1. Introduction
Zoned embankment dams occupy an important place among modern hydraulic structures because they enable the safe storage of large water volumes, are compatible with local materials, and provide economical solutions for high-dam applications [
1]. In particular, clay-core rockfill dams are widely preferred due to their zoned configuration, in which the fine-grained core provides impermeability. At the same time, strength and stability are ensured by the filter, transition, and rockfill zones. However, the interaction of dissimilar materials within the same structural system also gives rise to complex geotechnical problems associated with stress–deformation incompatibility [
2]. In this context, crack formation in the low-permeability core zone, hydraulic fracturing, and the subsequent internal erosion mechanisms constitute major safety concerns in the design of zoned embankment dams [
3]. The literature indicates that internal erosion processes initiated by penetration through or bypassing of the core may progress to piping and play a major role in embankment dam damage and failures; indeed, statistical assessments show that progressive piping and erosion are the primary cause in approximately 30–50% of embankment dam failures [
4]. Similarly, it has been emphasized that intense and often directly unobservable leaks caused by hydraulic fracturing may act as a critical trigger for internal erosion in the absence of adequate filtration [
5,
6]. In addition, it has been reported that hidden defects such as cracking, seepage, piping, and localized deformation may develop in earth and rockfill dams during long-term operation, often progressing without obvious surface manifestations in the early stages; therefore, early diagnosis and monitoring approaches are of critical importance in safety assessment [
7].
One of the principal mechanisms that predisposes clay-core rockfill dams to crack formation is arching. Soil arching is the transfer of stresses from a moving soil mass to an adjacent, more stable soil mass due to relative displacements [
8]. This definition is rooted in Terzaghi’s classical concept, which holds that shear resistance between adjacent soil masses with different deformation behavior leads to stress redistribution [
9]. In zoned embankment dams, this phenomenon becomes pronounced because the softer and more compressible clay core tends to settle more than the surrounding stiffer filter and rockfill zones. The shear resistances developed at the core–shell interface partially restrain the downward movement of the core, causing part of the vertical stress that would otherwise be carried by the core to be transferred to the shell zones. As a result, total vertical stresses decrease, particularly near the upstream face of the core and in regions adjacent to the shell zones, thereby creating a critical stress environment for low-stress zones and crack development [
10]. This mechanism has also been described in previous theoretical and numerical studies as load transfer from the core to stiffer adjacent zones and has been associated with cracking risk [
11,
12].
In this regard, it is well known that different types of arching may develop in clay-core embankment dams. Three principal types of arching are generally identified in dams: longitudinal arching between the dam body and valley abutments, transverse arching between the clay core and shell zones, and local arching around conduits or concrete appurtenant structures. Among these, transverse arching is of particular importance because it is directly related to the cross-sectional geometry and material stiffness contrast in zoned embankment dams and is therefore especially relevant to the development of horizontal-walled cracks in the clay core and the associated hydraulic fracturing conditions. In this type of arching, the core, having a lower deformation modulus, tends to settle more, whereas the stiffer shell and filter zones undergo relatively smaller displacements; consequently, stresses are transferred from the core to the surrounding zones, and stress reductions occur particularly on the upstream side of the core [
13]. Recent laboratory and numerical studies have also shown that the reduction in total overburden stress within the core due to arching is a fundamental precondition for the hydraulic fracturing mechanism [
14,
15]. The initial reservoir filling stage is critical because the reservoir water pressure is first imposed on the clay core at its end-of-construction stress state. If transverse arching has already generated low-stress zones, particularly near the upstream side of the core, the applied hydraulic pressure may approach or exceed the local stress level, thereby promoting crack initiation, crack propagation, and hydraulic fracturing susceptibility, as highlighted by Djarwadi et al. [
15]. In addition, it has been demonstrated in various geotechnical applications that soil arching is not limited to stress transfer alone, but is also related to deformation geometry and the equal-settlement plane: as differential settlement increases, the arch crown height and load-transfer pattern are correspondingly modified [
16]. Such findings indicate that arching in zoned embankment dams should be evaluated not only for stress reduction but also for deformation patterns.
The critical importance of arching for dam safety arises from its direct relationship with hydraulic fracturing. Hydraulic fracturing is defined as the initiation or propagation of cracks when the water pressure acting on the upstream face of the core or within the core exceeds the total minimum stress or the minor principal stress at that location [
17]. Haeri and Faghihi [
18] clearly demonstrated that the stress transfer from the core to the stiffer shell zones in zoned embankment dams reduces the total stresses available to resist failure before first impoundment, thereby increasing the potential for hydraulic fracturing. Akhtarpour and Khodaii [
19] likewise showed that, particularly in narrow valleys, the minimum principal stresses near the core may be reduced by arching, thereby increasing the risk of hydraulic fracturing during first impoundment. Similarly, field observations and three-dimensional numerical analyses have confirmed that stress reductions that develop under steep abutment conditions may create hydraulic-fracture conditions capable of initiating internal erosion within the core [
6].
This relationship is not merely theoretical but has also been supported by numerous case studies and field observations. Hyttejuvet dam [
20], Balderhead dam [
21], Stockton Creek dam, Wister dam [
22], and Teton dams are cited among the classical examples demonstrating the link between low-stress zones induced by arching and hydraulic fracturing/internal erosion. Detailed investigations on Greenbooth Dam also revealed that stress reductions developing particularly near steep abutments may create favorable conditions for hydraulic fracturing within the core and the resulting internal erosion [
23]. Furthermore, collective assessments of embankment dam failures indicate that many damage and failure events associated with hydraulic fracturing occur particularly during the first filling stage; this clearly highlights the importance of the stress state developed at the end of construction and the level of arching within the core for dam safety [
24].
The literature clearly shows that the parameters governing arching behavior are multidimensional. Geometric variables include the upstream and downstream slope inclinations, core width, core inclination, and the thicknesses of transition zones. In contrast, geomechanical variables primarily include the stiffness ratio between the core and the shell and the foundation’s compressibility. In their finite element-based parametric study, Talebi et al. [
25] demonstrated that steeper slopes, thinner cores, thinner filter zones, higher shell/core stiffness ratios, and less-compressible foundations lead to greater load transfer and, consequently, higher arching and hydraulic fracturing potential. Similar results were also reported in parametric studies on the Darian Dam, in which elastic modulus, Poisson’s ratio, core inclination, filter/core thickness ratio, and valley geometry were identified as governing parameters that affect the arching factor [
11]. In contrast, thicker cores, thicker filter zones, and more favorable core configurations may provide better conditions against arching. In addition, studies comparing monitoring data with numerical analyses have shown that the arching ratio may vary significantly across construction stages, the consolidation process, and locations within the core [
12,
26].
Similarly, the influence of the clay core’s deformation parameters on transverse arching has received increasing attention in recent years. The numerical analyses conducted by Topçu and Seyrek [
10] on the maximum cross-section of Çınarcık Dam showed that increases in the elastic modulus and Poisson’s ratio of the core material may reduce the potential for transverse arching. This finding is important because it demonstrates that arching is closely related not only to cross-sectional geometry but also to the material parameters that define the core’s compressibility and deformation capacity. On the other hand, valley topography and abutment conditions are also known to significantly affect arching behavior in high rockfill dams. Zhang and Du [
27], through three-dimensional nonlinear finite element analyses of high rockfill dams in narrow valleys, showed that intense arching may develop in both the transverse and longitudinal directions due to material zoning and load transfer to valley abutments, respectively. In the same study, it was reported that steep abutment slopes and deep, steep cutoff trenches further reduce the minor principal stresses, thereby increasing the core’s susceptibility to hydraulic fracturing; moreover, the effect of arching becomes more severe with increasing dam height. In addition, it has been reported that time-dependent behavior may also amplify arching in high embankment dams and increase the probability of cracking/hydraulic fracturing during the operational stage [
28]. Likewise, it has been emphasized that the geotechnical behavior of embankment dams depends not only on instantaneous stress–deformation conditions but also on seasonal environmental effects, erosion susceptibility, and long-term changes in soil properties, and that such effects should be considered in a comprehensive assessment of dam safety [
29]. Therefore, although the stiffness contrast between the core and shell is the principal driver of transverse arching in zoned embankment dams, this behavior should be evaluated together with longitudinal arching and time-dependent deformations, especially in high dams located in narrow valleys.
For these reasons, arching has become a major topic of experimental, numerical, and case-based studies. Nevertheless, the existing literature has generally evolved along two main lines: numerical analyses of the numerical behavior and safety of specific dam cases, and finite-element-based parametric investigations of factors affecting arching. Although this body of literature has made important contributions to understanding the arching mechanism, it also shows that open-form, readily applicable, and generalizable relationships that can be directly used in design and preliminary assessment remain limited. In particular, when the arching ratio must be estimated under the simultaneous influence of multiple geometric and material parameters, graphical evaluations, single-parameter trends, or case-specific findings are often insufficient. Therefore, there is a need to transform comprehensive numerical databases into explicit, interpretable relationships that can be employed in engineering practice. Although finite element analyses provide high accuracy and strong physical representation, they require considerable time, expertise, and computational cost for each design iteration. In contrast, closed-form predictive relationships that accurately represent complex, nonlinear parameter interactions can provide substantial advantages for preliminary design, sensitivity analysis, and rapid safety assessment.
In this context, data-driven methods, particularly evolutionary algorithms capable of generating symbolic expressions, have become increasingly attractive for geotechnical modeling. Recent studies have demonstrated the effectiveness of advanced deep learning frameworks in civil engineering; for example, Zhang and Meng [
30] showed that ANN- and LSTM-based models can achieve high predictive accuracy in the multi-proportion strength prediction of rubber–steel fiber reinforced concrete. However, such approaches generally remain black-box models and do not directly provide closed-form equations for engineering use. Gene Expression Programming (GEP) is particularly advantageous because it provides explicit and interpretable mathematical formulations rather than functioning solely as a black-box predictor [
31]. For transverse arching, which is governed by multiple interacting factors such as the stiffness contrast between the core and shell, core geometry, and transition-zone characteristics, GEP offers strong potential for converting extensive numerical results into practical design equations. In parallel, multiple linear regression analysis (MLRA) was also performed to derive alternative predictive relationships and to provide a comparative framework for equation development. Recent studies further show that data-driven approaches are increasingly being used in embankment dam engineering to evaluate uncertain parameters and predict quality and safety indicators, underscoring their growing relevance in modeling dam behavior [
32].
The present study aims to address this research gap. In this context, the transverse arching behavior arising from the stiffness contrast between the clay core and rockfill zones in central-zoned (clay-core rockfill dam founded on rigid foundation) dams was investigated using a comprehensive numerical database. The developed database consists of a total of 288 numerical models incorporating four different dam heights (Hdam = 50, 100, 150, and 250 m), six different slope geometries representing the rockfill and clay core zones, four different clay core elastic modulus values (Ecore = 25,000, 30,000, 35,000, and 40,000 kPa), and three different clay core Poisson’s ratios (νcore = 0.35, 0.40, and 0.45). Using this dataset, both a GEP-based modeling approach and multiple linear regression analysis were employed to develop explicit predictive relationships for estimating the transverse arching ratio at the end of construction before initial reservoir impoundment. Accordingly, the study aims to identify the main determinants of transverse arching systematically and to propose rapid, practical, and interpretable auxiliary equations for engineering applications. In this respect, the proposed framework combines the physical representational capability of classical numerical analyses with the practicality of data-driven and statistical modeling, thereby contributing to the safety assessment and preliminary design of zoned embankment dams.
2. Gene Expression Programming (GEP)
Gene Expression Programming (GenexproTools 5.0, Capelo, Portugal), introduced by Ferreira [
31], is an evolutionary computation technique derived from genetic algorithms (GAs) and genetic programming (GP). While GAs encode candidate solutions as fixed-length strings and GP represents them directly as expression trees (ETs), GEP combines these advantages by encoding individuals as linear chromosomes that are later expressed as nonlinear ETs [
31]. This representation enables the development of explicit, high-interpretability mathematical models.
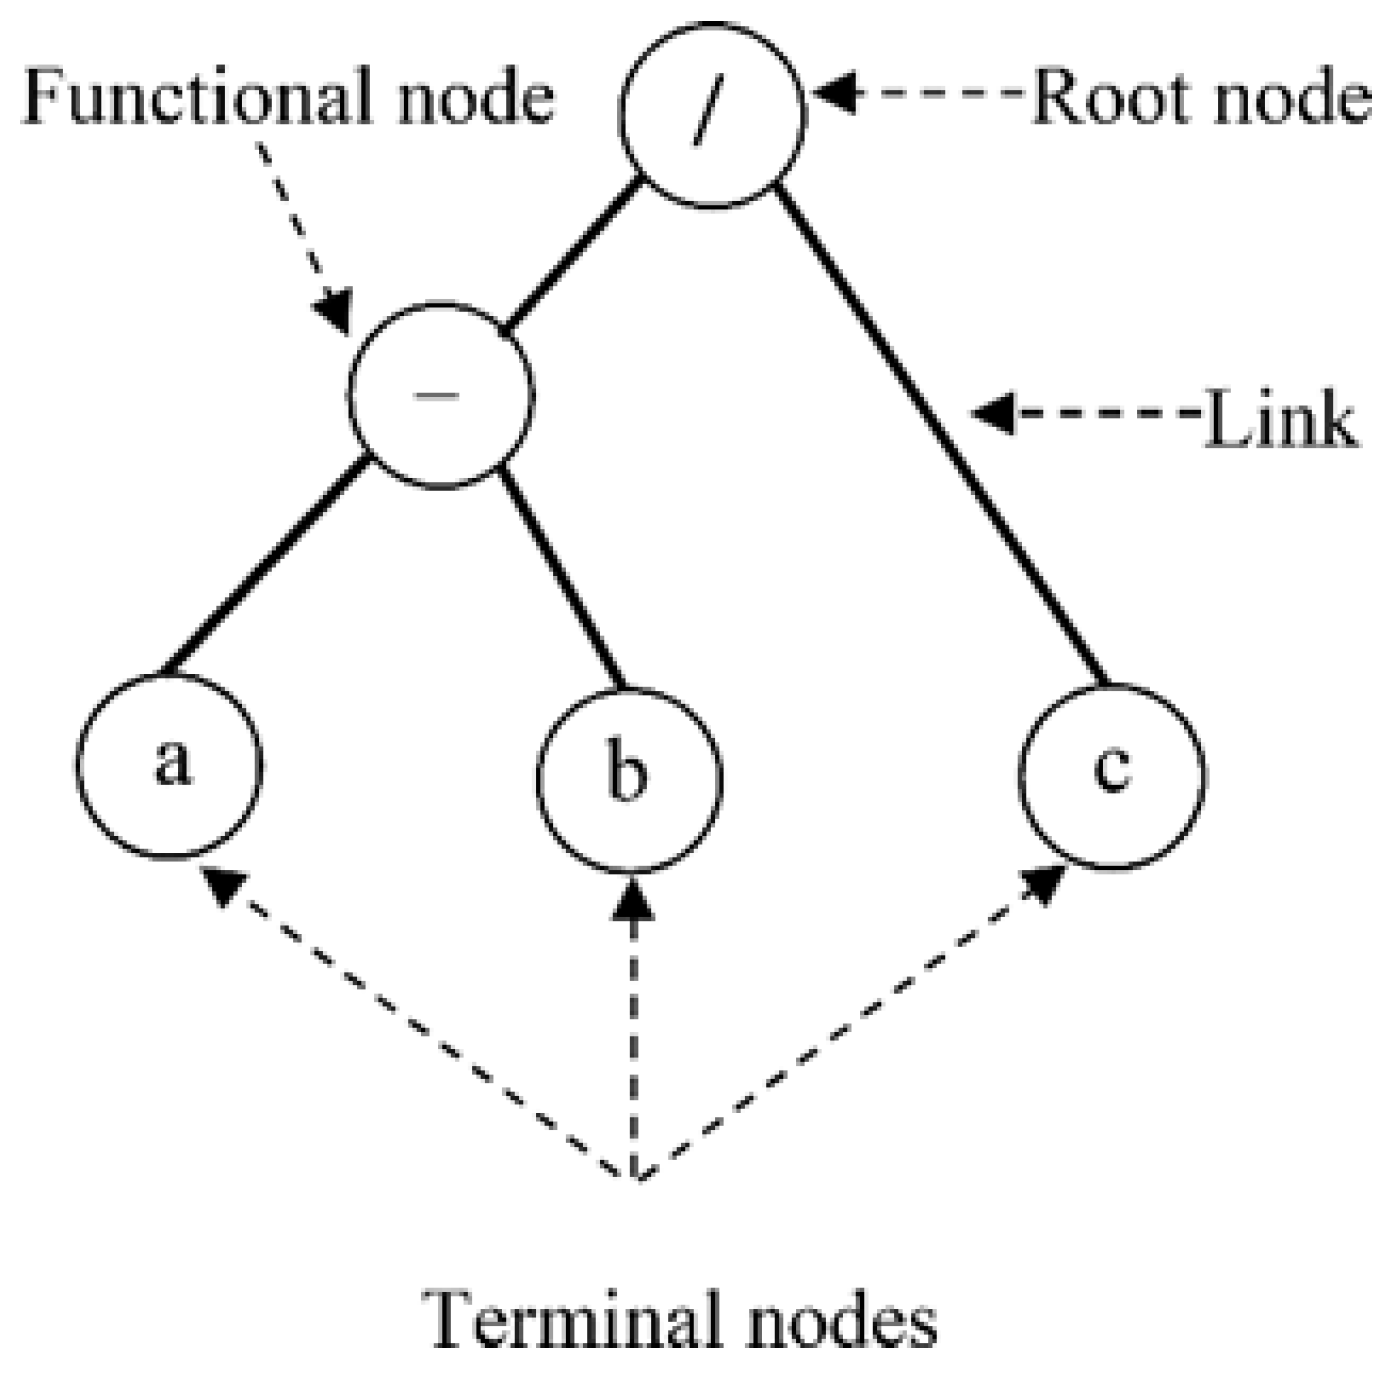
In GEP, chromosomes are composed of one or more genes, and each gene is expressed as an ET. A representative algebraic form of a gene is given in Equation (1), while its ET-based graphical representation is illustrated in
Figure 1.
In this structure, terminals correspond to input variables, whereas functions define the formal relationships among these variables. The genotype–phenotype transformation in GEP is commonly represented using Karva notation, and a typical Karva-based gene expression is shown in
Figure 2.
Each gene consists of a head and a tail. The head may contain both functions and terminals, whereas the tail contains terminals only. The tail length is determined according to the standard GEP formulation, and the head–tail organization of a sample gene is presented in
Figure 3 [
31]. This structural organization ensures that each chromosome can be translated into a valid ET, thereby preserving syntactic correctness during evolution.
The predictive capability of a GEP model is strongly influenced by chromosome architecture, including the number of genes, head length, terminal set, function set, and linking functions. These parameters should be selected based on the problem’s complexity and the number of explanatory variables. In general, more complex problems require larger chromosome structures. To obtain simpler, more interpretable formulations, basic arithmetic operators such as +, −, ×, and / are often preferred [
33].
The evolutionary process starts with a randomly generated population of chromosomes. The fitness of each individual is then evaluated using a predefined objective function. In regression-based applications, fitness is commonly assessed using the root-mean-square error (RMSE), as given in Equation (2).
Various genetic operators are employed in GEP to generate new individuals while preserving chromosome validity (Ferreira, 2001 [
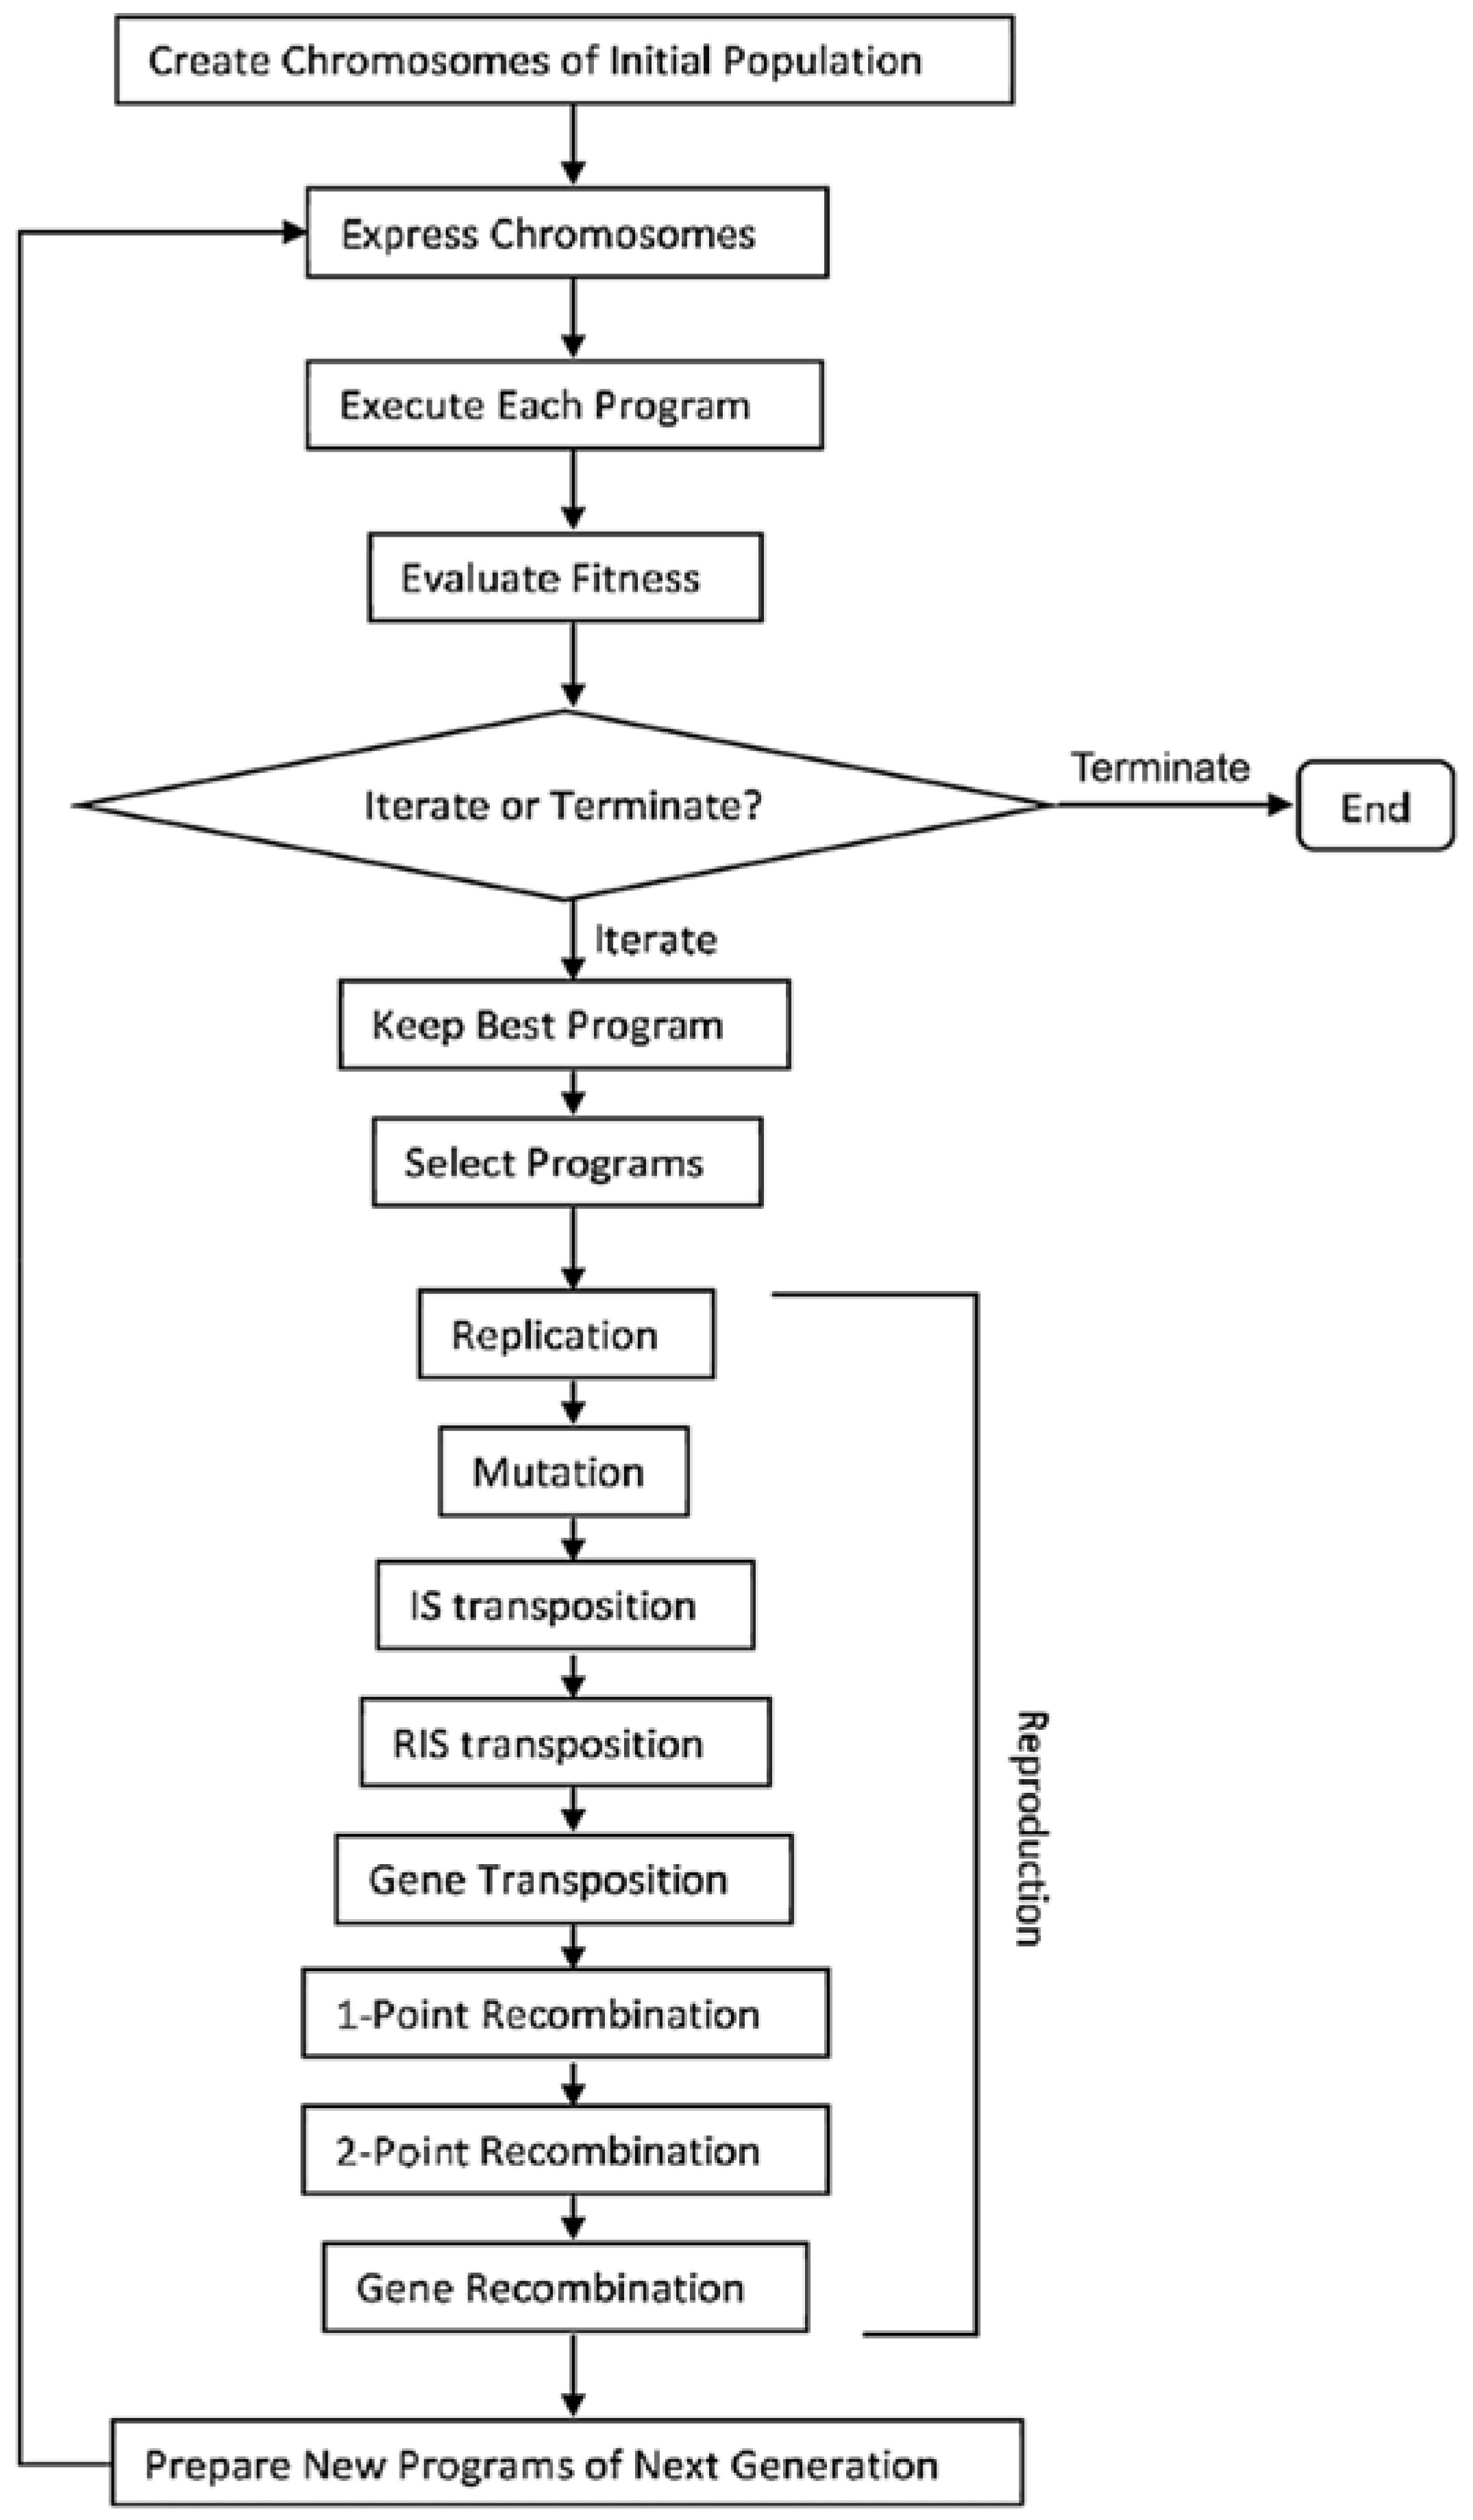
31]). Replication transfers high-performing genes to subsequent generations, whereas mutation alters symbols within genes; however, mutations in the tail are restricted to terminals in order to maintain the structural consistency of chromosomes. Transposition introduces additional variation through insertion sequence (IS) transposition, root insertion sequence (RIS) transposition, and gene transposition. In these mechanisms, selected gene segments are either relocated within the chromosome or copied and inserted into new positions. Recombination further enhances population diversity through 1-point recombination, 2-point recombination, and gene recombination, in which genetic material is exchanged between chromosomes at one point, two points, or at the gene level, respectively. These operators collectively improve exploration and exploitation during the evolutionary search process, as summarized in
Figure 4.
Due to its ability to generate explicit predictive expressions, GEP has been widely used in research areas. Previous studies have successfully applied GEP to predict swell pressure and unconfined compressive strength of expansive soils [
34], the compressive strength of high-strength concrete [
35], and the thermal conductivity of rocks [
36].
5. Numerical Modeling
In this study, the transverse arching behavior of centrally zoned embankment dams was analyzed under two-dimensional plane-strain conditions using the SIGMA/W module of GeoStudio 2018.R2. Numerical analyses were performed for six geometric configurations and four dam heights, as defined during dataset construction. The finite element method was adopted as the numerical framework since it provides a robust basis for evaluating stress redistribution and deformation behavior in zoned geotechnical systems. As noted by Potts et al. [
42], the essential requirements of finite element analysis in geotechnical engineering include equilibrium, compatibility, constitutive material behavior, and appropriate boundary conditions.
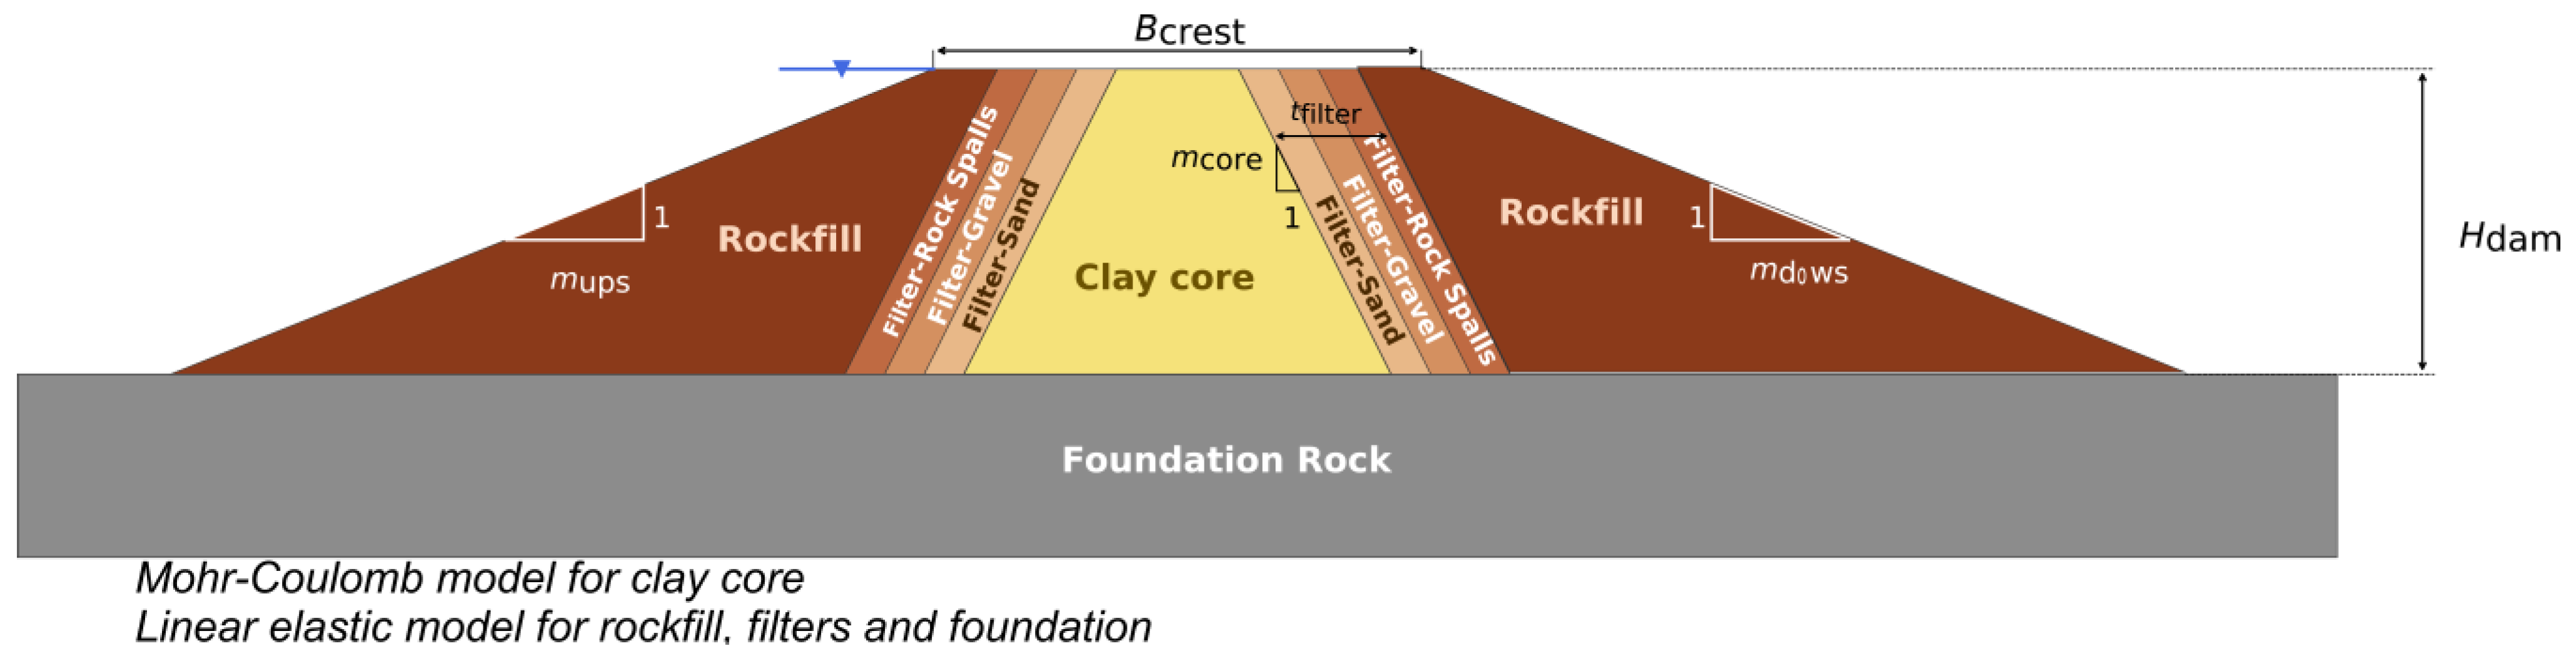
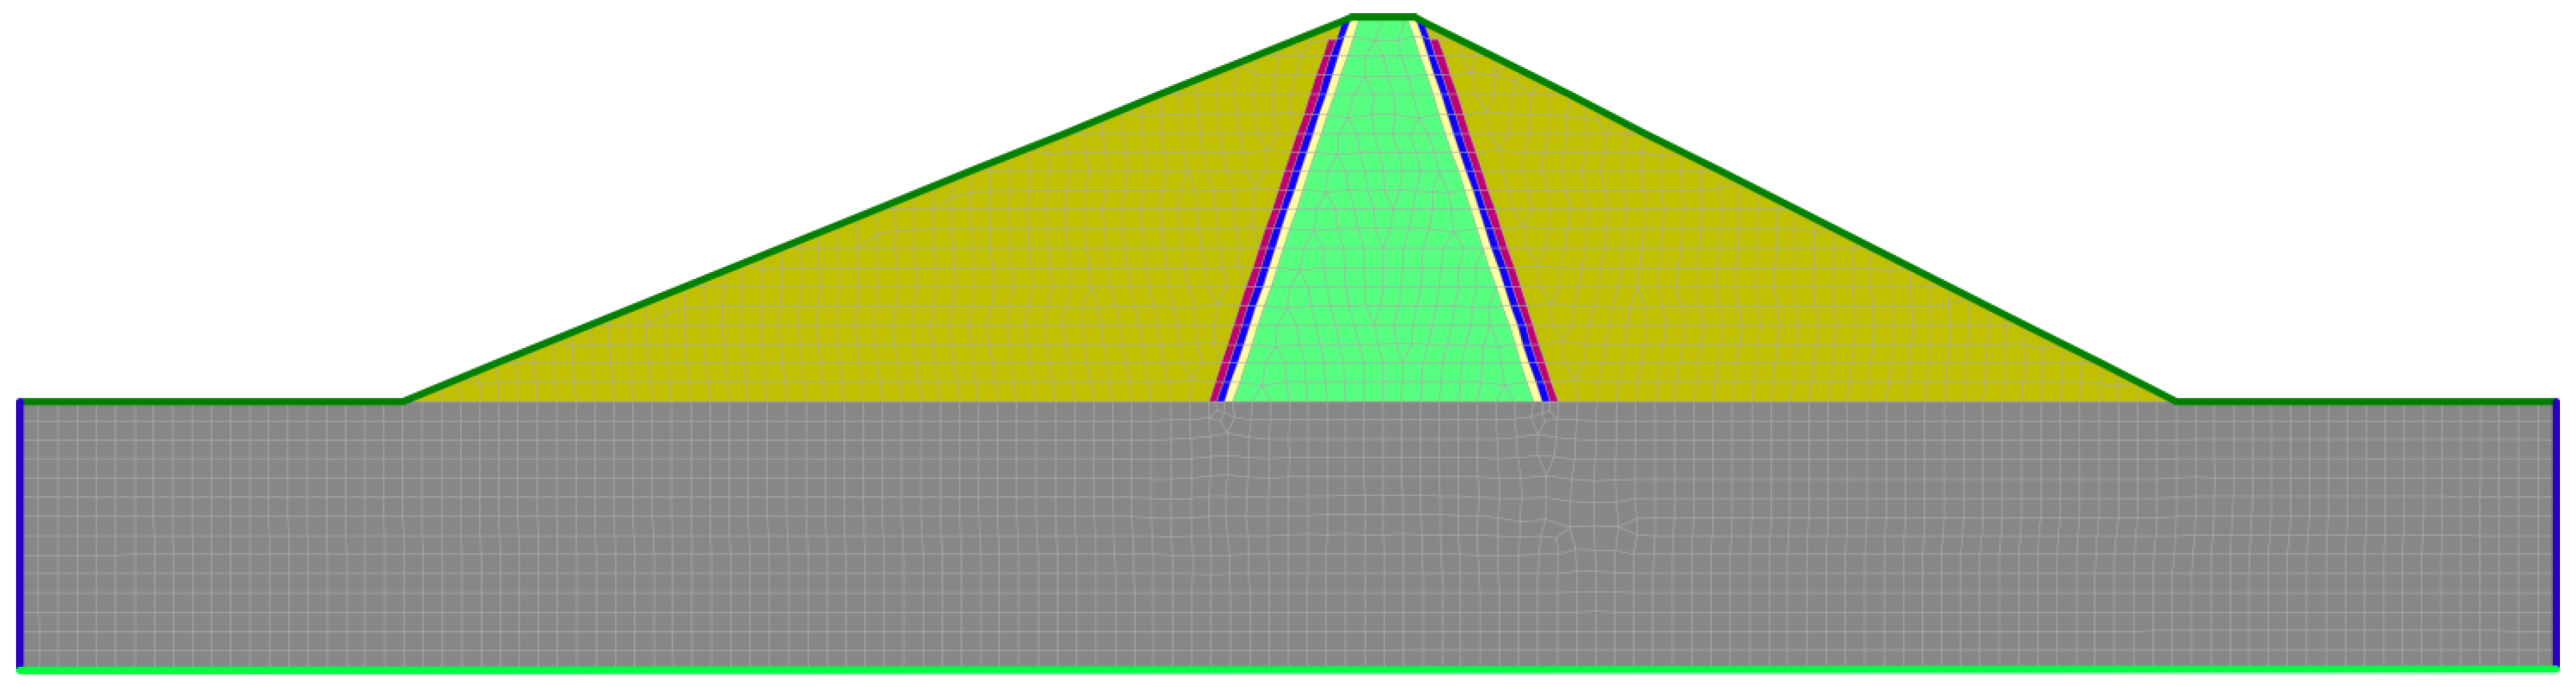
The numerical domain was discretized using a mesh composed of quadrilateral and triangular elements, together with the material zoning shown in
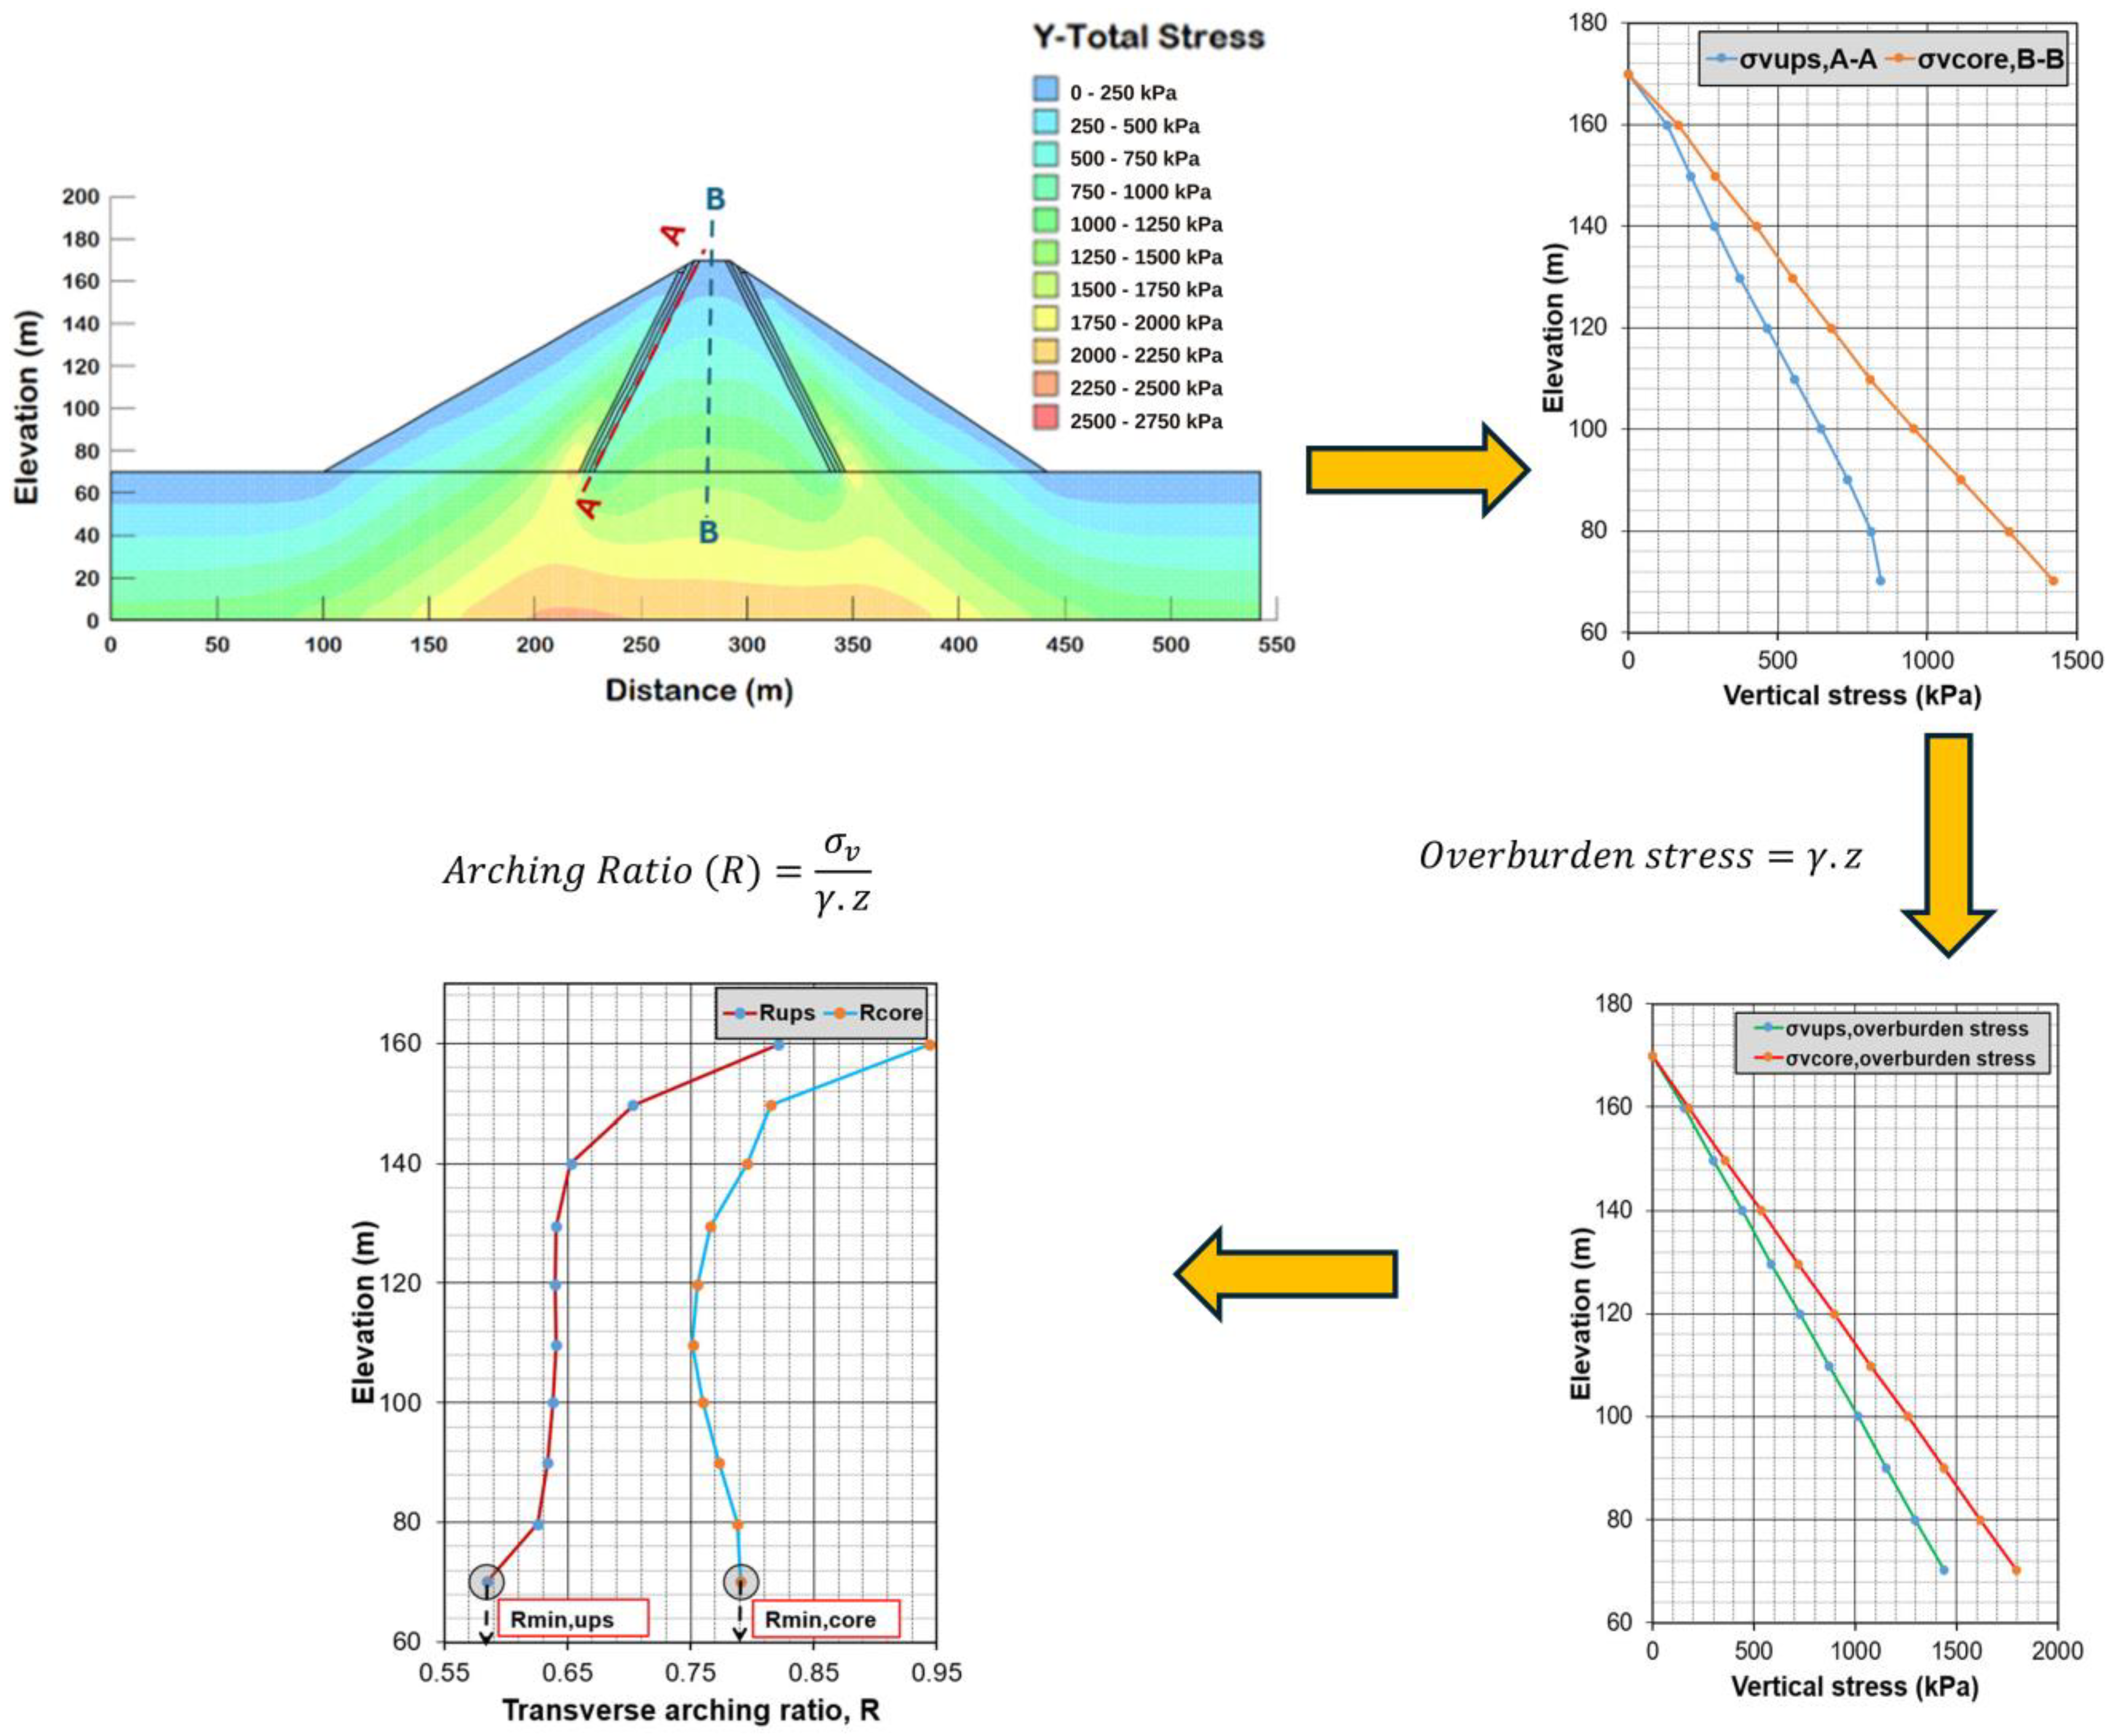
Figure 9. The mesh configuration was defined to ensure compatibility between the geometric layout and the zoned material distribution of the embankment section. As illustrated in the mesh and boundary-condition scheme, the vertical model boundaries were assigned roller-type constraints (shown in blue), allowing only vertical displacement while restraining horizontal movement. In contrast, the bottom boundary, shown in green, was fully restrained in both the horizontal and vertical directions. This boundary-condition arrangement was adopted to represent the foundation’s rigid mechanical response while minimizing spurious boundary effects on the embankment behavior. To realistically represent the construction process of embankment dams, staged construction was incorporated into the numerical analyses. The staged construction procedure is particularly important for the Mohr–Coulomb clay core, whose stress–strain response may depend on the loading path. Therefore, the transverse arching ratios were evaluated from the end-of-construction stress state induced by progressive fill placement rather than from a single-step gravity-loading analysis. In the step-by-step modeling procedure, the first stage consisted of defining the foundation and establishing the initial in situ body stresses. Thereafter, embankment construction was simulated progressively in ten stages for all geometric models. This staged approach was used to reproduce the gradual development of stresses and deformations during fill placement and to obtain a more realistic estimate of the end-of-construction stress state, which is critical for evaluating transverse arching before initial reservoir impoundment. No reservoir water level, hydrostatic pressure, or seepage loading was applied in these analyses; therefore, the results represent the static end-of-construction condition before first filling.
All numerical analyses were carried out using the material properties presented in
Section 4.1. Within this framework, the stress distributions obtained at the end of construction formed the basis for determining the transverse arching ratios used in the subsequent statistical, regression-based, and GEP-based evaluations.
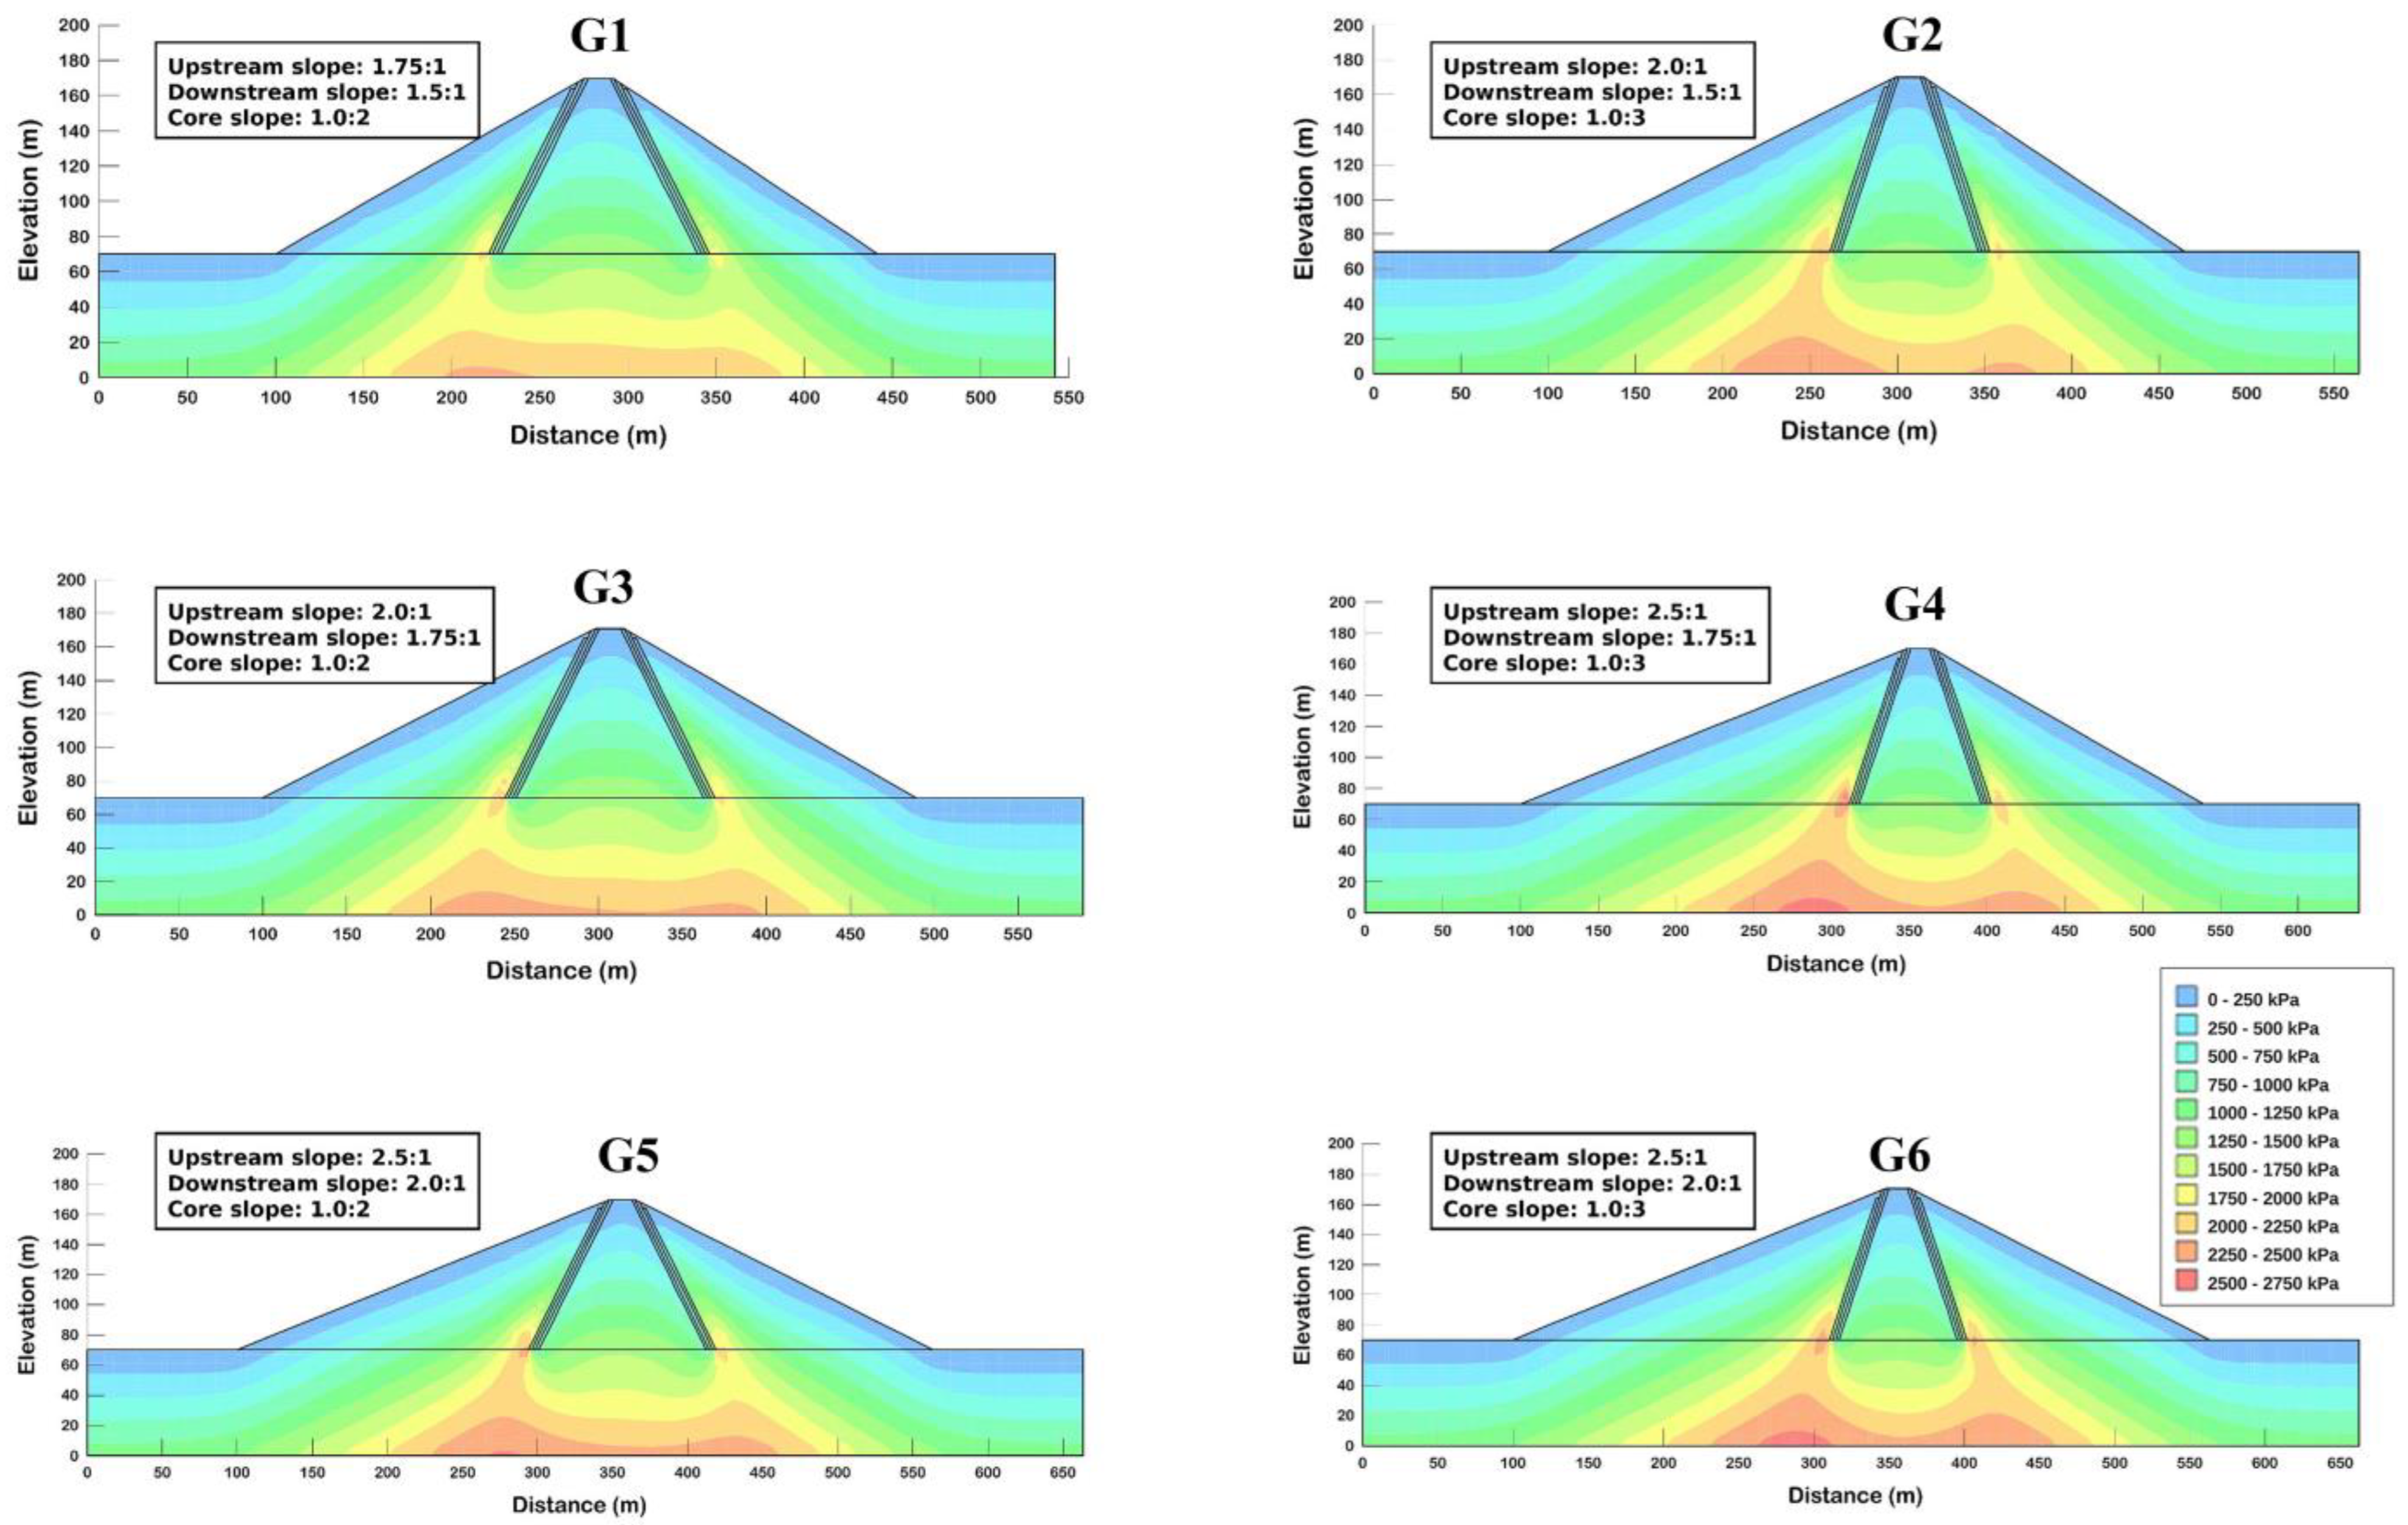
Representative examples of the vertical stress contours obtained from the numerical analyses are shown in
Figure 10 for the 100 m high dam section under six different slope geometries.
In these analyses, the clay core was assigned an elastic modulus of 30,000 kPa and a Poisson’s ratio of 0.40. The figure clearly shows that the numerical model can capture the spatial redistribution of vertical stresses within the dam body and foundation in response to geometric variations. In all cases, vertical stresses generally increase with depth, whereas noticeable reductions in stress occur in and around the clay core due to transverse arching. These low-stress zones are particularly evident near the core–filter–rockfill interfaces, where stress transfer from the relatively deformable core to the stiffer surrounding zones becomes more pronounced. Moreover, the extent and intensity of the stress-reduction region vary across the six geometric configurations, indicating that slope geometry directly influences the development of transverse arching. In particular, changes in upstream and downstream shell inclinations, along with the core slope, modify both the shape of the low-stress region and the stress-concentration pattern near the core boundaries. These results further confirm that the adopted numerical framework provides a consistent basis for evaluating the effect of geometric parameters on the end-of-construction stress state before initial reservoir impoundment.
6. Developed GEP Model
Gene Expression Programming (GEP) was employed to derive explicit predictive formulations for the minimum transverse arching ratios at the upstream side of the clay core (
) and at the core centerline (
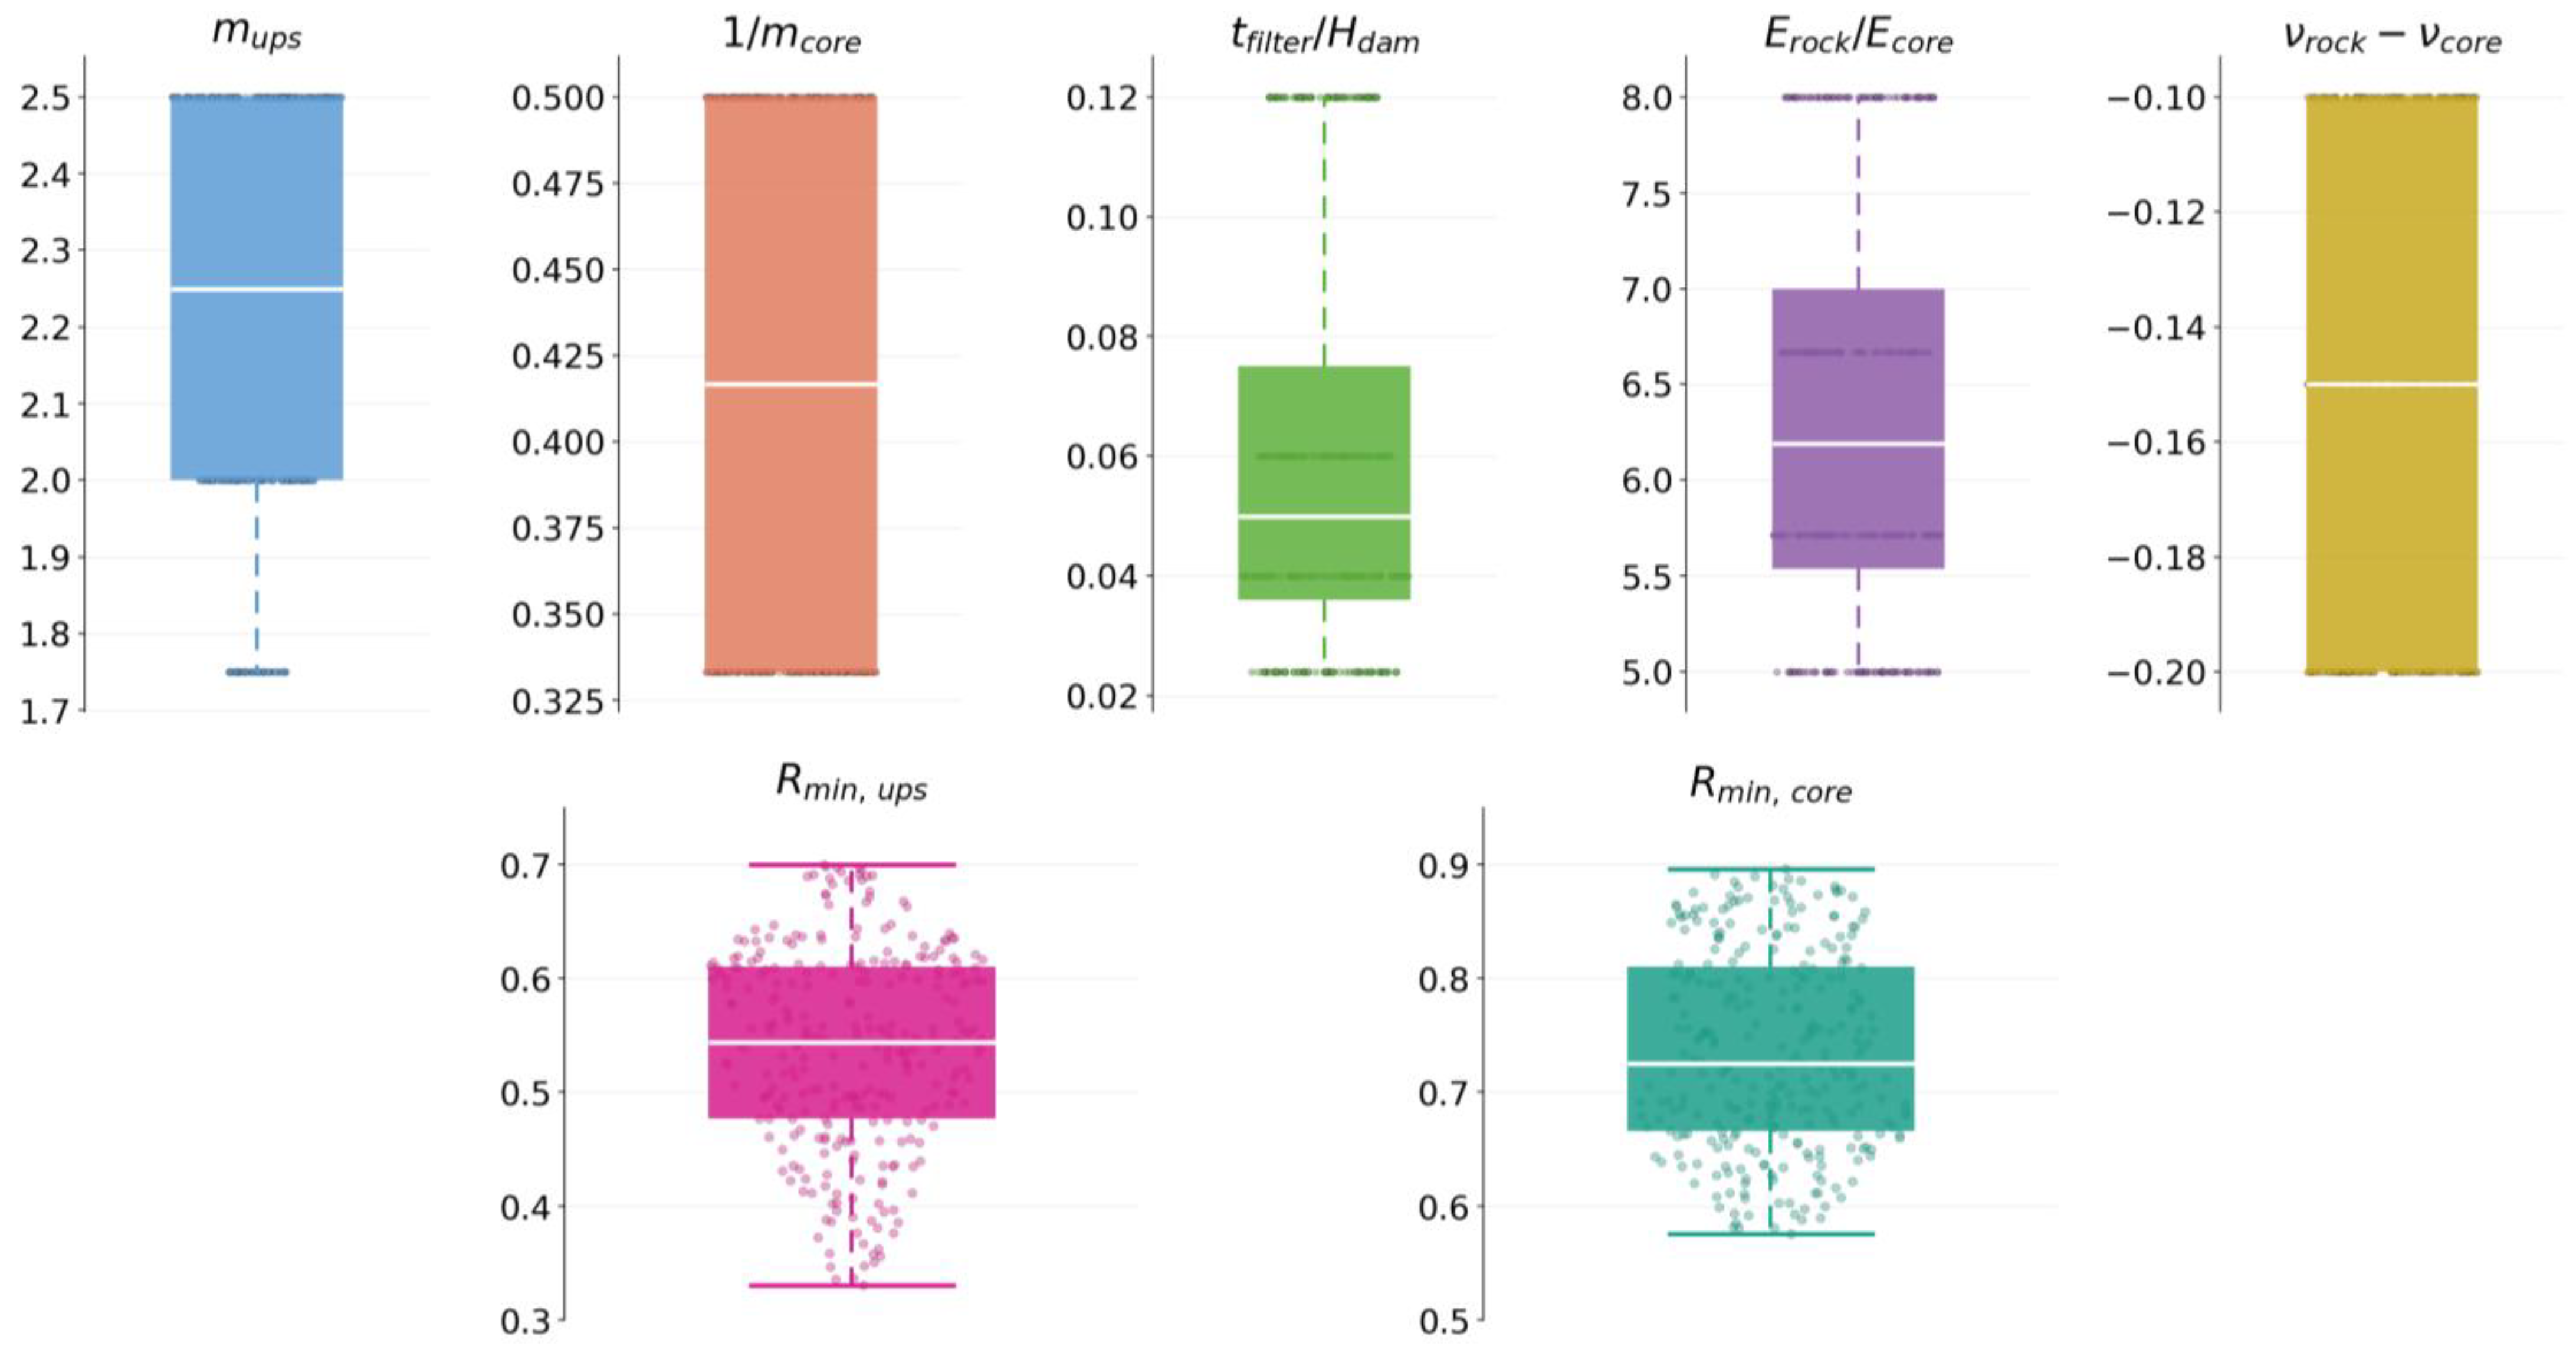
). For each output variable, the total dataset of 288 samples was divided into training, testing, and validation subsets consisting of 198, 45, and 45 samples, corresponding to 68.75%, 15.63%, and 15.63% of the dataset, respectively. Since the statistical characteristics of the full dataset were already presented in
Section 4.3, separate descriptive statistics for the training, testing, and validation subsets are not repeated here. The three subsets exhibited similar statistical characteristics, indicating that the adopted data split adequately preserved the overall distribution of the dataset.
The optimal model settings used for both target variables are summarized in
Table 3. Separate GEP runs were conducted for each response variable in order to account for the potentially different nonlinear relationships governing stress redistribution at these two critical locations. As shown in
Table 3, the root mean square error (RMSE) was adopted as the fitness function in both cases, since the primary objective of the modeling process was to minimize the deviation between the predicted and numerical results. The final fitness values obtained were 980.39 for
and 983.97 for
, indicating that both models achieved a high level of convergence under the selected evolutionary settings. For both target variables, the final GEP architecture was based on 4 genes, a head size of 8, and a population of 256 chromosomes, with addition selected as the linking function. These settings were found to provide a suitable balance between model flexibility and structural simplicity. The use of four genes allowed the nonlinear relationship between the input variables and the transverse arching response to be represented with sufficient complexity, while preserving explicit and interpretable mathematical expressions. The function sets used in the model development differed slightly between the two response variables. For
, the selected function set included the basic arithmetic operators together with hyperbolic tangent, inverse, average, and logical NOT functions. For
, the function set was expanded to include additional nonlinear operators such as square, natural logarithm, exponential, cube root, average, and maximum functions. This difference suggests that the stress redistribution mechanism governing the core-center response required a broader nonlinear representation than that of the upstream-side response.
The genetic operator rates, including mutation, inversion, one- and two-point recombination, gene recombination, gene transposition, and random chromosome generation, were kept at the same levels for both models. This ensured consistency in the evolutionary search process and allowed the differences in the final formulations to arise primarily from the intrinsic characteristics of the two target variables rather than from changes in algorithmic settings.
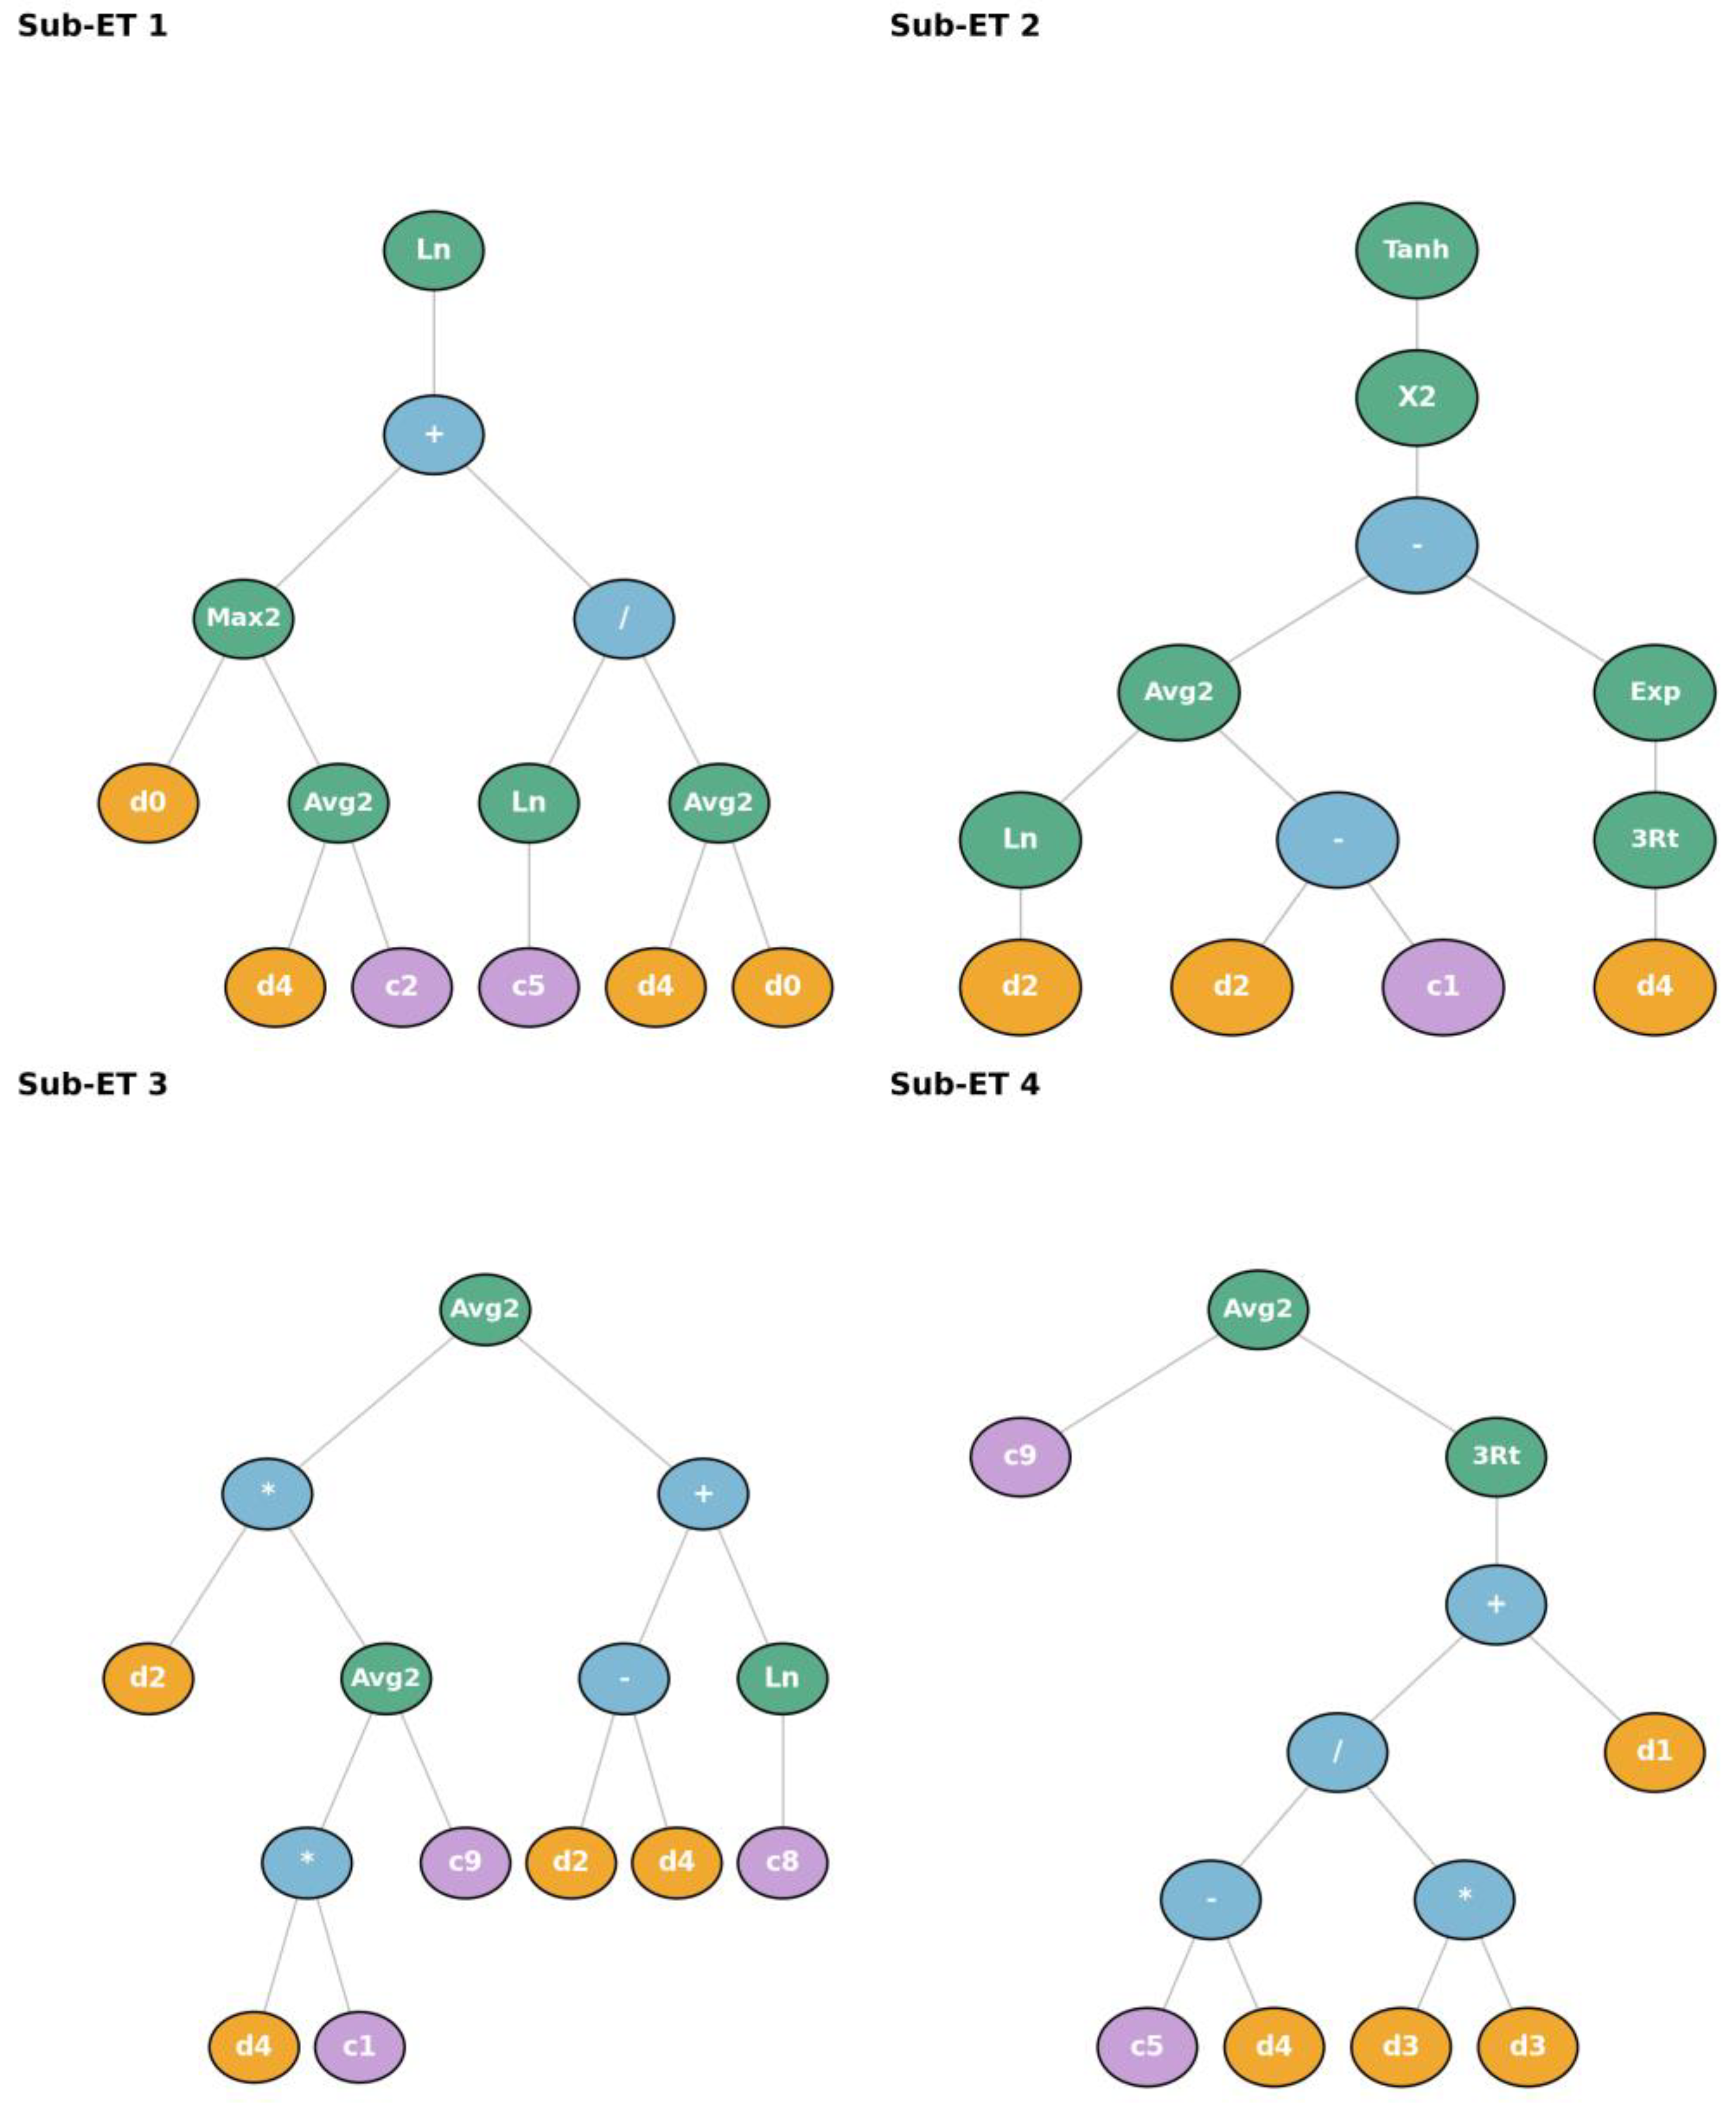
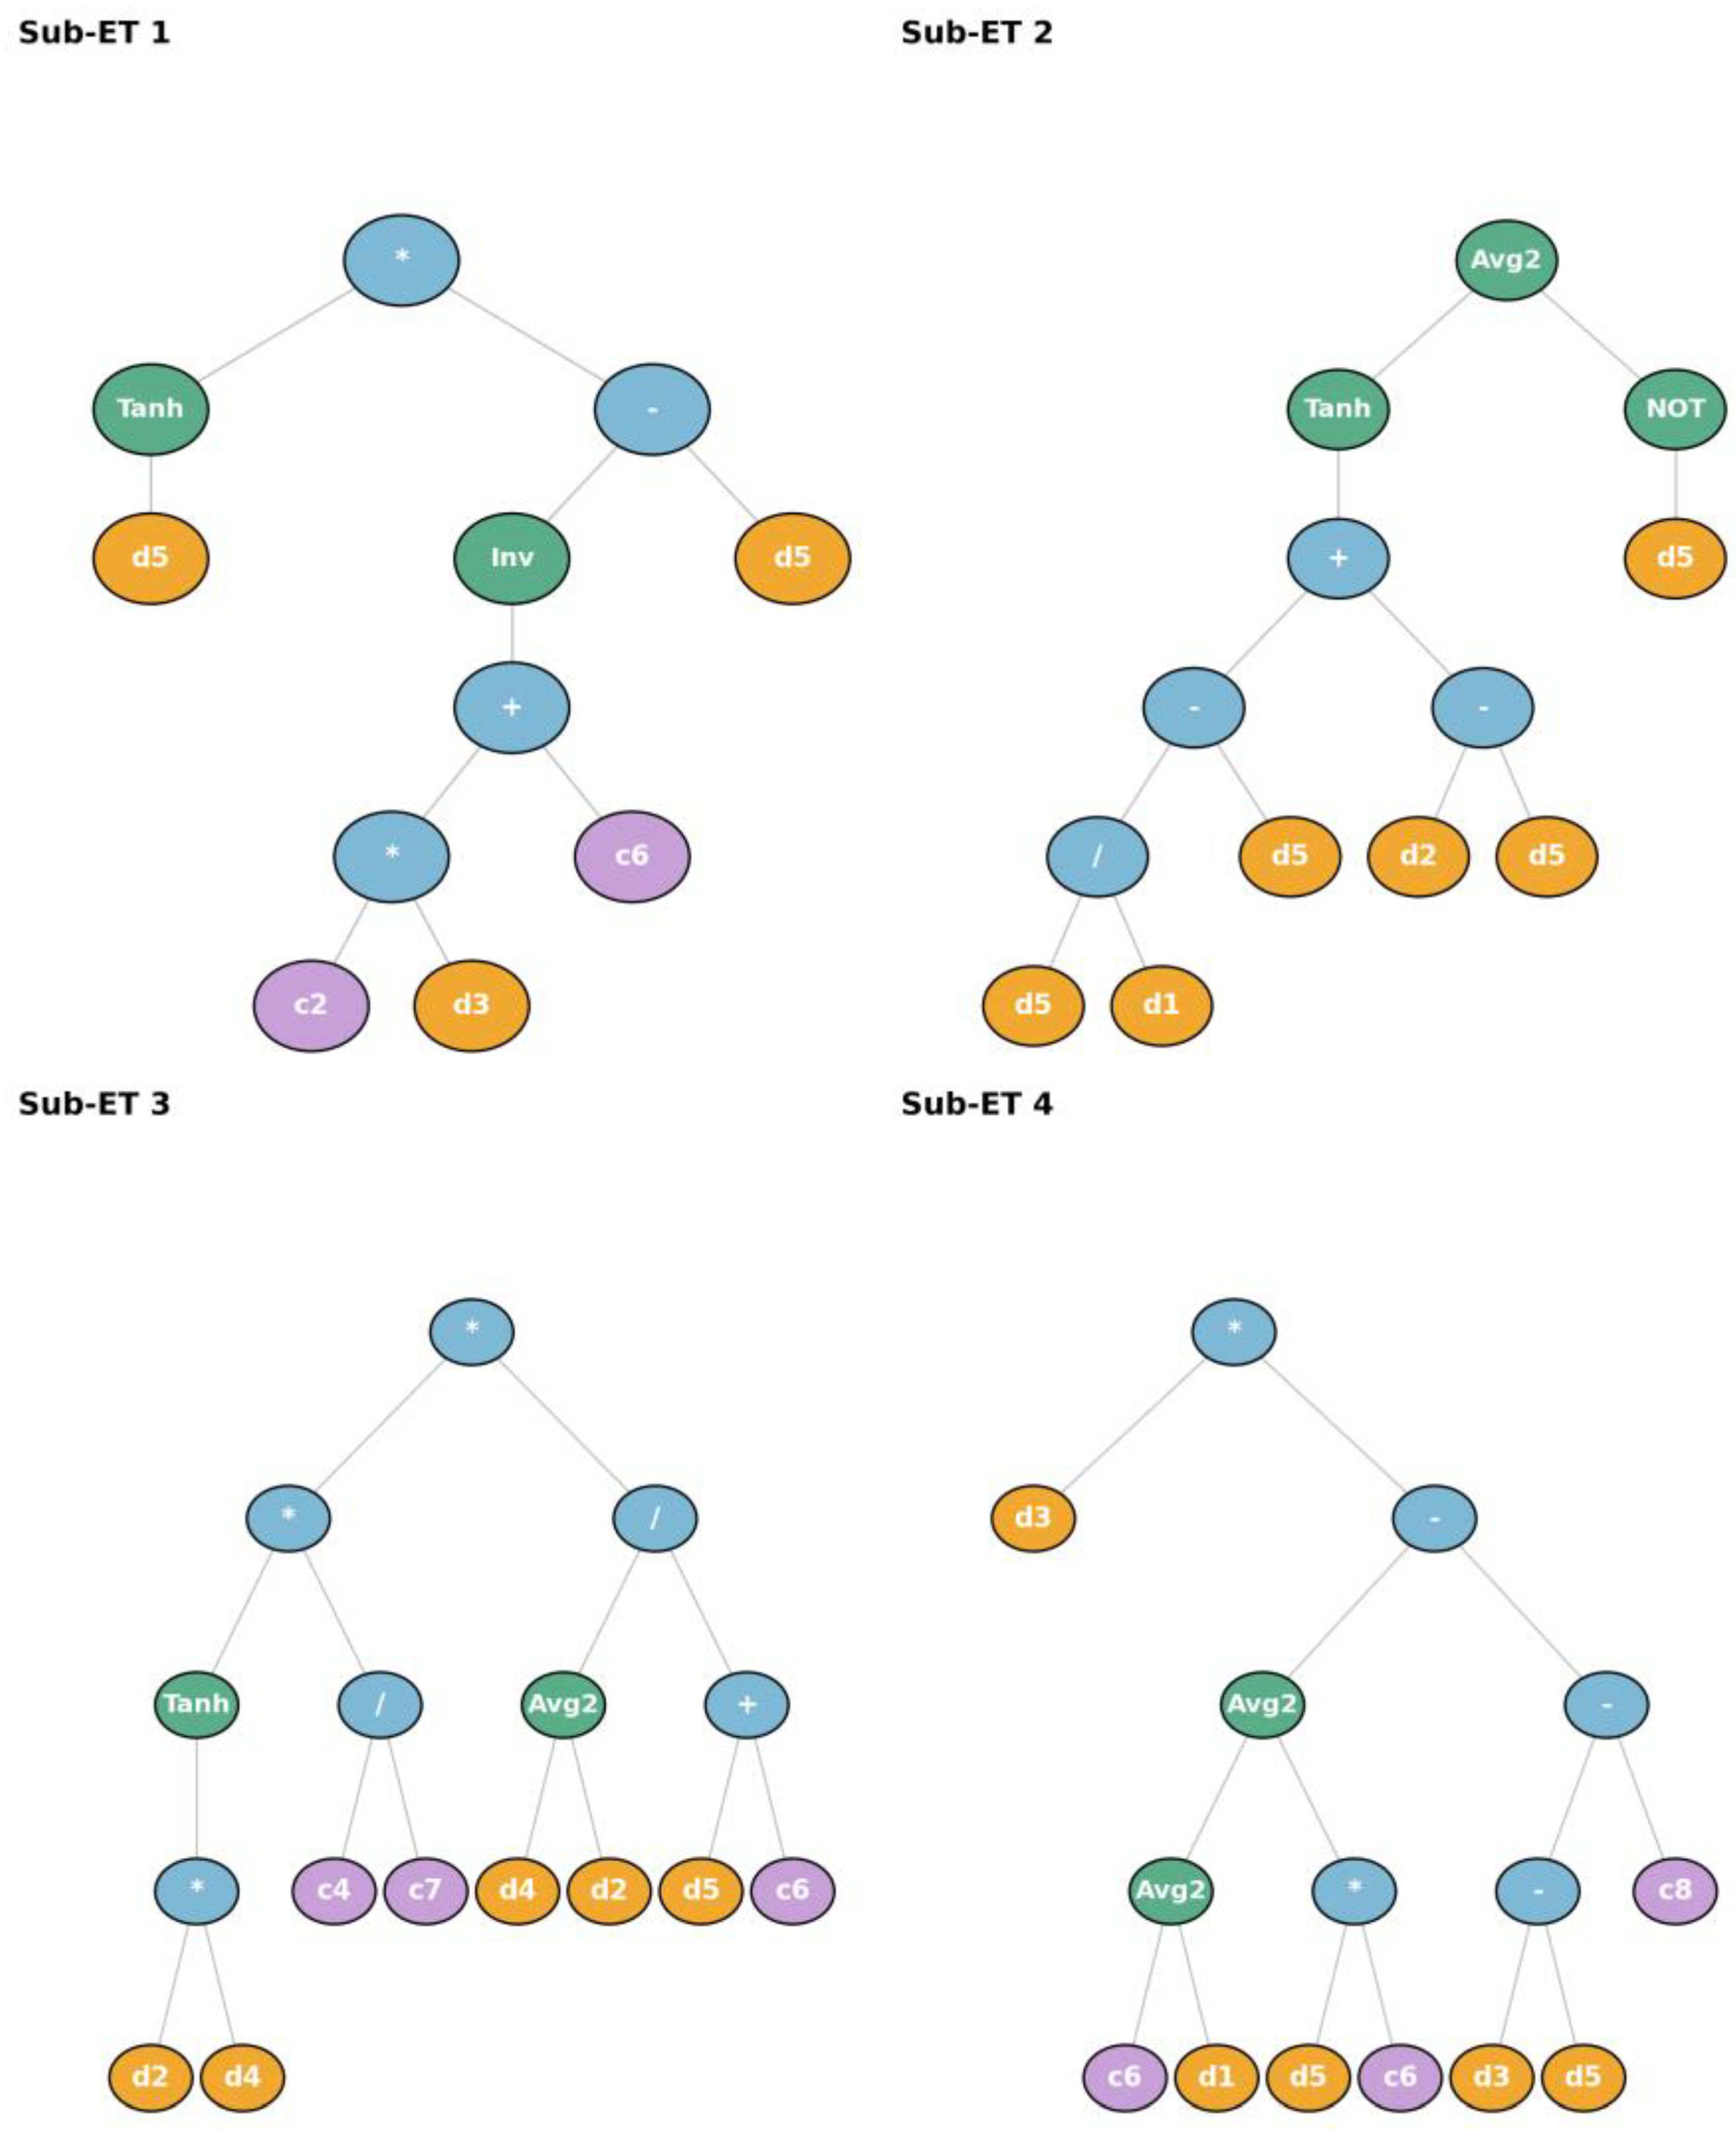
Following the selection of the optimal GEP control parameters, the final model structures for
and
were represented in the form of expression trees (ETs), as shown in
Figure 11 and
Figure 12, respectively. In both models, the final formulation consists of four sub-expression trees (Sub-ETs), which are linked through addition in accordance with the linking function given in
Table 3. This structure indicates that the target response is represented as the sum of four nonlinear sub-functions, each describing a different component of the relationship between the input variables and the transverse arching response.
In addition to the input variables and functional operators, the developed GEP models also include numerical constants assigned to each sub-expression tree. These constants are listed in
Table 4 for both
and
. These constants constitute the numerical coefficients required for converting the tree structures shown in
Figure 11 and
Figure 12 into explicit closed-form equations.
Based on the expression trees shown in
Figure 11 and
Figure 12, raw GEP expressions were first obtained for the prediction of the minimum transverse arching ratios at the upstream side of the clay core,
, and at the core centerline,
. These software-generated expressions were then converted into explicit engineering equations by substituting the numerical constants listed in
Table 4 and by replacing the symbolic input variables with the normalized parameters defined in
Section 4.3. For both formulations, the variables were taken as
,
,
,
, and
. The raw GEP expression for
is given in Equation (4), and its simplified form is presented in Equations (5)–(5d). Similarly, the raw and simplified forms of the
model are given in Equations (6) and (7)–(7d), respectively.
6.1. Performance Evaluation of the Developed GEP Models
The predictive performance of the developed GEP equations was assessed using four widely adopted statistical indicators, namely the coefficient of determination (), root mean square error (RMSE), mean absolute error (MAE), and mean absolute percentage error (MAPE). These metrics were calculated separately for the training, testing, validation, and overall datasets in order to evaluate both model accuracy and generalization capability.
The coefficient of determination,
, expresses the proportion of the variance in the observed data explained by the model and is given by Equation (8),
where
is the observed value,
is the predicted value,
is the mean of the observed values, and
is the number of samples. Values of
approaching 1 indicate a strong agreement between the predicted and observed results.
The RMSE, which is more sensitive to relatively large deviations, is defined as Equation (9),
The MAE, representing the average magnitude of the absolute prediction errors, is computed as Equation (10),
The MAPE, which expresses the relative prediction error in percentage form, is calculated as Equation (11),
In the present study, higher values and lower RMSE, MAE, and MAPE values were taken to indicate better predictive performance.
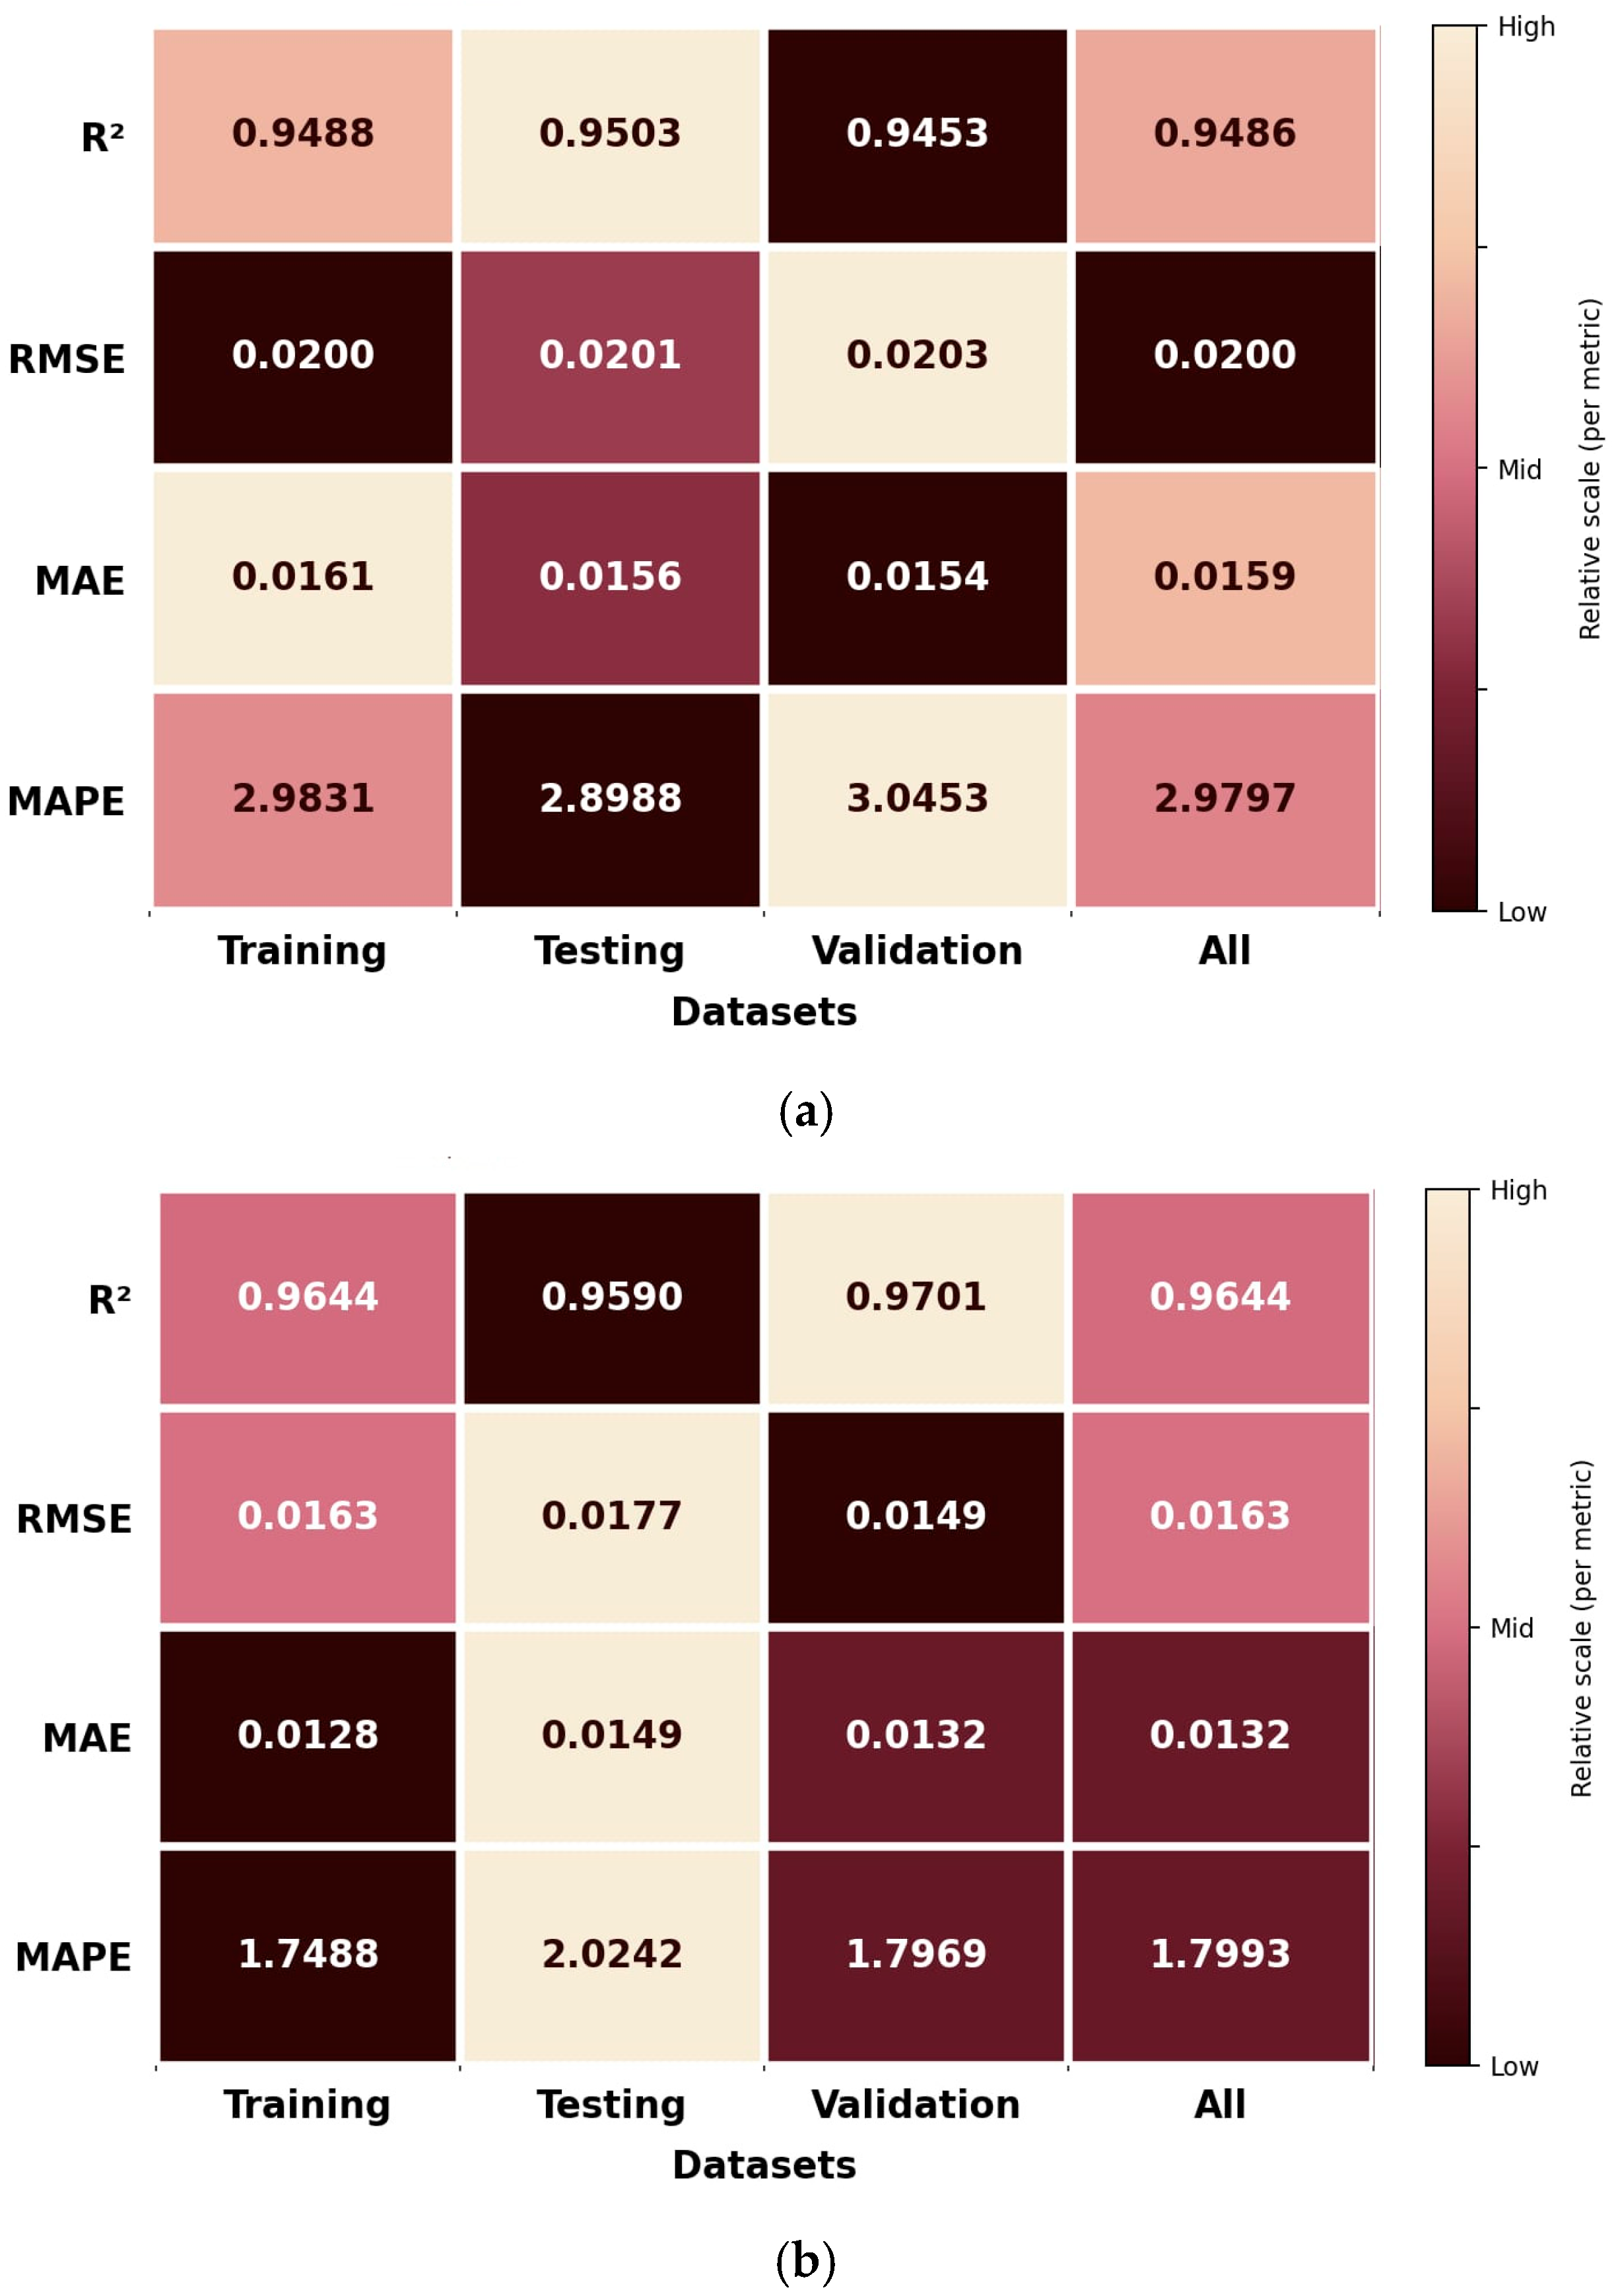
The resulting performance metrics for the developed GEP models are presented in
Figure 13, where
Figure 13a corresponds to
and
Figure 13b to
. For the
model, the
values for the training, testing, validation, and overall datasets were 0.9488, 0.9503, 0.9453, and 0.9486, respectively. These values indicate that the model explains approximately 95% of the variance in the target variable across all data subsets. The associated RMSE values ranged from 0.0200 to 0.0203, the MAE values from 0.0154 to 0.0161, and the MAPE values from 2.8988% to 3.0453%. The close agreement among the training, testing, and validation metrics indicates that the model maintains a stable predictive capability without showing a pronounced overfitting tendency.
The performance of the model was even stronger. The corresponding values were 0.9644, 0.9590, 0.9701, and 0.9644 for the training, testing, validation, and overall datasets, respectively. In particular, the validation value of 0.9701 confirms the excellent predictive accuracy of the model for unseen data. The RMSE values varied between 0.0149 and 0.0177, the MAE values between 0.0128 and 0.0149, and the MAPE values between 1.7488% and 2.0242%. These results show that the equation not only provides high explanatory power but also yields consistently low prediction errors.
A comparison of the two models indicates that the formulation performs slightly better than the formulation, as reflected by its higher values and lower error statistics. This suggests that the minimum transverse arching ratio at the core centerline follows a somewhat more regular and predictable pattern than that at the upstream side of the core. Nevertheless, the model also demonstrates a high level of predictive accuracy and remains fully adequate for engineering applications, particularly considering the practical importance of upstream stress reduction in relation to hydraulic fracturing susceptibility.
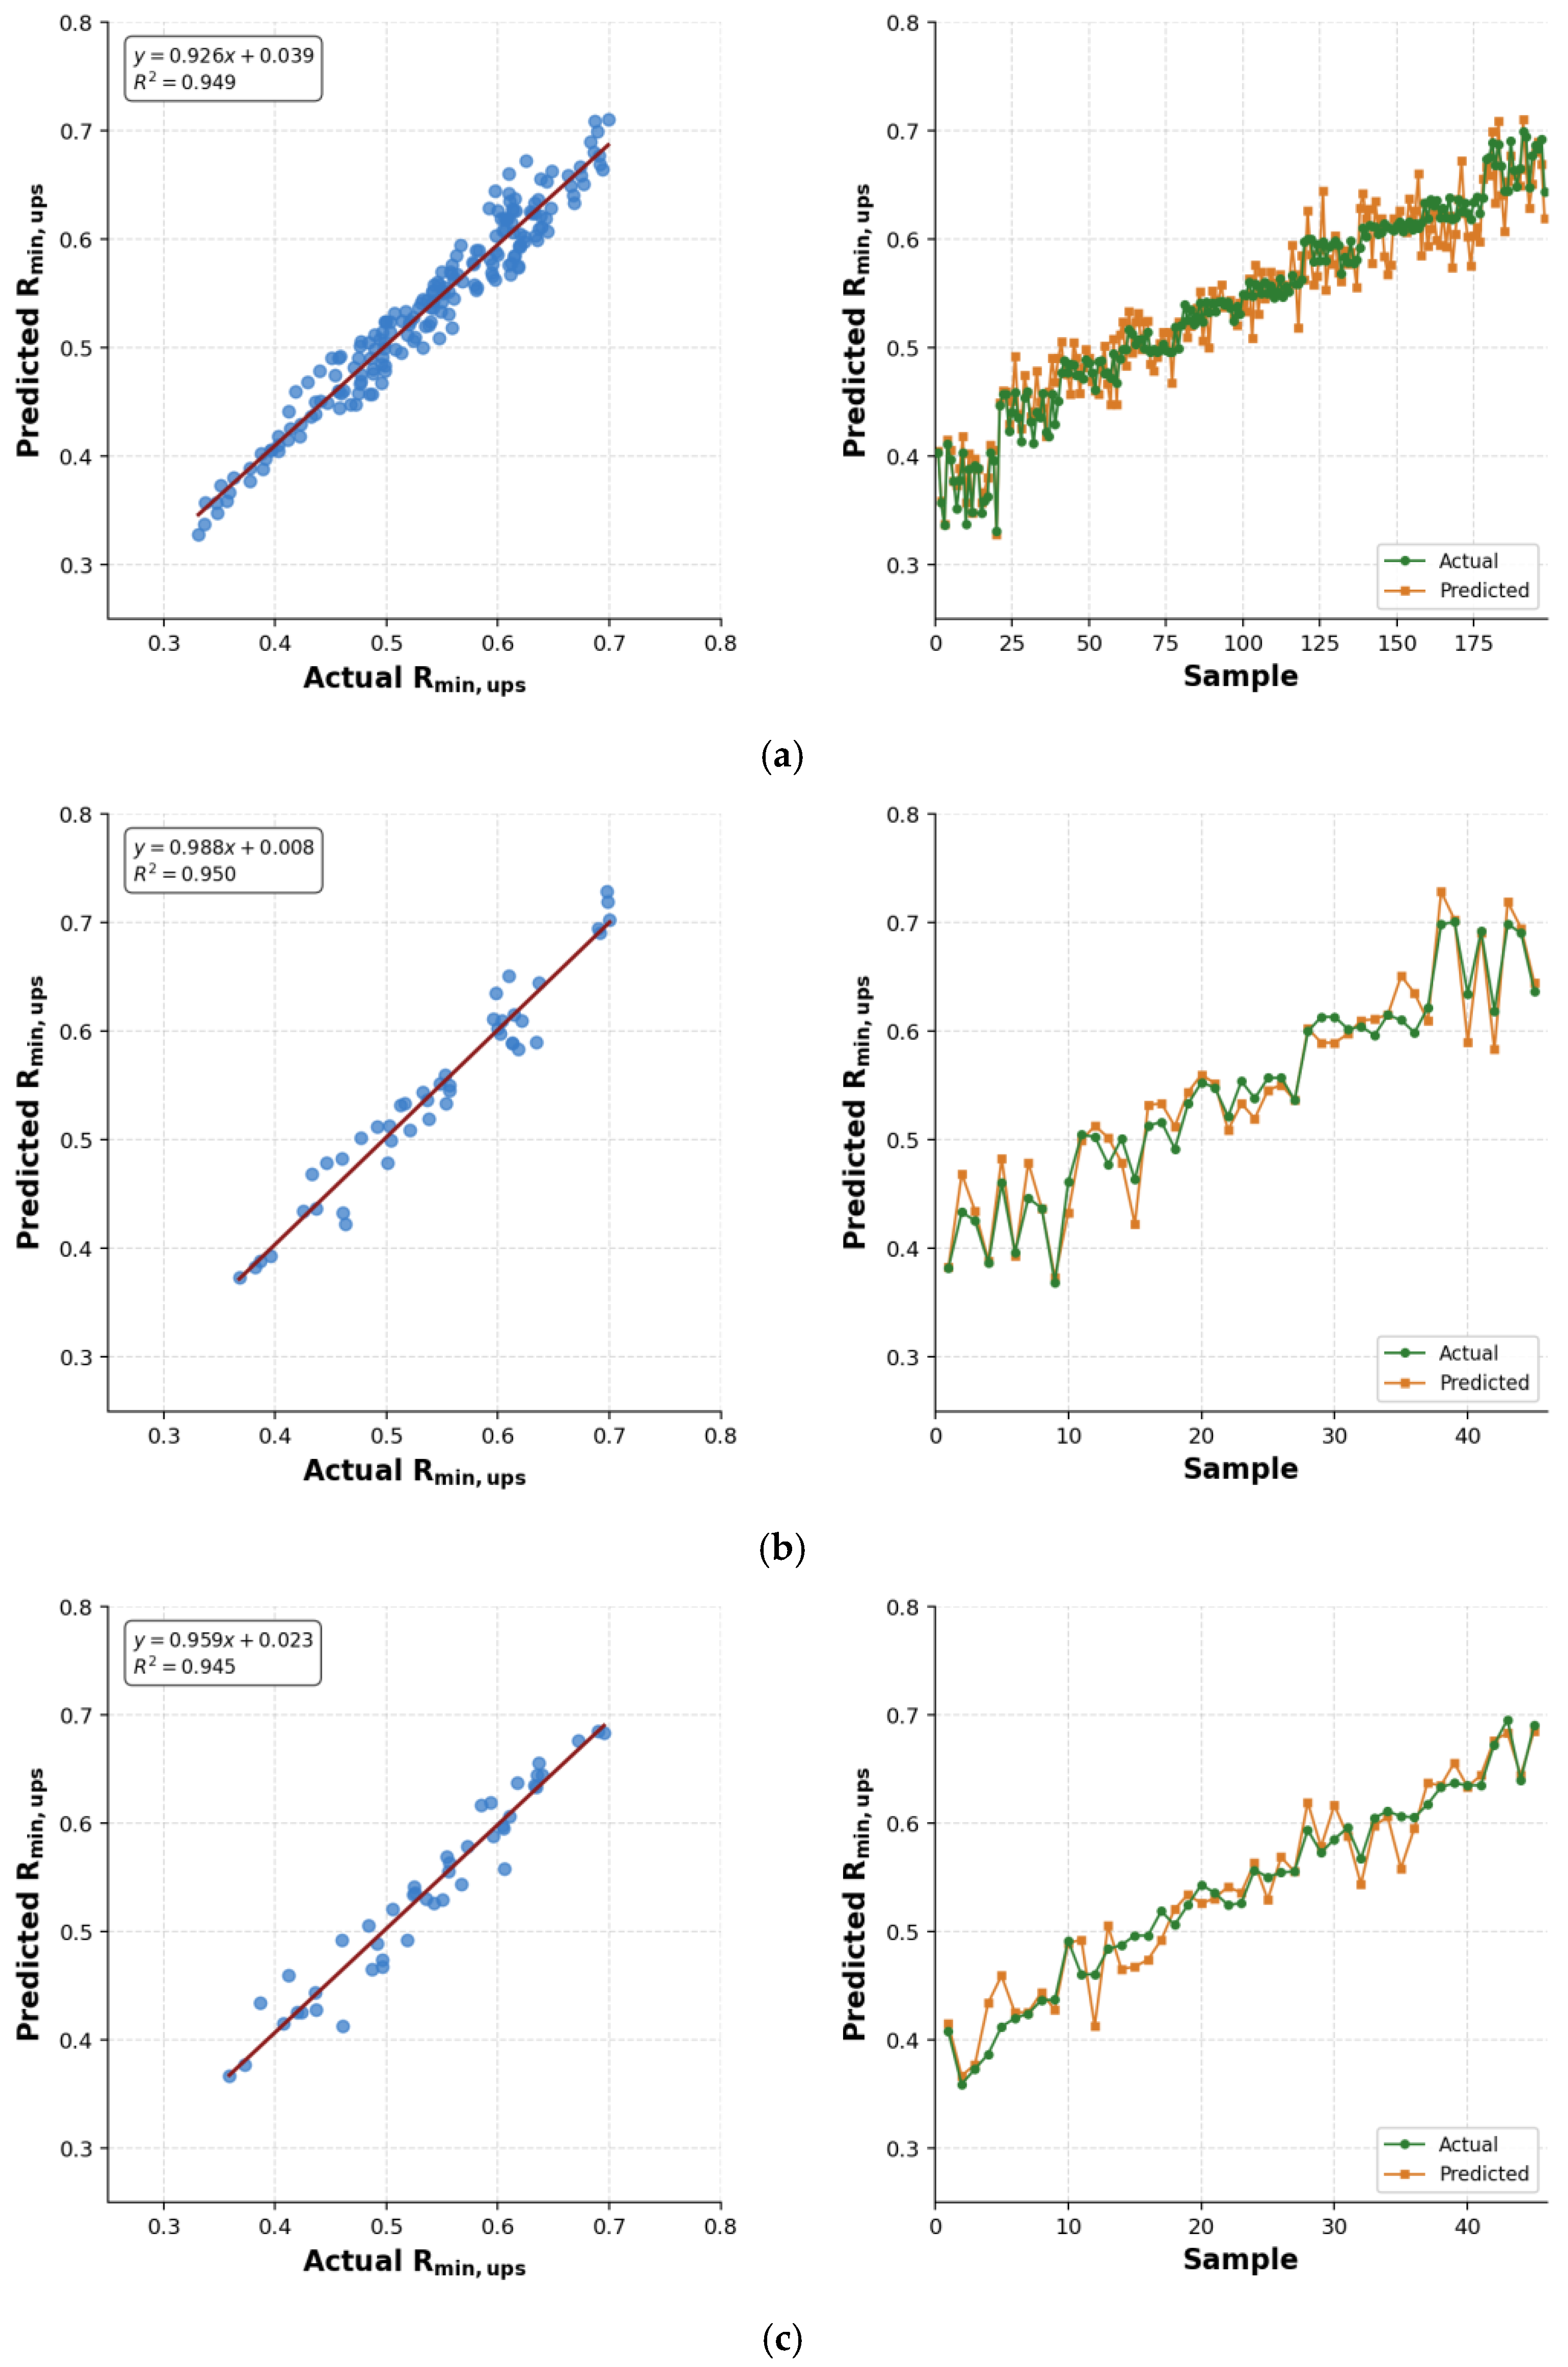
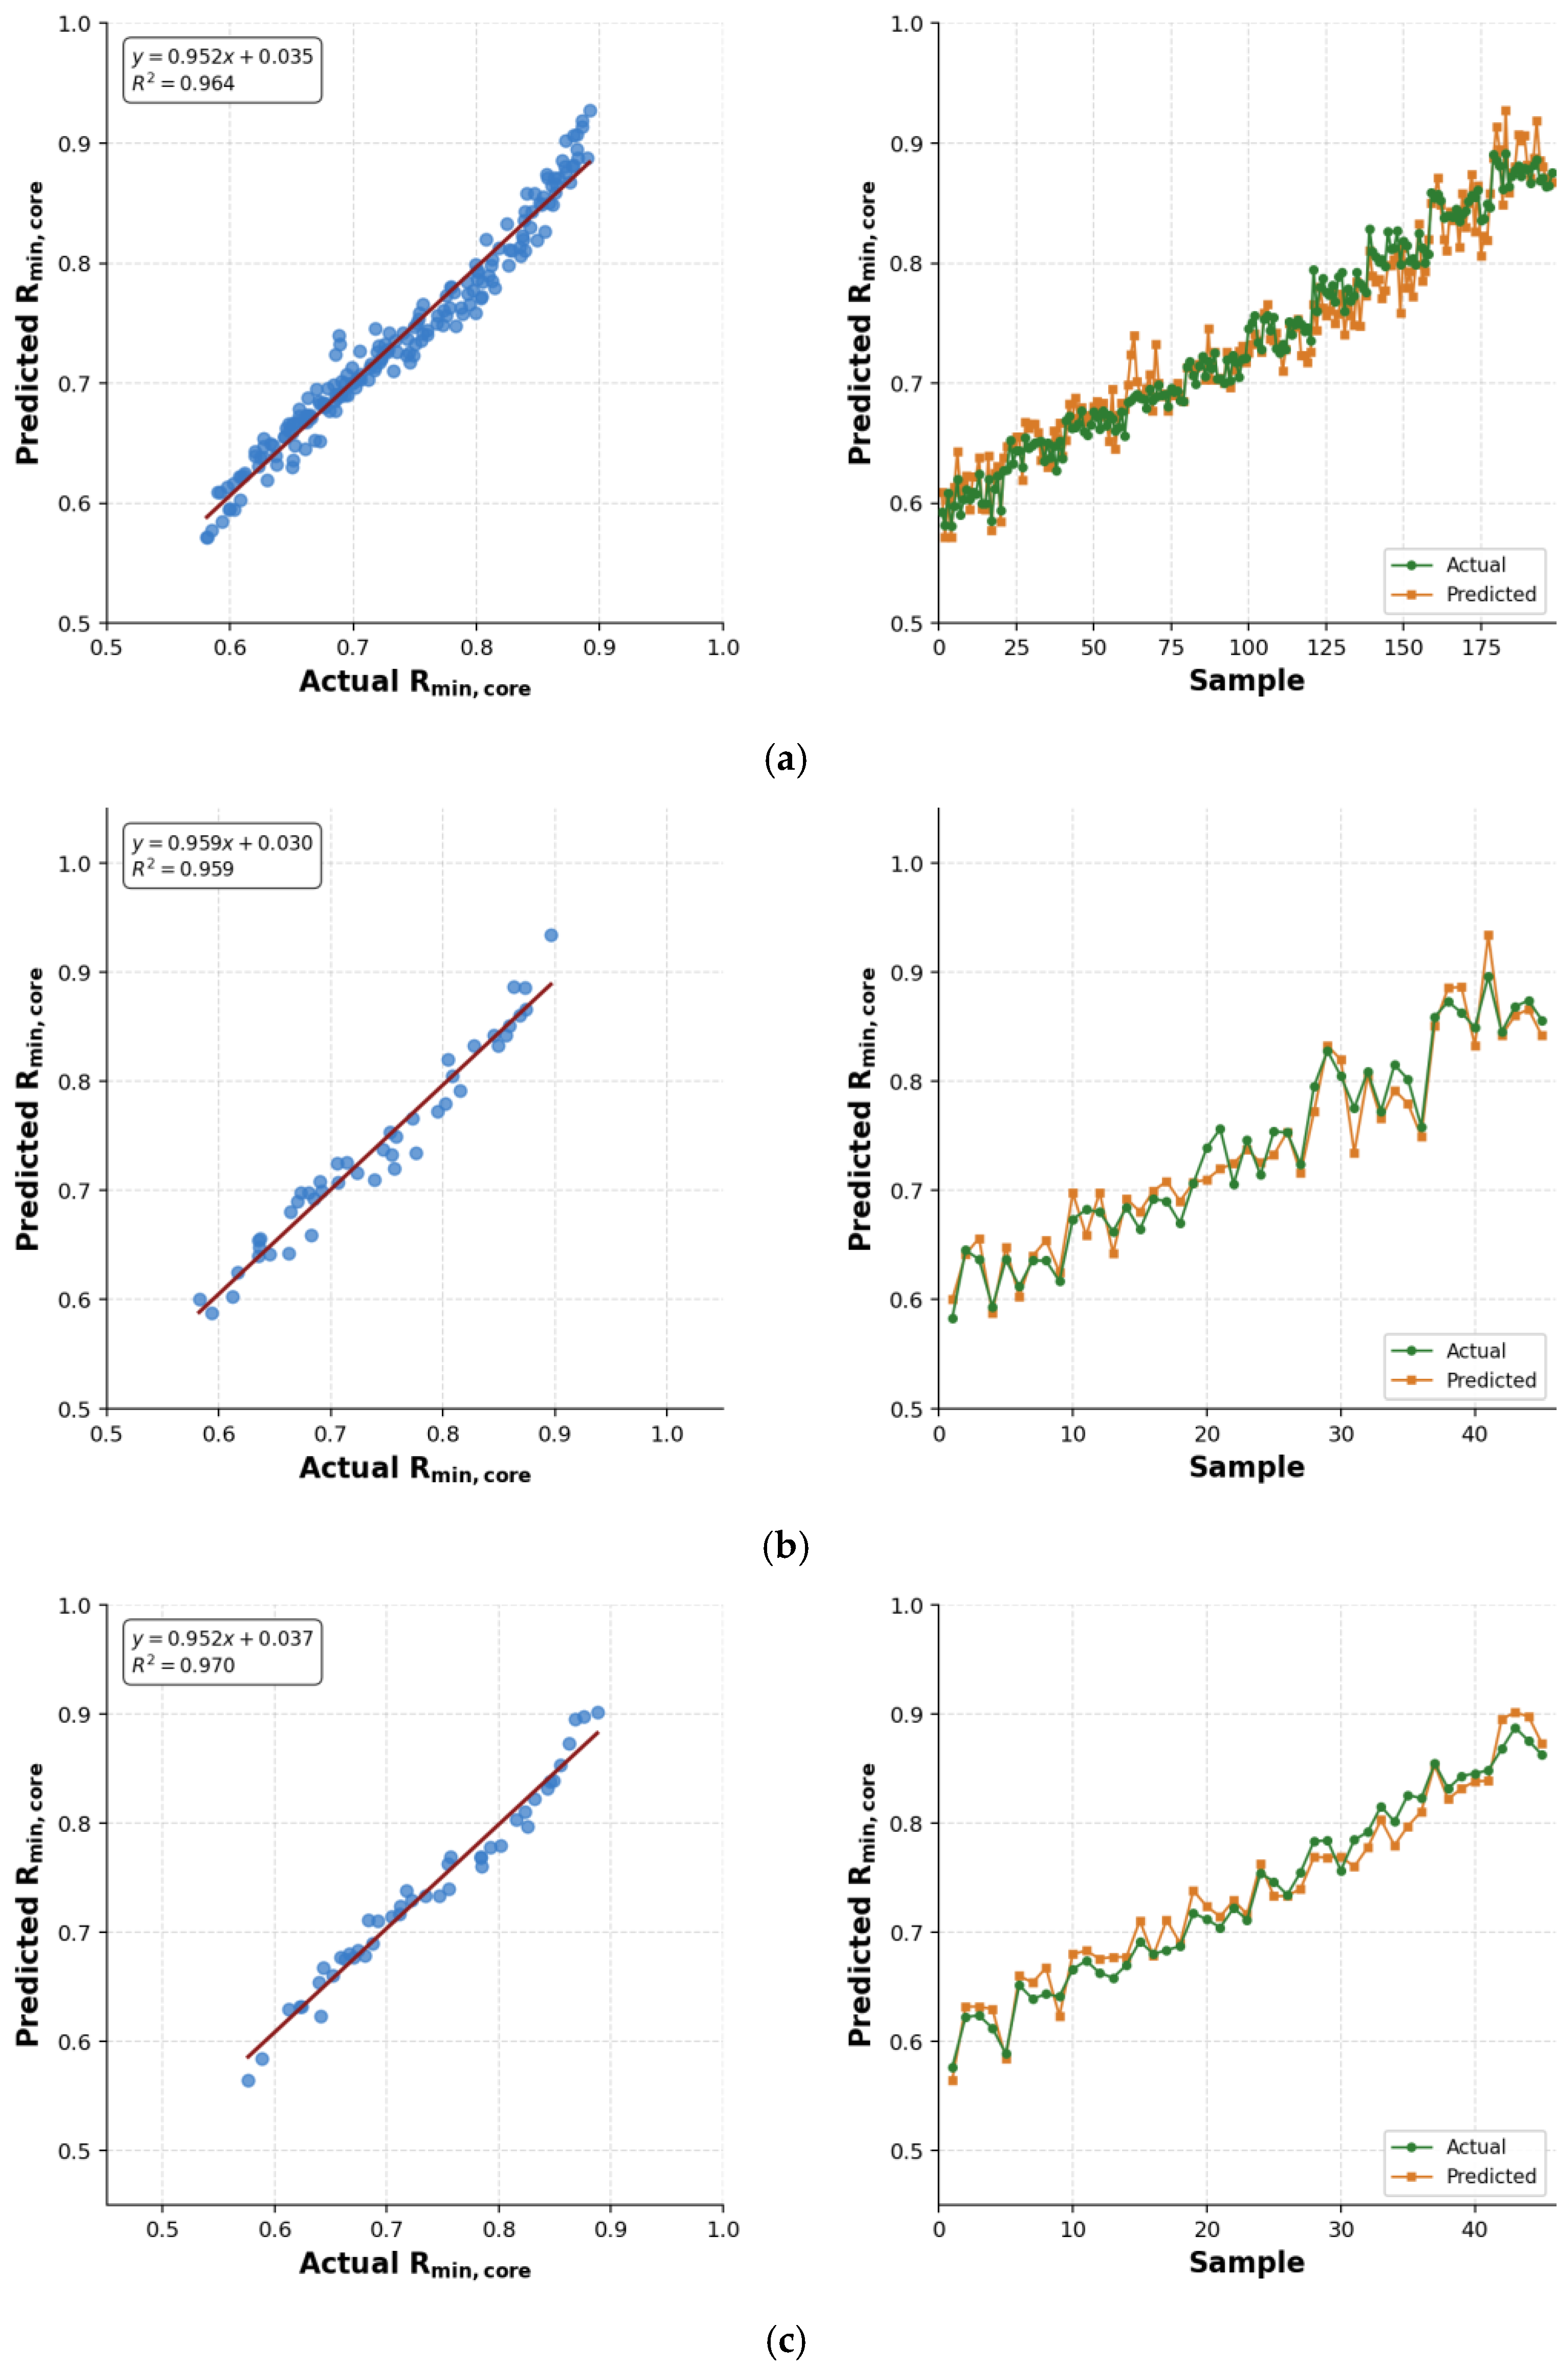
To further support the statistical performance metrics,
Figure 14 and
Figure 15 compare the actual and predicted values of
and
for the training, testing, and validation datasets. In all cases, the scatter points are closely distributed around the 1:1 line, while the fitted regression lines exhibit slopes close to unity and small intercepts, indicating a strong agreement between the numerical and GEP-predicted results. The sample-based comparisons likewise show that the developed equations successfully reproduce both the overall trends and the local variations in the target variables without any evident systematic overestimation or underestimation. Consistent with the error statistics presented above, the
model exhibits a slightly stronger agreement than the
model, particularly in the validation subset. Overall, these visual comparisons further confirm the robustness, stability, and generalization capability of the developed GEP-based formulations.
6.2. Parametric and Sensitivity Analyses of the Developed GEP Equations
To further examine the behavior of the developed equations, parametric and sensitivity analyses were performed using the complete dataset. In the parametric analysis, each input variable was considered separately, and all cases were grouped according to the discrete levels of that variable. For each level, the corresponding output response was summarized in terms of mean, standard deviation, minimum, maximum, and sample size. In this way, the average response trend of the target variable with respect to each input parameter was evaluated over the full database.
For a given input variable
, the mean value of the output variable at its
th level was computed in Equation (12),
where
is the mean output value at the
th level of the
th input variable,
is the output value of the
th sample within that level, and
is the number of samples in the corresponding group. In the present study, the output variable
denotes either
or
.
The input variables considered in the analysis were
,
,
,
, and
. Thus, the index
refers to one of these input variables, while
denotes its discrete level within the dataset. Based on the grouped mean responses, a range-based sensitivity measure was adopted to quantify the relative influence of each input parameter. The sensitivity of the
th input variable was defined as Equation (13),
where
represents the total variation in the average response caused by the
th input variable over its admissible range.
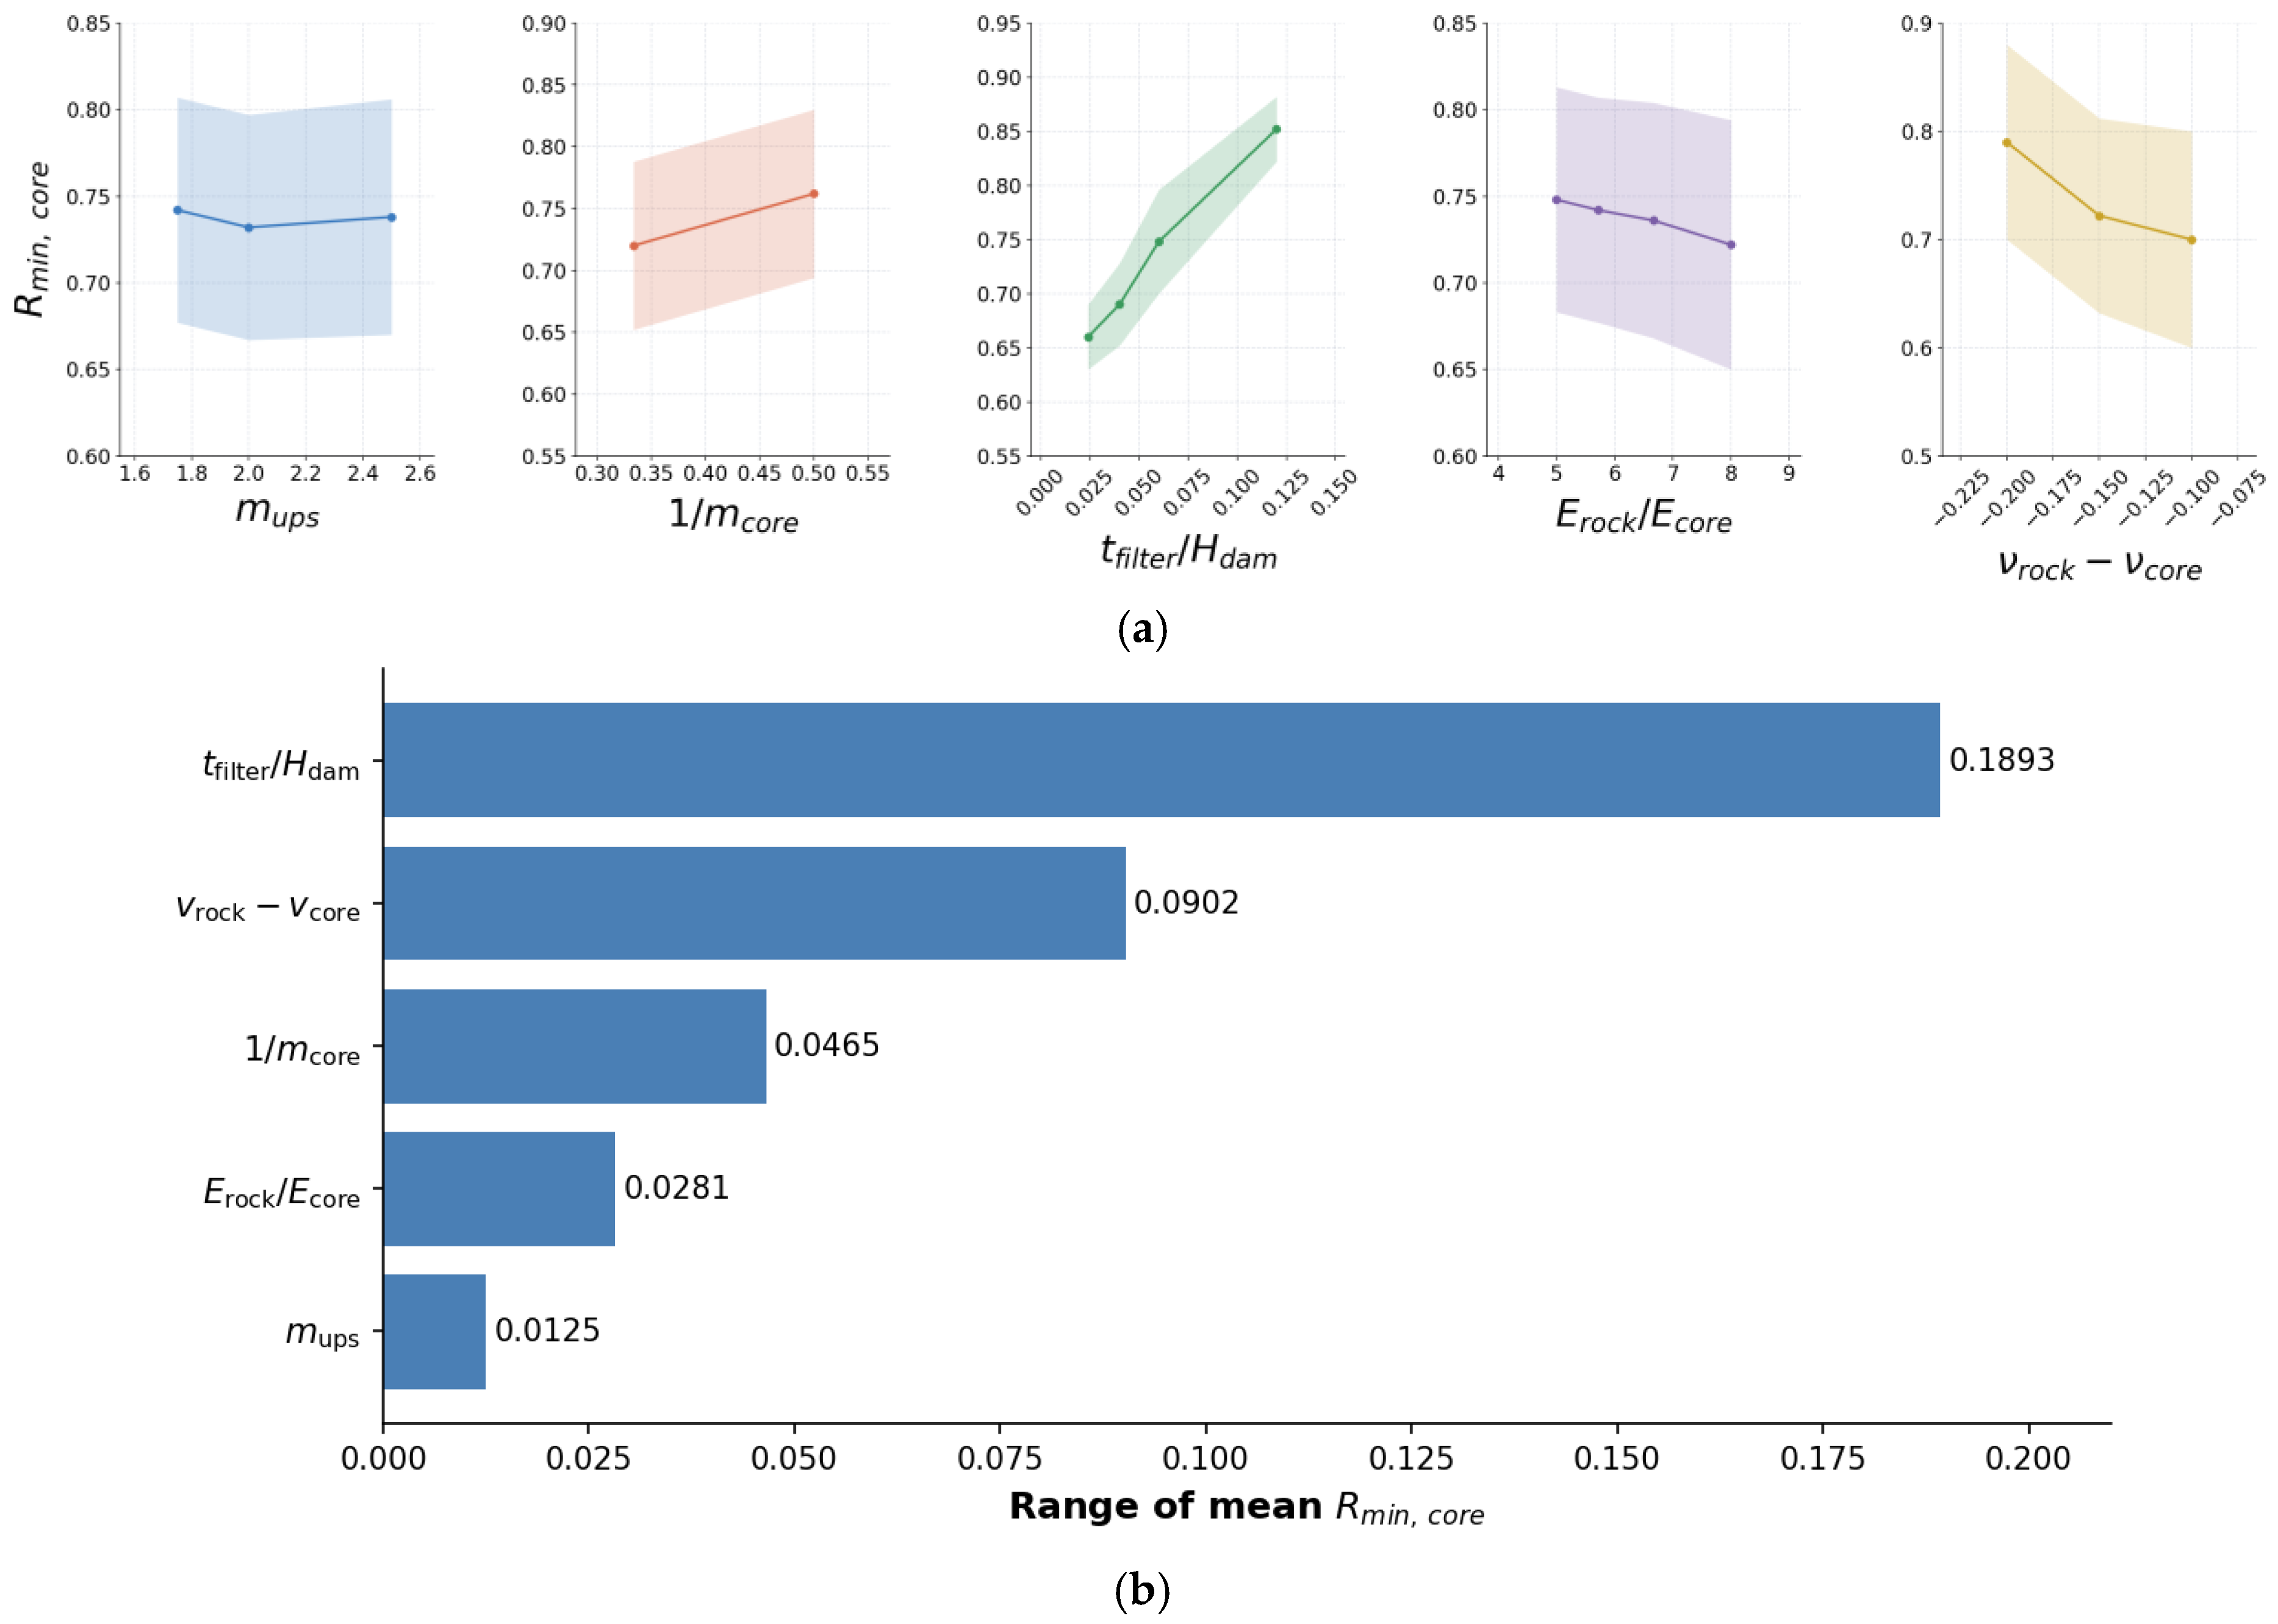
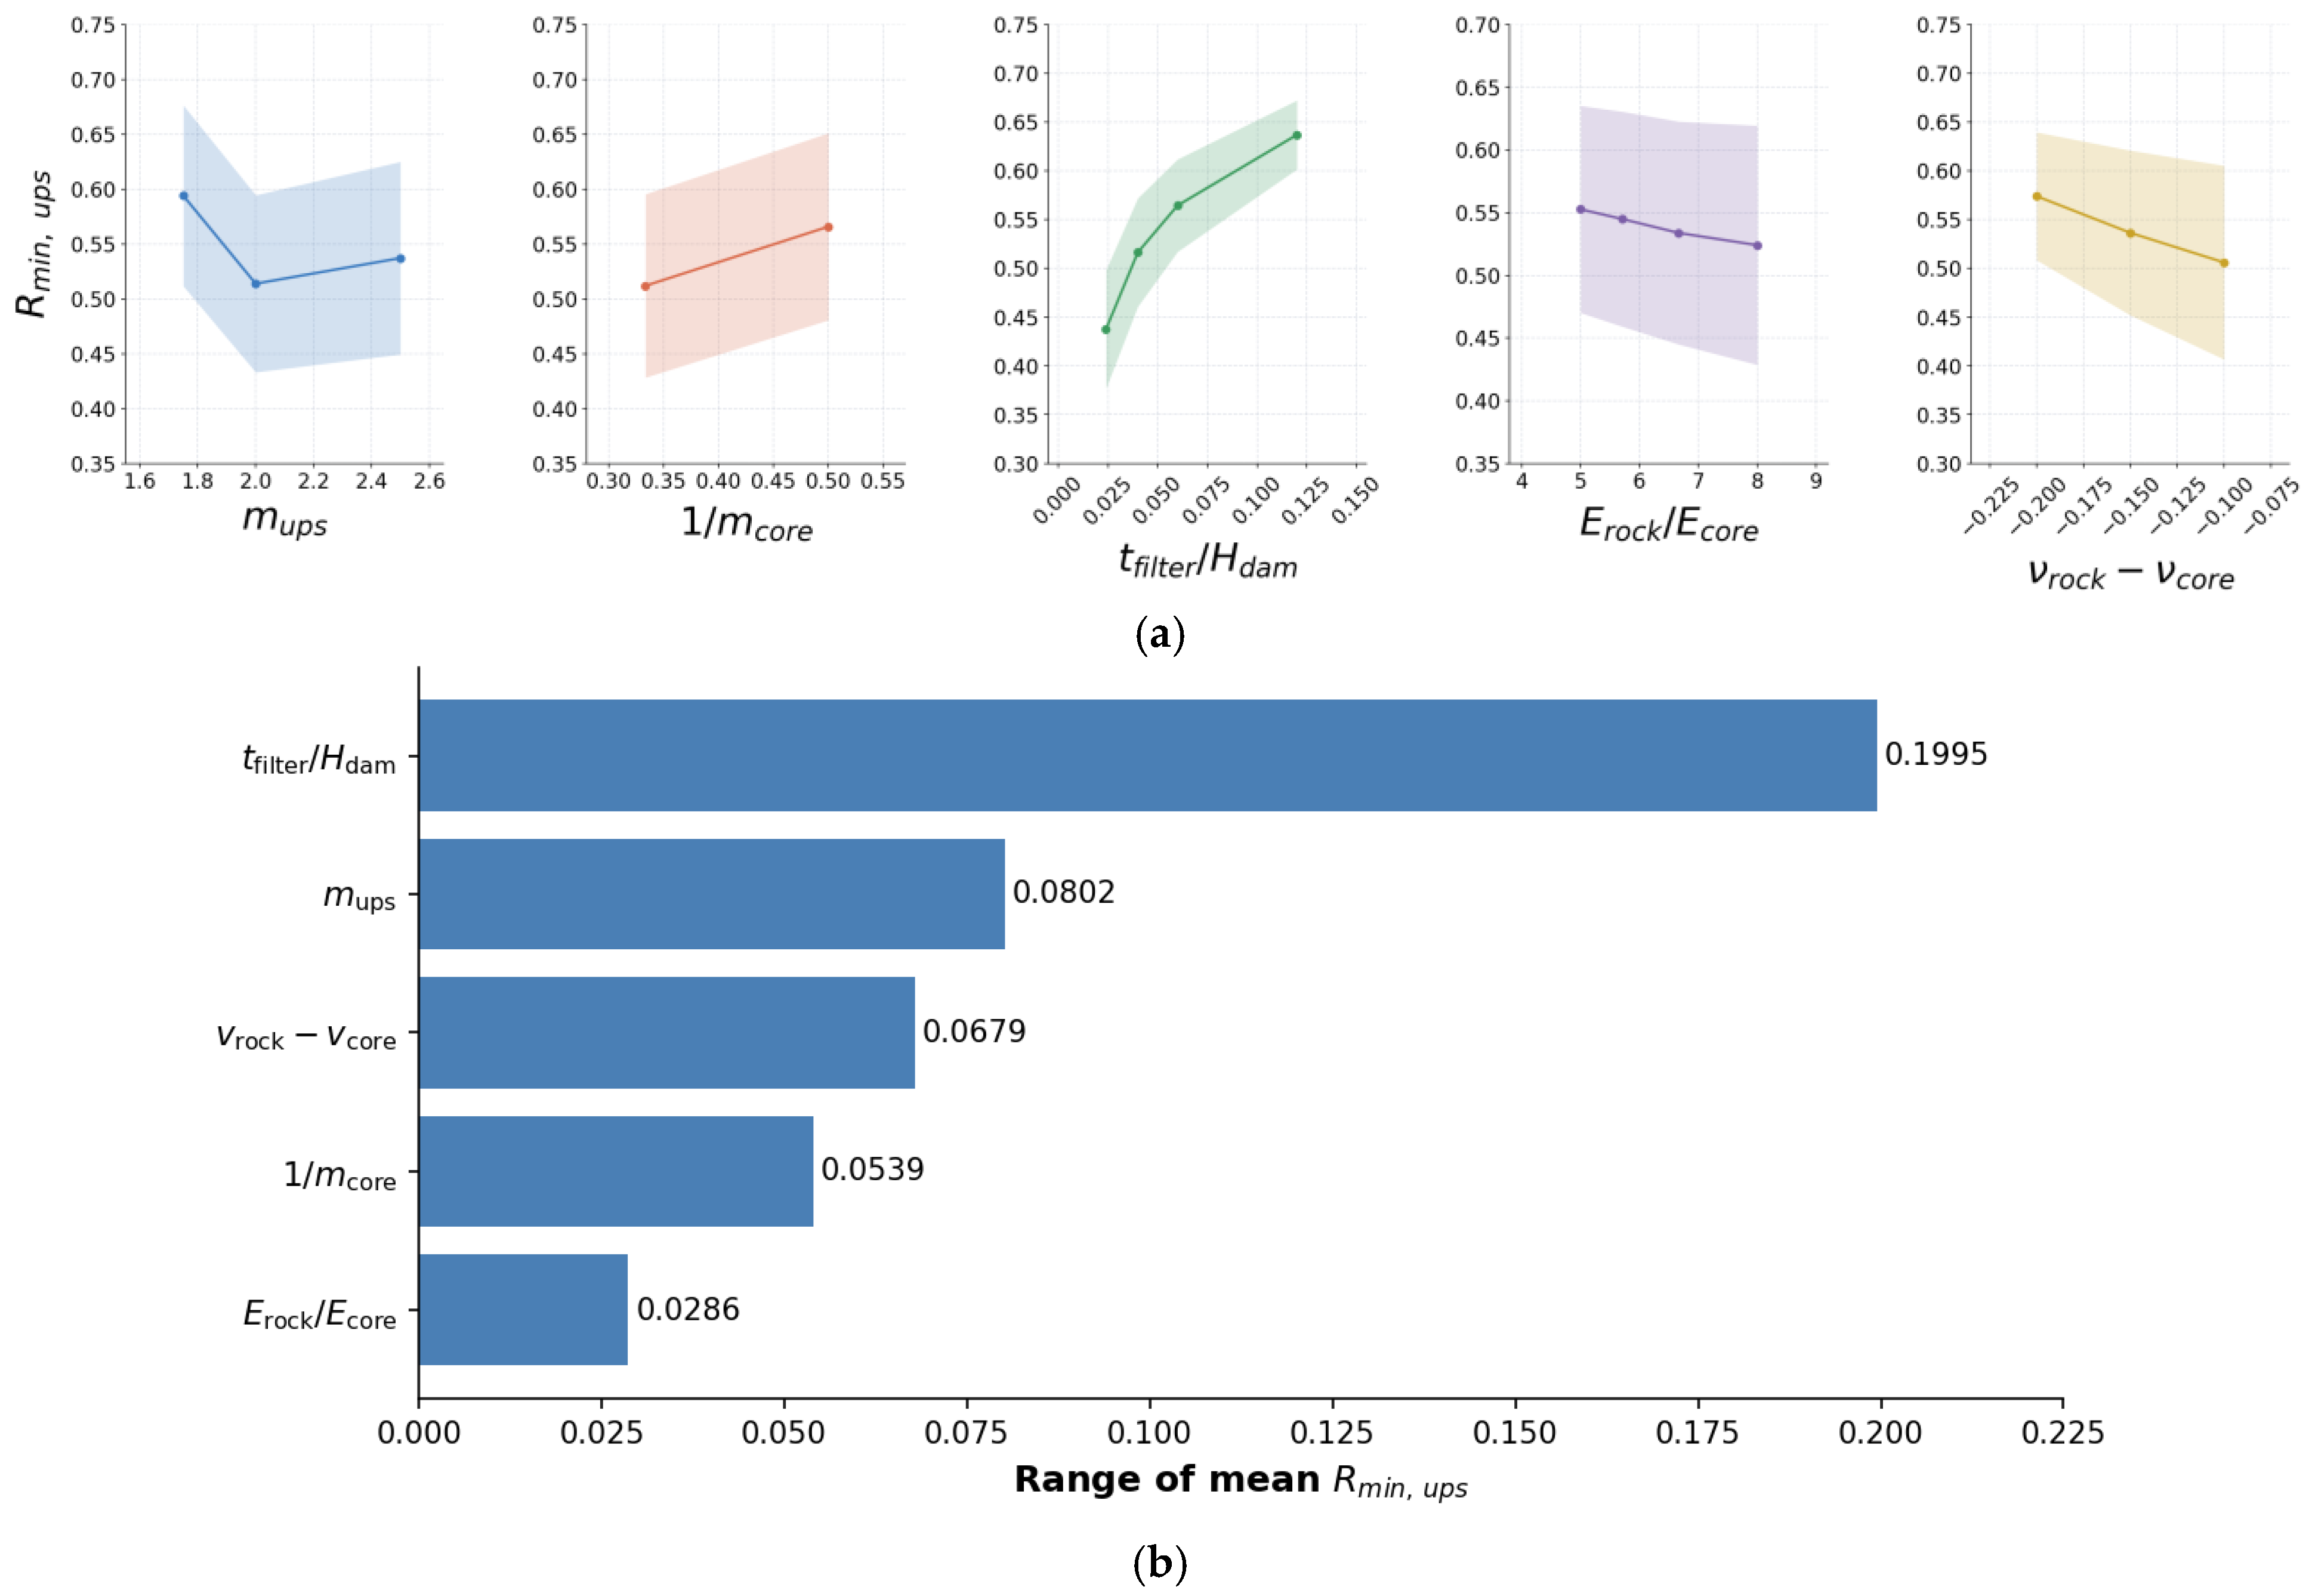
The results of the parametric and sensitivity analyses for the developed
and
equations are presented in
Figure 16 and
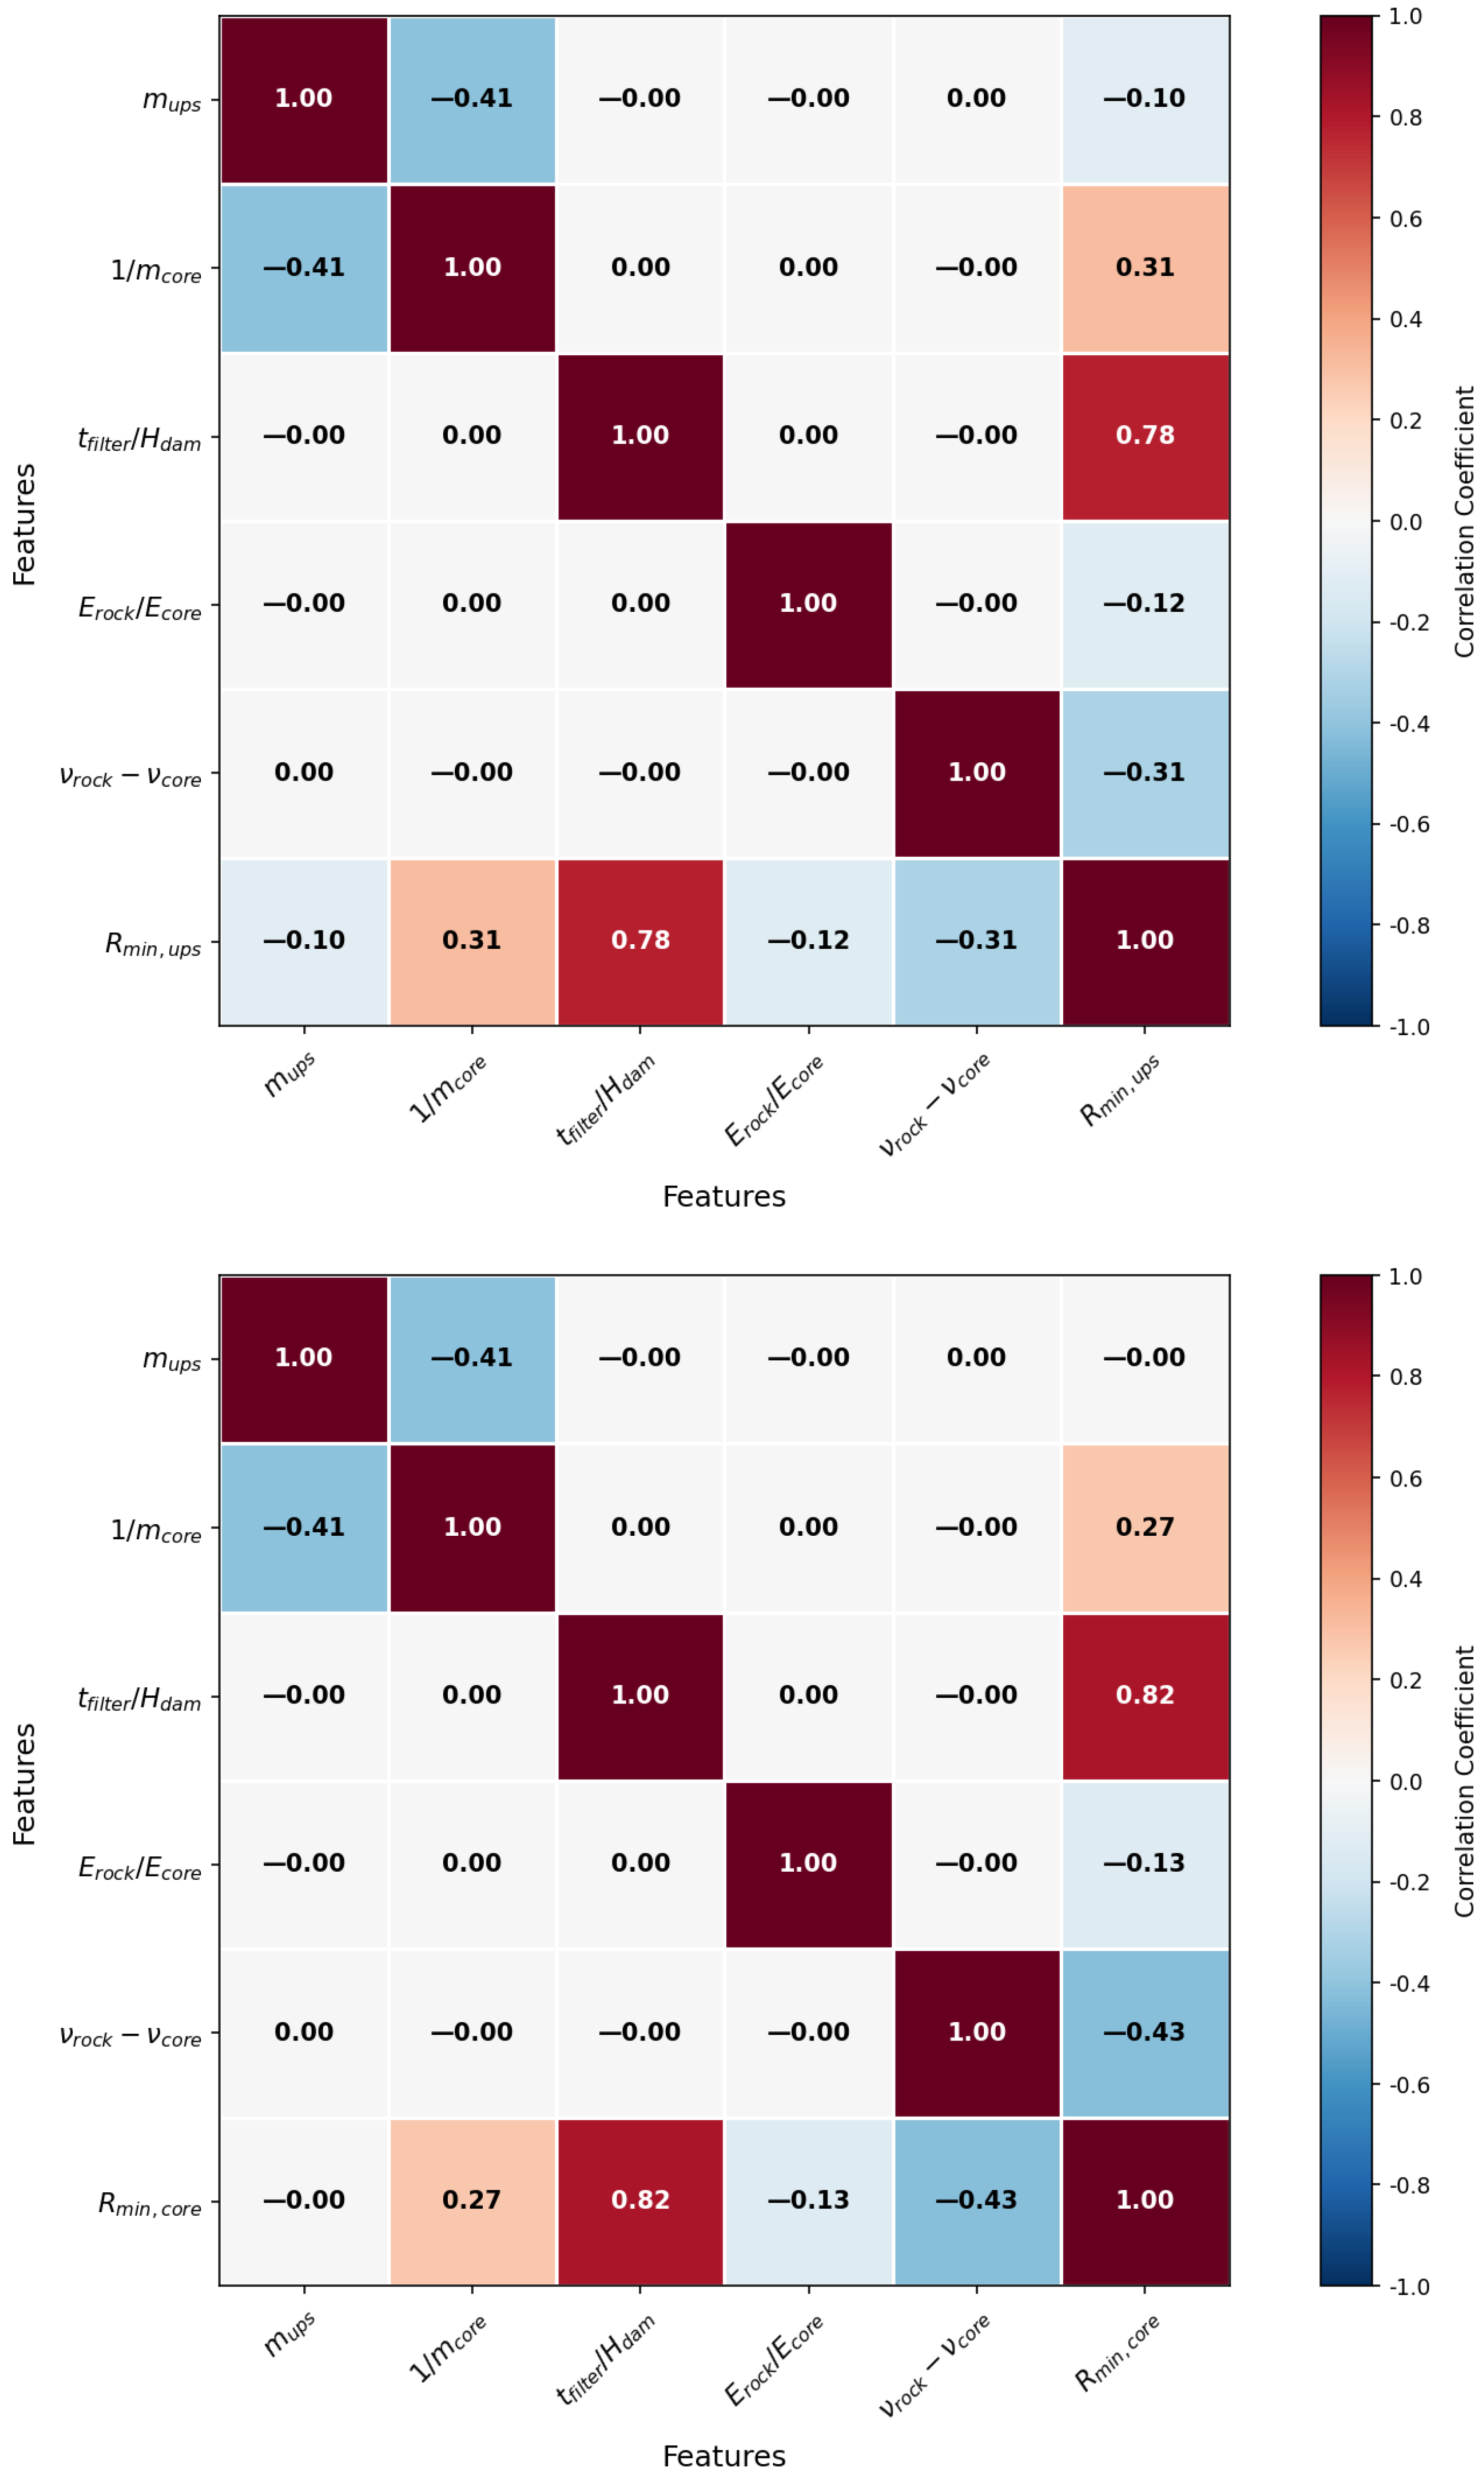
Figure 17, respectively. These analyses were performed to examine whether the developed GEP-based formulations not only reproduce the numerical dataset with acceptable statistical accuracy, but also reflect the physically meaningful trends expected from the transverse arching mechanism in centrally zoned embankment dams. The results indicate that both equations exhibit consistent and interpretable parametric behavior. In particular, the normalized filter thickness ratio,
, shows the strongest positive influence on oth
and
. Since the actual filter thickness was kept constant in the present database, this effect primarily reflects dam-height-related scaling rather than an independent variation in filter thickness. Accordingly, higher
values, corresponding to relatively lower dam heights, are associated with higher arching-ratio values and therefore reduced arching severity. Physically, this suggests that a thicker filter zone relative to dam height provides a more gradual stiffness transition between the clay core and the surrounding rockfill shells, thereby reducing stress transfer from the core and allowing a larger portion of the vertical stress to be retained within it. Consequently, the core stress state approaches the overburden condition, and the severity of transverse arching decreases.
A positive trend is also observed for , indicating that flatter core configurations are associated with higher arching-ratio values and therefore with less pronounced transverse arching. From a mechanical standpoint, increasing the horizontal-to-vertical core slope ratio alters the core–shell interaction geometry and tends to moderate the lateral transfer of stress from the relatively deformable core to the stiffer shell materials. Consequently, the vertical stress retained within the core becomes closer to the overburden stress, and the severity of transverse arching decreases. By contrast, both and are associated with decreasing transverse arching-ratio values. This suggests that a higher stiffness contrast and a less compatible deformation response between the clay core and the surrounding rockfill promote stronger load transfer away from the core, thereby reducing the vertical stress retained within it and intensifying the arching effect. Although the overall tendencies of and are similar, some differences can be identified in their relative sensitivities.
The influence of
is comparatively weak and slightly non-monotonic for
, while it becomes almost negligible for
, suggesting that the upstream shell slope plays a more limited role in the internal core response than in the upstream-side response. This distinction is also supported by
Figure 16b and
Figure 17b, which are based on the range of the mean output values. For
, the response ranges are 0.1995 for
, 0.0802 for
, 0.0679 for
, 0.0539 for
, and 0.0286 for
; for
, the corresponding values are 0.1893, 0.0902, 0.0465, 0.0281, and 0.0125, respectively. These results confirm that relative filter thickness is the dominant governing variable in both equations, whereas the core-center response is more strongly controlled by deformation compatibility and less affected by shell slope geometry. Overall, the parametric and sensitivity analyses demonstrate that the proposed GEP equations preserve the essential physical behavior of transverse arching while providing a statistically reliable representation of the numerical database.
7. Development of MLRA-Based Predictive Equations
Multiple linear regression analysis (MLRA) was also performed to derive benchmark predictive equations for
and
. The resulting formulations are given in Equations (14) and (15).
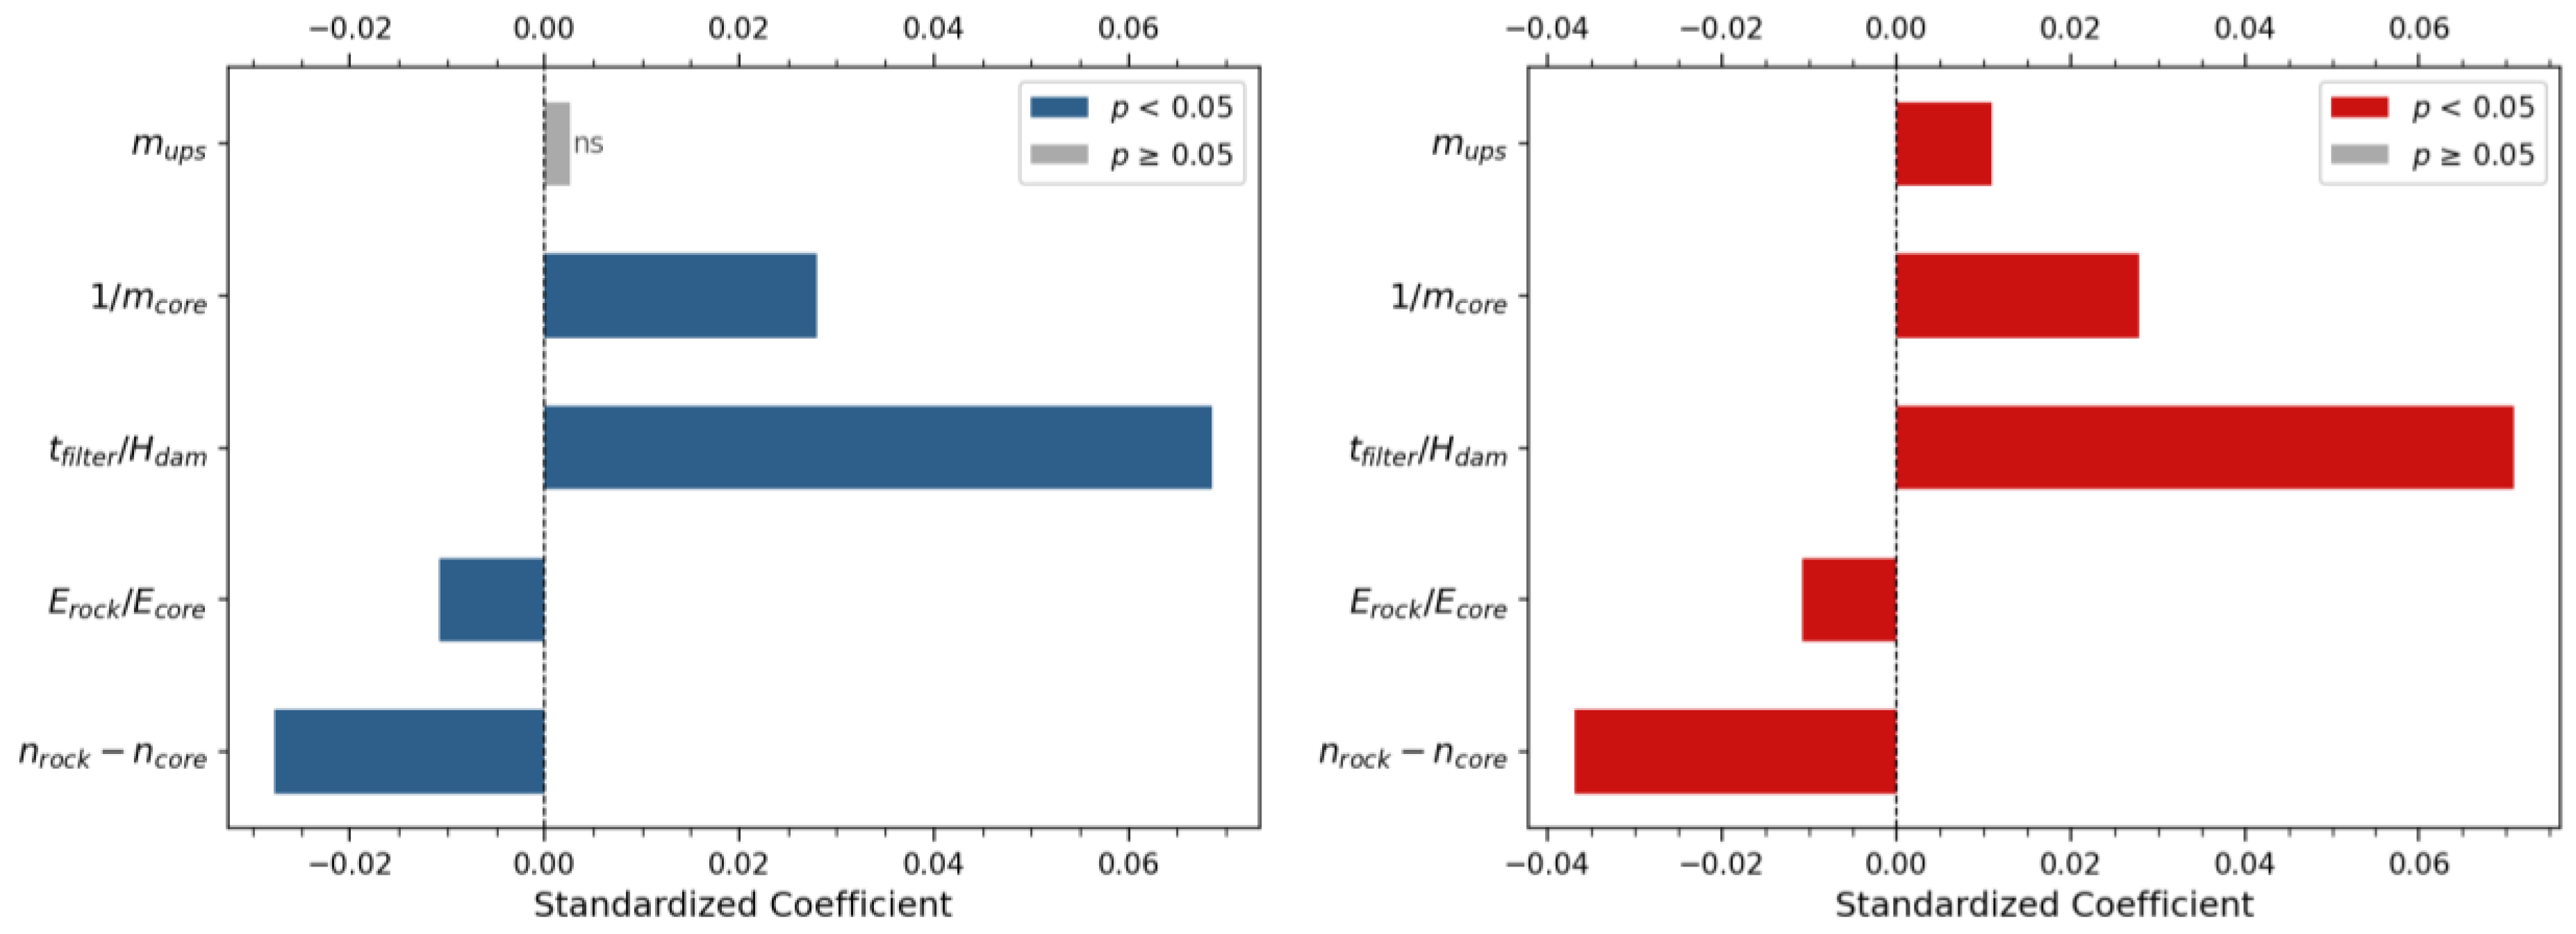
The relative effects of the input variables in the MLRA formulations are illustrated in
Figure 18 through the standardized regression coefficients. In
Figure 18, the standardized regression coefficients are presented together with their statistical significance levels, where colored bars denote coefficients with
and gray bars denote those with
. For both
and
, the normalized filter thickness,
, interpreted here as a dam-height-related scaling parameter, has the largest positive standardized coefficient, confirming that it is the dominant predictor in the linear regression framework as well. The variables
and
also contribute positively, although the effect of
is weak and statistically insignificant for
. By contrast,
and
exhibit negative standardized coefficients, indicating that greater stiffness contrast and less favorable deformation compatibility reduce the predicted transverse arching ratio. The fact that most predictors are statistically significant at the 95% confidence level, particularly for
, supports the physical and statistical relevance of the selected input set. Overall, the MLRA coefficients reproduce the main directional trends observed in the GEP-based parametric and sensitivity analyses, although the linear model represents these relationships in a simpler and less flexible form.
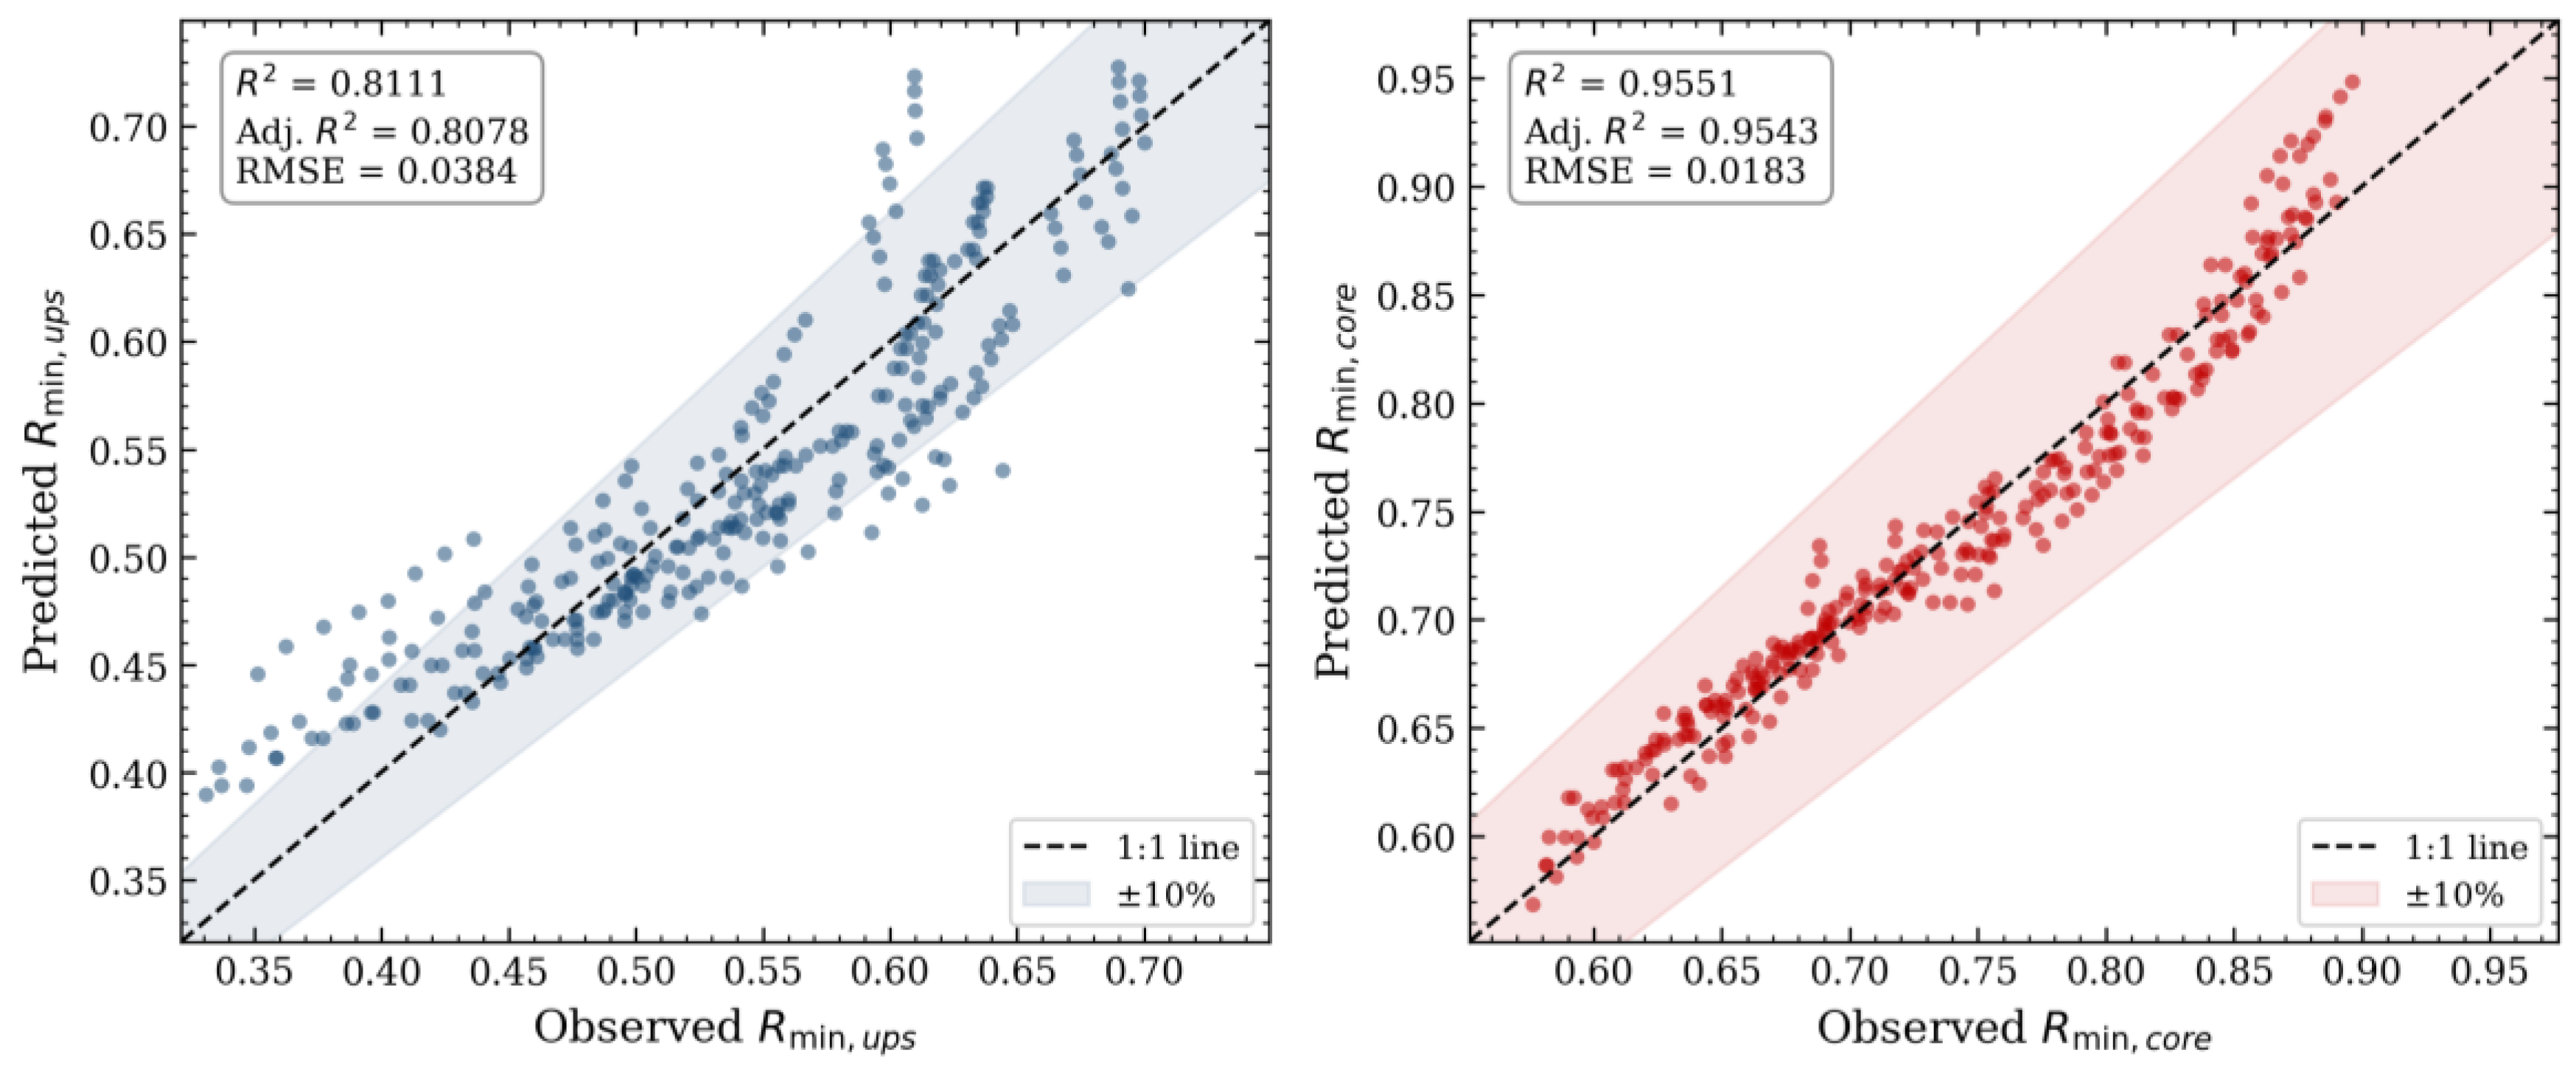
The predictive capability of the developed MLRA equations is further illustrated in
Figure 19 through comparisons between the observed and predicted values of
and
. The adjusted
was additionally reported, as it accounts for the number of predictors and therefore provides a more robust measure of model explanatory performance. For
, the points are generally aligned with the 1:1 line, but the scatter is noticeably broader than that observed for the GEP-based model, which is consistent with the lower coefficient of determination (
) and higher RMSE (0.0384). This indicates that, although the MLRA equation captures the overall increasing trend of the response, its ability to represent the variability of the upstream arching ratio is limited. In contrast, the
equation shows a much tighter clustering around the 1:1 line, with
, adjusted
, and RMSE = 0.0183, indicating a substantially stronger predictive performance. In both cases, most predictions remain within the ±10% band, but the dispersion is clearly smaller for
, suggesting that the core-center response is more amenable to linear approximation than the upstream-side response.
A comparison of the overall performance metrics of the developed GEP and MLRA equations is presented in
Table 5. The results clearly show that the GEP-based formulations outperform the corresponding MLRA equations for both
and
. The difference is particularly pronounced for
, for which the GEP model yields a substantially higher coefficient of determination (
) and markedly lower error values than the MLRA model (
, RMSE = 0.03839, MAE = 0.03052, and MAPE = 5.9277). This indicates that the nonlinear symbolic structure of GEP is considerably more effective in capturing the complex response of the upstream-side arching ratio than the linear regression formulation. For
, both models provide relatively high predictive accuracy; however, the GEP equation still performs slightly better, with higher
and lower RMSE, MAE, and MAPE values than the MLRA counterpart. This smaller difference suggests that the core-center response is more regular and therefore more amenable to linear approximation than the upstream-side response. Overall, the comparison confirms that GEP offers a more accurate and flexible predictive framework, whereas MLRA provides a simpler but less powerful benchmark formulation.