Article

An Eye-Tracking-Driven Evaluation Framework for Age-Friendly Smart Home Interface

College of Furniture and Industrial Design, Nanjing Forestry University, Nanjing 210037, China
*
Author to whom correspondence should be addressed.
Appl. Sci. 2026, 16(11), 5454; https://doi.org/10.3390/app16115454 (registering DOI)
Submission received: 25 April 2026 / Revised: 18 May 2026 / Accepted: 27 May 2026 / Published: 30 May 2026

Abstract

Smart home mobile applications are a primary digital channel through which older adults manage home devices and access daily services. Existing evaluation approaches do not adequately capture the cognitive burden experienced by older users, because dimensional weights are typically assigned through expert judgment rather than derived from target-user data. This study proposes a framework integrating eye-tracking-derived cognitive load with WCAG 2.2 criteria. Evaluation dimensions are defined based on the MOLD-US aging barrier classification, and nine indicators are selected according to compliance level, quantifiability, and relevance to cognitive aging. Cognitive load data from 35 older adults (aged 60–75) were used to calibrate dimensional priorities. Accessibility-related tasks produced significantly higher cognitive load than visual and operational tasks (Cohen’s d z = 0.855), and the ordering held across three Cognitive Load Index aggregation schemes. A hybrid scoring mechanism combining a multimodal large language model with rule-based scripts was implemented for scalable evaluation. Validation on six high-fidelity prototypes showed strong agreement with expert ratings (Spearman’s ρ = 0.71–0.93) and on the same scoring task, the framework required about 1/14 of the time taken by an expert panel. By calibrating dimensional weights with eye-tracking data from older adults instead of expert judgment alone, the framework integrates WCAG compliance scoring with group-specific priorities, positioned as a design-stage screening tool prior to deployment testing.

1. Introduction

Aging populations worldwide have made home-based care a dominant form of eldercare [1], and smart home mobile applications serve as the primary digital channel through which older adults manage home devices and access daily services. Adoption of these technologies among older users is constrained by declines across perceptual, motor, and cognitive channels. How legible, operable, and multimodally accessible the interface is directly affects whether older adults can independently complete device control, status monitoring, and emergency assistance tasks. The reliance of these tasks on each dimension is uneven, and a general-purpose evaluation framework applying uniform dimensional weights across all tasks cannot reflect such cross-task differences. Current evaluation methods rely on expert-assigned dimensional weights and manual review, leaving the interaction burden borne by older users outside the scoring logic.
Existing evaluation approaches exhibit two critical limitations. Dimensional weights are typically assigned through expert judgment or the Analytic Hierarchy Process [2], without grounding in objective behavioral evidence derived from target users, and therefore do not reflect the load experienced by older adults. Conventional heuristic reviews and expert blind ratings are labor-intensive; their outcomes depend heavily on the evaluators’ experience and do not fit the high-frequency iteration pace of agile development [3].
To address these limitations, this study proposes an age-friendly evaluation framework for smart home mobile interfaces. WCAG 2.2 is a general accessibility standard not specifically calibrated for the usability burden experienced by older adults; MOLD-US, derived from a literature synthesis of barriers older adults face in mobile applications, is more closely aligned with the evaluation target of this study than general-purpose human factors or accessibility frameworks [4]. The evaluation dimensions are derived from the MOLD-US aging barrier classification, and the indicators are selected from the WCAG 2.2 success criteria that are applicable to smart home contexts. Priority weights across dimensions are calibrated using cognitive load data collected from older adults through an eye-tracking experiment. The nine indicators are evaluated through a hybrid mechanism combining multimodal large language models for visual-semantic reasoning and rule-based scripts for code-level parameter extraction. Indicator scores are aggregated through weighted summation, producing a composite age-friendliness score together with a structured deduction report. Reliability, validity, and efficiency of the framework were tested on six high-fidelity prototype scenarios built with reference to mainstream smart home applications.
This study makes two contributions. First, it introduces a behavior-grounded weighting approach that integrates eye-tracking-derived cognitive load with WCAG 2.2, shifting dimensional weight calibration from expert judgment to empirical user data. Second, combining rule-based scoring with a multimodal language model yields Spearman correlations of 0.71–0.93 against blind expert ratings on the same scoring task at about 1/14 of the expert panel’s time, suitable for screening at the design stage prior to deployment testing.

2. Related Work

The tasks carried by smart home mobile applications range from switching devices on and off to triggering emergency assistance, placing differentiated demands on older users whose perceptual, motor, and cognitive capacities decline along distinct dimensions. Eye-tracking and EEG measurements have quantified the effects of font size, contrast, and information density on task performance, and separate experiments have tested button size and navigation structure in smart home contexts [5,6]. A recent systematic review integrated a decade of eye-tracking evidence on older users and identified the pathways through which visual parameters regulate cognitive load [7]. These findings map onto three categories of age-related interface demand: visual readability under reduced contrast sensitivity, reachability and error prevention under tremor and reduced motor control, and multichannel redundancy under reduced reliance on any single perceptual channel. The first two categories are addressed by general usability research; multichannel redundancy corresponds to accessibility as defined by WCAG [8], referring to the provision of alternative pathways for users with limited perceptual or motor capacity. Each category corresponds to a distinct design locus that a general-purpose evaluation framework will not automatically address.
Existing evaluation approaches address these demands along two paths. In heuristic evaluation and expert frameworks, evaluators review the interface item by item against criteria drawn from experience [9,10,11]. WCAG 2.2 offers an alternative anchor, providing quantitative thresholds for contrast ratio, text scaling, and target size [8]. Adjacent fields such as telemedicine rely mainly on interviews, focus groups, and questionnaires, with limited grounding in theoretical models of aging [12]. Across both paths, the dimensional weights applied during aggregation are derived from expert experience or the Analytic Hierarchy Process, and behavioral data from the target users themselves rarely enter this step [13]. The Analytic Hierarchy Process uses pairwise comparison and consistency checks, which makes weight derivation more reproducible than direct rating; however, the consistency check only constrains the internal coherence of expert judgments and does not guarantee that the weights match the burden experienced by older adults across different tasks. The behavior-based weighting strategy in this study uses eye-tracking measurements from older adults as the basis for weight derivation, removing the weights from expert judgment. WCAG itself was developed for disability populations in general and does not carry an indicator selection or weight structure tailored to age-related perceptual decline; its coverage of older users’ needs in smart home settings therefore remains partial [14], and the absence of multichannel accessibility support in particular enlarges operational barriers for older users [15].
At the execution layer, a set of automated and semi-automated methods has been developed to reduce manual review load. Earlier work used rule-based engines that read contrast ratio, target size, and similar quantifiable properties directly from front-end code or DOM structure [16]. Such engines are limited to properties that can be read from code and cannot handle indicators requiring visual semantics or spatial reasoning. Recent studies have taken interface screenshots as input for heuristic judgment by multimodal models [17,18] or used pairwise comparison to support expert scoring [19]. These studies share a common shift: from manual to programmatic execution of evaluation. The dimensions and weights used inside these automated pipelines continue to follow expert frameworks, so the automation so far operates on the execution layer rather than on the weight-construction layer.
Eye tracking is a well-established source of objective data on this last layer. Fixation duration, blink rate, saccade parameters, and pupil diameter change index information-processing difficulty, visual fatigue, and cognitive resource investment, and their validity have been examined across disciplines [20]. In interface research, fixation heatmaps and saccade paths have been used to account for differences in task performance; in smart home settings, combined eye-tracking and self-report measures have described how users distribute attention during device control [21]. Work on older users has paired eye tracking with EEG to test how visual parameters affect task performance [5,6,14]. In most of this work, eye-tracking data serve behavioral analysis or cognitive-state measurement. Using them to calibrate dimensional weights in an evaluation model is a role that the method itself supports but that existing studies have not yet taken up.
Taken together, three directions of progress sit side by side. Age-friendly evaluation has refined its indicator system but still assigns weights from expert judgment. Automation has streamlined the execution of scoring but inherits the weighting logic of the methods it automates. Eye tracking has matured as a measurement instrument for cognitive load and is routinely applied in behavioral analysis. Bringing older users’ eye-tracking data into the weight-construction step of a WCAG-anchored evaluation, and executing indicator-level scoring through a combination of rule-based and semantic judgment, offers a way to connect the three. The present study builds the framework along this line.

3. Materials and Methods

3.1. Framework Overview

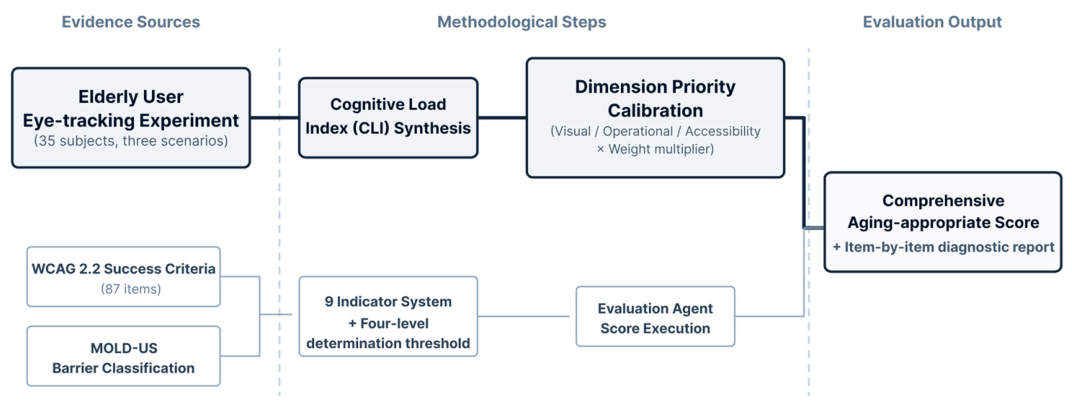
The evaluation framework takes smart home mobile interfaces as its object and receives a dual-modal input of interface screenshots and front-end code. It proceeds through three stages—cognitive load modeling, indicator-level scoring, and weighted aggregation—and outputs a quantified age-friendliness score (Figure 1). Dimensions and indicators are defined jointly by the MOLD-US aging barrier classification and the WCAG 2.2 success criteria; the priority weights across the three dimensions are calibrated by cognitive load data from the eye-tracking experiment. Scoring of the nine indicators is split between a multimodal large language model for visual-semantic judgments and rule-based scripts for parameters that can be read directly from code. Weights and indicator-level scores are aggregated into a composite score accompanied by a structured deduction report. The four construction decisions draw from independent sources: dimensions and indicators from MOLD-US and WCAG, weights from eye-tracking data, judgment mode from code-readability, and threshold values from official WCAG clauses. Smart home mobile applications, covering device control, status monitoring, and emergency response in home-based care, provide the evaluation context.

3.2. Metric System Based on WCAG

The MOLD-US framework proposed by Wildenbos et al. [22] classifies usability problems in mobile health applications into four barrier categories: perceptual, cognitive, motivational, and physical ability. Motivational barriers relate to psychological dispositions and long-term habits, on which a single interface redesign has limited effect; they are excluded from an interface-oriented framework. The remaining three categories map onto distinct interface-design concerns. Perceptual barriers, driven by the decline in contrast sensitivity from lens aging [23], threaten readability and define the visual design dimension (V). Physical-ability barriers, characterized by hand tremor and reduced fine motor control [24], call for reachability and error prevention on interactive controls and define the operational design dimension (O). Cognitive barriers manifest in mobile contexts as an increased need for alternative input and redundant feedback when a single perceptual channel becomes unreliable [25], aligning with accessibility design and giving rise to the accessibility design dimension (A). The three dimensions cover the MOLD-US barrier categories that can be addressed directly through interface design.
Indicators are drawn from the 87 success criteria of WCAG 2.2 [8], issued by the W3C, each carrying a compliance level (A/AA/AAA) and a quantitative judgment condition. The four WCAG principles target disability populations in general and do not map one-to-one onto the three dimensions derived from age-related physiological decline; dimensional classification therefore follows MOLD-US, while WCAG supplies the indicators. Three conditions were applied simultaneously to filter the 87 criteria: compliance level must be A or AA, aligning with the compliance target adopted by mainstream application deployment, since WCAG positions AAA as “not expected for all content”; the judgment condition must carry a quantitative threshold such as a contrast ratio, pixel dimension, or event-mechanism type, so that each indicator can be scored automatically by either the rule-based scripts or the multimodal LLM evaluation; and the corresponding usability barrier must have empirical support in at least two independent studies on cognitive aging, anchoring indicator selection to the empirical basis of age-related research. Nine criteria satisfy all three conditions and are assigned three per dimension (Table 1).

3.3. Cognitive Load Modeling via Eye-Tracking

The study received ethical approval (see Institutional Review Board Statement); written informed consent was obtained from all participants before the experiment. The relative contribution of the three dimensions to cognitive burden requires objective physiological measurement rather than theoretical reasoning alone. Eye tracking is an established method for cognitive load measurement [26], introduces minimal interference, and allows continuous data collection during natural operation. Four classical features are associated with cognitive load: mean fixation duration, blink rate, saccade rate, and pupil diameter change rate [20]. The experiment compares cognitive load across operational scenarios to calibrate priority weights for the three dimensions.
Thirty-five older volunteers were recruited with an inclusion criterion of 60–80 years; the achieved sample ranged from 60 to 75 years (M = 63.2, SD = 5.7; 16 men, 19 women). The sample mean of 63.2 years falls within the young-old segment (55–75 years) defined in Neugarten’s classical gerontological classification [27], which corresponds to the principal target user group of smart-home elderly-care products in China [28]. Inclusion required basic smartphone experience and normal or corrected to normal vision; participants with Mini-Mental State Examination (MMSE) scores below 24 were excluded [29]. The sample size provides adequate statistical power (1 − β > 0.95) to detect large effect sizes ( d z ≥ 0.8) in paired comparisons [30].
Stimuli were drawn from two smart home mobile applications with high market share in China, covering lighting, air conditioning, security, and audio-visual devices. Brand identifiers were removed and original interface designs were preserved. Three task types corresponded to three operational scenarios: Scenario V required locating a device on the home page and confirming its operating status (visual readability); Scenario O required adjusting the temperature to a specified value on the detail page (fine motor control); and Scenario A required locating and triggering the voice control or emergency assistance entry (reachability of alternative channels). Task order was balanced with a Latin square design, and a 2 s fixation point was inserted between tasks. Each interface contained text labels, touch controls, and alternative-channel entries simultaneously, so priority calibration rests on overall load differences across scenarios. Element count and layout density were held comparable (8–12 interactive elements per screen) to control for interface complexity.
Beyond surface-level complexity, each of the three scenarios is a complete operational task involving multiple evaluation dimensions. Specific actions, task type (such as the differing nature of emergency calls versus voice control), page layout, and decision type vary jointly with the evaluation dimensions under examination; these confounds cannot be fully removed through comparable element counts and layout density alone. Dimensional weights derived from these scenarios may therefore conflate dimension-specific load with scenario-specific load; the priority calibration in this study should be read at the scenario level and applied within the operational forms tested.
Data were collected with a Tobii Pro Fusion remote eye tracker (Tobii AB, Danderyd, Sweden) at 250 Hz in a standardized laboratory with constant screen luminance (250 cd/m2) and environmental illuminance (≈300 lx). Viewing distance was 60–65 cm, a five-point calibration was performed before each session, and a 5 s baseline pupil measurement against a gray background provided the reference for subsequent pupil change rates. Samples with sampling rates below 75% were excluded.
The CLI is obtained from four eye-tracking indicators (fixation duration, blink rate, pupil change rate, saccade rate) through z-score standardization and arithmetic averaging. Saccade rate decreases with rising cognitive load [20], opposite in direction to the other three indicators, and is therefore multiplied by −1 before standardization. Z-score standardization is performed per participant: each participant’s values across the three scenarios are normalized by that participant’s own mean and standard deviation, removing between-participant level differences. The arithmetic mean of the four standardized values is the CLI value for each participant in each scenario.
C L I s d = 1 4 i = 1 4 Z i s d ,
where s denotes participant, d denotes scenario, i denotes the eye-tracking indicator, and Z i s d is the standardized score. Simple arithmetic aggregation is adopted as the minimum-assumption scheme in the absence of prior evidence supporting differentiated weights, and avoids introducing free parameters that would themselves require justification; this is consistent with the recommendation in composite indicator methodology that equal weighting is the default when differentiated weights lack theoretical or empirical support [31,32]. The CLI is used here to rank cognitive load across scenarios rather than to measure absolute load. Among the four indicators, fixation duration and pupil change rate show clearer scenario-level differentiation than blink rate and saccade rate; all four are retained with equal weighting to preserve cognitive load as a multi-channel construct rather than a single-signal index. Two alternative schemes were tested as controls: a pupil-weighted scheme (0.4 for pupil change rate, 0.2 for each of the other three) and a principal-component scheme using the first principal component of the four indicators. Results are compared in Section 4.1.
After the CLI sequence was confirmed for normality through Shapiro–Wilk tests and for sphericity through Mauchly’s test, repeated-measures ANOVA was used for the overall test, followed by Bonferroni-corrected paired t-tests with Cohen’s d z as the effect size. Priority tier assignment is based on the pairwise comparison with the largest effect size and the highest significance level: if it satisfies p < 0.001 and d z ≥ 0.8, the dimension with the higher CLI mean enters the high-priority tier (multiplier 1.5), and the others fall into the baseline tier (multiplier 1.0).
The value 1.5 is a heuristic calibration parameter rather than a quantity derived from a closed-form mapping. It sits between two reference points that bracket the reasonable range: an equal-weight scheme (1.0), which removes dimensional differences entirely, and a linear-mapping scheme (≈1.855), which uses the single-experiment effect size directly as the weight coefficient. The sensitivity analysis in Section 4.1 shows that multiplier values across this interval produce identical scenario rankings, with only borderline scenarios shifting relative to the 80-point indicative threshold. The choice of 1.5 should therefore be read as a representative value within a stable interval supported by the sensitivity analysis, rather than a behavior-derived weight extracted directly from the eye-tracking experiment.

3.4. LLM-Based Evaluation Agent

Visual-semantic reasoning was carried out by Google Gemini 3 Pro (model identifier gemini-3-pro-preview-11-2025, accessed in February 2026 via Google AI Studio), with sampling temperature at 0, top-p at 1.0, and maximum output tokens at 2048. The model inputs included native-resolution PNG screenshots exported from Figma together with plain-text source obtained through Figma’s “Copy as CSS”. Both inputs preserved the Chinese interface text in the prototypes; prompt templates (Supplementary File S3) and the indicator rubric (Table 2) were in English. The five expert raters were all proficient in Chinese and likewise evaluated the Chinese prototypes. The English version of the interfaces is provided solely for international readers and was not used in scoring; the original Chinese version is provided as Supplementary File S6. Temperature 0 minimizes sampling variability but does not eliminate run-to-run variation in multimodal inference, which motivated the test–retest reliability analysis in Section 4.3. Rule-based judgments were executed by Python 3.11 scripts with dependencies limited to the standard library. Prompt templates, runtime pseudocode, arbitration rules, evaluation scripts, and representative outputs are provided as Supplementary Files S1–S5.
Under these constraints, the nine indicators fall into two classes. When every threshold condition can be read directly from front-end code (HTML attributes, CSS parameters, DOM structure), the indicator is rule-based and produces a deterministic script score. When any condition requires interpreting overall visual semantics or spatial relations between elements, the indicator is semantic and is handed to the multimodal LLM [33]. Semantic judgment takes a dual-modal input: screenshots carry global spatial relations, while code parameters supply element-level values and state attributes. Code alone cannot identify icon concreteness or the visual jump path of focus; screenshots alone lack precise dimensions and state information. Only the combined input makes semantic judgment feasible. Classification results are shown in Table 2.
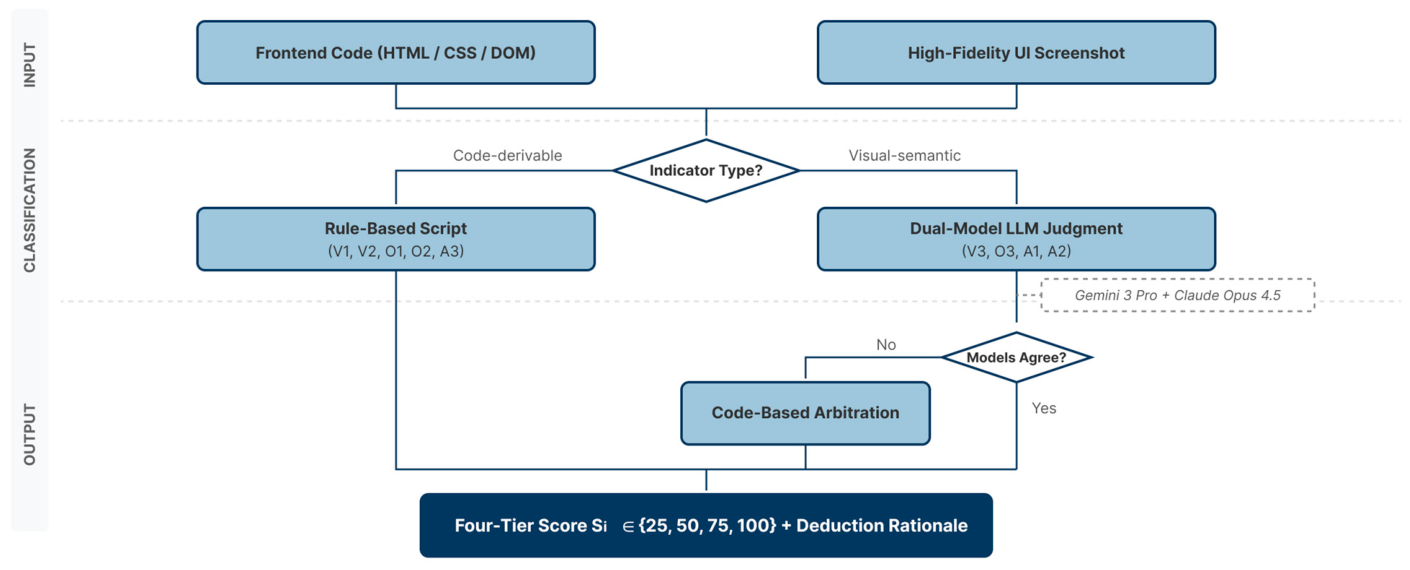
Individual scores S i are restricted to four discrete tiers {25, 50, 75, 100}, mapping onto WCAG compliance levels: 100 aligns with AAA, 75 with AA, 50 indicates A but not AA, and 25 falls below A. Discrete tiers also reduce LLM output variance, following the use of coarse-grained rubrics in LLM-as-judge research [34,35]. The scoring procedure is shown in Figure 2.
Tier thresholds are anchored to official WCAG judgment conditions. The 75 and 50 tiers align with the AA and A compliance baselines. The 100-tier threshold varies by indicator: where AAA is defined (such as V1 Contrast), the AAA threshold serves as the boundary; where only AA is defined, a stricter threshold is adopted from empirical studies on age-friendly design [36,37]. For clauses with a multi-mechanism optional structure, simultaneously satisfying multiple mechanisms is the full-score condition. A score of 25 corresponds to non-compliance. Each construction raises strictness by one level above the corresponding AA threshold, keeping full-score standards comparable across the nine indicators.
Semantic indicators can still show tier shifts across runs under a single model. To reduce subjectivity, semantic judgments are constrained by explicit rule-based criteria and supported by code-level evidence. Claude Opus 4.5 (model identifier claude-opus-4-5-20251101, accessed during the same period via the Anthropic Console) was therefore introduced as a control model alongside the main model, running five independent times per scenario across all six scenarios with identical prompts, inputs, and parameter settings. When the two models agreed, the shared tier was adopted. When judgments differed by one tier or more, an arbitration procedure consulted structured features from the interface code: pixel-level UI component contrast for V3; DOM declaration order against visual positions for O3; and status text coverage and alternative-input entry presence for A1 and A2 respectively. The output more consistent with the code evidence was selected as the final tier through a rule-based script, without manual intervention. These rules were scripted prior to evaluation (Supplementary File S5) and applied consistently across all runs. Rule-based indicators (V1, V2, O1, O2, A3) produced identical script outputs across five runs and did not enter arbitration.
Semantic indicators in this framework depend on the LLMs used. The two-model arbitration described above handles disagreements by reading features directly from code (contrast ratio, DOM declaration order, status text coverage, and the presence or absence of alternative input entries), bypassing model interpretation at the arbitration step. Indicators whose verification features cannot be read from code remain dependent on the model outputs. Mainstream multimodal models also share substantial overlap in their public training corpora; pairwise comparison cannot identify judgment tendencies shared by both models. Tier outputs therefore correspond to the chosen model combination: absolute tier values may shift when switching to a different model family, whereas scenario rankings driven by observable interface features are relatively insensitive to model choice.
The reasoning path is governed by six prompt modules (Table 3): role setting anchors the reasoning perspective to older adults’ physiological decline; evaluation scope declares input constraints and fallback rules for runtime indicators; task objective defines the execution action; evaluation criteria encode tier thresholds as conditional rules and include WCAG exemptions; evidence constraint requires verifiable evidence and prohibits uncertainty terms; and output format returns JSON with indicator-level and scenario-level fields. Rule-based scripts and LLM reasoning execute indicator-level scoring in parallel, followed by weighted aggregation.

3.5. Validation Design

The evaluation input is declarative CSS exported from Figma, together with interface screenshots, and excludes the runtime implementation of responsive layout and event handling. V2, O2, and A3 involve runtime behavior, and their judgment relies on engineering conventions common at the prototype deployment stage: V2 assumes rem units and a fluid layout supporting 200% lossless scaling; O2 assumes an up-event trigger and gesture-abort listener satisfying pointer cancelation; and A3 assumes an undo window and secondary confirmation on high-risk operations. These preconditions position the framework as a forward-looking review at the design stage, not a substitute for testing on deployed systems.
Scores on the nine indicators are aggregated through weighted summation. The weight of each indicator is set by the priority multiplier of its dimension, divided equally among the indicators in that dimension, then normalized globally:
W i = μ d / N d d { V , O , A } μ d ,
where d denotes the dimension (V, O, A), μ d the priority multiplier, and N d the number of indicators in that dimension. Substituting μ A = 1.5, μ V = μ O = 1.0, and three indicators per dimension, the baseline-tier weight is approximately 9.52% and the high-priority-tier weight is approximately 14.29%. Weights are equal within each dimension because the granularity of the eye-tracking data stops at the scenario level. The composite score is:
S t o t a l = i = 1 9 W i × S i ,
where S i ∈ {25, 50, 75, 100} and W i is the corresponding weight, with a maximum of 100.
The 80-point indicative compliance threshold derives from boundary cases in the tier mapping. When all nine indicators reach AA ( S i = 75), the composite score is 75.00; one AAA indicator in dimension A raises it to 78.57; two AAA indicators cross the 80-point line (82.14); and three AAA indicators with V and O at AA give 85.71. The threshold, therefore, corresponds to all indicators at AA or above, with at least two indicators in dimension A at AAA. Lowering the threshold to 75 would pass all scenarios except the home page and bedroom control page; raising it to 85 would also fail the single-device control pages. A value of 80 sits between these extremes, balancing discrimination with strictness.
Measurement quality is tested across three aspects: test–retest reliability, convergent validity, and evaluation efficiency. Test–retest reliability is assessed by running the evaluation five times per scenario at temperature = 0 and measuring stability with a two-way random-effects absolute-agreement single-measure ICC(2,1), following Koo and Li [38]: 0.75–0.90 is good, and above 0.90 is excellent.
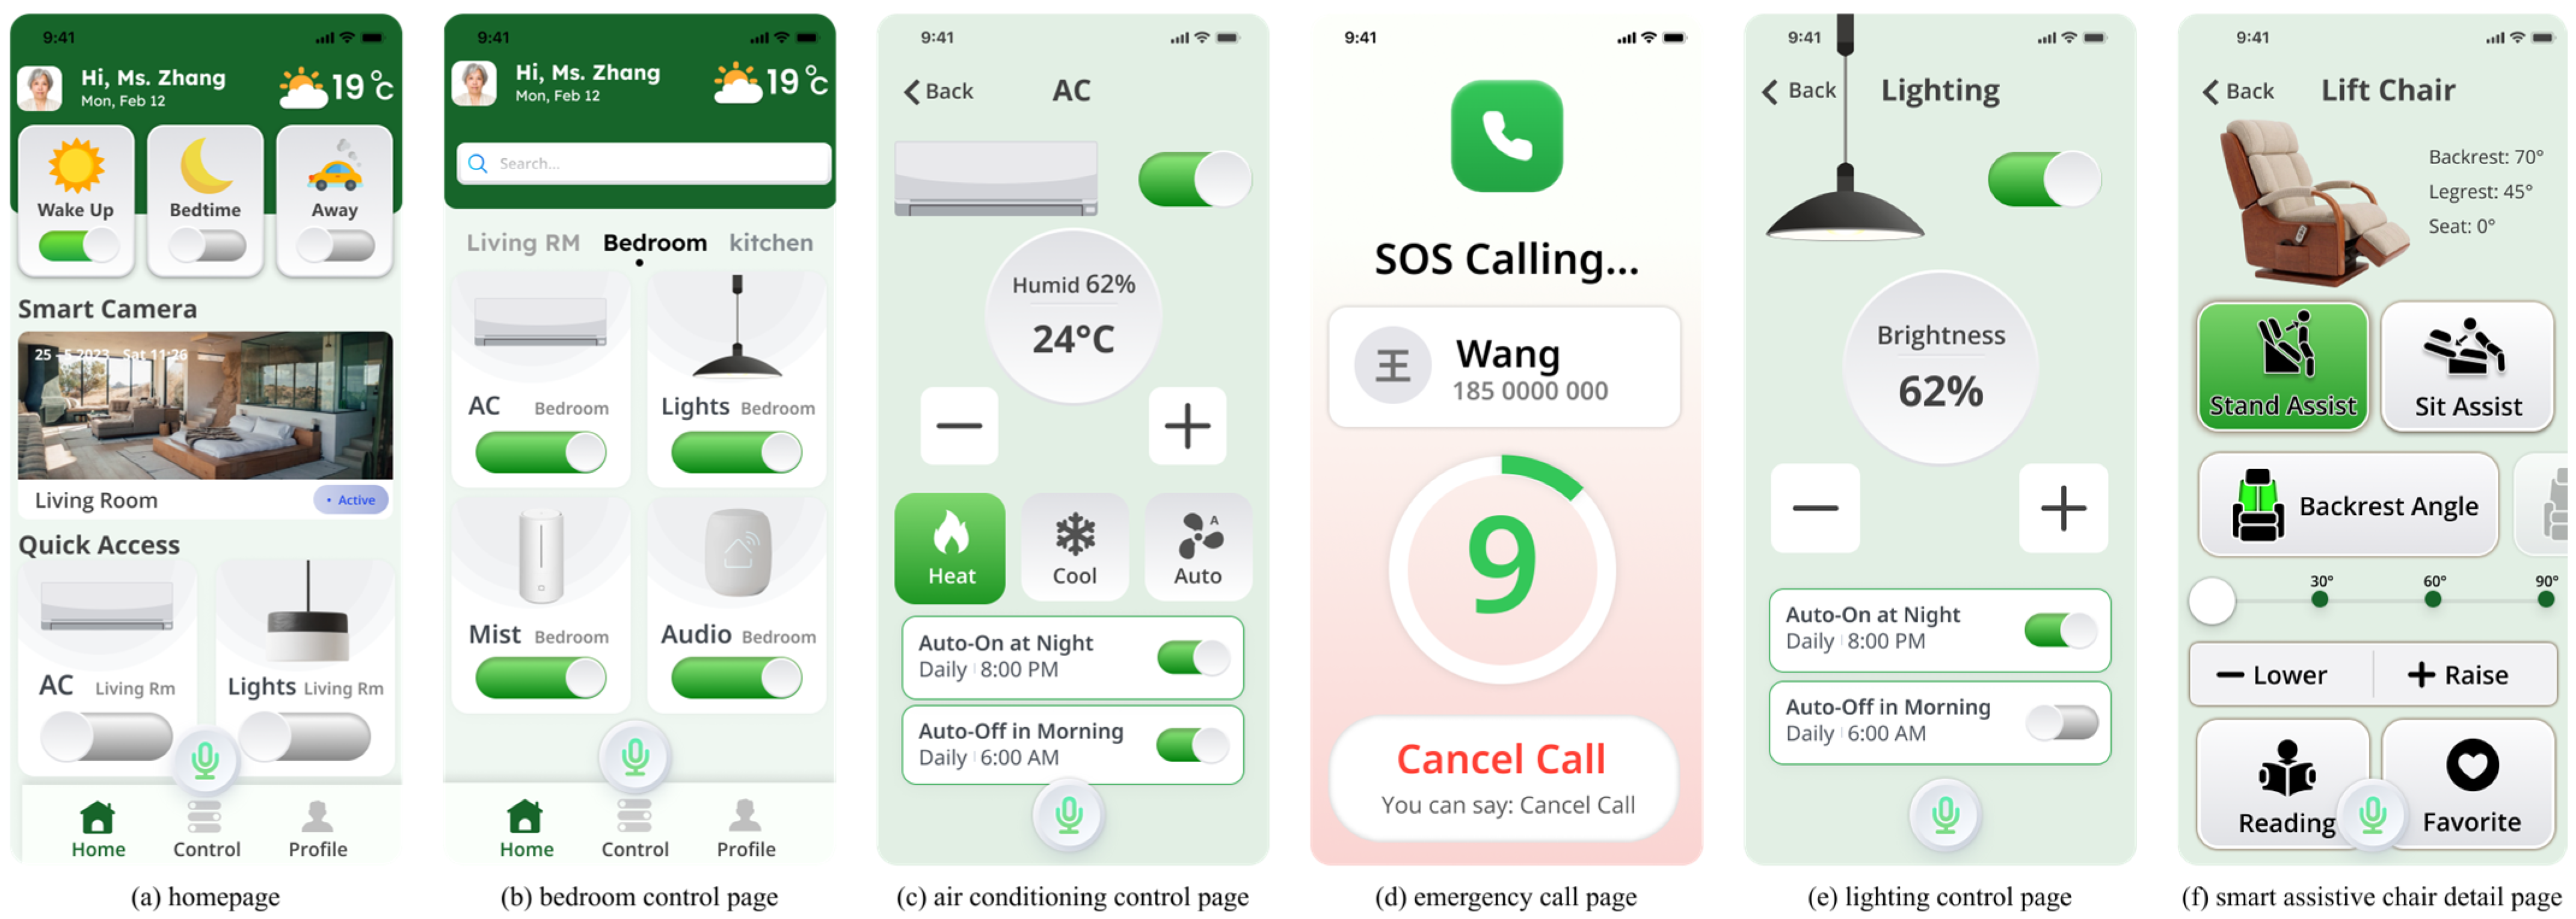
Validation material is a set of high-fidelity Figma prototypes built with reference to mainstream smart home applications, exported as CSS with screenshots. The prototypes represent different interface instances from those used in the eye-tracking experiment. Six scenarios were chosen to cover a range of evaluation challenges differing in interaction density and failure patterns. The home page and bedroom control page serve as information and multi-device aggregation entries with the highest element density, with contrast (V1, V3), target size (O1), and status messages (A1) as the primary indicators evaluated. The lighting and air conditioning control pages are dominated by sliders and toggles, concentrating on the operational dimension, with non-text contrast (V3) and active-mode labeling (A1) of slider components as further evaluation points. The smart assistive chair detail page is a specialized age-friendly device; assist-stand and assist-sit operations involve physical displacement, placing higher demands on error prevention (A3), and the page also contains health data display and posture controls. The emergency call page has few elements but the strictest demands on multi-channel reachability (A1 status messages and A2 keyboard accessibility). The remaining three indicators (V2 text scaling, O2 pointer cancelation, O3 focus order) rely on code-level structure rather than scenario-specific visible elements.
Convergent validity compares LLM scores with blind expert ratings. Five experts with backgrounds in age-friendly smart home design or human–computer interaction independently rated the six scenarios using indicators, tier criteria, and weights identical to those used by the LLM.
The panel comprised three experts from academia and two from the smart home industry, with 12–44 years of experience. All had participated in age-friendly interface or product design projects within the past three years; none was involved in this study. Experts received unified training before independent scoring. Because the experts and the framework applied the same indicators, tier criteria, and weights, this design measures the consistency of these criteria when applied across raters. Full background information (including gender, age range, and highest degree) is provided in Supplementary File S7. Inter-rater agreement among the five experts was measured with Kendall’s W; agreement between the expert mean and the LLM scores was measured with Spearman’s rank correlation. Efficiency was compared by recording the time required for each side to complete an equivalent task: LLM side time covered input preparation, model invocation, and result parsing; expert-side time included independent review and opinion aggregation. These comparisons assume prompts and input materials have been standardized in advance; the one-time cost of setting up the framework is not counted toward per-evaluation time. The six high-fidelity prototypes used for validation are shown in Figure 3.

4. Results

4.1. Cognitive Load Analysis and Weight Derivation

Accessibility tasks induced substantially higher cognitive load than visual or operational tasks, with eye-tracking evidence pointing in the same direction across the three scenarios. All 35 participants completed the experimental procedure, and no samples were excluded for insufficient sampling rate. Table 4 reports the descriptive statistics for the four eye-tracking features. Fixation duration and pupil change rate show a clear A > V > O gradient; blink rate follows the same direction with a smaller magnitude; and saccade rate shows no perceptible difference across scenarios.
The CLI composite preserves this gradient after z-score standardization. Scenario A yielded the highest CLI mean (M = 0.290, SD = 0.524), Scenario O the lowest (M = −0.260, SD = 0.519), with Scenario V in between (M = −0.030, SD = 0.428). The CLI sequence satisfied both normality (Shapiro–Wilk test, all p > 0.35) and sphericity (Mauchly’s test, W = 0.997, χ2(2) = 0.097, p = 0.953); no degrees-of-freedom correction was needed. Repeated-measures ANOVA revealed significant differences across the three scenarios, F(2, 68) = 12.65, p < 0.001, partial η2 = 0.271. Bonferroni-corrected post hoc comparisons are summarized in Table 5. The A–O contrast showed the largest difference, t(34) = −5.060, corrected p < 0.001, Cohen’s d z = 0.855, a large effect. The A–V contrast remained significant after correction ( d z = 0.501, medium effect), while the V–O contrast did not reach significance.
The A–O contrast met both p < 0.001 and d z ≥ 0.8, assigning the accessibility dimension to the high-priority tier (multiplier 1.5) and the visual and operational dimensions to the baseline tier (multiplier 1.0). Substituting these multipliers into the weight formula yields 14.29% per indicator in the accessibility dimension and 9.52% per indicator in the visual and operational dimensions.
Scenario rankings under the three CLI aggregation schemes (arithmetic mean, pupil-weighted, principal component) remained consistent: accessibility highest, visual intermediate, and operational lowest. The A–O gap measured 0.550 standardized units under the arithmetic mean, widening to 0.637 under pupil-weighted aggregation and to 1.190 under the principal component scheme. The high-priority assignment of the accessibility dimension does not depend on a particular CLI aggregation algorithm.
Sensitivity to the multiplier value was checked under three settings (μ = 1.0, μ = 1.5, μ = 1.855); composite scores for each scenario are summarized in Table 6. Scenario rankings remained identical across the three multipliers; the multiplier value affected only the position of borderline scenarios relative to the 80-point threshold: the lighting and air conditioning control pages fell below the threshold under μ = 1.5 and 1.855, while the emergency call page remained above it under all three settings, and the home and bedroom pages stayed well below it. Per-scenario diagnostic results were not affected by the multiplier choice.

4.2. Interface Evaluation Results

Table 7 lists the S i value that occurred most frequently across five independent runs (the mode), while the composite score is the arithmetic mean of the five run-level composite scores (not the mode-based conversion). When semantic indicators shift across runs, the mode-based conversion and the five-run composite mean can differ slightly: the two coincide for the homepage, whereas the bedroom control page has a five-run composite mean of 68.57 against a mode-converted value of 69.04. Overall, the results show clear differentiation across scenarios in both indicator-level performance and composite scores.
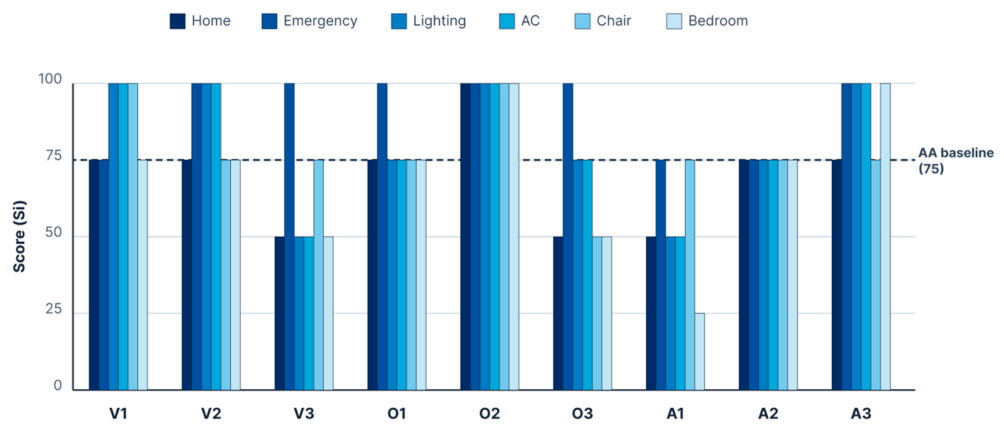
The composite scores differentiate primarily through lower performance on accessibility indicators and visual contrast (Figure 4). The emergency call page reaches or approaches the upper bound on most indicators, with the main losses on A1, A2, and V1. The single-device control pages lose points mainly on V3 and A1. The home page and the bedroom control page, with their dense element aggregation, score lower on V1, V3, O1, and A1 simultaneously.
The distribution of losses varies across scenarios, reflecting differences in interface structure and interaction density. The bedroom control page and the home page serve as multi-device and information aggregation entries, producing the highest element density and lower scores on V1, V3, and O1; the bedroom control page additionally scores 25 on A1, as its four device toggles convey on/off state only through position and color, without textual labeling. The lighting and air conditioning control pages are single-device controls, scoring lower on V3 (insufficient contrast between toggle handle and track end) and A1 (active mode not labeled as “current”). The smart assistive chair detail page scores 75 on A3, as the assist-stand and assist-sit operations lack secondary confirmation and one-click reset. The emergency call page scores lower on A1, A2, and V1: it lacks an audio feedback channel, the voice entry is marked by prompt text alone, and body text contrast falls slightly below the AAA threshold.
Each indicator score carries a deduction basis tied to specific interface parameters. Taking the bedroom control page’s 25 on A1: the four device cards use identical toggle handle positions (left: 69.6%) and a green track gradient, with state distinguished only by position and color and no textual label alongside each toggle. The recommended fix is to add state text and an aria-checked attribute adjacent to each toggle. This diagnostic path allows scores to be traced to specific elements and values within the interface.

4.3. Method Validation

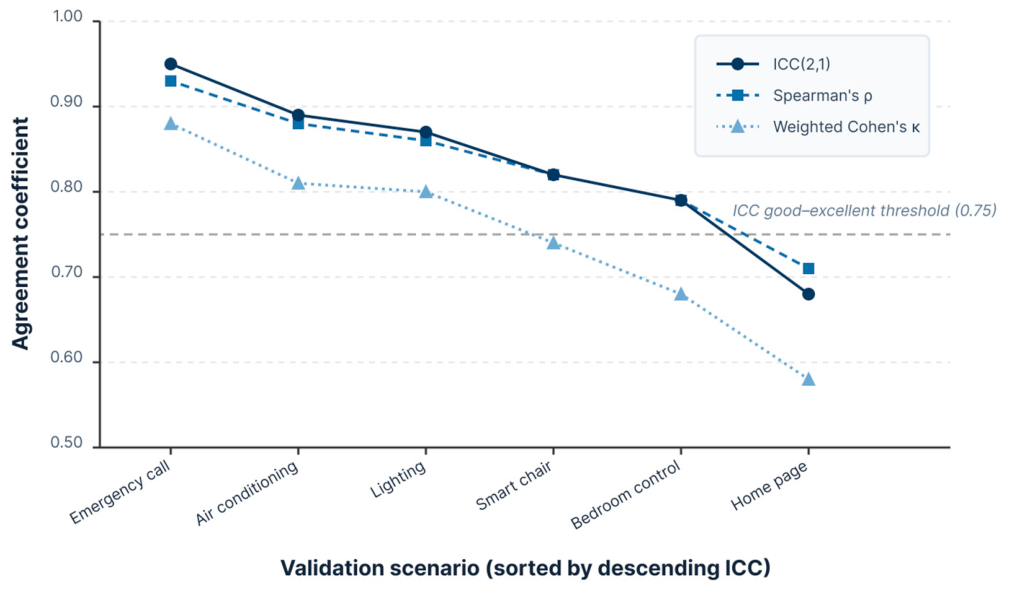
Score stability was measured through five-run ICC tests across the six scenarios. As shown in Figure 5, ICC values form a clear gradient: the emergency call page reached 0.95 (excellent), the three single-device control pages ranged from 0.82 to 0.89 (good), and the home page stood at 0.68 (moderate). Rule-based indicators (V1, V2, O1, O2, A3) produced identical S i values across runs in all scenarios, meaning that ICC differences come entirely from semantic indicators. The home page contains four semantic indicators (V3, O3, A1, A2) with tier shifts observed in V3, A1, and A2; the bedroom control page and the smart assistive chair detail page each showed one to two shifts; the emergency call page remained largely stable with only occasional boundary shifts on A1 or A2. ICC decreases as the number of semantic indicators in a scenario increases.
Introducing Claude Opus 4.5 as a control model raised the ICC values to 0.97 (emergency call), 0.89 (AC), 0.87 (lighting), 0.85 (chair), 0.82 (bedroom), and 0.79 (home page). Across 120 semantic judgments (6 scenarios × 4 semantic indicators × 5 runs), the two models agreed directly in approximately 70–80% of cases; the remainder entered arbitration, with disagreements concentrated on the home page, bedroom control page, and smart assistive chair detail page. These disagreements were primarily adjacent-tier shifts with occasional non-adjacent splits; O3 produced one non-adjacent 75-vs-25 split, while A1 and A2 each produced one adjacent-tier shift. All three were resolved automatically by the script using the arbitration rules specified in Supplementary File S5. The largest gain appeared on the home page, where ICC rose from 0.68 to 0.79. Single-model cross-run variability was the main source of low reliability on the home page, and dual-model cross-validation reduced this variability without altering the framework structure.
Five experts with backgrounds in human–computer interaction or age-friendly design independently rated the six scenarios, using the same indicators, tier criteria, and weights as the LLM. Inter-rater agreement among the experts was measured with Kendall’s W, and agreement between the expert mean and LLM scores with Spearman’s ρ (Table 8). Kendall’s W was significant across all six scenarios (range 0.66–0.92), indicating that the five experts applied the scoring criteria consistently across all six scenarios, and Spearman’s ρ followed the same gradient as ICC. Because range compression may inflate correlations on less complex scenarios, weighted Cohen’s κ was computed as a secondary check. κ rose from 0.58 on the home page to 0.88 on the emergency call page, a steeper gradient than ρ , indicating that agreement differences are not driven by statistical artifacts alone. The three coefficients (ICC, Spearman’s ρ , and weighted Cohen’s κ ) form three near-parallel descending curves, with the home page falling below the 0.75 reliability threshold on ICC. The gradient traces back to the number of semantic indicators per scenario: the more semantic indicators, the larger the judgment variance across evaluators and across runs.
Per-evaluation time for the LLM agent averaged about 1/14 of the expert panel’s (2.6 min vs. 35 min across the six scenarios). The efficiency multiple varied with interface complexity: 1.5 vs. 25 min on the emergency call page (≈16.7×), 2.8 vs. 38 min on single-device control pages (≈13.6×), and 3.2 vs. 42 min on the home page (≈13.1×). The highest ratio on the emergency call page came from its few elements and limited visual reasoning load. About 75% of the expert-side time went to independent review, while the LLM-side time was spent mostly on model invocation. Under the tested conditions, the framework applied the same scoring criteria as the experts and required about 1/14 of the time taken by the expert panel on the same scoring task.

5. Discussion

5.1. Cognitive Load Differences and Design Implications

Across all three aggregation schemes, accessibility-related tasks imposed higher cognitive load than visual and operational tasks (A > V > O), with the A–O contrast reaching Cohen’s d z = 0.855. This pattern reflects the asymmetric impact of age-related decline across perceptual channels. Visual and motor impairments raise interaction difficulty, but users retain compensatory strategies: re-fixation recovers from contrast or size limitations [24,39], and repeated input compensates for tremor on touch controls. In the accessibility scenarios tested, the absence of alternative input paths or redundant status feedback removes these strategies, and users must reallocate cognitive resources to plan a workaround or switch tasks.
The three scenarios differ on the evaluation dimensions and also in task type, urgency, and interaction context, so the higher load in accessibility-related scenarios cannot be attributed to the accessibility dimension alone; the dimensional ordering observed should be read as a scenario-level pattern rather than a general hierarchy. Design implications for smart home interfaces include redundant feedback channels on emergency and voice control entries, explicit text labels adjacent to state indicators, and reversible or confirmation-gated operations on age-specific devices [25,40].

5.2. Methodological Contribution: Behavior-Grounded Weighting

The framework differs from existing evaluation methods at two points: where dimensional weights come from, and how scoring is executed. In heuristic evaluation and the Analytic Hierarchy Process (AHP), the weights are derived from evaluator judgment. WCAG 2.2 supplies quantitative thresholds but treats the 87 success criteria uniformly, without distinguishing how different user groups experience different deficits [14]. This framework anchors indicator selection to WCAG clauses; the weights are derived from eye-tracking data collected from older adults across tasks corresponding to different dimensions.
When assessing age-related decline, expert-driven weighting may exhibit bias [41,42]. Experts typically evaluate WCAG criteria by functional severity and compliance cost, both of which correlate with visible interface elements. Criteria that manifest as absent pathways (alternative input, status programmatic perceivability) may receive less attention, because an absent pathway produces no inspectable trace on the interface. In the scenarios tested, A-dimension cognitive load rose on the home page and the emergency call page; both scenarios lacked alternative input channels and presented no visible problem element that static inspection could identify. This observation is consistent with the bias mechanism described above.
The 80-point threshold separated the six scenarios into three tiers, and this distribution traces directly to A-dimension performance: scenarios below 75 dropped to 50 or 25 on A1, while the emergency call page retained 75 on A1 and A2. Under an equal-weight scheme, two of the failing scenarios cross the 80-point line (Section 4.1). Efficiency follows from the same design: once prompts and inputs are standardized, the agent-side per-evaluation time averages about 1/14 of the expert panel’s, since roughly 75% of expert-side time is spent on independent review that deterministic scripts and LLM reasoning execute in parallel.

5.3. Reliability of LLM-Assisted Evaluation

Test–retest reliability and convergent validity followed the same gradient across the six scenarios, and the gradient tracks indicator type. Rule-based indicators produced identical outputs across five runs; all cross-run variability came from semantic indicators. Expert review reproduces this pattern: agreement on focus order and perceivability of status feedback is typically lower than on font size and contrast [43]. Semantic judgment requires integrating visual layout, contextual cues, and construct-level interpretation, and this step is harder to stabilize for both human evaluators and the agent.
Temperature 0 minimizes sampling variability but does not eliminate run-to-run variation in multimodal inference, which becomes visible when a judgment sits near a tier boundary. The ICC gradient, therefore, reflects a property of the task: scenarios with more semantic indicators accumulate more boundary-adjacent judgments. Adding Claude Opus 4.5 as a control raised the home page ICC from 0.68 to 0.79, following the inter-rater reliability principle that two judgment sources with uncorrelated error patterns produce a more stable aggregate than either alone. However, 0.79 still falls below the 0.90 ‘excellent’ threshold given by Koo and Li [38] and only slightly exceeds the 0.75 ‘good’ threshold. Rule-based indicator outputs are deterministic and show no run-to-run variation, whereas semantic LLM judgments carry inherent instability near tier boundaries; dual-model arbitration reduces but does not eliminate this residual variability. Spearman’s ρ and weighted κ followed the same gradient as ICC, indicating that the residual disagreement is a shared difficulty rather than a human-versus-LLM gap.

5.4. External Validity and Scope

The A > V > O ordering observed in this study should be read as a load-distribution pattern within the scenarios tested, rather than a generalizable hierarchy of evaluation dimensions; scenario-level features and the evaluation dimensions are intertwined and cannot be disentangled here. The framework targets static interfaces exported from Figma and does not capture runtime behavior. Responsive layout at 200% zoom, gesture abort timing, and voice recognition latency each contribute to A-dimension and O-dimension load independently of static properties. A deployed system can satisfy every static threshold and still produce elevated load, so the framework functions as a forward-looking review at the design stage rather than a substitute for deployment testing. Extending the framework to runtime evaluation would require field measurement on deployed systems of the corresponding dynamic properties, including adaptive layout, gesture abort timing, and voice recognition latency.
The 60–75 age range of the sample bounds the weight calibration; cognitive load patterns in adults aged 75 and above, a cohort differing from the young-old segment in fine motor dexterity, grip strength, and related functions [44], with possible load redistribution toward the visual and operational dimensions, warrant separate data collection. Under this redistribution, priority multipliers calibrated for the 60–75 age range may no longer reflect the load distribution in the 75+ population. The indicator weights in this study should be read as calibrated for the 60–75 age range; extension to the 75+ range warrants dedicated data collection to recalibrate the priority multipliers.
Adapting the framework to other user groups faces a methodological issue beyond sample recruitment. Pupil change rate is unreliable under visual impairment; hand tremor can dominate the signal under motor impairment; and cognitive impairment may require EEG or heart rate variability to capture processing difficulty that eye-tracking misses. Extension, therefore, requires substituting the indicator set inside the CLI and recalibrating the priority multipliers rather than re-running the same protocol, and the group-specific indicator choice must be validated before calibration proceeds. The reliability differences in the above indicators limit the framework’s direct generalization to these groups; the calibration carried out in this study cannot be reused without these prior adjustments.
In the validation design used in this study, the five experts applied the same indicators, tier criteria, and weights as the framework; the validation, therefore, measures the reproducibility of the scoring criteria across raters. End-user testing on deployed systems is needed to verify whether the composite score predicts user performance, error patterns, or subjective workload, and whether the runtime behavior involved in V2, O2, A2, and A3 introduces load not visible at the design stage. Testing whether experts systematically underweight indicators of absent pathways when they derive weights independently would, by contrast, require a dedicated comparative study.

6. Conclusions

This study presented an evaluation framework for age-friendly smart home interfaces that combines eye-tracking-derived cognitive load with automated indicator scoring. Evaluation dimensions follow the MOLD-US aging barrier classification; nine indicators are drawn from WCAG 2.2 success criteria, and dimensional priorities are calibrated with cognitive load data from 35 older adults. Scoring splits between rule-based scripts for code-readable parameters and a multimodal large language model for visual-semantic judgments.
Accessibility tasks produced substantially higher cognitive load than visual or operational tasks (Cohen’s d z = 0.855), and the ordering held across three Cognitive Load Index aggregation schemes. Validation on six high-fidelity prototype scenarios yielded Spearman correlations of 0.71–0.93 against blind expert ratings and ICC(2,1) values of 0.68–0.95, with per-scenario evaluation time averaging about 1/14 of that required by the expert panel.
The contribution is a route for calibrating dimensional weights with behavioral data from the target user group, so that WCAG-based evaluation carries group-specific priorities rather than uniform compliance weights. Composite scores remain bound to WCAG levels and come with indicator-level diagnostics, allowing designers to trace a score back to specific interface parameters.
The framework evaluates static interfaces exported from Figma and does not capture runtime behavior or empirical testing on deployed systems. The 60–75 age range of the sample bounds the weight calibration; cognitive load patterns in adults aged 75 and above warrant separate data collection. Extension to users with visual, motor, or cognitive impairment requires substituting the indicator set inside the Cognitive Load Index rather than re-running the current protocol. Within the present framework, residual run-to-run variability on semantic indicators can be reduced but not fully eliminated through dual-model arbitration (see Section 5.3).

Supplementary Materials

The following supporting information can be downloaded at: https://www.mdpi.com/article/10.3390/app16115454/s1, File S1 (Python scripts for evaluation and arbitration, including rule-based scoring of V1, V2, O1, O2, A3 and cross-model arbitration of V3, O3, A1, A2); File S2 (Representative LLM outputs for the lighting control scenario); File S3 (Complete prompt templates); File S4 (Runtime behavior pseudocode); File S5 (Code-heuristic arbitration rules); File S6 (Chinese-version interface screenshots); File S7 (Anonymized expert panel background information); File S8 (Scanned copy of the ethics approval document).

Author Contributions

Conceptualization, Z.H. and Y.C.; methodology, Z.H. and Y.C.; software, Z.H.; validation, Z.H. and Y.C.; formal analysis, Z.H.; investigation, Z.H.; data curation, Z.H.; writing—original draft preparation, Z.H.; writing—review and editing, Z.H. and Y.C.; visualization, Z.H.; supervision, Y.C. All authors have read and agreed to the published version of the manuscript.

Funding

This research received no external funding.

Institutional Review Board Statement

The study was conducted in accordance with the Declaration of Helsinki and was reviewed and approved by the IEC of the College of Furniture and Industrial Design, Nanjing Forestry University (approval No. 2026028, dated 16 January 2026). The committee determined that the experimental design poses no harm or risk to participants, recruitment was conducted on the basis of voluntary and informed consent, and participants’ rights and privacy were adequately protected.

Informed Consent Statement

Informed consent was obtained from all subjects involved in the study. All participants were informed of the study’s purpose, procedures, data handling, and their right to withdraw at any time without consequence. Eye-tracking data were anonymized immediately after collection.

Data Availability Statement

Materials supporting the LLM-assisted evaluation procedure (prompt templates, runtime behavior pseudocode, arbitration rules, evaluation scripts, and representative model outputs) are provided as Supplementary Files S1–S5. Due to the privacy of participants, the eye-tracking dataset and the expert rating sheets used for convergent validity analysis are available from the corresponding author upon reasonable request.

Conflicts of Interest

The authors declare no conflicts of interest.

References

  1. World Health Organization. Beyond the Decade of Healthy Ageing; World Health Organization: Geneva, Switzerland, 2024; ISBN 978-92-4-007353-1. [Google Scholar]
  2. Saaty, T.L. The Analytic Hierarchy Process: Planning, Priority Setting, Resource Allocation; McGraw-Hill International Book Company: New York, NY, USA, 1980; ISBN 978-0-07-054371-3. [Google Scholar]
  3. Rotaru, O.; Orhei, C.; Vasiu, R. Hybrid Usability Evaluation of an Automotive REM Tool: Human and LLM-Based Heuristic Assessment of IBM Doors Next. Appl. Sci. 2026, 16, 723. [Google Scholar] [CrossRef]
  4. Wang, Q.; Jing, L.; Zhou, L.; Tian, J.; Chen, X.; Zhang, W.; Wang, H.; Zhou, W.; Gao, Y. Usability Evaluation of mHealth Apps for Elderly Individuals: A Scoping Review. BMC Med. Inform. Decis. Mak. 2022, 22, 317. [Google Scholar] [CrossRef] [PubMed]
  5. Zhou, C.; Yuan, F.; Huang, T.; Zhang, Y.; Kaner, J. The Impact of Interface Design Element Features on Task Performance in Older Adults: Evidence from Eye-Tracking and EEG Signals. Int. J. Environ. Res. Public Health 2022, 19, 9251. [Google Scholar] [CrossRef]
  6. Zhou, C.; Dai, Y.; Huang, T.; Zhao, H.; Kaner, J. An Empirical Study on the Influence of Smart Home Interface Design on the Interaction Performance of the Elderly. Int. J. Environ. Res. Public Health 2022, 19, 9105. [Google Scholar] [CrossRef]
  7. Li, G.; Tang, T. Online Performance and Interface Design Implications among Older Adults: A Systematic Review of Eye Tracking Studies. Appl. Ergon. 2025, 128, 104538. [Google Scholar] [CrossRef]
  8. Web Content Accessibility Guidelines (WCAG) 2.2. Available online: https://www.w3.org/TR/WCAG22/ (accessed on 23 April 2026).
  9. Salman, H.M.; Wan Ahmad, W.F.; Sulaiman, S. Usability Evaluation of the Smartphone User Interface in Supporting Elderly Users From Experts’ Perspective. IEEE Access 2018, 6, 22578–22591. [Google Scholar] [CrossRef]
  10. Silva, P.A.; Holden, K.; Jordan, P. Towards a List of Heuristics to Evaluate Smartphone Apps Targeted at Older Adults: A Study with Apps That Aim at Promoting Health and Well-Being. In Proceedings of the 2015 48th Hawaii International Conference on System Sciences; IEEE: Kauai, HI, USA, 2015; pp. 3237–3246. [Google Scholar]
  11. Ashraf, A.; Zhu, X.; Liu, J.; Rauf, Q.; Firdaus, R. Usability Evaluation Framework of Smart Home Applications for Senior Citizens. In Proceedings of the 2022 12th International Conference on Software Technology and Engineering, ICSTE; IEEE Computer Soc: Los Alamitos, CA, USA, 2022; pp. 29–39. [Google Scholar]
  12. He, H.; Raja Ghazilla, R.A.; Abdul-Rashid, S.H. A Systematic Review of the Usability of Telemedicine Interface Design for Older Adults. Appl. Sci. 2025, 15, 5458. [Google Scholar] [CrossRef]
  13. Liu, W.; Li, Y.; Cai, J. Research on Aging Design of Passenger Car Center Control Interface Based on Kano/AHP/QFD Models. Electronics 2024, 13, 5004. [Google Scholar] [CrossRef]
  14. Ye, J.; Han, Y.; Li, W.; Yang, C. Visual Selective Attention Analysis for Elderly Friendly Fresh E-Commerce Product Interfaces. Appl. Sci. 2025, 15, 4470. [Google Scholar] [CrossRef]
  15. Kim, J.; Ahn, J.-H.; Kim, Y. Immersive Interaction for Inclusive Virtual Reality Navigation: Enhancing Accessibility for Socially Underprivileged Users. Electronics 2025, 14, 1046. [Google Scholar] [CrossRef]
  16. Platt, N.; Luchs, E.; Nizamani, S. Catching UX Flaws in Code: Leveraging LLMs to Identify Usability Flaws at the Development Stage. In Proceedings of the 2025 IEEE Symposium on Visual Languages and Human-Centric Computing (VL/HCC); IEEE: Raleigh, NC, USA, 2025; pp. 152–158. [Google Scholar]
  17. Duan, P.; Cheng, C.-Y.; Li, G.; Hartmann, B.; Li, Y. UICrit: Enhancing Automated Design Evaluation with a UI Critique Dataset. In Proceedings of the 37th Annual ACM Symposium on User Interface Software and Technology; Association for Computing Machinery: New York, NY, USA, 2024; pp. 1–17. [Google Scholar]
  18. Hsueh, N.-L.; Lin, H.-J.; Lai, L.-C. Applying Large Language Model to User Experience Testing. Electronics 2024, 13, 4633. [Google Scholar] [CrossRef]
  19. Li, D.; Jiang, B.; Huang, L.; Beigi, A.; Zhao, C.; Tan, Z.; Bhattacharjee, A.; Jiang, Y.; Chen, C.; Wu, T.; et al. From Generation to Judgment: Opportunities and Challenges of LLM-as-a-Judge. In Proceedings of the 2025 Conference on Empirical Methods in Natural Language Processing; Christodoulopoulos, C., Chakraborty, T., Rose, C., Peng, V., Eds.; Association for Computational Linguistics: Suzhou, China, 2025; pp. 2757–2791. [Google Scholar]
  20. Skaramagkas, V.; Giannakakis, G.; Ktistakis, E.; Manousos, D.; Karatzanis, I.; Tachos, N.; Tripoliti, E.; Marias, K.; Fotiadis, D.I.; Tsiknakis, M. Review of Eye Tracking Metrics Involved in Emotional and Cognitive Processes. IEEE Rev. Biomed. Eng. 2023, 16, 260–277. [Google Scholar] [CrossRef] [PubMed]
  21. Lu, Y.; Kim, M. Eye-Tracking Response Modeling and Design Optimization Method for Smart Home Interface Based on Transformer Attention Mechanism. Electronics 2026, 15, 1562. [Google Scholar] [CrossRef]
  22. Wildenbos, G.A.; Peute, L.; Jaspers, M. Aging Barriers Influencing Mobile Health Usability for Older Adults: A Literature Based Framework (MOLD-US). Int. J. Med. Inform. 2018, 114, 66–75. [Google Scholar] [CrossRef]
  23. Owsley, C. Aging and Vision. Vis. Res. 2011, 51, 1610–1622. [Google Scholar] [CrossRef] [PubMed]
  24. Wacharamanotham, C.; Hurtmanns, J.; Mertens, A.; Kronenbuerger, M.; Schlick, C.; Borchers, J. Evaluating Swabbing: A Touchscreen Input Method for Elderly Users with Tremor. In Proceedings of the SIGCHI Conference on Human Factors in Computing Systems; Association for Computing Machinery: New York, NY, USA, 2011; pp. 623–626. [Google Scholar]
  25. Jacko, J.A.; Scott, I.U.; Sainfort, F.; Barnard, L.; Edwards, P.J.; Emery, V.K.; Kongnakorn, T.; Moloney, K.P.; Zorich, B.S. Older Adults and Visual Impairment: What Do Exposure Times and Accuracy Tell Us about Performance Gains Associated with Multimodal Feedback? In Proceedings of the SIGCHI Conference on Human Factors in Computing Systems; Association for Computing Machinery: New York, NY, USA, 2003; pp. 33–40. [Google Scholar]
  26. Khan, R.; Vernooij, J.; Salvatori, D.; Hierck, B.P. Assessing Cognitive Load Using EEG and Eye-Tracking in 3-D Learning Environments: A Systematic Review. Multimodal Technol. Interact. 2025, 9, 99. [Google Scholar] [CrossRef]
  27. Neugarten, B.L. Age Groups in American Society and the Rise of the Young-Old. Ann. Am. Acad. Political Soc. Sci. 1974, 415, 187–198. [Google Scholar] [CrossRef]
  28. National Working Commission on Aging, Ministry of Civil Affairs of China. 2024 Annual Report on the Development of National Aging Affairs; National Working Commission on Aging, Ministry of Civil Affairs of China: Beijing, China, 2025.
  29. Creavin, S.; Wisniewski, S.; Noel-Storr, A.; Trevelyan, C.; Hampton, T.; Rayment, D.; Thom, V.; Nash, K.; Elhamoui, H.; Milligan, R.; et al. Mini-Mental State Examination (MMSE) for the Detection of Dementia in Clinically Unevaluated People Aged 65 and over in Community and Primary Care Populations. Cochrane Database Syst. Rev. 2016, 1, CD011145. [Google Scholar] [CrossRef]
  30. Cohen, J. Statistical Power Analysis for the Behavioral Sciences, 2nd ed.; Routledge: New York, NY, USA, 2013; ISBN 978-0-203-77158-7. [Google Scholar]
  31. Nardo, M.; Saisana, M.; Saltelli, A.; Tarantola, S.; Hoffmann, A.; Giovannini, E. Handbook on Constructing Composite Indicators: Methodology and User Guide; OECD Statistics Working Papers; OECD Publishing: Paris, French, 2005. [Google Scholar] [CrossRef]
  32. Greco, S.; Ishizaka, A.; Tasiou, M.; Torrisi, G. On the Methodological Framework of Composite Indices: A Review of the Issues of Weighting, Aggregation, and Robustness. Soc. Indic. Res. 2019, 141, 61–94. [Google Scholar] [CrossRef]
  33. You, K.; Zhang, H.; Schoop, E.; Weers, F.; Swearngin, A.; Nichols, J.; Yang, Y.; Gan, Z. Ferret-UI: Grounded Mobile UI Understanding with Multimodal LLMs; Springer Nature: Cham, Switzerland, 2024. [Google Scholar]
  34. Wang, P.; Li, L.; Chen, L.; Cai, Z.; Zhu, D.; Lin, B.; Cao, Y.; Liu, Q.; Liu, T.; Sui, Z. Large Language Models Are Not Fair Evaluators. In Proceedings of the 62nd Annual Meeting of the Association for Computational Linguistics (Volume 1: Long Papers); Association for Computational Linguistics: Stroudsburg, PA, USA, 2024; pp. 9440–9450. [Google Scholar]
  35. Chen, D.; Chen, R.; Zhang, S.; Wang, Y.; Liu, Y.; Zhou, H.; Zhang, Q.; Wan, Y.; Zhou, P.; Sun, L. MLLM-as-a-Judge: Assessing Multimodal LLM-as-a-Judge with Vision-Language Benchmark. In Proceedings of the 41st International Conference on Machine Learning; PMLR: Vienna, Austria, 2024; pp. 6562–6595. [Google Scholar]
  36. Bernard, M.; Liao, C.H.; Mills, M. The Effects of Font Type and Size on the Legibility and Reading Time of Online Text by Older Adults. In Proceedings of the CHI ’01 Extended Abstracts on Human Factors in Computing Systems; Association for Computing Machinery: New York, NY, USA, 2001; pp. 175–176. [Google Scholar]
  37. Hou, G.; Anicetus, U.; He, J. How to Design Font Size for Older Adults: A Systematic Literature Review with a Mobile Device. Front. Psychol. 2022, 13, 931646. [Google Scholar] [CrossRef]
  38. Koo, T.K.; Li, M.Y. A Guideline of Selecting and Reporting Intraclass Correlation Coefficients for Reliability Research. J. Chiropr. Med. 2016, 15, 155–163. [Google Scholar] [CrossRef]
  39. Wynn, J.S.; Olsen, R.K.; Binns, M.A.; Buchsbaum, B.R.; Ryan, J.D. Fixation Reinstatement Supports Visuospatial Memory in Older Adults. J. Exp. Psychol. Hum. Percept. Perform. 2018, 44, 1119–1127. [Google Scholar] [CrossRef] [PubMed]
  40. Li, H.; Hua, C.; Pan, W.; Chen, H.; Bu, L. Enhancing Attention Allocation in Smart Home Interactions: A Multimodal Approach for Hearing-Impaired Elders with Mild Cognitive Impairmen. Int. J. Hum.-Comput. Interact. 2025, 1–26. [Google Scholar] [CrossRef]
  41. Power, C.; Freire, A.; Petrie, H.; Swallow, D. Guidelines Are Only Half of the Story: Accessibility Problems Encountered by Blind Users on the Web. In Conference on Human Factors in Computing Systems—Proceedings; Association for Computing Machinery: New York, NY, USA, 2012. [Google Scholar] [CrossRef]
  42. Mankoff, J.; Fait, H.; Tran, T. Is Your Web Page Accessible? In Proceedings of the SIGCHI Conference on Human Factors in Computing Systems; ACM Conferences: New York, NY, USA, 2005; pp. 41–50. ISBN 978-1-58113-998-3. [Google Scholar]
  43. Petrie, H.; Kheir, O. The Relationship between Accessibility and Usability of Websites. In Proceedings of the SIGCHI Conference on Human Factors in Computing Systems; Association for Computing Machinery: New York, NY, USA, 2007; pp. 397–406. [Google Scholar]
  44. Shiffman, L.M. Effects of Aging on Adult Hand Function. Am. J. Occup. Ther. 1992, 46, 785–792. [Google Scholar] [CrossRef] [PubMed]
Figure 1. Overview of the proposed evaluation method. The framework integrates evidence from an elderly user eye-tracking experiment and the WCAG 2.2/MOLD-US classification (left), proceeds through cognitive load modeling, indicator-level scoring, and weighted aggregation (middle), and outputs a comprehensive aging-appropriate score (right).
Applsci 16 05454 g001
Figure 2. Indicator-level scoring procedure. Code-derivable indicators (V1, V2, O1, O2, A3) are scored by rule-based scripts; visual-semantic indicators (V3, O3, A1, A2) are scored by dual-model LLM judgment with code-based arbitration when the two models disagree. Horizontal dashed lines separate the three stages (input, classification, and output); the dashed box on the right indicates the two-model combination used for LLM judgment.
Applsci 16 05454 g002
Figure 3. Interface prototypes for the six validation scenarios: (a) home page; (b) bedroom control page; (c) air conditioning control page; (d) emergency call page; (e) lighting control page; (f) smart assistive chair detail page. The interface elements evaluated by the nine indicators across these scenarios include text contrast, target size, toggle and mode labeling, audio and voice feedback, and secondary confirmation.
Applsci 16 05454 g003
Figure 4. Comparison of the nine indicator scores ( S i ) across the six scenarios.
Applsci 16 05454 g004
Figure 5. Reliability and convergent-validity gradient across the six validation scenarios, sorted by descending ICC. The dashed line marks the conventional ICC threshold of 0.75.
Applsci 16 05454 g005
Table 1. List of age-friendly interface evaluation indicators.
IDDimensionWCAG CriterionLevelJudgment TypeCore Judgment Condition
V1VisualSC 1.4.3 ContrastAARule-basedForeground-to-background luminance ratio ≥ 4.5:1 (regular text) or ≥3:1 (large text)
V2VisualSC 1.4.4 Text scalingAARule-basedSupports 200% lossless scaling of base font size
V3VisualSC 1.4.11 Non-text contrastAASemanticUI components and icons with visual distinguishability ≥ 3:1
O1OperationalSC 2.5.8 Target sizeAARule-basedInteractive elements not smaller than 24 × 24 CSS pixels
O2OperationalSC 2.5.2 Pointer cancelationARule-basedProvides one of four mechanisms: up-event trigger, abort, undo, or essential exception
O3OperationalSC 2.4.3 Focus orderASemanticFocus order maintains consistency with visual layout in meaning and operability
A1AccessibilitySC 4.1.3 Status messagesAASemanticStatus changes are programmatically perceivable by assistive technology
A2AccessibilitySC 2.1.1 Keyboard accessibleASemanticAll functions are reachable through non-pointer methods
A3AccessibilitySC 3.3.4 Error preventionAARule-basedHigh-risk operations provide one of: reversible, checkable, or confirmation mechanism
Table 2. Four-tier judgment criteria for the nine indicators.
IndicatorType S i = 100 S i = 75 S i = 50 S i = 25
V1 ContrastRuleRegular text ≥ 7:1, large text ≥ 4.5:1Regular text ≥ 4.5:1, large text ≥ 3:1Regular text 3:1 to 4.5:1Regular text < 3:1
V2 Text scalingRuleSupports 200% lossless scaling and base font size ≥ 14 ptSupports 200% lossless scalingSupports 200% scaling but with truncation or functional lossDoes not support 200% scaling
V3 Non-text contrastSemanticUI component contrast ≥ 4.5:1UI component contrast ≥ 3:1Some UI components reach 3:1UI component contrast < 3:1
O1 Target sizeRuleAll elements ≥ 48 × 48 CSS pixelsAll elements ≥ 24 × 24 CSS pixelsSome elements between 16 × 16 and 24 × 24 CSS pixelsElements < 24 × 24 CSS pixels present
O2 Pointer cancelationRuleProvides both up-event trigger and undo mechanism, plus at least two other mechanismsSatisfies one of the four SC 2.5.2 mechanismsDoes not satisfy SC 2.5.2 but provides error feedbackDoes not satisfy SC 2.5.2 and no error feedback
O3 Focus orderSemanticFocus order fully consistent with visual layout and skips decorative elementsFocus order consistent with visual layout in core interaction areasSome areas inconsistent but do not affect core tasksFocus order disorganized or skips key elements
A1 Status messagesSemanticStatus conveyed through three channels: visual, screen reader, and audioStatus programmatically perceivable by screen reader plus visual feedbackVisual feedback only, with textual descriptionVisual feedback only, without textual description
A2 Keyboard accessibleSemanticAll functions support two non-pointer paths: voice and assistive technologyAll functions support at least one non-pointer pathSome functions support non-pointer pathsPointer input only
A3 Error preventionRuleSatisfies all three mechanisms: reversible, checkable, and confirmationSatisfies one of the three mechanismsVisual warning onlyNo safeguard
Table 3. Design of the six prompt modules.
ModuleFunctional RoleKey Design Features
Role settingAnchor the reasoning perspectiveUses physiological decline features of older adults (reduced contrast sensitivity, tremor, reduced working memory) as the basis for judgment; excludes general esthetic preferences and younger-user interaction habits
Evaluation scopeDeclare input constraintsStates the static limitation of Figma-exported CSS; for indicators involving runtime behavior (V2, O2, A3), applies fallback rules when judgment evidence is insufficient
Task objectiveDefine the execution actionProduces four-tier scores for each of the nine indicators based on combined screenshot (global visual) and code (element-level parameter) input
Evaluation criteriaConstrain output latitudeEncodes tier thresholds as “if…then…” rules; includes WCAG exemptions (large text, decorative text, placeholders); specifies lowest-tier rule for multi-element conflicts and code–screenshot discrepancy
Evidence constraintExclude speculative outputRequires the evidence field to contain verifiable evidence (code snippets, numerical calculations, or specific element counts); prohibits uncertainty terms such as “probably”, “possibly”, or “presumably”
Output formatStandardize the data interfaceReturns S i , weighted_score, evidence, and suggestion for each indicator in JSON, plus scenario-level total_score, compliance_level, and summary
Table 4. Descriptive statistics of the four eye-tracking indicators across the three scenarios.
IndicatorScenario A, M (SD)Scenario V, M (SD)Scenario O, M (SD)
Fixation duration (ms)409.26 (85.04)364.77 (71.64)344.34 (88.62)
Blink rate (per s)0.40 (0.15)0.38 (0.15)0.35 (0.19)
Saccade rate (per s)2.20 (0.52)2.26 (0.51)2.26 (0.50)
Pupil change rate (%)5.23 (1.23)4.65 (1.21)4.01 (0.96)
Table 5. Bonferroni-corrected pairwise comparisons of CLI across the three scenarios.
Contrastt (34)p (Raw)p (Bonferroni)Cohen’s  d z Significance
A vs. O−5.060<0.001<0.0010.855***
A vs. V−2.9610.00560.01670.501*
V vs. O2.0430.04880.14650.345ns
Note: *** p < 0.001; * p < 0.05; ns = not significant.
Table 6. Sensitivity of composite scores to the priority multiplier.
Scenarioμ = 1.0μ = 1.5μ = 1.855
Emergency call page91.6790.4889.82
Lighting control page80.5679.7679.32
Air conditioning control page80.5679.7679.32
Smart assistive chair detail page77.7877.3877.16
Bedroom control page69.4469.0568.83
Home page69.4469.0568.83
Table 7. Indicator scores and composite scores for the six scenarios.
Indicator W i HomeEmergencyLightingACChairBedroom
V1 Contrast (rule)9.52%757510010010075
V2 Text scaling (rule)9.52%751001001007575
V3 Non-text contrast (semantic)9.52%5010050507550
O1 Target size (rule)9.52%7510075757575
O2 Pointer cancelation (rule)9.52%100100100100100100
O3 Focus order (semantic)9.52%5010075755050
A1 Status messages (semantic)14.29%507550507525
A2 Keyboard accessible (semantic)14.29%757575757575
A3 Error prevention (rule)14.29%7510010010075100
Composite score (5-run mean) 69.0490.4779.7579.7577.3868.57
Compliance level <75≥9075–8075–8075–80<75
Table 8. Inter-rater reliability and convergent validity across the six scenarios.
ScenarioKendall’s W
(Experts)
SignificanceExpert Mean vs. LLM
(Spearman’s  ρ )
Weighted Cohen’s  κ Significance
Emergency call page0.92 p < 0.0010.930.88 p < 0.001
Air conditioning control page0.85 p < 0.0010.880.81 p < 0.001
Lighting control page0.84 p < 0.0010.860.80 p < 0.001
Smart assistive chair detail page0.78 p < 0.0010.820.74 p < 0.001
Bedroom control page0.74 p < 0.010.790.68 p < 0.01
Home page0.66 p < 0.010.710.58 p < 0.01
Disclaimer/Publisher’s Note: The statements, opinions and data contained in all publications are solely those of the individual author(s) and contributor(s) and not of MDPI and/or the editor(s). MDPI and/or the editor(s) disclaim responsibility for any injury to people or property resulting from any ideas, methods, instructions or products referred to in the content.