Article

A Lightweight Multi-Scale Feature Fusion Signal Detection Model for Metro Computer Interlocking Systems


1
The College of Information, Mechanical and Electrical Engineering, Shanghai Normal University, Shanghai 201418, China
2
Nanjing Kangni Mechanical & Electrical Co., Ltd., Nanjing 210008, China
3
Nanjing Ruijie Intelligent Transportation Technology Research Institute Co., Ltd., Nanjing 210004, China
4
School of Automation, Nanjing Institute of Technology, Nanjing 211167, China
*
Authors to whom correspondence should be addressed.
Appl. Sci. 2026, 16(11), 5452; https://doi.org/10.3390/app16115452
Submission received: 23 April 2026 / Revised: 26 May 2026 / Accepted: 27 May 2026 / Published: 30 May 2026
(This article belongs to the Section Applied Industrial Technologies)

Featured Application

The proposed framework enables real-time signal state detection on resource-constrained embedded dispatching terminals of metro computer interlocking systems, improving both the efficiency and safety of rail transit operations.

Abstract

Metro Computer Interlocking Systems are crucial for ensuring the safe and efficient operation of rail transit. However, existing vision-based signal detection methods face challenges including small target sizes, high target density, low image resolution, and the need for deployment on resource-constrained devices. To address these issues, this paper proposes a two-stage lightweight signal detection framework for Metro Computer Interlocking Systems. First, based on YOLOv8, a small object detection layer together with feature fusion modules is introduced to form the YOLOv8-SFF architecture. A Scale Sequence Feature Fusion (SSFF) module is added to adjust the resolution of feature maps and retain critical fine-grained information, enhancing the detection of small visual signals. A Triple Feature Encoding (TFE) module is designed to enhance the recognition of dense small signals while replacing some traditional feature concatenation and upsampling operations, yielding a more compact network. Second, to enable practical deployment, a joint optimization strategy combining Layer-Adaptive Magnitude-based Pruning (LAMP) and Channel-wise Knowledge Distillation (CWD) is applied, in which the unpruned YOLOv8-SFF serves as the teacher and the pruned model serves as the student. In addition, an automatic annotation subsystem based on digital image processing is developed, leveraging color and morphological features to generate high-quality labels. Experimental results show that YOLOv8-SFF achieves a mean average precision (mAP@50) of 98.7%, improving mAP@50 by 11.3 percentage points and recall by 22.1 percentage points over the original YOLOv8. After joint pruning and distillation, the final compact model retains 98.0% mAP while reducing the parameter count by 86.2% and the model size to 1.1 MB, making it well suited for real-time deployment in resource-constrained metro dispatching systems.

1. Introduction

1.1. Railway Interlocking System

The Metro Computer Interlocking System [1] is a computer-based railway signal control system, mainly used to control the operation of signals, turnouts and other railway equipment. Through logical decision-making, the system effectively coordinates various types of equipment to ensure safe train scheduling and operation, preventing safety hazards caused by equipment malfunctions. As a crucial component of railway operation control, the Metro Computer Interlocking System plays a vital role in ensuring the safety of train and shunting operations within stations.
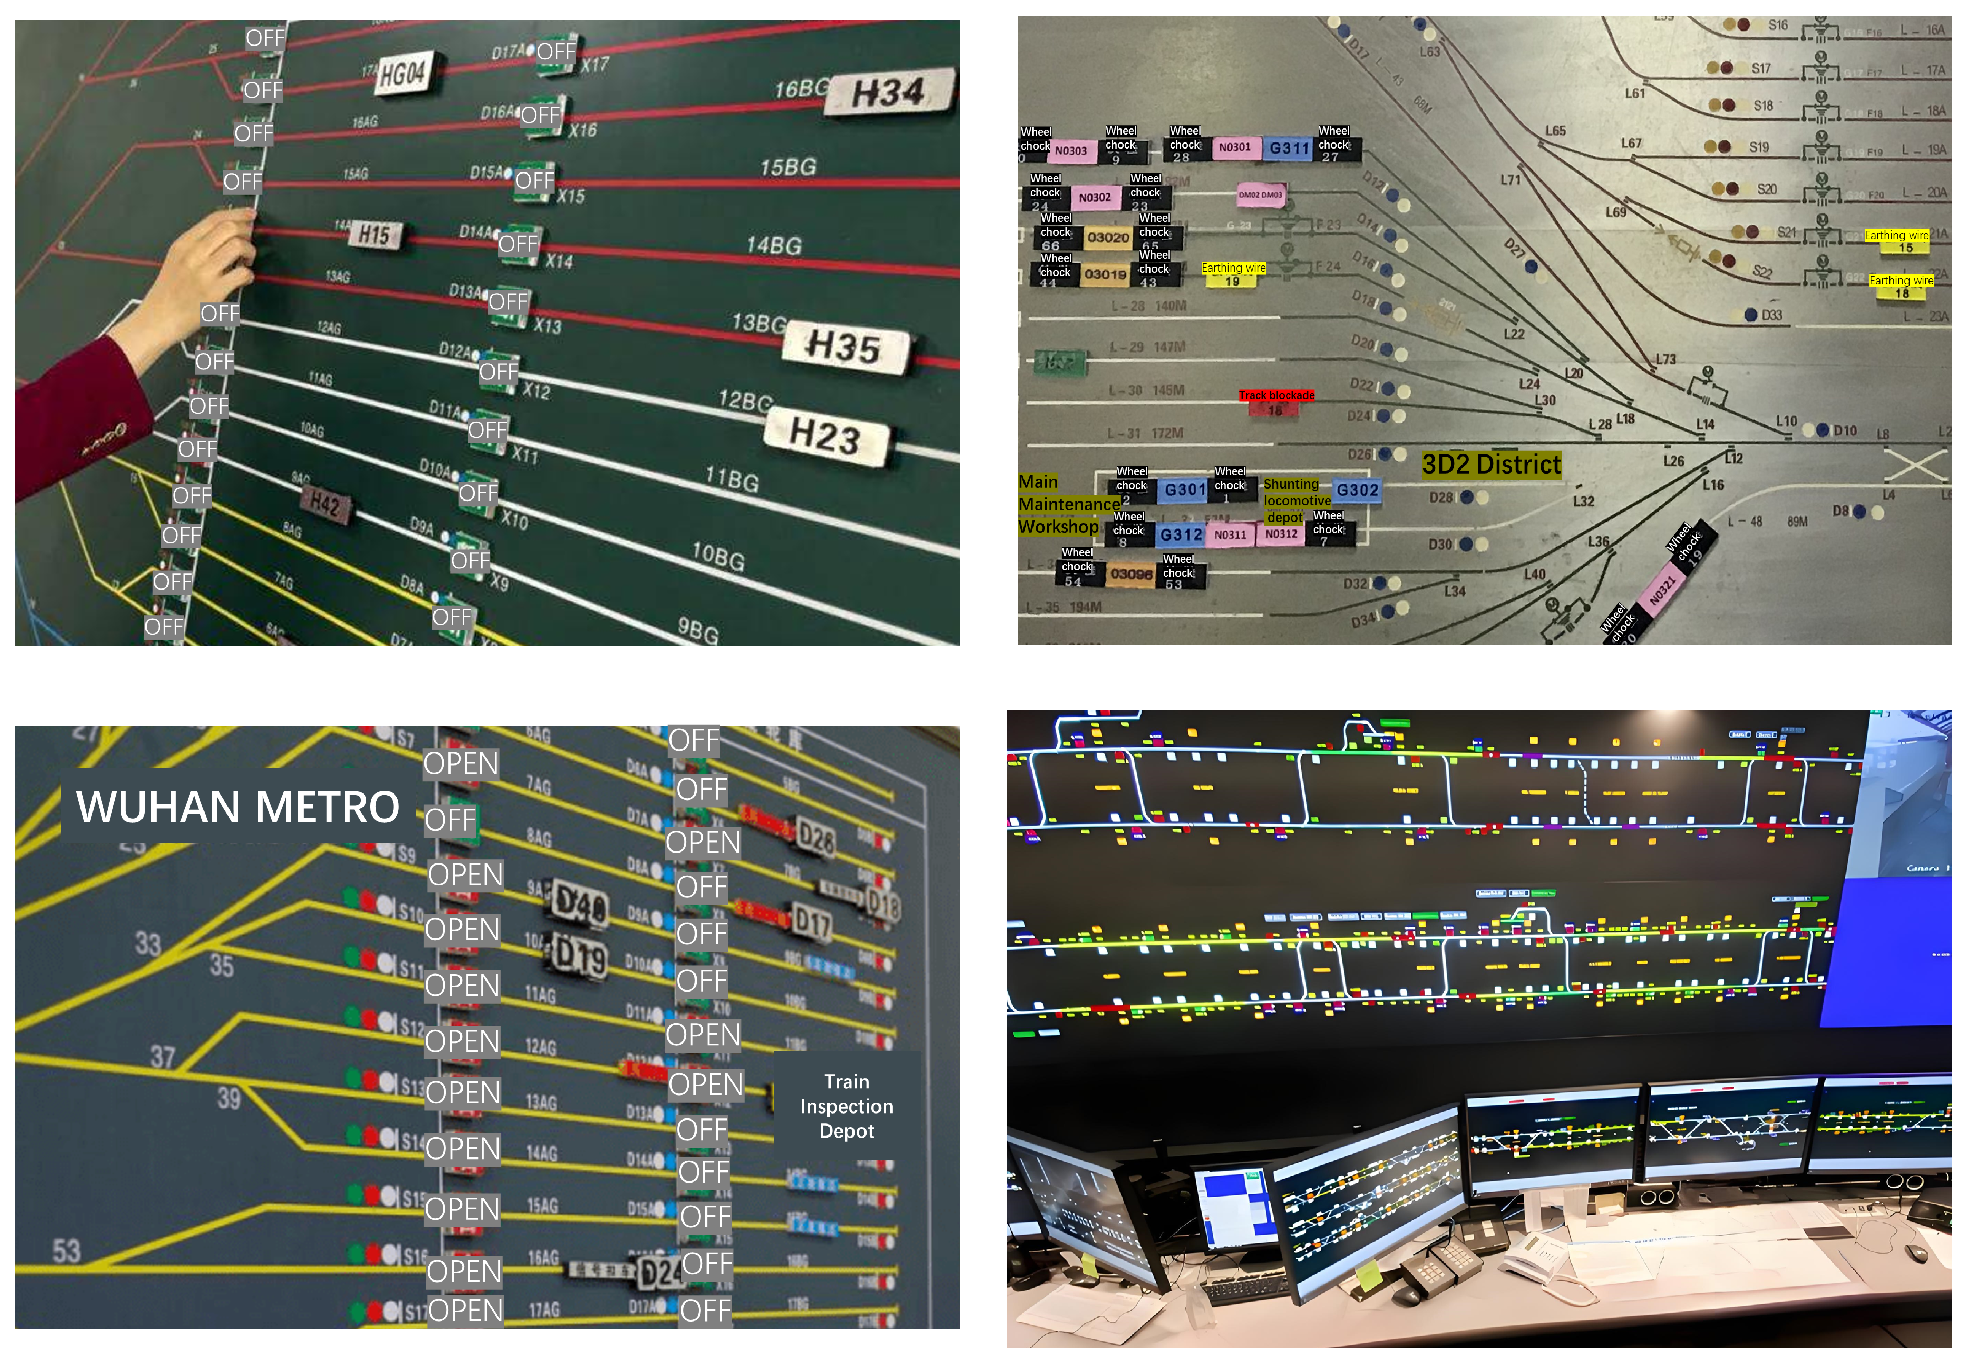
A manual operation physical metro computer interlocking occupancy panel is shown in Figure 1. Currently, computer interlock testing is still dominated by manual inspection, and dispatchers need to analyze and judge the status of signals on the occupancy board to make decisions about the planning and regulation of the metro section. With the increasing complexity of railway station structures, the interlocking testing workload has increased and manual operation not only consumes human resources, but also carries significant risks of subjective judgment and human error.

1.2. AI-Based Detection Approaches

Recent advances in artificial intelligence offer a route to automating this inspection workload. The use of digital image processing and deep learning algorithms [2] to directly detect and analyze the state of computer interlocking signals can significantly improve signal processing efficiency and reduce labor cost. In addition, fault diagnosis functions based on real-time signal status analysis help to discover potential faults in a timely manner [3], further improving the safety of rail transportation. The detection and analysis of signal status also generate a large amount of historical data to provide support to management and decision-makers, and thus provide a scientific basis for the planning and management of the railway system.
Object detection techniques for traffic scenes can be grouped into two broad families: classical pipelines built on hand-crafted features, and modern detectors built on deep neural networks. The classical family locates targets by capturing low-level cues such as object contours, edges, and colour signatures; traffic-sign recognition, for instance, has been tackled by colour-matching in the HSV or HSI colour spaces [4] and by combining Histogram of Oriented Gradients (HOG) descriptors with Scale-Invariant Feature Transform (SIFT) keypoints [5]. Such pipelines remain serviceable in visually clean settings, but their reliance on hand-tuned features limits their ability to localise small signs embedded in cluttered backgrounds.
Deep-learning detectors have since taken over the field; learned end-to-end representations are far more expressive than any hand-crafted descriptor and now dominate most public benchmarks. The most-cited architectures span the Region-Based Convolutional Neural Network (R-CNN) family [6], the YOLO series of one-stage detectors [7], and the Single Shot MultiBox Detector (SSD) [8], each of which has reported strong detection results across a wide range of tasks [9]. The YOLO series has undergone several iterations, each improving on its predecessor. YOLOv3 [10] enhances small object detection through multi-scale prediction. YOLOv5 [11] further optimizes the CSPNet structure introduced in YOLOv4 [12], reducing computational complexity and parameter count while maintaining high detection accuracy. YOLOv8 [13] introduces more efficient detection heads and updated loss functions, resulting in improved speed and precision in diverse application scenarios.
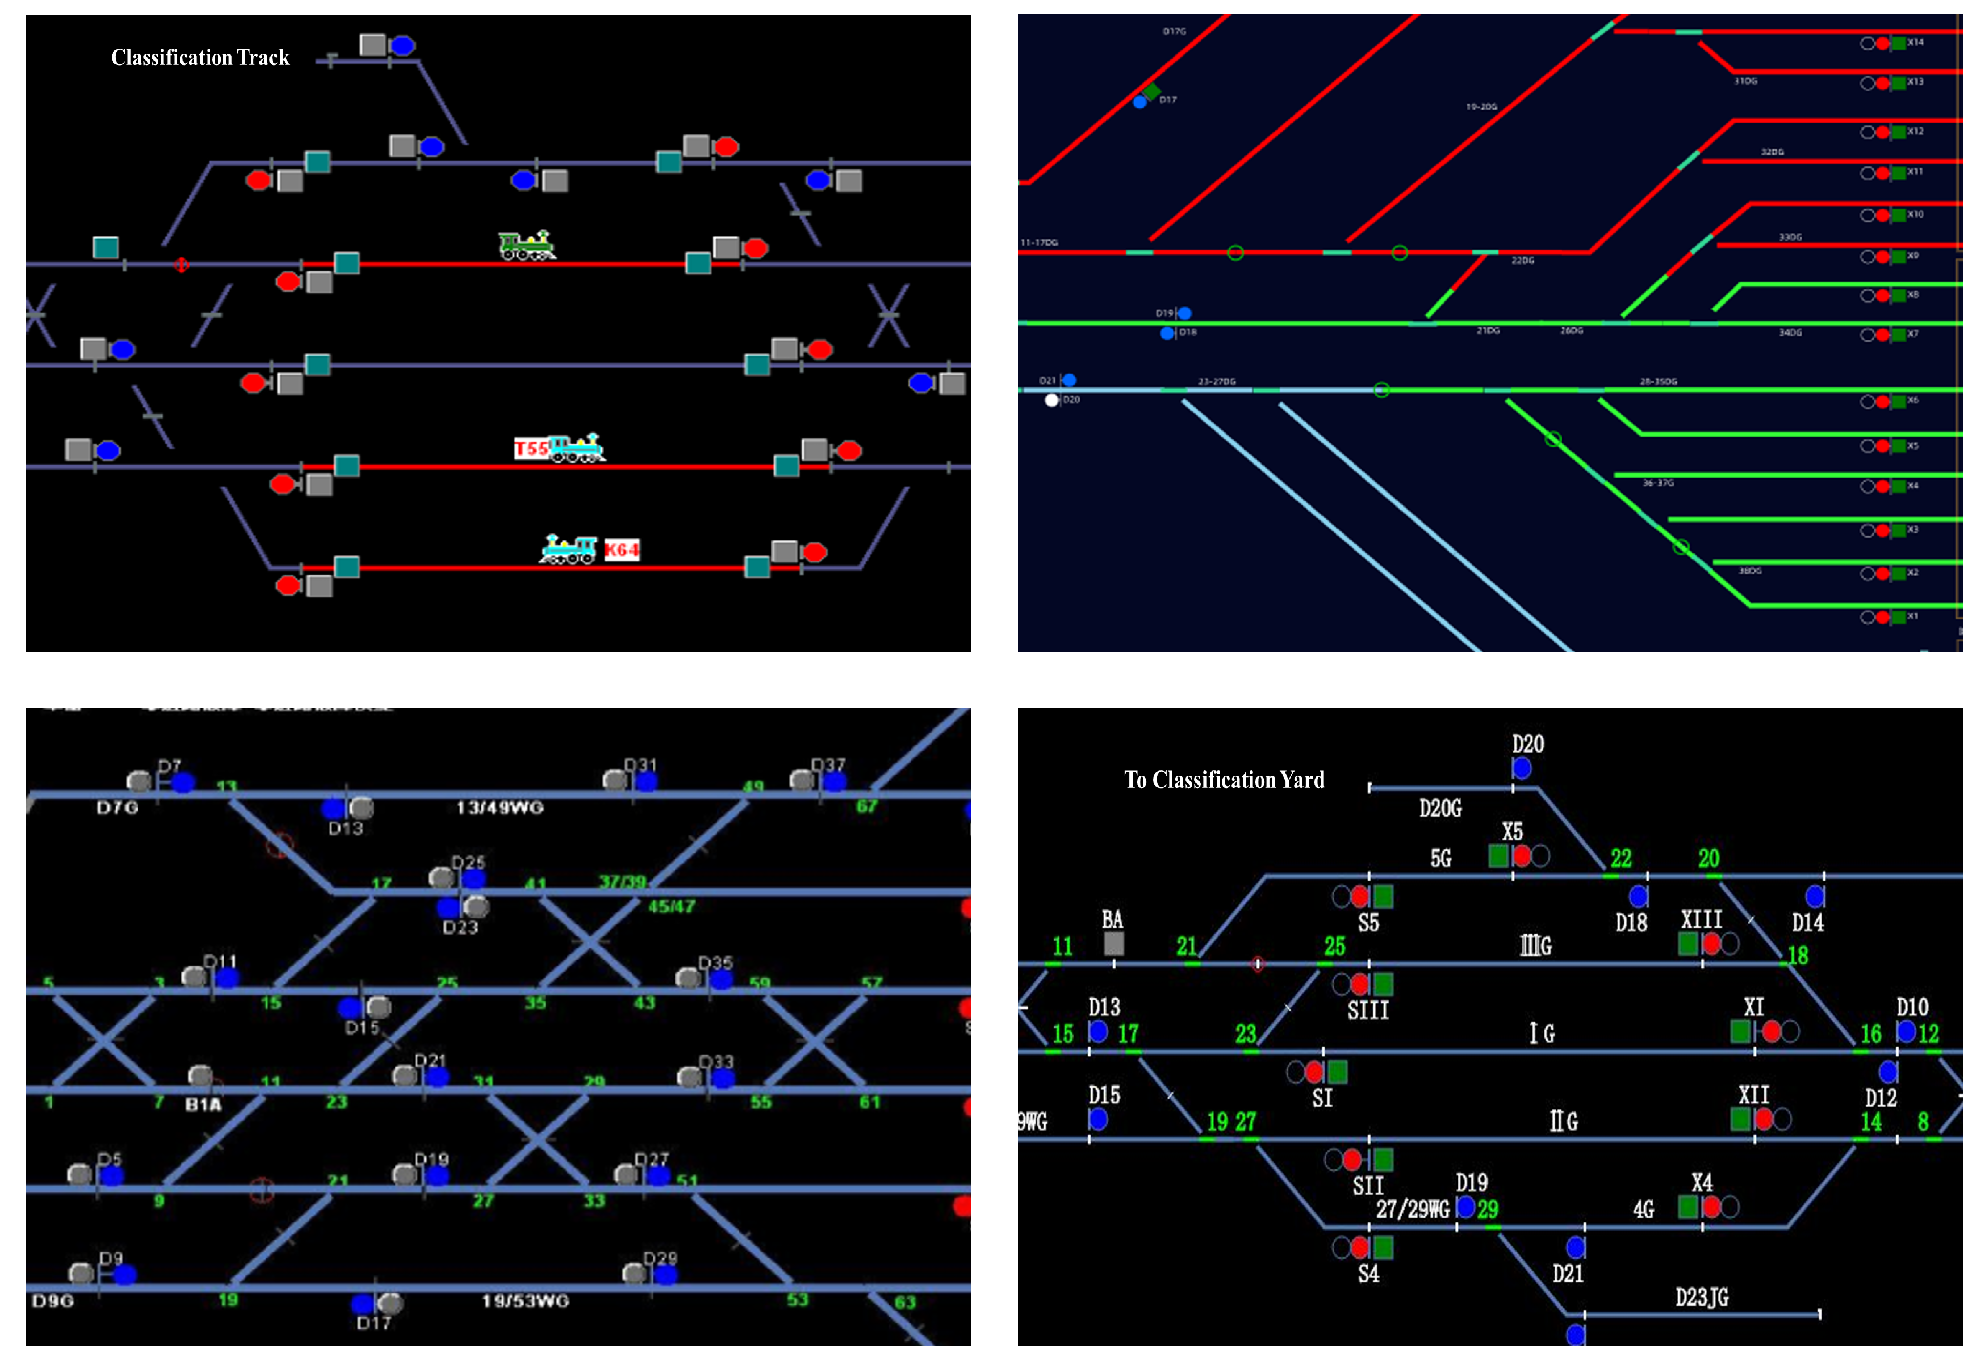
As shown in Figure 2, the display interface of the Metro Computer Interlocking System illustrates the challenges faced by deep learning algorithms in this domain. First, the small size and the large number of signal targets increase the probability of missed or false detections. Second, the low resolution of sample images and the blurring of signal boundaries complicate detection. Third, high-accuracy detection models are often too large to be deployed on the resource-constrained embedded dispatching terminals typically used in practice.

1.3. Research Objectives and Contributions

To address these challenges, this paper proposes a two-stage lightweight signal detection framework for Metro Computer Interlocking Systems. In the first stage, a detection architecture called YOLOv8-SFF is constructed by extending YOLOv8 with a small object detection layer and multi-scale feature fusion modules. In the second stage, the trained YOLOv8-SFF is further compressed by a joint pruning-and-distillation pipeline that combines Layer-Adaptive Magnitude-based Pruning (LAMP) [14] and Channel-Wide Knowledge Distillation (CWD) [15], producing a compact model suitable for deployment on embedded dispatching terminals.
The overarching objective of this work is to provide a signal detection framework for Metro Computer Interlocking Systems that is both end-to-end and deployment-ready, simultaneously addressing (i) small-object recognition, (ii) parameter and inference-time efficiency under embedded constraints, and (iii) the scalability of dataset construction. The main contributions of this paper, each addressing one of these aims, are summarized as follows:
  • A detection architecture for small targets at multiple scales, YOLOv8-SFF, is proposed by integrating a P2 detection layer, SSFF modules, and TFE modules [16] on top of YOLOv8. Redundant concatenation and upsampling operations are replaced by TFE blocks, yielding both higher accuracy and a more compact network.
  • A joint lightweighting strategy combining LAMP pruning and CWD knowledge distillation is applied to YOLOv8-SFF. Using the unpruned model as the teacher and the pruned model as the student, the resulting compact model retains detection accuracy while achieving an 86.2% parameter reduction, making deployment on embedded dispatching terminals feasible.
  • An automatic annotation subsystem based on HSV color analysis, morphological processing, and positional reasoning is developed, which substantially reduces the manual labeling effort required for small and densely distributed interlocking signals.
  • Extensive experiments on a real metro interlocking dataset demonstrate that the proposed framework provides an end-to-end solution that balances precision, speed, and deployability for practical rail transit scenarios.

2. Related Works

Deep-learning-based object detection has made significant advances in transportation applications, particularly for traffic signs, pedestrians, and vehicles. Recent studies have explored diverse approaches to improve performance under specific challenges such as precision, efficiency, and robustness.

2.1. Object Detection in Transportation

Yuan et al. [17] combined deep learning with a genetic algorithm to optimize the generation of test sequences for the verification of the signaling system, and Yan [18] proposed an automated testing framework for interlocking systems based on a timed automata model and the firefly algorithm. These studies highlight the growing role of intelligent algorithms in testing and verifying critical transportation systems.
For traffic sign detection, Han et al. [19] improved Faster R-CNN with a revised VGG16 backbone for small traffic signs. Choodowicz et al. [20] combined YOLO with classical image processing techniques to recognize the states of railway signals. Dewi et al. [21] used GANs to generate synthetic data to improve YOLOv4, while Zhang et al. [22] improved YOLOv5 with the Flip-Mosaic algorithm for small targets occluded. For pedestrian detection, Yang et al. [23] optimized SSD for metro station environments, and Lin et al. [24] proposed the DETR-based PED model for crowded scenes.
A particularly relevant sub-family is small-object detection (COCO convention: bounding-box area below 32 × 32 pixels), the regime in which our task falls. Existing approaches fall into four complementary families: (i) higher-resolution detection heads such as the P2 stride-4 layer; (ii) feature-pyramid refinements (FPN, PANet, BiFPN); (iii) attention-based mechanisms; and (iv) explicit multi-scale fusion modules. Kang et al. [16] combined family (iv) with a P2-like high-resolution head in ASF-YOLO via Scale Sequence Feature Fusion (SSFF) and Triple Feature Encoding (TFE) for cell instance segmentation; we adapt these to the interlocking-signal domain, combining SSFF and TFE with an explicit P2 head to form the SFF design used throughout this work, with per-component contributions quantified in Section 6.3.

2.2. Model Compression for Object Detection

Deep detection models generally yield higher accuracy at the cost of parameter redundancy and computational overhead. Two mainstream compression directions address this.
Network pruning removes unimportant weights or channels. Han et al. [25] proposed a classic three-step pipeline of training, pruning, and fine-tuning. Liu et al. [26] introduced Network Slimming, which applies 1 regularization on batch-normalization scaling factors for channel-level pruning, while Li et al. [27] directly removed filters with small 1 norms. Lee et al. [14] proposed Layer-Adaptive Magnitude-based Pruning (LAMP), which normalizes each weight’s importance within its layer and enables global pruning without manual per-layer sparsity tuning.
Knowledge distillation transfers the behavior of a large teacher network to a smaller student. Hinton et al. [28] first formulated the idea using temperature-scaled soft targets. Subsequent work extended the distillation to intermediate features and detection-specific settings. Shu et al. [15] proposed Channel-wise Knowledge Distillation (CWD), which aligns teacher–student activation distributions per channel using KL divergence and performs particularly well on dense prediction tasks.

2.3. Signal Detection in Interlocking Systems

For interlock signal recognition, traditional methods often rely on OpenCV-based pipelines [29,30], which extract colour and morphology cues but are sensitive to interface layout and perform poorly at low resolution. YOLO-based approaches [31] have improved accuracy by adding auxiliary detection heads, but their performance still degrades when equipment names or interface layouts change, and the deployment on embedded terminals remains problematic due to model size. Three properties of metro on-board footage compound the challenge—small, densely co-located targets; an operational zero-confusion requirement on safety-critical command states (motivating the per-class confusion-matrix analysis in Section 6.4); and a tight embedded-deployment budget. The proposed SFF design addresses these three properties through three complementary mechanisms: multi-scale feature fusion via the SSFF and TFE modules, a P2 stride-4 detection head for the smallest targets, and a joint LAMP pruning plus CWD distillation pipeline for the embedded compute budget.
Building on these observations, this paper proposes a lightweight detection framework tailored for Metro Computer Interlocking Systems, combining architectural improvements for small-object detection with a joint pruning-and-distillation pipeline that addresses the deployment bottleneck.

3. Proposed YOLOv8-SFF Architecture

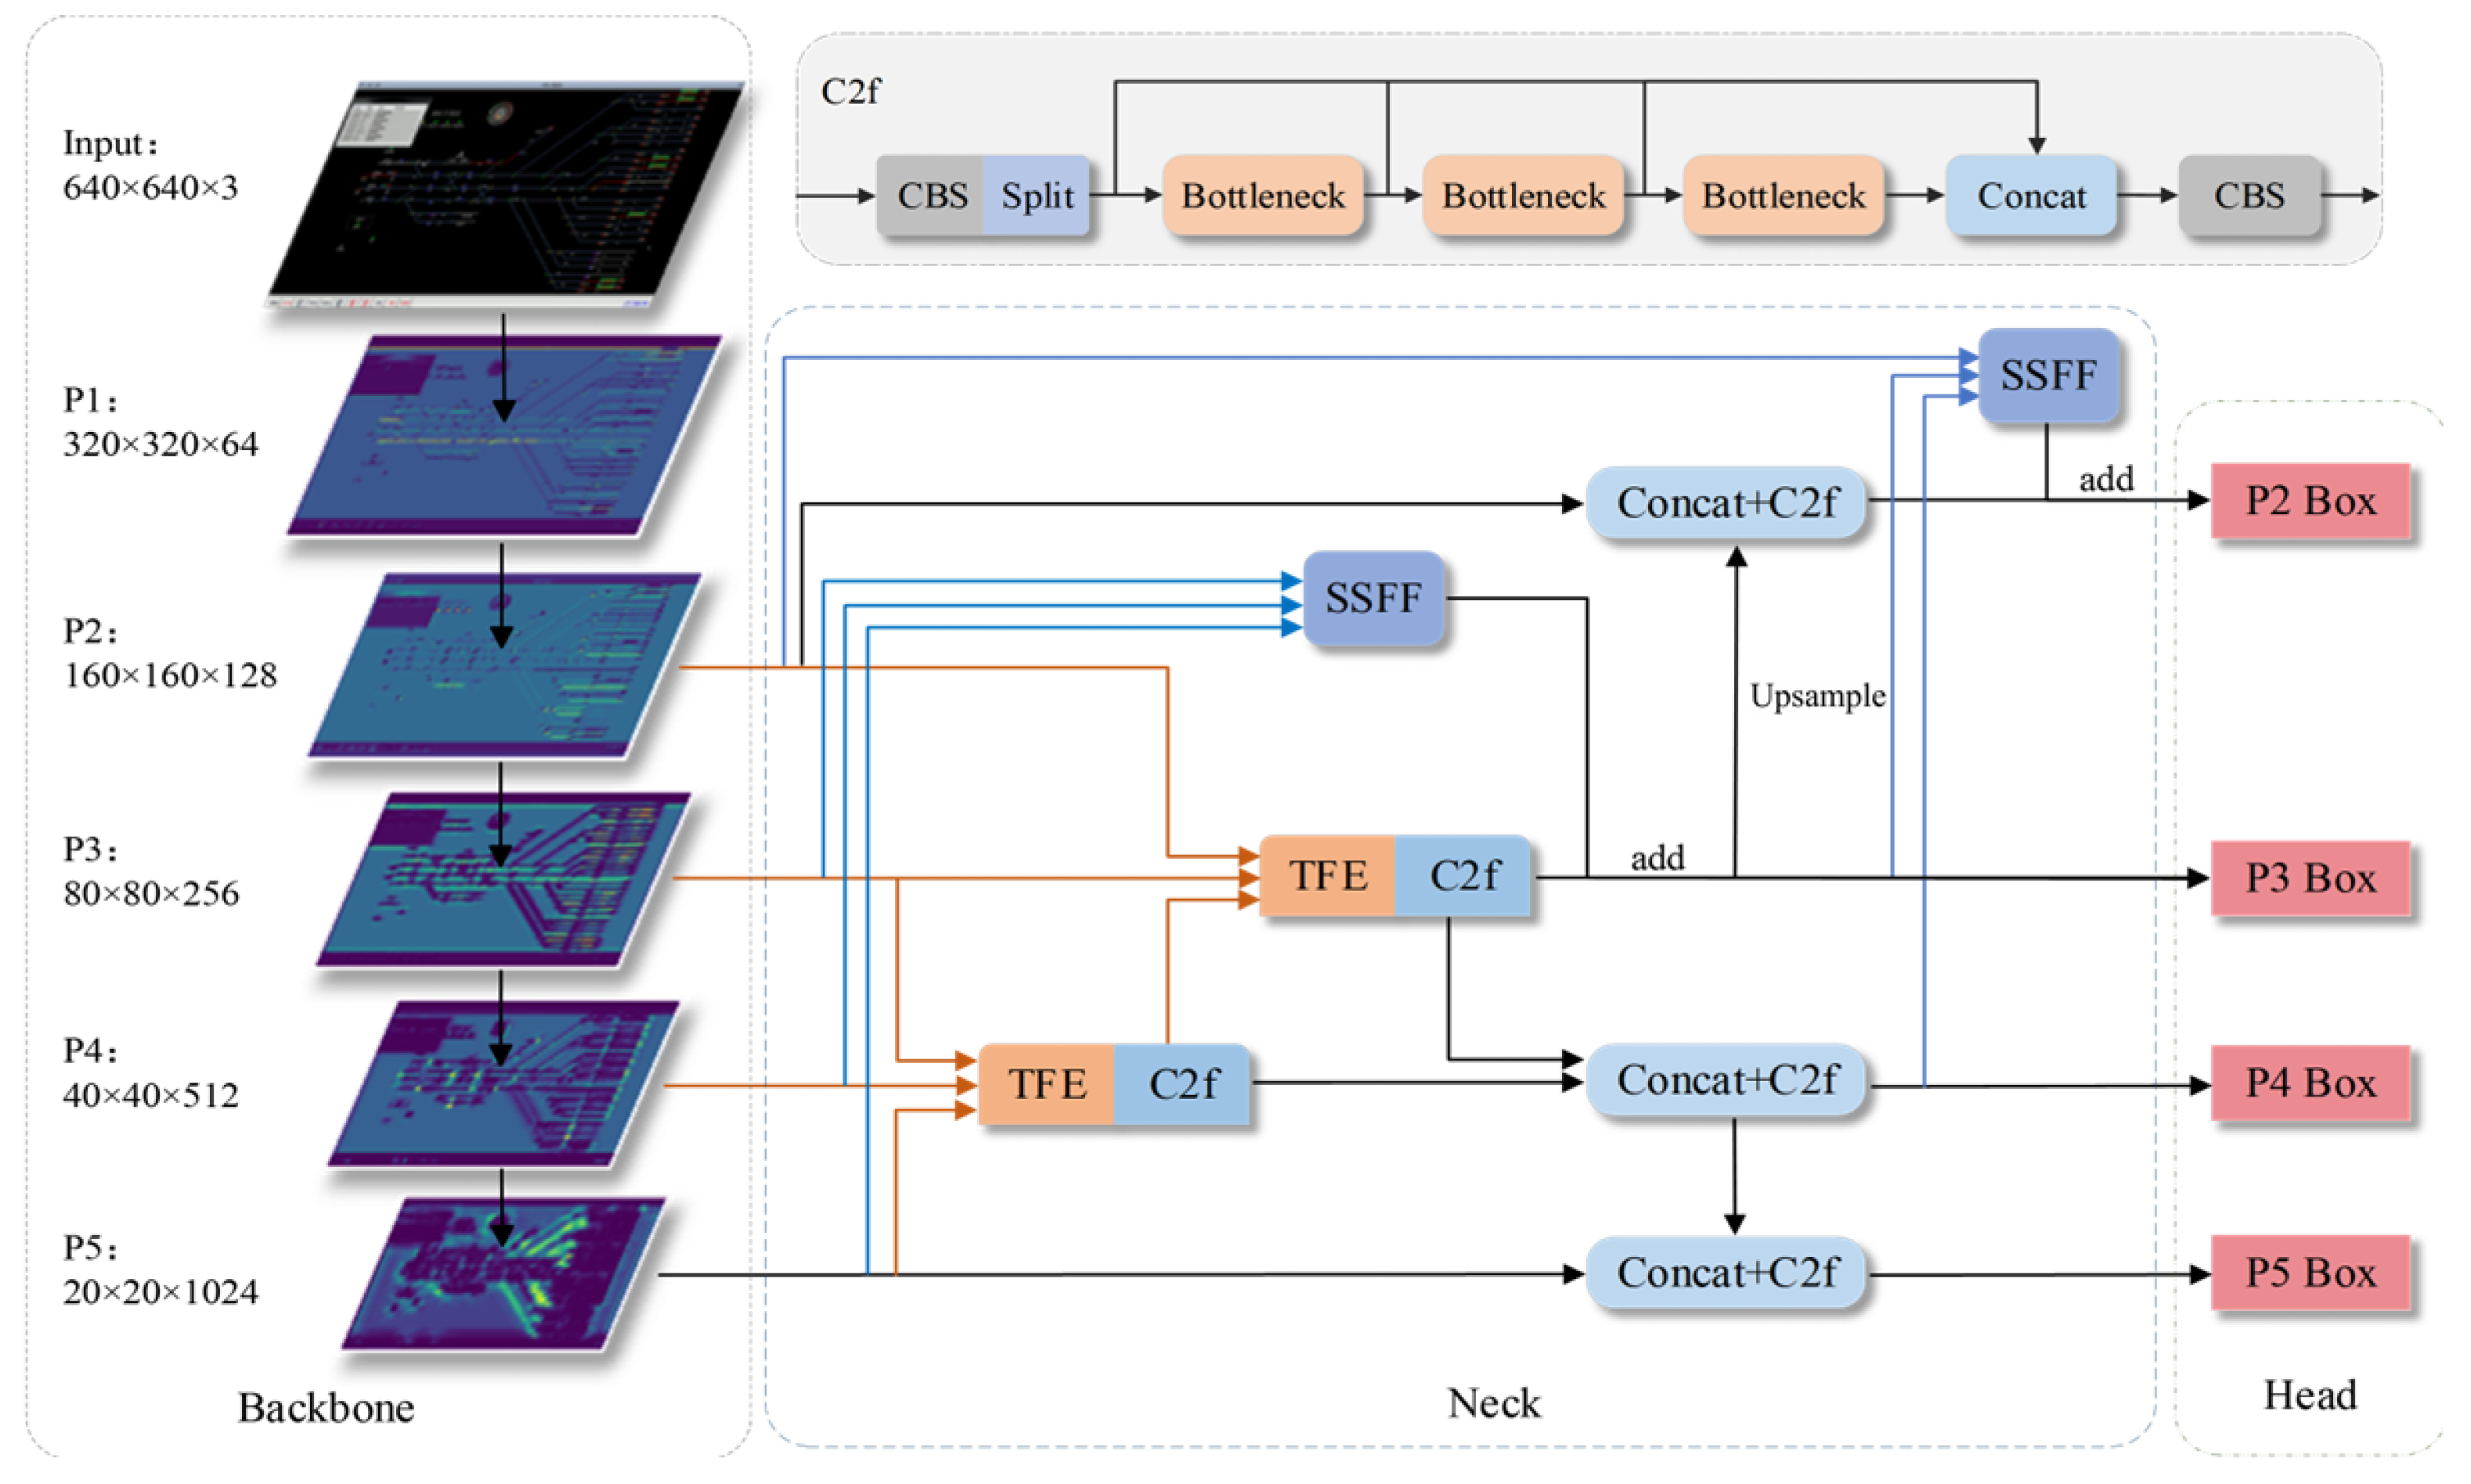
The general network architecture of YOLOv8-SFF is shown in Figure 3. Based on YOLOv8, the model incorporates a Small Object Detection Layer (denoted P2), allowing more efficient detection of small signal targets and more accurate localization.
The proposed model integrates the output of the P2 detection layer with the neck output of P3 and P4 through an SSFF module. The addition of the P2 detection layer further enhances small-target detection, reduces missed detections, and improves recall. The SSFF module preserves detection details and strengthens the network’s ability to detect small targets. In addition, the outputs of P2–P4 and P3–P5 from the backbone are fed into two TFE modules for cross-scale feature fusion, capturing detailed information from small targets and enhancing the detection of dense small signals. The TFE modules also replace certain feature concatenation and upsampling operations, retaining only one upsampling operation, which reduces both the parameter count and computational complexity.
Architecture summary. At the deployment scale (YOLOv8n, width factor 0.25 , input 640 × 640 ), the four detection heads receive feature maps with the following spatial resolution and channel dimension. The newly-added P2 head operates at stride 4 on a 160 × 160  map with 32 channels and is responsible for the smallest targets (the principal contribution of this work). The P3 head at stride 8 ( 80 × 80 , 64 channels) covers small-to-medium targets, the P4 head at stride 16 ( 40 × 40 , 128 channels) covers medium targets, and the P5 head at stride 32 ( 20 × 20 , 128 channels) covers large targets and global context. The two SSFF blocks fuse three pyramid-level feature maps each— { p 3 , p 4 , p 5 } for the deep SSFF and { p 2 , p 3 -fused , p 4 -fused } for the shallow SSFF, both aligned to the highest-resolution input among their three inputs—and the two TFE blocks operate at the P3 ( 80 × 80 ) and P4 ( 40 × 40 ) levels, each replacing a conventional concatenation-plus-upsampling stage of the original YOLOv8 neck. The total deployed model has 2.49  M parameters and 12.0  GFLOPs.

3.1. Small Object Detection Layer

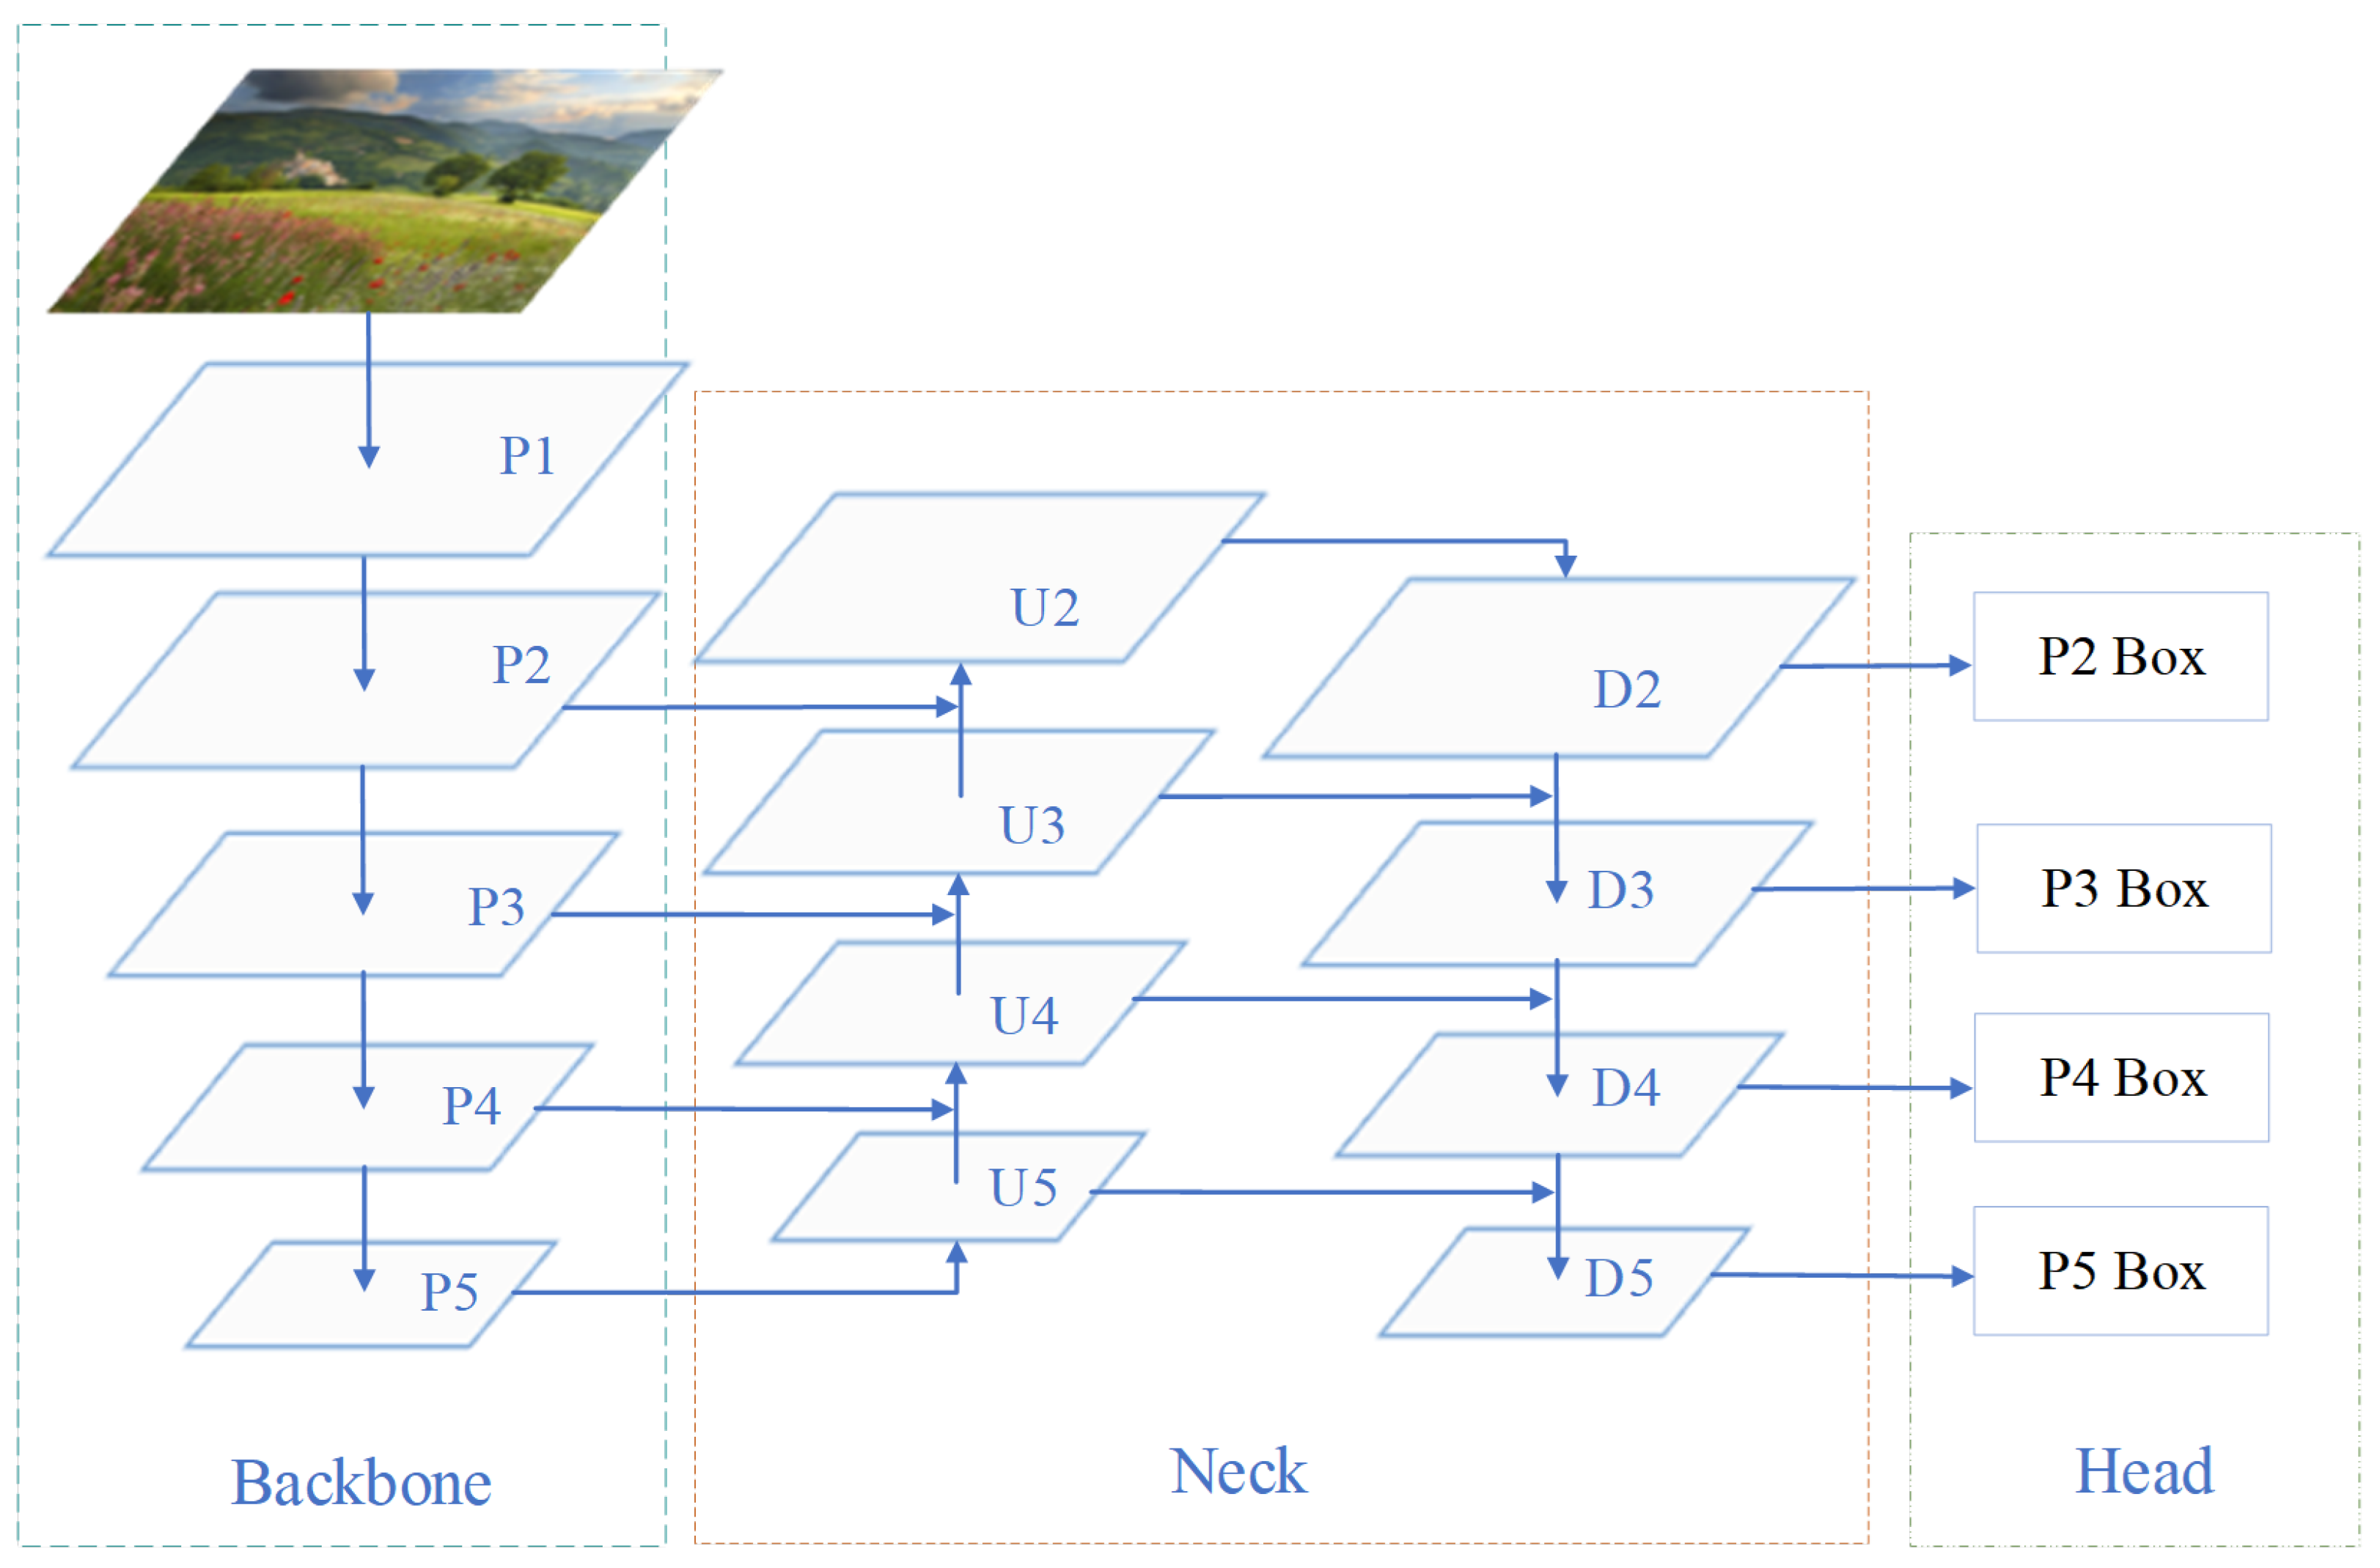
The YOLOv8 network comprises three main components: the backbone, the neck, and the head. Since small objects typically only occupy a few pixels, they are prone to being overlooked or misclassified. To mitigate this, a Small Object Detection Layer is incorporated into YOLOv8, as illustrated in Figure 4, where P2 denotes this layer.
In the backbone, CSPDarknet-53 generates five feature maps of different scales (P1–P5) through consecutive downsampling operations. The neck uses a Feature Pyramid Network (FPN) for feature fusion, allowing information exchange between different scales via upsampling (U2–U5) and downsampling (D2–D5). This produces four bounding-box predictions (P2–P5 boxes) in the head, allowing the network to effectively handle multi-scale detection.

3.2. SSFF Module

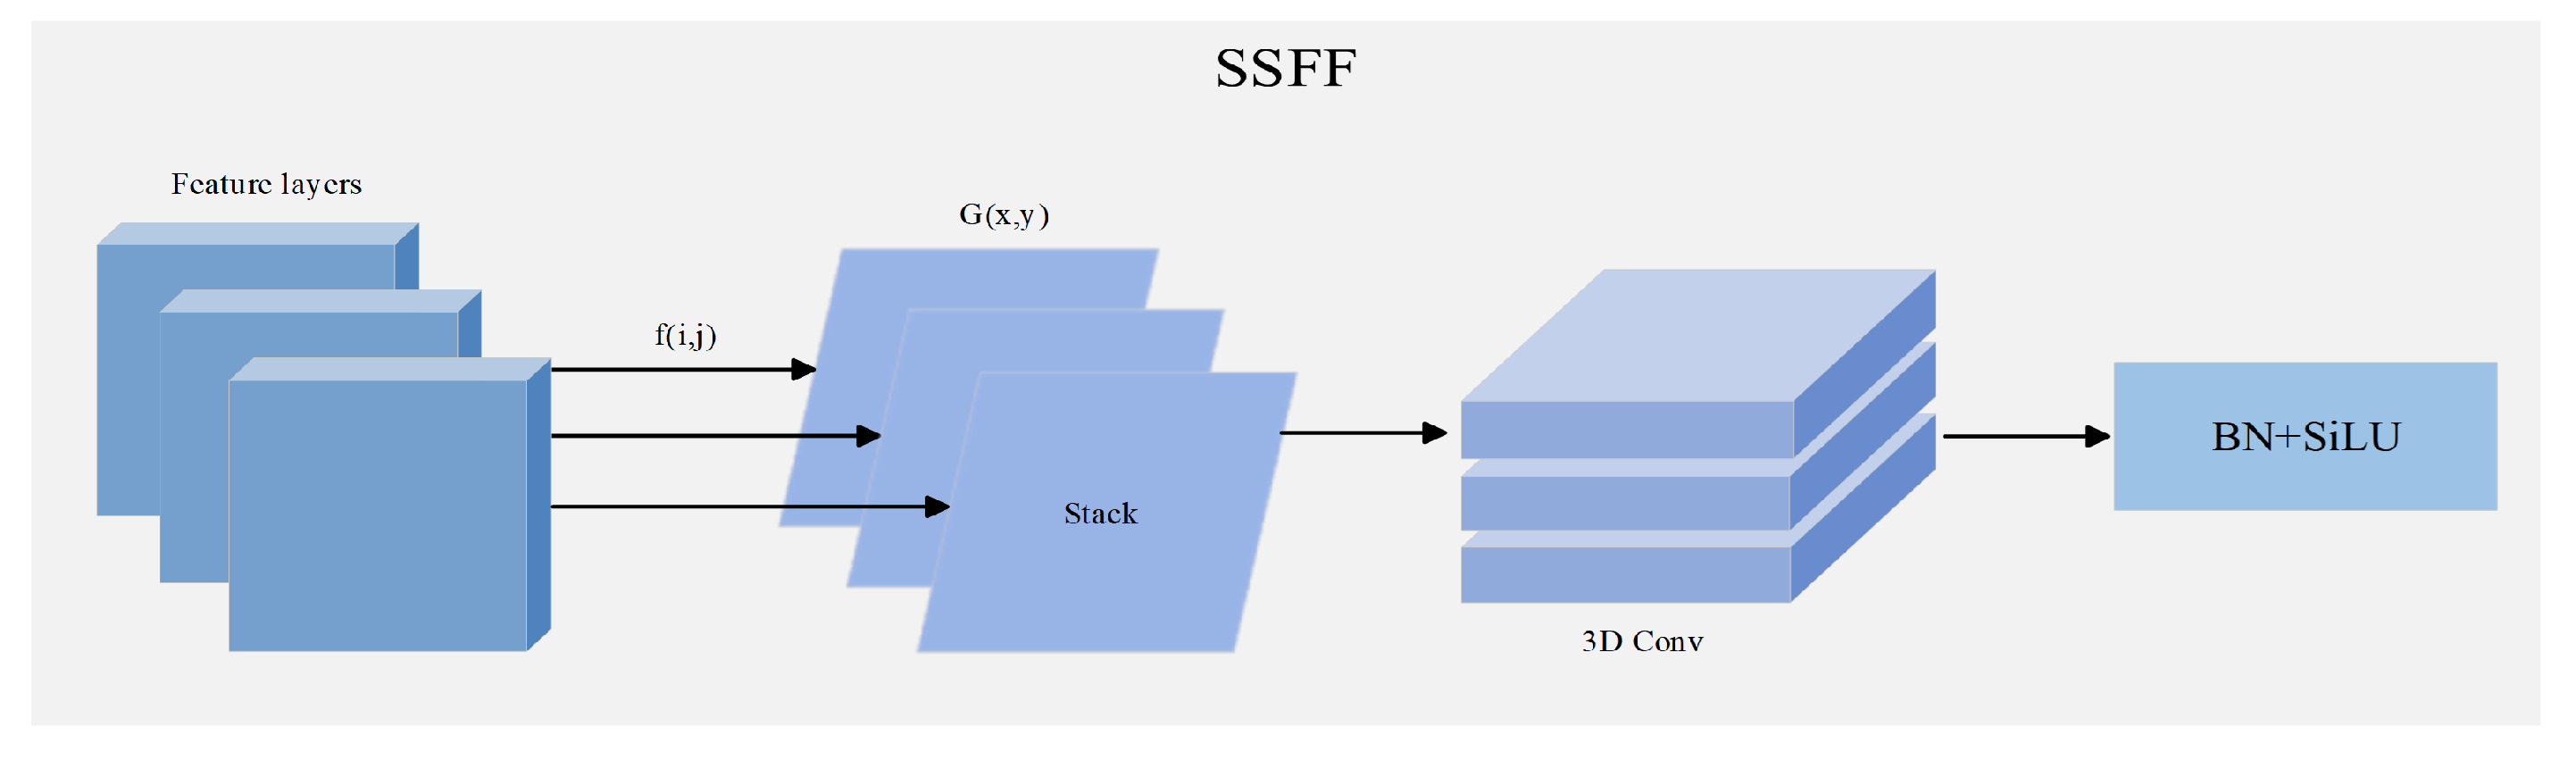
The SSFF module (Figure 5) resizes three feature maps of different scales to a uniform size and stacks them as input for 3D convolution, facilitating multi-scale feature fusion. The feature maps at varying scales undergo convolution with Gaussian kernels of progressively larger standard deviation, as defined in Equations (1) and (2):
G σ ( x , y ) = 1 2 π σ 2 e x 2 + y 2 2 σ 2
F σ ( i , j ) = u v f ( i u , j v ) × G σ ( u , v )
In the above equations, G σ denotes a 2D Gaussian kernel parametrised by standard deviation σ ; f ( i , j ) stands for the 2D input feature map, while u and v index the kernel offsets. The output map F σ is produced by convolving the input feature map with a sequence of such Gaussian kernels whose standard deviations grow monotonically, yielding a stack of multi-scale responses. These responses are then assembled along an auxiliary axis into a 3D tensor, from which scale-sequential representations are extracted by a 3D convolution. To address the varying resolutions of the Gaussian-smoothed maps and to retain critical details for small-target detection, nearest-neighbor interpolation aligns all feature maps with the highest resolution. In the overall network, the small target detection layer from the backbone is fused with the P3 and P4 feature layers from the neck through the SSFF module, enhancing the model’s ability to detect small targets.

3.3. TFE Module and Structural Optimization

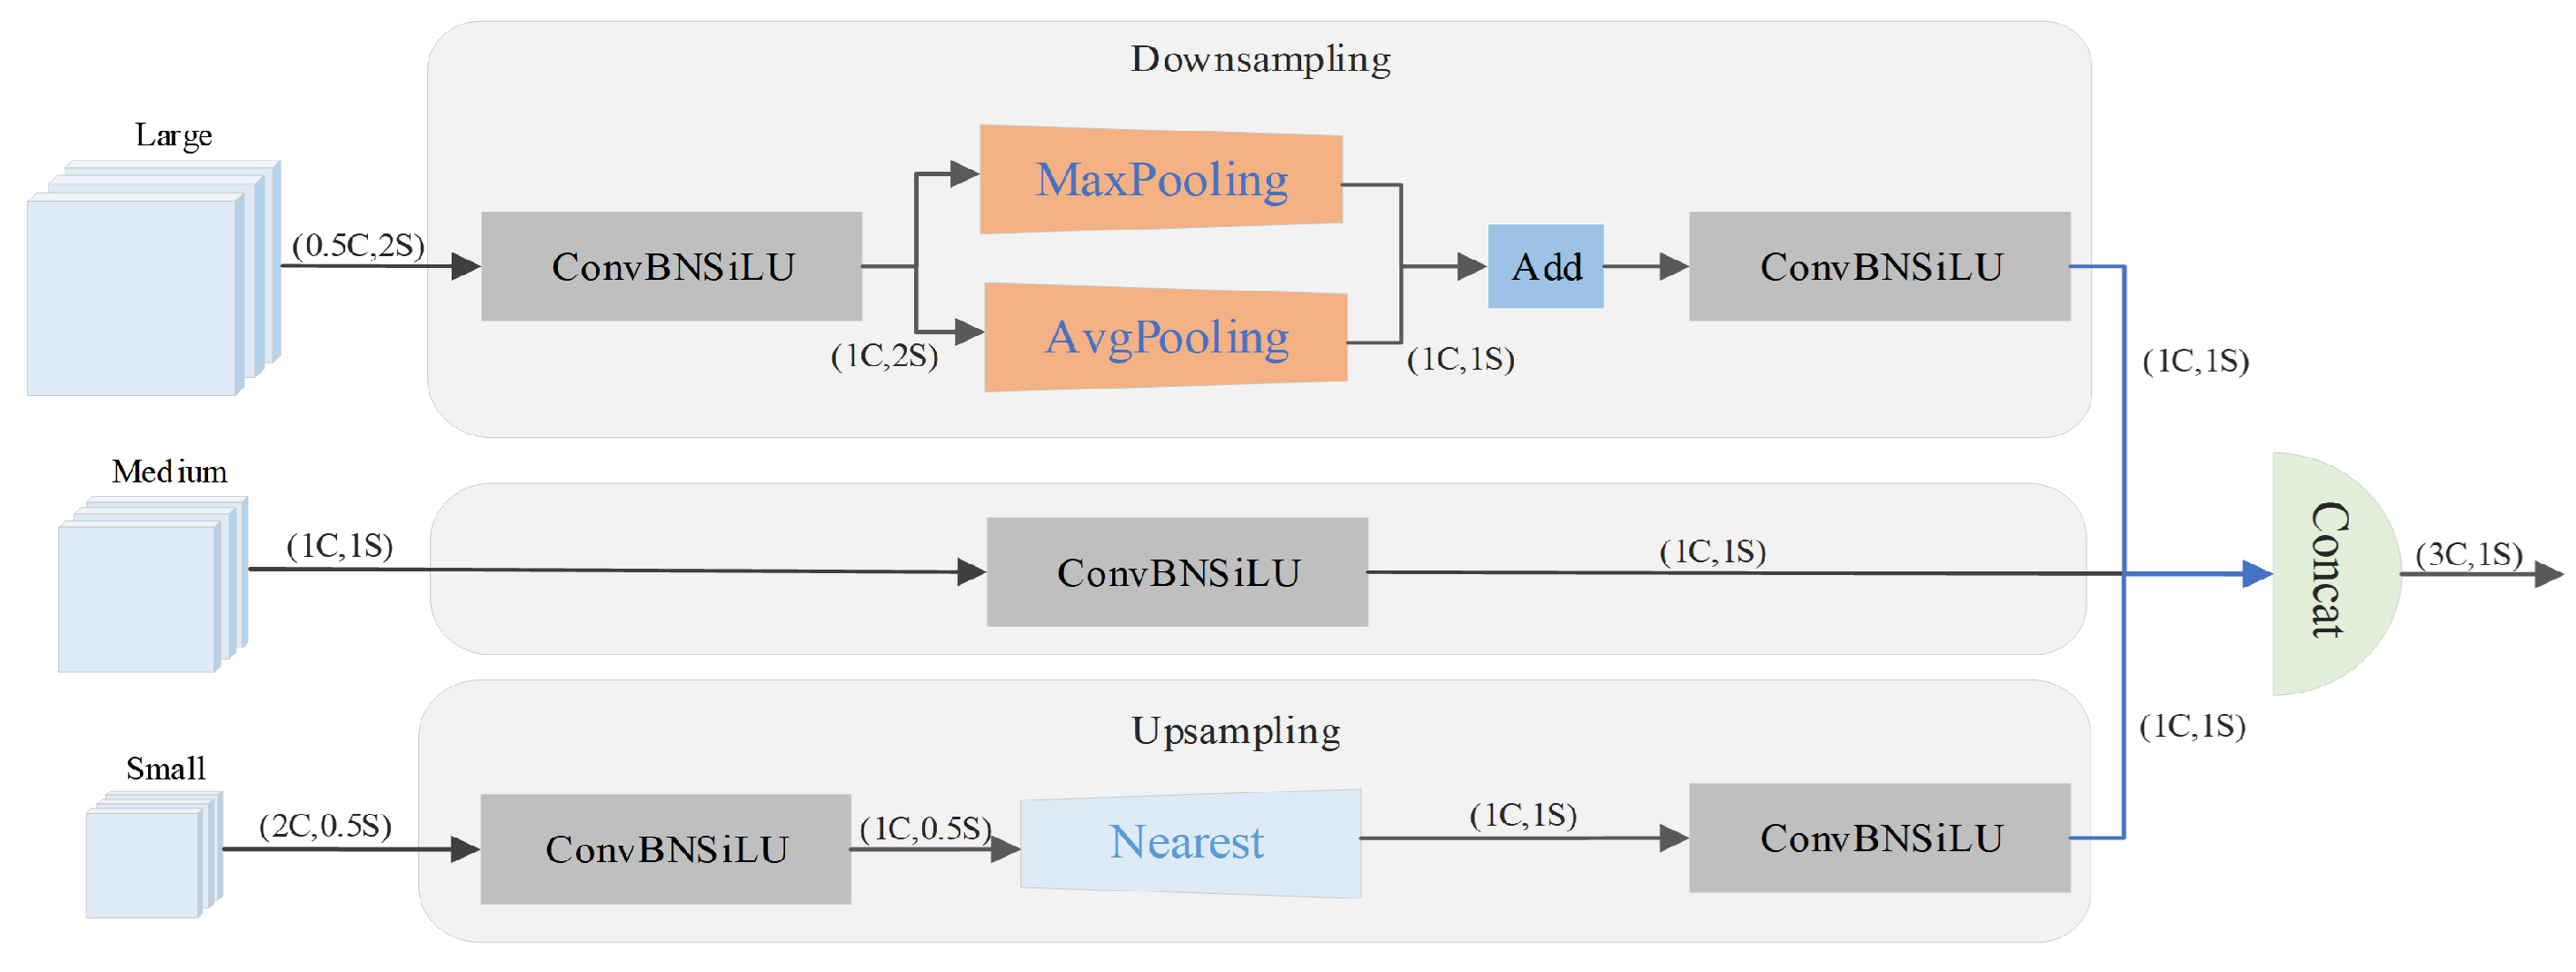
To handle dense signal regions, the TFE module (Figure 6) partitions the incoming features into three scales—large, medium and small—and merges them so that finer details survive the downstream pipeline. Prior to encoding, the channel count of each branch is realigned to match the medium-scale (primary) feature. The large branch (Large) first passes through a convolution that reduces its channel dimension to 1 C , lowering the cost of the later concatenation; the resulting tensor is then downsampled by a hybrid block that combines max and average pooling, which improves translation invariance and robustness to small spatial perturbations. On the small-scale branch (Small), the channel count is similarly realigned and the feature map is upsampled by nearest-neighbour interpolation, a choice that preserves local detail and avoids losing information about small objects. After this preprocessing, the large-, medium- and small-scale branches share an identical spatial resolution and are concatenated along the channel dimension:
F T F E = Concat ( F l , F m , F s )
F T F E above denotes the TFE module’s output, while F l , F m and F s refer respectively to the large-, medium- and small-scale feature maps. By construction, F T F E inherits the spatial resolution of F m but carries three times its channel count. The TFE module improves the detection of dense small targets by adjusting channel numbers, applying hybrid pooling, and fusing multi-scale features. In the overall architecture, using two TFE modules in place of certain concatenation and upsampling operations, while retaining only one upsampling step, optimizes the network structure and substantially reduces the parameter count.

3.4. Loss Function

The plain IoU loss used in anchor-based detectors captures neither the displacement nor the geometric overlap between predicted and ground-truth boxes adequately. A series of IoU variants have been proposed to remedy this: GIoU [32] and the joint DIoU/CIoU formulation [33] progressively incorporate centroid distance and aspect-ratio penalties, with CIoU (a DIoU extension that adds an aspect-ratio factor) being adopted in YOLOv5 and YOLOv8. EIoU [34] pushes this line further by explicitly penalising the width and height discrepancies between predicted and ground-truth boxes, which sharpens localisation on small objects. We therefore use EIoU in the detection head. The EIoU loss decomposes into three additive terms—an IoU term L I o U , a distance term L d i s , and an aspect term L a s p :
L E I o U = L I o U + L d i s + L a s p = 1 I o U + ρ 2 ( b , b g t ) w c 2 + h c 2 + ρ 2 ( w , w g t ) w c 2 + ρ 2 ( h , h g t ) h c 2 ,
In the equation above, ρ ( · ) = b b g t 2 stands for the Euclidean distance; b and b g t are the centre coordinates of the predicted box B and the ground-truth box B g t respectively; w g t and h g t are the side lengths of the ground-truth box; and w c , h c are the side lengths of the minimum enclosing rectangle that contains both boxes. Relative to CIoU, EIoU converges faster and yields more accurate bounding-box regression.

4. Model Compression via Joint Pruning and Distillation

4.1. Motivation for Lightweighting

Although YOLOv8-SFF achieves high accuracy, its 2.49 M parameters and 5.1 MB footprint can still be prohibitive for the embedded dispatch terminals used in practice, where memory and compute are tightly constrained. To bridge this gap, we propose a two-stage compression pipeline that first prunes the trained YOLOv8-SFF using LAMP and then recovers accuracy via CWD knowledge distillation.

4.2. LAMP-Based Pruning

LAMP [14] evaluates the importance of each weight through a layer-adaptive score. For a flattened weight tensor W with indices sorted in ascending order of magnitude, the LAMP score for index u is defined as
score ( u ; W ) = ( W [ u ] ) 2 v u ( W [ v ] ) 2 .
Weights with the smallest LAMP scores across the whole network are pruned globally until a target sparsity is reached. Unlike uniform pruning, LAMP automatically allocates sparsity across layers based on their internal weight distributions, avoiding manual per-layer tuning. We control the compression strength via a Speedup factor defined as the ratio of pre-pruning to post-pruning GFLOPs:
Speedup = GFLOPs pre GFLOPs post , PruningRate = GFLOPs pre GFLOPs post GFLOPs pre .
Larger Speedup values correspond to more aggressive pruning, leading into the distillation-based recovery stage described next.

4.3. Channel-Wise Knowledge Distillation

Aggressive pruning inevitably degrades accuracy. To recover performance, we apply CWD [15] using the original unpruned YOLOv8-SFF as the teacher T and the pruned model as the student S. For each channel c, the activation maps are converted into spatial probability distributions through a softmax with temperature τ :
ϕ ( y c , i ) = exp ( y c , i / τ ) j exp ( y c , j / τ ) .
The distillation loss is the KL divergence between teacher and student distributions, summed over channels:
L CWD = τ 2 C c i ϕ ( y c , i T ) log ϕ ( y c , i T ) ϕ ( y c , i S ) .
Per-channel alignment encourages the student to mimic the teacher’s spatial attention patterns on foreground regions, which is particularly beneficial for dense small-signal detection.

4.4. Joint Optimization Pipeline

The overall procedure consists of four steps: (1) train YOLOv8-SFF on the interlocking signal dataset to obtain the teacher; (2) apply LAMP pruning at a target Speedup to the trained YOLOv8-SFF to obtain a compact student with the same macro-architecture; (3) distill the pruned student using the CWD loss in Equation (8), with the unpruned YOLOv8-SFF as the frozen teacher and without any further architectural modification; (4) deploy the distilled compact model on the target embedded terminal. Compared to the conventional prune-then-finetune paradigm, replacing fine-tuning with CWD distillation produces faster accuracy recovery and better final performance, especially at high pruning ratios, as empirically verified in Section 6.6.

5. Signal Dataset and Annotation System

5.1. Signal Classification

As shown in Table 1, the signals in the upper computer interface of the Metro Computer Interlocking System are categorized into shunting/entry-exit signaling machines, turnouts, and track lines. Due to the limited duration of certain signal states in the original video, fewer samples were available for some states. Therefore, representative signals were selected for detection and analysis to evaluate the feasibility of the proposed approach.
A signaling machine indicates whether the train should move forward or stop and is usually located at the beginning of the approach, to the left of the line running direction. Signaling machines can be divided into inbound, outbound, shunting, and other types, with displayed states including RL, BL, RDL, BLFS, DRL, and so on. A turnout directs vehicles from one track to another and has two positional states, positioning (SG) and reverse positioning (SY). Track circuits use railway tracks as conductors to form signal transmission circuits, which continuously monitor section occupancy; they can be idle (LB), occupied (LR), or incoming (LSB) states.

5.2. Automatic Annotation System

An automatic annotation system is developed for interlocking computer signal targets based on digital image processing. Using the color and morphological characteristics of signaling machines, turnouts, and track lines, and combining HSV color space analysis, morphological feature extraction, and coordinate mapping, the system identifies each signal element and determines its state. Color analysis focuses on the distinct color attributes of each signal, including distribution, hue variation, and texture patterns. Morphological analysis emphasizes contours, boundaries, and geometric properties, particularly for low-resolution targets. Positional analysis determines the type of signal by computing the coordinates of the center point within the HSV-based color mask, enabling precise localization and classification.
The data set generated by the automatic annotation subsystem consists of 1092 samples covering a variety of states and is used, after manual verification, to train the detection network. This pipeline substantially reduces manual labeling effort while maintaining label quality under variations such as window jitter and mouse occlusion.

5.3. Dataset Partition and Evaluation Protocol

The 1092 annotated images are partitioned at the image level into a training set (764 images, 70.0 % ), a validation set (109 images, 26 , 808 instances, 10.0 % ), and a held-out test set (219 images, 53 , 625 instances, 20.0 % ). On the test split, the per-class instance counts are RL 4409; BL 5158; RDL 429; DRL 4913; BLFS 416; SG 5398; SY 3040; LB 25 , 530 ; LR 2558; LSB 1774, exhibiting a 61 : 1 imbalance ratio between LB and BLFS. Because all images derive from the same continuous on-board video, the partition is performed by sampling non-adjacent frames into each split so that no two visually-near-duplicate frames straddle the train/test boundary.
The training set is used for back-propagation only. The validation set is used exclusively for model selection: it is evaluated at the end of every training epoch, and the highest-mAP@50 checkpoint is saved as the final model with early stopping (patience 50). The test set is held out and is never consulted during training or model selection; it is evaluated only once per final model. Accordingly, Table 2 reports validation-set metrics to align with the model-selection criterion, while Table 3 reports the corresponding held-out test-set metrics.

6. Experiments

Section 6.1 and Section 6.2 establish the experimental and evaluation protocol; the subsequent subsections each open with the design of a specific experiment and immediately report its numerical or qualitative result.

6.1. Implementation Details

All training and evaluation runs were executed on a single NVIDIA RTX 4090 GPU (24 GB) using PyTorch 2.0.1 under Python 3.8 and CUDA 11.7; channel pruning is performed through the torch-pruning 1.3.7 library. Rather than training from scratch, each model is initialised with the publicly released YOLOv8n ImageNet pre-trained weights and is then fine-tuned on the interlocking signal dataset. Input images are resized to 640 × 640  pixels and grouped into mini-batches of eight samples; optimisation proceeds for up to 300 epochs, with early stopping triggered after 50 epochs of no improvement on the validation mAP@50. We adopt SGD with initial learning rate lr 0 = 0.01 decayed linearly to a final factor lr f = 0.01 , momentum  0.937 , weight decay  5 × 10 4 , and a three-epoch linear warm-up. To support the multi-seed mean–std ablation analysis of Section 6.3, each of the eight configurations in Table 2 is trained three times under deterministic kernels with random seeds { 0 , 1 , 42 } and otherwise-identical hyperparameters; the autogenerated args.yaml files of the 24 runs are byte-identical except for the seed field. Mixed-precision (AMP) training is used throughout. The augmentation pipeline follows the default YOLOv8 recipe—mosaic (probability  1.0 , disabled during the final 10 epochs), HSV jitter, geometric translation, scaling, horizontal flipping, and RandAugment—while mixup and copy-paste are turned off. For the two-stage compression pipeline of Section 4, the LAMP pruning stage (Equations (5) and (6)) runs with global pruning enabled, no per-layer sparsity cap, 200 iterative pruning steps, and a 500-epoch sparsity-learning warm-up applying an 2 regulariser of strength λ = 5 × 10 4 with linear decay δ = 0.1 λ every 10 epochs; the Speedup target is swept over { 1.0 , 1.5 , 2.0 , 2.5 } with the 2.5 × configuration adopted as the final deployment model, and the pruned model is fine-tuned for 300 epochs with lr 0 = 0.01 and patience 50 under the same SGD optimiser. The subsequent CWD distillation stage (Equations (7) and (8)) uses the unpruned YOLOv8-SFF as the teacher and the LAMP-pruned model as the student; the feature-level KL loss is applied at distillation layer indices { 13 , 17 , 20 , 23 , 28 } with temperature τ = 1.0 and a constant feature-loss weight of 0.4 , with distillation proceeding for 250 epochs at batch size 8 under the same optimiser. All hyperparameter values above are taken from the auto-saved args.yaml files and are reproducible from the released scripts.

6.2. Performance Metrics

Our evaluation tracks both accuracy and efficiency metrics: precision, recall, mean average precision at IoU = 0.5 (mAP@ 0.5 ), the parameter count, GFLOPs, on-disk model size, and the per-frame inference rate (FPS). Recall captures the fraction of ground-truth positives that the detector successfully recovers, while precision measures the fraction of detector outputs that are genuine positives. Average precision (AP) corresponds to the area under the precision–recall curve for one class, and the mean average precision (mAP) is obtained by averaging AP across all categories. We adopt mAP@50 as the primary evaluation metric throughout this work—it matches the operational tolerance of the downstream interlocking decision logic and is typeset in italic in Table 2 and Table 3; mAP@50:95 is reported for completeness:
R = T P T P + F N ,
A P = 0 1 P ( R ) d R ,
P = T P T P + F P ,
m A P = i = 1 N A P i N ,
where T P , F P , and F N are true positives, false positives, and false negatives, and N is the number of categories. GFLOPs quantifies the computational cost of a single forward pass.

6.3. Ablation Study

To isolate each component’s contribution, we conducted a complete 2 3 factorial ablation over all eight subsets of {P2, SSFF, TFE}. The proposed YOLOv8-SFF integrates all three; YOLOv8-ASF is the SSFF+TFE combination without P2 [16]. Each configuration is trained three times with random seeds { 0 , 1 , 42 } under otherwise-identical hyperparameters, and reported as mean ± standard deviation (Table 2 for validation, Table 3 for the held-out test split).
Three findings emerge. First, the P2 detection head is the dominant contributor: adding P2 alone to the YOLOv8 baseline lifts validation mAP@50 from 87.37 ± 1.39 to 98.63 ± 0.08 (a + 11.3 pp gain), and the per-seed standard deviation drops from 1.39 pp to 0.08 pp, confirming that signal targets reside predominantly at the P2 stride-4 scale and that the high-resolution head also stabilises optimisation. Second, without P2 the multi-scale fusion modules contribute little: SSFF, TFE, and the original ASF block (Rows 3, 4, 7) all remain within one σ of the baseline. Third, on top of P2 the four configurations (Rows 2, 5, 6, 8) cluster within 0.14 pp on both validation and test mAP@50, with all pairwise differences at most 2 × the larger of the two standard deviations; the proposed full SFF attains the highest mean validation mAP@50 ( 98.66 ± 0.08 ) and ties P2-only at the top of the test mAP@50 (both 98.67 ). On the stricter mAP@50:95 metric, adding TFE on top of P2 alone (Row 6) introduces a 1.2 pp localisation drift relative to P2 alone ( 85.62 vs. 86.86 ); re-introducing SSFF in the full SFF recovers this loss almost completely ( 86.74 ± 0.10 , within 0.12 pp of the P2-only ceiling), justifying retaining both modules in the proposed design.
Table 3 confirms that the validation-set ranking transfers to the held-out test split (SFF and P2-only both reach 98.67 % test mAP@50, within run-to-run variance); per-class robustness is analysed in Section 6.4.

6.4. Confusion-Matrix Analysis

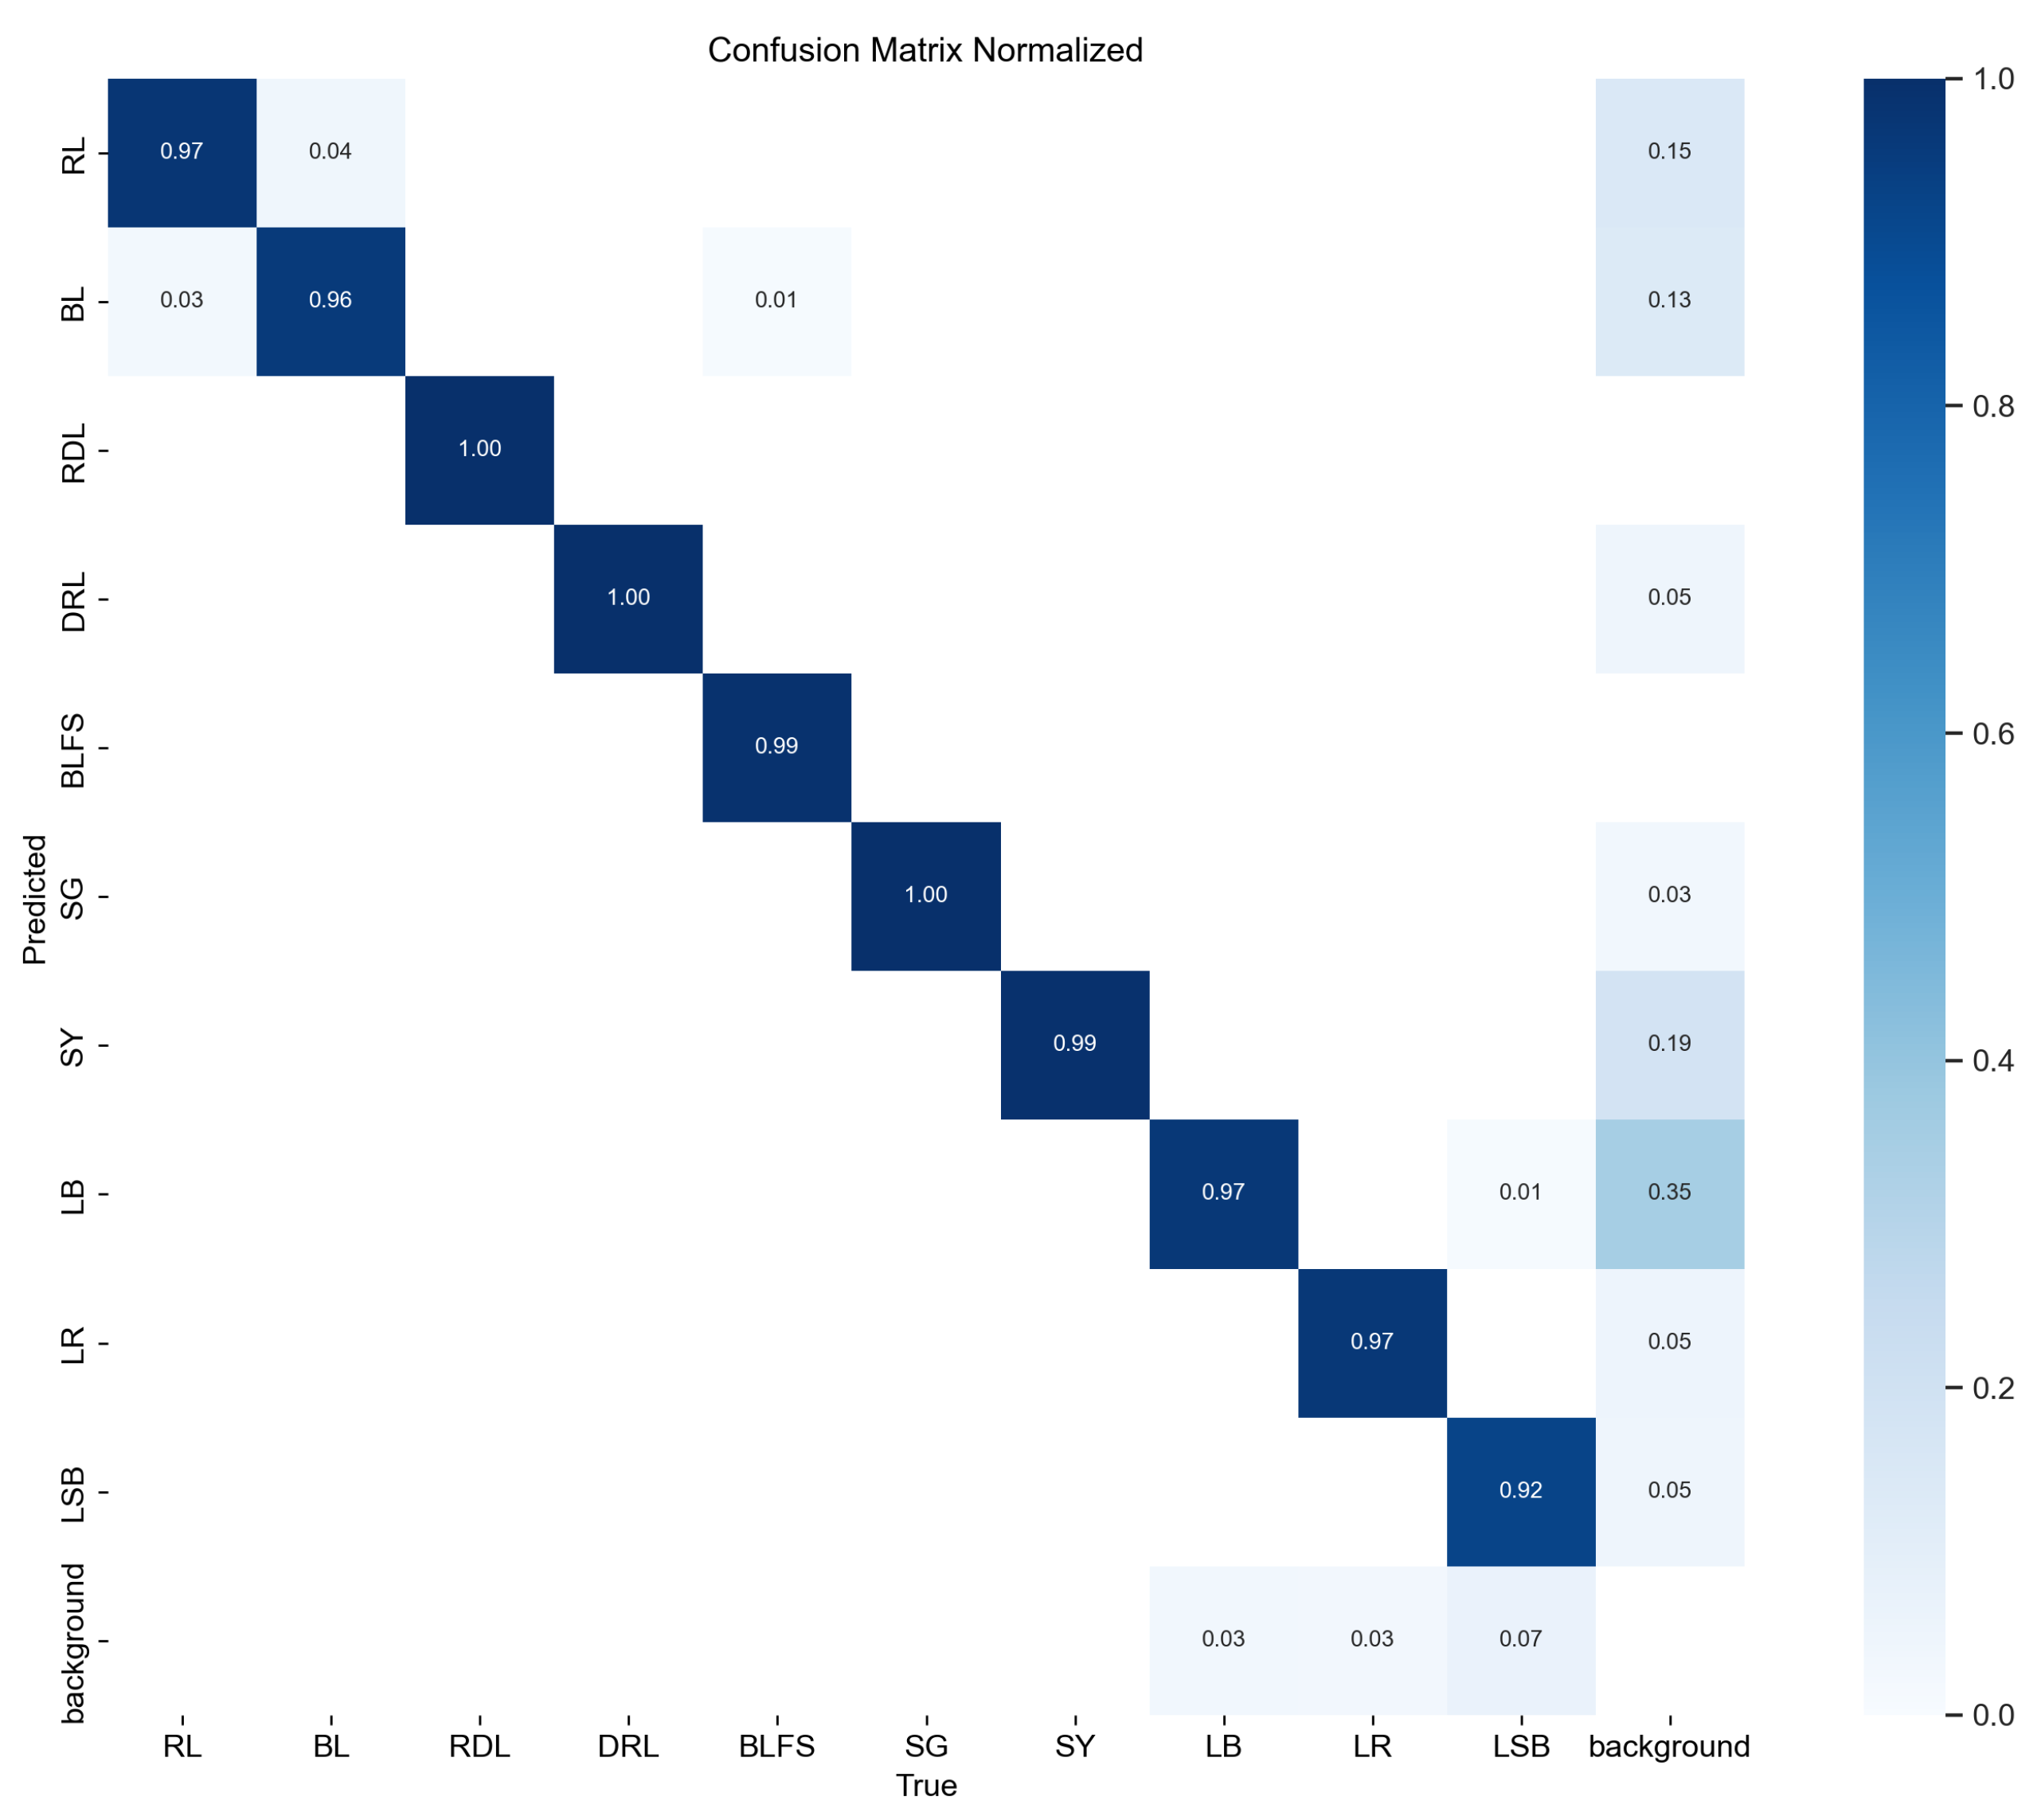
All ten classes reach ≥0.92 on-diagonal recall (Figure 7): RDL, DRL and SG at 1.00 ; BLFS and SY at 0.99 ; shunting and track classes between 0.92 and 0.97 , with LSB at the low end. The dominant cross-class confusion is the RL↔BL pair (3– 4 % in each direction; two operational states of the same shunting signal differing only in colour); every other off-diagonal cell is ≤0.01, and the safety-critical RDL/DRL/BLFS classes show zero confusion with other operational states. Missed detections are bounded by 7 % on LSB and ≤4% on every other class; false positives concentrate on the populous LB class (per-instance FP rate ≈ 2.1%, 534 / 24 , 725 ).

6.5. Comparative Experiments

Table 4 compares YOLOv8-SFF with several representative detectors, including YOLOv5n, YOLOv7-tiny, YOLOv9-tiny, and RT-DETR-tiny, on our interlocking signal dataset. YOLOv5n, YOLOv7-tiny, and YOLOv9-tiny exhibit lower precision and recall, yielding higher miss rates. RT-DETR-tiny reaches higher accuracy, but at roughly an order of magnitude more parameters and substantially lower throughput. YOLOv8-SFF offers the best overall balance of accuracy, model size, and real-time performance, running at 60 FPS with a footprint of 5.1 MB.

6.6. Pruning and Distillation Results

We evaluate the proposed joint compression pipeline on YOLOv8-SFF at four Speedup levels. Table 5 reports results for LAMP pruning alone, and Table 6 reports results after CWD distillation.
Several observations can be drawn from Table 5 and Table 6. First, LAMP pruning alone causes substantial accuracy loss at aggressive compression rates: at Speedup = 2.5 , mAP collapses to near zero, confirming that pruning must be followed by a recovery stage. A layer-wise inspection of the pruned weights further indicates that LAMP allocates sparsity adaptively across layers, with deeper convolutional stages pruned more aggressively than shallow ones, consistent with the layer-adaptive design of the method. Second, CWD distillation effectively restores accuracy in all Speedup settings. At Speedup = 1.0 2.0 , the distilled models even slightly surpass the original YOLOv8-SFF on mAP50, likely because distillation also acts as a form of regularization. Third, in Speedup = 2.5 , the distilled model retains 98.0% mAP while reducing the parameters from 2.49 M to 0.34 M (an 86.2% reduction) and the size of the model from 5.1 MB to 1.1 MB, and still runs above 60 FPS. This combination of accuracy, size, and speed makes the compressed model well suited for deployment on embedded dispatching terminals.

6.7. Detection Results

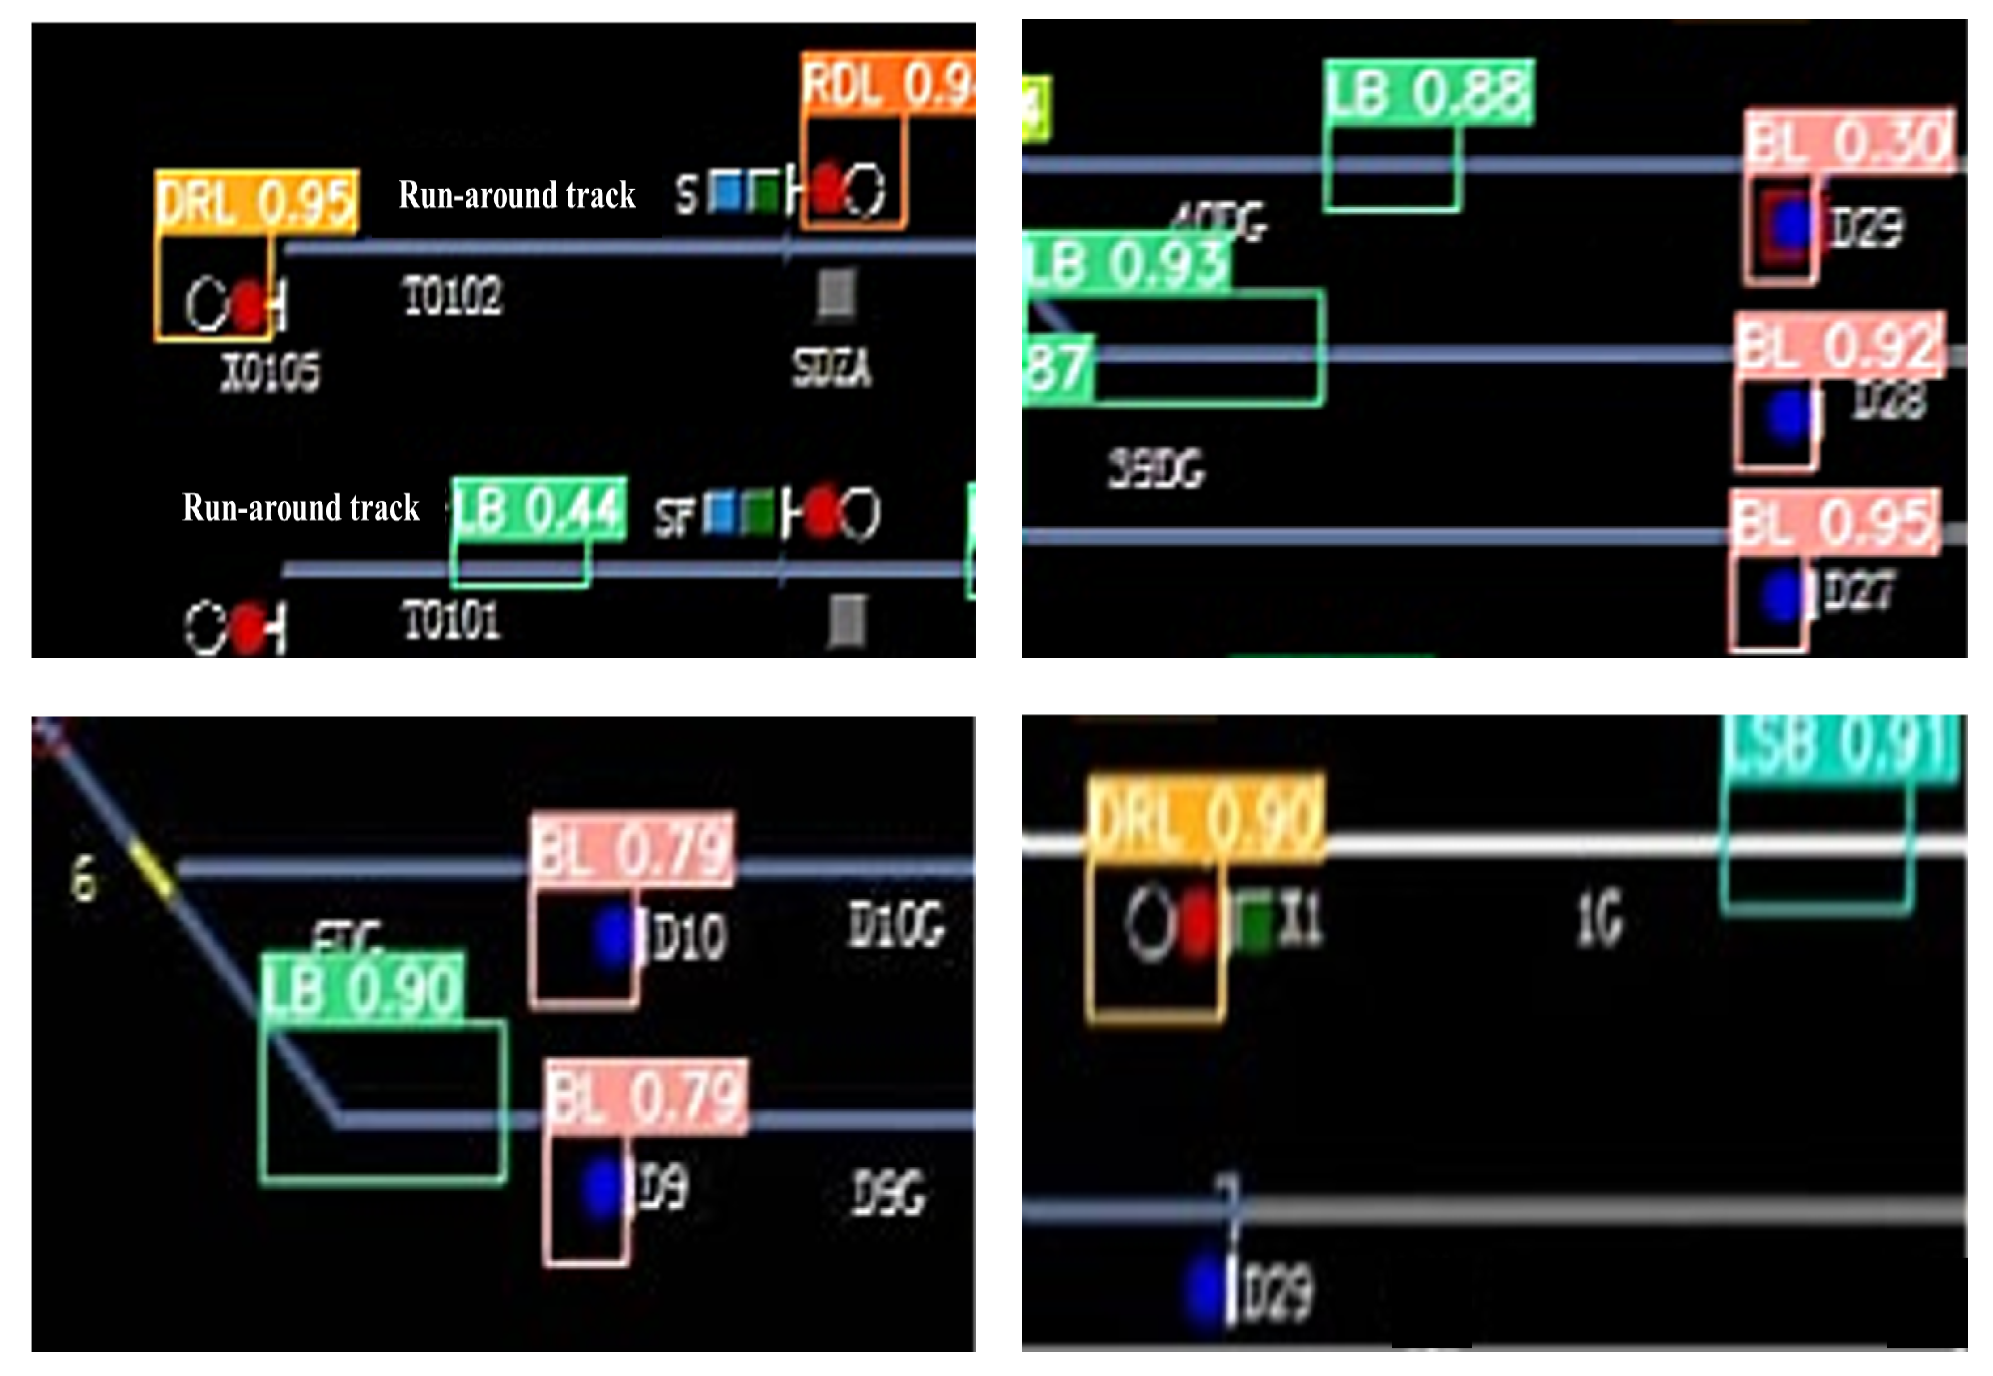
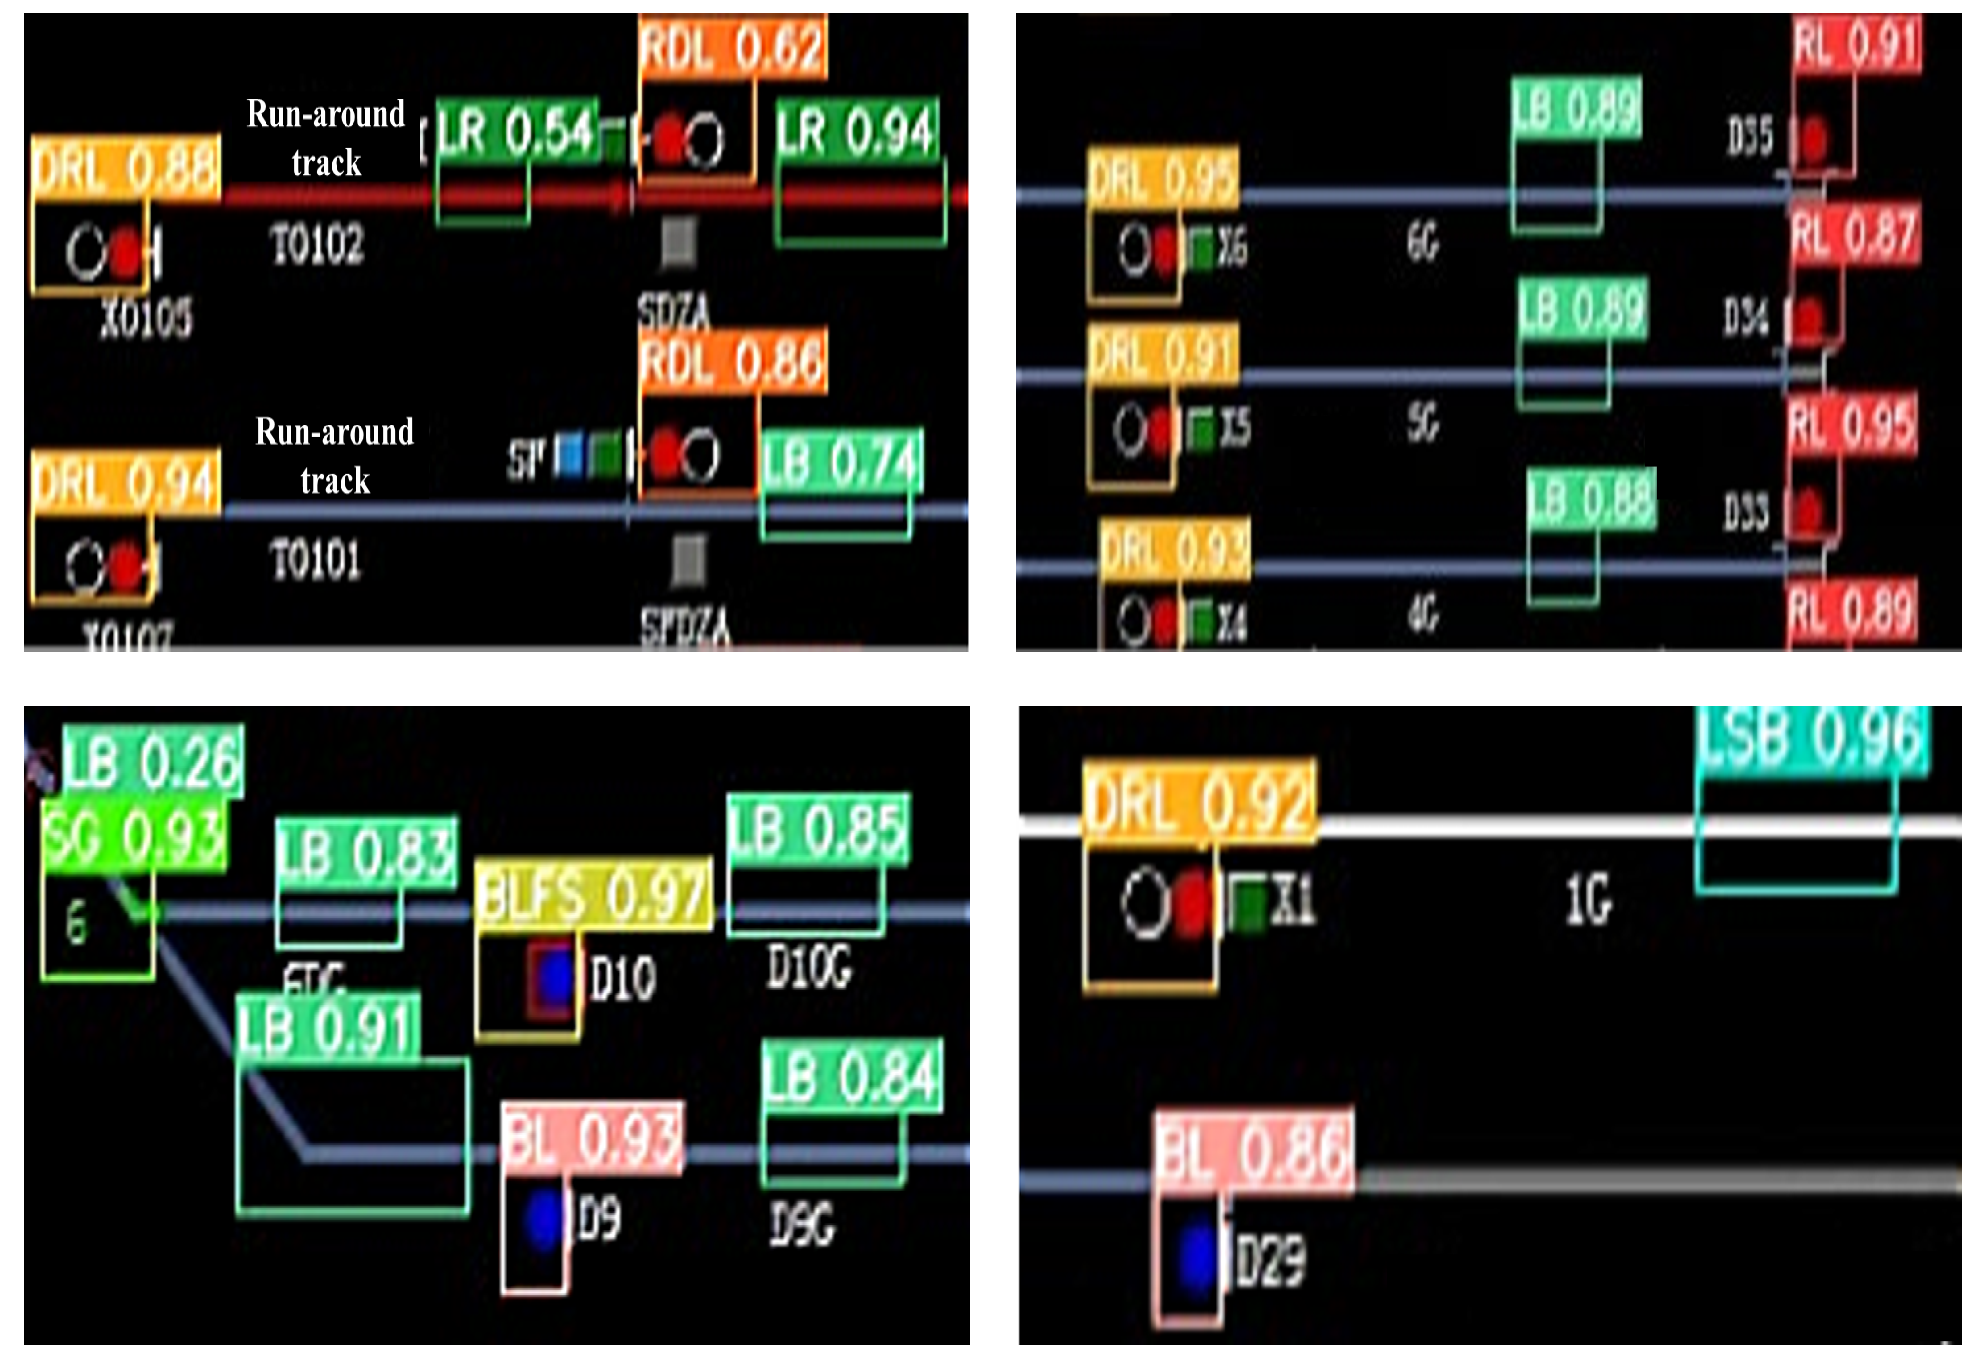
As shown in Figure 8, the original YOLOv8 suffers from noticeable missed detections, especially on turnouts and signaling machines, with relatively low detection confidence. In contrast, Figure 9 shows that the proposed YOLOv8-SFF accurately identifies signaling machines, turnouts and track signals, despite the small size and low resolution of the interlocking signals. These results indicate that the proposed framework can provide valuable signal analysis support for metro dispatching.

7. Discussion

The experimental results demonstrate that the proposed YOLOv8-SFF model significantly outperforms the baseline YOLOv8 model in detecting small-signal targets within metro computer interlocking systems. The substantial improvements in recall (by 25.3%) and mAP@50 (by 11.8%) can be primarily attributed to the architectural enhancements introduced in this study. Specifically, the addition of a small-target detection head effectively mitigates the information loss caused by the small size and low resolution of signal indicators. Furthermore, the incorporation of the SSFF and TFE modules enhances multi-scale feature fusion, allowing the model to preserve fine-grained spatial details that are otherwise easily discarded during deep downsampling operations. The removal of redundant concatenation and upsampling operations not only streamlines the network but also prevents overfitting to irrelevant noise, thereby improving detection efficiency without compromising accuracy. Nevertheless, the increased computational overhead from additional detection heads and modules may pose deployment challenges. Future work should therefore explore lightweight architectures and domain adaptation techniques to enhance robustness under degraded imaging conditions.

8. Conclusions

In this paper, a multi-scale feature fusion target detection model YOLOv8-SFF is proposed specifically for small-signal target detection in metro computer interlocking systems. To address the limitations of the original YOLOv8 model in detecting low-resolution signal targets, we introduced a small-target detection head, integrated SSFF and TFE modules for enhanced feature fusion, and optimized the network structure by removing redundant operations. Experimental results on real-world metro signal data demonstrate that the proposed model achieves an improvement in recall and mAP@50 compared to the baseline YOLOv8 model, effectively mitigating missed detections. Future work will focus on reducing model complexity and validating generalization performance under more diverse and complex operational scenarios.

Author Contributions

Conceptualization, X.X., K.Q. and Y.S.; methodology, X.X. and K.Q.; software, X.X. and Z.L.; validation, X.X., S.X. and Y.S.; formal analysis, X.X. and Y.S.; investigation, X.X., Z.L. and C.Y.; resources, K.Q. and C.Y.; data curation, X.X. and Z.L.; writing—original draft preparation, X.X.; writing—review and editing, S.X., X.X., Y.S., K.Q., Z.L. and C.Y.; visualization, X.X. and S.X.; supervision, K.Q. and Y.S.; project administration, K.Q.; funding acquisition, K.Q. All authors have read and agreed to the published version of the manuscript.

Funding

This research received no external funding.

Institutional Review Board Statement

Not applicable.

Informed Consent Statement

Not applicable.

Data Availability Statement

The data presented in this study are available on request from the corresponding author.

Conflicts of Interest

Author Zhengyan Li was employed by the company Nanjing Kangni Mechanical & Electrical Co., Ltd. Author Chong Yu was employed by the company Nanjing Ruijie Intelligent Transportation Technology Research Institute Co., Ltd. The remaining authors declare that the research was conducted in the absence of any commercial or financial relationships that could be construed as a potential conflict of interest.

Abbreviations

The following abbreviations are used in this manuscript:
YOLOYou Only Look Once
SSFFScale Sequence Feature Fusion
TFETriple Feature Encoding
LAMPLayer-Adaptive Magnitude-based Pruning
CWDChannel-wise Knowledge Distillation
mAPmean Average Precision
FPSFrames Per Second
IoUIntersection over Union
EIoUEfficient Intersection over Union
FPNFeature Pyramid Network
HSVHue, Saturation, Value
HOGHistogram of Oriented Gradients
SIFTScale-Invariant Feature Transform
R-CNNRegion-Based Convolutional Neural Network
SSDSingle Shot MultiBox Detector
RPNRegion Proposal Network
KLKullback–Leibler

References

  1. Huang, L. The past, present and future of railway interlocking system. In Proceedings of the 2020 IEEE 5th International Conference on Intelligent Transportation Engineering (ICITE), Beijing, China, 11–13 September 2020; pp. 170–174. [Google Scholar]
  2. Qian, K.; Tian, L.; Liu, Y.; Wen, X.; Bao, J. Image robust recognition based on feature-entropy-oriented differential fusion capsule network. Appl. Intell. 2021, 51, 1108–1117. [Google Scholar] [CrossRef] [Scilit]
  3. Su, H.; Wen, J. Reliability and safety analysis on railway signal regional computer interlocking system. Int. J. Saf. Secur. Eng. 2014, 4, 315–328. [Google Scholar] [CrossRef] [Scilit]
  4. Shopa, P.; Sumitha, N.; Patra, P.S.K. Traffic sign detection and recognition using OpenCV. In Proceedings of the International Conference on Information Communication and Embedded Systems (ICICES2014), Chennai, India, 27–28 February 2014; pp. 1–6. [Google Scholar]
  5. Ahmed, N.; Rabbi, S.; Rahman, T.; Mia, R.; Rahman, M. Traffic sign detection and recognition model using support vector machine and histogram of oriented gradient. Int. J. Inf. Technol. Comput. Sci. 2021, 13, 61–73. [Google Scholar] [CrossRef] [Scilit]
  6. Girshick, R.; Donahue, J.; Darrell, T.; Malik, J. Rich feature hierarchies for accurate object detection and semantic segmentation. In Proceedings of the IEEE Conference on Computer Vision and Pattern Recognition (CVPR), Columbus, OH, USA, 23–28 June 2014; pp. 580–587. [Google Scholar]
  7. Redmon, J.; Divvala, S.; Girshick, R.; Farhadi, A. You Only Look Once: Unified, Real-Time Object Detection. In Proceedings of the IEEE Conference on Computer Vision and Pattern Recognition (CVPR), Las Vegas, NV, USA, 27–30 June 2016; pp. 779–788. [Google Scholar]
  8. Liu, W.; Anguelov, D.; Erhan, D.; Szegedy, C.; Reed, S.; Fu, C.Y.; Berg, A.C. SSD: Single Shot MultiBox Detector. In Proceedings of the European Conference on Computer Vision (ECCV), Amsterdam, The Netherlands, 11–14 October 2016; pp. 21–37. [Google Scholar]
  9. Qian, K.; Tian, L. A topic-based multi-channel attention model under hybrid mode for image caption. Neural Comput. Appl. 2022, 34, 2207–2216. [Google Scholar] [CrossRef] [Scilit]
  10. Redmon, J.; Farhadi, A. YOLOv3: An Incremental Improvement. arXiv 2018, arXiv:1804.02767. [Google Scholar] [CrossRef] [Scilit]
  11. Jocher, G. YOLO by Ultralytics (Version 5.7.0). GitHub. 2022. Available online: https://github.com/ultralytics/yolov5 (accessed on 1 September 2024).
  12. Bochkovskiy, A.; Wang, C.Y.; Liao, H.Y.M. YOLOv4: Optimal speed and accuracy of object detection. arXiv 2020, arXiv:2004.10934. [Google Scholar]
  13. Jocher, G.; Chaurasia, A.; Qiu, J. YOLO by Ultralytics (Version 8.0.0). GitHub. 2023. Available online: https://github.com/ultralytics/ultralytics (accessed on 1 September 2024).
  14. Lee, J.; Park, S.; Mo, S.; Ahn, S.; Shin, J. Layer-adaptive sparsity for the magnitude-based pruning. In Proceedings of the International Conference on Learning Representations (ICLR), Virtual, 3–7 May 2021. [Google Scholar]
  15. Shu, C.; Liu, Y.; Gao, J.; Yan, Z.; Shen, C. Channel-wise knowledge distillation for dense prediction. In Proceedings of the IEEE/CVF International Conference on Computer Vision (ICCV), Montreal, QC, Canada, 10–17 October 2021; pp. 5311–5320. [Google Scholar]
  16. Kang, M.; Ting, C.M.; Ting, F.F.; Phan, R.C.W. ASF-YOLO: A novel YOLO model with attentional scale sequence fusion for cell instance segmentation. Image Vis. Comput. 2024, 147, 105057. [Google Scholar] [CrossRef] [Scilit]
  17. Yuan, L.; Gan, Q.; Li, K.; Fu, Q. Optimal generation of test sequences for EMU and ATP on-board equipment interface test based on deep learning and genetic algorithm. J. China Railw. Soc. 2018, 40, 7. [Google Scholar] [CrossRef]
  18. Yan, X. Research on Simulation Test Method of Computer Interlocking Software. Master’s Thesis, Beijing Jiaotong University, Beijing, China, 2019. [Google Scholar]
  19. Han, C.; Gao, G.; Zhang, Y. Real-time small traffic sign detection with revised Faster-RCNN. Multimed. Tools Appl. 2019, 78, 13263–13278. [Google Scholar] [CrossRef] [Scilit]
  20. Choodowicz, E.; Lisiecki, P.; Lech, P. Hybrid algorithm for the detection and recognition of railway signs. In Progress in Computer Recognition Systems 11; Springer: Cham, Switzerland, 2020; pp. 337–347. [Google Scholar]
  21. Dewi, C.; Chen, R.C.; Liu, Y.T.; Jiang, X.; Hartomo, K.D. YOLOv4 for advanced traffic sign recognition with synthetic training data generated by various GAN. IEEE Access 2021, 9, 97228–97242. [Google Scholar] [CrossRef] [Scilit]
  22. Zhang, Y.; Guo, Z.; Wu, J.; Tian, Y.; Tang, H.; Guo, X. Real-time vehicle detection based on improved YOLOv5. Sustainability 2022, 14, 12274. [Google Scholar]
  23. Yang, J.; He, W.Y.; Zhang, T.L.; Zhang, C.L.; Zeng, L.; Nan, B.F. Research on subway pedestrian detection algorithms based on SSD model. IET Intell. Transp. Syst. 2020, 14, 1491–1496. [Google Scholar] [CrossRef] [Scilit]
  24. Lin, M.; Li, C.; Bu, X.; Sun, M.; Lin, C.; Yan, J.; Ouyang, W.; Deng, Z. DETR for crowd pedestrian detection. arXiv 2020, arXiv:2012.06785. [Google Scholar]
  25. Han, S.; Pool, J.; Tran, J.; Dally, W.J. Learning both weights and connections for efficient neural networks. In Proceedings of the Advances in Neural Information Processing Systems (NeurIPS), Montreal, QC, Canada, 7–12 December 2015; pp. 1135–1143. [Google Scholar]
  26. Liu, Z.; Li, J.; Shen, Z.; Huang, G.; Yan, S.; Zhang, C. Learning efficient convolutional networks through network slimming. In Proceedings of the IEEE International Conference on Computer Vision (ICCV), Venice, Italy, 22–29 October 2017; pp. 2736–2744. [Google Scholar]
  27. Li, H.; Kadav, A.; Durdanovic, I.; Samet, H.; Graf, H.P. Pruning filters for efficient ConvNets. In Proceedings of the International Conference on Learning Representations (ICLR), Toulon, France, 24–26 April 2017. [Google Scholar]
  28. Hinton, G.; Vinyals, O.; Dean, J. Distilling the knowledge in a neural network. arXiv 2015, arXiv:1503.02531. [Google Scholar] [CrossRef] [Scilit]
  29. Chen, X.; Li, Q. Image recognition and analysis of computer interlock interface based on OpenCV technology. In Proceedings of the 2024 IEEE 6th Advanced Information Management, Communications, Electronic and Automation Control Conference (IMCEC), Chongqing, China, 24–26 May 2024; pp. 1318–1321. [Google Scholar]
  30. Zhang, H.; Kuang, W. Computer interlocking host computer recognition based on OpenCV and neural network. In Proceedings of the 2024 IEEE 6th Advanced Information Management, Communications, Electronic and Automation Control Conference (IMCEC), Chongqing, China, 24–26 May 2024; pp. 1171–1174. [Google Scholar]
  31. Cheng, H.; He, T.; Tian, R. Research on the application of YOLOv5 in station interlocking test. In Proceedings of the Third International Conference on Image Processing and Intelligent Control (IPIC 2023), Kuala Lumpur, Malaysia, 5–7 May 2023; Volume 12782, pp. 245–250. [Google Scholar]
  32. Rezatofighi, H.; Tsoi, N.; Gwak, J.; Sadeghian, A.; Reid, I.; Savarese, S. Generalized intersection over union: A metric and a loss for bounding box regression. In Proceedings of the IEEE/CVF Conference on Computer Vision and Pattern Recognition (CVPR), Long Beach, CA, USA, 15–20 June 2019; pp. 658–666. [Google Scholar]
  33. Zheng, Z.; Wang, P.; Liu, W.; Li, J.; Ye, R.; Ren, D. Distance-IoU loss: Faster and better learning for bounding box regression. Proc. AAAI Conf. Artif. Intell. 2020, 34, 12993–13000. [Google Scholar] [CrossRef] [Scilit]
  34. Zhang, Y.F.; Ren, W.; Zhang, Z.; Jia, Z.; Wang, L.; Tan, T. Focal and efficient IOU loss for accurate bounding box regression. Neurocomputing 2022, 506, 146–157. [Google Scholar] [CrossRef] [Scilit]
Figure 1. Manually operated physical metro computer interlocking occupancy panels. Colored dots and blocks denote different signal and track states.
Applsci 16 05452 g001
Figure 2. Display interface of the Metro Computer Interlocking System. Colored dots and blocks denote different signal and track states.
Applsci 16 05452 g002
Figure 3. Overall architecture of the proposed YOLOv8-SFF detector. The CSPDarkNet-53 backbone (left) produces five hierarchical feature maps P1–P5 at strides 2, 4, 8, 16 and 32 terminated by an SPPF block at P5; the neck fuses these features through two SSFF blocks and two TFE blocks, terminating in four detection heads at strides 4, 8, 16 and 32. The stride-4 head (P2) is the small-target detection layer added in this work. The two TFE blocks replace conventional concatenation–upsampling operations at the P3 and P4 levels, reducing parameter count while preserving multi-scale representation. C2f, Conv and Concat operators are inherited from the original YOLOv8. Blocks of different colors denote the backbone, neck modules (SSFF and TFE), and detection heads, respectively.
Applsci 16 05452 g003
Figure 4. Sketch of the YOLOv8 network structure with small target detection layer.
Applsci 16 05452 g004
Figure 5. Scale Sequence Feature Fusion (SSFF) module: three pyramid-level feature maps p 3 , p 4 , p 5 are first re-aligned to a common resolution by nearest-neighbour interpolation, smoothed by a sequence of 2D Gaussian filters of progressively larger standard deviation (Equations (1) and (2)), stacked along an auxiliary scale axis into a 3D tensor, and processed by a 3D convolution followed by BatchNorm + LeakyReLU + 3D-max-pooling to extract scale-sequential features at the highest input resolution.
Applsci 16 05452 g005
Figure 6. Triple Feature Encoder (TFE) module: Large, Medium and Small feature maps from consecutive pyramid scales are merged at the Medium resolution. A 1 × 1 convolution re-projects the Large branch to 1 C channels and a hybrid max + average pooling block downsamples it; the Small branch is re-projected and upsampled by nearest-neighbour interpolation. The three aligned branches are concatenated along the channel dimension into F T F E (Equation (3)), reducing explicit upsampling operations relative to the conventional YOLOv8 neck.
Applsci 16 05452 g006
Figure 7. Normalised confusion matrix of the proposed YOLOv8-SFF on the held-out test set; each column is normalised to sum to one along the true-class axis, so each on-diagonal entry directly reads as the per-class recall. The off-diagonal entries quantify the proportion of cross-class confusions, and the “background” row/column captures the false-negative (missed-detection) and false-positive (spurious-detection) profiles, respectively. The matrix is rendered for the SFF seed-0 run; per-class recall varies by at most 0.5 pp across the three random seeds reported in Table 3.
Applsci 16 05452 g007
Figure 8. Detection results of the original YOLOv8. Bounding boxes of different colors indicate detected signal categories.
Applsci 16 05452 g008
Figure 9. Detection results of YOLOv8-SFF. Bounding boxes of different colors indicate detected signal categories.
Applsci 16 05452 g009
Table 1. Signal classification and its legend.
Signal TypeDisplay LegendClassification NameFunction Description
Shunting SignalApplsci 16 05452 i001RLProhibit shunting
Applsci 16 05452 i002BLSuspend shunting
Entry/Exit SignalApplsci 16 05452 i003BLFSBlocking
Applsci 16 05452 i004RDLProhibit inbound
Applsci 16 05452 i005DRLOutbound prohibited
TurnoutsApplsci 16 05452 i006SGPositioning
Applsci 16 05452 i007SYReverse Positioning
Track LinesApplsci 16 05452 i008LBIdle
Applsci 16 05452 i009LROccupied
Applsci 16 05452 i010LSBIncoming
Table 2. Component-wise ablation on the validation set. The proposed YOLOv8-SFF (Row 8, shaded in blue) integrates all three components and corresponds to the YOLOv8-ASF-P2 configuration. Parameters and GFLOPs are deterministic and reported once for the deployed model. Detection metrics are reported as mean ± standard deviation across three independent training runs with random seeds { 0 , 1 , 42 } and otherwise-identical hyperparameters. Bold indicates the highest mean value in each metric column; differences within one standard deviation are statistically equivalent. The italic mAP@50 column marks the primary evaluation metric (see Section 6.2). In the header, “#” denotes the configuration index and a checkmark (✔) indicates the inclusion of the corresponding component.
#P2SSFFTFEParams (M)GFLOPsmAP@50 (%)P (%)R (%)
13.018.187.37 ± 1.3991.65 ± 0.7075.33 ± 3.76
22.9212.298.63 ± 0.0897.70 ± 0.3397.19 ± 0.36
33.048.387.53 ± 0.6391.73 ± 1.6776.16 ± 2.70
43.028.387.43 ± 0.6892.77 ± 0.8674.27 ± 1.17
52.4611.898.64 ± 0.0297.69 ± 0.4097.25 ± 0.13
62.4511.598.52 ± 0.0497.51 ± 0.4597.15 ± 0.32
73.058.586.85 ± 0.3293.22 ± 0.4573.76 ± 0.84
82.4912.098.66 ± 0.0897.24 ± 0.4897.39 ± 0.09
Table 3. Held-out test-set verification of the eight ablation configurations. The proposed YOLOv8-SFF (Row 8, shaded in blue) was never exposed to the test set during training or model selection. Metrics are reported as mean ± standard deviation across three independent training runs with random seeds { 0 , 1 , 42 } and otherwise-identical hyperparameters. Bold indicates the highest mean value in each metric column (ties on the rounded mean are both bolded); differences within one standard deviation are statistically equivalent. The italic mAP@50 column marks the primary evaluation metric (see Section 6.2). In the header, “#” denotes the configuration index and a checkmark (✔) indicates the inclusion of the corresponding component.
#P2SSFFTFEmAP@50 (%)mAP@50:95 (%)P (%)R (%)
187.20 ± 1.3370.36 ± 1.3191.64 ± 1.8474.90 ± 3.92
298.67 ± 0.0386.86 ± 0.3997.61 ± 0.3397.36 ± 0.27
387.32 ± 0.8971.06 ± 1.3090.84 ± 2.0975.71 ± 3.12
487.30 ± 0.5869.29 ± 0.7193.46 ± 0.0673.81 ± 0.78
598.65 ± 0.0286.70 ± 0.1097.63 ± 0.4097.47 ± 0.07
698.53 ± 0.0685.62 ± 0.1897.63 ± 0.4497.20 ± 0.36
786.63 ± 0.4669.68 ± 0.4493.19 ± 0.7872.65 ± 0.45
898.67 ± 0.0486.74 ± 0.1097.45 ± 0.1297.36 ± 0.23
Table 4. Comparison experiment results. YOLOv8-SFF metrics are the mean across three random seeds { 0 , 1 , 42 } (per-seed standard deviation 0.1 pp, see Table 2); the four baseline detectors are single-run as published. The proposed YOLOv8-SFF row is shown in bold to highlight the proposed method.
ModelP (%)R (%)mAP50 (%)ParametersFPSModel Size (MB)
YOLOv5n72.882.383.71,777,44742.923.8
YOLOv7-tiny65.370.864.56,039,34262.8912.3
YOLOv9-tiny90.674.286.42,620,46025.386.1
RT-DETR-tiny99.199.299.319,884,60017.3040.5
YOLOv8-SFF97.297.498.72,490,48860.405.1
Table 5. Results of LAMP pruning on YOLOv8-SFF (no distillation). Speedup denotes the target compression level specified to the pruning tool; the Speedup = 1.0 configuration corresponds to the mildest pruning setting rather than no pruning.
SpeedupP (%)R (%)mAP50 (%)FPSParametersGFLOPsModel Size (MB)
1.054.360.357.644.8933,3877.92.2
1.542.434.833.046.1575,8756.01.5
2.019.27.411.347.9433,0174.81.2
2.510.50.70.248.2345,0224.01.1
Table 6. Results after CWD distillation on the LAMP-pruned YOLOv8-SFF. Speedup denotes the target compression level specified to the pruning tool; the Speedup = 1.0 configuration corresponds to the mildest pruning setting rather than no pruning. The finally adopted deployment configuration (Speedup = 2.5 ) is shown in bold.
SpeedupP (%)R (%)mAP50 (%)FPSParametersGFLOPsModel Size (MB)
Baseline98.096.698.260.42,490,48812.05.1
1.097.997.698.756.6929,9057.92.2
1.597.297.798.658.2573,1106.01.5
2.096.897.098.560.9430,6154.71.2
2.596.596.898.061.0342,8753.91.1
Disclaimer/Publisher’s Note: The statements, opinions and data contained in all publications are solely those of the individual author(s) and contributor(s) and not of MDPI and/or the editor(s). MDPI and/or the editor(s) disclaim responsibility for any injury to people or property resulting from any ideas, methods, instructions or products referred to in the content.