Article

Characterization of Dough Rheological Properties and Bread Quality from Different Triticale Varieties and Fermented Dark Brewers’ Spent Grain


by
Aliona Ghendov-Mosanu
1,
Iurie Rumeus
1,2,
Sorina Ropciuc
3,
Olesea Saitan
1,
Viorica Bulgaru
1,
Svetlana Leatamborg
4,
Galina Lupascu
4 and
Georgiana Gabriela Codină
3,*
1
Faculty of Food Technology, Technical University of Moldova, 9/9 Studentilor St., MD-2045 Chisinau, Moldova
2
Bogdan Petriceicu Hașdeu University Center of Cahul, Technical University of Moldova, MD-3909 Chisinau, Moldova
3
Faculty of Food Engineering, “Stefan cel Mare” University, 720229 Suceava, Romania
4
Applied Genetics Laboratory, Institute of Genetics, Physiology and Plant Protection, Moldova State University, 20 Padurii St., MD-2002 Chisinau, Moldova
*
Author to whom correspondence should be addressed.
Appl. Sci. 2026, 16(11), 5407; https://doi.org/10.3390/app16115407 (registering DOI)
Submission received: 25 April 2026 / Revised: 22 May 2026 / Accepted: 25 May 2026 / Published: 28 May 2026

Abstract

Triticale grains and brewers’ spent grain (BSG) offer promising, sustainable ingredients for bread development, as triticale adapts well to climate change and BSG is a low-cost by-product supporting zero-waste goals. This study evaluated the rheological properties of dough and bread quality obtained from seven triticale cultivars (Ingen 35, Ingen 93, Ingen 40, Ingen 33, Ingen 54, Costel, and Fanica) grown in the Republic of Moldova, with the addition of 5% and 10% fermented dark BSG (BSGF). BSGF incorporation decreased dough stability and protein network strength, as indicated by Mixolab parameters, while the pasting properties varied according to the cultivar. Dynamic rheology showed reductions in storage (G′) and loss (G″) moduli, with tan δ < 1 for all samples. Increasing BSGF levels reduced falling number, Alveograph tenacity, extensibility, baking strength, and Rheofermentometer parameters. In bread, BSGF addition decreased loaf volume and porosity while significantly increasing acidity. Color analysis showed reduced lightness (L*) and increased redness (a*). Texture profile analysis indicated increased hardness and adhesiveness, with stable cohesiveness and reduced resilience. Sensory evaluation revealed improved color and a “hearty” texture at 5% inclusion, whereas 10% resulted in a denser structure and lower acceptability. BSGF significantly influenced the rheological, physicochemical, and sensory properties of triticale bread, highlighting the need for formulation optimization.

1. Introduction

Triticale is a hybrid of rye (Secale cereale) and wheat (Triticum aestivum), combining the grain quality and yield potential of wheat with the environmental tolerance of rye. Due to its exceptional adaptability, high nutritional value, and resilience to environmental stress, it is widely regarded as a promising cereal crop for sustainable and climate-resilient agriculture [1]. In 2022, according to FAOSTAT, 3.6 million hectares of triticale were cultivated, with a total production of around 14.2 million tons and a yield of 3.9 tons/ha. Europe provides nearly 80% of total triticale production globally, with Poland, Belarus, France and Germany being the main producers [2]. Triticale is mainly used in agriculture as fodder and green fodder and as a grain for the production of flour, with uses in obtaining food products [3]. The best results have been obtained in feed for poultry (turkeys and chickens) and dairy cattle, with triticale grains recommended to replace 50% of conventional feeds [4]. The specialized literature provides us with the results of research on the growing conditions of triticale and its uses for animal feed, but fewer results are available on the use of triticale in human nutrition [4,5]. With a chemical composition similar to that of wheat, it is used in the feed of various fish species [6]. There has also been an increased interest in obtaining biofuels, biomaterials and bio compositions based on triticale [3].
In the production of bakery products, its limitation is hindered by the quantitative and qualitative insufficiency of gluten, high levels of alpha-amylase activity and low rheological properties of the dough, which is why triticale flour is particularly indicated for the production of unleavened dough products [7]. Compared to wheat gluten, triticale gluten is much more difficult to wash due to the high content of pentosans in triticale flour. Triticale gluten has similar characteristics to washed gluten from low-quality wheat grains; it is inflexible, hard and easy to break [8]. Triticale dough also has higher stickiness and lower water absorption capacity than wheat dough, as well as shorter development times, reduced mixing tolerance, reduced stability and lower dough strength. Also, due to the higher activity of α-amylase, the dough has lower viscosity, resulting in lower quality bread [9,10]. Due to its lower popularity compared to wheat bread, triticale bread is less well known, and its potential nutritional benefits are underestimated [8]. There are also few studies in the literature on the use of triticale for bread-making [11] and even fewer for the use of brewers’ spent grain (BSG) as an ingredient for the development of new bread products obtained from triticale flour. In 2024, worldwide beer production was 1.83 billion hectoliters [12]. Almost 20 kg of wet BSG is generated for every 100 L of beer produced. This accounts for 85% of beer production waste and is the largest amount by mass [13]. Now, BSG is mainly used for animal feed, with only a small amount for biogas production. The high nutritional value of BSG makes it an excellent ingredient for bread-making. It contains dietary fibers like β-glucan and arabinoxylan, polyphenols like ferulic acid and hydroxycinnamic acid, and minerals such as magnesium, calcium, phosphorus, iron and protein [14]. Proteins include globulin, albumin, hordein and glutelin, which have antioxidative and anti-inflammatory health effects [15]. It is high in lysine in contrast with other cereals, which makes it valuable for use in bread-making [16]. Different studies have reported that BSG addition to bread recipes significantly affects bread quality [17]. However, these studies have been conducted only on bread made from wheat flour, and, to the best of our knowledge, no research has yet been carried out on bread made from triticale flour. The use of BSG in wheat flour up to 20% (w/w) resulted in only minor changes in bread volume, whereas additions exceeding 20% significantly decreased bread height and volume, suggesting that 10–20% BSG is the optimal level for maintaining product quality while improving nutritional value [18]. Sourdough bread with the same amount of BSG had a higher specific volume but a smaller one than the control sample. Crumb hardness presented higher values with increasing amounts of BSG (10, 15, and 20%) incorporated in the bread recipe [19]. Even when BSG was incorporated in a fermented form, the crumb hardness increased [20]. From the sensory point of view, bread with 10% BSG addition led to a decrease in general acceptability compared to the control sample, whereas the bread aroma was not significantly different between the compared samples [21]. Sourdough BSG bread had better appearance, acceptability, taste, flavor, and texture, with better results for lower substitution levels (5%) than for higher ones (15%). Higher substitution amounts of 15% and 20% in wheat flour significantly negatively affect all bread quality characteristics [22]. The use of BSG in a fermented form can improve bread final characteristics [23,24]. However, if amounts incorporated into the bread recipe are too high, bread quality characteristics worsen. As far as we know, this is the first study investigating the use of fermented dark brewers’ spent grain (BSG) in bread from various triticale varieties. The present study extends our earlier research on the effects of another type of BSG (light BSG) [25] on dough rheological properties. Moreover, this is the first study to analyze the impact of fermented BSG on the bread quality of different triticale varieties.

2. Materials and Methods

2.1. Triticale Samples

The different varieties of triticale samples (Ingen 35, Ingen 93, Ingen 40, Ingen 33, Ingen 54, Costel, Fanica) were cultivated in the Republic of Moldova (harvest 2023). These seven triticale varieties are officially approved for cultivation in the Republic of Moldova by the State Commission for Testing Plant Varieties. The triticale grains were ground in a LabMill 3100 (Perten Instruments, Hägersten, Sweden) and were analyzed for their chemical data according to ICC standard methods 104/1, 105/2, ICC136, ICC 110/1 and 137/1 [26]. The triticale varieties presented the fallowing data: 1.53–1.73% for ash content, 13.08–14.78% for protein content, 1.30–1.65% for fat content, 12.03–12.25% for moisture content and 18.51–27.45% for wet gluten content. The chemical composition of these triticale flours may be seen in extenso for each triticale variety in our previously published article by Codină et al. [27].

2.2. Brewers’ Spent Grain Sourdough Fermentation

Brewers’ spent grain (BSG), a by-product of dark beer production based on barley malt, was provided by Î.M. “Efes Vitanta Moldova Brewery” S.A., Chisinau, Republic of Moldova. This brewery produces beer from malt, hops, yeast, and water and utilizes barley as a principal brewing raw material. The BSG was dried at 40 ± 1 °C until its moisture content reached a value of 6.3 ± 0.1% and analyzed by using the ICC 110/1 standard method [26]. After drying, the material was ground using a 3100 mill feeder (Perten Instruments, Segeltorp, Sweden) and stored in polyethylene bags at an ambient temperature (20 °C) until used to obtain sourdough. The BSG presented the following data: 18.53 ± 0.2% for protein content, 7.43 ± 0.1% for fat content and 4.28 ± 0.1% for ash content, determined according to ICC standard methods 105/2, ICC 136 and 104/1.
For fermentation, 75 g of BSG flour was combined with 200 mL of water and 25 g of triticale flour to obtain a liquid dough. The mixture was incubated in a proofing chamber set at 30 ± 1 °C with 85% relative humidity for 24 h. The dough was then refreshed every 24 h by incorporating a mixture of 100 g of fermented dough, 200 g of flour, and 200 mL of water. This process was repeated until the dough had a pH of 3.78 ± 0.01, analyzed using an HQ30d portable pH meter (HACH, Loveland, CO, USA), and an acidity of 8–10°, determined according to standard method 90:2007 [28]. Two different BSF levels of 5 and 10% were incorporated in the triticale flour in order to evaluate their impact on dough behavior and bread quality. For each triticale variety, a control bread (0% BSGF addition) was prepared and used as a reference for comparison with the BSGF-enriched formulations.

2.3. Determination of Dough Rheological Properties During Mixing and Pasting

Dough rheological properties during mixing and pasting were determined with a Mixolab device (KPM, Tripette et Renaud, Paris, France) according to the standard method ICC No. 173. Mixolab analyzed the C1–C5 torque values that correspond to the optimum dough consistency (C1), protein weakening (C2), starch gelatinization (C3), stability of hot starch paste (C4) and final starch paste viscosity after cooling (C5). During mixing, water absorption (WA), which represents the amount of water required to obtain a C1 torque, dough stability (ST) and dough development time (DDT), was determined. The differences between Mixolab torques C1 and C2 (C12), C2 and C3 (C32), C3 and C4 (C34), and C4 and C5 (C54) offer information related to protein weakening, starch gelatinization, amylolytic activity and starch gelling.

2.4. Determination of Fundamental Dough Rheological Properties

Oscillatory tests were determined using a HAAKE MARS 40 rheometer (Termo-HAAKE, Karlsruhe, Germany). For this purpose, a parallel plate geometry of 40 mm with a 2 mm gap was used. Before analysis, the samples were rested for 10 min, allowing the dough to relax. Frequency sweep tests from 1 to 20 Hz were performed within the linear viscoelastic region to analyze the loss (G″), storage (G′) and loss tangent (tan δ).

2.5. Determination of Dough Rheological Properties During Extension

Dough rheological values during extension were determined using an Alveograph (KPM, Tripette et Renaud, Paris, France) according to the ICC 121 standard method [26]. The parameters analyzed were dough extensibility (L), baking strength (W), maximum pressure (P), the configuration ratio of the Alveograph and the index of swelling (G).

2.6. Dough Rheological Properties During Fermentation and Falling Number Values

Dough rheological values during fermentation were determined using an Rheofermentometer (KPM, Tripette et Renaud, Paris, France). The dough was formed from 250 g of triticale flour, brewers’ spent grain sourdough, 3 g of dry yeast of the Saccharomyces cerevisiae type and 5 g of salt. The values analyzed were total CO2 volume production (VT, mL), the maximum height of gaseous production (H’m, mm), the volume of the gas retained in the dough at the end of the test (VR, mL) and the retention coefficient (CR, %).

2.7. Bread-Making

The bread samples were prepared using the direct dough method. The ingredients—salt, compressed yeast (Saccharomyces cerevisiae), triticale flour, water, and brewers’ spent grain sourdough—were mixed for 10–15 min using a laboratory mixer (KitchenAid, Whirlpool Corporation, Benton Harbor, MI, USA). Samples were prepared with and without the addition of sourdough. The addition of brewers’ spent grain sourdough was 5 and 10% of the flour mass. Fermentation was carried out in a Cooper 72B chamber (Europe SRL, Malo (VI), Italy) at 30 ± 1 °C for 120 ± 5 min. The fermented dough was then divided into 400 g pieces, formed into oblong shapes, placed in metal rectangular molds for baking, and proofed at 38 ± 1 °C and 80–85% relative humidity for 50 min. In the first phase of baking, the dough pieces were steamed and then baked in a Cooper 72B oven (Europe SRL, Malo (VI), Italy) at 190 ± 10 °C for 50–60 min. Once cooled to 20 ± 1 °C, the bread samples were subjected to quality analysis.

2.8. Bread Chemical and Physical Characteristics

The bread loaf volume, porosity, elasticity and acidity were determined according to the SR 91:2007 standard method [29]. The color parameters of the bread samples were determined using a Konica Minolta CR-400 colorimeter (Konica Minolta, Inc., Tokyo, Japan) based on the CIELab system. The analysis was focused on determining points in the L* (lightness/darkness), a* (red/green chromaticity), and b* (yellow/blue chromaticity) coordinates. Measurements were conducted across the UV-Vis electromagnetic absorption spectrum.

2.9. Texture Profile Analysis

The textural properties of the bread samples—specifically, hardness, adhesivity, cohesiveness, resilience, and chewiness—were evaluated using a Stable Micro Systems TA.HD plus C texture analyzer (Godalming, Surrey, UK). Bread slices (20 × 20 mm) underwent a double compression cycle using a P/75 stainless steel plate. The analysis was conducted under the following parameters: a pre-test speed of 100 mm/s, test and post-test speeds of 5 mm/s, and a 5 kg load cell.

2.10. Sensory Analysis

The sensory characteristics of bread samples produced from different triticale varieties, with and without dark brewer’s spent grain sourdough, were evaluated at the Department of Food Technology, Technical University of Moldova, according to ISO 6658:2017 [30] and the IFST Guide for Ethical and Professional Practices in Food Sensory Analysis. Nine semi-trained participants (students and academic staff; 7 women and 2 men), aged 23–52 years, participated in the study. All participants provided written informed consent prior to participation, in accordance with the approval of the Ethics Committee of the Technical University of Moldova (decision no. 35/10 April 2025). Each sample was analyzed in duplicate under controlled laboratory sensory conditions compliant with ISO 8589 [31]. Sensory attributes, including appearance, color, taste, odor, texture, and aroma, were evaluated using a 9-point hedonic scale.

2.11. Statistical Analysis

Data were analyzed using a two-way analysis of variance (ANOVA), with triticale variety and BSF concentration as the two independent factors. Upon finding a significant interaction between the factors (p < 0.05), simple main effects were analyzed. This involved performing a one-way ANOVA followed by Tukey’s HSD post hoc test for each variety separately to evaluate the specific impact of BSF concentration levels (0, 5, and 10%) and determine significant differences (p < 0.05). All calculations were performed using Statgraphics Centurion XVI (Statgraphics Technologies, Inc., The Plains, VA, USA).

3. Results and Discussion

3.1. Dough Rheological Properties During Mixing and Pasting

The Mixolab data are shown in Table 1. As can be seen, the water absorption values ranged between 57.5 and 60.2%, with the lowest value for Ingen 40 and the highest one for the Fanica variety. BSF incorporation in the dough recipe did not significantly affect water absorption values, indicating that it may be incorporated into bread-making without major adjustments in dough hydration, which is advantageous for bakery processing. These data are in disagreement with those reported by Ghendov-Mosanu et al. [25], who reported a significant decrease in WA values when BSF from light beer production was incorporated in the dough recipe. In our study, BSG was obtained from dark beer production, which is characterized by a higher fiber content due to the use of roasted malts. Fibers such as β-glucans, cellulose, and hemicellulose from BSG have a strong water-binding capacity, which tends to increase WA [32,33]. At the same time, the BSG was fermented, which partially hydrolyzes some fibers and reduces their water-binding potential. Additionally, only a low percentage of BSF (5–10%) was used, which limits its overall impact on the dough water absorption values. From some triticale varieties, such as Ingen 93, a slight increase in WA values can be seen, probably due to the fiber content from the BSG composition; this is in agreement with the data reported by Aprodu et al. [19]. In general, dough stability (ST) decreased when BSF was incorporated in the wheat flour, probably due to gluten dilution, which reduces the dough’s tolerance to mixing, whereas dough development time (DDT) increased. These data are in agreement with those reported by others [19,23,24,34], explaining that this behavior is due to the different composition of BSG with respect to the flour. Triticale quality variation and BSF composition (mainly the amount of non-starch polysaccharide), molecular size of their compounds and solubility may impact dough properties in different ways [35]. During heating, C2 torque values decreased with increasing BSF addition to triticale flour. This may be due to the fact that BSF partially replaces the triticale flour, leading to the dilution of gluten proteins, which reduces the structural integrity of the protein network.
Also, the fiber content from BSF may compete with gluten for water, limiting hydration and weakening the dough matrix. Moreover, through BSG fermentation, the proteolytic activity from the dough system may increase; this is reflected by a general increase in C12 values, which partially hydrolyzes triticale proteins, contributing to protein weakening and therefore to a decrease in C2 values. These data are in agreement with those reported by Ghendov-Mosanu et al. [25] after incorporating BSF from light beer production in a dough recipe. The Mixolab torque related to starch gelatinization process C3 generally decreased with BSF addition to the dough recipe for most triticale flours (Ingen35, Ingen54, Costel, Fanica, Ingen 40), while for triticale varieties Ingen33 and Ingen93, C3 values showed reduced or less consistent changes. The decrease in C3 values may be related to the fiber content from BSF, which competes with starch for water. This limits the availability of free water for starch granules to swell, resulting in a lower viscosity of dough during the starch gelatinization stage [36]. Moreover, the starch compound from the dough system decreased due to BSF addition and α-amylase activity increase, which act on starch structure. The starch gelatinization speed, which is reflected by C32 values, decreased for all the samples except the Ingen 33 and Ingen 93 varieties. This behavior may be related to different factors such as triticale variety composition, α-amylase activity impact, etc. Triticale flours with stronger gluten or higher starch integrity and dough systems with lower α-amylase activity will have lower dextrin content and a more intact starch with higher resistance to gelatinization during heating [37,38]. For most triticale varieties, BSF addition led to an increase in the stability of the hot starch paste (C4) and final starch paste viscosity after cooling (C5), probably due to the fiber content of BSF, such as cellulose and hemicellulose, which can limit starch swelling and restrict enzymatic access to gelatinized starch, resulting in higher C4 torque values during the heating stage. A similar observation was reported by others when wheat flours were replaced with dietary fiber such as cellulose, pea hull fiber, and sugar beet fiber [33,37]. However, in some triticale varieties such as Costel and Fanica, the addition of 5% BSF caused a decrease in C4 and C5, followed by an increase at a 10% substitution level. This behavior may be related to the dilution of starch content and an increase in enzymatic activity from the dough system, which can favor starch degradation during heating [25]. At higher substitution levels (10%), the structural contribution of dietary fibers may become dominant, stabilizing the gelatinized starch network and increasing C4 and C5 values. This behavior was accompanied by a C34 decrease, which indicates lower starch degradation during heating. Also, except for the Ingen 54 variety, the C54 values decreased, which indicates lower starch retrogradation and therefore a slower bread staling process. The decrease in C54 values observed for most BSG-enriched formulations suggests a reduced tendency for starch retrogradation, which may contribute to delayed staling. This effect may be associated with residual carbohydrate fractions, such as oligosaccharides and dextrin-like compounds, present in brewer’s spent grain together with its high water-holding capacity. Consequently, fermented BSG may contribute to delayed crumb firming and bread staling during storage.

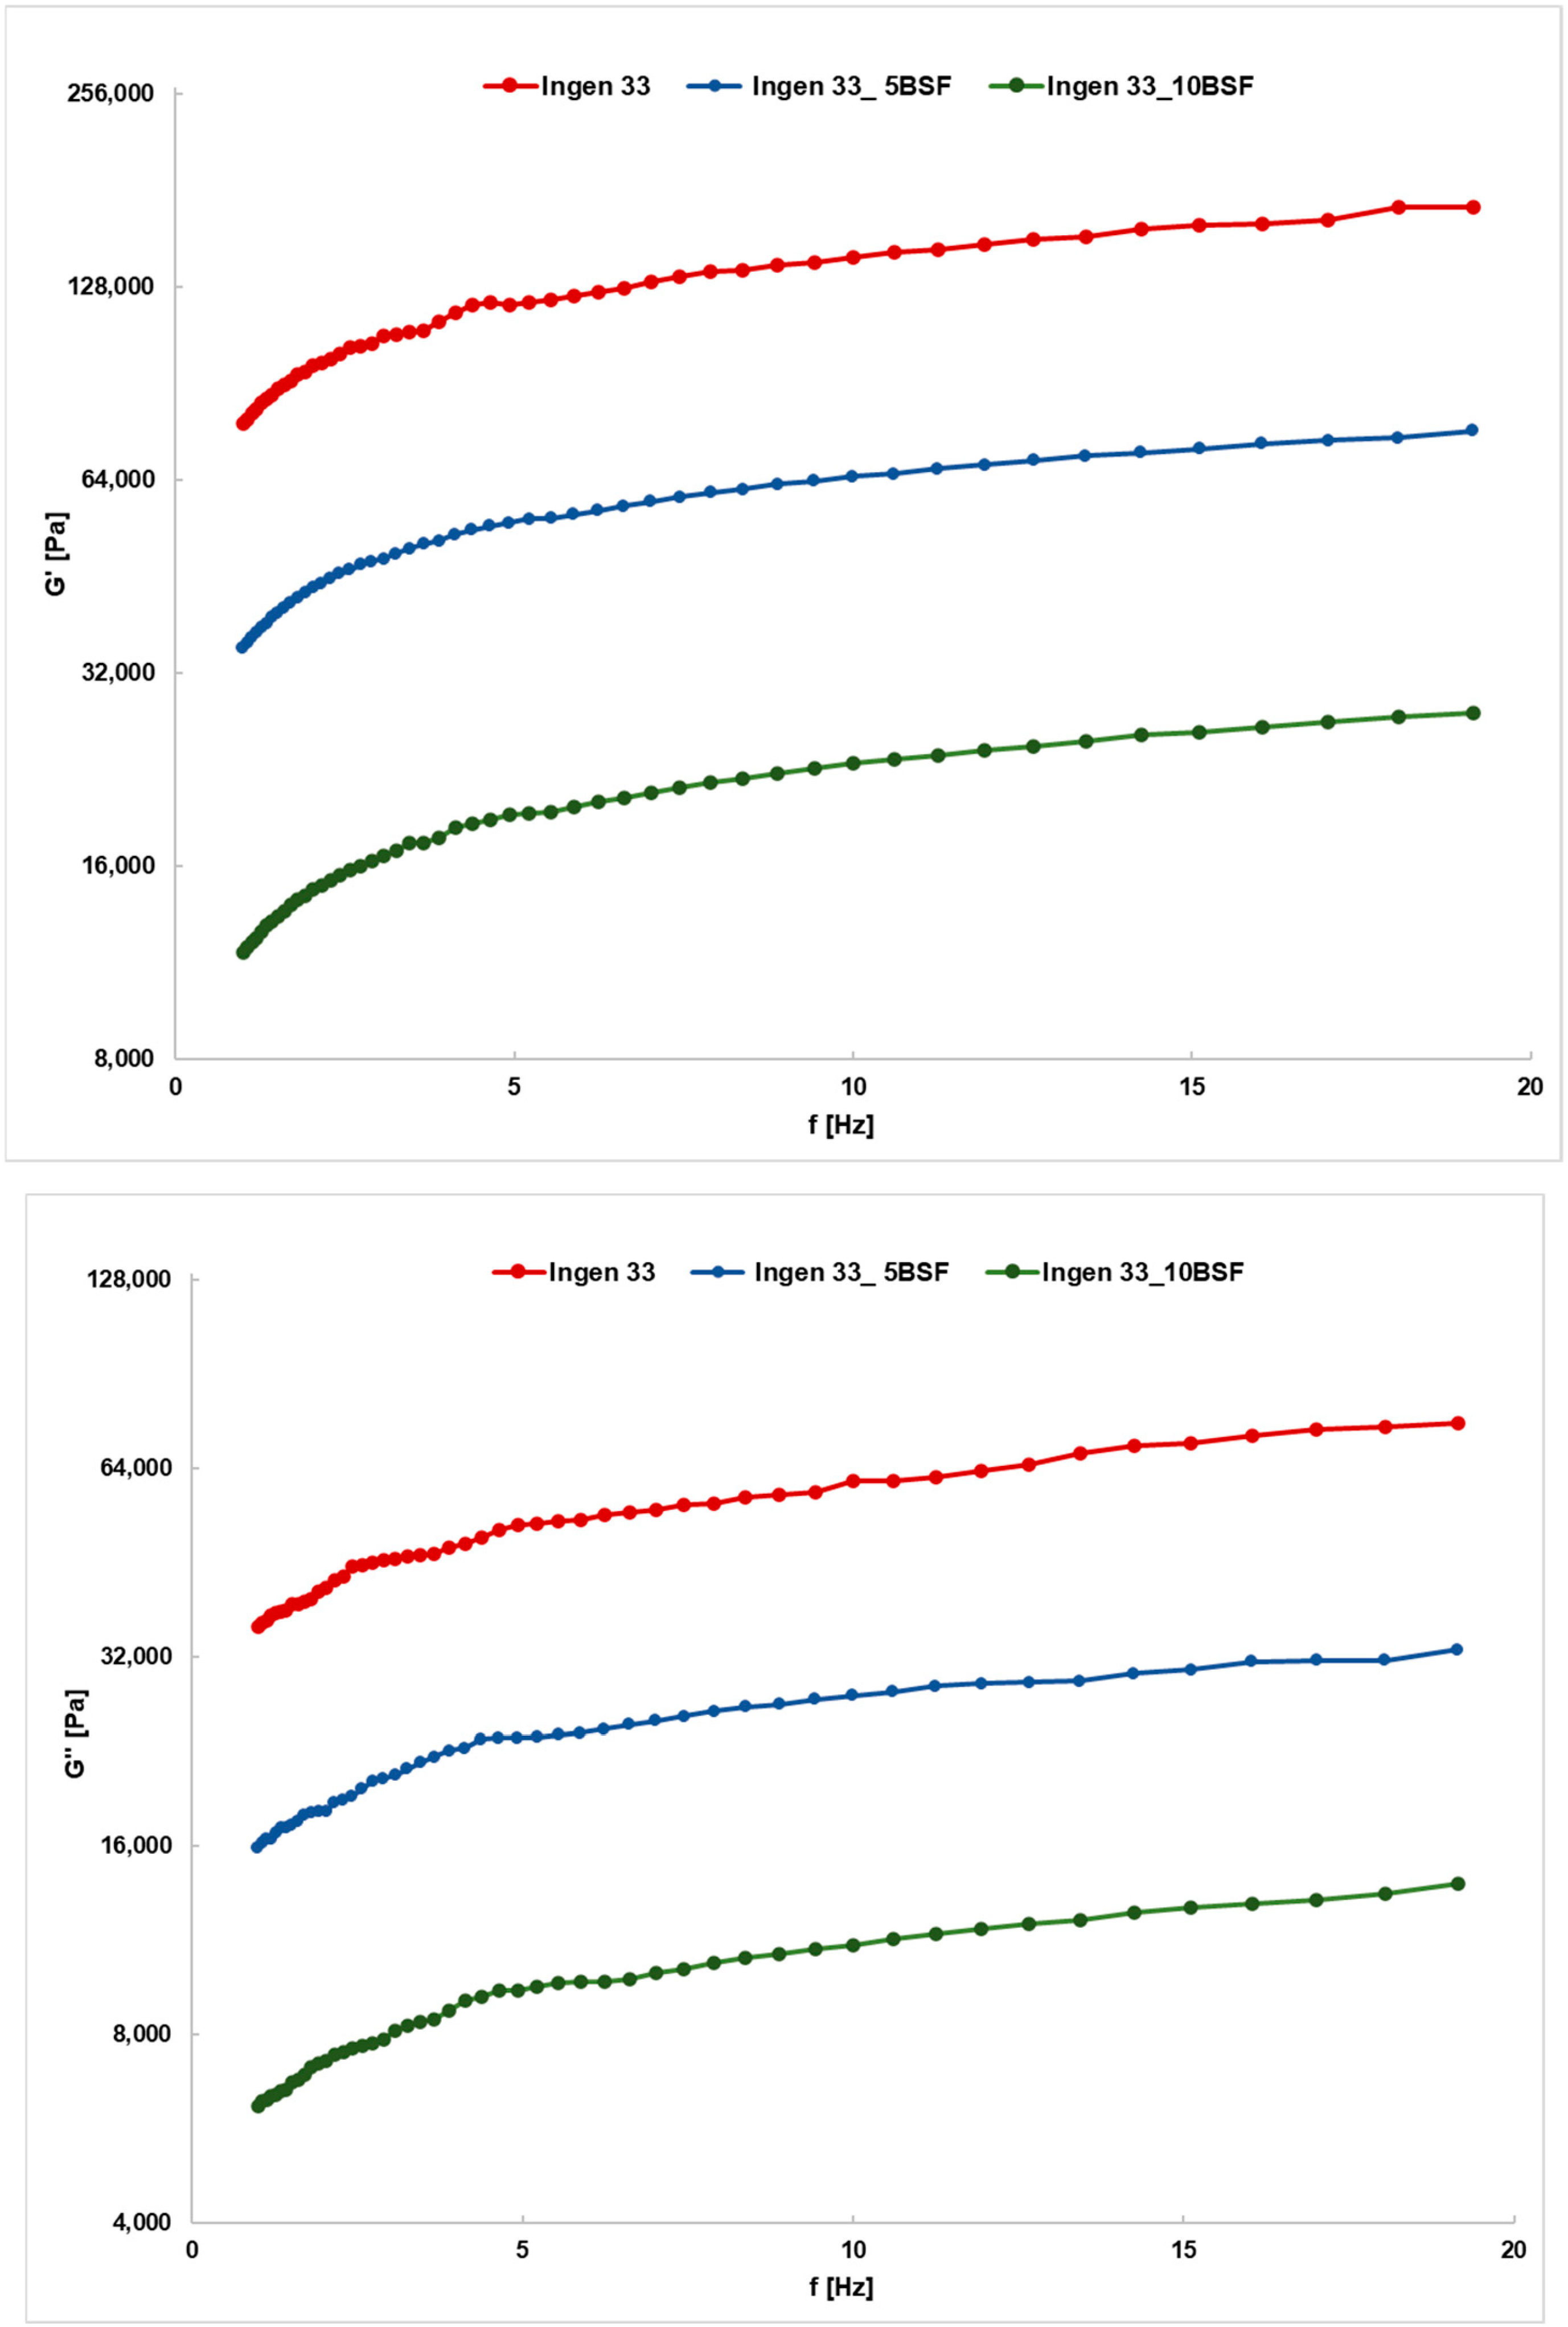
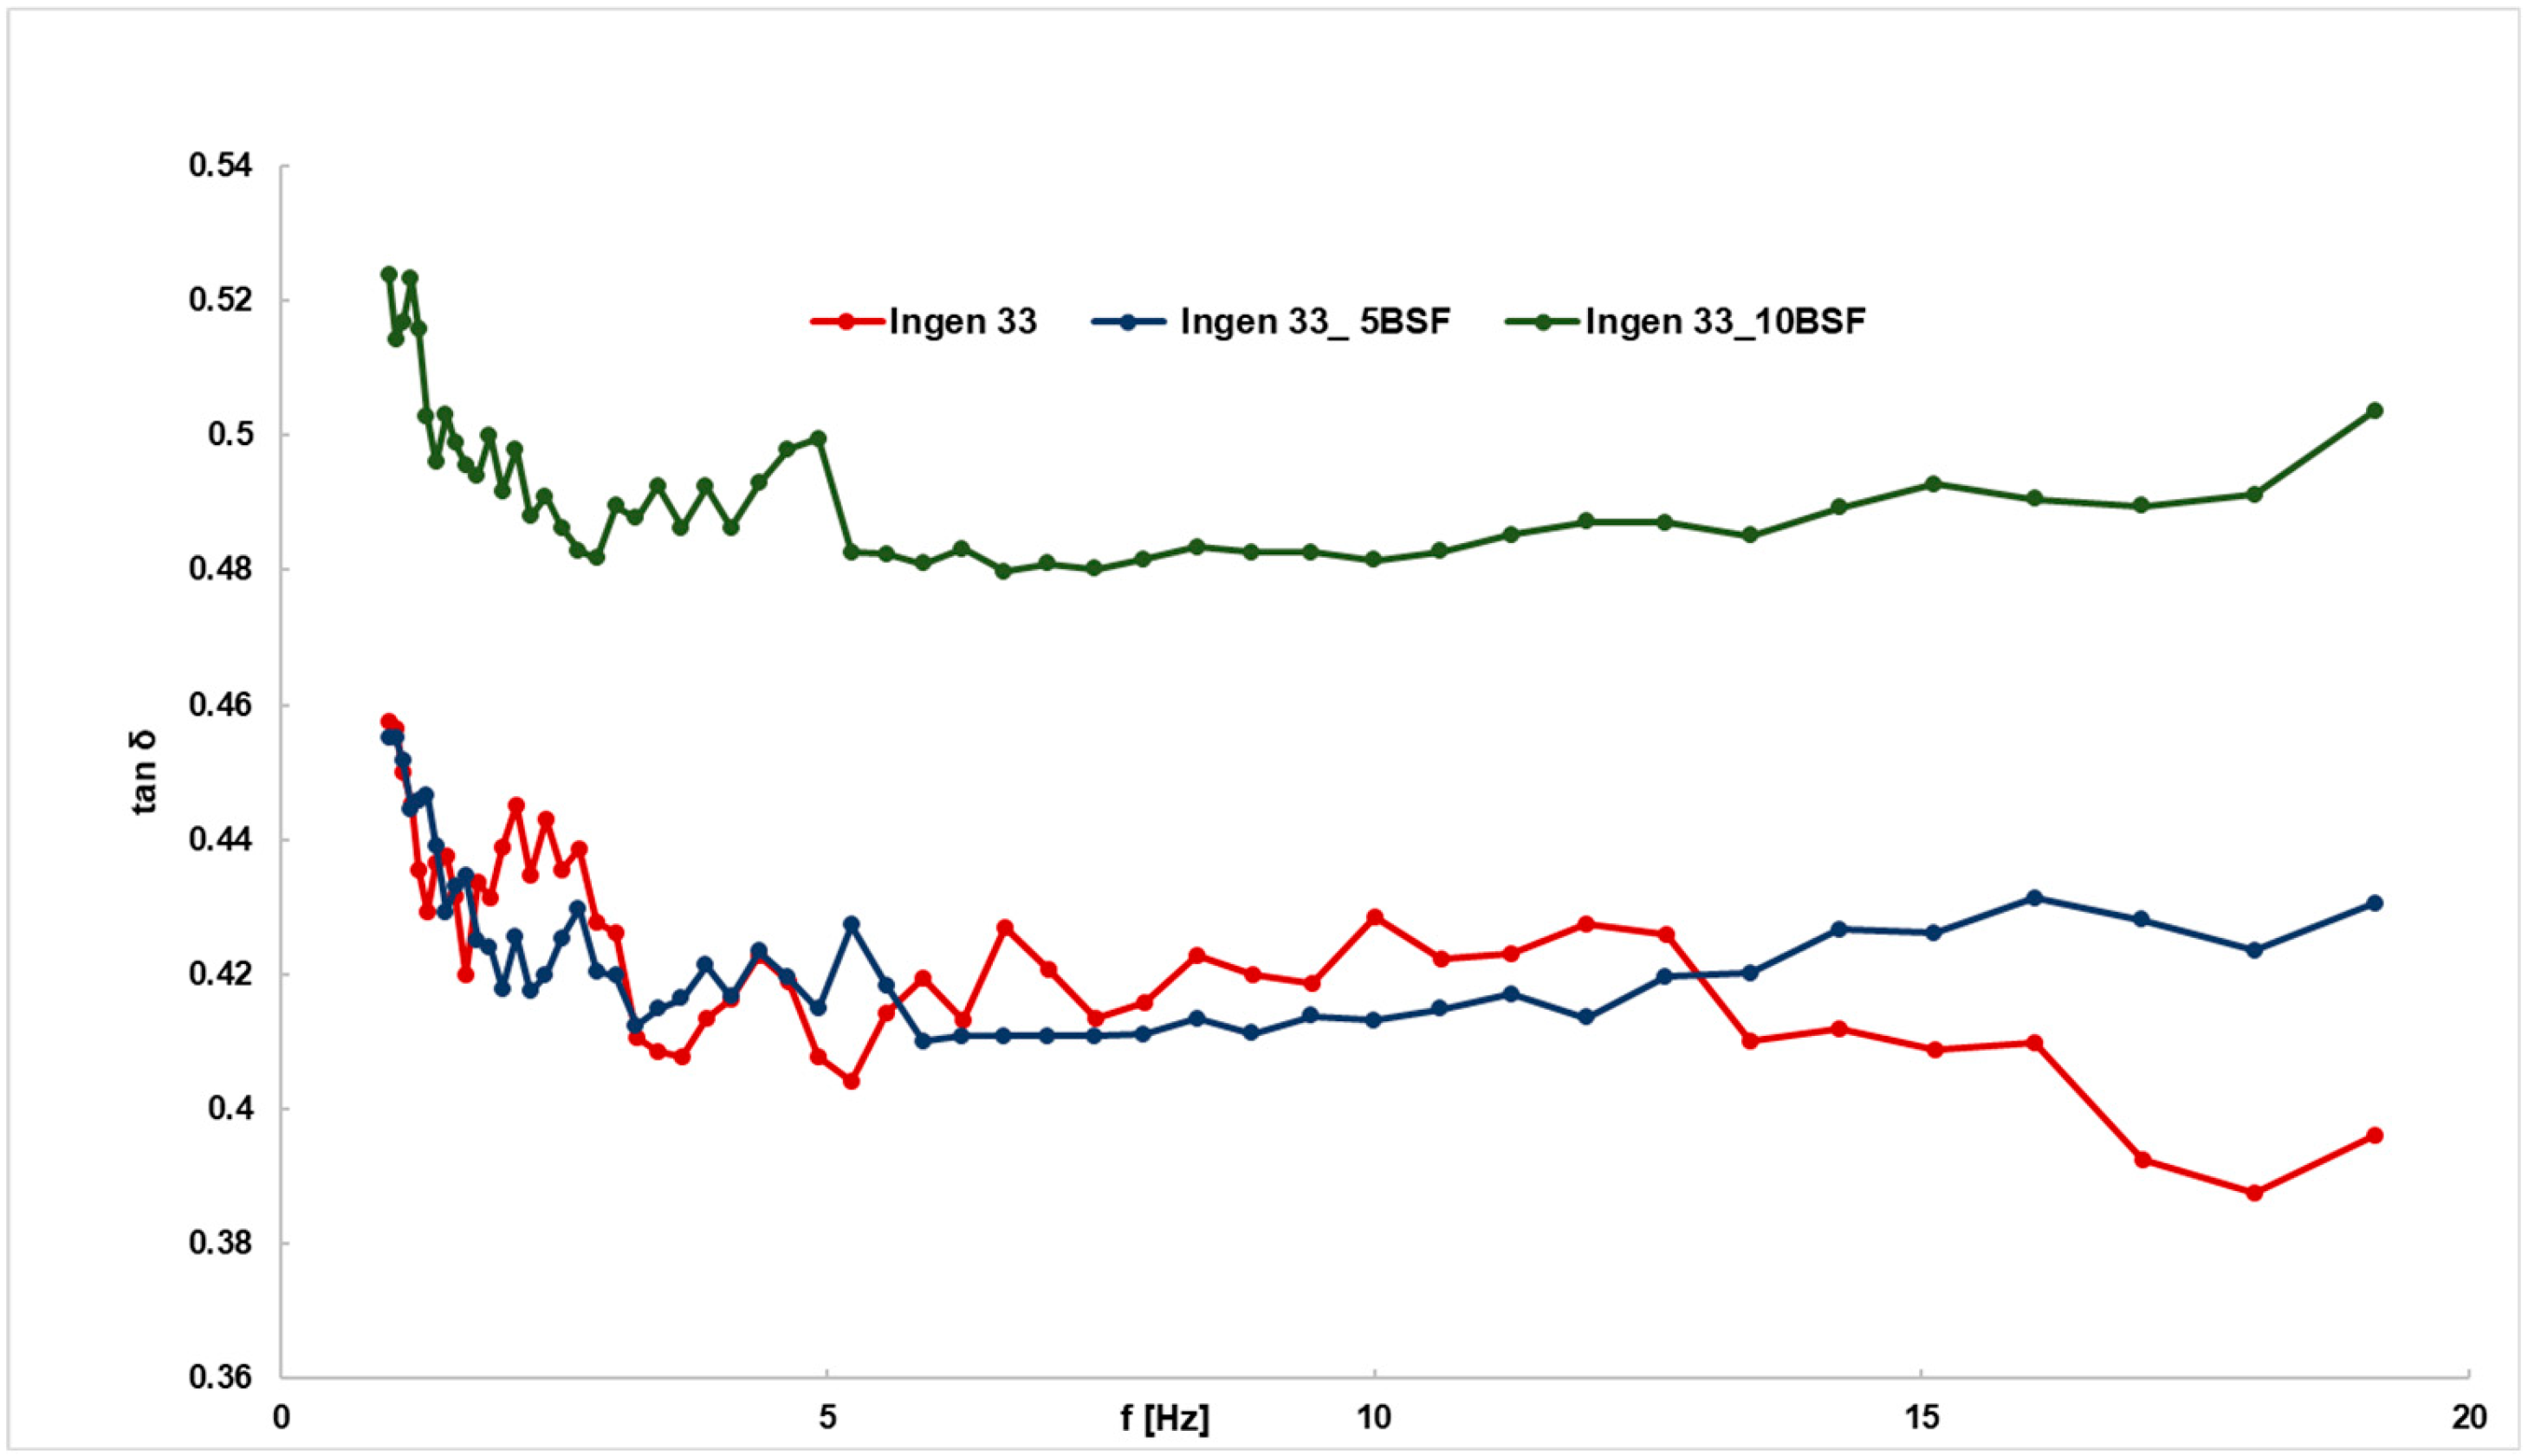
3.2. Dynamic Dough Rheological Properties

The viscoelastic behavior of the dough samples with different amounts of BSF addition was evaluated through dynamic oscillatory rheological measurements. The storage modulus (G′), loss modulus (G″) and loss tangent (tan δ) analyzed are shown in Figure 1. For all the dough samples, the storage modulus (G′) was higher than the loss modulus (G″), indicating that the dough samples exhibited a predominantly elastic behavior [39]. The tan δ values were less than 1, which indicates that the elastic component dominated the viscoelastic response of the dough matrix. These data indicate that the gluten networks in the triticale dough are well developed, with the protein matrix providing the structural elasticity that dominates stiffness [40]. The incorporation of BSF in triticale flours influenced the dough’s rheological properties, depending on both the wheat cultivar and the level of addition. However, in general, BSF addition decreased the values of G′ and G″ compared to the control sample. This decrease may be explained by the high content of insoluble dietary fibers from BSF composition, which can interfere with gluten network development. The dilution of gluten proteins, combined with competition for water between fibers and gluten-forming proteins, may limit gluten hydration and disrupt the continuity of the protein network. These data are in agreement with other studies [25,41], which reported that dough systems enriched with cereal by-products or fiber-rich ingredients had decreased dough elasticity and increased weakness. The loss tangent values also showed a significant change in the viscoelastic behavior of the dough systems when BSF was incorporated in triticale flour. These values decrease with BSF addition to triticale flours, which indicates an increase in viscous behavior and a decrease in the gluten network strength [40].

3.3. Dough Rheological Properties During Extension

BSF addition to triticale flour significantly (p < 0.05) affects all dough rheological properties, as can be seen from Table 2. Alveograph tenacity (P) values decreased in all dough samples with an increasing amount of BSF addition to the dough recipe, indicating a reduction in the resistance of the dough to deformation. This effect may be attributed to gluten dilution caused by BSF addition, which does not contain gluten, and also the fiber fraction from BSF, which disrupts the formation of the cohesive gluten network essential for dough strength [25]. Compared to the control sample, extensibility (L) and the index of swelling (G) values significantly (p < 0.05) decreased, indicating the reduced ability of the dough to stretch during bread-making. This may be due to the fiber content from BSF, which reduces the mobility of gluten strands during extension [42]. However, for some triticale varieties (Ingen 35, Ingen 54, Costel, Fanica), a slight increase in L and G values could be seen when high amounts of BSF were added to the dough recipe. This behavior may be due to an increase in enzymatic activity, probably due to the fact that the BSF is in a fermented form. The decrease in baking strength (W) values for the samples with BSF addition indicates a dough weakening effect, probably due to gluten dilution, which limits its formation. A significant behavior in dough rheological values was reported by Ghendov-Mosanu et al. [25] when BSF from blonde beer processes was incorporated in triticale flour—higher values of P/L for dough samples with BSF addition compared to the control samples indicate that the dough is very resistant to deformation and less extensible, which indicates that it may not retain gas well during fermentation.

3.4. Dough Rheological Properties During Fermentation and Falling Number Values

BSF incorporation in triticale flour significantly (p < 0.05) affected all Rheofermentometer values, as can be seen from Table 3. Control samples presented the highest values for H’m, VT, VR and CR. The gas retention coefficients were higher than 97% for all the control samples, which indicates that the triticale flours have good gas retention capacity. Incorporation of BSF significantly (p < 0.05) decreased all rheological properties during fermentation. The maximum height of gaseous production (H’m) decreased by 15–25%, whereas the retention coefficient (CR) increased to 72.7–78.4%. Total CO2 volume production (VT) and the volume of the gas retained in the dough at the end of the test (VR) presented a similar decreasing trend with BSF addition to triticale flours. Gas production in triticale flour dough occurs during the fermentation process by metabolizing the fermentable sugars in the dough via yeast. No sucrose or other fermentable sugars were added to the bread formulations. Yeast nutrition was supported by carbohydrates naturally present in triticale flour and residual fermentable carbohydrates from the fermented brewer’s spent grain. Although VT values demonstrate a lower decrease or even an increase in the Costel variety in the samples with BSF, VR values significantly decreased (p < 0.05), which indicates the low capacity of the dough to retain gases and a weakening of the dough structure. The decrease in VR may be due to the high dietary fiber content of BSF, which interferes with gluten network formation, not allowing it to retain gases [43]. Additionally, it has been reported that fibers such as arabinoxylans, present in the BSF composition, limits gluten hydration and disrupts the gluten–starch matrix, leading to a reduction in the gas-holding capacity of the dough [34] and, therefore, in the VR values. A lower decrease in VT values or a slight increase in the case of the Costel variety may be explained by an increase in α-amylase activity due to the BSF addition, which can be seen from the decrease in falling number values. The falling number values ranged between 68 to 136 s, indicating high amylase activity in all the analyzed samples. The incorporation of BSF in triticale flour led to a significant (p < 0.05) decrease in falling number values compared to the control flours, indicating an increase in α-amylase activity. This suggests that BSF has amylolytic activity, probably due to the fermentation process it resulted from and also to the possible presence of α-amylase in BSG. These data are in agreement with those reported by Ghendov-Mosanu et al. [25] when BSF from light beer processes was incorporated in triticale flours. Increasing amylolytic activity from the triticale–BSF systems leads to an increase in the amount of fermentable sugars, which favors gas formation and an increase in VT values (for the Costel variety) or a slight decrease, probably due to the lower amount of fermentation substrate in these samples or because the pH values are not optimum in these samples for intense amylolytic activity. However, even if gas formation is favored by BSF addition, the dough’s capacity to retain gases decreases, probably due to the high fiber content from the BSF, which weakens the gluten network [34].

3.5. Bread Physical–Chemical Characteristics

The bread physical–chemical characteristics are shown in Table 4. As can be seen, the bread loaf volume decreased by the increased amount of BSGF in the dough recipe. Similar data has been reported by others [17,19] when sourdough bread with BSG was obtained. The lowest loaf volume values have been obtained for bread samples when 10% of BSGF was incorporated in the Ingen 40, Costel and Fanica triticale flour varieties. At an addition level of 5% sourdough in the dough recipe, the loaf volume of the bread samples decreased by an average of 11.85 cm3/100 g (a reduction of about 4.7% compared to the control sample). With the addition of 10% sourdough in the bread recipe, the loaf volume decreased, on average, by 24.57 cm3/100 g (a reduction of about 9.8% compared to the control sample). This decrease can be explained by a reduction in dough extensibility and gas-holding capacity due to gluten dilution and fiber interaction with wheat proteins [43]. According to Stojceska and Ainsworth [34], some compounds from BSG fibers, such as arabinoxylans, can lead to a loaf volume decrease due to the fact that they can limit gluten hydration and may disrupt the gluten–starch matrix, which will reduce the dough’s capacity to retain gases during the fermentation process. Although the sugar content was not directly quantified, the normal dough fermentation and bread quality parameters obtained suggest that the endogenous carbohydrates present in triticale flour and fermented BSG were sufficient to sustain yeast activity.
The BSGF addition in triticale flours decreased bread porosity. Bread samples obtained only from triticale flours presented porosity values between 51.3% and 58.3%. The 10% BSGF addition caused a decrease in porosity values of up to 41.5–47.5%. This decrease may be due to the fiber content from BSGF, which may interfere with the gluten network, favoring higher cell collapse and carbon dioxide loss on reaching the bread surface, leading to a lower bread density and smaller pore size [44]. Also, the bread elasticity decreased with BSF addition to bread recipes, probably due to gluten dilution and fiber interference in its network [45]. Moreover, the increase in enzymatic activity in the dough system with BSF addition, especially from amylases and proteases, may affect its structure, weakening it.
The addition of sourdough from brewers’ spent grain led to significant increase in bread acidity. The acidity of the bread samples without the addition of sourdough had values between 4.60 and 6.46 degrees. With an addition of 5% BSF, the acidity of the bread increased to about 6.92–7.82 degrees, and at 10% BSF addition, the values reached maximum values of 8.21–8.94 degrees. This increase is explainable, caused by the activity of lactic acid bacteria, which increases and develops during the sourdough fermentation process, contributing to the accumulation of organic acids. The highest value of acidity, 8.94 degrees, was obtained for the Fanica variety when 10% BSF was incorporated in its recipe.
Color values obtained for the bread samples indicate a significant decrease in lightness (L*) values for the samples with BSGF addition in triticale flour. This decrease was, on average, 9.55 units (about 19% compared to the control sample) for the samples with 5% BSGF addition and, on average, 17.20 units (about 34%) for the samples with 10% BSGF addition. This data is in agreement with many studies, which have reported that there was a decrease in this value with BSG addition to wheat flour [43,46,47]. According to Amoriello et al. [22], this decrease is due to a higher quantity of amino acids favoring the Maillard reaction, which, as well as increasing the L* value, also increased the redness (a*) value. However, for some sourdough BSG bread samples, the a* value increase contributed to a wholemeal bread appearance. Positive values for b* indicate shades of yellow. At the higher levels of 10% BSGF, the b* value tends to decrease slightly compared to sourdough bread with 5% BSG, as the lightness significantly decreases, indicating that the bread brown color has become darker.

3.6. Bread Textural Characteristics

The bread textural characteristics are shown in Table 5. As can be seen, BSF addition to the dough recipe led to a significant (p < 0.05) increase in hardness for all triticale variety bread samples; this is in agreement with other studies [19,26] that incorporated BSG in bread recipes. This may be due to the fact that BSF has a large number of fibers, which may make bread denser and stiffer. The adhesivity values also increase with the addition of BSF in triticale flours. High values of adhesivity indicate a more “sticky” texture, which can influence the chewing sensation and flavor release. Cohesiveness reflects how well the bread retains its structure, while resilience indicates its ability to recover its original shape after compression [47]. Neither value presents a linear evolution, and their variation depends on the triticale variety. Generally, a high BSF addition tends to decrease the resilience value, probably due to gluten dilution in the bread samples. This indicates the reduced ability of the bread to recover its original shape after compression, resulting in a more compact and less aerated structure [48]. Cohesiveness remains relatively stable, with an insignificant decrease, indicating that although BSF increases bread hardness, the crumb structure remains intact and does not exhibit excessive crumbling. Chewiness reflects the energy required to masticate bread until it is ready for swallowing [49]. In the present study, the hardness increase value led to a significant increase in chewiness. High values indicate that the bread requires substantially more chewing effort, a feature characteristic of products enriched with BSF. Chewiness closely follows the increasing hardness trend, suggesting that the bread with BSF incorporated in its recipe exhibits a denser crumb structure and demands a greater mastication effort.

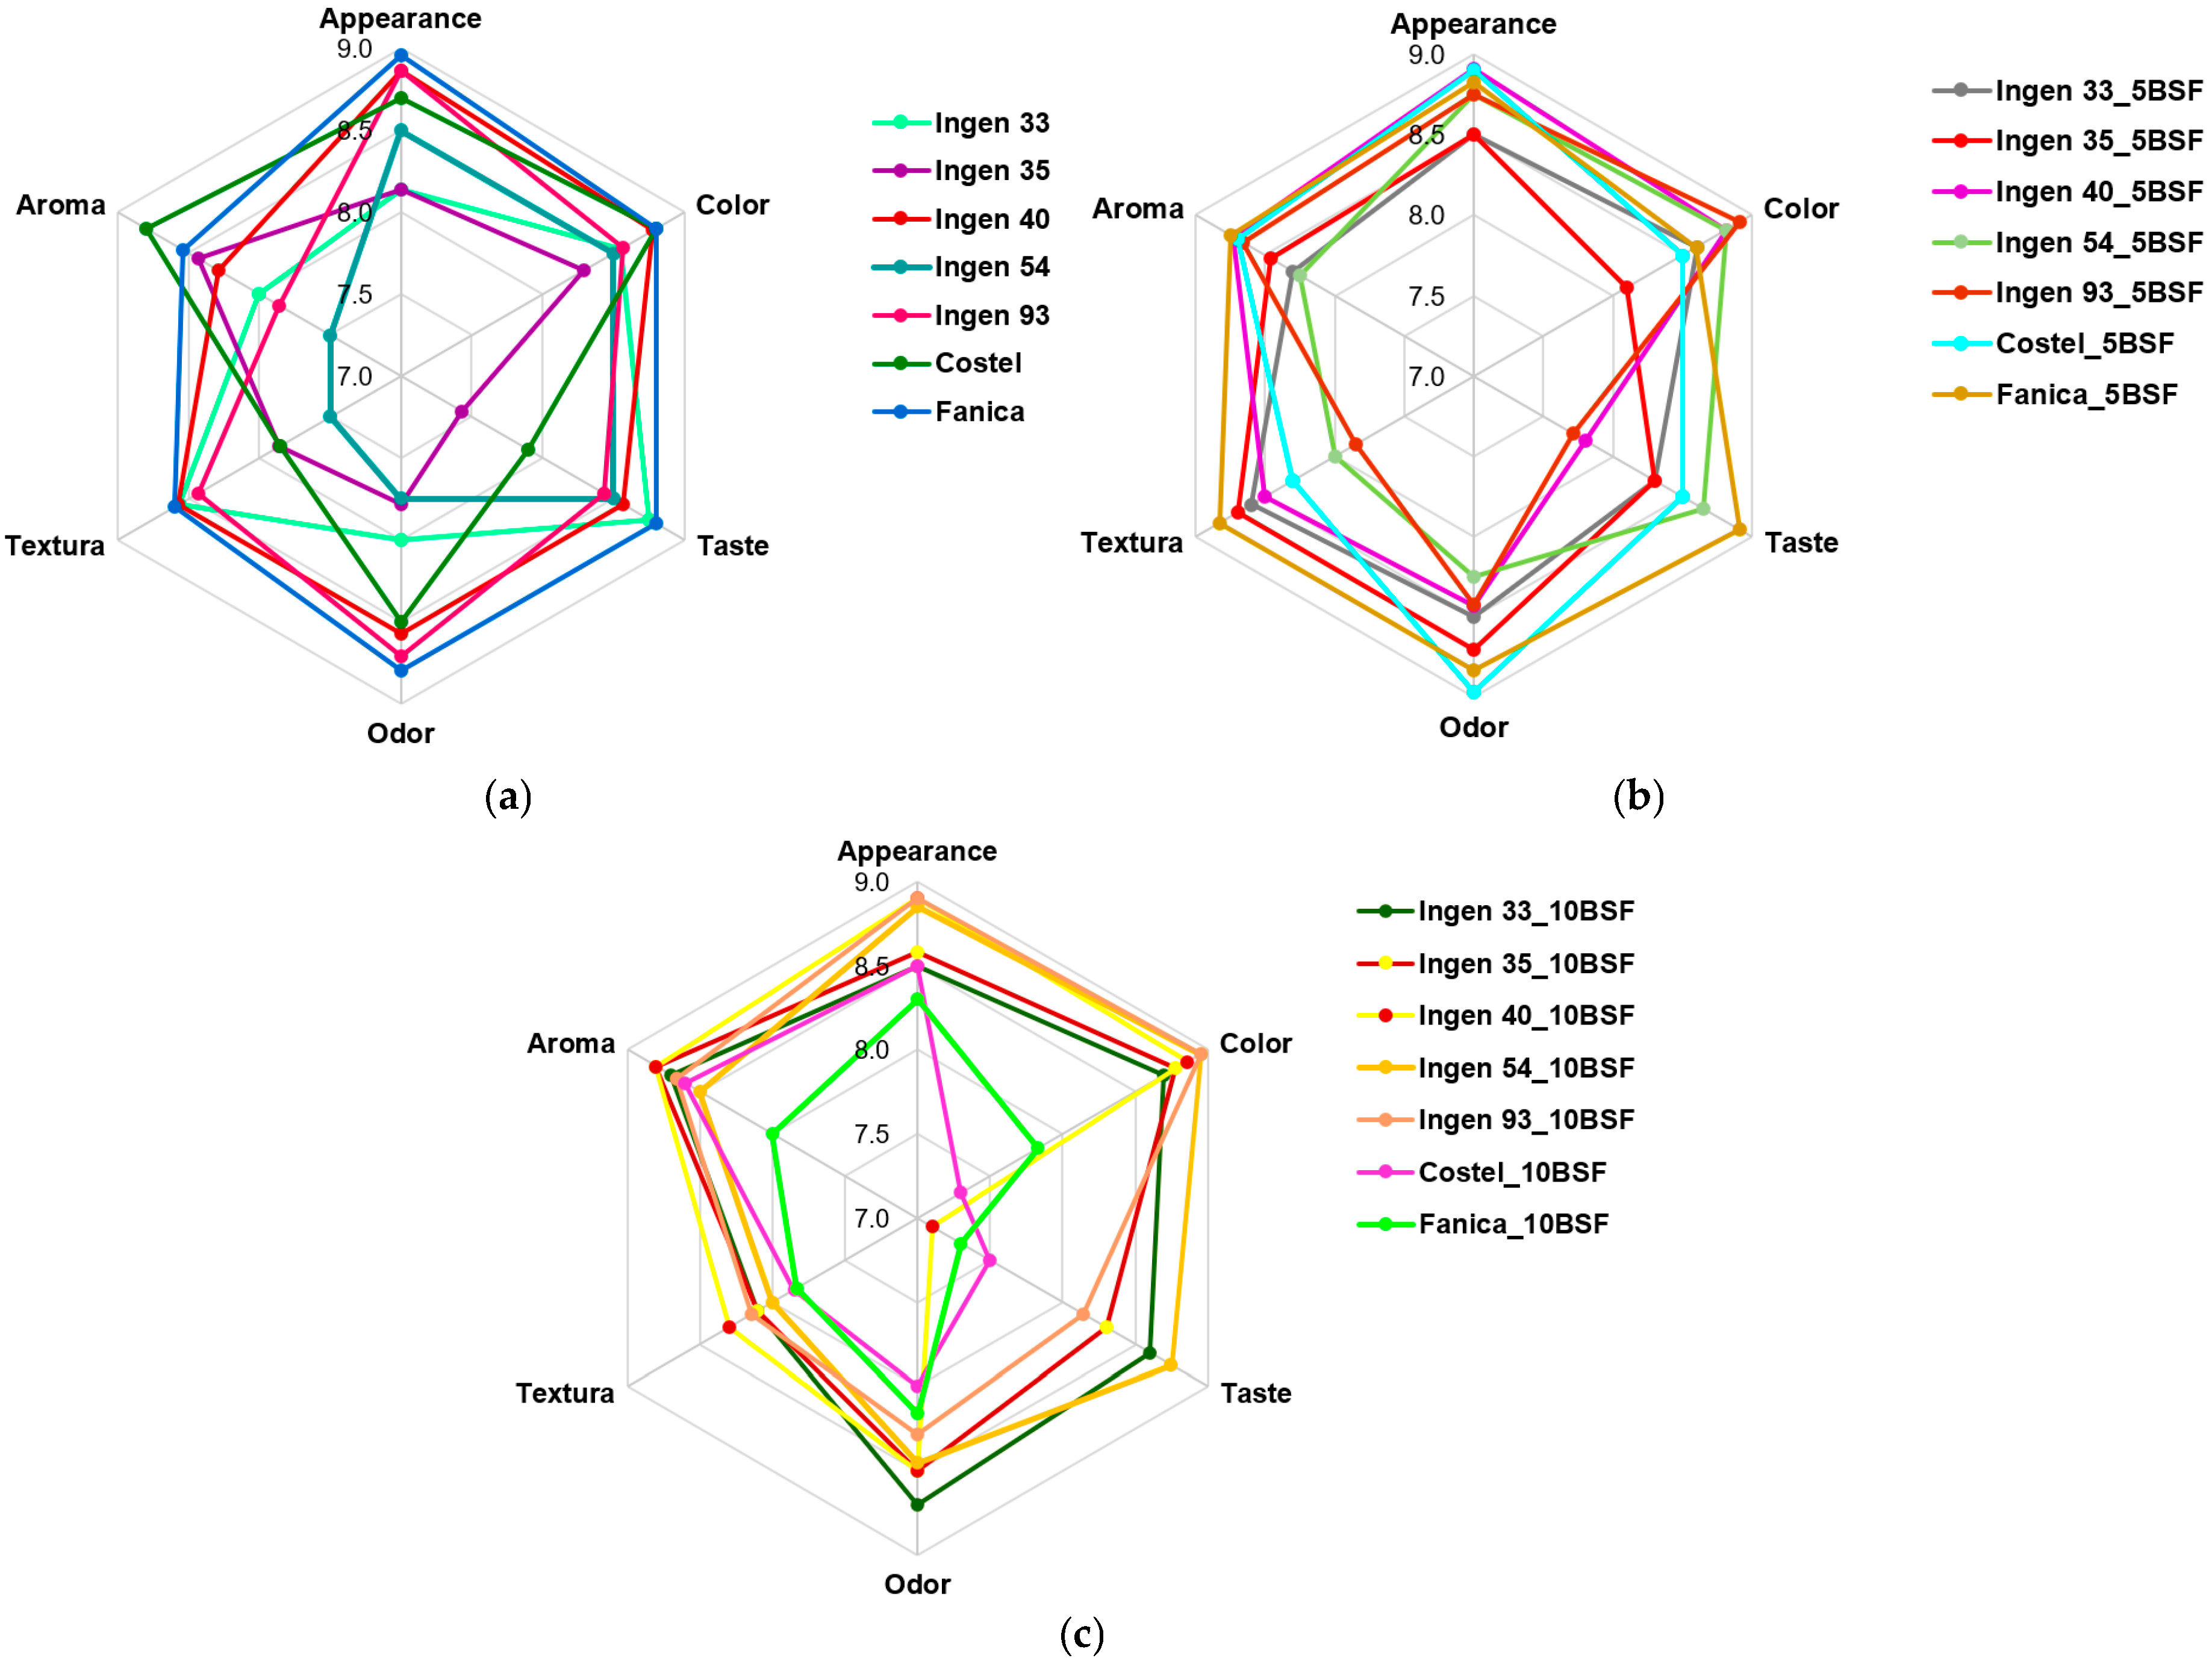
3.7. Bread Sensory Characteristics

The sensory characteristics of the bread samples are shown in Figure 2. Almost all the bread samples (except for the Costel and Fanica varieties with 10% BSGF addition) show an improvement in the color sensory characteristic value. These data are in agreement with another study [22], which reported that sourdough bread with BSG addition presented good scores for taste, structure, and color. The panelists’ preference in this study may be due to the fact that the BSGF gives an intense, attractive, brown color, specific to wholegrain products, which is usually preferred by consumers. The taste and flavor depend a lot on the base triticale variety from which the bread samples were obtained. For some triticale varieties, these sensory values were better appreciated by the panelists than for other varieties (Ingen 40 and Fanica), which had values evaluated in a negative way, suggesting a synergy between the flour and sourdough brewers’ spent grain. These data are in agreement with another study [50], which reported that BSG with different wheat types presented a significant variation in bread sensory attributes. For some samples, a high BSGF addition led to strong flavors that masked the natural flavors of the triticale varieties. Although instrumental data has shown a significant increase in bread hardness, the sensory evaluation of texture was a positive one. The panelists seem to appreciate the “hearty” texture of the bread samples obtained with 5% BSGF addition. However, at the 10% level of BSGF incorporated in the bread recipe, the scores for texture evaluation slightly decreased, probably due to the fact that it becomes denser and chewier.

4. Conclusions

Fermented dark brewers’ spent grain (BSF) can be successfully incorporated into triticale-based flour in order to obtain quality bread products. Its addition to triticale flours affects dough rheological behavior by decreasing its stability and weakened protein structure, probably due to gluten dilution and increased enzymatic activity. Starch gelatinization and Mixolab parameter values during pasting were generally decreased with BSF addition, indicating competition for water and reduced starch availability. The increase in C4 and C5 values for most samples suggests that BSF addition contributes to an improvement in the stability of hot starch paste and final starch paste viscosity after cooling. A decrease in the difference between torque C5 and C4 (C54) values for almost all the samples indicates a reduced retrogradation and slower staling. Dynamic rheological data showed a decrease in the storage modulus (G′) and loss modulus (G″) alongside an increase in tan δ, suggesting a weakening of the dough’s elastic network with BSF addition to the dough recipe. Furthermore, BSF addition negatively affected dough rheological properties during extension by decreasing its maximum pressure, baking strength and dough extensibility. Dough rheological values during fermentation, analyzed using the Rheofermentometer device, were decreased, indicating a weakening of the dough structure and a reduced gas retention capacity, probably due to fiber–gluten interactions with BSF addition to triticale flours. Although BSF addition increases α-amylase activity and, in some cases, favors gas production, the dough’s ability to retain CO2 was reduced, as seen by a decrease in the volume of the gas retained in the dough at the end of the test (VR) and in the retention coefficient (CR). Increasing the proportion of BSGF in the dough formulation resulted in a consistent decrease in bread loaf volume, with the most pronounced reductions observed at the 10% inclusion level across all triticale flour varieties. Similarly, BSF incorporation negatively affected loaf volume, with reductions of approximately 4.7% and 9.8% at 5% and 10% addition levels, respectively, compared to the control sample. The incorporation of BSF into triticale flours also led to a reduction in bread porosity. Control samples exhibited porosity values ranging from 51.3% to 58.3%, whereas the addition of 10% BSF decreased these values to 41.5–47.5%. The use of sourdough derived from BSG significantly increased bread acidity. Control samples showed acidity values between 4.60 and 6.46 degrees, while the addition of 5% sourdough increased acidity to 6.92–7.82 degrees, and further to 8.21–8.94 degrees at the 10% inclusion level. Color analysis indicated that BSF incorporation significantly reduced L* values and increased a* values in some samples, while positive b* values reflected the presence of yellow hues. The incorporation of BSF significantly (p < 0.05) increased bread hardness across all varieties. Adhesiveness increased with BSF addition, whereas cohesiveness remained relatively stable, and resilience tended to decrease at higher inclusion levels. The increase in hardness was directly associated with higher values of chewiness. Sensory evaluation revealed that BSF generally improved bread color acceptability due to the development of a wholegrain-like brown hue. Taste and flavor varied depending on the triticale variety, indicating an interaction between flour type and BSF, with higher inclusion levels occasionally producing overly intense flavors that masked intrinsic characteristics. Texture was positively perceived at the 5% inclusion level as “hearty,” whereas slightly lower scores at 10% were associated with increased density and chewiness.
Overall, the results indicate a clear trade-off between technological quality and sensory enhancement as the BSGF level increases. Higher inclusion levels (>10%) appear less favorable for conventional bread applications due to their impact on loaf volume and crumb structure, while lower levels better preserve bread quality. Nevertheless, higher additions may still be suitable for the development of dense, fiber-enriched bakery products. Therefore, BSGF incorporation should be considered a formulation strategy tailored to the desired product profile rather than defined by a single optimal level.

Supplementary Materials

The following supporting information can be downloaded at: https://www.mdpi.com/article/10.3390/app16115407/s1.

Author Contributions

Conceptualization, A.G.-M., I.R. and G.G.C.; methodology, S.R., O.S., A.G.-M., V.B. and S.L.; software, S.R., I.R. and V.B.; validation, A.G.-M., G.L. and G.G.C.; formal analysis, O.S., S.R., G.L., V.B. and S.L.; investigation, I.R., O.S., S.R., V.B. and S.L.; resources, S.L., G.L. and G.G.C.; data curation, A.G.-M., I.R., O.S., S.R., V.B. and S.L.; writing—original draft preparation, A.G.-M., I.R. and G.G.C.; writing—review and editing, G.G.C.; visualization, A.G.-M. and G.G.C.; supervision, G.G.C.; project administration, G.G.C.; funding acquisition, G.G.C. All authors have read and agreed to the published version of the manuscript.

Funding

This work was supported by a grant from the Ministry of Research, Innovation and Digitization, CNCS-UEFISCDI, project number PN-IV-P8-8.3-ROMD-2023-0078, within PNCDI IV.

Institutional Review Board Statement

The study was conducted in accordance with the Declaration of Helsinki and approved by the Technical University of Moldova Ethics Commission (decision no. 35 on 10 April 2025).

Data Availability Statement

The original contributions presented in the study are included in the article; further inquiries can be directed to the corresponding author.

Acknowledgments

This work was supported by a grant from the Ministry of Research, Innovation and Digitization, CNCS-UEFISCDI, project number PN-IV-P8-8.3-ROMD-2023-0078, within PNCDI IV.

Conflicts of Interest

The authors declare no conflicts of interest.

Abbreviations

The following abbreviations are used in this manuscript:
BSGBrewers’ spent grain
BSFDark brewer’s spent grain sourdough
Ingen33_5BSFIngen 33 triticale flour variety with 5% dark brewer’s spent grain sourdough addition
Ingen40_5BSF Ingen 40 triticale flour variety with 5% dark brewer’s spent grain sourdough addition
Ingen 35_5BSF Ingen 35 triticale flour variety with 5% dark brewer’s spent grain sourdough addition
Ingen 54_5BSF Ingen 54 triticale flour variety with 5% dark brewer’s spent grain sourdough addition
Ingen 93_5BSF Ingen 93 triticale flour variety with 5% dark brewer’s spent grain sourdough addition
Costel_5BSFCostel triticale flour variety with 5% dark brewer’s spent grain sourdough addition
Fanica_5BSFFanica triticale flour variety with 5% dark brewer’s spent grain sourdough addition
Ingen33_10BSFIngen 33 triticale flour variety with 10% dark brewer’s spent grain sourdough addition
Ingen40_10BSF Ingen 40 triticale flour variety with 10% dark brewer’s spent grain sourdough addition
Ingen 35_10BSF Ingen 35 triticale flour variety with 10% dark brewer’s spent grain sourdough addition
Ingen 54_10BSF Ingen 54 triticale flour variety with 10% dark brewer’s spent grain sourdough addition
Ingen 93_10BSF Ingen 93 triticale flour variety with 10% dark brewer’s spent grain sourdough addition
Costel_10BSFCostel triticale flour variety with 10% dark brewer’s spent grain sourdough addition
Fanica_10BSFFanica triticale flour variety with 10% dark brewer’s spent grain sourdough addition

References

  1. Andras, B.E.; Fițiu, A.; Acs, P.B.; Horga, V.A.; Racz, I.; Duda, M.M. The Influence of Sowing Rate and Foliar Fertilization on the Yield of Some Triticale Varieties in the Context of Climate Change in Northwest Romania. Agriculture 2024, 14, 2155. [Google Scholar] [CrossRef]
  2. Food and Agriculture Organization of the United Nations (FAO). Crops and Livestock Products. Available online: https://www.fao.org/faostat/en/#data/QCL (accessed on 23 February 2026).
  3. Usmanova, M.; Urokov, S.; Xadjayev, D.; Jurayeva, Z.; Keldiyarova, X.; Valiyev, S. The influence of conditions on water holding capacity characteristics of triticale varieties planted in the Samarkand region. Plant Sci. Today 2024, 11, 752–760. [Google Scholar] [CrossRef]
  4. Cionca, I.; Lupuț, I.; Rusu, T. Triticale: Navigating Past Achievements, Current Realities and Future Horizons in Agricultural Innovation. Agricultura 2024, 129, 1–2. [Google Scholar]
  5. Rodríguez-Pérez, G.; Cervantes-Ortiz, J.F.; Gámez-Vázquez, A.J.; Reynaga-Franco, F.J.; Torres-Velázquez, J.R.; Ávila-Perches, M.Á. Nutritional value in grains of triticale as an alternative in the food industry. Rev. Mex. Cienc. Agric. 2023, 14, 351. [Google Scholar] [CrossRef]
  6. Andraș, B.-E.; Ács, B.; Racz, I.; Ursan, P.; Duda, M. Triticale, a Grain with Many Uses, Including Medicinal. Hop Med. Plants 2023, 31, 93–109. [Google Scholar] [CrossRef]
  7. Kaszuba, J.; Jaworska, G.; Krochmal-Marczak, B.; Kogut, B.; Kuźniar, P. Effect of bran addition on rheological properties of dough and quality of triticale bread. J. Food Process. Preserv. 2021, 45, e15093. [Google Scholar] [CrossRef]
  8. Pycia, K.; Kaszuba, J.; Posadzka, Z.; Juszczak, L. Influence of the Addition of Vital Wheat Gluten on Thermal and Rheological Properties of Triticale Flour. Polymers 2023, 15, 1870. [Google Scholar] [CrossRef]
  9. Tamagno, S.; Pittelkow, C.M.; Fohner, G.; Nelsen, T.S.; Hegarty, J.M.; Carter, C.E.; Vang, T.; Lundy, M.E. Optimizing water and nitrogen productivity of wheat and triticale across diverse production environments to improve the sustainability of baked products. Front. Plant Sci. 2022, 13, 952303. [Google Scholar] [CrossRef]
  10. González-Alonso, V.; Pradal, I.; Wardhana, Y.R.; Cnockaert, M.; Wieme, A.D.; Vandamme, P.; De Vuyst, L. Microbial ecology and metabolite dynamics of backslopped triticale sourdough productions and the impact of scale. Int. J. Food Microbiol. 2024, 408, 110445. [Google Scholar] [CrossRef]
  11. Suhovici, D.; Paiu, S.; Rumeus, I.; Boeştean, O.; Codină, G.G.; Ghendov-Mosanu, A. Current and prospective directions in the use of the grain crops triticale. J. Eng. Sci. 2025, 32, 136–150. [Google Scholar] [CrossRef]
  12. Statista Inc. Beer Production Worldwide from 1998 to 2024. Statista 2025. Available online: https://www.statista.com/statistics/270275/worldwide-beer-production/ (accessed on 23 February 2026).
  13. Dancker, P.; Glas, K.; Gastl, M. Potential utilisation methods for brewer’s spent grain: A review. Int. J. Food Sci. Technol. 2025, 60, vvae022. [Google Scholar] [CrossRef]
  14. Chetrariu, A.; Dabija, A. Spent Grain: A Functional Ingredient for Food Applications. Foods 2023, 12, 1533. [Google Scholar] [CrossRef]
  15. Farcas, A.C.; Chis, M.S.; Socaci, S.A.; Dulf, F.; Podea, P.; Salanta, L.C.; Paucean, A.; Negrean, O. Craft Brewers’ Spent Grains as a Secondary Resource: Chemical Profiling of Key Nutritional Components. Agriculture 2026, 16, 720. [Google Scholar] [CrossRef]
  16. Ressa, A.; Nyhan, L.; Sanchez, R.; Lombardi, D.N.; O’Riordan, P.; Arendt, E.K. In vitro protein digestibility and protein quality assessment of novel brewers’ spent grain protein isolates. Innov. Food Sci. Emerg. Technol. 2026, 109, 104482. [Google Scholar] [CrossRef]
  17. Pérez-Alva, A.; Martín del Campo, S.T.; Baigts-Allende, D.K. Brewer’s spent grain (BSG) as an ingredient for leavened bread making: Challenges and opportunities. J. Cereal Sci. 2025, 124, 104223. [Google Scholar] [CrossRef]
  18. Cheung, J.; Hwang, E.S. Quality and Functional Characteristics of Morning Bread Supplemented with Brewer’s Spent Grain Powder. Prev. Nutr. Food Sci. 2026, 31, pnf.2025.259. [Google Scholar] [CrossRef]
  19. Aprodu, I.; Simion, A.B.; Banu, I. Valorisation of the brewers’ spent grain through sourdough bread making. Int. J. Food Eng. 2017, 13, 201700195. [Google Scholar] [CrossRef]
  20. Neylon, E.; Arendt, E.K.; Zannini, E.; Sahin, A.W. Fermentation as a tool to revitalise brewers’ spent grain and elevate techno-functional properties and nutritional value in high fibre bread. Foods 2021, 10, 1639. [Google Scholar] [CrossRef] [PubMed]
  21. Goh, L.L.; Chi Lik Lee, K. Biovalorisation of brewer’s spent grain (BSG) and sensory evaluation of BSG bread. ChemRxiv 2021. [Google Scholar]
  22. Amoriello, T.; Mellara, F.; Galli, V.; Amoriello, M.; Ciccoritti, R. Technological properties and consumer acceptability of bakery products enriched with brewers’ spent grains. Foods 2020, 9, 1492. [Google Scholar] [CrossRef] [PubMed]
  23. Vriesekoop, F.; Haynes, A.; van der Heijden, N.; Liang, H.; Paximada, P.; Zuidberg, A. Incorporation of fermented brewers spent grain in the production of sourdough bread. Fermentation 2021, 7, 96. [Google Scholar] [CrossRef]
  24. Waters, D.M.; Jacob, F.; Titze, J.; Arendt, E.K.; Zannini, E. Fibre, protein and mineral fortification of wheat bread through milled and fermented brewer’s spent grain enrichment. Eur. Food Res. Technol. 2012, 235, 767–778. [Google Scholar] [CrossRef]
  25. Ghendov-Mosanu, A.; Ropciuc, S.; Dabija, A.; Saitan, O.; Boestean, O.; Paiu, S.; Rumeus, I.; Leatamborg, S.; Lupascu, G.; Codină, G.G. Effect of Brewers’ Spent Grain Addition to a Fermented Form on Dough Rheological Properties from Different Triticale Flour Cultivars. Foods 2025, 14, 41. [Google Scholar] [CrossRef] [PubMed]
  26. International Association for Cereal Science and Technology (ICC). ICC Standard Methods; 104/1, 136, 105/2, 110/1, 173; ICC121; ICC: Vienna, Austria, 2005. [Google Scholar]
  27. Codină, G.G.; Ursachi, F.; Dabija, A.; Paiu, S.; Rumeus, I.; Leatamborg, S.; Lupascu, G.; Stroe, S.-G.; Ghendov-Mosanu, A. Physicochemical Properties, Polyphenol and Mineral Composition of Different Triticale Varieties Cultivated in the Republic of Moldova. Molecules 2025, 30, 1233. [Google Scholar] [CrossRef] [PubMed]
  28. SR 90:2007; Wheat Flour. Analysis Methods. ASRO Publisher House: Bucharest, Romania, 2007.
  29. SR 91:2007; Bread and Fresh Pastries. Analyses Methods. ASRO Publisher House: Bucharest, Romania, 2007.
  30. ISO 6658:2017; Sensory Analysis—Methodology—General Guidance 2017. International Organization for Standardization (ISO): Geneva, Switzerland, 2017.
  31. ISO 8589:2007; Sensory Analysis. General Guidance for the Design of Test Rooms. International Organization for Standardization (ISO): Geneva, Switzerland, 2007.
  32. Lovegrove, A.; Wood, A.J.; Hassall, K.L.; Howes, L.; Poole, M.; Tosi, P.; Shewry, P.R. The contribution of fiber components to water absorption of wheat grown in the UK. Cereal Chem. 2020, 97, 940–948. [Google Scholar] [CrossRef]
  33. Lauková, M.; Kohajdová, Z.; Karovičová, J.; Kuchtová, V.; Minarovičová, L.; Tomášiková, L. Effects of cellulose fiber with different fiber length on rheological properties of wheat dough and quality of baked rolls. Food Sci. Technol. Int. 2017, 23, 490–499. [Google Scholar] [CrossRef]
  34. Stojceska, V.; Ainsworth, P. The effect of different enzymes on the quality of high-fibre enriched brewer’s spent grain breads. Food Chem. 2008, 110, 865–872. [Google Scholar] [CrossRef]
  35. Rössel, B.; Salmenkallio-Marttila, M.; Suortti, T.; Holt, M. Wheat flour non-starch polysaccharides and their effect on dough rheological properties. Ind. Crops Prod. 2011, 34, 1327–1331. [Google Scholar] [CrossRef]
  36. Rosell, C.M.; Rojas, J.A.; Benedito de Barber, C. Influence of cellulosic fibres on pasting properties of starch–fibre blends. Int. J. Food Sci. Technol. 2010, 45, 1641–1648. [Google Scholar]
  37. Zou, X.; Wang, X.; Li, L.; Peng, P.; Ma, Q.; Hu, X.; Appels, R. Effects of composition and strength of wheat gluten on starch structure, digestion properties and the underlying mechanism. Foods 2022, 11, 3432. [Google Scholar] [CrossRef]
  38. Ghendov-Mosanu, A.; Popa, N.; Paiu, S.; Boestean, O.; Bulgaru, V.; Leatamborg, S.; Lupascu, G.; Codină, G.G. Breadmaking Quality Parameters of Different Varieties of Triticale Cultivars. Foods 2024, 13, 1671. [Google Scholar] [CrossRef] [PubMed]
  39. Axentii, M.; Stroe, S.-G.; Codină, G.G. Development and Quality Evaluation of Rigatoni Pasta Enriched with Hemp Seed Meal. Foods 2023, 12, 1774. [Google Scholar] [CrossRef] [PubMed]
  40. Struck, S.; Straube, D.; Zahn, S.; Rohm, H. Interaction of wheat macromolecules and berry pomace in model dough: Rheology and microstructure. J. Food Eng. 2018, 223, 109–115. [Google Scholar] [CrossRef]
  41. Abebe, W.; Ronda, F.; Villanueva, M.; Collar, C. Effect of tef [Eragrostis tef (Zucc.) Trotter] grain flour addition on viscoelastic properties and stickiness of wheat dough matrices and bread loaf volume. Eur. Food Res. Technol. 2015, 241, 469–478. [Google Scholar] [CrossRef]
  42. Verbeke, C.; Debonne, E.; Versele, S.; Van Bockstaele, F.; Eeckhout, M. Technological evaluation of fiber effects in wheat-based dough and bread. Foods 2024, 13, 2582. [Google Scholar] [CrossRef]
  43. Plessas, S.; Trantallidi, M.; Bekatorou, A.; Kanellaki, M.; Nigam, P.; Koutinas, A.A. Immobilization of kefir and Lactobacillus casei on brewery spent grains for use in sourdough wheat bread making. Food Chem. 2007, 105, 187–194. [Google Scholar] [CrossRef]
  44. Pereira de Freitas, F.P.; da Silva Lannes, S.C. Composition and sensory properties of breads supplemented with brewers’ spent grain from three different craft beer styles. Cereal Chem. 2024, 101, 1150–1159. [Google Scholar] [CrossRef]
  45. Cheng, J.; Zheng, L.; Zhao, J.; Yu, M.; Cao, R.; Wang, D.; Li, J.; Zhou, L. Study on the effect of microwaved brewer’s spent grains on the quality and flavor characteristics of bread. Foods 2024, 13, 461. [Google Scholar] [CrossRef]
  46. Zhang, Y.; Wei, X.; Bao, J.; Xu, K.; Chen, X.; Guo, M. Applicability of wheat brewer’s spent grain in steamed bread-making based on physicochemical and visual profiles assessment of doughs and breads. Food Sci. Technol. Int. 2024, 32, 10820132241260453. [Google Scholar] [CrossRef]
  47. Sato, Y. Structural recoverability of white breads based on the “cohesiveness” value from texture profile analysis and the “compression force value” from the American Association of Cereal Chemists (74–09). J. Texture Stud. 2025, 56, e70028. [Google Scholar] [CrossRef] [PubMed]
  48. Codină, G.G.; Bordei, D.; Pâslaru, V. The effects of different doses of gluten on rheological behaviour of dough and bread quality. Roum. Biotechnol. Lett. 2008, 13, 37–42. [Google Scholar]
  49. Heuven, L.A.J.; Dekker, M.; Renzetti, S.; Bolhuis, D.P. The eating rate of bread predicted from its sensory texture and physical properties. Food Funct. 2024, 15, 12244–12255. [Google Scholar] [CrossRef]
  50. Baiano, A.; La Gatta, B.; Rutigliano, M.; Fiore, A. Functional bread produced in a circular economy perspective: The use of brewers’ spent grain. Foods 2023, 12, 834. [Google Scholar] [CrossRef]
Figure 1. Evaluation of the frequency of storage modulus (G′), loss modulus (G″) and loss tangent (tan δ) for the dough samples (data shown are for the Ingen 33 sample; the rest of the data can be seen in the Supplementary Material).
Applsci 16 05407 g001aApplsci 16 05407 g001b
Figure 2. Sensory characteristics of bread samples: (a) without dark brewer’s spent grain sourdough; (b) with 5% dark brewer’s spent grain sourdough; (c) with 10% dark brewer’s spent grain sourdough.
Applsci 16 05407 g002
Table 1. Mixolab parameters of triticale dough with different levels of dark brewers’ spent sourdough.
SamplesWA
(%)
ST
(min)
DDT (min)C1
(N∙m)
C2
(N∙m)
C3
(N∙m)
C4
(N∙m)
C5
(N∙m)
C12
(N∙m)
C32
(N∙m)
C34
(N∙m)
C54
(N∙m)
Ingen 3359.0 ± 0.2 a2.30 ± 0.03 a2.53 ± 0.03 a1.137 ± 0.001 c0.397 ± 0.002 c1.618 ± 0.009 a0.364 ± 0.005 a0.644 ± 0.001 b0.740 ± 0.004 a1.221 ± 0.001 a1.254 ± 0.009 b0.280 ± 0.004 b
Ingen33_5BSF59.0 ± 0.1 a2.91 ± 0.04 c3.00 ± 0.02 b1.125 ± 0.002 b0.343 ± 0.004 b1.688 ± 0.006 c0.377 ± 0.011 b0.629 ± 0.007 a0.782 ± 0.003 b1.345 ± 0.005 c1.311 ± 0.012 c0.252 ± 0.009 a
Ingen33_10BSF59.0 ± 0.1 a2.60 ± 0.01 b3.10 ± 0.01 c1.119 ± 0.001 a0.321 ± 0.001 a1.630 ± 0.001 b0.399 ± 0.009 c0.685 ± 0.004 c0.798 ± 0.001 c1.309 ± 0.011 b1.231 ± 0.002 a0.286 ± 0.005 b,c
Ingen 4057.5 ± 0.0 a6.30 ± 0.07 c4.78 ± 0.03 c1.130 ± 0.001 b0.462 ± 0.001 c2.027 ± 0.006 c0.675 ± 0.013 a1.245 ± 0.013 b0.668 ± 0.002 a1.565 ± 0.0c1.352 ± 0.003 c0.570 ± 0.001 c
Ingen40_5BSF58.0 ± 0.1 b5.22 ± 0.03 b4.13 ± 0.05 b1.102 ± 0.003 a0.402 ± 0.002 b1.913 ± 0.005 b0.756 ± 0.007 c1.295 ± 0.009 c0.700 ± 0.001 b1.511 ± 0.002 b1.157 ± 0.008 b0.539 ± 0.007 b
Ingen40_10BSF58.0 ± 0.1 b4.51 ± 0.06 a4.05 ± 0.01 a1.102 ± 0.001 a0.358 ± 0.003 a1.841 ± 0.001 a0.730 ± 0.012 b1.239 ± 0.006 a0.744 ± 0.001 c1.483 ± 0.007 a1.111 ± 0.004 a0.509 ± 0.004 a
Ingen 3559.4 ± 0.1 a2.90 ± 0.05 c3.00 ± 0.01 c1.119 ± 0.002 b0.365 ± 0.004 c1.782 ± 0.005 c0.515 ± 0.010 a0.942 ± 0.018 a0.754 ± 0.002 a1.417 ± 0.009 c1.267 ± 0.012 c0.427 ± 0.008 c
Ingen35_5BSF59.4 ± 0.1 a2.42 ± 0.04 b2.85 ± 0.04 b1.121 ± 0.001 a,b0.351 ± 0.002 b1.532 ± 0.004 b0.521 ± 0.006 b0.940 ± 0.013 a0.770 ± 0.001 b1.181 ± 0.003 a1.011 ± 0.009 b0.419 ± 0.005 b
Ingen35_10BSF59.4 ± 0.1 a2.23 ± 0.01 a2.72 ± 0.02 a1.114 ± 0.0 a0.319 ± 0.001 a1.512 ± 0.005 a0.540 ± 0.008 c0.951 ± 0.010 b0.795 ± 0.003 c1.193 ± 0.007 b0.972 ± 0.012 a0.411 ± 0.004 a
Ingen 5459.2 ± 0.1 a3.80 ± 0.07 c4.08 ± 0.02 c1.103 ± 0.002 c0.418 ± 0.003 c1.977 ± 0.004 c0.872 ± 0.012 a1.527 ± 0.012 a0.685 ± 0.002 a1.559 ± 0.003c1.105 ± 0.010 b0.655 ± 0.011 a
Ingen54_5BSF59.2 ± 0.1 a2.61 ± 0.0 a3.30 ± 0.01 a1.111 ± 0.001 b0.351 ± 0.001 b1.661 ± 0.007 b0.900 ± 0.015 b1.633 ± 0.008 c0.760 ± 0.003 b1.310 ± 0.009 a0.761 ± 0.007 a0.733 ± 0.009 c
Ingen54_10BSF59.2 ± 0.1 a2.92 ± 0.02 b3.45 ± 0.02 b1.103 ± 0.002 a0.331 ± 0.002 a1.651 ± 0.003 a0.899 ± 0.011 b1.600 ± 0.011 b0.772 ± 0.002c1.320 ± 0.011 b0.752 ± 0.013 a0.701 ± 0.005 b
Ingen 9358.3 ± 0.1 a2.60 ± 0.01 a2.85 ± 0.05 a1.113 ± 0.001 b0.344 ± 0.003 c1.765 ± 0.008 b0.450 ± 0.014 a0.817 ± 0.031 a0.769 ± 0.001b1.421 ± 0.009 b1.315 ± 0.009 c0.367 ± 0.012 c
Ingen93_5BSF59.9 ± 0.0 c2.90 ± 0.01 b3.10 ± 0.01 b1.124 ± 0.002 c0.328 ± 0.002 b1.773 ± 0.001c0.486 ± 0.007 b0.817 ± 0.015 da0.796 ± 0.003 b1.445 ± 0.004 c1.287 ± 0.003 b0.331 ± 0.006 a
Ingen93_10BSF58.7 ± 0.0 b2.90 ± 0.02 b3.23 ± 0.03 c1.081 ± 0.002 a0.296 ± 0.001 a1.682 ± 0.004 a0.502 ± 0.001 c0.852 ± 0.007 b0.785 ± 0.002 a1.386 ± 0.004 a1.180 ± 0.002 a0.350 ± 0.008 b
Costel60.0 ± 0.1 a2.80 ± 0.02 c2.97 ± 0.03 a1.095 ± 0.001 b0.379 ± 0.001 c1.449 ± 0.001 c0.326 ± 0.006 b0.599 ± 0.008c0.716 ± 0.002 a1.070 ± 0.006 c1.123 ± 0.002 c0.273 ± 0.002 c
Costel_5BSF60.0 ± 0.1 a2.50 ± 0.05 a3.07 ± 0.02 a1.059 ± 0.001 a0.331 ± 0.003 b1.325 ± 0.001 a0.268 ± 0.011 a0.463 ± 0.006 a0.728 ± 0.003 b0.994 ± 0.002 a1.057 ± 0.004 b0.195 ± 0.003 a
Costel_10BSF60.0 ± 0.1 a2.61 ± 0.0 b2.98 ± 0.01 a1.120 ± 0.003 c0.319 ± 0.001 a1.342 ± 0.0 b0.327 ± 0.007 b0.561 ± 0.013 b0.801 ± 0.001 c1.023 ± 0.006 b1.015 ± 0.007 a0.234 ± 0.005 b
Fanica60.2 ± 0.1 a2.50 ± 0.04 a3.45 ± 0.03 b1.112 ± 0.001 c0.421 ± 0.001 c1.416 ± 0.001 c0.302 ± 0.005 b0.552 ± 0.015 c0.691 ± 0.001 a0.995 ± 0.009 c1.114 ± 0.003 c0.250 ± 0.007 c
Fanica_5BSF60.2 ± 0.1 a2.61 ± 0.03 b3.45 ± 0.02 b1.072 ± 0.001 a0.365 ± 0.001 b1.281 ± 0.004 b0.265 ± 0.009 a0.453 ± 0.003 a0.707 ± 0.003 b0.916 ± 0.006 a1.016 ± 0.011 b0.188 ± 0.011 a
Fanica_10BSF60.2 ± 0.1 a2.90 ± 0.02 c3.07 ± 0.03 a1.097 ± 0.002 b0.343 ± 0.001 a1.271 ± 0.007 a0.304 ± 0.007 b0.511 ± 0.002 b0.754 ± 0.001 c0.928 ± 0.007 b0.967 ± 0.008 a0.207 ± 0.009 b
Mixolab parameters: WA—water absorption; ST—stability; DDT—dough development time; C1–C5—maximum consistency during stages 1–5 respectively; C12—difference between torques C1 and C2; C32—difference between torques C3 and C2; C34—difference between torques C3 and C4; C54—difference between torques C5 and C4; a–c means that different letters in the same column indicate significant differences (p < 0.05) among triticale varieties and BSF concentrations.
Table 2. Alveograph parameters of triticale dough with different levels of dark brewers’ spent sourdough.
SamplesP (mm)L (mm)G (mm)W (10−4 J)P/L
Ingen 33100 ± 1.2 c37 ± 0.6 c13.5 ± 0.2 c114 ± 0.2 c2.70 ± 0.04 a
Ingen33_5BSF71 ± 1.4 b14 ± 0.2 b8.3 ± 0.5 b49 ± 0.3 b5.07 ± 0.10 b
Ingen33_10BSF62 ± 1.6 a11 ± 0.2 a7.4 ± 0.1 a40 ± 0.1 a5.63 ± 0.09 c
Ingen 40110 ± 1.0 c41 ± 1.1 c14.2 ± 0.4 c150 ± 0.7 c2.68 ± 0.07 a
Ingen40_5BSF95 ± 0.9 b14 ± 0.6 b8.3 ± 0.7 b66 ± 0.2 b6.79 ± 0.12 b
Ingen40_10BSF90 ± 1.2 a10 ± 0.5 a7.0 ± 0.5 a52 ± 0.5 a9.00 ± 0.22 c
Ingen 35102 ± 0.9 c31 ± 1.0 c12.4 ± 0.4 c112 ± 1.0 c3.29 ± 0.07 a
Ingen35_5BSF74 ± 1.6 b13 ± 0.3 a8.0 ± 0.2 a51 ± 0.7 b5.69 ± 0.18 c
Ingen35_10BSF58 ± 1.0 a14 ± 0.7 a,b8.3 ± 0.5 a,b42 ± 0.5 a4.14 ± 0.12 b
Ingen 54106 ± 0.5 c32 ± 1.3 c12.6 ± 0.8 c129 ± 1.2 c3.31 ± 0.08 a
Ingen54_5BSF64 ± 1.3 b16 ± 0.8 a8.9 ± 0.6 a50 ± 0.6 b4.00 ± 0.13 b
Ingen54_10BSF60 ± 0.2 a18 ± 1.0 a,b9.4 ± 0.2 a,b47 ± 0.3 a3.33 ± 0.07 a
Ingen 9395 ± 1.2 c32 ± 0.9 c12.6 ± 0.4 c99 ± 0.5 c2.97 ± 0.05 a
Ingen93_5BSF93 ± 0.8 b13 ± 0.4 b8.0 ± 0.1 b56 ± 0.4 b7.15 ± 0.13 b
Ingen93_10BSF85 ± 1.1 a10 ± 0.6 a7.0 ± 0.2 a35 ± 0.3 a8.40 ± 0.09 c
Costel99 ± 2.0 b32 ± 1.4 c12.6 ± 0.5 c104 ± 0.8 c3.09 ± 0.07 a
Costel_5BSF100 ± 1.1 b7 ± 0.1 a5.9 ± 0.2 a33 ± 0.5 a14.29 ± 0.15 c
Costel_10BSF82 ± 1.5 a10 ± 0.6 b7.0 ± 0.4 b39 ± 0.6 b8.20 ± 0.13b
Fanica125 ± 2.3 c33 ± 0.8 c12.8 ± 0.3 c147 ± 1.2 c3.79 ± 0.11 a
Fanica_5BSF102 ± 1.4 b12 ± 1.0 a7.7 ± 0.1 a60 ± 0.4 a8.50 ± 0.06 c
Fanica_10BSF90 ± 1.2 a14 ± 0.9 b8.3 ± 0.3 a,b64 ± 0.6 b6.43 ± 0.08 b
Alveograph parameters: P, maximum pressure; L, dough extensibility; G, index of swelling; W, baking strength; P/L, configuration ratio of the Alveograph curve; a–c means that different letters in the same column indicate significant differences (p < 0.05) among types of triticale variety and BSF concentrations.
Table 3. Rheofermentometer parameters of triticale dough with different levels of dark brewers’ spent sourdough.
Dough SamplesH’m (mm)VT (mL)VR (mL)CR (%)FN (s)
Ingen 3387.1 ± 0.9 c1647 ± 9 c1640 ± 2 c99.5 ± 0.4 c73 ± 1 b
Ingen33_5BSF64.4 ± 0.6 a1403 ± 12 a1086 ± 5 a77.4 ± 0.1 b71 ± 1 b
Ingen33_10BSF74.6 ± 0.3 b1562 ± 15 b1135 ± 7 b72.7 ± 0.6 a70 ± 1 a,b
Ingen 4085.4 ± 0.7 c1607 ± 6 c1590 ± 11 c98.9 ± 0.3 c111 ± 2 b,c
Ingen40_5BSF67.5 ± 0.2 b1459 ± 8 b1099 ± 7 b75.3 ± 0.5 a108 ± 1 b
Ingen40_10BSF66.1 ± 0.6 a1383 ± 7 a1068 ± 3 a77.2 ± 0.3 b94 ± 1 a
Ingen 3588.7 ± 0.0 c1921 ± 11c1907 ± 9 c99.2 ± 0.7 c102 ± 1 c
Ingen35_5BSF68.8 ± 0.5 a1525 ± 6 a1103 ± 6 a72.3 ± 0.6 b91 ± 1 b
Ingen35_10BSF72.4 ± 0.6 b1709 ± 5 b1207 ± 5 b70.6 ± 0.5 a86 ± 1 a
Ingen 5487.4 ± 0.8 c1631 ± 8 c1620 ± 10 c99.3 ± 0.4 c136 ± 2 c
Ingen54_5BSF73.2 ± 0.4 a1574 ± 10 a1183 ± 9 a75.2 ± 0.9 a120 ± 1 a,b
Ingen54_10BSF75.3 ± 0.4 b1605 ± 4 b1215 ± 5 b75.7 ± 0.4 a118 ± 2 a
Ingen 9387.2 ± 0.6 c1743 ± 6 c1727 ± 6 c99.1 ± 0.6 c120 ± 1 c
Ingen93_5BSF72.8 ± 0.3 b1512 ± 9 b1179 ± 10 b78.0 ± 0.4 a105 ± 2 b
Ingen93_10BSF68.5 ± 0.7 a1396 ± 11 a1130 ± 8 a80.9 ± 0.3 b86 ± 1 a
Costel68.4 ± 0.4 a1328 ± 9 a1311 ± 9 c98.7 ± 0.6 c71 ± 1 b
Costel_5BSF69.4 ± 0.0 a1487 ± 7 b1165 ± 12 a78.4 ± 0.8 b70 ± 1 a,b
Costel_10BSF73.7 ± 0.3 b1568 ± 13 c1189 ± 9 b75.8 ± 0.6 a68 ± 1 a
Fanica88.4 ± 0.3 c1648 ± 8 c1602 ± 13 c97.2 ± 0.3 b73 ± 1 c
Fanica_5BSF72.4 ± 0.5 a1521 ± 5 a1124 ± 10 a73.9 ± 0.4 a71 ± 1 b,c
Fanica_10BSF74.2 ± 0.7 b1630 ± 4 b1199 ± 9 b73.6 ± 0.6 a69 ± 1 a,b
Rheofermentometer parameters: H’m—maximum height of gaseous production; VT—total CO2 volume production; VR—volume of the gas retained in the dough at the end of the test; CR—retention coefficient; a–c means that different letters in the same column indicate significant differences (p < 0.05) among types of triticale variety and BSF concentrations; FN—Falling numbers values.
Table 4. Physical–chemical characteristics of the bread samples.
SamplesLoaf Volume
(cm3/100 g)
Porosity
(%)
Elasticity
(%)
Acidity
(Degrees)
L*a*b*
Ingen 33261 ± 2 c52.6 ± 0.2 c61.3 ± 0.5 c5.46 ± 0.05 a47.82 ± 0.07 c8.01 ± 0.05 a19.94 ± 0.21 a
Ingen33_5BSF249 ± 1 a,b49.3 ± 0.6 b59.7 ± 0.3 fb7.40 ± 0.02 b44.79 ± 0.12 b9.64 ± 0.07 c28.23 ± 0.35 b
Ingen33_10BSF247 ± 1 a48.4 ± 0.5 a57.6 ± 0.0 a8.58 ± 0.03 c37.68 ± 0.19 a8.31 ± 0.12 b29.94 ± 0.16 c
Ingen 40239 ± 2 c58.3 ± 0.2 c67.3 ± 0.2 c4.60 ± 0.02 a51.80 ± 0.24 c6.19 ± 0.07 b16.31 ± 0.28 a
Ingen40_5BSF213 ± 1 b43.5 ± 0.6 b53.7 ± 0.3 b7.14 ± 0.01 b43.99 ± 0.13 b5.44 ± 0.09 a17.67 ± 0.30 b
Ingen40_10BSF210 ± 1 a42.9 ± 0.3 a,b50.8 ± 0.2 a8.21 ± 0.01 c33.14 ± 0.09 a7.18 ± 0.12 c21.56 ± 0.26 c
Ingen 35261 ± 3 c52.3 ± 0.4 c61.1 ± 0.5 c5.44 ± 0.03 a58.08 ± 0.16 c10.68 ± 0.08 a20.71 ± 0.18 b
Ingen35_5BSF255 ± 2 b46.8 ± 0.5 b57.8 ± 0.6 b7.16 ± 0.05 b51.93 ± 0.09b16.50 ± 0.10 c18.82 ± 0.23 a
Ingen35_10BSF228 ± 4 a46.0 ± 0.2 a54.5 ± 0.2 a8.64 ± 0.05 c39.98 ± 0.18 a12.17 ± 0.14 b23.09 ± 0.18 c
Ingen 54264 ± 4 c52.7 ± 0.1 c62.2 ± 0.3 c5.40 ± 0.02 a51.66 ± 0.25 c4.73 ± 0.04 a27.00 ± 0.15 c
Ingen54_5BSF251 ± 3 b48.4 ± 0.3 b58.7 ± 0.2 b6.92 ± 0.06 b35.75 ± 0.12 b10.80 ± 0.09 c19.73 ± 0.11 a
Ingen54_10BSF238 ± 1 a47.5 ± 0.3 a55.8 ± 0.2 a8.24 ± 0.5 c31.29 ± 0.25 a9.91 ± 0.15 b24.81 ± 0.25b
Ingen 93253 ± 1 c54.4 ± 0.1 c63.7 ± 0.3 c5.44 ± 0.03 a49.34 ± 0.16 c5.64 ± 0.06 b19.24 ± 0.13 b
Ingen93_5BSF245 ± 3 a,b43.7 ± 0.3 b58.2 ± 0.4 b7.27 ± 0.04 b44.88 ± 0.11 b7.01 ± 0.13 c23.66 ± 0.15 c
Ingen93_10BSF243 ± 1 a41.5 ± 0.1 a53.1 ± 0.1 a8.54 ± 0.04 c32.05 ± 0.09 a4.68 ± 0.04 a18.80 ± 0.11 a
Costel260 ± 2 c51.3 ± 0.1 c64.8 ± 0.5 c5.70 ± 0.02 a57.59 ± 0.18c6.78 ± 0.06 b23.88 ± 0.15 a
Costel_5BSF240 ± 2 b44.9 ± 0.3 b58.7 ± 0.2 b7.82 ± 0.04 b46.22 ± 0.15 b5.15 ± 0.02 a33.21 ± 0.23 c
Costel_10BSF216 ± 1 a43.3 ± 0.4 a52.4 ± 0.5 a8.35 ± 0.05 c30.05 ± 0.11 a8.49 ± 0.17 c25.92 ± 0.19 b
Fanica242 ± 1 c52.4 ± 0.3 c65.9 ± 0.3 c6.46 ± 0.01 a50.44 ± 0.16 c10.72 ± 0.13 b35.00 ± 0.22 c
Fanica_5BSF232 ± 2 b47.6 ± 0.3 b59.2 ± 0.1 b7.52 ± 0.03 b38.80 ± 0.12 b7.21 ± 0.11 a29.46 ± 0.19 a
Fanica_10BSF225 ± 2 a46.9 ± 0.1 a53.9 ± 0.3 a8.94 ± 0.0 c32.02 ± 0.17 a10.75 ± 0.15 b30.02 ± 0.11 b
L*, darkness/brightness; a*, shade of red/green; b*, shade of blue/yellow. a–c means that different letters in the same column indicate significant differences (p < 0.05) among types of triticale variety and BSF concentrations.
Table 5. Textural characteristics of the bread samples.
SamplesHardness
(N)
Adhesivity
(N·s)
Cohesiveness
(Dimensionless)
Resilience (Dimensionless)Chewiness
(N)
Ingen 3328.48 ± 0.31 a21.12 ± 0.09 a0.570 ± 0.004 b0.275 ± 0.002 b16.24 ± 0.09 a
Ingen33_5BSF35.72 ± 0.29 b26.76 ± 0.16 b0.609 ± 0.006 c0.307 ± 0.004 c21.76 ± 0.21 b
Ingen33_10BSF48.73 ± 0.41 c37.81 ± 0.21 c0.501 ± 0.0 a0.228 ± 0.002 a24.41 ± 0.25 c
Ingen 4021.26 ± 0.18 a14.62 ± 0.05 a0.719 ± 0.003 b0.380 ± 0.001 a15.29 ± 0.16 a
Ingen40_5BSF40.68 ± 0.34 b37.13 ± 0.17 c0.695 ± 0.005 a0.399 ± 0.006 b28.27 ± 0.27 b
Ingen40_10BSF42.63 ± 0.27 c28.21 ± 0.19 b0.746 ± 0.007 c0.438 ± 0.005 c31.82 ± 0.31 c
Ingen 3522.79 ± 0.14 a16.87 ± 0.07 a0.669 ± 0.003 c0.354 ± 0.003 c15.24 ± 0.06 a
Ingen35_5BSF39.46 ± 0.23 b35.36 ± 0.25 b0.634 ± 0.003 a0.315 ± 0.006 b25.01 ± 0.11 b
Ingen35_10BSF39.52 ± 0.18 b38.28 ± 0.19 c0.642 ± 0.005 b0.231 ± 0.003 a25.37 ± 0.23 b
Ingen 5426.15 ± 0.13 a19.03 ± 0.10 a0.637 ± 0.006 a0.338 ± 0.006 a16.65 ± 0.12 a
Ingen54_5BSF27.09 ± 0.19 b20.17 ± 0.14 b0.699 ± 0.004 c0.387 ± 0.005 c18.92 ± 0.16 b
Ingen54_10BSF32.47 ± 0.25 c24.21 ± 0.17 c0.680 ± 0.006 b0.364 ± 0.004 b22.09 ± 0.22 c
Ingen 9322.44 ± 0.18 a16.16 ± 0.08 ba0.760 ± 0.005 c0.437 ± 0.004 c17.06 ± 0.06 a
Ingen93_5BSF31.38 ± 0.21 b27.81 ± 0.12 b0.552 ± 0.007 a0.254 ± 0.003 b17.32 ± 0.11 b
Ingen93_10BSF31.64 ± 0.16 b,c31.91 ± 0.23 c0.561 ± 0.003 a,b0.231 ± 0.002 a17.75 ± 0.17 c
Costel35.57 ± 0.13 a31.62 ± 0.16 a0.575 ± 0.004 a0.276 ± 0.002 a20.45 ± 0.25 a
Costel_5BSF47.16 ± 0.24 b34.91 ± 0.11 b0.601 ± 0.006 b0.302 ± 0.001 b28.37 ± 0.16 b
Costel_10BSF53.36 ± 0.21 c37.05 ± 0.24 c0.711 ± 0.003 c0.379 ± 0.002 c37.97 ± 0.24 c
Fanica35.99 ± 0.13 a25.64 ± 0.18 a0.613 ± 0.004 c0.306 ± 0.005 c22.08 ± 0.13 a
Fanica_5BSF52.92 ± 0.16 b42.09 ± 0.25 c0.590 ± 0.006 a0.267 ± 0.004 b31.23 ± 0.08 b
Fanica_10BSF53.18 ± 0.26 b,c38.44 ± 0.21 b0.603 ± 0.004 b0.221 ± 0.005 a32.06 ± 0.11 c
a–c means that different letters in the same column indicate significant differences (p < 0.05) among types of triticale variety and BSF concentrations.
Disclaimer/Publisher’s Note: The statements, opinions and data contained in all publications are solely those of the individual author(s) and contributor(s) and not of MDPI and/or the editor(s). MDPI and/or the editor(s) disclaim responsibility for any injury to people or property resulting from any ideas, methods, instructions or products referred to in the content.