Article

Simulation Modeling and Schedule Optimization for Arch Dam Construction in High-Altitude Regions with Severe Temperature Variations

1
Key Laboratory of Intelligent Health Perception and Ecological Restoration of Rivers and Lakes, Ministry of Education, Hubei University of Technology, Wuhan 430068, China
2
School of Hydraulic and Environmental Engineering, China Three Gorges University, Yichang 443002, China
*
Author to whom correspondence should be addressed.
Appl. Sci. 2026, 16(11), 5390; https://doi.org/10.3390/app16115390
Submission received: 10 April 2026 / Revised: 19 May 2026 / Accepted: 25 May 2026 / Published: 28 May 2026

Abstract

In the construction of conventional concrete high arch dams in high-altitude regions with large temperature variations, the prolonged and cold winters often force the suspension of concrete pouring, severely constraining the overall schedule. To address this limitation, this paper breaks away from the conventional winter-shutdown scheme by proposing a new technique: continuous construction under low-temperature conditions. It can adapt to large temperature variations, and this study develops a corresponding construction schedule simulation model for quantitative evaluation and scheme optimization. First, the influence of large diurnal temperature variations on high-altitude concrete pouring was analyzed. Based on this, a dynamic pouring technique for sub-blocks is proposed—thin-layer pouring during positive temperatures and insulation curing during negative temperatures—with the aim of transforming discrete climatic windows into a continuous construction period. Second, to accurately simulate this complex spatial partitioning and temporal scheduling process, a customized schedule simulation model based on discrete-event simulation (DES) theory was developed. The model incorporated meteorological recognition at low temperatures, dynamic dam-block partitioning, and sub-block pouring scheduling. Finally, a high arch dam on a plateau in Southwest China was used as an engineering case to compare two construction schemes: the low-temperature shutdown scheme and the continuous construction scheme. After validating the simulation model under parameter assumptions such as ideal resource availability and stable annual climate patterns, the results showed that the continuous construction scheme achieves a monthly average pouring volume of 33,721 m3 during the period with large diurnal temperature variations, which accounts for 42.48% of the average monthly pouring volume during the normal construction period. Compared to the low-temperature shutdown scheme, the coefficient of variation of the monthly pouring intensity decreases by about 40%, and the total construction period is shortened by approximately ten months. This demonstrates the potential for schedule optimization for continuous winter construction in simulation.

1. Introduction

Conventional concrete arch dams (hereinafter referred to as arch dams) are widely used in the high-altitude region of Southwest China due to their unique structural characteristics and economic advantages [1,2]. Arch dams are typically constructed using the jointing-and-blocking method. First, transverse joints divide the dam body into several monoliths, and then horizontal construction joints subdivide each monolith into layers, forming pouring blocks [3,4]. Each block undergoes preparation, concrete placement, curing, and other steps, and the dam is built gradually from the bottom to the crest. Meanwhile, during the temperature control process, joint grouting of the transverse joint surfaces is carried out sequentially in grouting zones, which ultimately forms a complete dam body [5,6]. In arch dam construction, concrete pouring and temperature control procedures are interdependent, which creates complex constraints that complicate schedule control and optimization [7,8]. Discrete-event simulation (DES) technology, which excels at handling discrete and dynamic system logic [9,10,11], has been applied to analyze high arch dam construction and simulate construction progress and resource status under different decision scenarios [12]. Reference [13] used DES to model the arch dam construction system, including concrete production, transport, and pouring. This enabled schedule prediction and analysis, providing decision support for schedule control. Reference [14] expanded the application boundaries of DES in construction schedule simulation, emphasizing the importance of quality–schedule coupling simulation, which is valuable for high-precision construction modeling. Reference [15] employed an orthogonal experimental design to identify key control parameters that restrict construction rates. Reference [16] proposed a multi-scale simulation framework to enable joint planning and unified decision-making for cable crane and pouring block matching and pouring operations, which can improve the accuracy of scheduling simulations.
Although these DES-based simulation models have made significant progress in terms of schedule simulation for arch dam construction, a common limitation remains: the modeling is too coarse to capture extremely large diurnal temperature variations in high-altitude regions. For high arch dams built in cold, high-altitude regions, there is a contradiction between the region’s large, long-term temperature differences with hypoxic conditions and the tight construction schedule [17,18]. Under low temperatures, freshly placed concrete blocks are highly susceptible to freeze damage [19,20]. In practice, common temperature control measures include material heating, electric heating, heat storage, and warm-shed insulation. However, due to high costs and the difficulty of consistently ensuring pouring quality, most projects are forced to adopt a prolonged winter shutdown lasting several months [21,22]. Also, hypoxic conditions reduce the efficiency of both workers and machinery [23]. These dual adverse effects cause severe schedule delays and increase management complexity. When dealing with winter in existing simulation models, reference [24] incorporated a low-temperature shutdown mechanism into the arch dam simulation model; reference [25] considered the influence of different winter-shutdown durations on concrete pouring progress; reference [26] predicted next-stage weather conditions to update arch dam simulation parameters; reference [27] proposed schedule assurance measures for severe cold regions and evaluated the effectiveness of these measures using simulation models; and reference [28] predicted winter temperature sequences to determine the daily constructable duration. The above simulation models adopt two simplification strategies: one treats the entire winter as a period with low construction efficiency; the other directly sets it to mandatory shutdown. Both strategies are essentially passive adaptations and fail to capture the unique diurnal alternation of positive and negative temperatures in high-altitude regions, where there are several hours of positive-temperature windows during the day and temperatures drop below freezing at night. Due to a lack of understanding of daily temperature variation, existing simulation frameworks cannot use daily positive-temperature windows to enable continuous winter construction by adjusting the construction method. The absence of a simulation module that adapts to large diurnal temperature variation and construction techniques makes it impossible to evaluate the schedule optimization potential of active, adaptive continuous winter construction strategies.
Therefore, to fundamentally solve this problem, it is necessary not only to propose a new organization strategy that actively adapts to large diurnal temperature variation in construction but also to develop a customized simulation model that accurately maps this strategy in theory. Accordingly, this paper breaks with the conventional winter shutdown and proposes a dynamic sub-block pouring strategy adapted to the large winter diurnal temperature variation in high-altitude regions (i.e., using short positive-temperature windows in winter for thin-layer sub-block pouring). Based on DES theory, a schedule simulation model was developed that integrates low-temperature meteorological recognition, dynamic dam-block partitioning, and sub-block pouring scheduling, enabling adaptive switching between conventional and dynamic sub-block pouring based on temperature parameters.
The main scientific contributions of this paper can be summarized as follows: (1) a continuous construction strategy is proposed that actively utilizes the diurnal alternating positive- and negative-temperature windows in winter; (2) a climate-driven DES simulation framework is constructed to fill the gap in existing models, which cannot simulate dynamic sub-block pouring; and (3) a case study of a high arch dam on a plateau in Southwest China is conducted to compare the schedule advantages and construction uniformity improvement of the new process versus the conventional shutdown scheme through simulation.
The remainder of this paper is organized as follows. Section 2 describes the principles of the dynamic sub-block pouring process. Section 3 presents the DES schedule simulation model that integrates environmental recognition and dynamic sub-block decision-making. Section 4 validates the model and analyzes simulation results through a case study. Section 5 discusses and concludes the findings.

2. Principles and Analysis of New Construction Technology

2.1. Analysis of Plateau Climate Characteristics and Construction Challenges

High-altitude regions are characterized by prolonged periods of low temperatures and significant diurnal temperature variations, which often force most projects to suspend construction during winter and severely constrain schedules. Against this background, it has become a critical issue to achieve continuous winter construction, which can alleviate schedule pressures while ensuring project quality.
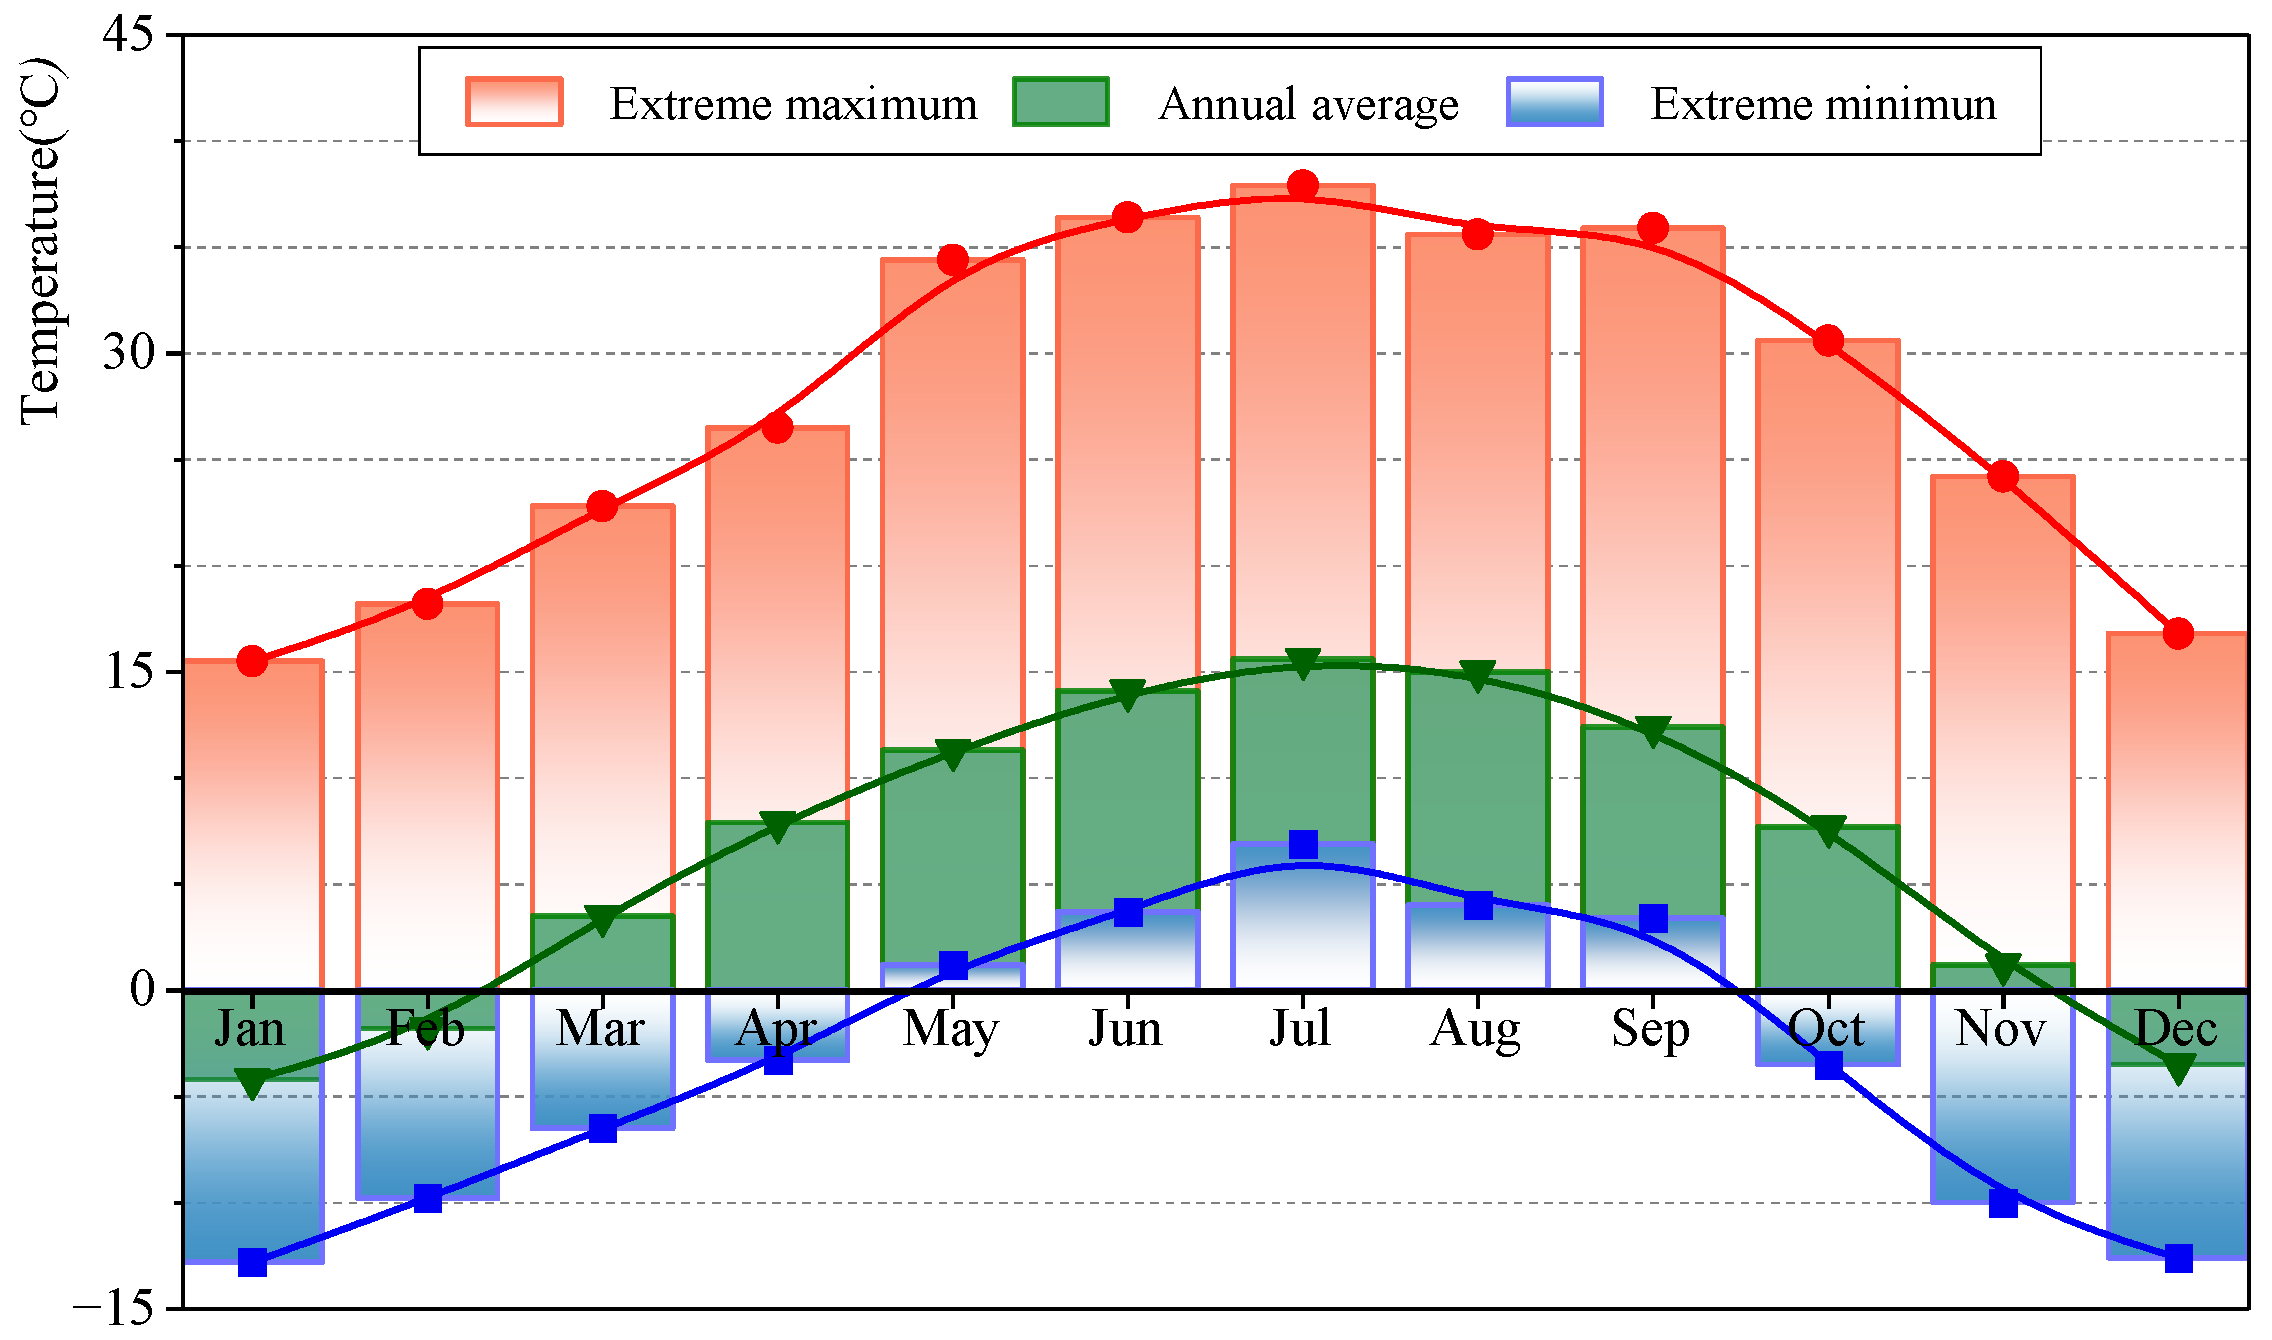
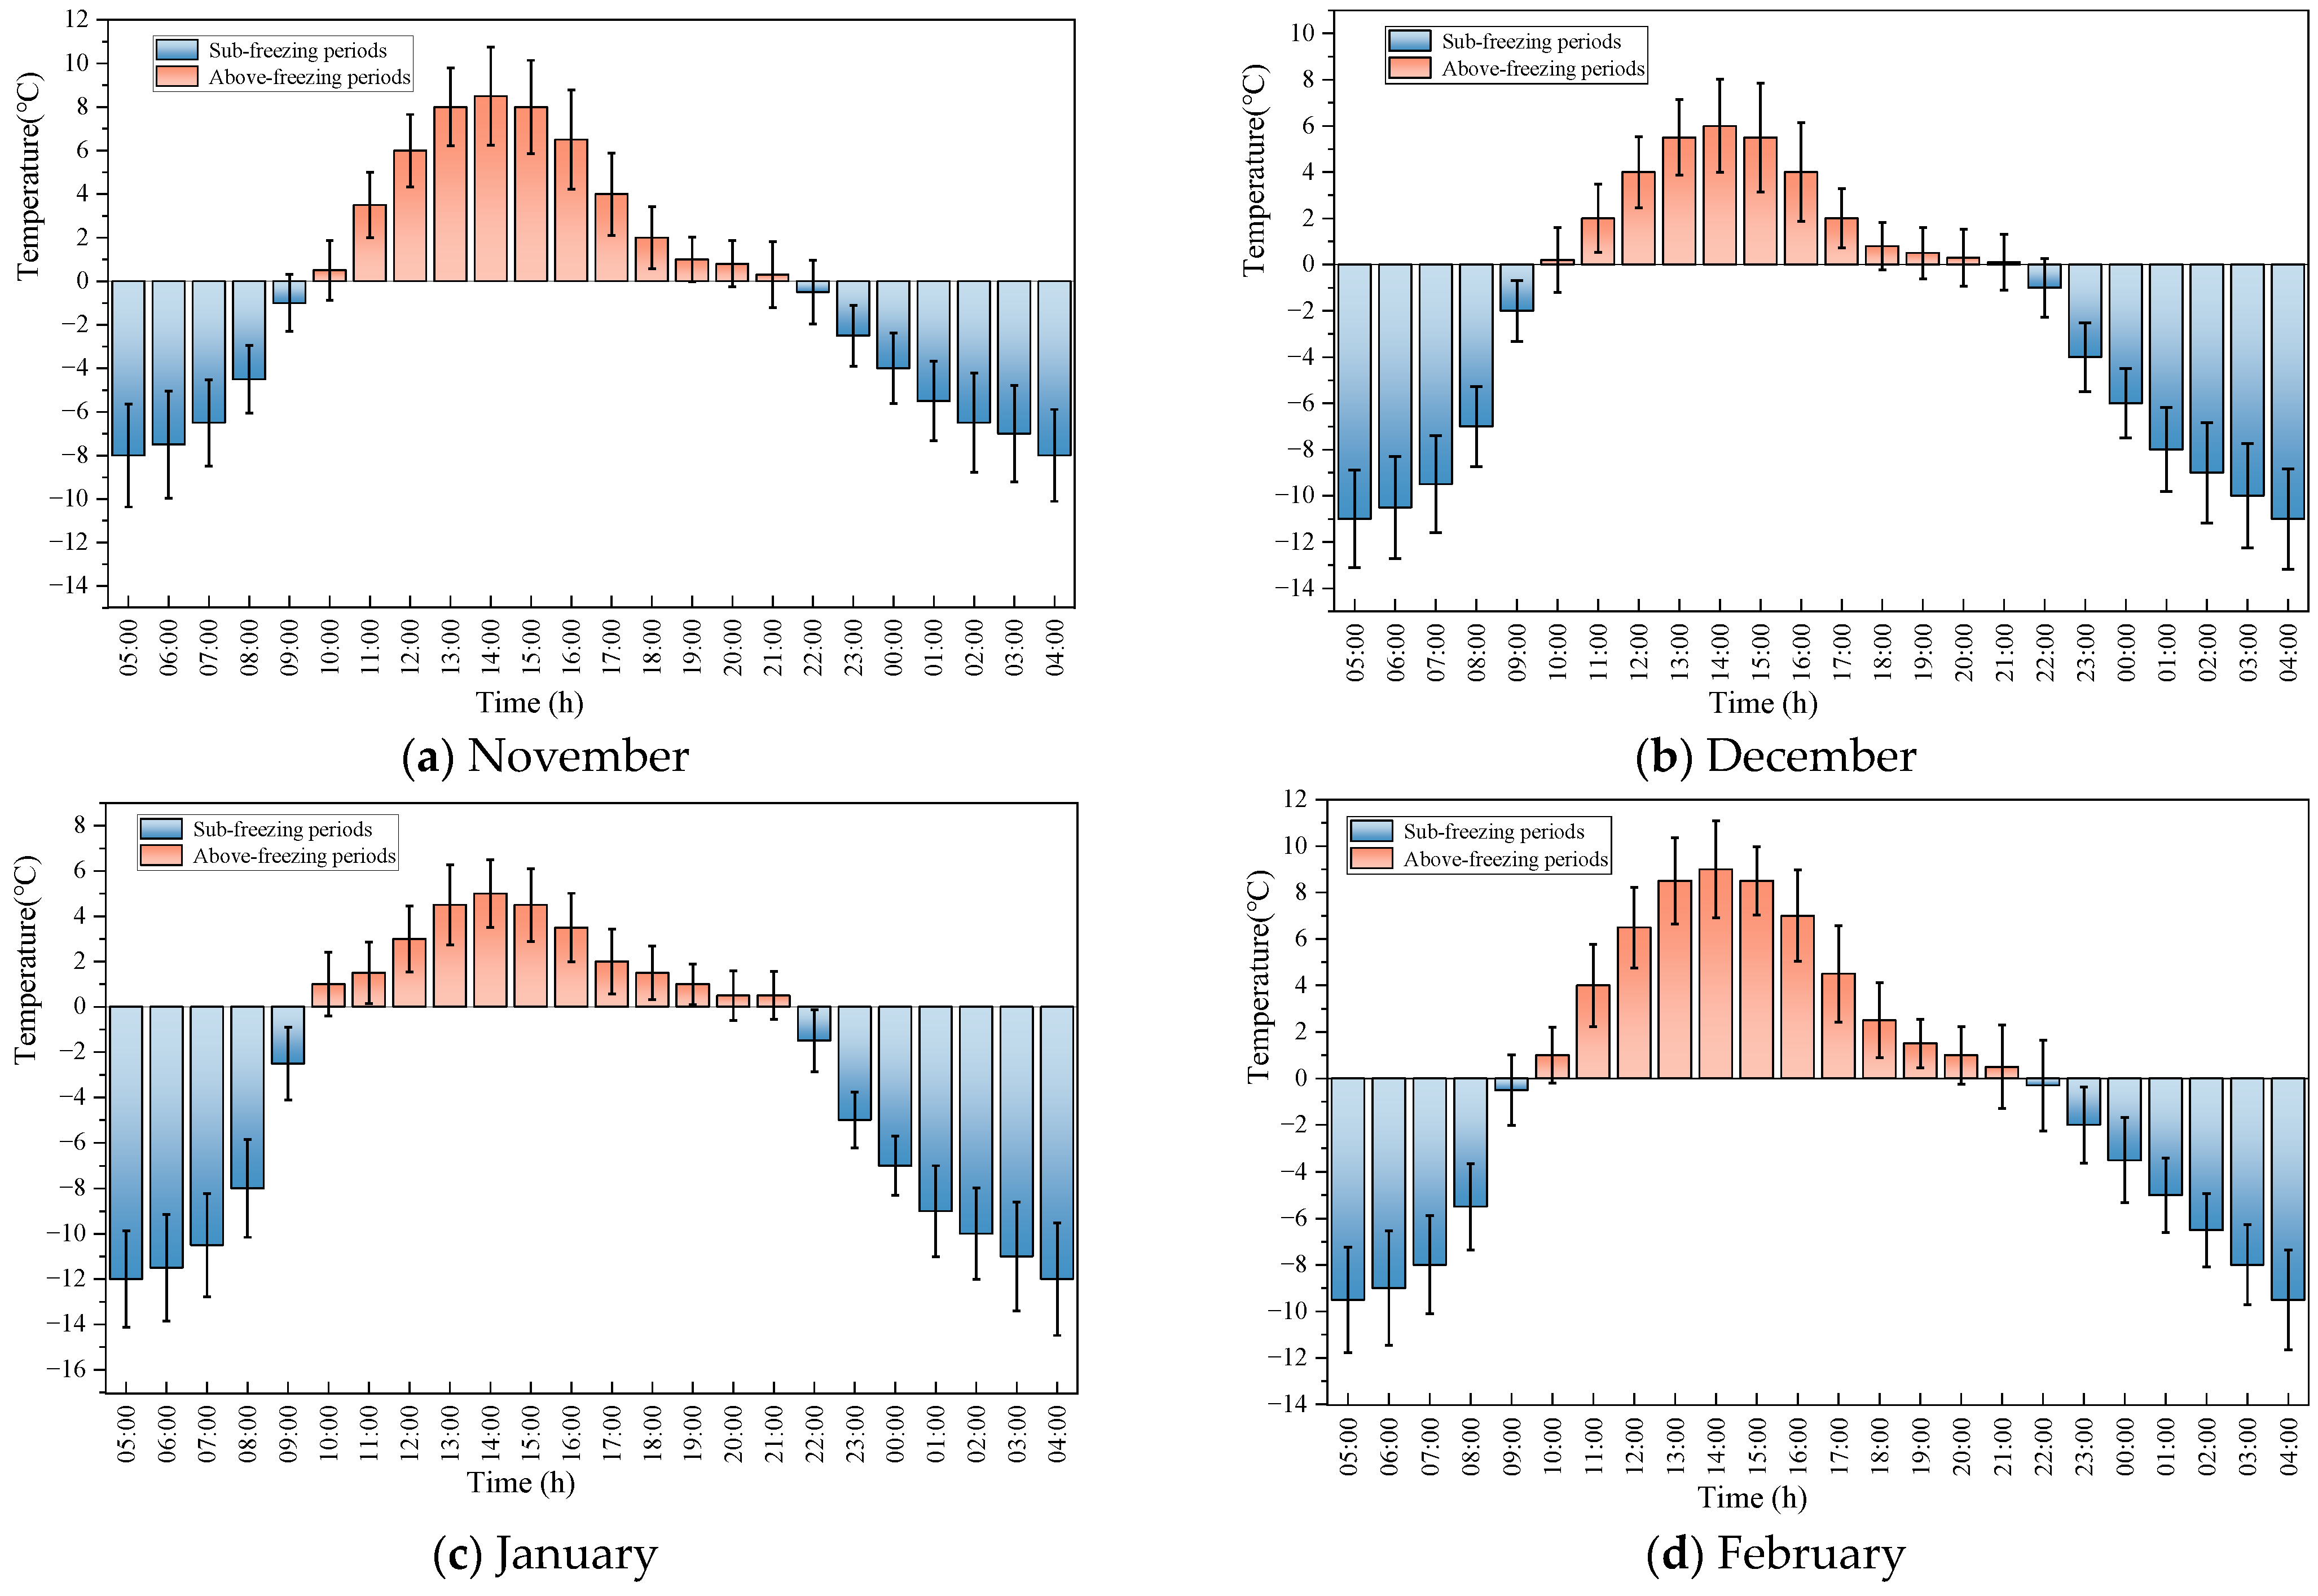
High-altitude regions exhibit a pronounced climate with large temperature differences that manifest not only as large interannual temperature variations but also as significant diurnal fluctuations. Taking the multi-year temperature profile of a dam site in a high-altitude region of Southwest China, as shown in Figure 1, as an example, the winter in this region is long (from November to February of the following year). The monthly average temperature remains below 5 °C, with the lowest average monthly temperature reaching −4 °C, though the extreme maximum temperature during the same period is 24.2 °C. Moreover, the daily temperature in winter exhibits a stable pattern of diurnal alternation of positive and negative temperatures. Based on an analysis of temperature data for a typical year (with a winter whose climatic characteristics are closest to the multi-year average), the temperature rises above 0 °C around 10:00 a.m. each day, forming a positive-temperature window lasting approximately 12 h, with a mean duration of 11.6 h, standard deviation of ±1.2 h, and extreme range of 9.5–13.2 h. The temperature then drops below 0 °C around 10:00 p.m., with diurnal temperature differences reaching 15–20 °C, as shown in Figure 2. Multi-year statistics indicate that the interannual fluctuations of this diurnal temperature alternation pattern are small in this region, supporting the assumption of a fixed positive-temperature window adopted in this study.
Under such climatic conditions, conventional continuous pouring of thick, large-volume layers inevitably spans the nighttime period with negative temperatures, exposing freshly poured concrete to severe risks of early-age frost damage. To avoid damage, conventional practice typically adopts two approaches. One is the implementation of complex temperature-control measures during winter, such as aggregate heating, mixing with hot water, heat storage methods, or warm-shed insulation, which are costly and difficult to control in terms of quality. The other is the winter shutdown strategy, which not only increases the cost of resuming work after winter but also directly causes schedule delays.
Therefore, the winter shutdown strategy is essentially a compromise forced by the mismatch between the rigid, conventional large-block pouring process and the short, intermittent climatic windows. The key to unlocking the potential for winter construction lies in developing a new construction mode that actively aligns with this diurnal-cycle climate.

2.2. Principles of Dynamic Sub-Block Pouring

To fully utilize stable positive-temperature windows in winter construction, this paper proposes a dynamic sub-block pouring strategy. The core idea is to reorganize construction operations in space and time. Without changing the existing materials, machinery, or insulation systems, this technology dynamically subdivides standard pouring blocks into thin sub-blocks and pours them sequentially in layers. Although the number of sub-blocks increases, the control object at any given time remains unchanged, and the construction procedures and workflows do not require adjustment. Thus, the complexity of construction management does not increase significantly.
(1)
The “single-formwork, phased-placement” construction methodology
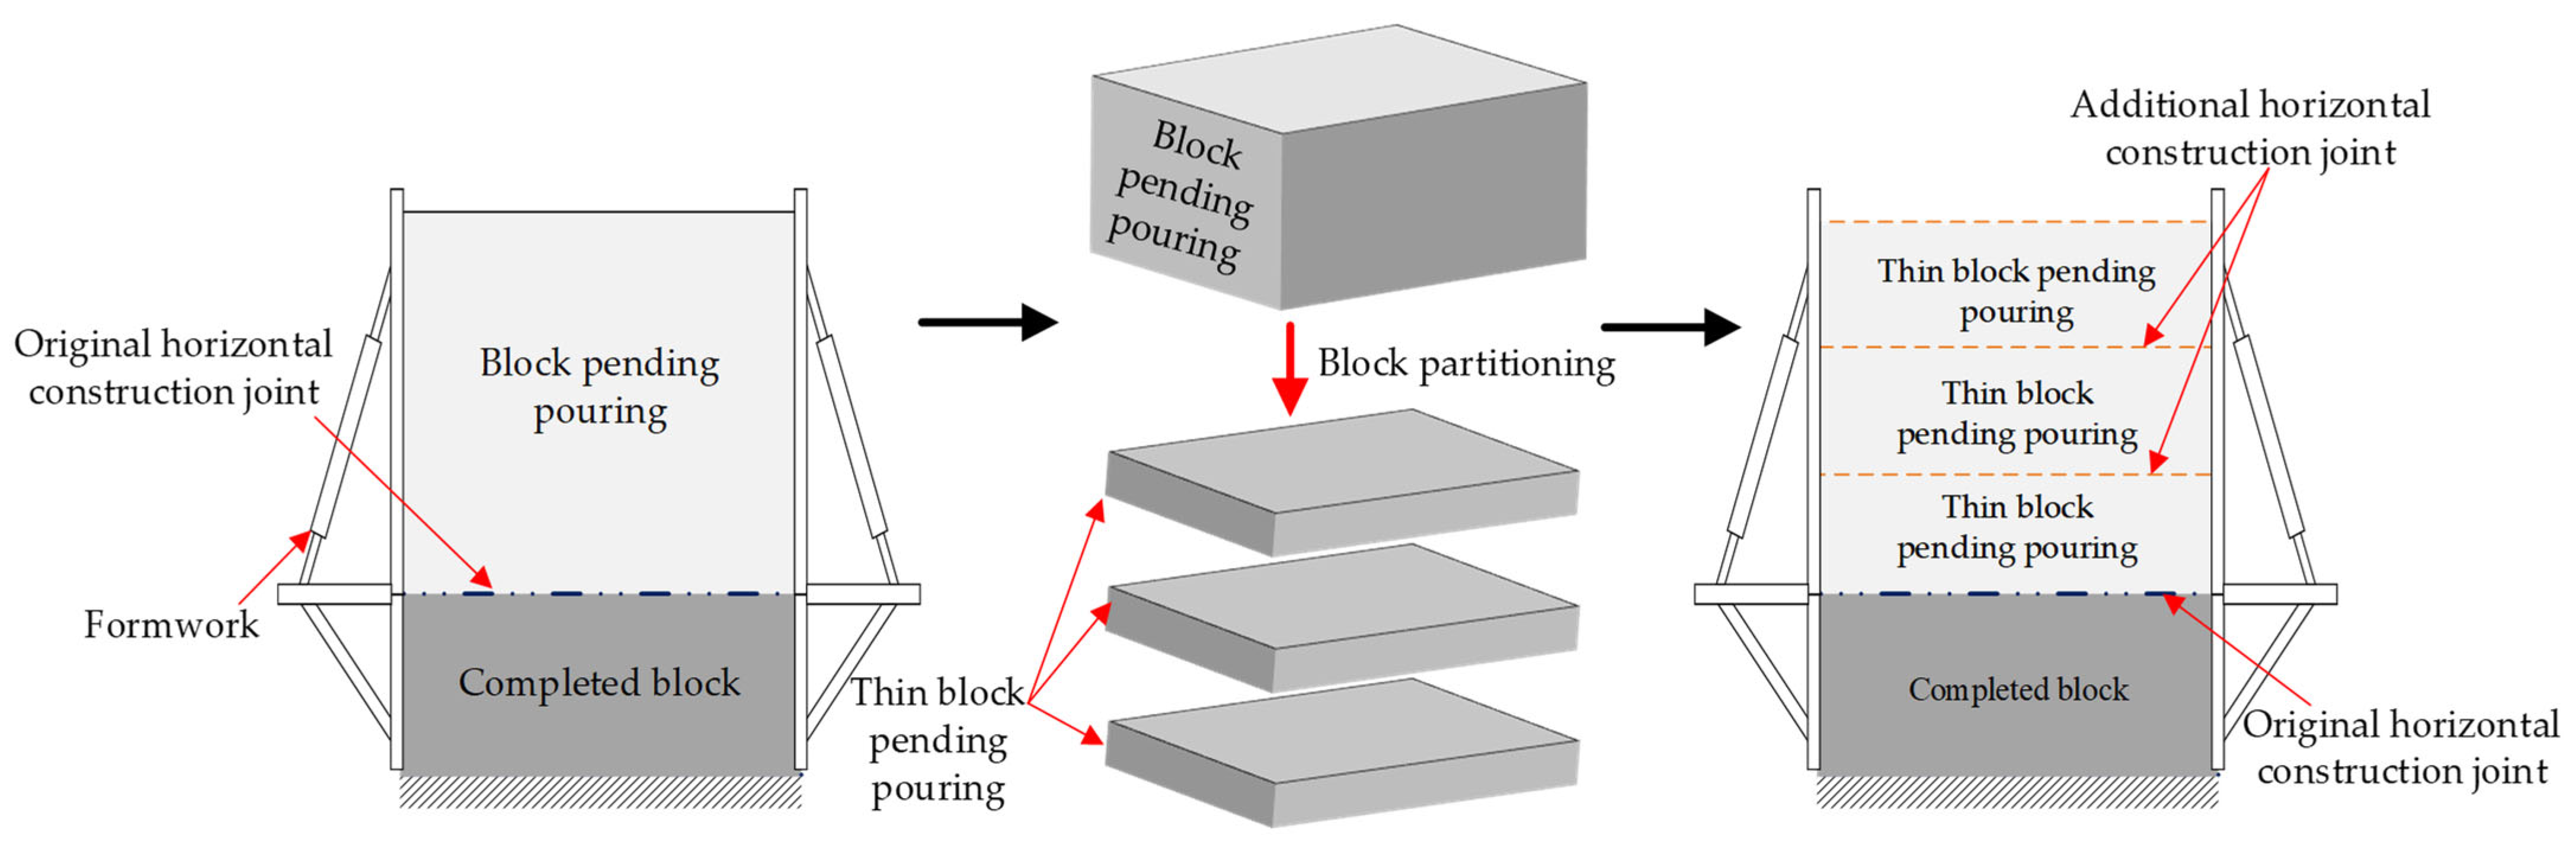
During winter construction, the formwork is erected for a standard pouring block with a design thickness H, typically 3.0 m or 4.5 m. This block is then dynamically partitioned vertically into several sub-blocks, each with a design thickness h, for example, 1.5 m. The same set of formwork serves all sub-blocks within the original standard block, which uses one formwork for each block. For sub-blocks within a single block, their construction processes and pouring sequences are independent, resulting in a multi-pour workflow. Before pouring each sub-block, the surface of the hardened concrete is mechanically roughened, and laitance is removed to enhance interlayer bond strength.
(2)
The “window-driven execution and dynamic intervals” construction strategy
Construction times are strictly synchronized with the positive-temperature windows. Within this window (e.g., from 10:00 a.m. to 10:00 p.m.), resources are concentrated to complete the concrete pouring of one dynamic sub-block. The planned start time T i for a sub-block pour is a dynamically scheduled decision variable based on the remaining positive-temperature duration and the current cable-crane pouring rate to avoid construction at low temperatures. During the nighttime negative-temperature period, pouring is halted and the block surface undergoes insulation curing. The intervals between sub-blocks reduce the time required for formwork erection and rebar installation, leaving only the time needed for concrete strength gain, heat dissipation, and joint surface treatment, thus forming dynamic intervals.
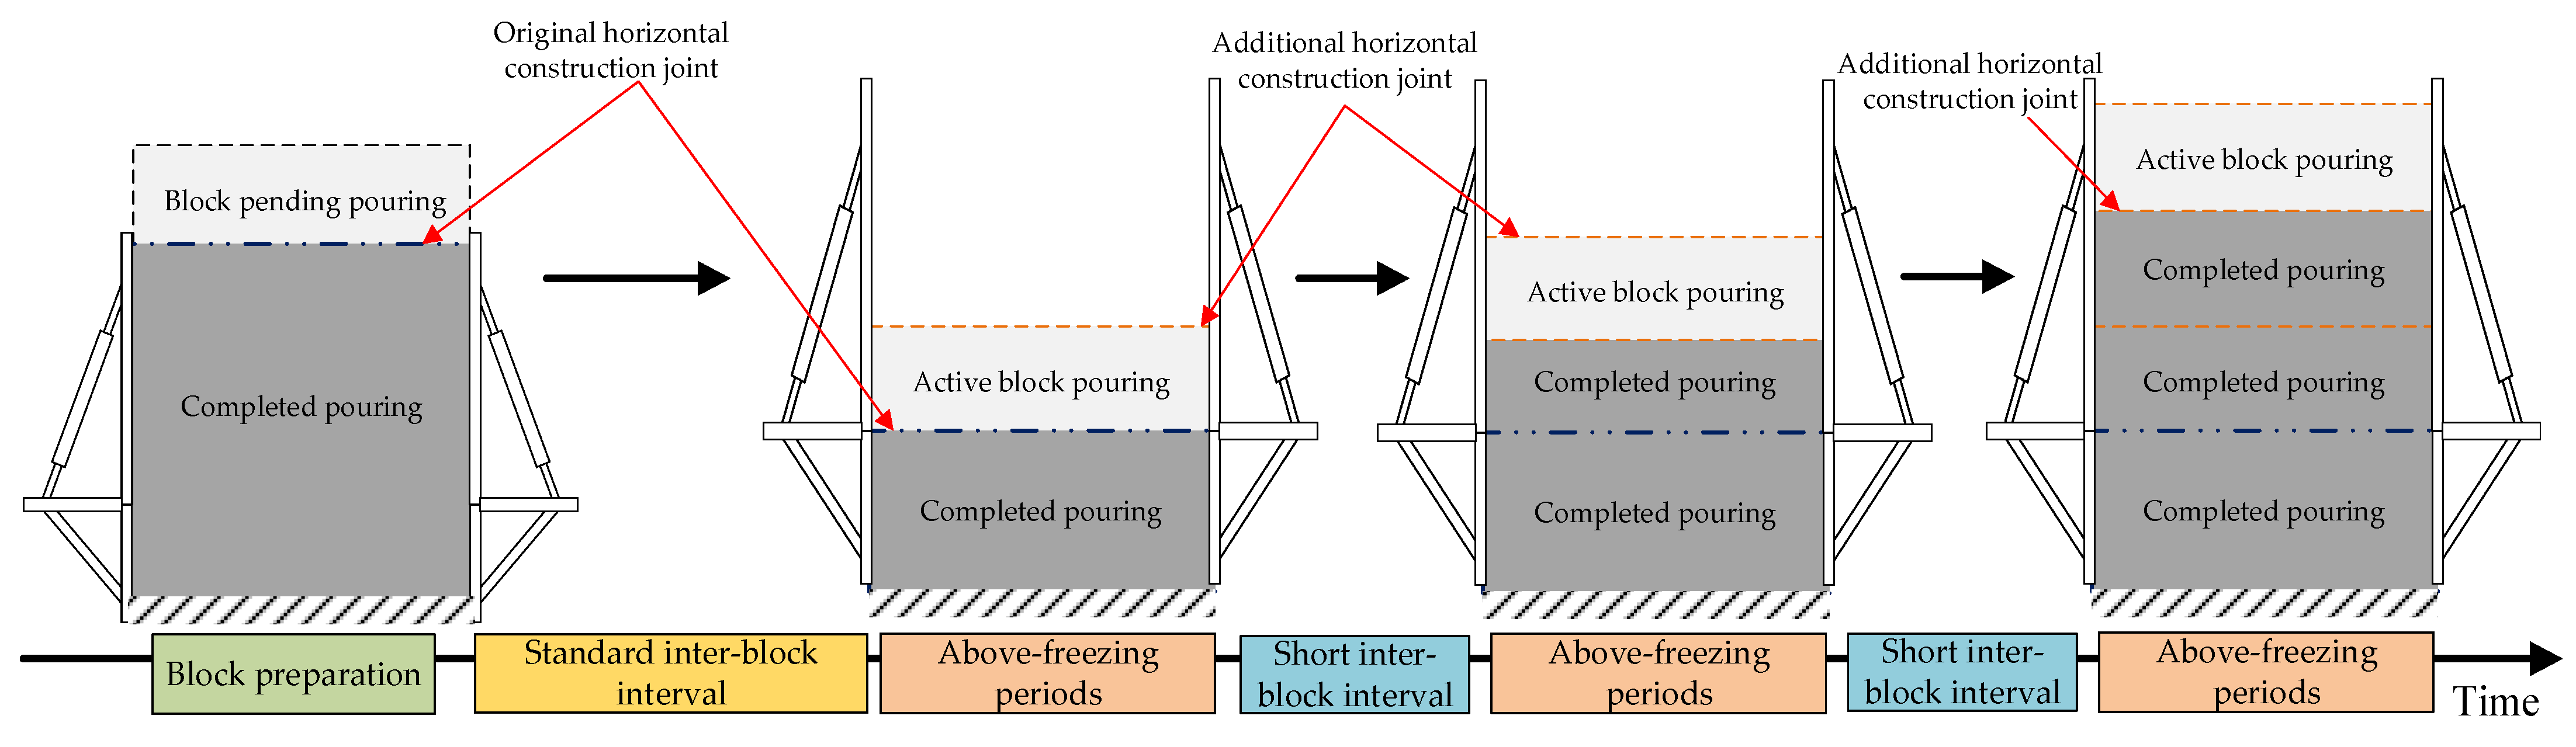
It should be noted that this technological strategy relies on two operational mechanisms. The first is the subdivision of construction units, which significantly reduces the concrete volume per pour. The second is the climate synchronization of the operation cycle. When the start time is controlled, the entire process of block preparation, pouring and covering for a sub-block is strictly confined to the daily positive-temperature window, while the nighttime negative-temperature period serves as an interval for insulation curing. Schematic diagrams are shown in Figure 3 and Figure 4.
A 5 cm thick rigid polyurethane insulation board was selected as the insulation material. Immediately after concrete pouring, a layer of plastic film was applied to retain moisture, followed by two layers of 5 cm thick insulation quilts. The entire block surface was fully covered, with additional insulation boards attached to the outside of the side formwork, and polyurethane foam was used to seal the joints at the interface with the previously poured block. Resistance temperature sensors were used to monitor the internal temperature of the poured block, with increased monitoring frequency and locations. Field tests and numerical simulations have shown that, with such insulation measures in high-altitude regions, the surface temperature gradient can be controlled within the allowable range of relevant specifications [19]. Furthermore, according to construction codes, when the block thickness is reduced, the required interval between adjacent monoliths can be appropriately shortened, which complies with construction requirements [22,29].

3. Construction Schedule Simulation Model for High Arch Dams Incorporating Dynamic Sub-Block Pouring

The construction system of the high arch dam is a typical dynamic system characterized by discrete states, parallel operations, complex resource contention, and multiple spatiotemporal constraints. The core of the schedule model is to simulate the entire sequence of processes, including block preparation, concrete pouring, curing, temperature control, and joint grouting, to identify various constraints and make decisions on block selection and pouring timing. Therefore, after introducing the dynamic sub-block pouring process, it is necessary to establish a schedule model that integrates a meteorological driving mechanism and process-switching logic, which enables the simulation of and schedule prediction for arch dam construction that accommodates the new process.

3.1. Overall Model Framework and Underlying Constraints

The modeling framework is based on discrete-event simulation (DES). Using a process-interaction paradigm, the simulation engine manages execution schedules by maintaining a future-event list (FEL) and a current-event list (CEL). In this architecture, each concrete block is defined as an autonomous entity. Each entity has an independent process thread, which consists of a sequence of discrete events marking the start and the end of preparation, concrete placement, and interlayer curing intervals. As the simulation progresses, system state transitions are governed by the process logic of the entities and by physical and technological constraints.
(1)
Multi-constraint operator set
To ensure the engineering feasibility of the simulation results, the model is bound by a comprehensive constraint set covering all operational elements:
Joint grouting constraints C g r o u t : Follow the principles of age, temperature, and overburden compliance. That is, joint grouting can commence only after the secondary cooling age (e.g., 120 days), the secondary cooling control temperature, and the overburden height above the grouting zone have been met. After all transverse joints in this zone are closed, new growth-domain boundaries are activated. The cantilever height constraint specifically determines these boundaries.
Temporal constraint C t i m e : A block must follow the rigid temporal sequence of each process, advancing in the order of block preparation, pouring, curing, formwork removal, etc. After a lower block is finished, the overlying block cannot be poured until the preparation work is complete and the minimum interlayer interval requirement is met.
Construction height difference constraint C h e i g h t : Strictly control the maximum and minimum height differences between adjacent monoliths, the maximum construction height difference across the entire dam, and the cantilever height to satisfy temperature control, formwork erection, and dam structural-safety requirements.
Meteorological constraint Ω w e a t h e r : As the core trigger variable, this constraint monitors the temperature sequence in real time, driving automatic switching between the normal process and the dynamic sub-block process, and strictly enforces the temperature requirement for starting pouring during winter.
Hydration heat constraint: The heat released by cement hydration governs the temperature field of a dam and the associated control strategy. The model defines, in its miscellaneous parameters, the final adiabatic temperature rise ( θ 0 ), the fitted temperature-rise curve parameters (n, m), the specific heat capacity (c), and the density (ρ) of the four-graded concrete blocks, from which the cumulative hydration heat per unit volume is calculated. Combined with the pipe cooling parameters in the miscellaneous temperature-control parameter set, temperature control measures are implemented.
(2)
State transition mechanism
The evolution of the system state S at time step t can be expressed as the logical intersection of all active entities filtered by the above constraint set. When the system detects a low-temperature meteorological signal, it activates the dynamic sub-block decision module, dynamically adjusting the progress by redefining the block’s geometric properties (e.g., adjusting the lift thickness from H to h) and repositioning the pouring window.
When the simulation begins, the system state is set to S 0 , the simulation time to t = 0 , and the target state to S N , with duration t N . Here, N represents the total number of system state changes and is a variable to be determined. In each simulation step, the event with the earliest occurrence time in the future-event list (FEL) is first moved to the current-event list (CEL). Then, the process corresponding to that entity is advanced until it is interrupted due to resource constraints or unsatisfied logical conditions. The interrupted process is removed from the CEL, and a record for its next event is created in the FEL.
Specifically, in the pouring simulation, when the system is in state S n , the set of blocks waiting to be poured is extracted from the FEL. The feasible block set ψ f e a s i b l e is filtered based on the above spatial height difference constraints (e.g., maximum/minimum adjacent height differences, full-dam maximum height difference, cantilever height difference), temporal constraints (e.g., interlayer interval, grouting age), and pouring start conditions, as expressed in Equation (1).
Ψ feasible = f ( C grout C height C time Ω w e a t h e r )
For ψ f e a s i b l e , the system further checks the concrete supply capacity C S , the availability and spatial accessibility a S p c i C C S p c i , respectively, of cable crane resources C C i , the safe distance between cable cranes C C s a f e , and the cable crane pouring capacity CCP to perform resource matching, thereby determining the feasible scheme set P M i , as shown in Equation (2).
P M i = C n f g a i , C S , C C i , a S p c i C C S p c i , C C s a f e , C C P
Here, C n f g is the resource-matching function, which comprehensively evaluates the match between currently available resources and the construction requirements of the candidate blocks to determine the feasible scheme set. From the feasible scheme set P M i , the ultimate selection is made according to the prioritization protocol. The main decision indicators include: monolith elevation, overdue waiting time, structural complexity, odd/even monolith (appearance shape control indicator), etc. It should be noted that the current model only avoids crane conflicts statically by enforcing a minimum safety separation distance, without implementing global optimization of dynamic multi-crane collisions—a simplification inherent to the model. From this feasible set, P M i , the ultimate selection of placement blocks is governed by a prioritization protocol. The primary decision metrics driving this selection include the current monolith elevation, accumulated idle time, structural complexity, and odd–even monolith sequencing—a critical metric utilized to control the macroscopic construction profile of the rising dam.
V i = k = i 1 in ω ik ϕ k ( i )   ,   B select = arg   max ( V i )
In Equation (3), V i is the quantified value of a candidate block and ω i k is the weight of each indicator. The weights, as fixed values, are not self-calibrated by the model but rather determined based on engineering experience combined with the actual management objectives of high arch dam construction and expert judgments. B s e l e c t is the finally selected block, and ϕ k ( i ) is the normalized quantified value of each decision indicator.
From the perspective of project duration, it is desirable to have high pouring intensity. Therefore, the optimization objective for the pouring scheme is to maximize the overall pouring intensity, as shown in Equation (4).
J P M = max i I p m i . c c . P w r i = 1 , , M
Here, J P M is the performance indicator of the scheme, I is the set of blocks in the planning period, and p m i . c c . P w r is the total pouring intensity of the cable cranes under the scheme. Based on this, the optimal scheme P M i is selected. After executing the selected scheme, the simulation clock advances to t i + 1 , and the system state transitions according to Equation (5):
x i + 1 = E x c t x i , P M i i = 0 , , N 1
In Equation (5), E x c t is the state transition function. This process is executed in cycles until all blocks are poured and the target state x N is reached.
Within the above multi-dimensional constraint framework, selecting the optimal pouring block from the feasible set to maximize construction efficiency is essentially a combinatorial optimization problem with complex constraints. For such resource allocation and conflict minimization problems, some studies have adopted optimization methods such as integer linear programming (ILP), demonstrating that they can efficiently obtain the globally optimal solution [30]. However, ILP methods usually require linear constraints and objectives and have limited adaptability to dynamic random events. By contrast, this paper adopts the DES framework. Through process interaction and event-driven mechanisms, it can flexibly characterize nonlinear logic, such as low-temperature meteorological triggering and dynamic sub-block switching.

Climate-Driven Simulation Framework

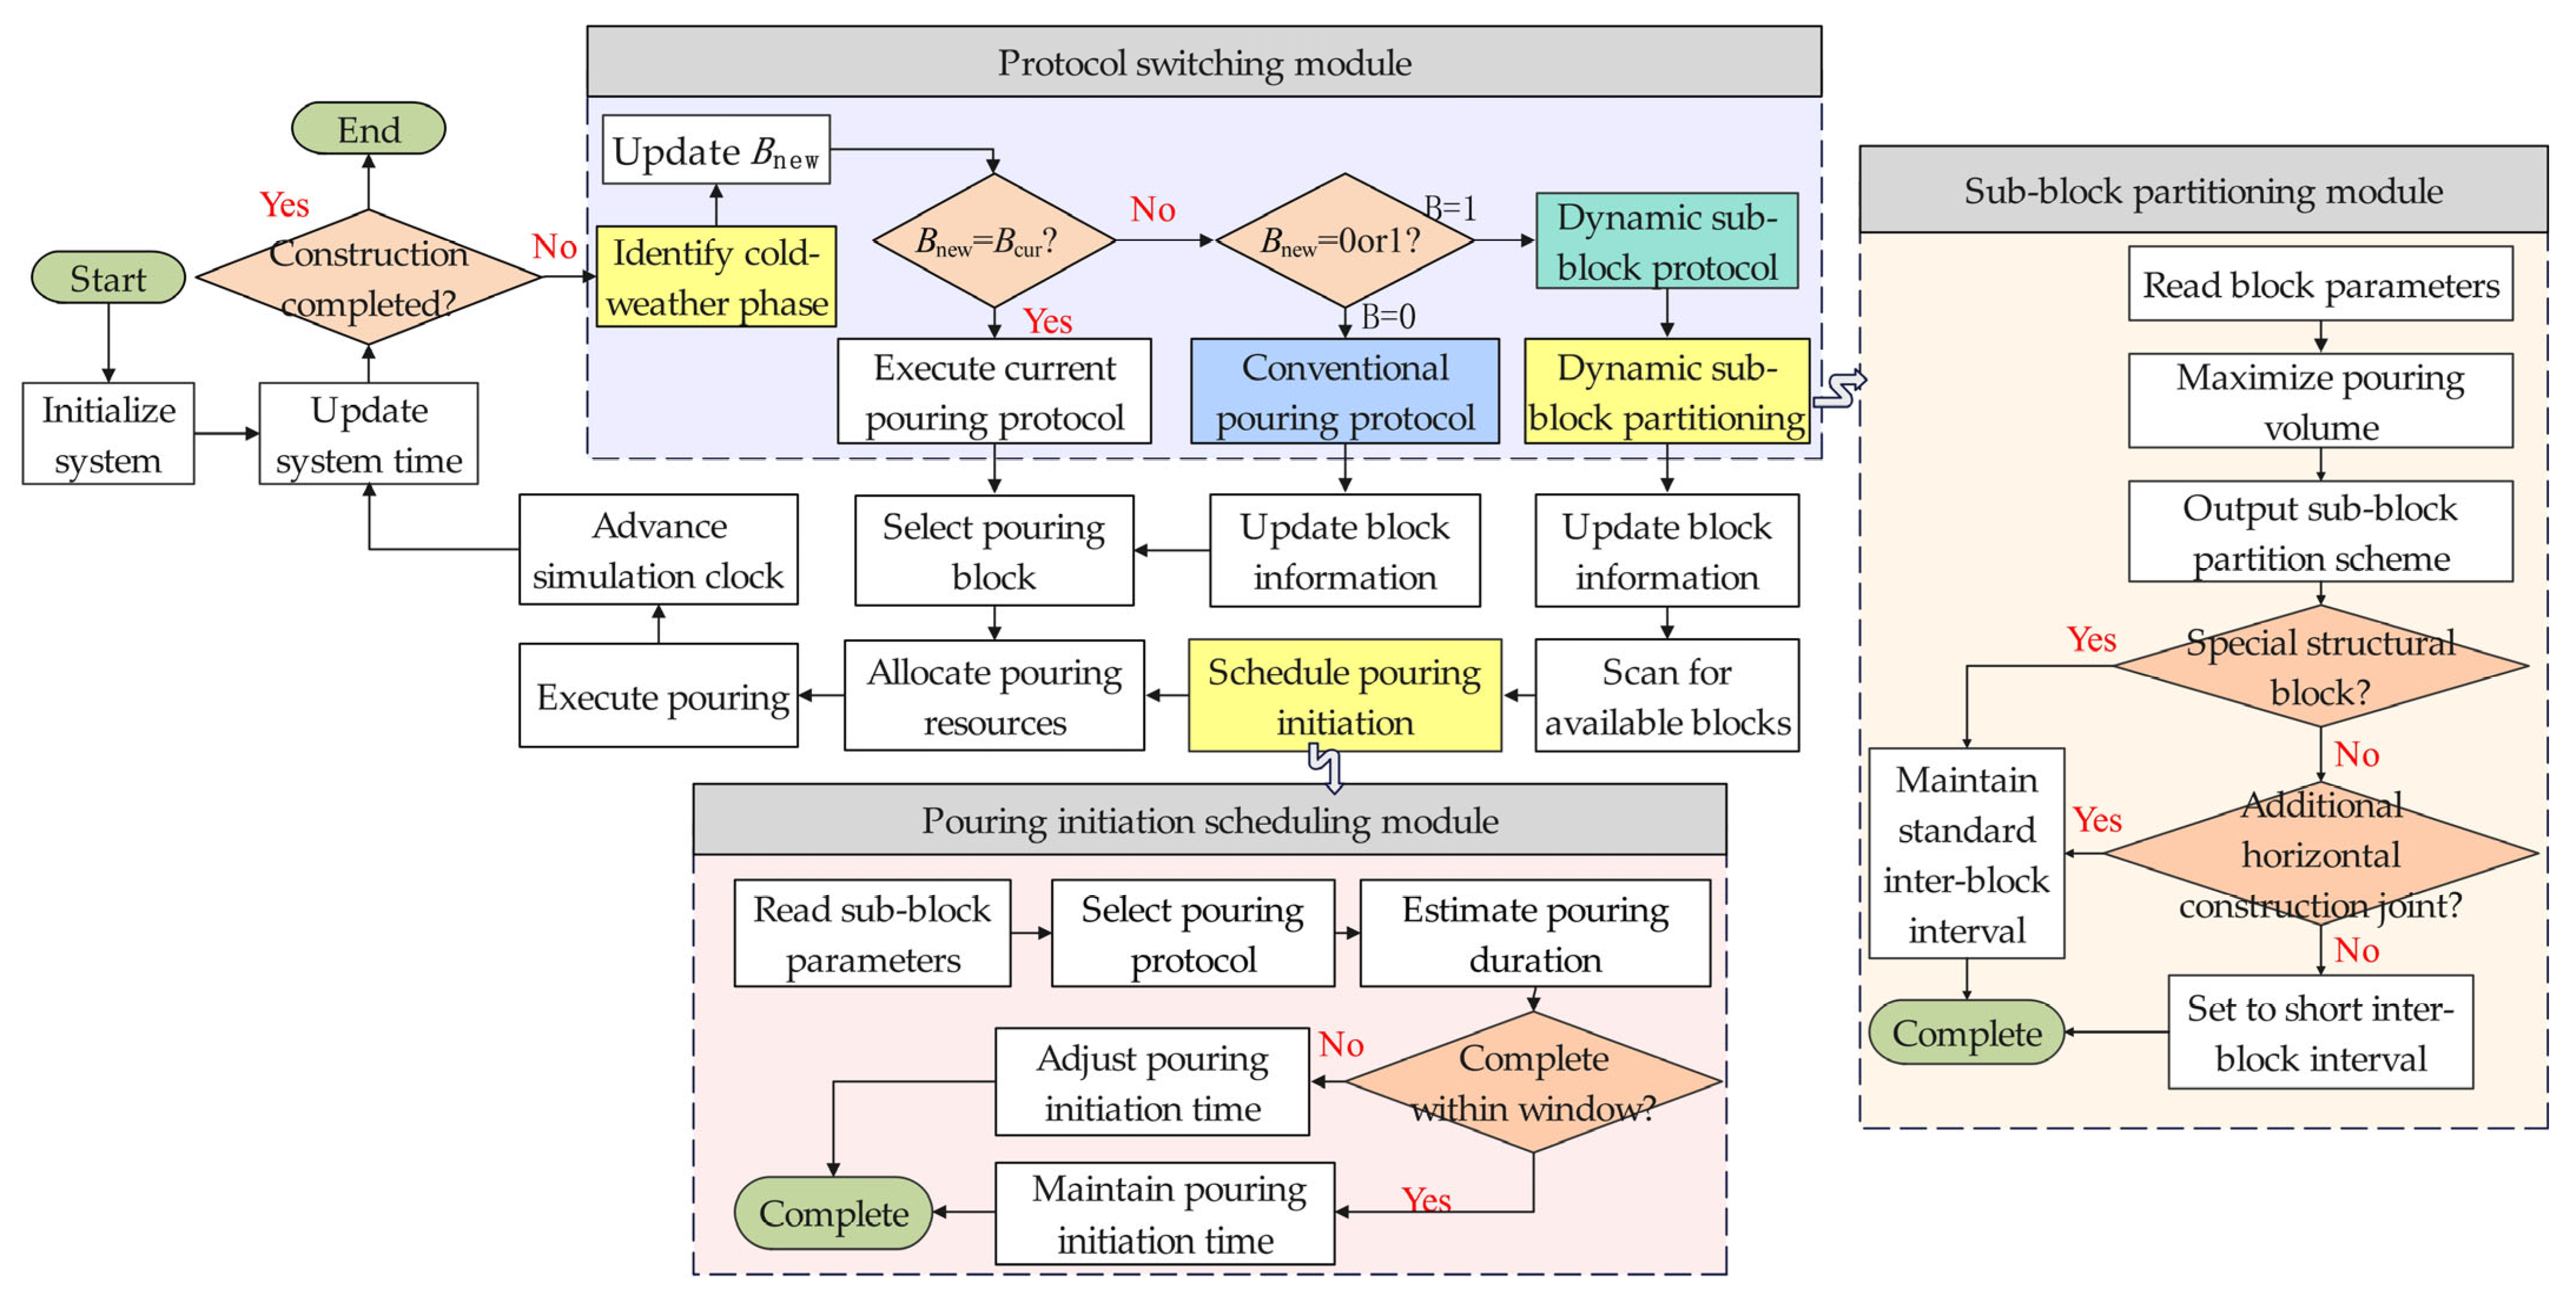
The simulation system can switch adaptively between normal mode and dynamic sub-block mode. Switching is triggered by real-time temperature data. When the daily average temperature remains stably below 5 °C for five consecutive days, the system switches to the dynamic sub-block mode. Otherwise, it switches back to the normal mode. The overall simulation process is shown in Figure 5.
(1)
Normal mode: The standard pouring process is executed with the standard block thickness H. Simulation events proceed cyclically in the established order: updating block status, filtering eligible blocks, selecting the optimal block, allocating resources, and, finally, completing pouring.
(2)
Low-temperature period: The dynamic sub-block module subdivides H into h, and the sub-block planning module ensures that operations are strictly confined within the daily positive-temperature window.
The simulation uses discrete-event time to advance. Core events include entity generation, ready for pouring, curing completion, and grouting. Processing procedures are as follows. The clock first switches to the earliest event time in the FEL, and all events at that time are moved to the CEL. Then, they are processed sequentially by type.
As for resource allocation, cable cranes adopt a two-stage strategy: availability first, then block priority. First, feasible blocks are filtered to satisfy spatial, temporal, and meteorological constraints and are scored according to Equation (3). When multiple blocks compete, the one with the higher score has priority. When crane conflicts occur, a minimum safe spacing of 15 m is maintained. Simulation terminates when all monoliths have reached the crest elevation.
Conflict resolution is incorporated under the dynamic sub-block mode. The benching method is preferentially used when a sub-block cannot be completed within the current positive-temperature window. If still infeasible, it is postponed to the next positive-temperature window. If postponement leads to abnormal intervals, the block is repartitioned (sub-block thickness reduced to ≥1.0 m) to ensure completion within the positive-temperature window.

3.2. Core Functional Modules for Dynamic Sub-Block Simulation

To enable continuous pouring during winter, the schedule simulation system based on dynamic sub-blocks incorporates three core modules: low-temperature identification and process switching, dynamic sub-block partitioning, and sub-block pouring scheduling.

3.2.1. Low-Temperature Period Identification and Strategy-Switching Module

In the simulation system, each block’s information includes the block number, bottom and top elevations, volume, spatial coordinates, concrete material zoning, and minimum interval time. The data structure is complex. During simulation, each judgment of the low-temperature period updates the block information, triggering frequent, large-scale data reads/writes and state refresh, thereby increasing the computational load. To address this issue, this module specifically designs two subroutines: low-temperature period identification and strategy switching.
(1)
Low-temperature-period identification
A discriminant function B is defined. After the system time is updated, it determines whether the current time falls within the low-temperature period and then updates B n e w , as shown in Equation (6), where   B n e w = 1 indicates the dynamic sub-block pouring strategy; B n e w = 0 indicates the normal pouring strategy.
B New = 1 C d 5 0 C d 5
Here, C ( d ) represents the number of consecutive days with a daily average temperature threshold below 5 °C. This threshold directly follows the stipulation in the Specifications for Hydraulic Concrete Construction [22], which requires that when the daily average temperature is continuously below 5 °C for five days, thermal insulation measures must be taken and the pouring thickness must be controlled. This is precisely the prerequisite for the dynamic sub-block strategy proposed in this paper.
(2)
Strategy switching
This subroutine is responsible for switching the construction strategy based on the identification result. B c u r is defined as the current process value.
After the system simulation time is updated, the new discriminant state B n e w is calculated using the criterion above. The logical execution proceeds as follows:
When B n e w B c u r , it leads to a process switch. Depending on the value of B n e w , different pouring processes are triggered. If B n e w = 1 , the dynamic sub-block pouring strategy is invoked, and the block and strategy information are queried and updated. If B n e w = 0 , the normal pouring strategy is restored, with block and information queried and updated. Then, B n e w is assigned to B c u r . If B n e w = B c u r , this subroutine is skipped without any update.
Through the above design, block information is updated only when B n e w B c u r , which reduces unnecessary query and computation loads.

3.2.2. Dynamic Sub-Block Partitioning Module

Within the discrete-event simulation framework, the dynamic sub-block partitioning module is a dedicated process triggered by the winter construction mode switch. Based on preset deterministic rules (e.g., sequential subdivision by lift thickness of 1.5 m, merging the remaining thickness into the top layer, etc.), this module generates a sub-block partitioning scheme, which is the combination of the number and thickness of sub-blocks. According to a preset interlayer interval time, the module preliminarily schedules the start time of each sub-block. The original intention of this module is to maximize the cumulative pouring volume during the cold period. This goal is not achieved through mathematical optimization but rather relies on the above rule-driven process. The generated partitioning scheme and its preliminary schedule are entered into the FEL as a new, ready sub-block, which then drives the subsequent simulation process.
In this module, the optimization target is defined as I { 1,2 , , M } , the set of blocks scheduled within planning. Any block i in this set is a predetermined construction task that the simulation system outputs in advance according to the overall schedule. A Boolean decision variable B i , j is introduced. It is T if the j-th layer (from bottom to top) of block i is scheduled to be poured and is F otherwise. A continuous decision variable h i , j > 0 is also introduced, representing the planned thickness of the corresponding sub-block. Let J i = { 1,2 , , j m a x } be the index set of sub-block sequences for block i, and let j m a x be the estimated maximum number of sub-blocks derived from H i and h m i n .
After setting the decision variables, the module aims to maximize the total cumulative concrete volume V poured over M blocks. This design preference must be considered together with the following operational constraints (allowable pouring duration and resource availability), which can be expressed mathematically as:
max V = i I j J i S i h i , j
s . t . j J i h i , j H i H m i n B i , j h i , j H i B i , j i I , j J i s i h i , j N q T
In this formulation, S i and H i denote the base area and the total design height, respectively. The engineering codes require the minimum single-layer thickness to be h m i n . In combination with practice, a standard reference layer thickness h s t d is set. Within planning, the daily available positive-temperature duration is T , the number of cable cranes available is N, and the average pouring intensity of a single crane is q.
In Equation (8), Constraint ① ensures that the cumulative placement height of any given block strictly respects its prescribed design height. Constraint ② ensures consistency between the thickness variable and the decision variable B i , j and satisfies the minimum layer-thickness specification. If the layer is selected ( B i , j = T ), its thickness must be at least h m i n . Otherwise, the thickness is forced to zero. Constraint ③ ensures that the pouring duration of all planned sub-layers does not exceed the positive-temperature window length. Within Constraint ②, priority is given to layering according to h s t d , while for special layer thicknesses, the residual thickness is handled flexibly. Its handling rules are as follows:
(1)
Flexible Top-Layer Thickness: The top-layer thickness j m a x is allowed to vary within [ h m i n , H i ] to accommodate non-standard residual thicknesses;
(2)
Residual Merging: If the top-layer thickness h i , j is significantly smaller than h m i n , then no further layer is planned ( B i , j = F ) , and the residual thickness is merged into the current layer.
The output of this module is a set of sub-block partitioning schemes for M blocks within planning. For a given block i , the output is Y i , j = { Y i , 1 , Y i , 2 , , Y i , m } , meaning the block will be divided into m sub-blocks with corresponding thicknesses h i , j = { h i , 1 , h i , 2 , , h i , m } .

3.2.3. Sub-Block Initiation Scheduling Module Based on Positive-Temperature Windows

This module triggers a decision of the ready sub-block event. The process receives the sub-block entities and their initial start-time output from the dynamic sub-block partitioning module. Its core task is to match a feasible start time and pouring process for each sub-block.
Once activated, the process first performs an intensity check. Based on real-time monitoring [31], the simulation system dynamically obtains the measured average pouring intensity of the cable crane groups and uses it to drive the process decision event. The system first matches a feasible process according to the minimum required intensity: ① If the available intensity is not less than the minimum intensity required for the horizontal layering method, the method is triggered preferentially. ② The benching method is triggered if the required intensity only meets its lower bound and the estimated pouring duration can be completed within the current positive-temperature window. ③ If none of the above methods are satisfied, the current sub-block partitioning scheme cannot fit the window. Thus, a re-planning event is generated, which feeds back into the dynamic sub-block partitioning module for scheme iteration until a feasible solution is obtained. The minimum pouring intensities required for each process are:
q 1 = s i h i , j δ m a x
V 2 = n L σ v c σ
In Equation (9), δ m a x denotes the time interval between spreading layers (h), and q 1 is the minimum pouring intensity for the horizontal layering method (m3/h). In Equation (10), V 2 is the concrete volume per spread step in the benching method (m3); σ is the spreading thickness (m); n indicates the number of benches; L is the short side length of the block (m); and V c is the bucket volume (m3).
After verification, the process enters the decision stage for the start time of pouring. The initial planned start time is recorded, the final decision pair (start time and pouring process) is output, and the corresponding pouring is initiated and added to the FEL.
(1)
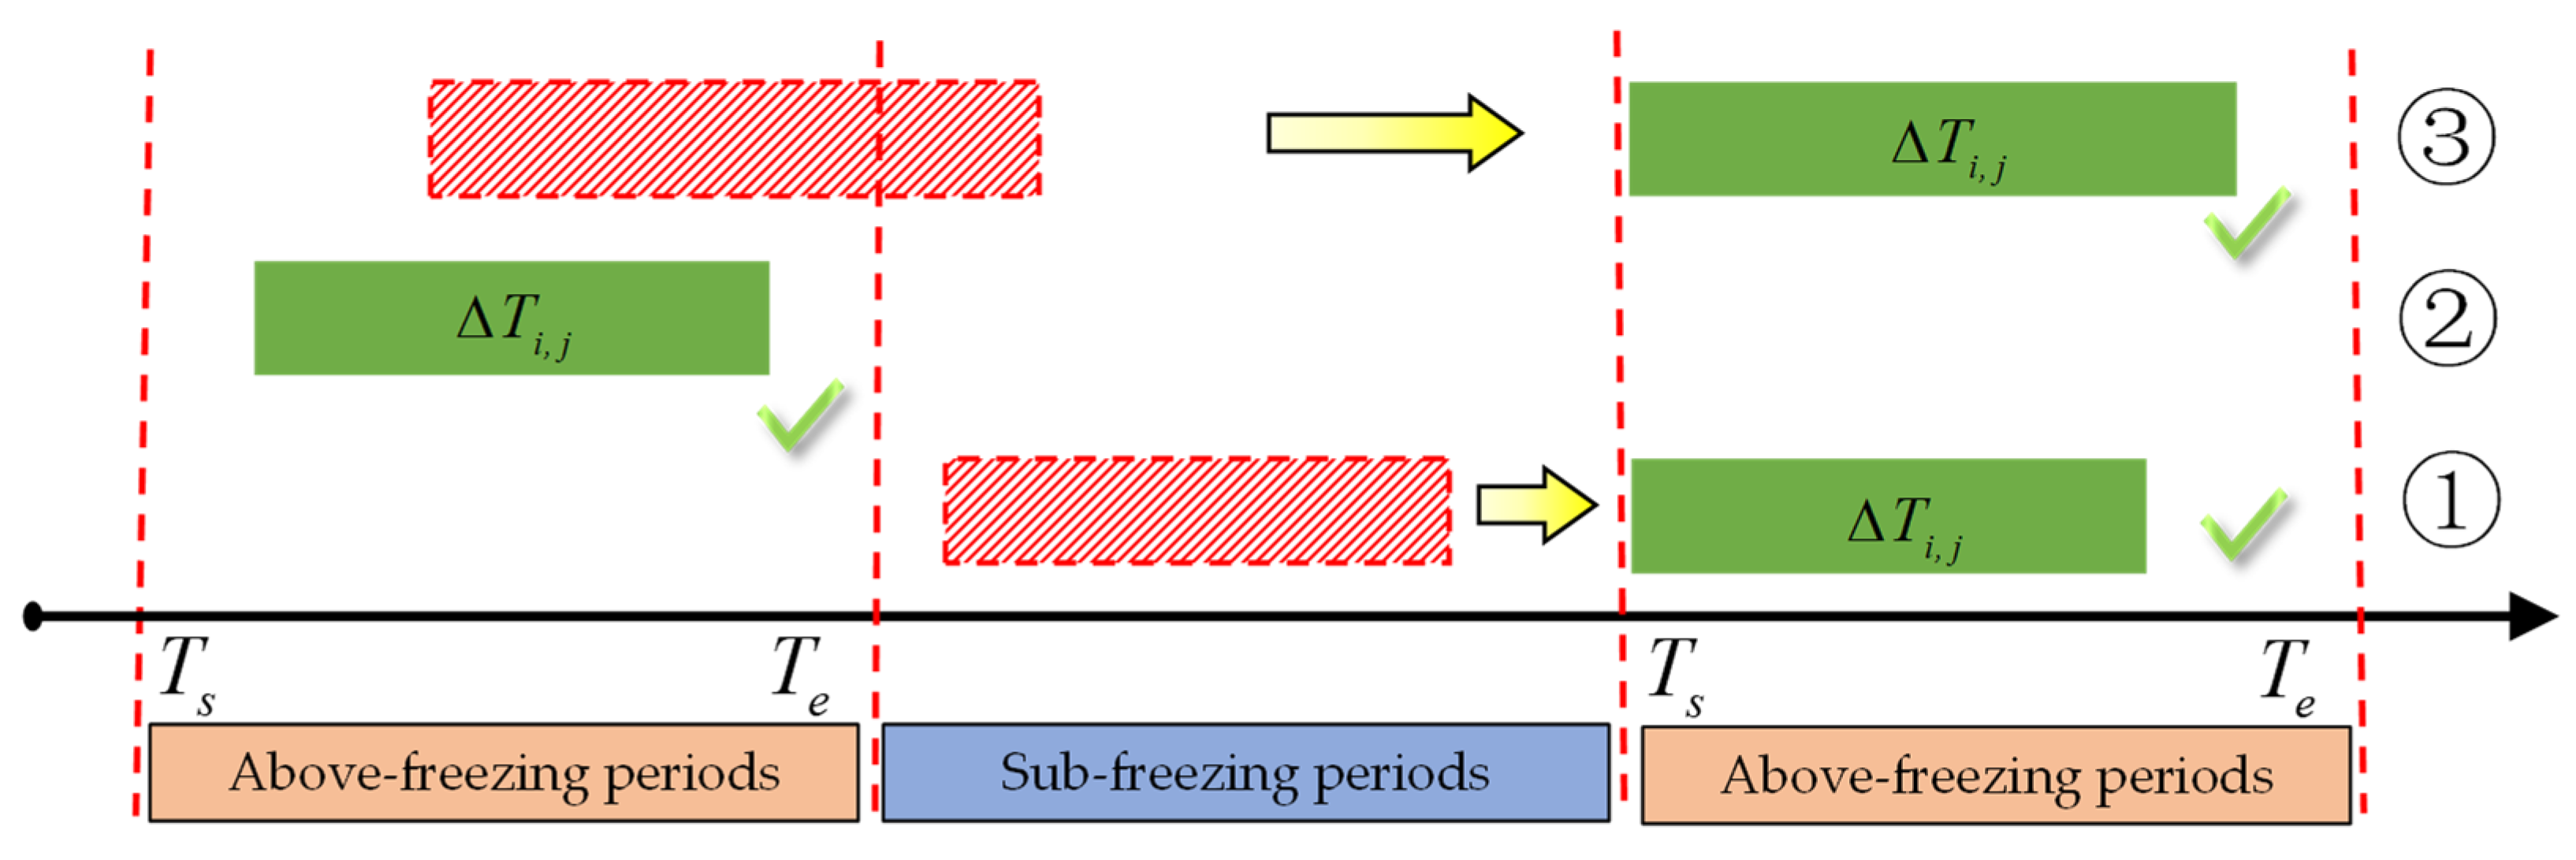
If the initiation time T i falls within a negative-temperature period, a time-domain rolling mechanism is executed to adjust T i to T s ,   , the onset of the next available positive-temperature time window, which is then used as the new decision starting point. This ensures that pouring is always planned within the allowable positive-temperature window, as shown in Case ① of Figure 6.
(2)
When T i lies within a positive-temperature window [ T s , T e ] , the simulation system selects a feasible process that satisfies the lower bound of process intensity based on the measured average pouring intensity N q of the cable crane groups. It then estimates the pouring duration using Equation (11). The key criterion is whether the estimated completion time T + T i , j   is ahead of the window end time T e . ① If a process satisfies the condition, it is selected and executed, as shown in Case ② of Figure 6. ② If none of the feasible processes can be completed within the current window, the time-domain rolling is triggered again, postponing T i to the start of the next positive-temperature window for re-planning, as shown in Case ③ of Figure 6.
Δ T i . j = s i h i . j N q k t + M c T c ( 1 - k c )
In Equation (11), Δ T i , j is the total pouring duration for sub-block j. Considering the time incurred by equipment coordination in multi-crane operations, M c represents the number of crane moves, T c is the time per single crane move; k t is the block surface operation coefficient; and k c is the interference coefficient between cranes.

3.3. Architecture of the Integrated Simulation Framework

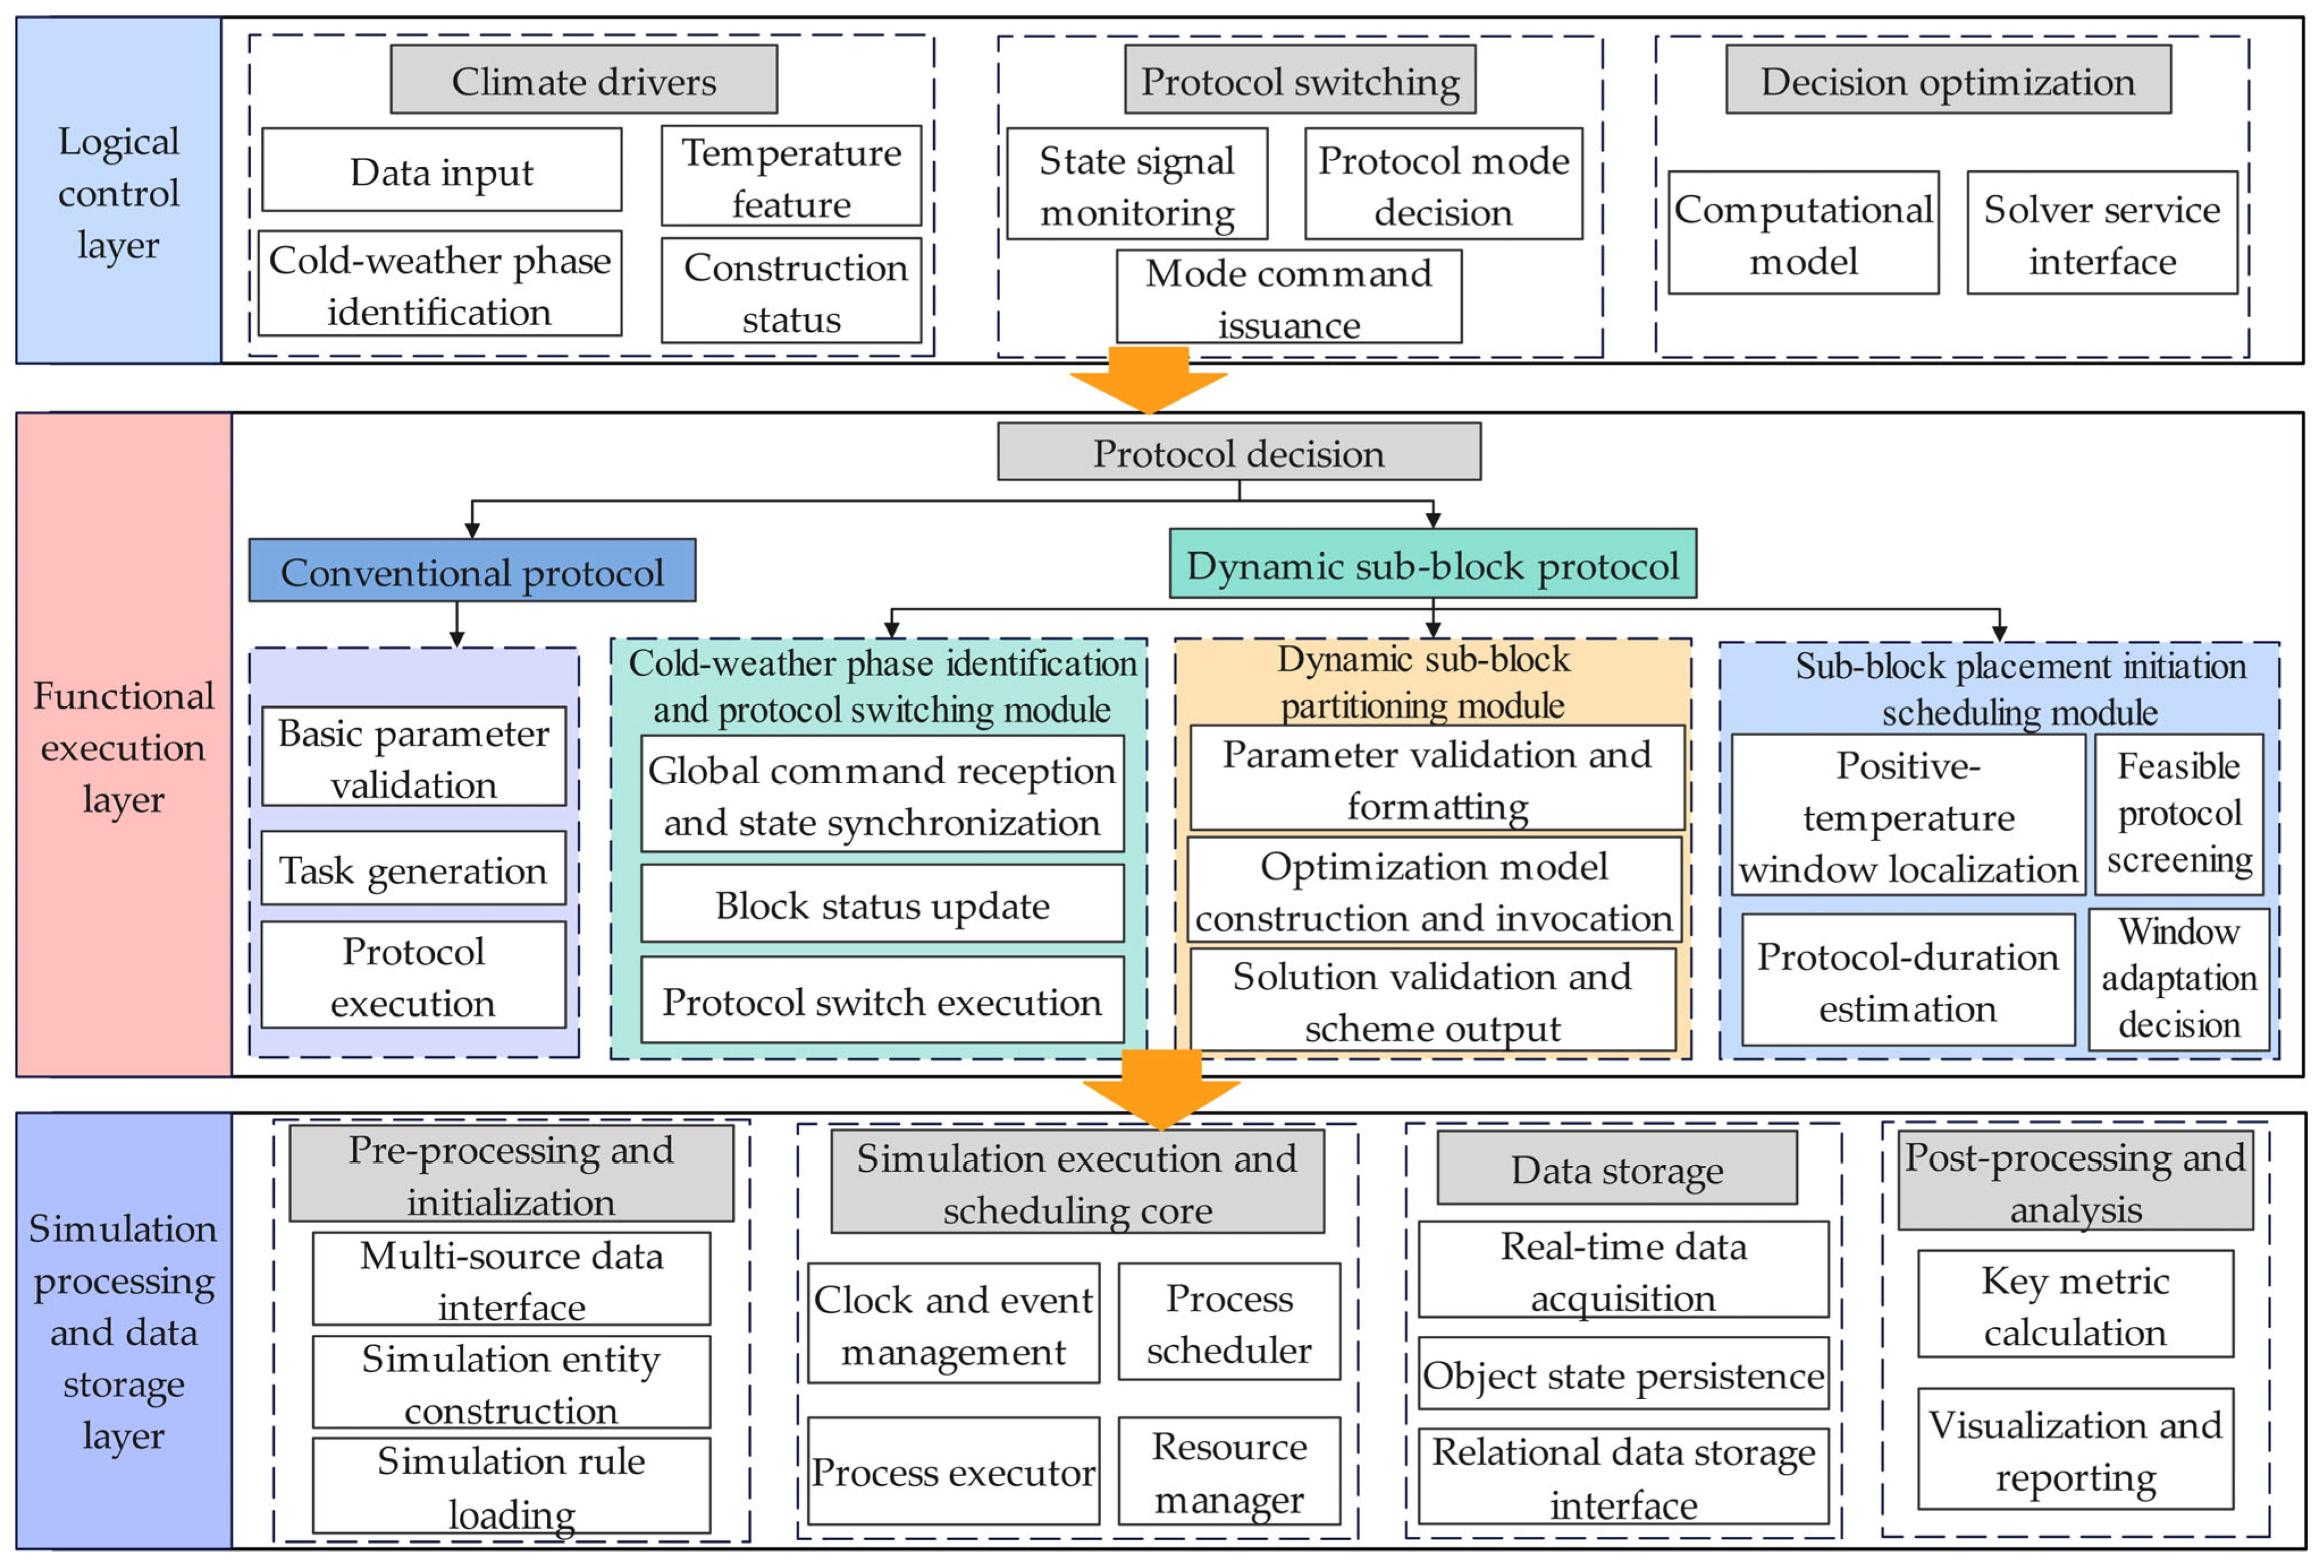
To achieve the integrated simulation of both normal pouring and the dynamic sub-block strategy, the model’s innovation lies in introducing a climate-driven strategy-switching mechanism. The system automatically decides which strategy to adopt based on the temperature state parameters: during periods with acceptable temperatures, the normal pouring logic is followed; when the temperature meets the low-period criterion (five consecutive days with a daily average temperature < 5 °C), the model switches to the dynamic sub-block strategy. This module incorporates three key innovations:
(1)
Dynamic sub-block partitioning: A standard block is vertically subdivided into multiple thin sub-blocks, and the number and thickness combination of sub-blocks are optimized with the goal of maximizing the pouring volume during the low-temperature period.
(2)
Positive-temperature-window-driven initiation planning: Using the daily positive-temperature window and the real-time pouring capacity of cable cranes, the latest feasible start time for each sub-block is calculated, which ensures that the pouring is completed within the positive-temperature interval.
(3)
Coordinated decision-making for strategy switching: The above modules operate within the same simulation model, which enables smooth switching between low-temperature and normal strategies.
This model can evaluate the scheduling-optimization effect of the dynamic sub-block continuous-pouring strategy compared to the traditional winter-shutdown approach, a capability that existing DES models lack due to the absence of climate-driven adaptive logic. The overall simulation operation utilizes discrete events with process interactions. The specific simulation model structure is shown in Figure 7.

4. Case Study

To validate the application value and effectiveness of the proposed method, this section presents a case study of a high arch dam project. The original construction plan for this project required a complete shutdown during severe winters. To reduce the overall duration, this paper proposes an alternative continuous winter pouring scheme based on the dynamic block-division method. The following subsections first elaborate on the simulation results to demonstrate the feasibility of the new scheme and then compare and analyze the total durations of the original and proposed schemes at a macro level to quantify the effect of schedule optimization.

4.1. Project Overview

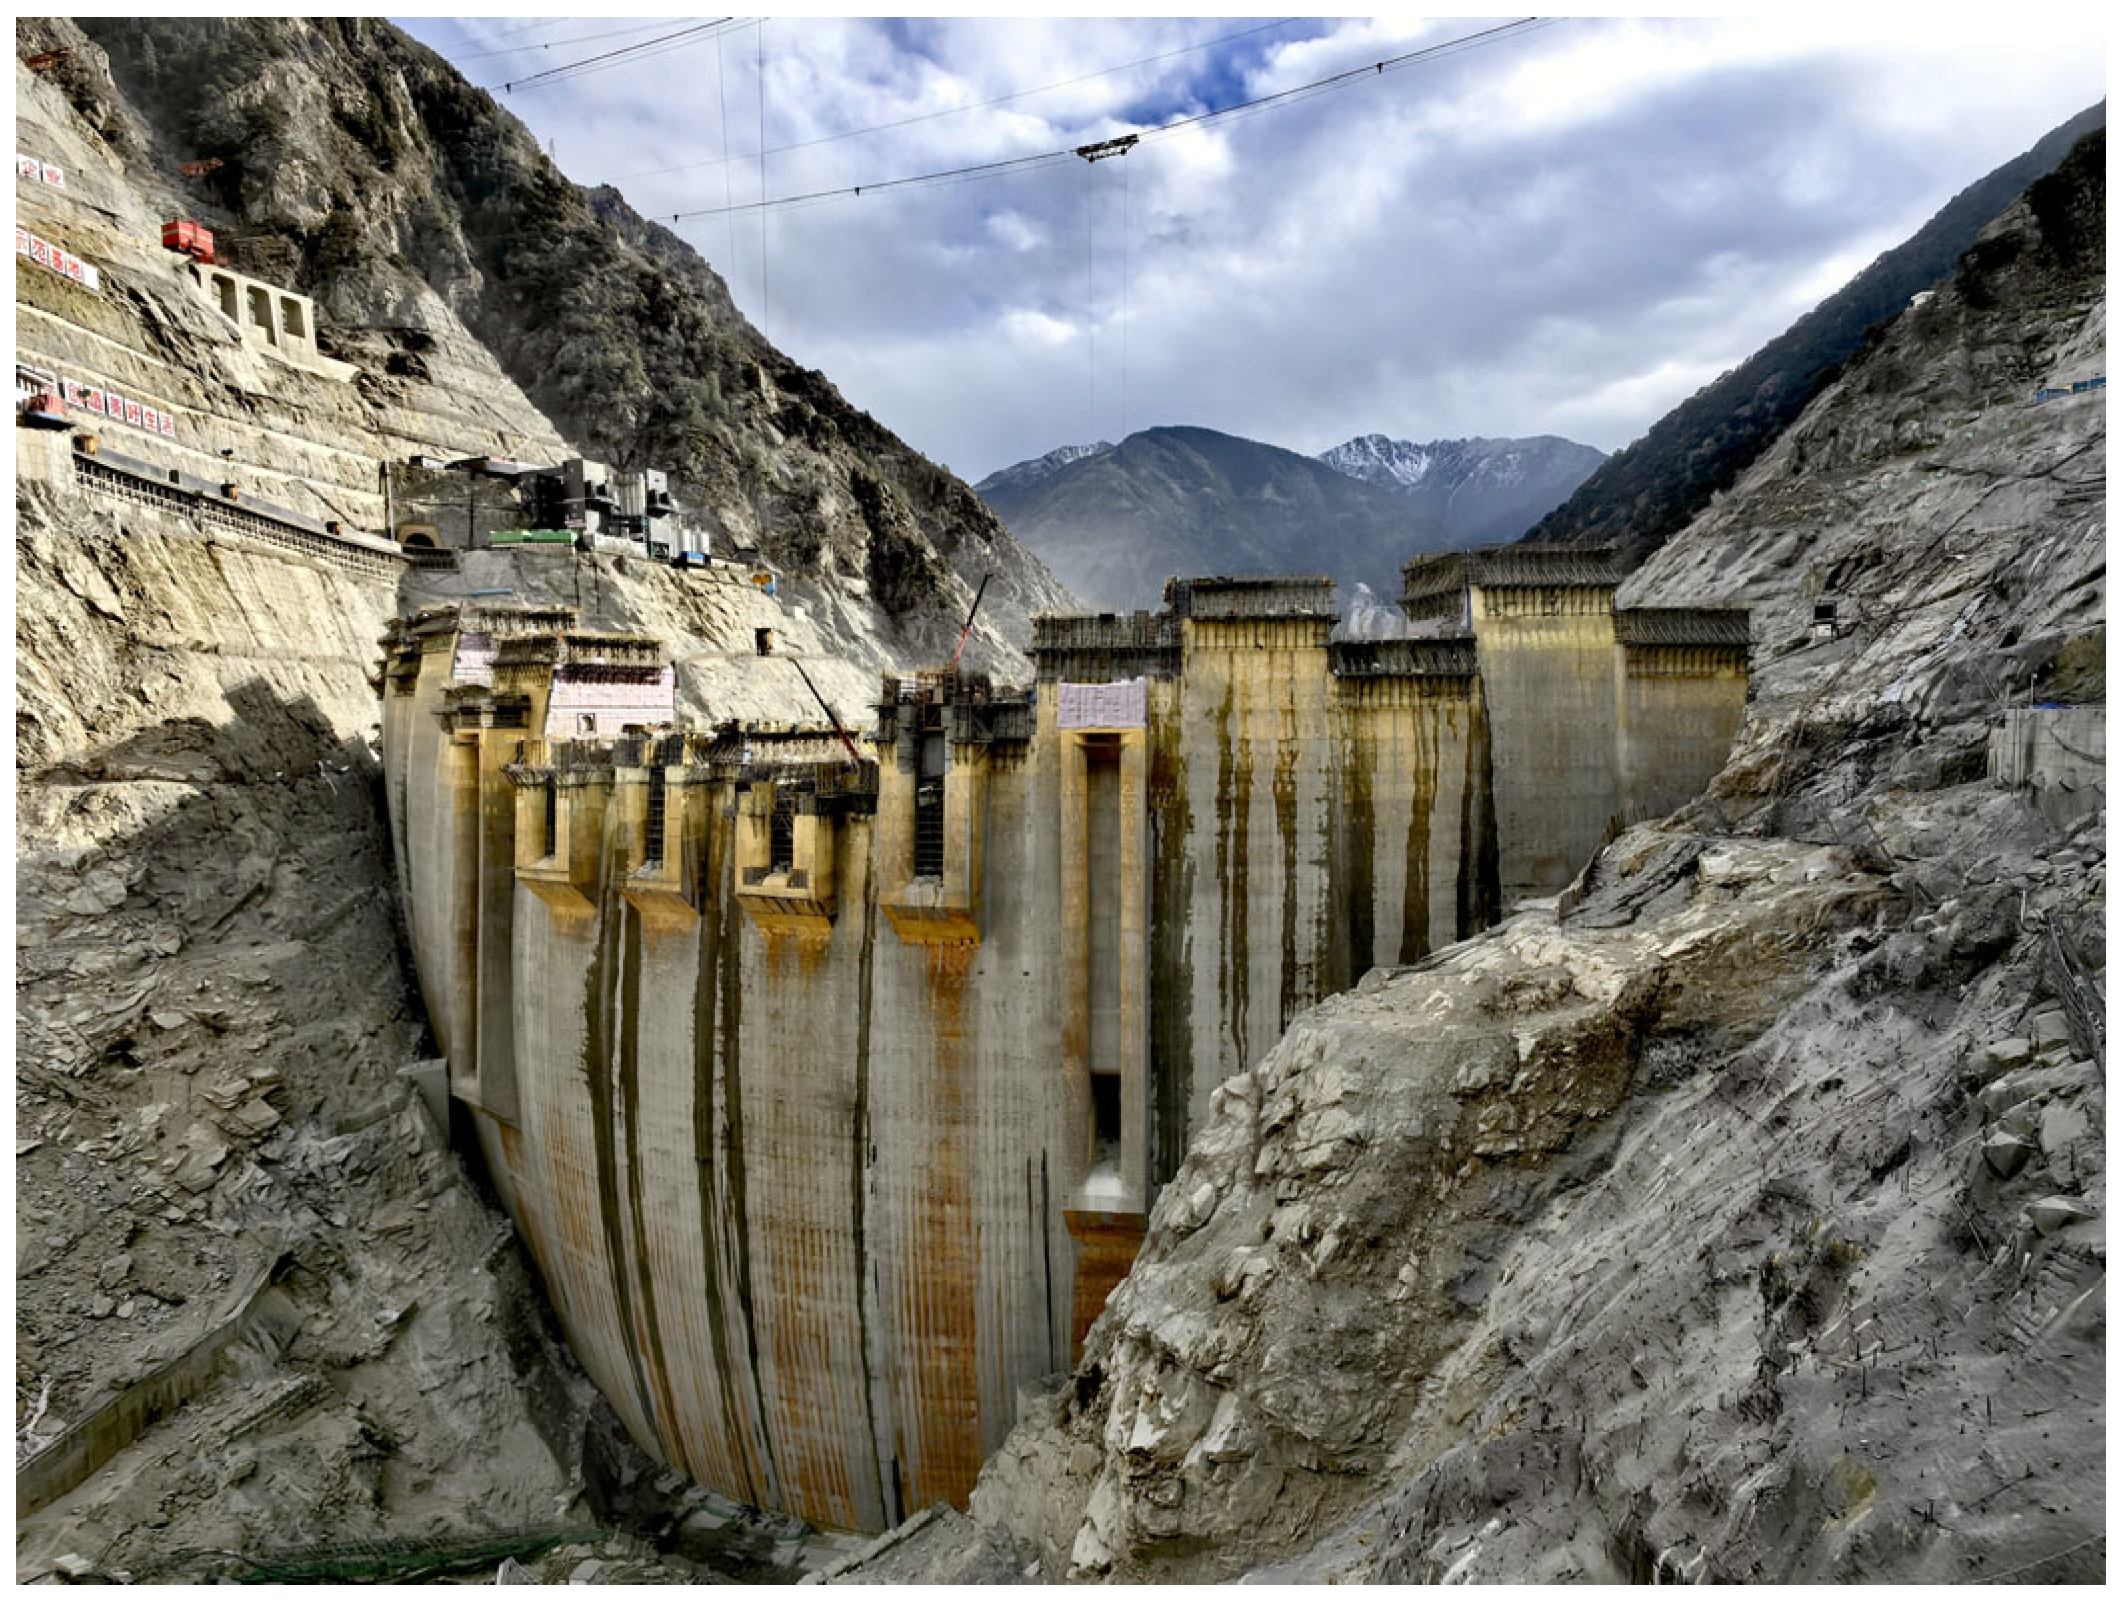
The hydropower complex mainly consists of a concrete double-curvature arch dam, a flood-discharge and energy-dissipation system, and a water-diversion and power-generation system. The total concrete volume of the dam is approximately 2.51 million m3. The dam body is divided into 27 monoliths by 26 transverse joints, with no longitudinal joints. The upstream face profile is shown in Figure 8. The concrete production system is located on the left bank at an elevation of 2894 m, with a design production capacity of 420 m3/h. Dam concrete is transported by 25-ton dump trucks to the supply platform, and four 30-ton conjugate, parallel cable cranes are used for hoisting and pouring.
The project is located in the transition zone between the Qinghai–Tibet Plateau and the Northwest Sichuan Plateau. According to multi-year records from a meteorological station near the dam site, the average annual temperature is 9.2 °C, and the low-temperature period is long. From November to February of the following year, the number of days with a diurnal temperature difference greater than 15 °C averages 108 per year, and those with a difference greater than 20 °C average 86.2 per year, which indicates significant diurnal temperature variation. The temperature characteristics during a specific low-temperature period are shown in Table 1.

4.2. Simulation Scheme Design

4.2.1. Scheme Comparison

To address the construction difficulties caused by the severe winter climate and large diurnal temperature variations, two simulation scenarios were defined in this study, as shown in Table 2. The first corresponded to the original winter-shutdown scenario, and the second used the proposed dynamic block-division method for continuous winter pouring operations. Through this comparative analysis, the dam’s construction under different strategies can be systematically analyzed. In addition, the simulation evaluated the extent to which each scenario meets the predetermined key project milestones, comprehensively assessing the practical application of the two scenarios in optimizing the overall construction timeline.

4.2.2. Boundary Conditions and Parameter Settings

The dam crest elevation is 2894 m, with the lowest foundation surface elevation of 2677 m and the maximum dam height of 217 m. The dam body has three tiers of discharge orifices—bottom, deep, and surface—with galleries arranged at elevations of 2696 m, 2750 m, and 2826 m.
The pouring-layer thickness and interlayer interval were set according to Table 3. The block thickness was set to 1.5 m, in accordance with the recommended sub-block thickness for winter pouring in the construction code. According to the project design documents, the required interval at conventional horizontal construction joints is 9 days, whereas that at newly generated thin-layer joints can be reduced to 6 days. The cable-crane efficiency was determined based on the design specifications of the actual 30-ton machines. The positive-temperature-window duration was determined from multi-year winter temperature statistics at the dam site. However, meteorological data may be incomplete, which could reduce the model’s simulation accuracy under specific engineering conditions.
Regarding height difference control, the maximum allowable construction height difference between adjacent monoliths was 18 m, the minimum was 6 m, and the maximum allowable height difference across the entire dam was 36 m. When the height difference between adjacent monoliths exceeded 9 m, the sloping monolith could be poured; the formwork influence height was set to 1.5 m. Also, joint grouting took 5 days, the design age was 120 days, one cooling zone was grouted simultaneously, and the cantilever height limit was 68 m. All the above parameters were taken from the project’s design and construction organization plan.

4.3. Model Validation

To validate the constructed simulation model, Monolith No. 14, with a long construction duration and a complex monolith structure, was selected. The sub-block information from its first low-temperature period was used as the validation object, with a focus on two aspects: dynamic block division and start-time planning.
The dynamic block division results are shown in Table 4, indicating that the model behaves as expected:
(1)
For special structural blocks with layer heights of 2.0 m and 2.5 m, the model processed them according to the preset sub-block division and residual thickness merging mechanism, with no layering violating the minimum-thickness constraint.
(2)
Regarding interlayer interval control, the model appropriately set short intervals for newly added horizontal joint surfaces while maintaining the original interval requirements at existing structural joints, conforming to the construction logic.
(3)
In terms of start-time planning, the start and completion times of all sub-blocks fell within the system-defined positive-temperature window.
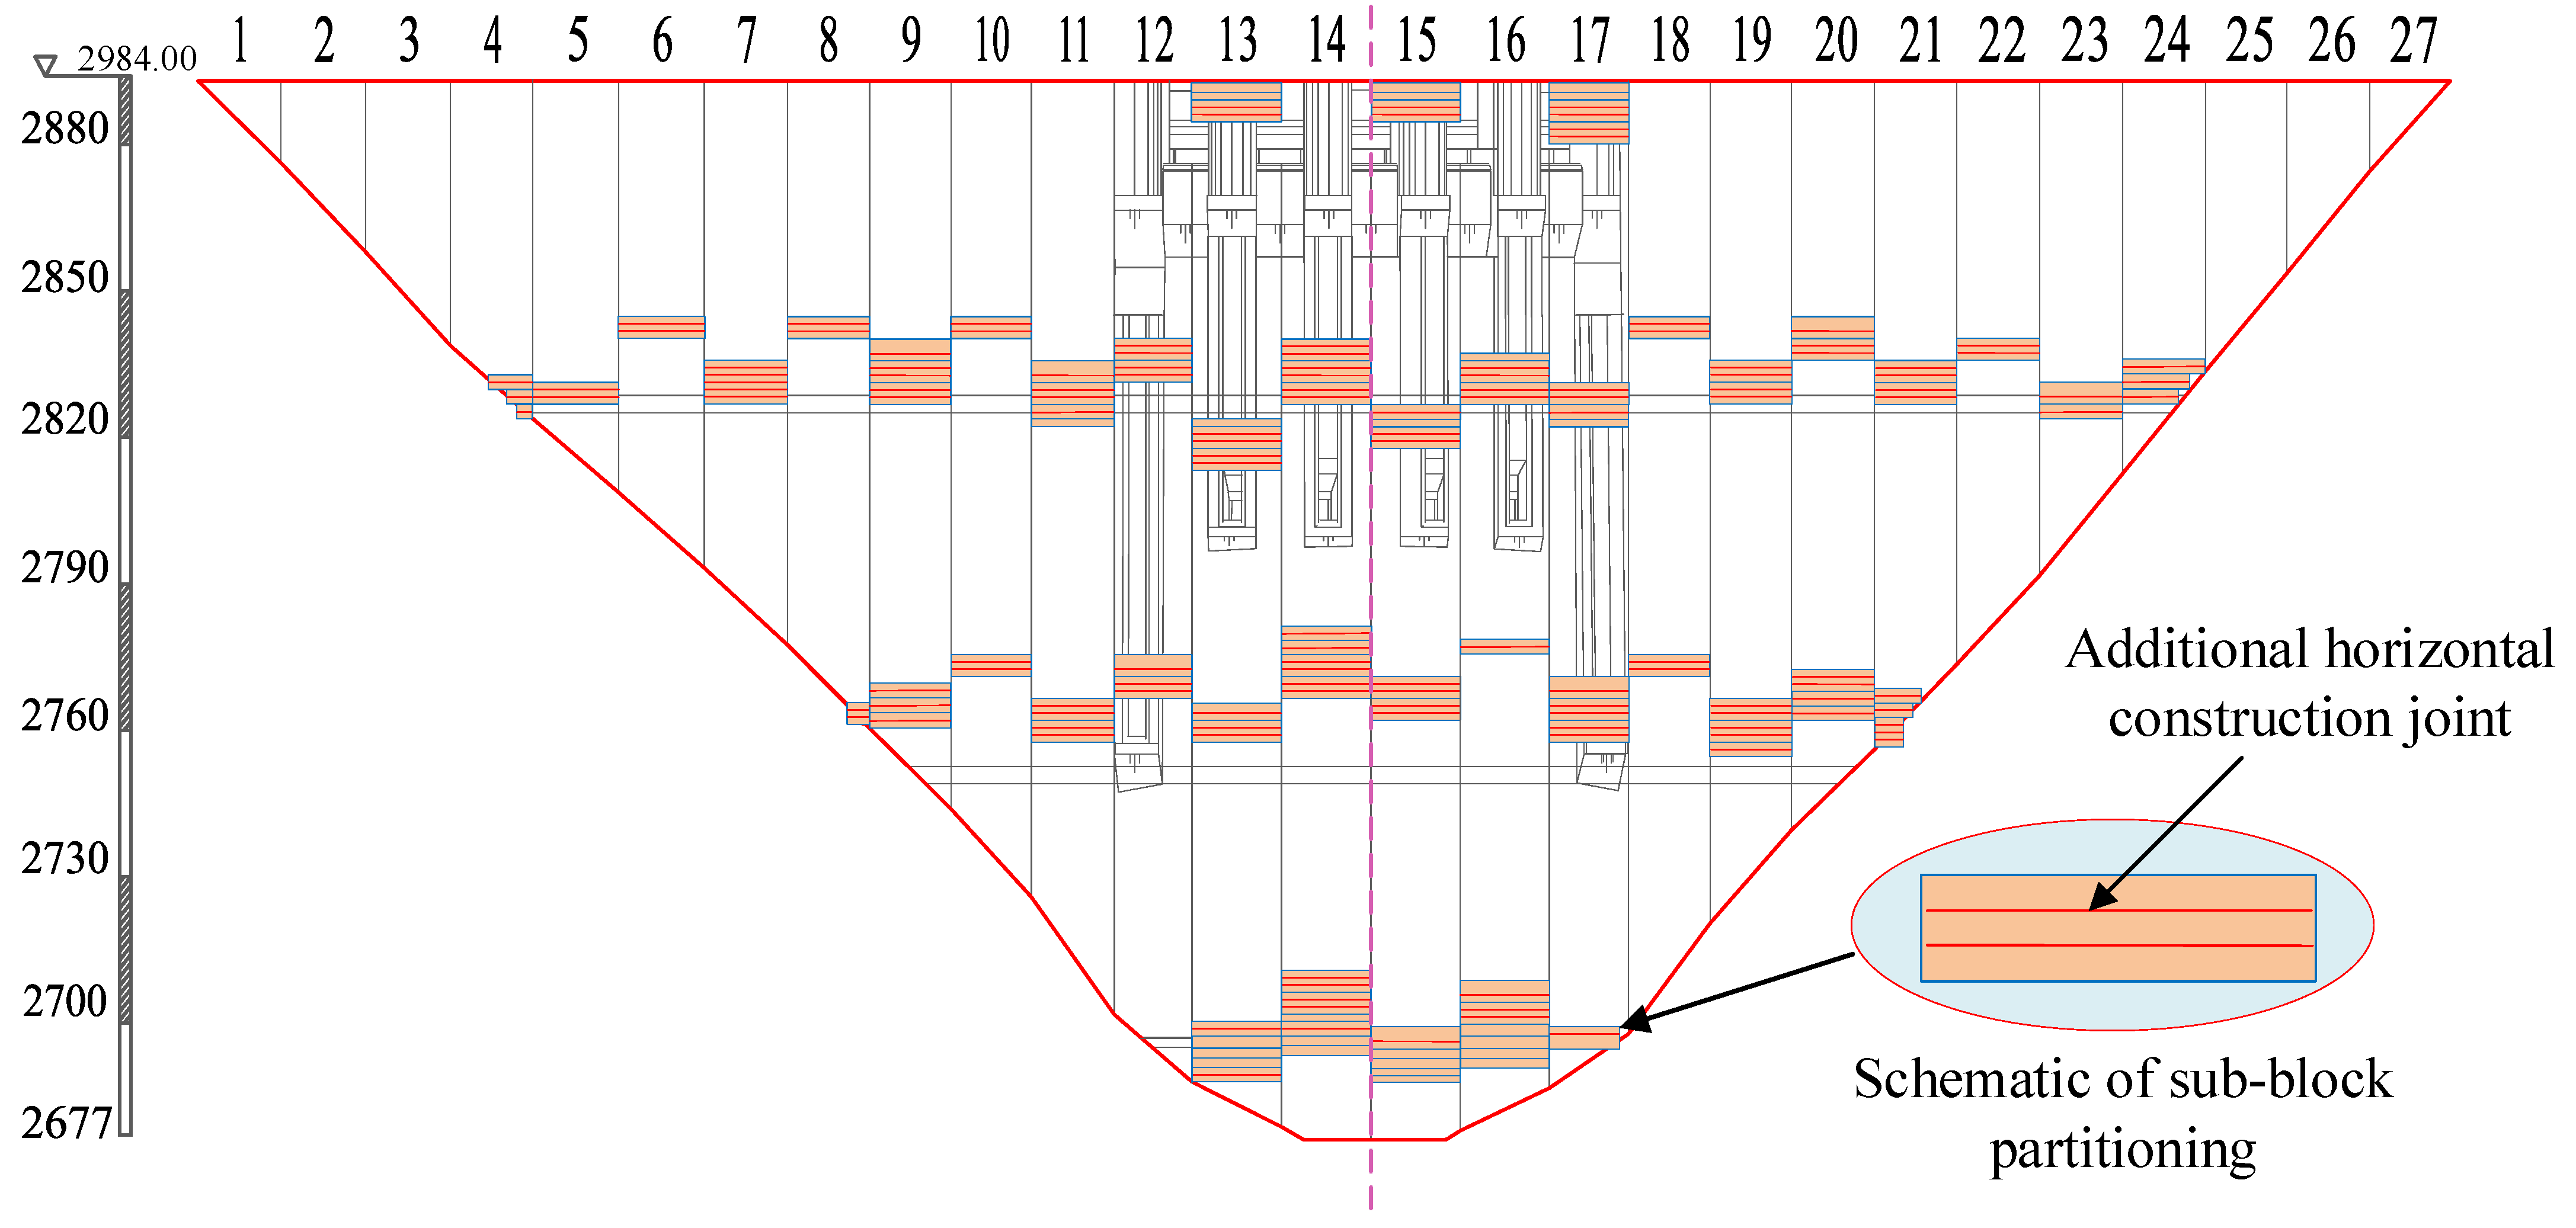
The block division positions for the entire dam are shown in Figure 9. The original planned number of blocks for Monolith No. 14 was 57, which increased to 75 after optimization. Among them, 11 original blocks were dynamically subdivided, which generated a total of 17 additional sub-blocks. Most of the newly added sub-blocks adopt the standard 1.5 m thin layer, reflecting the optimization strategy of maintaining continuous pouring by dividing thin-layer blocks during low-temperature periods. The validation was limited to the block-division logic and the pouring process within a single daily positive-temperature window, and it did not use historical construction data from the actual project for quantitative calibration.

4.4. Simulation Results and Discussion

4.4.1. Construction Schedule

Each simulation scenario utilized September 2 of the first year as the start time for the first pouring. The comparison of the calculation results for the scenarios is presented in Table 5, and the completion status of key milestone nodes is shown in Table 6.
(1)
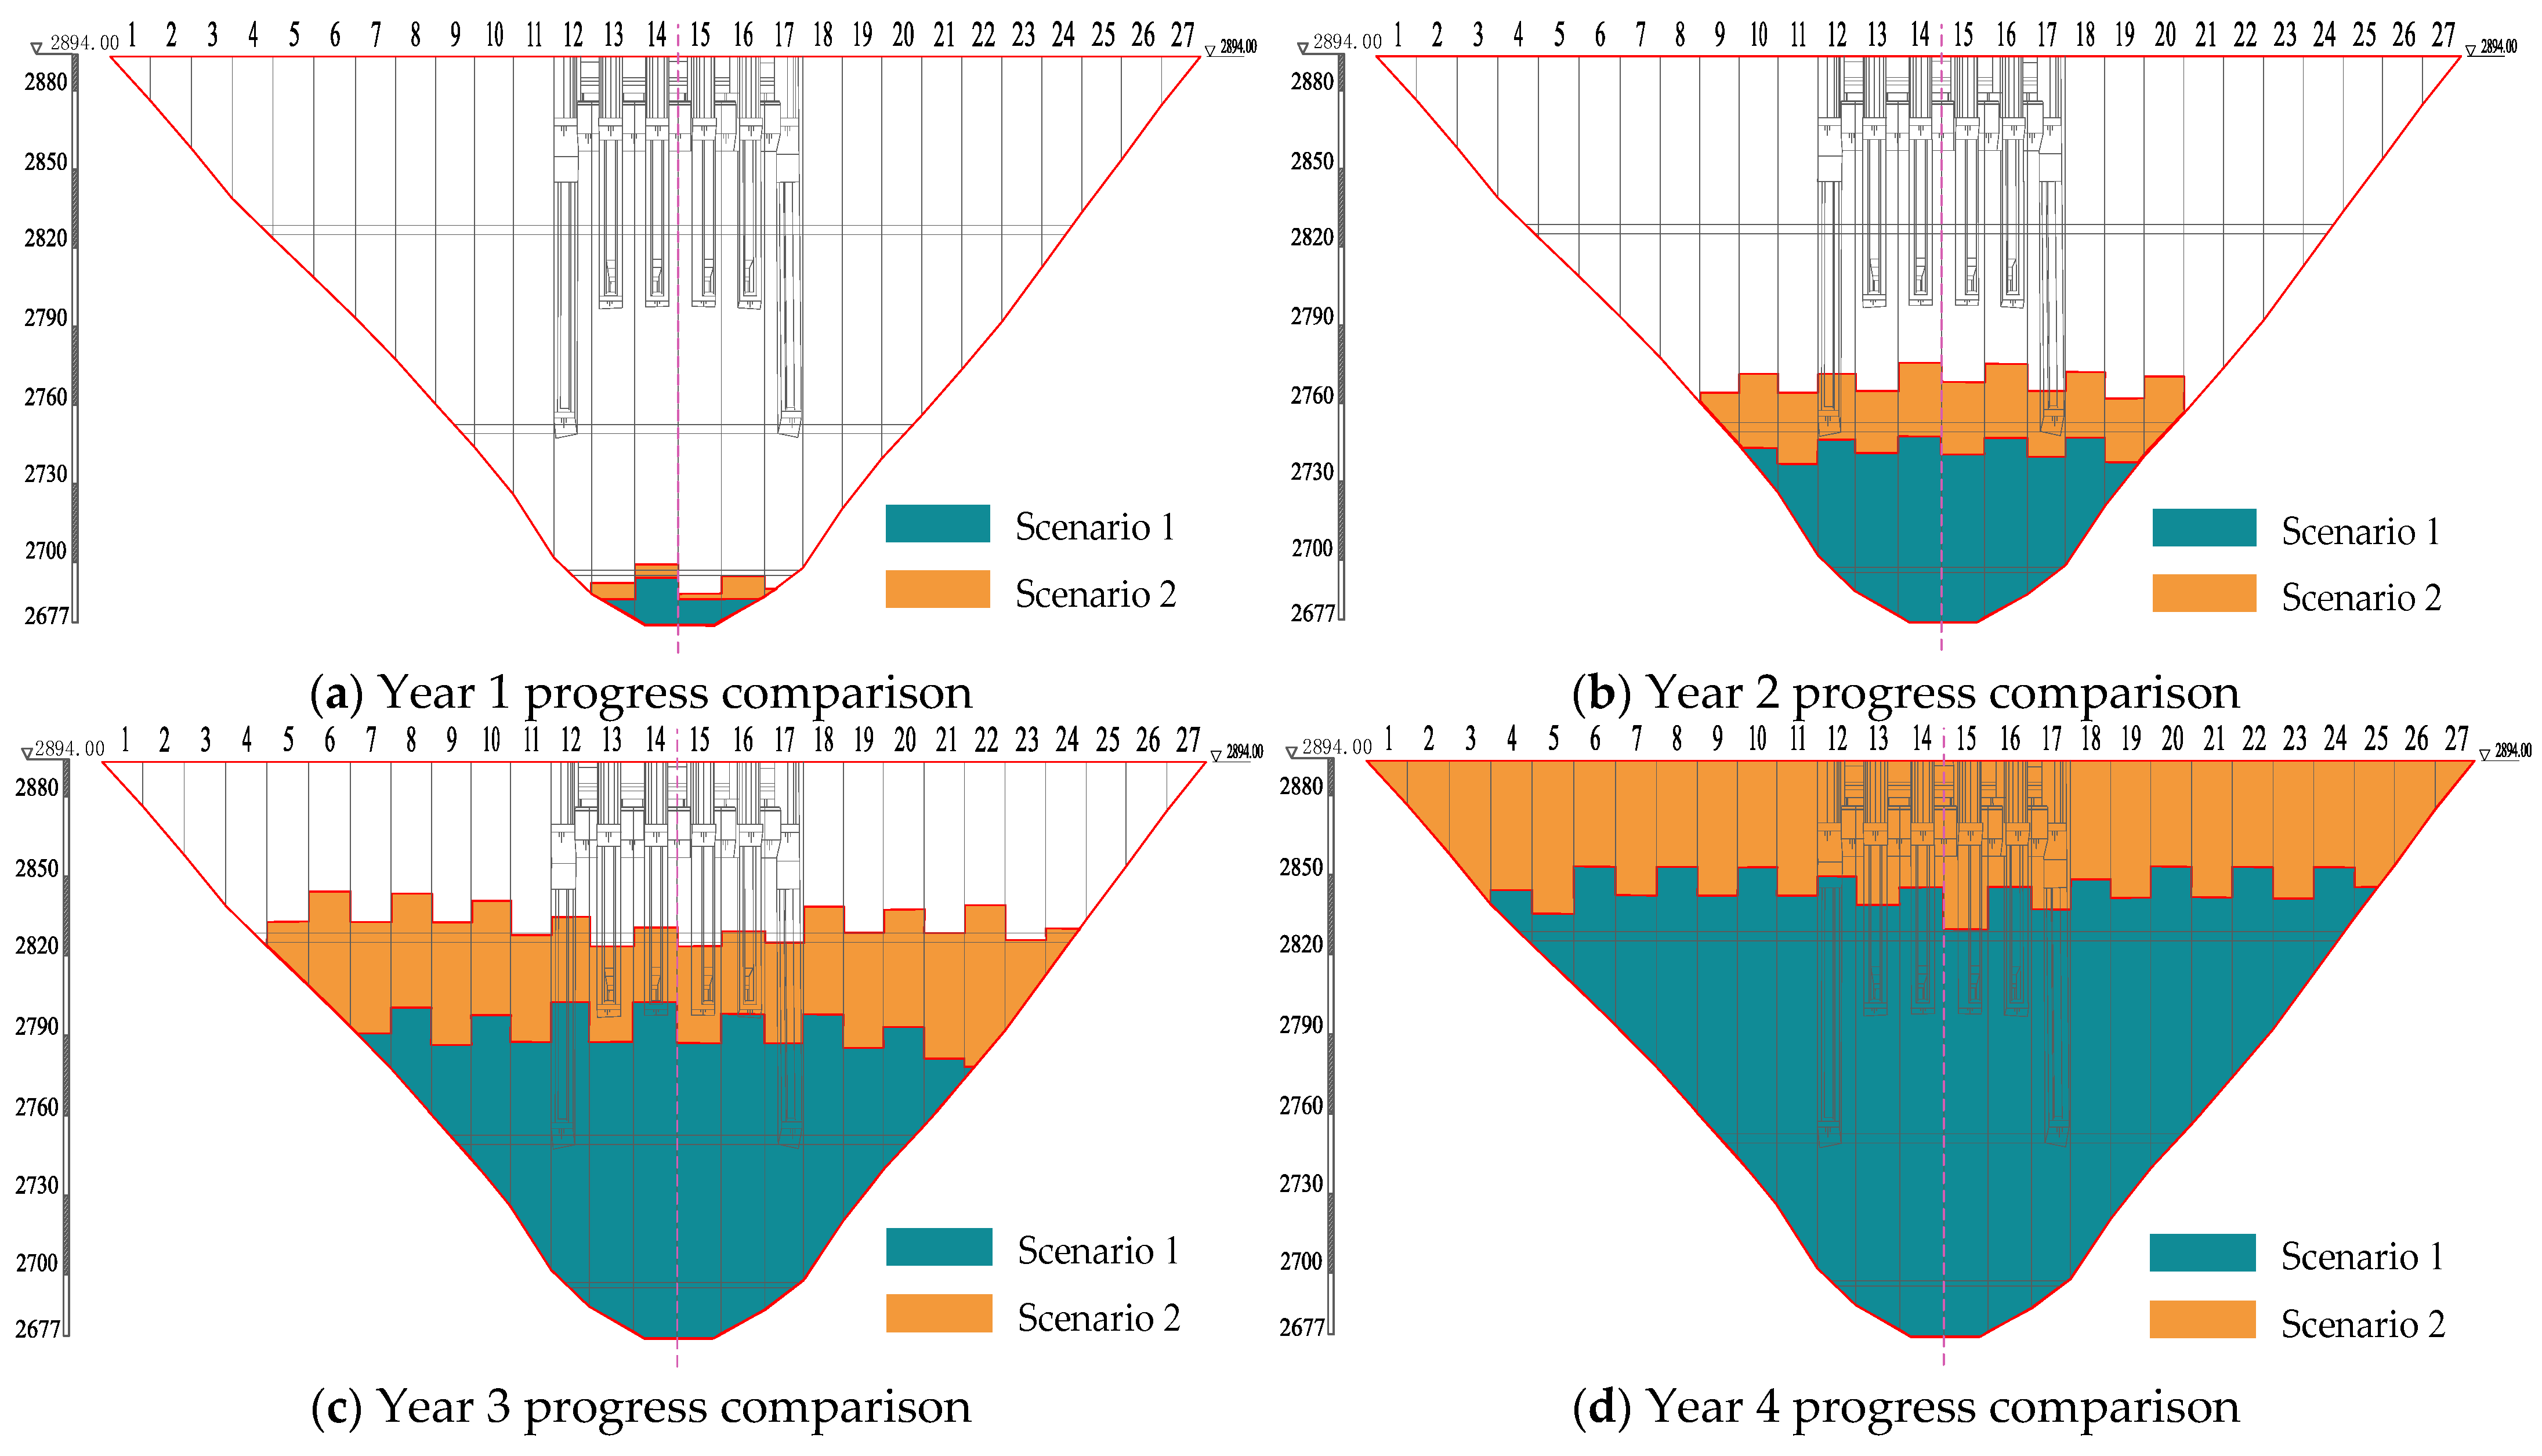
In scenario 1, a mandatory complete shutdown during severe winters resulted in approximately four months of construction suspension each year. Consequently, the overall schedule was severely delayed, and none of the key control nodes reached the specified elevation requirements. By contrast, Scenario 2 shortened the overall duration by 10 months and met all key schedule-control indicators, which indicates effective schedule control.
(2)
As shown in Figure 10, the annual elevation increase in scenario 2 was superior to that in scenario 1, judging by the annual dam-body pouring profile. The elevation increase during low-temperature periods in scenario 2 was mainly concentrated near 2688 m, 2761 m, and 2824 m.
(3)
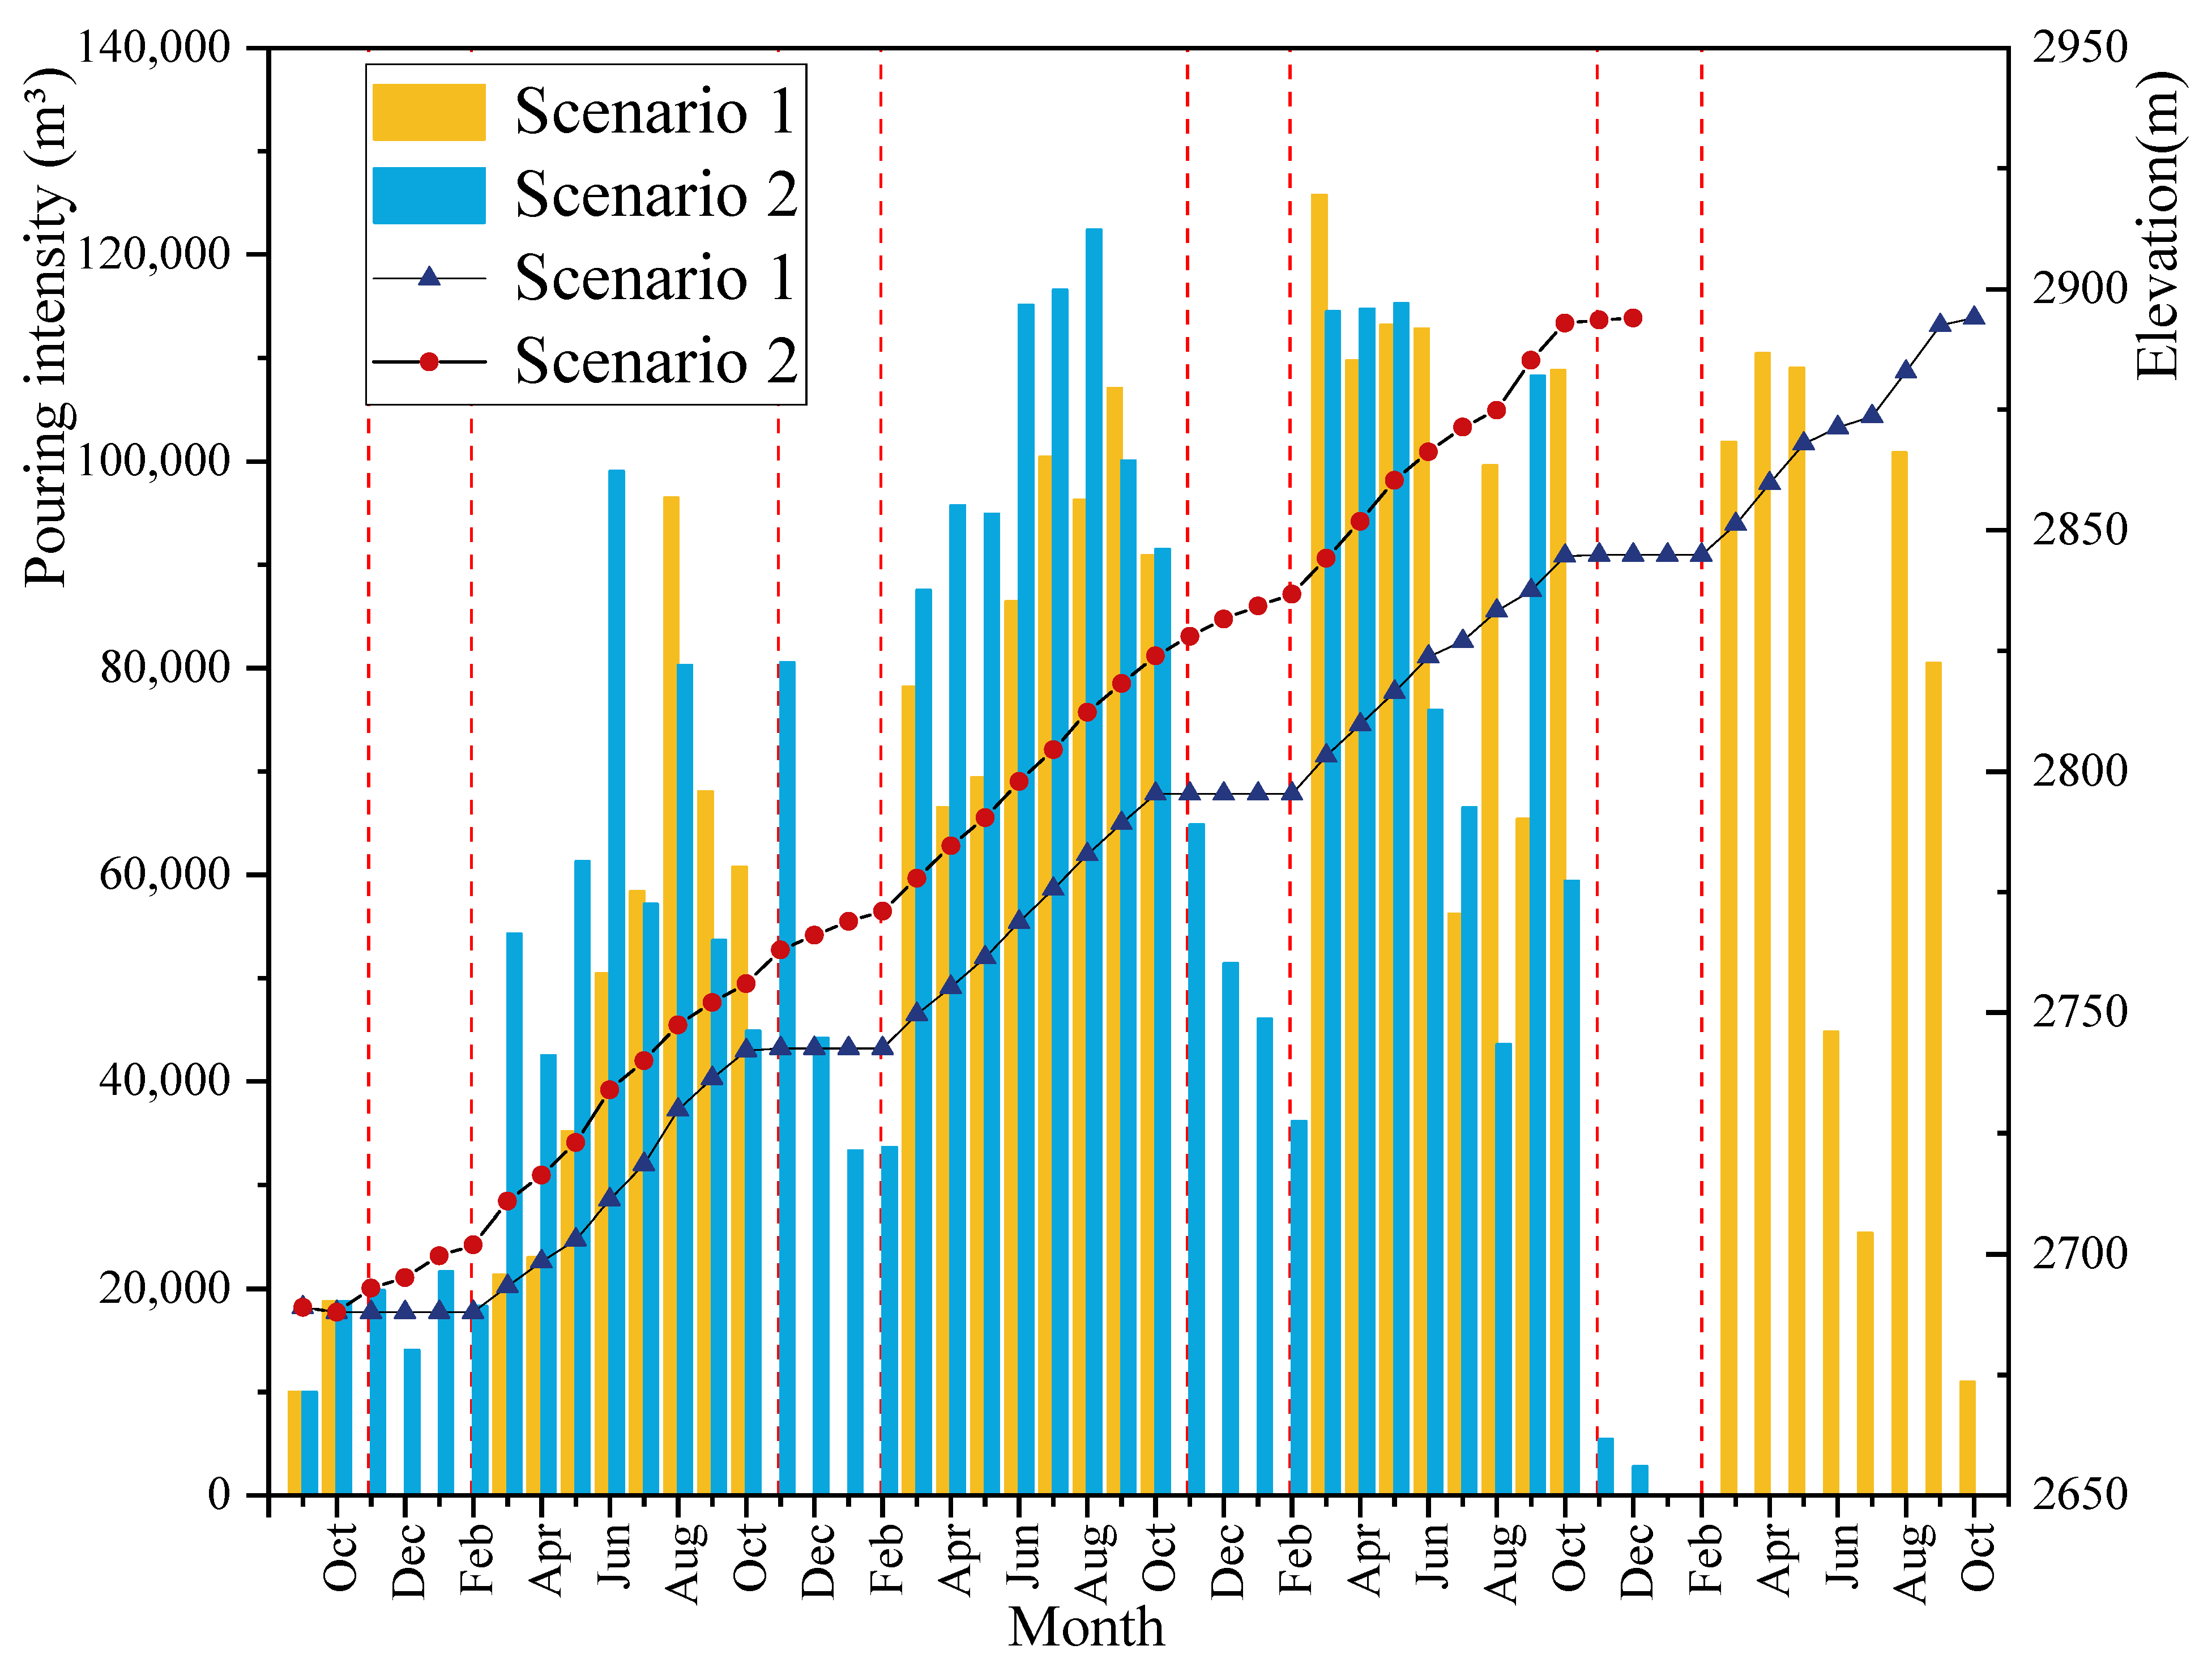
The monthly average elevation variation is shown in Figure 11. In scenario 2, the dam elevation increased steadily month by month, and the year-end average elevations were 7.2 m, 23.4 m, 36.2 m, and 49.1 m higher than those in scenario 1.
The above comparative analysis of the simulation results shows that the continuous pouring process during the low-temperature period adopted in scenario 2 has significant advantages in shortening the construction duration, improving schedule control, and enhancing the uniformity of the dam pouring. The core reason lies in the active use of the large winter diurnal temperature variation in high-altitude regions. The traditional scenario adopts a complete shutdown strategy during this period, which results in approximately four months of construction time lost each year. Notice that such a climate has a stable pattern of diurnal positive–negative temperature alternation. Thus, the pouring can be completed within the positive-temperature window and switches to insulation curing during the negative-temperature period. This dynamic sub-block scenario subdivides each standard block into multiple 1.5 m thin-layer sub-blocks. Taking this project as an example, based on the monthly statistics of pouring intensity, a cumulative volume of approximately 472,000 m3 was completed, corresponding to an average dam-height increase of about 20 m per winter.
To assess the impact of variations in the positive-temperature-window duration on the total construction duration, three comparison scenarios were designed. Scenario A shortened the positive-temperature window to 10 h (10:00–21:00). Scenario B was the baseline window of 12 h (10:00–22:00), the original scenario 2. Scenario C extended the positive-temperature window to 13 h (9:00–22:00). All other simulation parameters remained unchanged.
The simulation results are shown in Table 7. For every additional hour of positive-temperature-window duration, the total construction duration was shortened by approximately one month. Even under the shortest 11 h window, the construction duration of the dynamic sub-block strategy (41 months) was 9 months shorter than that of the complete winter-shutdown scenario (50 months). When the window was extended from 12 h to 13 h, the duration was shortened by only 26 days, and the effect of schedule optimization diminished. Moreover, simply extending the positive-temperature window was not consistent with actual temperatures. In summary, the positive-temperature-window duration is an important sensitivity parameter for predicting construction duration, but within the actual possible fluctuation range (11–13 h), the dynamic sub-block strategy consistently outperforms the winter shutdown scenario.

4.4.2. Concrete Placement Productivity

(1)
As shown in Figure 11, the monthly pouring intensity was zero for scenario 1 during the low-temperature period, and the peak intensity of 125,771 m3 occurred from March to June of the fourth year. In scenario 2, the construction peak was from June to September of the third year, with a peak intensity of 122,395 m3. The peak intensities of the two scenarios were similar, but scenario 2 reached and maintained peak construction capacity earlier.
(2)
As shown in Table 8, in terms of pouring-intensity uniformity, the monthly pouring-intensity data from the second to the fourth year of both scenarios were selected to calculate the annual coefficient of variation. For these 3 years, the coefficients of variation for scenario 2 are 42.99%, 37.03%, and 59.82%, respectively, significantly lower than those for scenario 1 (93.98%, 76.54%, and 84.01%, respectively). This indicates that scenario 2, by continuously pouring during the low-temperature period, effectively reduces the range of fluctuations in pouring intensity, resulting in a more stable construction workflow.
(3)
During the implementation of scenario 2, the average monthly pouring intensity in the low-temperature period was 33,721 m3, which was 42.48% of the average monthly intensity during the normal-temperature period. The dynamic sub-block strategy converted the traditional winter idle period into a continuous low-intensity pouring window.
In summary, the low-temperature period dynamic sub-block pouring strategy advances the construction peak, improves construction uniformity, optimizes the overall schedule, and disperses schedule risks.

5. Discussion

This study addressed construction delays caused by shutdowns during low-temperature periods with large diurnal temperature variations in the construction of high arch dams in high-altitude regions. This study proposed a dynamic sub-block pouring process strategy and developed a corresponding simulation model for construction scheduling. A construction-schedule simulation analysis was conducted for a high arch dam project on a plateau in Southwest China to meet the project’s need for schedule optimization. The following discussion elaborates on the winter construction strategy, the innovation in the simulation model, the simulation results, and this study’s limitations.
The core of the proposed dynamic sub-block pouring strategy lies in subdividing a conventional thick block into multiple thin sub-blocks. This strategy fully utilizes the significant diurnal temperature variation characteristic of plateau winters, using the daytime positive-temperature window for pouring and implementing insulation curing during the negative-temperature period. Simulation results showed that scenario 2, which adopted this process, maintained an average monthly pouring intensity of 33,721 m3 during the low-temperature period, which accounts for 42.48% of the average monthly pouring intensity during the normal-temperature period. This also reached 39.32% of the average monthly pouring intensity (85,760 m3) reported in reference [25]. This result reflects the advantage of this strategy in terms of resource utilization efficiency. Traditional approaches mostly adopt macro-efficiency-reduction assumptions, such as winter shutdown or reduced working hours. Wang et al. [27] applied a complete winter-shutdown strategy for a high arch dam in a severe cold region, with a suspension period of about six months. The pouring intensity was zero during the low-temperature period, and the available construction time was extended by 40 days, yet the actual construction period was only shortened by 15 days. By contrast, scenario 2 converted the winter period into effective construction time, shortening the total duration by approximately 10 months compared to the winter shutdown strategy and demonstrating strong potential in terms of schedule optimization.
Based on the DES method, this study developed an arch dam construction schedule simulation model that integrated modules for low-temperature period identification, dynamic sub-block division, and sub-block pouring planning. The main innovations of the proposed model are as follows: (1) The first is the strategy-switching mechanism: by introducing a low-temperature-period identification function and strategy-switching logic, the model achieved adaptive switching between the normal pouring and the dynamic sub-block pouring strategies, enhancing the model’s adaptability to different climatic conditions. (2) The second is the dynamic sub-block division module: with the objective of maximizing the pouring volume during the low-temperature period, and considering layer thickness constraints and the positive-temperature-window duration, the model realized dynamic optimization, breaking through the limitation of fixed block height in traditional models. (3) The third is the pouring planning module: combined with real-time cable-crane pouring intensity and the minimum requirements for pouring intensity, the model dynamically matched the horizontal layering method and the benching method to ensure that sub-block pouring was completed within the positive-temperature window, improving the temporal accuracy of the simulation. By analyzing the simulation model’s output, we verified the functional integrity of each module.
Based on the simulation results for the case project, the dynamic sub-block process shortened the total construction duration by 10 months compared to the shutdown scenario, demonstrating its potential for schedule control. Moreover, this process reduced the coefficient of variation of the monthly pouring intensity by approximately 40%, resulting in a more stable construction process with less resource-allocation pressure and schedule risks. It should be emphasized that the above conclusions only indicate the potential of the dynamic sub-block process for schedule optimization. It is not yet a fully validated construction strategy. The thermal control safety under this process needs to be verified through specific engineering tests or numerical simulations.
Moreover, the following major limitations must be acknowledged. First, the model’s validity depends on a stable daily positive-temperature window. If extreme weather significantly shortens the window or causes it to disappear, the dynamic sub-block pouring logic will no longer be applicable. Second, this study did not conduct concrete temperature monitoring, early-age strength testing, or long-term crack-resistance evaluation under the dynamic sub-block strategy. The conclusions are limited to schedule optimization. Third, model validation was based only on conformity checks between simulation results and engineering logic, without comparison with actual monitoring data. Fourth, key simulation parameters, such as the number of cable cranes and transport speed, were treated as fixed design values, and various pouring strategies used in actual projects were not incorporated into the model.

6. Conclusions

To address the difficulty of winter construction schedule control for high arch dams in high-altitude regions with extreme temperature variations, this paper proposed a dynamic sub-block pouring construction strategy adapted to positive-temperature windows and developed a corresponding discrete-event simulation model. Through a case simulation study of a project in Southwest China, the following main conclusions were drawn:
(1)
The proposed dynamic sub-block pouring strategy, through the mode of one formwork for each block with multiple pourings and operation in windows with dynamic intervals, can convert the traditional complete winter-shutdown period into a continuous pouring window in simulation.
(2)
The DES-based simulation model can automatically identify low-temperature periods, dynamically divide sub-blocks, and constrain the pouring start and end times within the positive-temperature window. Taking the simulation results for Monolith No. 14 as an example, the model’s ability to effectively simulate the dynamic sub-block pouring strategy was verified.
(3)
When the two simulation scenarios were compared, i.e., shutdown in the low-temperature period and continuous pouring, the simulation results showed that the continuous pouring scenario advanced the construction duration by approximately 10 months; advanced the construction peak by nearly one year; increased the year-end average pouring elevations by 7.2 m, 23.4 m, 36.2 m, and 49.1 m; and achieved a lower coefficient of variation of monthly pouring intensity, indicating better construction uniformity.
In summary, simulation modeling indicates that the dynamic sub-block pouring strategy shows promising potential for schedule optimization in the winter construction of high arch dams in high-altitude regions with large diurnal temperature variations. However, the above conclusions are based on simulations, and the model has limitations. Future research will focus on: introducing probabilistic climate modeling or short-term forecasting to enhance climate robustness, establishing correction mechanisms for missing climate data, conducting systematic thermo-mechanical numerical simulations and on-site thermal-monitoring studies to comprehensively optimize construction parameters, performing sensitivity analysis of key simulation parameters, and extending the model to support the combinatorial optimization of multiple winter-construction strategies.

Author Contributions

Conceptualization, C.Z. and F.W.; methodology, C.Z.; software, C.Z.; validation, C.Z. and Z.L.(Zhiyu Liu); formal analysis, H.Z., J.H. and Z.L.(Zhipeng Liang); investigation, H.Z. and L.L.; resources, Y.Z.; data curation, Z.L.(Zhiyu Liu); writing—original draft preparation, C.Z. and Z.L.(Zhiyu Liu); writing—review and editing, C.Z., Z.L.(Zhiyu Liu) and J.H.; visualization, Z.L.(Zhiyu Liu) and J.H.; supervision, Y.Z.; project administration, C.Z. All authors have read and agreed to the published version of the manuscript.

Funding

This research was supported by the Doctoral Research Start-up Fund of Hubei University of Technology (XJ2023001101).

Institutional Review Board Statement

Not applicable.

Informed Consent Statement

Not applicable.

Data Availability Statement

The original contributions presented in this study are included in the article. Further inquiries can be directed to the corresponding author.

Conflicts of Interest

The authors declare no conflicts of interest.

References

  1. Yan, C.; Tu, J.; Liang, H.; Guo, S.; Li, D. Seismic Stability Analysis of a High Arch Dam-Foundation System Considering Ground Motion and Modeling Parameter Uncertainties. Soil Dyn. Earthq. Eng. 2023, 164, 107534. [Google Scholar] [CrossRef]
  2. Cao, W.; Wen, Z.; Su, H. Spatiotemporal Clustering Analysis and Zonal Prediction Model for Deformation Behavior of Super-High Arch Dams. Expert Syst. Appl. 2023, 216, 119439. [Google Scholar] [CrossRef]
  3. Song, W.; Ren, B.; Guan, T. Concrete Placement Sequencing for Arch Dams Based on Deep Monte Carlo Tree Search. J. Hydroelectr. Eng. 2024, 43, 120–130. (In Chinese) [Google Scholar]
  4. Song, W.; Guan, T.; Ren, B.; Yu, J.; Wang, J.; Wu, B. Real-Time Construction Simulation Coupling a Concrete Temperature Field Interval Prediction Model with Optimized Hybrid-Kernel RVM for Arch Dams. Energies 2020, 13, 4487. [Google Scholar] [CrossRef]
  5. Yan, J.; Wang, F.; Li, Y.; Ma, C.; Zhou, J.; Yu, H. Prediction and Analysis of Temperature Recovery after Arch Closure Grouting of Baihetan Arch Dam. Adv. Eng. Softw. 2025, 210, 104012. [Google Scholar] [CrossRef]
  6. Zhang, C.; Wang, H.; Cao, J.; Liu, Q.; Liu, F.; Wang, M. Type Selection between Arch Dam and Gravity Dam Based on Construction Simulation: A Case Study. Water 2023, 15, 1482. [Google Scholar] [CrossRef]
  7. Wang, F.; Song, R.; Yu, H.; Zhang, A.; Wang, L.; Chen, X. Thermal Parameter Inversion of Low-Heat Cement Concrete for Baihetan Arch Dam. Eng. Appl. Artif. Intell. 2024, 131, 107823. [Google Scholar] [CrossRef]
  8. Zhong, G.; Ren, B.; Tong, D. Study on Multi-Scheme Analysis and Evaluation Method for Concrete Sequence Placement of High Arch Dam. Sci. China Technol. Sci. 2011, 54, 47–53. [Google Scholar] [CrossRef]
  9. AbouRizk, S. Role of Simulation in Construction Engineering and Management. J. Constr. Eng. Manag. 2010, 136, 1140–1153. [Google Scholar] [CrossRef]
  10. Abdelmegid, M.A.; González, V.A.; Poshdar, M.; O’Sullivan, M.; Walker, C.G.; Ying, F. Barriers to Adopting Simulation Modelling in Construction Industry. Autom. Constr. 2020, 111, 103046. [Google Scholar] [CrossRef]
  11. Wei, Y.; Lei, Z.; Altaf, M.S. Simulation-Based Comparison of Push- and Pull-Based Planning in Panelized Construction. Autom. Constr. 2024, 158, 105228. [Google Scholar]
  12. Wang, R. Key Technologies in the Design and Construction of 300 m Ultra-High Arch Dams. Engineering 2016, 2, 350–359. [Google Scholar] [CrossRef]
  13. Sun, X.; Qi, D. Computer Simulation and Program Design for Water Resources and Hydropower Engineering Construction, 1st ed.; China Water & Power Press: Beijing, China, 1996. [Google Scholar]
  14. Zhang, G.; Wu, B.; Ren, B.; Guan, T.; Yu, J. Collaborative Analysis Model of Construction Schedule and Quality for RCC Dam Based on DES and Deep Learning. J. Civ. Eng. Manag. 2025, 31, 843–859. [Google Scholar] [CrossRef]
  15. Zhong, D.; Chu, Z.; Ren, B.; Zhao, M.; Guan, T.; Song, W. Global Comprehensive Sensitivity Analysis of Arch Dam Construction Parameters Based on Orthogonal Experiment. Trans. Tianjin Univ. 2017, 23, 427–433. [Google Scholar] [CrossRef]
  16. Zhao, C.; He, J.; Wang, F.; Xiong, J.; Zheng, X.; Zhou, Y. Integrated Decision-Making for Cable Crane Group Dispatch in High Arch Dams Using Multi-Scale Simulation. Autom. Constr. 2026, 181, 106643. [Google Scholar] [CrossRef]
  17. Liu, M.; Wen, Z.; Su, H. A Multipoint Prediction Model for the Deformation of Concrete Dams Considering Climatic Features of High-Altitude Regions. Eng. Struct. 2024, 319, 118845. [Google Scholar] [CrossRef]
  18. Schuldt, S.J.; Nicholson, M.R.; Adams, Y.A.; Delorit, J.D. Weather-Related Construction Delays in a Changing Climate: A Systematic State-of-the-Art Review. Sustainability 2021, 13, 2861. [Google Scholar] [CrossRef]
  19. Chen, B.; He, M.; Huang, Z.; Wu, Z. Long-Tern Field Test and Numerical Simulation of Foamed Polyurethane Insulation on Concrete Dam in Severely Cold Region. Constr. Build. Mater. 2019, 212, 618–634. [Google Scholar] [CrossRef]
  20. Guler, S.; Akbulut, Z.F. A Comprehensive Review of Concrete Durability in Freeze-Thaw Conditions: Mechanisms, Prevention, and Mitigation Strategies. Structures 2025, 75, 108804. [Google Scholar] [CrossRef]
  21. Zhang, Z.; Sun, Q.; Yue, X.; Sun, Z.; Liu, Y. Temperature Field Analysis and Prediction of Winter Construction Warm Shed Method Based on Hot Air Heating. Case Stud. Therm. Eng. 2024, 60, 104709. [Google Scholar] [CrossRef]
  22. DL/T 5144-2015; Specification for Hydraulic Concrete Construction. China Electric Power Press: Beijing, China, 2015.
  23. Zhang, G.; Liu, M.; Li, S.; Wang, C.; Zhang, Y.; Zhang, X. Over-winter Insulation Method for Long Interval Thin Placing Layer of Concrete Dam in Alpine Region. Water Resour. Hydropower Eng. 2016, 47, 25–28. (In Chinese) [Google Scholar]
  24. Zheng, J. Simulation and Optimization Study on Construction Process of High Roller Compacted Concrete Arch Dam. Ph.D. Thesis, Tianjin University, Tianjin, China, 2009. (In Chinese) [Google Scholar]
  25. Lu, K. Simulation Study on Concrete Placement Schedule of High Arch Dam in Severe Cold and Long Interval Periods. Master’s Thesis, Tianjin University, Tianjin, China, 2018. (In Chinese) [Google Scholar]
  26. Wang, Q.; Zhong, D.; Wu, B.; Yu, J.; Chang, H. Construction Simulation Approach of Roller-Compacted Concrete Dam Based on Real-Time Monitoring. J. Zhejiang Univ. Sci. A 2018, 19, 367–383. [Google Scholar] [CrossRef]
  27. Wang, X.; Yang, X.; Zhang, K.; Fan, W. Simulation of Schedule Guarantee Measures for Concrete Construction of a High-arch Dam in Severe Cold Region. Yangtze River 2022, 53, 143–147. (In Chinese) [Google Scholar]
  28. Guan, T.; Xiao, Y.; Ren, B.; Yu, H. Research on simulation method of high arch dam construction process under cold conditions. J. Hydroelectr. Eng. 2024, 43, 85–96. (In Chinese) [Google Scholar]
  29. GB 50496-2018; Standard for Construction of Mass Concrete. China Architecture & Building Press: Beijing, China, 2018.
  30. Talmor, I. Optimizing Academic Timetables Using Integer Linear Programming: A Case Study. Educ. Sci. Manag. 2024, 2, 176–187. [Google Scholar] [CrossRef]
  31. Wang, H.; Yang, Q.; Liu, Q.; Zhao, C.; Zhou, W.; Zhang, H.; Liu, J. Automated Productivity Analysis of Cable Crane Transportation Using Deep Learning-Based Multi-Object Tracking. Autom. Constr. 2024, 166, 105644. [Google Scholar]
Figure 1. Multi-year temperature profile at the dam site (Elevation: 2937.9 m).
Applsci 16 05390 g001
Figure 2. Hourly mean temperature in a typical cold season.
Applsci 16 05390 g002
Figure 3. Schematic Layout of Block Partitioning.
Applsci 16 05390 g003
Figure 4. Schematic of Thin-Block, Short-Interval Pouring Construction.
Applsci 16 05390 g004
Figure 5. Simulation Flowchart of High Arch Dam Construction Based on DES.
Applsci 16 05390 g005
Figure 6. Schematic of the Pouring Initiation Planning.
Applsci 16 05390 g006
Figure 7. Structure of the DES-based Simulation Framework.
Applsci 16 05390 g007
Figure 8. Upstream Face of the Dam.
Applsci 16 05390 g008
Figure 9. Block Partition Distribution across Dam Sections.
Applsci 16 05390 g009
Figure 10. Comparison of the Dam’s Annual Pouring Progress.
Applsci 16 05390 g010
Figure 11. Monthly Pouring Intensity and Average Dam Elevation.
Applsci 16 05390 g011
Table 1. Air Temperature Conditions During the Cold Season of a Given Year.
MonthMinimum Temperature (°C)Maximum Temperature (°C)Average Temperature (°C)
11−8.416.23.78
12−13.512.3−0.75
1−17.612.4−1.77
2−8.6515.93.51
Table 2. Summary of the Simulation Scenarios.
Scenario IDConstruction Strategy
Scenario 1Construction suspension during the cold period
Scenario 2Continuous construction during the cold period. The negative-temperature window is defined as 22:00 to 10:00 (the following day), and the positive-temperature window is defined as 10:00 to 22:00.
Table 3. Parameters for Block Thickness and Inter-Block Intervals.
TypeConstruction Location/Structural TypeThicknessInterval DurationNotes
Placement thicknessStrong-restraint foundation zone of riverbed dam sections3.0 mComply with specifications for the corresponding block type4.5 m for other standard dam sections
Gallery layers, downstream trestles, areas around orifices, corbels, and other structures1.5 m/3.0 mComply with specifications for the corresponding block type
Inter-lift intervalStandard block-9 d/6 d-
Special structural block-15 d-
Table 4. Details of Block Partitioning for Part of the Dam During the Cold Period of the First Year.
Elevation Range (m)Lift Height (m)Layer Thickness (m)Inter-Lift Interval (d)Pouring Start TimePouring Completion TimePouring Protocol
2694~269622152022/11/7 10:00:002022/11/7 21:46:45Stepped placement
2696~2698.52.52.5152022/11/24 10:00:002022/11/24 21:54:36Stepped placement
2698.5~2701.531.562022/12/10 10:00:002022/12/10 18:50:06Horizontal placement
1.592022/12/17 10:00:002022/12/17 18:19:23Horizontal placement
2701.5~27031.51.592023/1/2 10:00:002023/1/2 18:20:37Horizontal placement
2703~2707.54.51.562023/1/12 10:00:002023/1/12 18:19:19Horizontal placement
1.562023/1/17 10:00:002023/1/17 18:20:33Horizontal placement
1.562023/1/27 10:00:002023/1/27 18:20:29Horizontal placement
2705.5~27124.51.592023/2/14 10:00:002023/2/14 18:20:26Horizontal placement
1.562023/2/19 10:00:002023/2/19 18:20:25Horizontal placement
1.562023/2/25 12:22:502023/2/25 21:56:20Stepped placement
Table 5. Comparison of Construction Durations for the Simulation Scenarios.
Metric/ScenarioScenario 1Scenario 2
Completion date of dam pouringOctober 31, Year 5December 5, Year 4
Pouring duration (months)5040
Table 6. Completion Status of Dam Pouring Schedule Milestones.
DateMinimum Required Pouring Elevation (m)Minimum Pouring Elevation for Scenario 1 (m)Deviation (m)Minimum Pouring Elevation for Scenario 2 (m)Deviation (m)
End of Dec, Year 126902686−4.02690.5+0.5
End of May, Year 227112696−15.02712.0+1.0
End of Dec, Year 227722734−38.02773.0+1.0
End of May, Year 327932749.5−43.52796.0+3.0
End of Dec, Year 32821.52784.0−37.52823.0+1.5
End of May, Year 42848.52805.0−43.52851.0+2.5
End of Dec, Year 428942827.5−66.52894.00.0
Table 7. Effect of Positive-Temperature-Window Duration on Total Construction Period.
ScenarioPositive-Temperature-Window Duration (Hours)Total Construction Period (Months)Elapsed Days
A11411230
B12401194
C13391168
Table 8. Coefficient of Variation of Annual Pouring Intensity.
Scenario IDMetricYear 2Year 3Year 4
Scenario 1Standard Deviation (m3)32,479.5744,347.8848,878.83
Average (m3)34,561.0057,948.6758,184.17
Coefficient of Variation93.98%76.54%84.01%
Scenario 2Standard Deviation (m3)23,570.9031,082.3844,026.10
Average (m3)54,830.0083,928.3373,591.50
Coefficient of Variation42.99%37.03%59.82%
Disclaimer/Publisher’s Note: The statements, opinions and data contained in all publications are solely those of the individual author(s) and contributor(s) and not of MDPI and/or the editor(s). MDPI and/or the editor(s) disclaim responsibility for any injury to people or property resulting from any ideas, methods, instructions or products referred to in the content.