Article

Chemical and Sensory Evaluation of Commercial Oat Beverages with Emphasis on Their Lipid Fraction


1
Department of Chemistry, Institute of Food Sciences, Warsaw University of Life Sciences-SGGW, 159C Nowoursynowska Str., 02-776 Warsaw, Poland
2
Faculty of Food Technology, Warsaw University of Life Sciences-SGGW, 159C Nowoursynowska Str., 02-776 Warsaw, Poland
3
Department of Fundamental Engineering and Energetics, Institute of Mechanical Engineering, Warsaw University of Life Sciences-SGGW, 02-787 Warsaw, Poland
*
Author to whom correspondence should be addressed.
Appl. Sci. 2026, 16(11), 5376; https://doi.org/10.3390/app16115376
Submission received: 20 April 2026 / Revised: 22 May 2026 / Accepted: 25 May 2026 / Published: 27 May 2026
(This article belongs to the Special Issue Advancements in Food Nutrition and Bioactive Compounds)

Featured Application

The results can support the formulation and optimization of commercial oat beverages by helping manufacturers select lipid ingredients that enhance oxidative stability while preserving a favorable fatty acid profile and acceptable sensory quality.

Abstract

Oat beverages are widely consumed as dairy alternatives; however, there is still limited understanding of how the source and structural organization of added lipids influence their physicochemical functionality and sensory perception. This study aimed to evaluate whether the type of lipid source used in commercial oat-based products can explain variability in lipid quality and consumer acceptability. Lipid fractions were extracted from 10 commercial oat-based products available on the Polish market, including 5 ready-to-drink beverages and 5 powdered products reconstituted with water. The extracted lipids were analyzed for fatty acid (FA) composition, positional distribution of FAs in triacylglycerols, melting behavior, and oxidative stability, complemented by sensory evaluation. Marked differences were observed among samples, primarily driven by the lipid source rather than product form. Products containing sunflower oil exhibited a favorable FA profile characterized by a high proportion of unsaturated FAs and relatively good oxidative stability. In contrast, oat-only formulations showed lower oxidative stability and reduced sensory performance, particularly in terms of taste and texture. The sample containing coconut fat demonstrated the highest oxidative stability (τmax = 333.48 min) but the least favorable nutritional profile due to a predominance of saturated FAs (85.43% SFA). The highest overall sensory acceptance was recorded for sample L1 (overall desirability = 7.00). Overall, the findings demonstrate that lipid source is a key determinant of the nutritional, physicochemical, and sensory properties of oat beverages, while product format (liquid vs. powder) plays a secondary role. These results address the knowledge gap regarding the relationship between lipid origin and functional performance in plant-based beverages and highlight formulation strategy as a critical factor in product optimization.

1. Introduction

Plant-based milk alternatives have gained significant attention in recent years due to a combination of health-, consumer-, and sustainability-related factors. Lactose intolerance affects more than 65% of the global population, with a prevalence of approximately 28% in Europe [1]. At the same time, changes in dietary habits, including the growing interest in plant-forward and flexitarian eating patterns, have strengthened consumer demand for non-dairy beverage options. As a result, plant-based beverages have become one of the most dynamic segments of the alternative food market, with an estimated global value of approximately twenty-one billion U.S. dollars [2].
Plant-based milk alternatives are typically complex oil-in-water colloidal systems designed to mimic the physicochemical and sensory properties of cow’s milk [3,4,5,6,7,8]. Their quality and consumer acceptance depend not only on nutritional value, but also on physicochemical stability and sensory characteristics such as appearance, texture, flavor, and mouthfeel [6,9,10]. Previous studies have demonstrated that these properties are strongly influenced by both the botanical source and formulation strategy, including the type of lipids, proteins, emulsifiers, stabilizers, and fortifying ingredients used in the product matrix [9,11]. The characteristics of plant-based beverages are strongly dependent on the botanical raw material, which influences their composition, stability, and sensory properties.
Oat-based beverages occupy a particularly strong position within this product category. This is partly related to the intrinsic properties of oats, which can contribute soluble dietary fiber, a mild cereal-like flavor, and a smooth texture that is often perceived as desirable in milk-alternative products [12,13]. In addition, oat grain is valued for its nutritional composition and for the presence of bioactive constituents, which further supports its use as a raw material for beverage formulation [12,14]. In addition, oat-based beverages are widely used both as direct milk alternatives and as coffee additives, where mouthfeel, foam stability, and flavor are especially important [6]. Despite these advantages, the final quality of commercial oat beverages depends not only on the oats themselves but also on the type of added fat and other formulation components [9,15].
Even when present in relatively small amounts, the lipid phase may have a considerable impact on the quality of oat-based beverages. The type of fat incorporated into the formulation determines not only the proportion of saturated and unsaturated fatty acids, but also the thermal behavior, oxidative response, and sensory properties of the final product [4,10]. In commercial formulations, added oils and fats are often used to improve mouthfeel, creaminess, and technological stability [9,16]. However, lipid sources commonly used for this purpose may differ substantially in their functional and nutritional consequences. For example, sunflower oil usually increases the contribution of unsaturated fatty acids, whereas coconut fat may enhance resistance to oxidation but at the same time increases the saturated fatty acid fraction [8,17,18]. For this reason, the analysis of lipids isolated from commercial oat-based products can provide useful information beyond that available from label declarations alone. Therefore, detailed characterization of the extracted lipid fraction may provide important information on both the nutritional and physicochemical quality of commercial oat beverages. Another important challenge for plant-based beverages is sensory acceptance. Consumer studies indicate that taste, texture, and appearance are key drivers of market success, while off-flavors, instability, or inadequate mouthfeel may limit repeat purchases [9,10,19].
Despite the increasing number of studies on oat beverages as dairy substitutes, the lipid fraction of products currently available to consumers remains insufficiently characterized. In particular, limited information is available on how different declared lipid sources are reflected in the composition and physicochemical behavior of the extracted fat fraction, especially when ready-to-drink and powdered oat-based products are evaluated within the same study. Therefore, the present work investigated lipid fractions obtained from commercial oat-based formulations differing in product form and fat source. The analysis focused on fatty acid composition, the positional distribution of fatty acids in triacylglycerols, melting properties, oxidative stability, and sensory quality.

2. Materials and Methods

2.1. Materials

Ten oat-based products commercially distributed in Poland were investigated, of which five were marketed as ready-to-consume drinks, whereas the remaining five were available in powdered form for subsequent rehydration with water. To ensure neutral presentation of the results, all samples were anonymized and coded before analysis. Ready-to-drink products were coded as L1–L5, whereas powdered products were coded as P1–P5.
The investigated products differed in formulation and included both oat-only variants and products supplemented with sunflower oil or coconut fat. Differences were also observed in the declared oat content as well as in the presence of added vitamins, minerals, stabilizers, and emulsifiers. The principal characteristics of the analyzed samples are presented in Table 1, while detailed ingredient lists and nutritional information provided by the manufacturers are included in the Supplementary Materials (Tables S1 and S2).
All products were commercially available and were analyzed within their shelf-life period. Samples were stored in their original, tightly closed packages under light-protected conditions until analysis. Powdered products were reconstituted with water according to the manufacturers’ instructions.

2.2. Lipid Extraction

Lipid fractions were extracted from the analyzed oat-based samples using a modified Folch procedure with chloroform/methanol extraction [20]. Lipid extraction was performed both for commercially available liquid oat beverages and for powdered products after reconstitution according to the manufacturers’ instructions, to ensure comparability between sample types.
Approximately 70 g of each sample were transferred into 500 mL Schott bottles and mixed with 100 mL of a chloroform/methanol solution (2:1, v/v). The extraction mixtures were homogenized by shaking for 3 min and subsequently incubated at 60 °C for 20 min using a laboratory dryer. To release internal pressure, the bottles were briefly opened midway through the incubation period. After cooling to room temperature, an additional 100 mL of chloroform was introduced, followed by further shaking for 3 min. The obtained mixtures were filtered into clean Schott bottles through filter paper.
Subsequently, 70 mL of 1 mol/L aqueous KCl solution was added to each filtrate. Phase separation was facilitated by overnight storage under refrigerated conditions. The following day, the lower chloroform fraction was collected using separatory funnels and transferred to clean vessels. The organic phase was dried with anhydrous MgSO4 and maintained under dark conditions for 2 h with intermittent mixing. The extracts were then filtered again and concentrated under reduced pressure using a rotary evaporator (Büchi Rotavapor R-300, Büchi AG, Flawil, Switzerland) to obtain crude lipid fractions. Extraction yield (%) was calculated according to Equation (1):
Extraction   yield   %   =   m oil m sample   ×   100
where moil represents the mass of the extracted oil (g) and msample corresponds to the mass of the material subjected to extraction (g).
In addition to extraction yield, relative extraction efficiency was determined as the ratio between experimentally obtained lipid content and the fat content declared by the manufacturer for the corresponding product, expressed as a percentage according to Equation (2):
Relative   extraction   efficiency   %   =   extracted   fat   content manufacturer - declared   fat   content   ×   100

2.3. Fatty Acid Methyl Ester Analysis by Gas Chromatography

The fatty acid composition of the extracted lipid fractions was determined by GC-FID analysis of fatty acid methyl esters (FAMEs) following conversion of fatty acids into their corresponding methyl esters. Methylation was conducted in accordance with ISO 12966-2:2017 [21]. For derivatization, a drop of lipid extract was dissolved in 2 mL of hexane and mixed with 2 mL of 1 mol/L methanolic KOH. The reaction mixtures were vortexed and maintained at 40 °C for 20 min. After phase separation, the upper hexane fraction containing FAMEs was collected and dried over anhydrous MgSO4 prior to chromatographic analysis. Chromatographic measurements were carried out using a YL6100 GC system (Young Lin Bldg., Anyang, Republic of Korea) equipped with a flame ionization detector (FID) and a BPX70 capillary column (60 m × 0.25 mm i.d., 0.25 μm film thickness). Nitrogen (N5.0, 99.999% purity) was used as the carrier gas. The oven temperature program started at 70 °C, followed by a gradual increase to 160 °C at 15 °C/min. Subsequently, the temperature was raised to 200 °C at 1.1 °C/min and maintained for 12 min, before reaching a final temperature of 225 °C at 30 °C/min. Injector and detector temperatures were set at 225 °C and 250 °C, respectively. Individual fatty acids were identified by comparing their retention times with those of a certified FAME reference standard mixture. Relative quantification was performed using peak area normalization, and the results were expressed as the percentage contribution of each fatty acid to the total identified fatty acids. Since fatty acid composition was reported on a relative basis (% of total fatty acids), no internal standard was required. All analyses were conducted in duplicate.
Additionally, fatty acid composition data were used to calculate selected lipid nutritional quality indices, including the atherogenic index (AI), thrombogenic index (TI), and the hypocholesterolemic/hypercholesterolemic ratio (h/H), according to Equations (3)–(5) [22].
AI = C 12 : 0 + 4   ×   C 14 : 0 + C 16 : 0 MUFA + n     6   PUFA + n     3   PUFA
TI = C 14 : 0 + C 16 : 0 + C 18 : 0 0.5   ×   MUFA + 0.5   ×   n 6   PUFA + 3   ×   n     3   PUFA + n     3   PUFA n     6   P UFA
h / H = C 18 : 1 + PUFA C 12 : 0 + C 14 : 0 + C 16 : 0
where MUFA is monounsaturated fatty acid and PUFA is polyunsaturated fatty acid.

2.4. Positional Distribution of Fatty Acids in Triacylglycerols

The positional distribution of fatty acids within triacylglycerols (TAGs) was evaluated using pancreatic lipase hydrolysis according to the procedure described by Bryś et al. [23]. Briefly, 100 mg of each extracted lipid sample was weighed into test tubes. Then, 1 mL of 1 mol/L aqueous tris(hydroxymethyl)aminomethane (TRIS) buffer (pH 8.0), 0.1 mL of 2.2% (m/v) CaCl2 solution, and 0.25 mL of 0.05% (m/v) aqueous bile salt solution were added. After 10 min of thermostatic equilibration, 20 mg of pancreatic lipase was added to initiate hydrolysis. The reaction was subsequently terminated using 4 mL of diethyl ether and 1 mL of 6 mol/L HCl. Following centrifugation for 5 min, the upper organic phase was collected into clean tubes and evaporated under a nitrogen stream. The obtained lipid fraction was then separated by preparative thin-layer chromatography (TLC) performed on silica gel plates.
The TLC plates were developed using a solvent system consisting of diethyl ether, hexane, and acetic acid in a ratio of 50:50:1 (v/v/v). The separated fractions of mono- and diacylglycerols, free fatty acids, and unreacted triacylglycerols were identified in an iodine chamber. The sn-2 monoacylglycerol fraction was scraped with the silica gel and eluted with diethyl ether. The fatty acid composition of the isolated sn-2 monoacylglycerols was analyzed as FAMEs by GC-FID using the methodology described in Section 2.3. Fatty acids were identified by retention time comparison with reference standards and quantified by peak area normalization. Analyses were performed in duplicate, and the results are presented as mean values.
The fatty acid composition at the sn-1,3 positions was calculated from the fatty acid composition of the initial TAG fraction and the isolated sn-2 monoacylglycerols according to the following Equation (6):
S s n 1,3   ( % ) = 3 × F A i n   T A G s ( F A i n   s n 2   M A G ) 2
where Ssn-1,3 is the percentage content of a given fatty acid at the external positions (sn-1,3) of the TAG molecule, FAin TAGs is the percentage content of that fatty acid in the initial triacylglycerol fraction, and FAin sn-2 MAG is the percentage content of that fatty acid in the isolated sn-2 monoacylglycerol fraction.
The percentage share of individual fatty acids at the sn-2 position relative to their total content in TAG was calculated using Equation (7):
S s n 2   ( % ) =   F A i n   s n 2   M A G 3 × ( F A i n   T A G s ) × 100
where Ssn-2 is the percentage share of a given fatty acid at the sn-2 position relative to its total content in TAG.

2.5. Oxidative Stability Determined by Pressure Differential Scanning Calorimetry (PDSC)

Oxidative stability of the extracted lipid fractions was evaluated using pressure differential scanning calorimetry (PDSC) with a DSC Q20P calorimeter (TA Instruments, New Castle, DE, USA). Approximately 3–4 mg of each lipid extract was placed in aluminum pans, while an empty pan served as the reference. The measurements were performed under isothermal conditions at 120 °C in an oxygen atmosphere under a pressure of 1350–1400 kPa. Based on the obtained thermograms, the time corresponding to the maximum oxidation rate (τmax) was calculated and used as a parameter reflecting oxidative stability.

2.6. Melting Characteristics Determined by Differential Scanning Calorimetry (DSC)

The thermal melting behavior of the extracted lipid fractions was analyzed using differential scanning calorimetry (DSC) with a DSC Q200 calorimeter (TA Instruments, New Castle, DE, USA). For each determination, approximately 3–4 mg of lipid sample was sealed in aluminum pans, whereas an empty pan was used as the reference. Measurements were conducted under atmospheric pressure using nitrogen as the purge gas at a flow rate of 50 mL/min.
Prior to analysis, samples were heated to 80 °C and maintained at this temperature for 10 min to remove crystal memory effects. Subsequently, the samples were cooled to −80 °C at a rate of 10 °C/min and equilibrated for 30 min. Melting profiles were recorded during the second heating cycle performed from −80 to 80 °C at a scanning rate of 15 °C/min. Characteristic phase transition temperatures were identified from the obtained thermograms and used to evaluate the melting properties of the analyzed lipid fractions.

2.7. Sensory Evaluation

Sensory evaluation was conducted using a 9-point hedonic scale. The attributes assessed included odor, appearance, color, texture, taste, and overall desirability. Each attribute was scored from 1 to 9, with 1 indicating the lowest desirability and 9 the highest. Before evaluation, powdered products were reconstituted according to the manufacturers’ instructions (20 g of powder per 100 mL of warm water). All samples were then transferred to transparent containers, randomly coded, and served to assessors immediately after preparation and equilibration to room temperature. The consumer panel consisted of 24 volunteers from the Warsaw University of Life Sciences (Poland), including students and university staff. The group comprised 15 females and 9 males, with a mean age of 34.8 ± 7.8 years (range: 25–50 years). The assessors were untrained consumers and participated voluntarily. Each participant received 10 coded oat beverage samples, water for palate cleansing, and anonymous evaluation forms. A separate evaluation sheet was used for each of the 10 samples. Sensory scores were collected and expressed as mean values for each sample and attribute. After consultation with the WULS Research Ethics Committee, the requirement for ethical approval was waived due to the anonymous nature of the study. The study was conducted in accordance with national regulations, GDPR requirements (EU 2016/679) [24], and the ethical principles of the Declaration of Helsinki. All data were collected anonymously, and informed consent was obtained from all participants involved in the study.

2.8. Statistical Analysis

Unless otherwise stated, data are presented as mean ± standard deviation of three independent replicates. All results were summarized using Microsoft Excel for Microsoft 365 (Microsoft Corp., Redmond, WA, USA). Statistical analyses were performed using Statistica 13.3. (TIBCO Software Inc., Palo Alto, CA, USA). Statistical differences between samples were verified using one-way analysis of variance (ANOVA) followed by Tukey’s post hoc test, with significance established at p < 0.05. Relationships between lipid-related parameters and sensory characteristics were examined using Spearman’s rank correlation analysis. In addition, exploratory correlation analysis based on Spearman coefficients was applied to investigate associations among selected variables. Hierarchical cluster analysis (HCA) was further employed to identify similarities between the analyzed samples according to the measured parameters.

3. Results and Discussion

3.1. Lipid Fraction Extraction Yield and Relative Efficiency

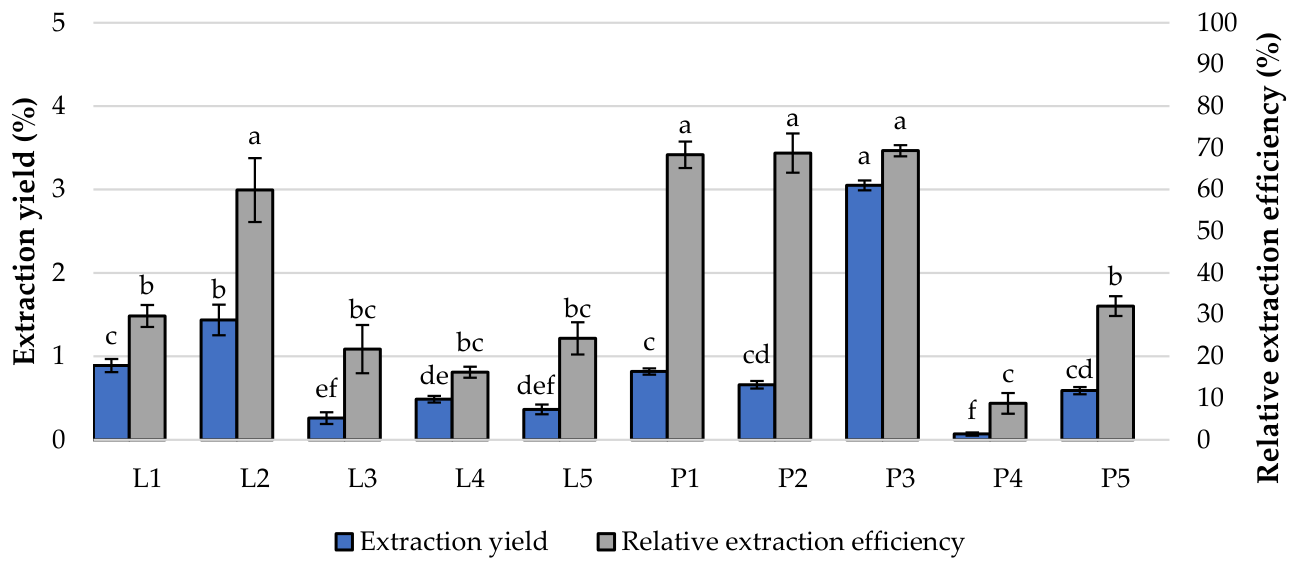
The extraction yield and relative extraction efficiency of the lipid fraction differed significantly among the analyzed oat-based products (Figure 1). The highest extraction yield was observed for sample P3 (3.05%), followed by L2 (1.44%), L1 (0.89%), P1 (0.82%), and P2 (0.66%). In contrast, markedly lower yields were obtained for L4 (0.49%), L5 (0.37%), L3 (0.26%), and especially P4 (0.07%).
Differences in extraction yield may result not only from variations in total fat content and lipid source, but also from differences in matrix composition among the analyzed products. Samples containing added fats, particularly coconut or sunflower oil, may be associated with higher lipid recoverability, whereas the presence of proteins, dietary fiber, stabilizers, and hydrocolloids in more complex formulations can contribute to reduced solvent accessibility to the lipid fraction by increasing viscosity and promoting the formation of three-dimensional networks that stabilize or entrap lipid droplets within the matrix, consequently lowering extraction yield [6,25].
The relative extraction efficiency, expressed as the percentage of extracted lipid relative to the manufacturer-declared fat content, also varied significantly among the analyzed products. The highest values were observed for P2 (68.75%), P3 (69.32%), and P1 (68.33%), indicating efficient recovery of the lipid fraction in these samples. Among the liquid beverages, L2 exhibited the highest relative extraction efficiency (59.88%), whereas the remaining samples showed substantially lower values, ranging from 16.23% for L4 to 29.70% for L1. The lowest efficiency was recorded for P4 (8.75%), suggesting limited recovery of lipids relative to the declared fat content.
Overall, the powdered products, particularly P1–P3, exhibited higher relative extraction efficiency than most ready-to-drink beverages. This observation may indicate that lipids present in powdered matrices after reconstitution may exist in a different physical state and spatial distribution compared with emulsified ready-to-drink systems, which can result in altered accessibility during solvent extraction [11]. In contrast, liquid oat beverages represent more complex colloidal systems in which lipid droplets are finely dispersed and physically stabilized within the aqueous phase, potentially limiting solvent contact with part of the lipid fraction [6]. Moreover, industrial homogenization and emulsion stabilization applied during beverage production may contribute to the formation of more stable lipid–matrix interactions, thereby reducing extractability [25]. The particularly high efficiency observed for P3 suggests that both formulation design and the physical state of the added lipid fraction may strongly influence lipid recovery, whereas the low values obtained for P4 and several liquid samples may reflect reduced lipid accessibility within the product microstructure.
It should also be noted that the relative extraction efficiency was calculated based on the fat contents declared by the manufacturer and therefore should be interpreted with caution. Label values may be influenced by rounding practices and are not always directly comparable between liquid and powdered products, particularly when different declaration bases or regulatory conventions are applied. Nevertheless, this parameter provides useful comparative insight into the relationship between analytically recovered lipids and the declared fat content of commercial products.
In addition, discrepancies between declared and experimentally recovered lipid fractions may reflect inherent limitations of using label information as a reference point for complex food matrices rather than true analytical yield. Consequently, the observed variability should be considered in a broader methodological context, where both formulation heterogeneity and reporting conventions may contribute to apparent differences in efficiency [26,27].
Moreover, the differences in extraction yield observed in the present study may be explained not only by the declared fat content of the analyzed products but also by the physicochemical organization of lipids within the product matrix. Plant-based beverages are complex colloidal systems in which oil droplets interact with proteins, polysaccharides, fiber, emulsifiers, and stabilizing agents, and these interactions may affect lipid accessibility during solvent extraction [6,16,28]. In such systems, part of the lipid fraction may be less accessible to the solvent, particularly in products with more structured or highly stabilized formulations. In oat-based materials, the recovery and composition of the extracted lipid fraction also depend on the extraction approach applied [29,30]. Moreover, recent studies on plant-based milk alternatives have shown that proteins and fiber can influence emulsion structure and lipid encapsulation, which may further explain the reduced extractability of lipids from more complex formulations [25].

3.2. Fatty Acid Composition and Positional Distribution in Triacylglycerols

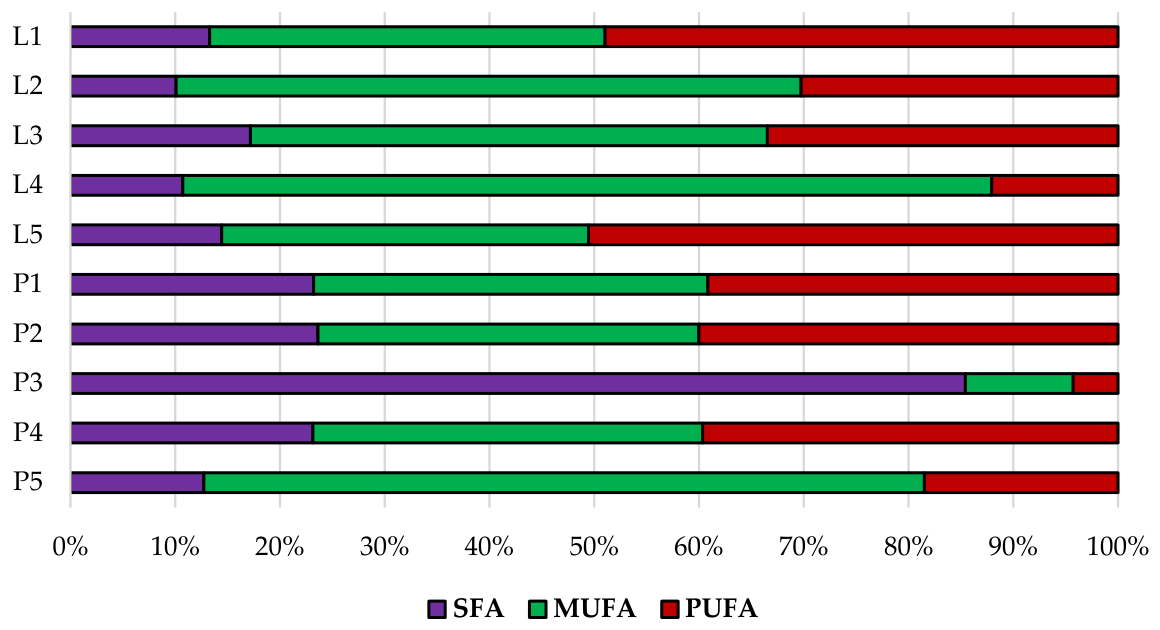
The analyzed lipid fractions differed markedly in their distributions of saturated fatty acids (SFA), monounsaturated fatty acids (MUFA), and polyunsaturated fatty acids (PUFA) (Figure 2). Among liquid samples, L1 and L5 had the highest PUFA levels (48.96% and 50.55%, respectively), whereas L2 and especially L4 were dominated by MUFA (59.66% and 77.22%, respectively). L3 showed an intermediate profile, with MUFA as the dominant fraction (49.35%). Among powdered products, P1, P2, and P4 had similar fatty acid group distributions, with approximately 23% SFA, 36–38% MUFA, and 39–40% PUFA. In contrast, P3 was distinguished by very high SFA content (85.43%) and very low proportions of MUFA and PUFA, indicating a substantially different lipid composition. P5 was characterized by a high MUFA level (68.78%) and a lower PUFA content (18.49%). Therefore, these results confirm that the fatty acid group composition of the analyzed products depended strongly on the lipid source used in their formulation. Importantly, the observed variability may substantially influence both the nutritional quality and oxidative stability of the products, since PUFA-rich formulations are generally considered more nutritionally desirable [31,32,33], whereas MUFA-rich systems may exhibit greater oxidative resistance during storage [34,35].
Beyond the overall distribution of SFA, MUFA, and PUFA, the detailed fatty acid composition of the extracted lipid fractions is shown in Table 2. The analyzed samples exhibited marked differences in fatty acid profiles, primarily related to product formulation and the lipid source used. In the liquid samples (L1–L5), oleic acid (C18:1) and linoleic acid (C18:2 n − 6) were the predominant fatty acids. Linoleic acid was the major component in L1 and L5, accounting for 46.94% and 49.34% of total fatty acids, respectively, whereas oleic acid predominated in L2, L3, and especially L4, reaching 58.14%, 48.25%, and 76.65%, respectively. Palmitic acid (C16:0) was the main saturated fatty acid across all liquid samples, ranging from 6.23% in L4 to 14.02% in L3.
Among the powdered products (P1–P5), P1, P2, and P4 showed similar fatty acid profiles, with moderate palmitic acid (19.25–19.70%), high oleic acid (34.89–36.30%), and high linoleic acid (37.91–38.62%). These samples also contained small amounts of α-linolenic acid (C18:3 n-3, 1.26–1.40%). In contrast, P3 displayed a markedly different fatty acid pattern, with very high saturated fatty acid levels, particularly lauric acid (C12:0, 37.20%), myristic acid (C14:0, 17.65%), and palmitic acid (13.74%), along with much lower proportions of oleic acid (10.21%) and linoleic acid (4.21%). This composition clearly indicates coconut fat as the dominant lipid source in this sample, which explains the markedly different nutritional indices observed for P3 compared with the remaining oat-based products. Sample P5 was distinguished by a high oleic acid content (68.23%) and a lower level of linoleic acid (17.47%), suggesting a lipid source rich in monounsaturated fatty acids.
The nutritional indices derived from the fatty acid profiles also varied substantially across samples. The lowest AI values were observed for L4 (0.07) and L2 (0.08), while the highest was recorded for P3 (8.36). A similar pattern was observed for TI, with the lowest value in L2 (0.16), followed by L4 (0.22), and the highest again in P3 (5.19). The h/H ratio, considered an indicator of the nutritional quality of the lipid fraction, was highest in L4 (14.25) and L2 (11.74), whereas P3 showed by far the lowest value (0.21). These results indicate that L2 and L4 had the most favorable lipid quality indices among the analyzed samples, while P3 exhibited the least favorable profile due to the predominance of saturated fatty acids. From a nutritional perspective, lower AI and TI values together with higher h/H ratios are generally associated with a more beneficial effect on cardiovascular health [36,37], highlighting substantial differences in the nutritional value of the analyzed formulations despite their similar market positioning as oat-based products.
Furthermore, the n6/n3 ratio also showed pronounced variability. The lowest value was recorded for L2 (3.88), indicating the most balanced proportion of omega-6 to omega-3 fatty acids among all samples. In contrast, markedly higher values were found for L5 (86.18) and P3 (56.16), reflecting a much less favorable balance. The remaining samples showed intermediate values, generally within the range of approximately 15.5 to 34.8. Such high n-6/n-3 ratios, particularly in L5 and P3, may be considered nutritionally less desirable, as excessive dietary omega-6 relative to omega-3 fatty acids has been associated with pro-inflammatory dietary patterns [38].
The fatty acid profiles obtained in the present study were largely consistent with recent reports on oat oils and oat-based products, in which unsaturated fatty acids predominate and oleic and linoleic acids are the major fatty acids, whereas α-linolenic acid occurs at lower levels [39,40,41,42]. In the study by Palani et al. [39], oat oil had an unsaturated-to-saturated fatty acid ratio of approximately 80:20, with oleic acid accounting for 37.83–40.84% and linoleic acid for 36.93–39.18% of total fatty acids [39]. Similarly, studies on European and Canadian oat genotypes and on oat cultivars grown in China identified oleic and linoleic acids as the dominant fatty acids in oat lipids, with palmitic acid as the principal saturated fatty acid [40,41]. In addition, Puganen et al. [42] reported that palmitic, oleic, and linoleic acids were the most abundant fatty acids in oat flour lipids, further supporting the typical oat-like character of the lipid fractions observed in most samples [42].
Therefore, the profiles observed for most samples, particularly L1, L2, L3, L5, P1, P2, and P4, are broadly consistent with the expected composition of oat-containing lipid fractions, suggesting that oat-derived lipids remained the dominant determinant of fatty acid composition in these products. In contrast, the markedly different profile of P3, characterized by a pronounced predominance of SFA, can be directly linked to the presence of coconut fat in its formulation. This finding demonstrates how the incorporation of alternative lipid sources may substantially alter the nutritional characteristics of commercially available oat-based formulations. This interpretation is also consistent with research on coconut-based milk alternatives, in which triacylglycerols rich in medium-chain saturated fatty acids, especially lauric- and myristic-acid-containing species, were identified as characteristic of coconut lipid fractions [43].
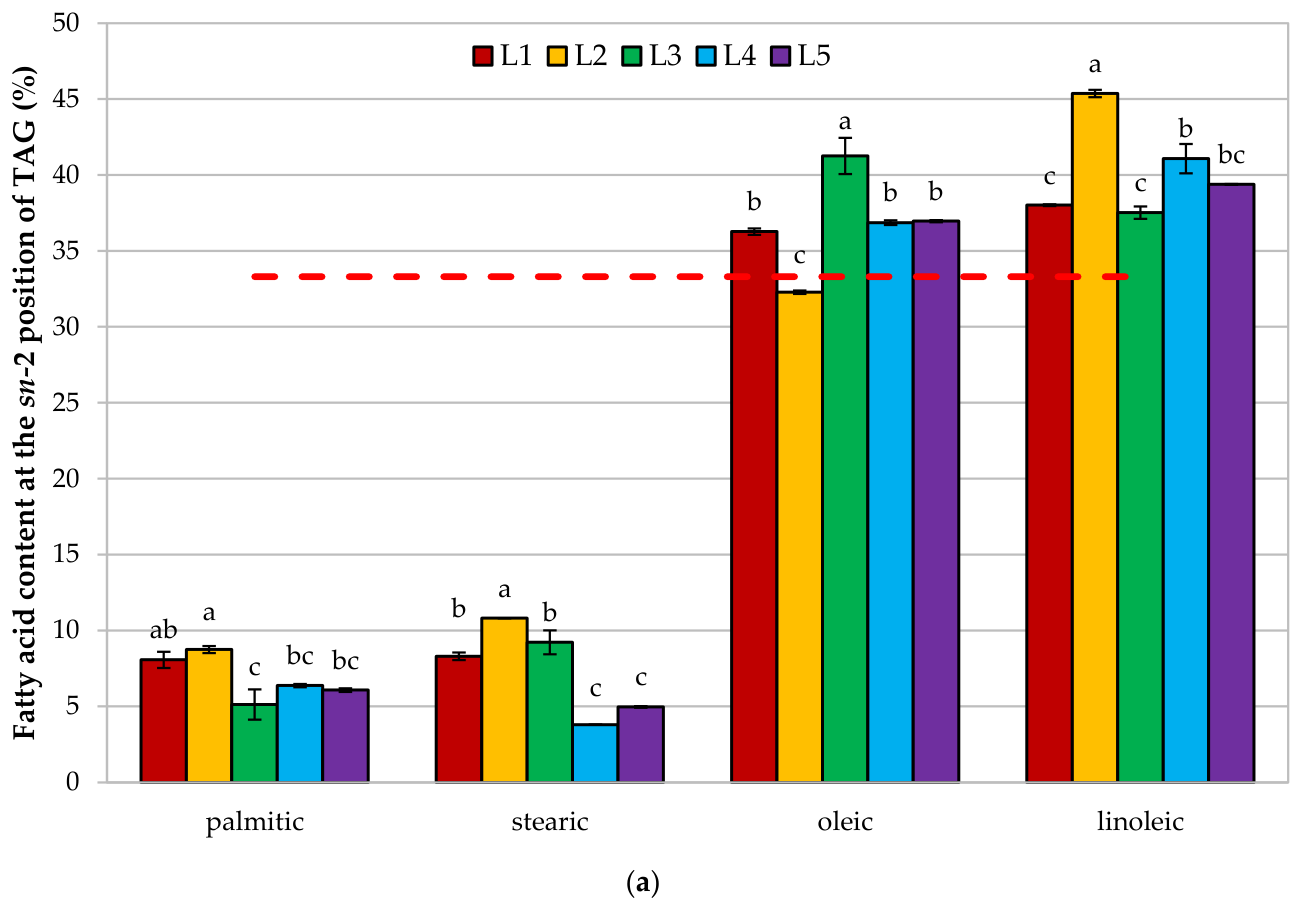
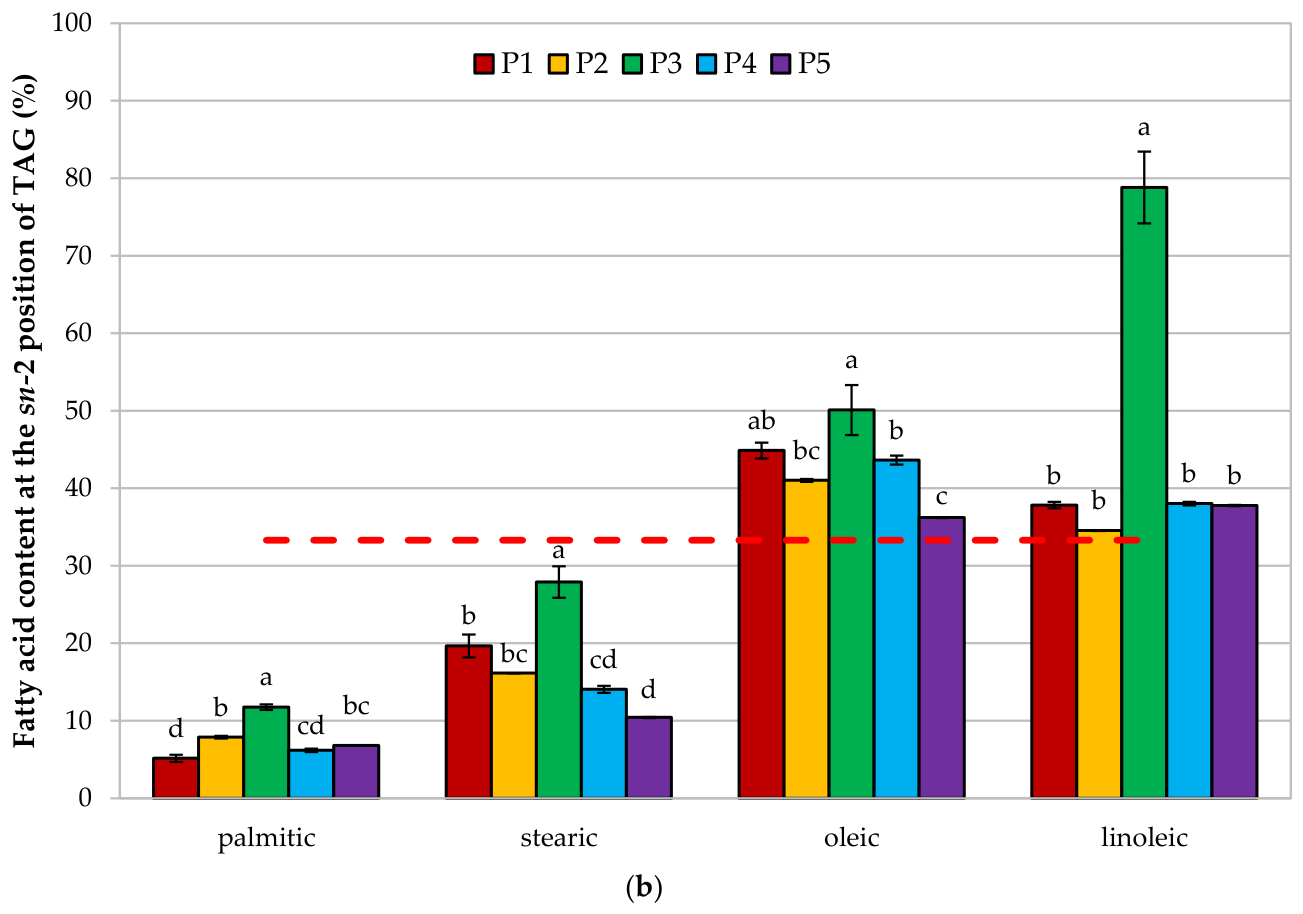
The distribution of selected fatty acids at the sn-2 position of triacylglycerols varied among the analyzed samples (Figure 3), yet a clear general pattern emerged. In all samples, palmitic and stearic acids were present at the sn-2 position at levels markedly below the theoretical even distribution of 33.3%, indicating preferential location in the external sn-1,3 positions. Palmitic acid showed the lowest sn-2 shares overall, ranging from 5.13% in L3 to 11.76% in P3. Stearic acid was also depleted in the sn-2 position, with values from 3.79% in L4 to 27.90% in P3.
In contrast, unsaturated fatty acids were generally enriched at the sn-2 position. Oleic acid accounted for 32.28–50.10% at sn-2, with the highest value observed for P3, followed by P1 (44.87%), P4 (43.63%), L3 (41.25%), and P2 (41.02%). In most samples, oleic acid exceeded the theoretical value of 33.3%, indicating preferential incorporation into the internal position of TAG molecules; the only exception was L2, in which its share at sn-2 was slightly lower (32.28%).
Linoleic acid also showed clear enrichment at the sn-2 position in all analyzed samples. Its proportion ranged from 34.54% in P2 to as much as 78.81% in P3. Among the ready-to-drink products, the highest sn-2 share of linoleic acid was found in L2 (45.37%), followed by L4 (41.08%), L5 (39.38%), L1 (38.01%), and L3 (37.52%). In the powdered samples, P3 was clearly distinct from the remaining products due to the exceptionally high proportion of linoleic acid at the sn-2 position.
Overall, the results indicate that unsaturated fatty acids, particularly oleic and linoleic acids, were preferentially located at the sn-2 position of TAG, whereas saturated fatty acids were predominantly esterified at the external sn-1,3 positions. This distribution is consistent with the typical positional structure of many plant-derived lipids and may affect both the nutritional and physicochemical properties of the analyzed lipid fractions. This may also be nutritionally relevant, since fatty acids esterified at the sn-2 position are preferentially absorbed as 2-monoacylglycerols during digestion and may therefore exert different metabolic effects compared with fatty acids located at the sn-1,3 positions [44,45].
The positional distribution of fatty acids in TAGs observed in the present study followed the general pattern reported for many plant-derived lipids, in which unsaturated fatty acids are preferentially esterified at the internal sn-2 position, whereas saturated fatty acids are mainly located at the external sn-1,3 positions. This pattern was reflected in the enrichment of oleic and linoleic acids at sn-2 and in the low proportions of palmitic and stearic acids at this position. Similar observations have been reported for other plant oils. Guan et al. [46] showed that, in high-oleic rapeseed oil, oleic acid exhibited a clear preference for the sn-2 position over sn-1,3. Likewise, Dulf et al. [47] demonstrated that in Sambucus seed oils, unsaturated fatty acids were preferentially located at sn-2, while saturated fatty acids were concentrated mainly at sn-1 and sn-3.
Overall, the present results demonstrate that commercially available oat-based products may differ substantially in lipid quality despite belonging to the same product category. The findings indicate that the nutritional characteristics of these products are strongly influenced not only by the oat matrix itself but also by the type of added lipid fraction used during formulation. In particular, the replacement of oat-derived or unsaturated plant oils with coconut-based fats may considerably worsen lipid quality indices and modify TAG structure. These observations may be relevant for both product formulation strategies and consumer-oriented nutritional evaluation of oat-based alternatives.

3.3. DSC Melting Profiles and PDSC Oxidative Stability

Two endothermic transitions were observed in the DSC melting thermograms of the extracted lipid fractions, and the temperatures corresponding to the maxima of these transitions are presented as Tp1 and Tp2 (Table 3). The first melting peak (Tp1) occurred within a relatively narrow temperature range, from −75.50 °C in L4 to −68.31 °C in P2. Most samples showed similar Tp1 values, and only limited statistical differentiation was observed, indicating that the first transition was relatively consistent across the analyzed lipid fractions. This suggests that the low-melting lipid fraction was relatively similar among products despite differences in overall fatty acid composition.
In contrast, the second melting peak (Tp2) showed much greater variation and clearly differentiated the samples. The lowest Tp2 values were observed for L1 (−28.91 °C) and L5 (−28.46 °C), whereas L2, L3, P1, P2, and P4 formed a homogeneous group with Tp2 values between approximately −20 and −18 °C. Intermediate Tp2 values were recorded for L4 (−7.57 °C) and P5 (−10.20 °C). A clearly distinct result was obtained for P3, in which the second melting peak appeared at a positive temperature (20.62 °C), significantly higher than in all other samples.
These results indicate that the second melting transition was much more sensitive to differences in lipid composition than Tp1. The markedly higher Tp2 value of P3 suggests the presence of a lipid fraction enriched in higher-melting components, consistent with its fatty acid profile, which is characterized by a predominance of saturated fatty acids. In contrast, the more negative Tp2 values observed for the remaining samples indicate a greater proportion of lower-melting unsaturated lipids. The DSC results confirm substantial differences in the thermal behavior of the extracted lipid fractions and show that melting characteristics were strongly influenced by the lipid source used in the analyzed products. This observation is particularly important from a technological perspective, since melting behavior may affect the sensory properties, mouthfeel, and physical stability of plant-based products during storage and consumption [48,49].
This interpretation aligns with previous studies showing that DSC thermal profiles of edible oils are strongly influenced by FA and TAG composition, and that melting peak temperatures are closely related to the relative proportions of saturated and unsaturated fatty acids. In particular, Wirkowska-Wojdyła et al. [50] found that in amaranth and quinoa oils, low-melting fractions were mainly associated with unsaturated fatty acids, whereas higher-melting fractions reflected a greater contribution from more saturated lipid components. The present results therefore confirm that DSC analysis can effectively differentiate lipid fractions originating from distinct raw materials and formulations used in commercial oat-based products.
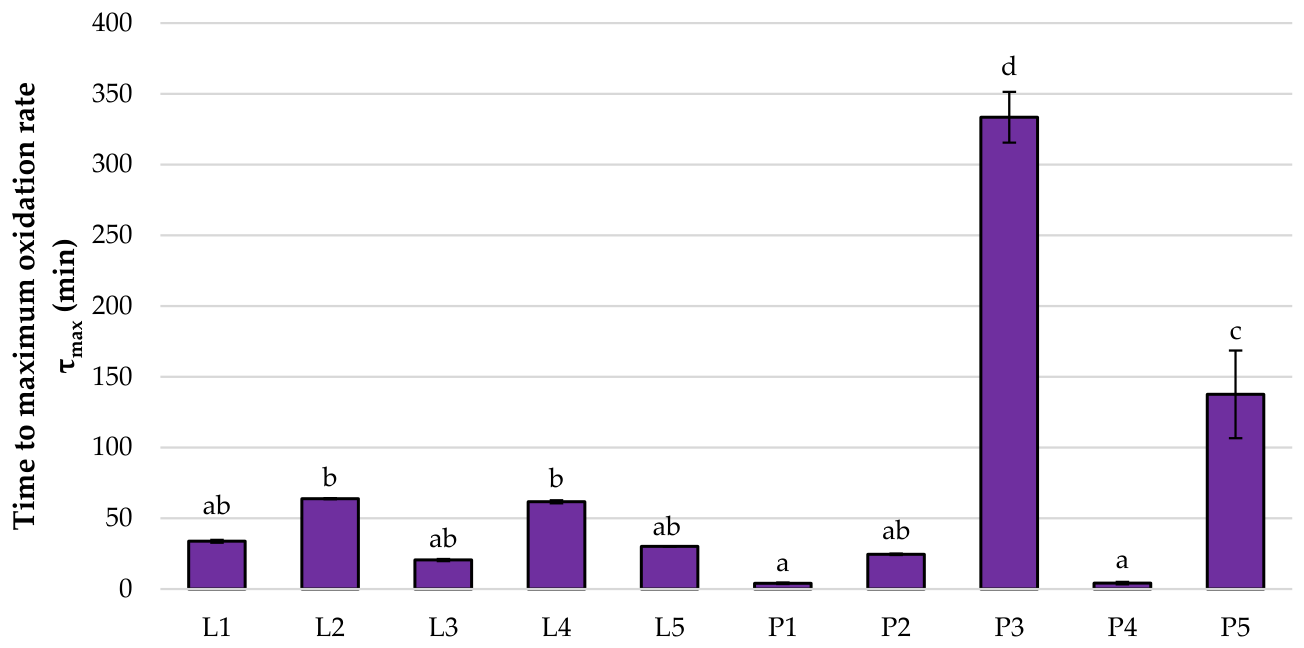
The oxidative stability of the extracted lipid fractions, expressed as the time to maximum oxidation rate (τmax), differed significantly among samples (Figure 4). The highest τmax was recorded for P3 (333.48 min), indicating by far the greatest oxidative stability among all analyzed samples. The second-highest value was observed for P5 (137.59 min), while intermediate stability was observed for L2 (63.87 min) and L4 (61.68 min). Lower τmax values were noted for L1 (33.75 min), L5 (30.16 min), P2 (24.57 min), and L3 (20.52 min). The lowest oxidative stability was observed for P1 (4.06 min) and P4 (4.17 min).
The observed differences in τmax were closely related to the fatty acid composition of the lipid fractions. Sample P3, which showed the highest oxidative stability, was also characterized by a very high proportion of saturated fatty acids and a very low proportion of polyunsaturated fatty acids, which explains its strong resistance to oxidation. In contrast, samples with lower oxidative stability generally contained higher levels of unsaturated fatty acids, particularly PUFA, which are more susceptible to oxidative degradation. The relatively high τmax values of L2, L4, and P5 may be associated with their high MUFA content and lower PUFA proportions compared with the less stable samples. These findings highlight the well-established trade-off between nutritional quality and oxidative stability, as lipid fractions richer in PUFA are generally considered nutritionally advantageous but are simultaneously more prone to oxidation [51,52].
It should be noted that the oxidative stability of the extracted lipid fractions may have been influenced not only by fatty acid composition, but also by antioxidant compounds and formulation-related factors present in the commercial products. Several ready-to-drink beverages declared the addition of vitamins, including vitamin E, which is known to delay lipid oxidation by scavenging free radicals and interrupting oxidative chain reactions [52,53]. Moreover, in complex oil-in-water systems such as plant-based beverages, oxidative stability is strongly affected by interfacial structure and matrix composition, including the presence of proteins, emulsifiers, stabilizers, and polysaccharides, which may modify lipid accessibility and oxidation kinetics [52]. Therefore, the τmax values obtained in the present study should be interpreted as indicators of the oxidative behavior of lipid fractions isolated from complete commercial formulations rather than as direct measures of the intrinsic stability of the lipid source alone. This aspect is particularly relevant when evaluating commercial oat-based products, since technological additives and matrix interactions may substantially modify oxidative performance independently of fatty acid composition alone.
Similar relationships between oxidative stability and fatty acid composition have been reported previously for edible oils, in which higher PUFA contents were associated with lower oxidative stability [54,55]. In addition, Palani et al. [39] demonstrated that the stability of oat oil can be effectively differentiated using thermal methods, further supporting the usefulness of PDSC for characterizing oat-derived lipid fractions. Overall, the present findings demonstrate that both thermal behavior and oxidative stability of oat-based lipid fractions are strongly dependent on the type of lipid source incorporated into the final formulation. The marked differences observed among commercially available products suggest that products within the same market category may exhibit substantially different technological and nutritional properties.

3.4. Hedonic Sensory Evaluation and Consumer Acceptance

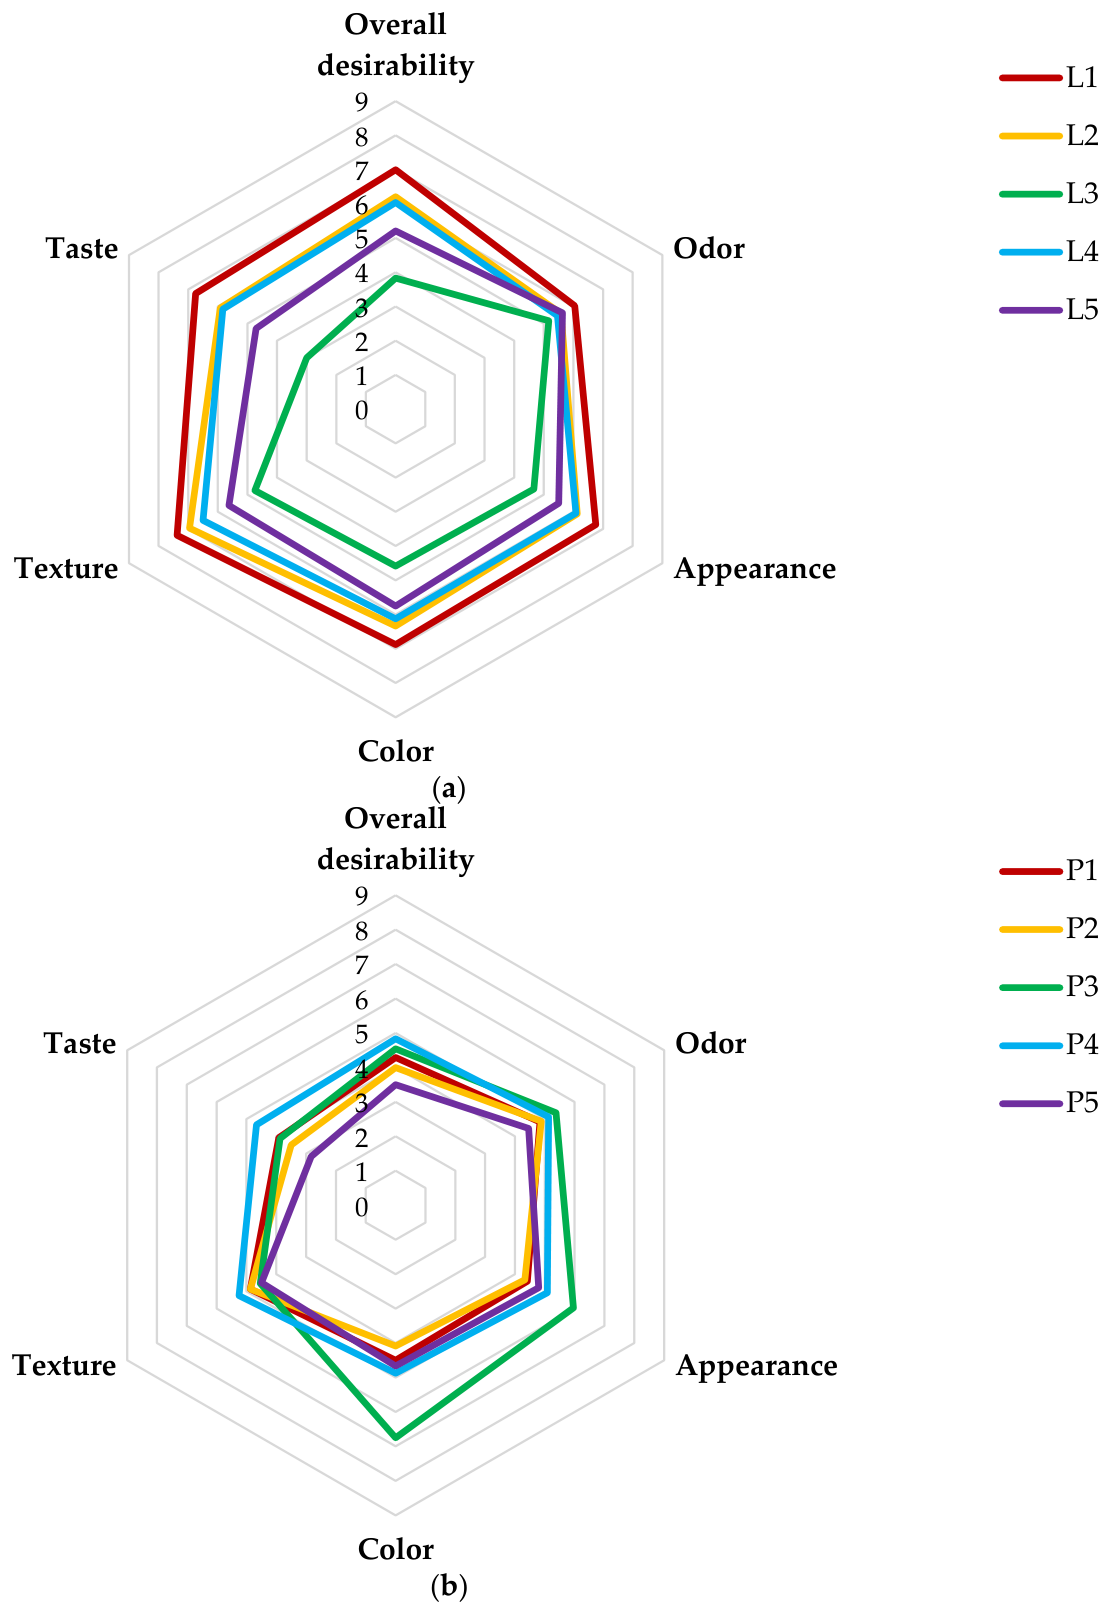
The sensory scores of the analyzed oat-based samples showed clear differences among products, particularly in overall desirability, taste, and texture (Figure 5). Among all samples, L1 received the highest overall desirability score (7.00), followed by L2 (6.21) and L4 (6.04). In contrast, the lowest overall desirability was recorded for P5 (3.50), with low scores also observed for P2 (4.00), L3 (3.83), and P1 (4.29). These results indicate that the ready-to-drink beverages were generally better accepted by consumers than the powdered products. This finding may suggest that liquid formulations provide more desirable sensory characteristics, particularly with respect to mouthfeel and flavor integration, compared with reconstituted powdered systems.
Odor scores varied within a relatively narrow range, from 4.46 for P5 to 6.04 for L1, suggesting that aroma was not the primary factor distinguishing sample acceptance. Greater differences were observed in appearance and color. The highest appearance score was for L1 (6.75), followed by L2 (6.13), L4 (6.08), and P3 (5.96). Similarly, the highest color scores were for L1 (6.88) and P3 (6.75), whereas P2 (4.08) and L3 (4.58) were rated less favorably. The relatively smaller variability in odor scores compared with taste and texture further indicates that visual and aromatic properties alone were insufficient to determine overall consumer preference.
Texture and taste were the attributes that most clearly differentiated the samples. L1 achieved the highest texture score (7.38), followed by L2 (6.96) and L4 (6.50), while P3 (4.54), P5 (4.50), and L3 (4.75) recorded lower values. A similar pattern was observed for taste. L1 was rated highest (6.75), followed by L2 (5.92) and L4 (5.83), whereas the lowest taste scores were obtained by P5 (2.83), L3 (3.00), and P2 (3.50). The low overall desirability of these samples was therefore mainly attributable to poorer perceived taste and texture. These observations emphasize the critical importance of palatability-related properties in determining consumer acceptance of oat-based products.
Overall, the sensory results suggest that liquid products, especially L1, L2, and L4, were more favorably perceived by consumers, probably due to their more acceptable mouthfeel and taste. In contrast, most powdered products showed lower sensory acceptance, despite in some cases an acceptable appearance or color. Sample P3 is a good example of this pattern, i.e., although it was rated relatively well for appearance and color, its lower scores for taste and texture reduced its overall desirability. This indicates that visual attributes alone were not sufficient to ensure good consumer acceptance. The results therefore suggest that optimization of texture and flavor should be considered a priority in the development of oat-based formulations, particularly powdered products intended for reconstitution.
Spearman’s rank correlation analysis showed that all evaluated sensory attributes were positively and significantly correlated with overall desirability (p < 0.05) (Table 4). The strongest association was observed for taste (ρ = 0.988), followed by texture (ρ = 0.924). Odor and appearance showed equally strong correlations with overall desirability (ρ = 0.855), whereas color exhibited the weakest, though still significant, relationship (ρ = 0.770). Therefore, taste and texture were the primary determinants of consumer acceptance of the analyzed oat-based beverages. The particularly high correlation coefficient obtained for taste highlights its dominant role in shaping overall product perception and consumer liking.
To directly examine the relationship between lipid fraction characteristics and sensory perception, an additional exploratory Spearman correlation analysis was conducted between selected lipid-related parameters and sensory attributes (Table S3). Most correlations were not statistically significant, indicating that sensory acceptance was not determined by any single lipid parameter. However, Tp1 showed significant negative correlations with appearance (ρ = −0.648, p = 0.043) and color (ρ = −0.673, p = 0.033), suggesting that samples with lower first-melting-peak temperatures tended to receive more favorable visual scores. This may indicate that thermal properties of lipid fractions indirectly contribute to visual perception, potentially through their influence on physical structure, dispersion stability, or light-scattering properties within the product matrix [48].
The sensory results in the present study are consistent with recent reports indicating that taste- and mouthfeel-related attributes are among the main drivers of liking for plant-based milk alternatives. In our study, taste and texture showed the strongest correlations with overall acceptability, whereas odor and color were less strongly associated with the final consumer assessment. A similar interpretation was presented by Jaeger et al. [56], who showed that positive sensory drivers of liking for plant-based milk alternatives span multiple sensory modalities, with taste, flavor, texture, and mouthfeel playing particularly important roles. This is also in agreement with the systematic review by Appiani et al. [57], which concluded that plant-based dairy analogs are mainly limited by flavor- and texture-related challenges, even when visual attributes are acceptable. Moreover, Alsado et al. [58], in a study on fortified oat milks, emphasized that changes in formulation may affect flavor and mouthfeel and thereby influence overall consumer liking. Therefore, the present findings support the view that the sensory quality of oat-based beverages is determined primarily by palatability-related attributes, especially taste and texture, rather than by appearance alone. Taken together, these findings reinforce the importance of balancing nutritional quality with sensory optimization in the formulation of plant-based beverages, since even products with favorable lipid profiles may show limited consumer acceptance if sensory quality is inadequate.
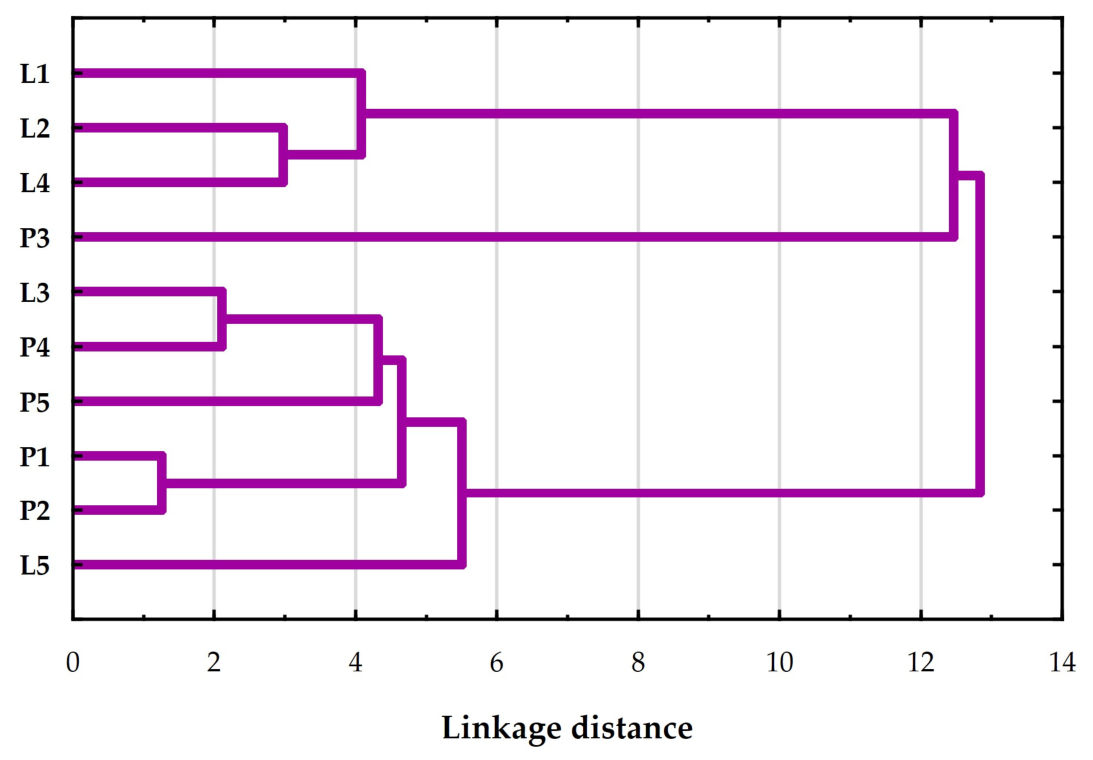
Hierarchical cluster analysis (Figure 6) showed that sample grouping was largely related to formulation and lipid characteristics. P1 and P2 formed the closest pair, consistent with their similar compositions as oat-based powdered products and comparable fatty acid profiles, lipid quality indices, oxidative stability, and melting characteristics. L2 and L4 also clustered closely, most likely because both samples were characterized by high MUFA contents, favorable AI, TI, and h/H values, relatively high oxidative stability, and good sensory quality. L1 joined this subgroup at a slightly higher linkage distance, probably due to its more PUFA-rich profile. In contrast, P3 was clearly separated from all other samples, which can be explained by its coconut fat-based formulation and the resulting very high SFA content, outstanding oxidative stability, distinct DSC behavior, and unfavorable lipid quality indices. The clustering pattern confirms that formulation-related differences, particularly in lipid composition, were reflected not only in physicochemical parameters but also in sensory performance. This demonstrates the strong interrelationship between lipid characteristics, technological behavior, and consumer perception in oat-based products.

4. Conclusions

Commercial oat-based beverages differed significantly in lipid composition, melting behavior, oxidative stability, and sensory quality, demonstrating that lipid source is a key determinant of both technological performance and consumer perception. Among the evaluated formulations, sunflower oil-based products provided the most balanced profile in terms of fatty acid composition, oxidative stability, and sensory acceptance, indicating their suitability for improving overall product quality. In contrast, beverages formulated exclusively with oat-derived lipids showed lower oxidative stability and lower sensory preference, highlighting limitations of native oat lipids in liquid beverage systems. Although the coconut fat-containing sample exhibited superior oxidative stability, this advantage was offset by its nutritionally unfavorable saturated fatty acid profile, illustrating a clear trade-off between stability and nutritional value.
These results emphasize that careful selection of lipid ingredients is crucial not only for optimizing product stability and sensory properties, but also for aligning oat-based beverages with contemporary nutritional recommendations. More broadly, the findings may support the development of tailored lipid systems in plant-based beverages aimed at balancing health, stability, and consumer acceptability.

Supplementary Materials

The following supporting information can be downloaded at: https://www.mdpi.com/article/10.3390/app16115376/s1, Table S1: Manufacturer-declared ingredient lists.; Table S2: Manufacturer-declared nutritional values.; Table S3: Spearman’s rank correlation coefficients between selected lipid-related parameters and sensory attributes of the analyzed oat-based products.

Author Contributions

Conceptualization, J.B. and K.Z.; methodology, J.B., M.S., A.B. and D.M.-J.; software, K.Z. and B.Z.; investigation, K.Z., A.B. and J.B.; resources, K.Z. and J.B.; data curation, K.Z., B.Z. and J.B.; writing—original draft preparation, K.Z., B.Z. and J.B.; writing—review and editing, M.S. and D.M.-J.; visualization, K.Z. and B.Z.; supervision, J.B.; project administration, J.B. All authors have read and agreed to the published version of the manuscript.

Funding

This research received no external funding.

Institutional Review Board Statement

Ethical review and approval were not required for anonymous voluntary sensory evaluation of commercially available food products.

Informed Consent Statement

Informed consent was obtained from all subjects involved in the study.

Data Availability Statement

The original contributions presented in this study are included in the article. Further inquiries can be directed to the corresponding author (J.B.).

Conflicts of Interest

The authors declare no conflicts of interest.

Abbreviations

The following abbreviations are used in this manuscript:
AIatherogenicity index
ANOVAanalysis of variance
DSCdifferential scanning calorimetry
FAfatty acid
FAMEsfatty acid methyl esters
GCgas chromatography
HCAhierarchical cluster analysis
h/Hhypocholesterolemic/hypercholesterolemic fatty acid ratio
MAGmonoacylglycerol
MUFAmonounsaturated fatty acids
NDnot detected
PDSCpressure differential scanning calorimetry
PUFApolyunsaturated fatty acids
SDstandard deviation
SFAsaturated fatty acids
TAGtriacylglycerol
TIthrombogenicity index
TLCthin-layer chromatography
Tp1temperature of the first melting peak
Tp2temperature of the second melting peak
TRIStris(hydroxymethyl)aminomethane
τmaxtime to maximum oxidation rate

References

  1. Catanzaro, R.; Sciuto, M.; Marotta, F. Lactose Intolerance: An Update on Its Pathogenesis, Diagnosis, and Treatment. Nutr. Res. 2021, 89, 23–34. [Google Scholar] [CrossRef] [PubMed]
  2. Alcorta, A.; Porta, A.; Tárrega, A.; Alvarez, M.D.; Vaquero, M.P. Foods for Plant-Based Diets: Challenges and Innovations. Foods 2021, 10, 293. [Google Scholar] [CrossRef]
  3. Reyes-Jurado, F.; Soto-Reyes, N.; Dávila-Rodríguez, M.; Lorenzo-Leal, A.C.; Jiménez-Munguía, M.T.; Mani-López, E.; López-Malo, A. Plant-Based Milk Alternatives: Types, Processes, Benefits, and Characteristics. Food Rev. Int. 2023, 39, 2320–2351. [Google Scholar] [CrossRef]
  4. Pointke, M.; Albrecht, E.H.; Geburt, K.; Gerken, M.; Traulsen, I.; Pawelzik, E. A Comparative Analysis of Plant-Based Milk Alternatives Part 1: Composition, Sensory, and Nutritional Value. Sustainability 2022, 14, 7996. [Google Scholar] [CrossRef]
  5. Deswal, A.; Deora, N.S.; Mishra, H.N. Optimization of Enzymatic Production Process of Oat Milk Using Response Surface Methodology. Food Bioprocess Technol. 2014, 7, 610–618. [Google Scholar] [CrossRef]
  6. McClements, D.J.; Newman, E.; McClements, I.F. Plant-Based Milks: A Review of the Science Underpinning Their Design, Fabrication, and Performance. Compr. Rev. Food Sci. Food Saf. 2019, 18, 2047–2067. [Google Scholar] [CrossRef] [PubMed]
  7. Moretto, L.; Tonolo, F.; Folda, A.; Scalcon, V.; Bindoli, A.; Bellamio, M.; Feller, E.; Rigobello, M.P. Comparative Analysis of the Antioxidant Capacity and Lipid and Protein Oxidation of Soy and Oats Beverages. Food Prod. Process. Nutr. 2021, 3, 1. [Google Scholar] [CrossRef]
  8. Paul, A.A.; Kumar, S.; Kumar, V.; Sharma, R. Milk Analog: Plant Based Alternatives to Conventional Milk, Production, Potential and Health Concerns. Crit. Rev. Food Sci. Nutr. 2020, 60, 3005–3023. [Google Scholar] [CrossRef]
  9. Sethi, S.; Tyagi, S.K.; Anurag, R.K. Plant-Based Milk Alternatives an Emerging Segment of Functional Beverages: A Review. J. Food Sci. Technol. 2016, 53, 3408–3423. [Google Scholar] [CrossRef]
  10. Giacalone, D.; Clausen, M.P.; Jaeger, S.R. Understanding Barriers to Consumption of Plant-Based Foods and Beverages: Insights from Sensory and Consumer Science. Curr. Opin. Food Sci. 2022, 48, 100919. [Google Scholar] [CrossRef]
  11. Grossmann, L.; Kinchla, A.J.; Nolden, A.; McClements, D.J. Standardized Methods for Testing the Quality Attributes of Plant-Based Foods: Milk and Cream Alternatives. Compr. Rev. Food Sci. Food Saf. 2021, 20, 2206–2233. [Google Scholar] [CrossRef] [PubMed]
  12. Sang, S.; Chu, Y. Whole Grain Oats, More than Just a Fiber: Role of Unique Phytochemicals. Mol. Nutr. Food Res. 2017, 61, 1600715. [Google Scholar] [CrossRef]
  13. Grant, C.A.; Hicks, A.L. Comparative Life Cycle Assessment of Milk and Plant-Based Alternatives. Environ. Eng. Sci. 2018, 35, 1235–1247. [Google Scholar] [CrossRef]
  14. Angelov, A.; Yaneva-Marinova, T.; Gotcheva, V. Oats as a Matrix of Choice for Developing Fermented Functional Beverages. J. Food Sci. Technol. 2018, 55, 2351–2360. [Google Scholar] [CrossRef]
  15. McClements, D.J. Development of Next-Generation Nutritionally Fortified Plant-Based Milk Substitutes: Structural Design Principles. Foods 2020, 9, 421. [Google Scholar] [CrossRef] [PubMed]
  16. Xie, A.; Dong, Y.; Liu, Z.; Li, Z.; Shao, J.; Li, M.; Yue, X. A Review of Plant-Based Drinks Addressing Nutrients, Flavor, and Processing Technologies. Foods 2023, 12, 3952. [Google Scholar] [CrossRef] [PubMed]
  17. Aydar, E.F.; Tutuncu, S.; Ozcelik, B. Plant-Based Milk Substitutes: Bioactive Compounds, Conventional and Novel Processes, Bioavailability Studies, and Health Effects. J. Funct. Foods 2020, 70, 103975. [Google Scholar] [CrossRef]
  18. Asif, N.; Anwar, O.; Arif, S.; Anwar, Z.; Iahtisham-Ul-Haq; Ercisli, S.; Mugabi, R.; Nayik, G.A. The Rise of Plant-Based Milk Alternatives: Exploring Nutritional, Health, and Sustainability Impacts. Food Chem. X 2026, 34, 103528. [Google Scholar] [CrossRef]
  19. Mäkinen, O.E.; Wanhalinna, V.; Zannini, E.; Arendt, E.K. Foods for Special Dietary Needs: Non-Dairy Plant-Based Milk Substitutes and Fermented Dairy-Type Products. Crit. Rev. Food Sci. Nutr. 2016, 56, 339–349. [Google Scholar] [CrossRef]
  20. Kozłowska, M.; Mańko-Jurkowska, D.; Zieniuk, B.; Rudzińska, M. Influence of Extraction Techniques on Almond Oil Quality: A Comparative Study of Solvent-Extracted and Commercial Products. Molecules 2025, 30, 3519. [Google Scholar] [CrossRef]
  21. ISO 12966-2:2017; Animal and Vegetable Fats and Oils—Gas Chromatography of Fatty Acid Methyl Esters Part 2: Preparation of Methyl Esters of Fatty Acids. International Organization for Standardization: Vernier, Switzerland, 2017. Available online: https://www.iso.org/standard/72142.html (accessed on 19 April 2026).
  22. Łuczyńska, J.; Paszczyk, B. Health Risk Assessment of Heavy Metals and Lipid Quality Indexes in Freshwater Fish from Lakes of Warmia and Mazury Region, Poland. Int. J. Environ. Res. Public Health 2019, 16, 3780. [Google Scholar] [CrossRef]
  23. Bryś, J.; Flores, L.F.V.; Górska, A.; Wirkowska-Wojdyła, M.; Ostrowska-Ligęza, E.; Bryś, A. Use of GC and PDSC Methods to Characterize Human Milk Fat Substitutes Obtained from Lard and Milk Thistle Oil Mixtures. J. Therm. Anal. Calorim. 2017, 130, 319–327. [Google Scholar] [CrossRef]
  24. European Parliament and Council. Regulation (EU) 2016/679 of 27 April 2016 on the protection of natural persons with regard to the processing of personal data and on the free movement of such data, and repealing Directive 95/46/EC (General Data Protection Regulation). Off. J. Eur. Union 2016, L119, 1–88. [Google Scholar]
  25. Kramm, K.; Roucher, A.; Busom Descarrega, J.; Ambühl, M.; Kammerhofer, J.; Meunier, V.; Heinrich, S. Influence of Material Characteristics on Plant-Based Milk Alternative Properties. J. Food Eng. 2024, 373, 112019. [Google Scholar] [CrossRef]
  26. Shin, J.-M.; Park, S.-K. Comparison of Fat Determination Methods Depending on Fat Definition in Bakery Products. LWT 2015, 63, 972–977. [Google Scholar] [CrossRef]
  27. Albuquerque, T.G.; Nunes, M.A.; Oliveira, M.B.P.P.; Costa, H.S. Compliance of Declared vs. Analysed Values with EU Tolerance Limits for Mandatory Nutrients in Prepacked Foods. Food Chem. 2020, 302, 125330. [Google Scholar] [CrossRef] [PubMed]
  28. Hu, Y.; Acevedo-Fani, A.; Singh, H.; Ye, A. Colloidal Properties of Milk and Plant-Based Milk Alternatives: A Structural Perspective. Curr. Opin. Colloid Interface Sci. 2025, 80, 101966. [Google Scholar] [CrossRef]
  29. Banaś, K.; Harasym, J. Current Knowledge of Content and Composition of Oat Oil—Future Perspectives of Oat as Oil Source. Food Bioprocess Technol. 2021, 14, 232–247. [Google Scholar] [CrossRef]
  30. Zhou, M.; Robards, K.; Glennie-Holmes, M.; Helliwell, S. Oat Lipids. J. Am. Oil Chem. Soc. 1999, 76, 159–169. [Google Scholar] [CrossRef]
  31. Lopes, P.A.; Alfaia, C.M.; Pestana, J.M.; Prates, J.A.M. Structured Lipids Engineering for Health: Novel Formulations Enriched in n-3 Long-Chain Polyunsaturated Fatty Acids with Potential Nutritional Benefits. Metabolites 2023, 13, 1060. [Google Scholar] [CrossRef]
  32. Rizzo, G.; Baroni, L.; Lombardo, M. Promising Sources of Plant-Derived Polyunsaturated Fatty Acids: A Narrative Review. Int. J. Environ. Res. Public Health 2023, 20, 1683. [Google Scholar] [CrossRef]
  33. Saini, R.K.; Prasad, P.; Sreedhar, R.V.; Akhilender Naidu, K.; Shang, X.; Keum, Y.-S. Omega−3 Polyunsaturated Fatty Acids (PUFAs): Emerging Plant and Microbial Sources, Oxidative Stability, Bioavailability, and Health Benefits—A Review. Antioxidants 2021, 10, 1627. [Google Scholar] [CrossRef] [PubMed]
  34. Siol, M.; Mańko-Jurkowska, D.; Stanaszek, I.; Zieniuk, B.; Bryś, A.; Bryś, J. Toward Functional Oil Blends: Physicochemical and Nutritional Evaluation of Rapeseed–Hazelnut Oil Mixtures. Foods 2025, 14, 4008. [Google Scholar] [CrossRef]
  35. Sheashea, M.; Xiao, J.; Farag, M.A. MUFA in Metabolic Syndrome and Associated Risk Factors: Is MUFA the Opposite Side of the PUFA Coin? Food Funct. 2021, 12, 12221–12234. [Google Scholar] [CrossRef] [PubMed]
  36. Moussavi Javardi, M.S.; Madani, Z.; Movahedi, A.; Karandish, M.; Abbasi, B. The correlation between dietary fat quality indices and lipid profile with Atherogenic index of plasma in obese and non-obese volunteers: A cross-sectional descriptive-analytic case-control study. Lipids Health Dis. 2020, 19, 213. [Google Scholar] [CrossRef]
  37. Rashidimehr, A.; Mohammadi-Nasrabadi, F.; Alhouei, B.; Khoshtinat, K.; Esfarjani, F. Fatty acid composition of dairy products and their impact on atherogenicity and thrombogenicity. Sci. Rep. 2025, 15, 43613. [Google Scholar] [CrossRef]
  38. Tortosa-Caparrós, E.; Navas-Carrillo, D.; Marín, F.; Orenes-Piñero, E. Anti-Inflammatory Effects of Omega 3 and Omega 6 Polyunsaturated Fatty Acids in Cardiovascular Disease and Metabolic Syndrome. Crit. Rev. Food Sci. Nutr. 2017, 57, 3421–3429. [Google Scholar] [CrossRef]
  39. Palani, B.K.; Siol, M.; Makouie, S.; Bryś, J.; Gruczyńska-Sękowska, E.; Koczoń, P. Investigation of Oil Extracted from Roasted and Unroasted Oats with Use of Chemometrics. Appl. Sci. 2024, 14, 11481. [Google Scholar] [CrossRef]
  40. Pokhrel, K.; Kouřimská, L.; Pazderů, K.; Capouchová, I.; Božik, M. Lipid Content and Fatty Acid Profile of Various European and Canadian Hulled and Naked Oat Genotypes. J. Cereal Sci. 2022, 108, 103580. [Google Scholar] [CrossRef]
  41. Ma, F.; Dai, T.; Guo, L.; Wang, C.; Li, C.; Li, C.; Chen, J.; Ren, C. Comparative Study of Chemical Compositions and Antioxidant Capacities of Oils Obtained from Sixteen Oat Cultivars in China. Foods 2025, 14, 2007. [Google Scholar] [CrossRef] [PubMed]
  42. Puganen, A.; Damerau, A.; Pöysä, M.; Lampi, A.-M.; Piironen, V.; Yang, B.; Linderborg, K.M. Lipid and Volatile Profiles of Finnish Oat Batches of Pure Cultivars: Effect of Storage on the Volatile Formation. Food Chem. 2024, 451, 139448. [Google Scholar] [CrossRef]
  43. Blasi, F.; Maria Pellegrino, R.; Br Alabed, H.; Ianni, F.; Emiliani, C.; Cossignani, L. Lipidomics of Coconut, Almond and Soybean Milks-Comprehensive Characterization of Triacylglycerol Class and Comparison with Bovine Milk. Food Res. Int. 2023, 172, 113147. [Google Scholar] [CrossRef] [PubMed]
  44. Linderborg (Née Yli-Jokipii), K.M.; Kallio, H.P.T. Triacylglycerol Fatty Acid Positional Distribution and Postprandial Lipid Metabolism. Food Rev. Int. 2005, 21, 331–355. [Google Scholar] [CrossRef]
  45. Ratnayake, W.M.N.; Galli, C. Fat and Fatty Acid Terminology, Methods of Analysis and Fat Digestion and Metabolism: A Background Review Paper. Ann. Nutr. Metab. 2009, 55, 8–43. [Google Scholar] [CrossRef] [PubMed]
  46. Guan, M.; Chen, H.; Xiong, X.; Lu, X.; Li, X.; Huang, F.; Guan, C. A Study on Triacylglycerol Composition and the Structure of High-Oleic Rapeseed Oil. Engineering 2016, 2, 258–262. [Google Scholar] [CrossRef]
  47. Dulf, F.V.; Oroian, I.; Vodnar, D.C.; Socaciu, C.; Pintea, A. Lipid Classes and Fatty Acid Regiodistribution in Triacylglycerols of Seed Oils of Two Sambucus Species (S. nigra L. and S. ebulus L.). Molecules 2013, 18, 11768–11782. [Google Scholar] [CrossRef]
  48. McClements, D.J.; Grossmann, L. Physicochemical and Sensory Properties of Plant-Based Foods. In Next-Generation Plant-Based Foods; Springer International Publishing: Cham, Switzerland, 2022; pp. 155–226. [Google Scholar]
  49. Greis, M.; Sainio, T.; Katina, K.; Nolden, A.A.; Kinchla, A.J.; Seppä, L.; Partanen, R. Physicochemical Properties and Mouthfeel in Commercial Plant-Based Yogurts. Foods 2022, 11, 941. [Google Scholar] [CrossRef]
  50. Wirkowska-Wojdyła, M.; Ostrowska-Ligęza, E.; Górska, A.; Bryś, J. Application of Chromatographic and Thermal Methods to Study Fatty Acids Composition and Positional Distribution, Oxidation Kinetic Parameters and Melting Profile as Important Factors Characterizing Amaranth and Quinoa Oils. Appl. Sci. 2022, 12, 2166. [Google Scholar] [CrossRef]
  51. Ghnimi, S.; Budilarto, E.; Kamal-Eldin, A. The New Paradigm for Lipid Oxidation and Insights to Microencapsulation of Omega-3 Fatty Acids. Comp. Rev. Food Sci. Food Safe 2017, 16, 1206–1218. [Google Scholar] [CrossRef]
  52. Islam, F.; Imran, A.; Nosheen, F.; Fatima, M.; Arshad, M.U.; Afzaal, M.; Ijaz, N.; Noreen, R.; Mehta, S.; Biswas, S.; et al. Functional Roles and Novel Tools for Improving-oxidative Stability of Polyunsaturated Fatty Acids: A Comprehensive Review. Food Sci. Nutr. 2023, 11, 2471–2482. [Google Scholar] [CrossRef] [PubMed]
  53. Fadda, A.; Sanna, D.; Sakar, E.H.; Gharby, S.; Mulas, M.; Medda, S.; Yesilcubuk, N.S.; Karaca, A.C.; Gozukirmizi, C.K.; Lucarini, M.; et al. Innovative and Sustainable Technologies to Enhance the Oxidative Stability of Vegetable Oils. Sustainability 2022, 14, 849. [Google Scholar] [CrossRef]
  54. Symoniuk, E.; Ratusz, K.; Krygier, K. Comparison of the Oxidative Stability of Linseed (Linum usitatissimum L.) Oil by Pressure Differential Scanning Calorimetry and Rancimat Measurements. J. Food Sci. Technol. 2016, 53, 3986–3995. [Google Scholar] [CrossRef]
  55. Kowalska, D.; Kołowrocka, Z.; Gruczyńska-Sękowska, E.; Tarnowska, K.; Zieniuk, B. Evaluation of the Quality and Composition of the Lipid Fraction Obtained from Acorns. Appl. Sci. 2026, 16, 2564. [Google Scholar] [CrossRef]
  56. Jaeger, S.R.; Dupas de Matos, A.; Frempomaa Oduro, A.; Hort, J. Sensory Characteristics of Plant-Based Milk Alternatives: Product Characterisation by Consumers and Drivers of Liking. Food Res. Int. 2024, 180, 114093. [Google Scholar] [CrossRef]
  57. Appiani, M.; Cattaneo, C.; Laureati, M. Sensory Properties and Consumer Acceptance of Plant-Based Meat, Dairy, Fish and Eggs Analogs: A Systematic Review. Front. Sustain. Food Syst. 2023, 7, 1268068. [Google Scholar] [CrossRef]
  58. Alsado, C.; Lopez-Aldana, L.; Chen, L.; Wismer, W. Consumer Perception and Sensory Drivers of Liking of Fortified Oat Milks. Foods 2023, 12, 4097. [Google Scholar] [CrossRef]
Figure 1. Lipid extraction yield (%) and relative extraction efficiency (%) for samples L1–L5 and P1–P5. Blue bars represent extraction yield, and gray bars represent relative extraction efficiency. Data are presented as mean ± SD. Different letters above bars indicate statistically significant differences among samples (p < 0.05).
Applsci 16 05376 g001
Figure 2. Percentage distribution of saturated fatty acids (SFA), monounsaturated fatty acids (MUFA), and polyunsaturated fatty acids (PUFA) in the lipid fractions extracted from samples L1–L5 and P1–P5. Results are expressed as the percentage share of each fatty acid group in total fatty acids.
Applsci 16 05376 g002
Figure 3. The percentage of selected fatty acids at the sn-2 position of triacylglycerols (TAGs) in lipid fractions extracted from oat-based samples, where (a) L1–L5 are ready-to-drink products and (b) P1–P5 are powdered products. The dotted line indicates the theoretical even distribution of fatty acids among the three TAG positions (33.3%). Data represent mean values ± SD (n = 2). Different letters indicate significantly different values (p < 0.05).
Applsci 16 05376 g003aApplsci 16 05376 g003b
Figure 4. Oxidative stability of lipid fractions extracted from oat-based samples L1–L5 and P1–P5, expressed as the time to maximum oxidation rate (τmax, min) determined by PDSC. Different letters above the bars indicate statistically significant differences among samples (p < 0.05).
Applsci 16 05376 g004
Figure 5. Radar plots showing the sensory profiles of oat-based samples evaluated using a 9-point hedonic scale: (a) ready-to-drink products (L1–L5) and (b) powdered products (P1–P5). The assessed attributes included overall desirability, odor, appearance, color, texture, and taste. Scores ranged from 1 (lowest desirability) to 9 (highest desirability). Higher values indicate greater consumer acceptance of a given sensory attribute.
Applsci 16 05376 g005
Figure 6. Hierarchical cluster analysis dendrogram illustrating the similarity among oat-based samples L1–L5 and P1–P5 on the basis of the analyzed characteristics. Clustering was performed using Euclidean distance and Ward’s method.
Applsci 16 05376 g006
Table 1. Characteristics of the oat-based samples included in the study.
Sample CodeProduct FormDeclared Oat Content (%w/w)Main Lipid SourceDeclared Fat Content (g/100 mL Beverage)Ingredient Summary
L1Ready-to-drink13Sunflower oil3.00Water, oat base, sunflower oil, salt, vitamin D, vitamin B12, calcium
L210Sunflower oil2.40Water, oat base, sunflower oil, calcium carbonate, sea salt, vitamins
L316Sunflower oil1.20Water, organic oat base, organic sunflower oil
L48.7Sunflower oil3.00Oat base, sunflower oil, chicory root fiber, pea protein, potassium phosphates, sea salt, vitamins
L510.5Sunflower oil1.50Oat base, corn fiber, sunflower oil, calcium, sea salt, gellan gum, vitamins
P1Powdered product for reconstitution100Native oat lipids1.20Single-ingredient product (gluten-free oat flour)
P2100Native oat lipids0.96Single-ingredient product (oat-based powder)
P321Coconut fat4.40Coconut fat, oat flour, glucose syrup powder, dextrose, maltodextrin, inulin, emulsifier, stabilizer, salt
P499.75Native oat lipids0.80Wholegrain oat flour and α-amylase
P550%High-oleic sunflower oil1.84Instant oat flakes, corn maltodextrin, high-oleic sunflower oil, calcium sources, natural vanilla flavor
L1–L5 denote ready-to-drink beverages, while P1–P5 denote powdered products for reconstitution.
Table 2. Fatty acid composition of the lipid fractions extracted from oat-based samples L1–L5 and P1–P5, expressed as % of total fatty acids, together with selected lipid quality indices.
Fatty AcidL1L2L3L4L5P1P2P3P4P5
C6:0NDNDNDNDND0.04 ± 0.010.03 ± 0.010.33 ± 0.030.07 ± 0.050.03 ± 0.01
C8:0NDNDNDNDND0.03 ± 0.010.02 ± 0.014.42 ± 0.250.02 ± 0.010.01 ± 0.01
C10:0NDNDNDNDND0.05 ± 0.010.02 ± 0.014.53 ± 0.230.03 ± 0.040.01 ± 0.01
C12:0NDNDNDNDND0.14 ± 0.020.07 ± 0.0137.20 ± 1.290.09 ± 0.060.04 ± 0.01
C14:0NDNDNDNDND0.55 ± 0.080.47 ± 0.0417.65 ± 0.120.54 ± 0.060.16 ± 0.01
C14:10.14 ± 0.020.11 ± 0.010.27 ± 0.100.09 ± 0.010.14 ± 0.01NDNDNDNDND
C16:09.17 ± 0.617.53 ± 0.2014.02 ± 2.736.23 ± 0.1110.23 ± 0.2019.25 ± 1.7319.70 ± 0.4513.74 ± 0.4219.66 ± 0.718.53 ± 0.04
C16:10.13 ± 0.010.17 ± 0.010.18 ± 0.010.13 ± 0.010.12 ± 0.010.22 ± 0.020.27 ± 0.02ND0.27 ± 0.020.16 ± 0.03
C18:03.58 ± 0.111.88 ± 0.012.40 ± 0.213.87 ± 0.013.59 ± 0.041.88 ± 0.141.58 ± 0.017.45 ± 0.541.95 ± 0.063.17 ± 0.02
C18:137.07 ± 0.2258.14 ± 0.2048.25 ± 1.3976.65 ± 0.3234.41 ± 0.0736.30 ± 0.8234.89 ± 0.1610.21 ± 0.6636.30 ± 0.4968.23 ± 0.10
C18:2 n646.94 ± 0.0723.79 ± 0.1332.24 ± 0.3510.26 ± 0.2449.34 ± 0.5837.91 ± 0.4238.62 ± 0.074.21 ± 0.2538.28 ± 0.2317.47 ± 0.04
C18:3 n31.45 ± 0.016.20 ± 0.080.94 ± 0.100.44 ± 0.010.58 ± 0.011.26 ± 0.091.40 ± 0.060.08 ± 0.011.37 ± 0.010.53 ± 0.01
C20:00.28 ± 0.050.47 ± 0.050.16 ± 0.060.34 ± 0.020.25 ± 0.040.13 ± 0.030.10 ± 0.010.14 ± 0.020.13 ± 0.010.25 ± 0.01
C20:10.42 ± 0.041.24 ± 0.140.53 ± 0.210.37 ± 0.020.35 ± 0.040.75 ± 0.140.73 ± 0.120.09 ± 0.010.65 ± 0.110.39 ± 0.01
C20:4 n60.58 ± 0.110.27 ± 0.020.31 ± 0.171.07 ± 0.040.63 ± 0.04NDNDNDND0.49 ± 0.04
C20:5 n3NDNDND0.30 ± 0.04NDNDNDNDNDND
C24:00.27 ± 0.040.22 ± 0.010.63 ± 0.230.30 ± 0.010.37 ± 0.011.16 ± 0.151.66 ± 0.08ND0.68 ± 0.030.56 ± 0.02
C24:1NDND0.16 ± 0.05NDND0.37 ± 0.040.48 ± 0.04NDNDND
n6/n332.88 ± 0.043.88 ± 0.0334.79 ± 3.1115.53 ± 0.6286.18 ± 2.1030.27 ± 1.8827.61 ± 1.0656.16 ± 2.0027.94 ± 0.4533.89 ± 0.89
AI0.11 ± 0.010.08 ± 0.010.17 ± 0.040.07 ± 0.010.12 ± 0.010.28 ± 0.030.28 ± 0.018.36 ± 0.620.28 ± 0.020.11 ± 0.01
TI0.27 ± 0.010.16 ± 0.010.38 ± 0.070.22 ± 0.010.31 ± 0.010.52 ± 0.050.52 ± 0.025.19 ± 0.220.53 ± 0.020.26 ± 0.01
h/H9.40 ± 0.6711.74 ± 0.315.96 ± 1.3014.25 ± 0.258.31 ± 0.173.81 ± 0.423.70 ± 0.100.21 ± 0.023.75 ± 0.199.95 ± 0.07
Values are presented as mean ± SD. ND, not detected. AI, atherogenicity index; TI, thrombogenicity index; h/H, ratio of hypocholesterolemic to hypercholesterolemic fatty acids. The n6/n3 value denotes the ratio of total omega-6 to omega-3 fatty acids.
Table 3. Temperatures of the first (Tp1) and second (Tp2) melting peaks of lipid fractions extracted from oat-based samples L1–L5 and P1–P5.
SampleTp1 (°C)Tp2 (°C)
L1−74.18 ± 1.49 abc−28.91 ± 0.35 a
L2−73.46 ± 2.57 abc−18.55 ± 0.25 b
L3−73.90 ± 0.77 abc−18.18 ± 0.31 b
L4−75.50 ± 0.01 a−7.57 ± 0.02 c
L5−68.94 ± 0.18 bc−28.46 ± 0.11 a
P1−71.18 ± 3.42 abc−20.04 ± 0.35 b
P2−68.31 ± 0.09 c−19.81 ± 1.66 b
P3−75.26 ± 1.51 ab20.62 ± 0.97 d
P4−72.82 ± 1.66 abc−19.79 ± 1.75 b
P5−69.12 ± 0.13 abc−10.20 ± 0.14 c
Different letters within the same column indicate statistically significant differences among samples at p < 0.05, as determined by one-way ANOVA followed by Tukey’s post hoc test. Tp1 and Tp2 represent the temperatures of the maxima of the first and second endothermic transitions observed in the DSC melting thermograms.
Table 4. Spearman’s rank correlation coefficients between individual sensory attributes and overall desirability of the analyzed oat-based beverages.
Sensory AttributeSpearman’s ρp-Value
Odor0.8550.0016
Appearance0.8550.0016
Color0.7700.0092
Texture0.9240.0001
Taste0.988<0.0001
Disclaimer/Publisher’s Note: The statements, opinions and data contained in all publications are solely those of the individual author(s) and contributor(s) and not of MDPI and/or the editor(s). MDPI and/or the editor(s) disclaim responsibility for any injury to people or property resulting from any ideas, methods, instructions or products referred to in the content.