Article

The Correlation Between Pre-Competition Training, Stroke Power Monitoring, and Race Time in Indoor Rowing

1
Division of Sport Science and Physical Education, Tsinghua University, Beijing 100084, China
2
Department of Physical Education, Peking University, Beijing 100871, China
*
Author to whom correspondence should be addressed.
Appl. Sci. 2026, 16(11), 5322; https://doi.org/10.3390/app16115322
Submission received: 3 April 2026 / Revised: 18 May 2026 / Accepted: 19 May 2026 / Published: 26 May 2026

Abstract

The purpose of this study is to provide data-driven training optimization tools for indoor rowing coaches and athletes, provide quantitative reference for training monitoring and performance analysis in a controllable environment, and help improve the scientific level of competitive performance and training management. To address the absence of quantitative analysis regarding the relationship between rowing power load and competition time during pre-competition training, this study introduces a sequential attention pooling with monotonic constraints (SAP-MC) to systematically analyze data from the rowing power sensor system. The results show that the model effectively captures the negative correlation between power output and competition time. Specifically, when the average power is increased from 230 W to 290 W, the competition time is reduced from 435.2 s to 409.6 s, resulting in a significant reduction of 25.6 s (p < 0.001). When the coefficient of variation of power output (cv_power) increased from 0.08 to 0.18, the competition time was prolonged by 14.2 s (p < 0.01). In addition, when the acute-chronic load ratio (ACWR) exceeds 1.2, compared with the optimal range (0.9–1.1), the competition time is increased by about 6.8 s (p < 0.05). The overall analysis shows that the average power output and power stability are the most critical variables affecting the change of competition time, followed by training load balance and segmented pace optimization. The research results validate the scientific significance of power monitoring and provide a reference for quantitatively analyzing the correlation between training load and race time in a controlled indoor rowing training environment.

1. Introduction

Rowing is a competitive sport highly dependent on aerobic endurance and technical execution, in which the quality of pre-competition training plays a decisive role in the result of the competition [1]. In recent years, with the development of sports monitoring technology, multi-source indicators such as power output, rowing frequency, and heart rate have been widely used in training load evaluation and sports performance prediction [2]. Compared with the real water rowing environment, indoor rowing dynamometer training has the characteristics of unified equipment, less environmental interference, and stable data acquisition by paddle, so it is widely used in pre-competition training monitoring, load evaluation, and performance analysis. Especially in the indoor rowing environment, the time series data, such as rowing power, rowing frequency, and heart rate, can be continuously recorded, which provides a controllable data basis for the modelling of the correlation between training load and competition time. However, the traditional monitoring methods are mainly based on statistical summaries or empirical judgment. Although the training intensity can be roughly quantified, it is often difficult to describe the time dynamic change of performance, thus limiting its ability to reveal the deep causal correlation between training load and competition time [3,4,5]. Therefore, how to effectively integrate the dynamic information of rowing level with the overall training characteristics while maintaining the interpretability of the model is still a key challenge in sports science research and practical application.
Most existing methods rely on a single statistical feature or a traditional machine learning framework, and their ability to mine sequence information is limited. Although simple indicators such as average power or peak heart rate can reflect the overall training load, they ignore the rhythm change and stage fluctuation in the training process, which are often important factors to determine the performance of the game [6,7,8]. In addition, although the deep learning model can capture complex time-dependent correlations, it usually lacks interpretability and robustness, especially in areas where there is no distribution, and its prediction results may violate physiological constraints, thus reducing its reliability in practical applications [9]. Due to the lack of explicit prior constraints on the training dynamic process, the consistency between the model output and the physiological laws is still insufficient, thus limiting the effect of its application in the training monitoring system [10].
Based on this, this study proposes an SAP-MC (Sequential Attention Pooling with Monotonic Constraints) model that combines sequential attention pooling and a monotonic constraint mechanism, aiming to construct a reasonable mapping between indoor rowing training power sequence and competition duration. The model introduces an attention mechanism to dynamically identify the key stages in the training sequence, and at the same time, enhances the training stability through regularization based on the gradient. In addition, the model incorporates monotone constraints based on kinematic a priori, so that the increase of average power will inevitably correspond to the decrease of competition time, while the increase of load fluctuation will lead to the extension of competition time. Through this design, the model can output explanatory feature contributions to competition performance, and reveal the mechanism of action between pre-competition training monitoring and competition results. This model can also provide an interpretable modelling framework for the analysis of the correlation between training load and flight time under controlled conditions.
The main contributions of this study are as follows:
(1)
A sequential pooling method based on an attention mechanism is proposed to model rowing data, to effectively capture the time structure and key load stages in the training process.
(2)
Monotonicity and shape constraints are embedded in the regression framework, and physiological principles are integrated into the model structure to ensure logical consistency and good generalization ability.
(3)
Build a unified data processing and feature extraction process, which can automatically convert the original. row file into model input format, and provide a technical basis for subsequent training, monitoring, and correlation analysis.
In general, this study takes the analysis of the correlation between pre-competition training load and competition time of indoor rowing as the core research goal, and the model constructed is mainly used as an analytical tool to reveal the mechanism between training monitoring and competition performance. Based on the existing training monitoring research and the law of exercise load, it is assumed that there is a directional dynamic correlation between the power output level, power stability, and load balance state during the oar-by-oar training of indoor rowing and the competition time. Based on this idea, this study further uses SAP-MC to model the public database to verify the dynamic correlation between different training load characteristics and flight time, and analyzes the relative role of various characteristics in the formation of competition performance. The experimental analysis shows that the average power, power stability, and load balance state may be stably related to the sailing time of the game. The power increase may correspond to the shortening of the sailing time, while the increase in power fluctuation may lead to a decline in the performance of the game.

2. Related Work

Rowing, as a sport highly dependent on endurance and technical cooperation, has long been the core object of training monitoring and sports performance regulation research. Watts et al. (2025) [11] summarized the core concepts and prescription strategies in rowing training based on interviews with 10 elite Australian coaches. The study shows that coaches generally emphasize the development of athletes’ “engine ability” through periodic and polarized training structure, and take the gradual improvement of water speed as an important index to evaluate the training effect. The training prescription is not fixed, but dynamically adjusted according to the characteristics of individual athletes, which highlights the important role of load monitoring and personalized regulation in the pre-competition preparation stage. Based on the 44-week training data of six Chinese world-class male rowers, Zhong et al. (2025) [12] further analyzed the seasonal distribution of training volume and intensity. The results show that more than two-thirds of the total training load comes from rowing special training, of which nearly 90% belongs to low-intensity training, while medium-high intensity training accounts for a relatively low proportion. Although the training structure showed obvious polarization characteristics, the performance of the exercise continued to improve in the repeated tests of 2000 m and 5000 m, and the incremental step test showed that the peak power output (PPO) was enhanced. This shows that the high-capacity and low-intensity training mode will not hinder the development of sports performance, but will help fine-tune regulation and targeted preparation in the pre-competition stage.
In the empirical research of training monitoring, Watts et al. (2024) [13] analyzed 1453 water training courses to explore the correlation between rowing frequency, heart rate, and boat speed. Although there is a significant difference between rowing frequency and speed in different heart rate intervals (p < 0.001), there is still a large overlap between the intervals, indicating that there is a high variability in the real training environment. In addition, there is only a moderate correlation between rowing frequency and boat speed (r = 0.50), which further indicates that it is necessary to monitor rhythm and intensity variables simultaneously to describe sports performance behaviour more comprehensively. From the perspective of long-term adaptation, Mikulic and Gulin (2024) [14] conducted a longitudinal analysis of two Olympic champions for 20 years, and found that their PPO per unit time remained stable in the range of 550–575 W for a long time. This stability is highly consistent with the performance of 2000 m and 6000 m tests, and the competition results continue to improve, indicating that long-term training adaptation is not only reflected in physiological stability, but also in the continuous power output ability and performance improvement. In addition, Das et al. (2023) [15] monitored the 17-week training cycle of the Indian national rowing team and found that the pre-competition training load adjustment was closely related to the change of metabolic pressure. The lactate dehydrogenase level was significantly related to rowing performance time (p < 0.05), suggesting that physiological and biochemical indicators can be used as an effective reference for sports performance evaluation. Similarly, Naghizadeh et al. (2024) [16] compared the high-intensity intermittent resistance training (HIIRT) with the traditional resistance training scheme, and the results showed that both methods could improve the strength-related sensing indexes, but HIIRT was more effective in improving the maximum oxygen uptake (p = 0.002), indicating that different training strategies would lead to different physiological adaptation paths.
Generally speaking, the existing research generally reaches a consensus that load monitoring and physiological adaptation are the key factors to determine the performance of rowing, and training distribution structure, power output, and rhythm control play an important role in pre-competition preparation. However, at present, most of the research is still limited to descriptive statistics or univariate analysis methods, which lack a systematic modelling framework that can describe the dynamic interaction of multivariate data and remain at the level of static comparison as a whole, failing to fully consider the time structure and physiological constraints. In the actual training situation, the power output, rowing frequency, and heart rate show obvious dynamic coupling characteristics at the rowing level, which indicates that there is an urgent need for a method to explicitly model this kind of interdependent time correlation. In addition, recent studies have further discussed rowing performance from the perspectives of special performance modelling, pace strategy, and physiological determinants. With the development of wearable sensors and temporal deep learning, motion monitoring research has gradually shifted from traditional statistical analysis to sequence modelling for continuous dynamic behaviour. Mănescu and Mănescu (2025) [17], based on smartphone and wearable IMU data, combined with self-supervised learning and time series modelling strategies, to achieve robust detection of gait events in complex motion scenarios. This indicates that the sequence perception framework under weakly supervised conditions can effectively improve the generalization ability of motion monitoring. Navakauskas and Dumpis (2025) [18] further compared the performance of LSTM (Long Short-Term Memory), GRU (Gated Recurrent Unit), and FIRNN (Finite Impulse Response Neural Network) in human activity recognition. The results showed that the temporal neural network had obvious advantages in dynamic behaviour modelling, and the interpretable mechanism could enhance the analysis ability of the model to the contribution of sensor features. In addition, Tan et al. (2024) [19] realized dynamic estimation based on IMU (Inertial Measurement Unit) data through Transformer and self-supervised learning, which improved the modelling efficiency of motion temporal features while reducing annotation dependence. Zhang and Oh (2026) [20] realized high-precision recognition and interpretable analysis of multimodal wearable sensing data by using time-consistent coding and position-aware attention fusion mechanism. The above research shows that sequence modelling, attention mechanisms, and interpretable learning methods based on sensor data are gradually becoming an important development direction of motion behaviour analysis and human performance monitoring. In addition, Wang and Liu (2026) [21] put forward a personalized performance prediction framework based on multi-source training and physiological data. The results show that training density and heart rate recovery ability are significantly correlated with subjective exertion perception and sports performance results. González-García et al. (2025) [22] used real race data to analyze the pace distribution in different stages, and found that there was a significant correlation between the segmented pace strategy and the final race results. In addition, Borges et al. (2025) [23] pointed out through a systematic review that the maximum oxygen uptake (VO2max) and PPO were the key physiological indices most consistent with rowing performance. Although the above research provides important insights for the determinants of sports performance from different angles, its analysis still relies mainly on aggregated statistical characteristics or one-dimensional indicators, lacking a framework that can uniformly model the time structure of paddle level and the multi-variable interaction. In order to solve the above problems, this study proposes an SAP-MC model, which can dynamically capture the multidimensional information of rowing training data and introduce physiological constraints. This design not only enhances the interpretability of the model but also ensures its consistency with the known physiological laws, thus providing a more robust analytical framework for understanding the correlation between training load and competitive performance.


3. Materials and Methods

3.1. SAP-MC Model

3.1.1. Implementation Principle of the SAP-MC Model

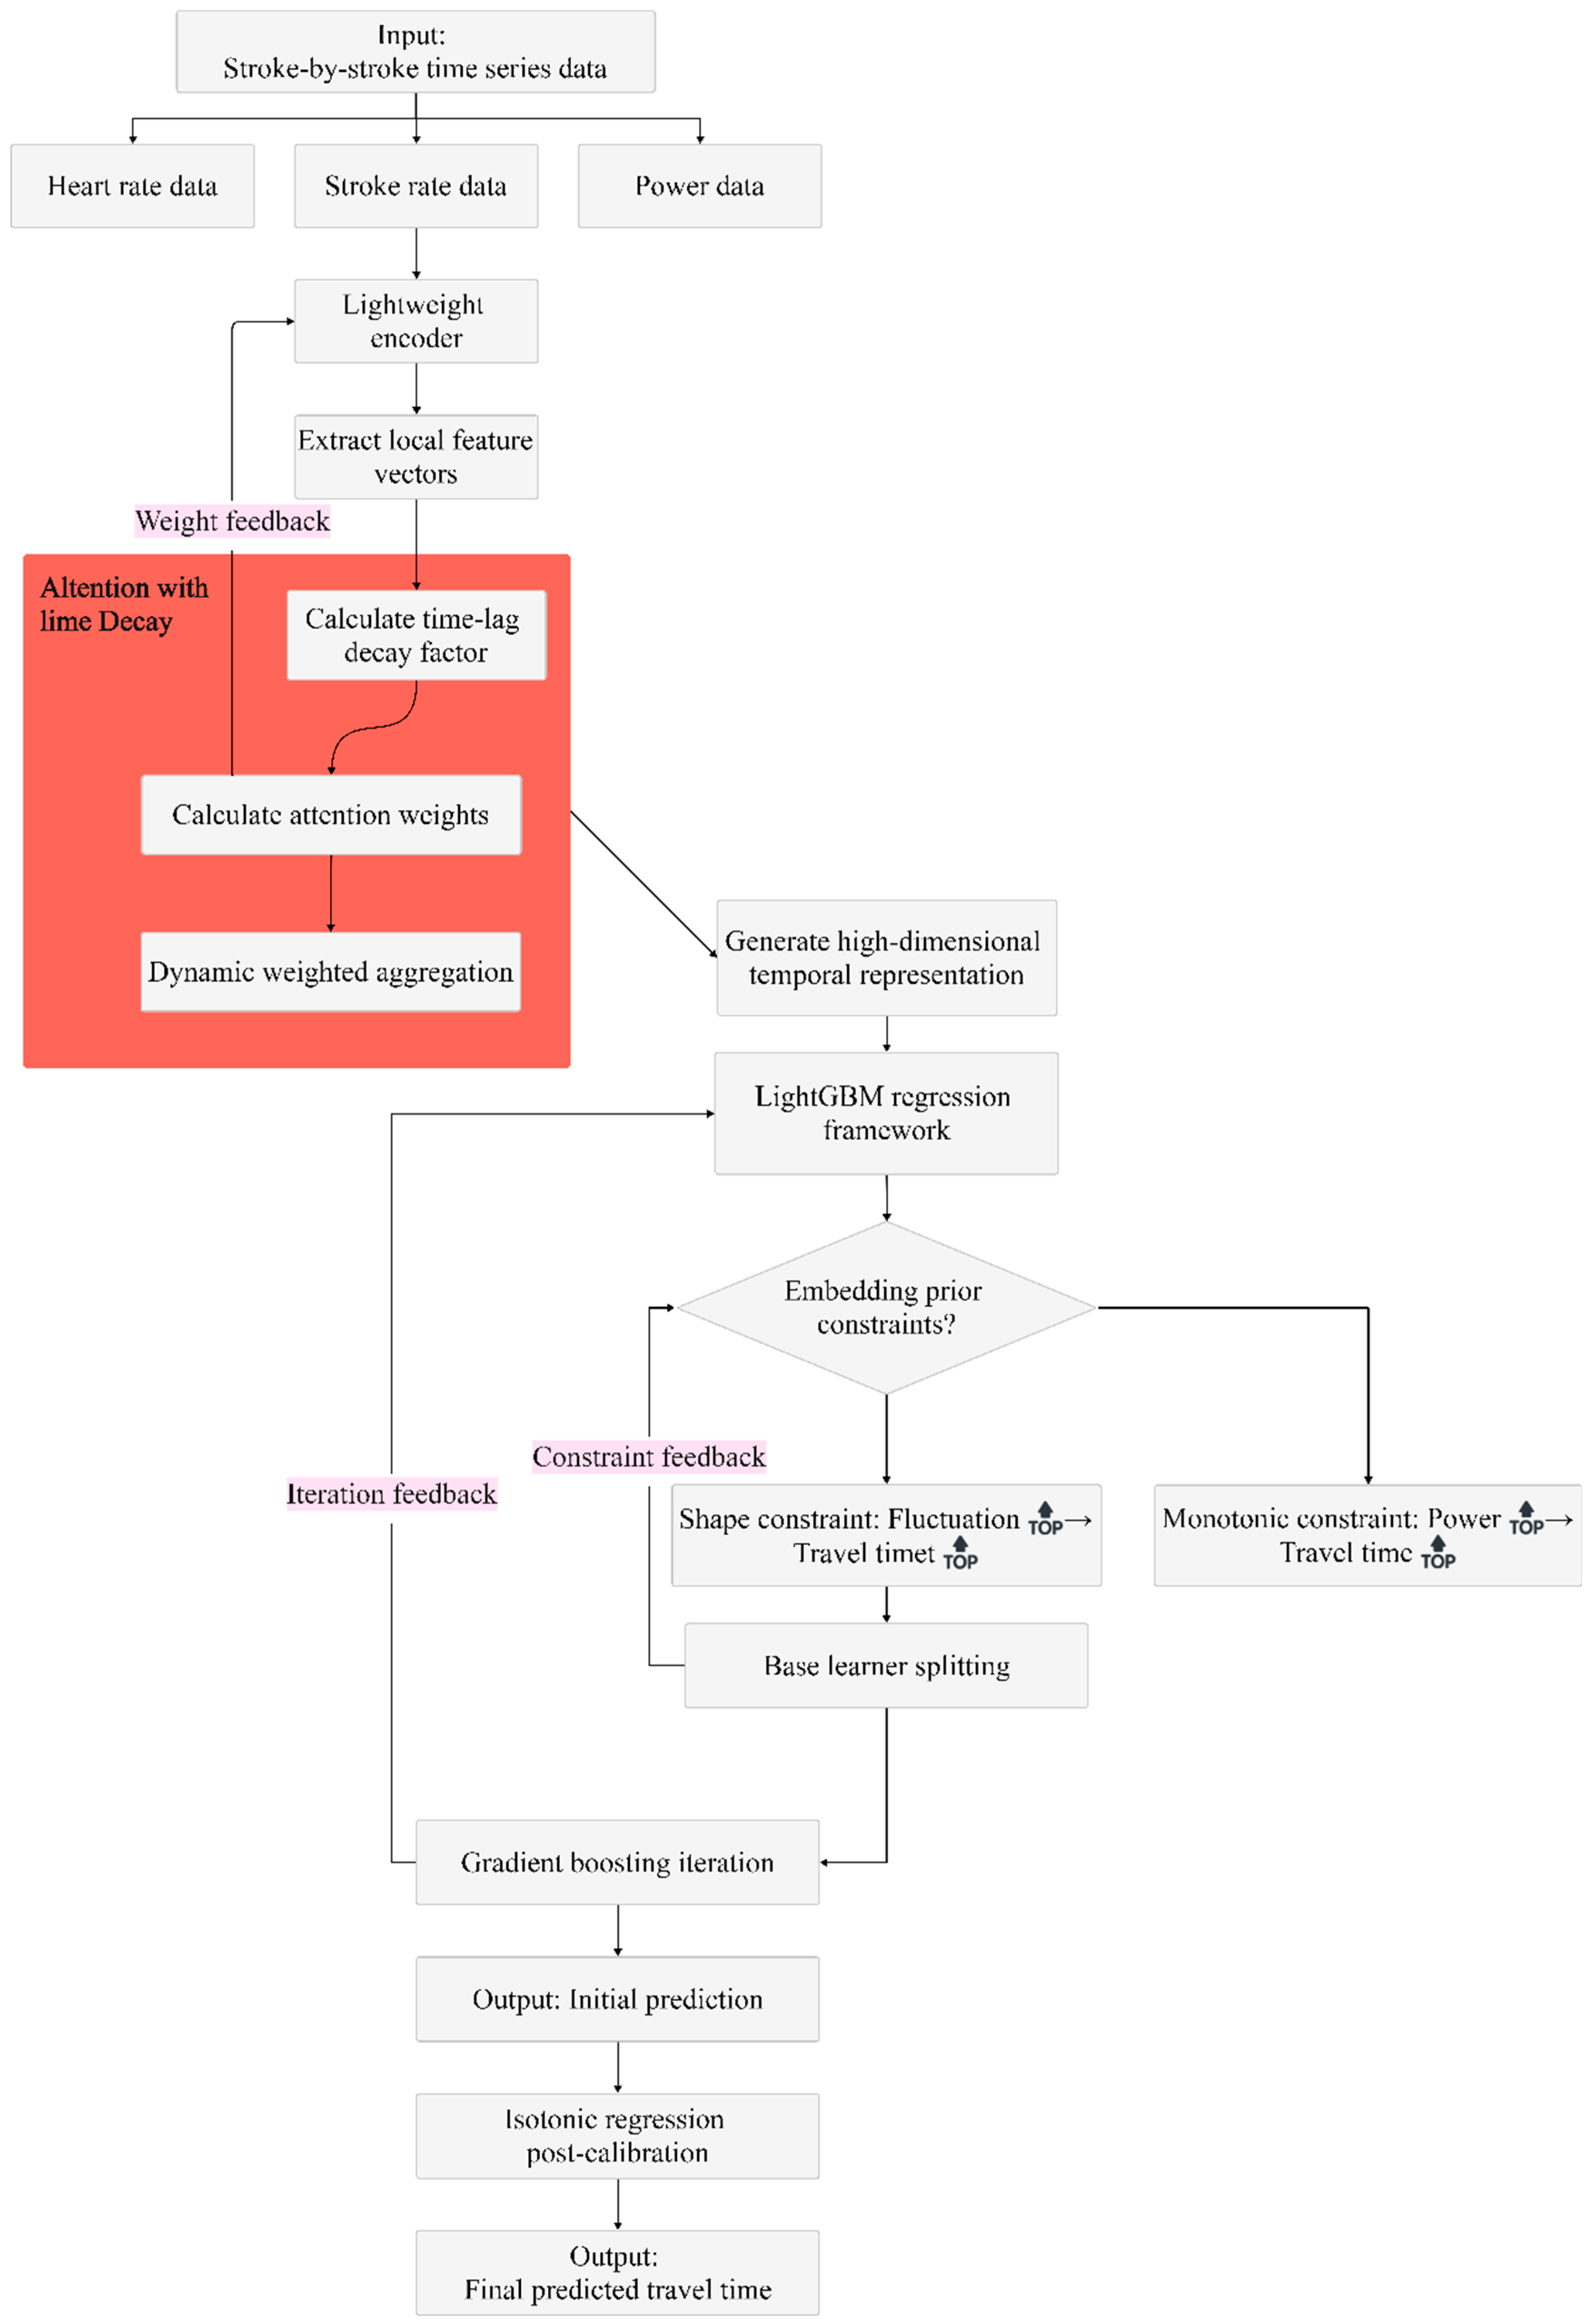
The SAP-MC model is a stable and interpretable regression framework based on Light Gradient Boosting Machine (LightGBM 3.3). By integrating the attention pooling mechanism of sequence, monotonicity, and shape constraints, it can improve the prediction performance and further enhance the logical consistency. Firstly, it starts from the continuous time series data collected in the pre-competition training process, including the power output of rowing class, rowing frequency, and heart rate, and introduces the sequential attention pooling module for processing. This module firstly extracts local feature representation from each time segment by using a lightweight encoder, and then carries out weighted aggregation by introducing the attention weight of the time attenuation factor, and finally forms a high-dimensional embedded representation that can effectively describe the dynamic state of training [24,25,26]. This mechanism enables the model to automatically identify and strengthen the training stages that are closer to or more relevant to the competition situation, thus transforming the original input from static statistical characteristics into structured sequence signals with explicit time dependence and intensity changes. In particular, key training segments such as the middle stage of stability and the late stage of acceleration can be highlighted adaptively, because these stages have a stronger influence on the final performance of the game. In the regression modelling stage, monotonicity and shape constraints are directly embedded in the LightGBM framework, and the consistent directional constraints between key variables and target output are realized by introducing physiological and training priors in the decision tree splitting process. For example, the increase of average power is constrained to correspond to the decrease of competition time, while the increase of power output volatility corresponds to the extension of competition time [27,28]. By introducing such constraints, the model effectively avoids the mapping correlation that is not in line with physiological laws caused by complex feature interaction, and enhances the robustness of extrapolation in the region where no data is seen, thus providing more explanatory guidance for training optimization and pre-competition preparation. Finally, the model output is post-processed based on isometric regression to achieve sequence consistency calibration. This step keeps the strict monotony correlation, keeps the prediction results consistent with the overall distribution of the real competition time, and corrects the slight systematic deviation, thus generating a result with a reasonable prediction interval and more suitable for the actual athlete monitoring scene. The overall implementation process of the SAP-MC model is shown in Figure 1, which integrates dynamic feature extraction, time attention weighting, monotonic constraint learning, and calibration regression, and realizes high-precision and highly interpretable prediction of competitive performance.
The SAP-MC framework combines a sequential attention pooling module and a monotonous shape constraint mechanism in a gradient lifting architecture. This design can effectively realize the mapping correlation between the power sequence of paddle-level training and the competition time, and combine the depth-time feature extraction ability and interpretable prediction logic. The prediction system is consistent with the known basic principles of physiology and training, so it is reasonable in methodology and has good operability and application value in practical applications.

3.1.2. Mathematical Modelling of the SAP-MC Model

The mathematical form of the SAP-MC model consists of two core parts: a sequential attention pooling module and a monotonic constrained regression module. Before the model is built, all input features are preprocessed according to the process described in Section 3.2.1, including missing value filling, outlier elimination, and feature building. This preprocessing process ensures the continuity of sequence data in the time dimension and improves the statistical stability of the constructed feature representation. Let the j-th sample be represented as a stroke-level sequential input denoted by x j , t , where t = 1 , T j denotes the sequence length of sample j . Each x j , t is a multi-dimensional feature vector at time step t , containing key physiological and mechanical variables such as stroke power, stroke rate, and heart rate.
x j , t = P j , t ,   S P M j , t ,   H R j , t
represents power, stroke rate, and heart rate, respectively. The lightweight encoder ϕ ( ) maps the raw stroke vectors into a latent representation:
h j , t = ϕ ( x j , t ) , h j , t R d
To emphasize heterogeneity across different training stages, a temporal-decay attention mechanism is introduced for weighted aggregation. The attention weight α j , t is computed as:
α j , t = exp q h j , t λ ( T j t ) τ = 1 T j   e x p q h j , τ λ ( T j τ )
where q R d is a learnable query vector, and λ > 0 is a temporal decay factor that emphasizes strokes closer to the race [29]. The final sequence-level representation is then:
z j = t = 1 T j   α j , t h j , t
After obtaining the sequence representation z j , it is concatenated with global statistical features g j   =   [ m e a n p o w e r , c v p o w e r , b e s t i n t e r v a l p a c e , a c w r ] to form the comprehensive input:
u j = [ z j , g j ]
A monotonic-constrained gradient boosting regression model F ( ) is then used to predict race duration:
y ^ j = F ( u j )
where y ^ j represents the predicted race duration. Monotonic constraints are defined as:
y ^ j m e a n p o w e r 0 , y ^ j c v p o w e r 0
ensuring that increases in mean power reduce race duration, while larger power fluctuations extend it. These constraints are enforced via shape restrictions on the base learners’ splitting directions, embedding physiological knowledge directly into the model structure [30].
Finally, isotonic regression is applied for post-hoc calibration, defining a monotonic function, on ψ ( ) to align predictions with the true distribution:
y j ψ ( y ^ j )
where y j denotes the actual race duration. This calibration ensures that predictions are globally consistent with the labels while strictly preserving monotonicity.
Generally speaking, the distribution of attention weight in the SAP-MC model reflects the relative contribution of paddle power, paddle frequency, and heart rate to competition performance in different training stages. At the same time, the gradient structure guided by monotone constraints describes the directionality and sensitivity of the correlation between average power and power variability. Through the joint interpretation of these two parts of information, the model can identify the key stages of pre-competition training and clarify the quantitative correlation between these stages and competition time. This provides a theoretical and interpretable analytical framework for establishing the correlation between training monitoring signals and competitive performance results.

3.2. Experimental Design

3.2.1. Data Collection and Preprocessing

Considering the strict data protection laws and regulations of athletes’ information, this study does not use any sensitive training log data involving individual privacy, but uses publicly available data sets to verify the proposed SAP-MC model. The data comes from the Row Pro Row File Library (http://www.digitalrowing.com/download/rowfiles.htm (accessed on 12 July 2025)), which provides detailed indoor rowing dynamometer records and official race results data. These data mainly come from representative indoor rowing competitions such as Crash-B (Charles River All-Star Has-Bees International Indoor Rowing Championships) and BIRC (British Indoor Rowing Championships). The recorded content is the data of rowing class competition based on a dynamometer, which mainly corresponds to the standard 2000 m race. All data are collected by the Concept2 rowing dynamometer, which ensures the consistency of measurement environment between samples. Each sample is stored as a structured “.row” file, in which a single file corresponds to an athlete’s complete performance. Because the data set comes from the indoor dynamometer environment, there is no traditional difference between boat types (such as sculling or sculling). In addition, the data can be regarded as a mixed-ability crowd sample under the condition of unified equipment because there is no clear label for athletes’ classification. Therefore, the modelling goal of this study focuses on capturing the overall statistical law between heterogeneous performance levels, rather than hierarchical analysis based on competition categories. At the same time, the RowPro data is essentially derived from the indoor dynamometer environment, and its recording process does not include environmental factors such as wind and waves, water flow, hull attitude changes, and multi-person collaborative rowing in real water rowing. Therefore, the current experimental results are more suitable for the analysis of the training load correlation under controlled conditions.
These Rowfile files are essentially in XML format and contain two key types of information:
(1)
Global metadata, including total distance, total race time, athlete-related identifiers, and training or competition type. These variables are used as target labels and contextual features for predictive modelling.
(2)
Stroke-level dynamic data, which record time-stamped physiological and mechanical variables such as power output, pace, stroke rate, and heart rate. These data fully characterize the temporal structure and intensity variation of pre-competition performance.
XML files are parsed individually to construct two structured datasets:
  • A global summary table, where each row corresponds to a single sample and contains aggregated race-level information such as total distance and total time.
  • A long-format stroke sequence table, where each row represents a stroke-level record. Sequence data are linked to the global table via a unique file identifier.
Table 1 summarizes the field mapping used in SAP-MC. The global summary table is used as the input of the LightGBM regression module to capture static and aggregation features, while the stroke-level sequence table is used as the input of the sequential attention concentration module to model time dynamics. The total competition time is directly used as the prediction target to ensure the consistency between model design and actual performance evaluation.
Before model input, additional consistency preprocessing is performed on both stroke-level sequences and aggregated statistical features. First, missing heart rate (HR) values and locally discontinuous timestamps in the stroke-level sequences are imputed using forward filling. To ensure the integrity and structural consistency of the sequence, samples with a high proportion of missing values or serious time segment breaks are eliminated. Secondly, the abnormal values in power output and pace are identified and cleaned up. Specifically, extreme values (such as sudden power spikes or abnormal readings with zero power) that obviously deviate from the physiologically reasonable range are filtered to reduce the interference of measurement noise on model training. In the feature construction stage, mean_power is defined as the arithmetic average of the power sequence of the paddle stage, which is used to characterize the overall output level; Cv_power is defined as the ratio of standard deviation to mean value, which is used to describe the power stability and internal fluctuation degree during rowing. Because the LightGBM model is insensitive to the feature scale, no additional normalization or standardization is carried out. However, all features have been processed by unit consistency and range verification to ensure comparability between different samples.
In the model training and evaluation stage, the data are randomly divided into a training set, a verification set, and a test set according to the sample level, and the proportions are about 70%, 20%, and 10%. Among them, each sample corresponds to a complete “.row” file, representing a complete competition sequence. The division is done at the file level, not at the paddle level, thus ensuring that a single time series will not be split into different data subsets. This strategy effectively avoids the problem of information leakage caused by overlapping time series. In addition, all baseline models and proposed models are evaluated under the same random partition settings to ensure the fairness and consistency of performance comparison.

3.2.2. Ablation Experiments for SAP-MC

In order to evaluate the contribution of each core module in the proposed SAP-MC model, a series of ablation experiments was designed. All experiments are conducted on the same paddle-level sequence data and global statistical characteristics, and the data division and training configuration are consistent, and only the model structure is differentiated to ensure the fairness and controllability of the comparison. The specific model settings are as follows:
(1)
Baseline model: the standard gradient lifting regression model is adopted, and the global feature vector obtained by a simple average of the paddle level sequence is taken as input. This model does not introduce an attention mechanism, nor does it contain monotone constraints.
(2)
w/o Attention mechanism: the attention pooling module of the sequence is removed, and the paddle-level sequence is aggregated by equal weight average, but the gradient lifting regression framework is still retained to evaluate the contribution of time modelling ability.
(3)
w/o Monotonicity: The attention pooling mechanism is retained to extract time features, but monotonicity and shape constraints are removed, so that the model can learn the correlation between input features and competition time without physiological constraints.
(4)
SAP-MC (complete model): The proposed complete model combines the sequential attention pooling mechanism and monotonous constraint mechanism in the gradient lifting framework.
The performance of the model is comprehensively evaluated by three commonly used regression evaluation indices, including mean square error (MSE), mean absolute error (MAE), and determination coefficient (R2), so as to comprehensively measure the prediction accuracy and explanatory power.
The results reported in Table 2 show that during pre-competition training, the sequential attention concentration mechanism plays an important role in capturing the key parts of stroke level power output and heart rate variability. Compared with the w/o attention variant (which relies on simple sequence aggregation average), the proposed attention-based model achieves about 6% improvement in R, while MSE and MAE are significantly reduced. These results show that explicit modelling of time dependence can more accurately represent performance-related dynamics. In addition, the combination of monotone constraints effectively suppresses the physically inconsistent mapping caused by the interaction of complex features, thus improving the prediction stability, especially in the case of extrapolation. This shows that embedding physiological priors into the learning process enhances the robustness and interpretability of the model. Finally, the complete SAP-MC model achieves the best performance in all evaluation indexes, which proves that the integration of a sequential attention pool and monotone constraints realizes effective dynamic feature extraction and consistent prediction behaviour. Generally speaking, the proposed model provides a powerful analytical framework for describing the correlation between training load and competition results.
After the ablation study, before the final test and analysis, an additional evaluation was made according to different random data division schemes. The results show that the changes of MSE, MAE, and R of different segments are still very small, and the overall performance trend is consistent, and no obvious decline is observed. This shows that the proposed model shows strong robustness in sub-sample distribution under the current data set.

3.2.3. Experimental Environment and Hyperparameter Settings for SAP-MC

In order to ensure the repeatability and reliability of experimental results, all models are trained and evaluated in a unified hardware and software environment. The controlled experiment setup ensures the consistency between different experiments and minimizes the potential fluctuation caused by system-level differences. At the same time, the key hyperparameters of the proposed SAP-MC model are systematically configured and tuned. The specific experimental environment settings and model hyperparameter configuration are summarized in Table 3 and Table 4, respectively.

3.2.4. Statistical Analysis Methods

In order to ensure the consistency of statistical analysis and the rationality of result interpretation, all statistical calculations in this paper are based on the sample level. Each row file corresponds to a complete sample, and the paddle-by-paddle sequence is only used to construct dynamic time series features, not directly as an independent statistical unit to participate in significance analysis. The specific statistical process is as follows:
(1)
In the attention analysis of the training stage, the attention weights of each sample in different stages are averaged, and then the mean, standard deviation, and 95% confidence interval of the whole stage are calculated. Since different stages come from the continuous rowing process of the same sample, the statistical results are mainly used to compare the overall weight distribution trend between stages. One-way ANOVA (Analysis of Variance) was used to analyze the significance of stage differences, and the Kruskal-Wallis nonparametric test was further used to verify the robustness, so as to reduce the influence of the normality hypothesis and homogeneity of variance on the results.
(2)
In the marginal gradient analysis under monotonic constraints, the local gradient response of each sample’s corresponding feature is first calculated based on the LightGBM model under monotonic constraints, and then the gradient results of all samples are statistically summarized. The average gradient, 95% confidence interval, and p-value are all posterior statistical analysis results after the model training is completed, and are not direct output functions of the LightGBM library.
(3)
The 95% confidence interval is estimated by the normal approximation method based on the gradient empirical distribution, and the p-value is evaluated by the one-sample t-test to evaluate whether the average gradient deviates significantly from zero. Considering that the predicted response of the tree model has piecewise characteristics, the local gradient distribution may have certain discreteness and skewness, so the relevant statistical results are mainly used to describe the overall gradient change trend, rather than strict probability distribution inference.
(4)
All statistical analysis in this paper is completed in a Python 3.9 environment, and the statistical significance level is uniformly set to p < 0.05.

4. Results

4.1. Analysis of Training Phase Contributions via Attention Weight Distribution

In order to explore the attention distribution of the SAP-MC model in different stages of the rowing sequence, this study divided the 2000 m race into four different stages according to the characteristics of special sports load. This division is helpful to explain and analyse the importance of time in rowing order sequence at the stage level. Table 5 summarises the statistical distribution of attention weight in each stage as follows.
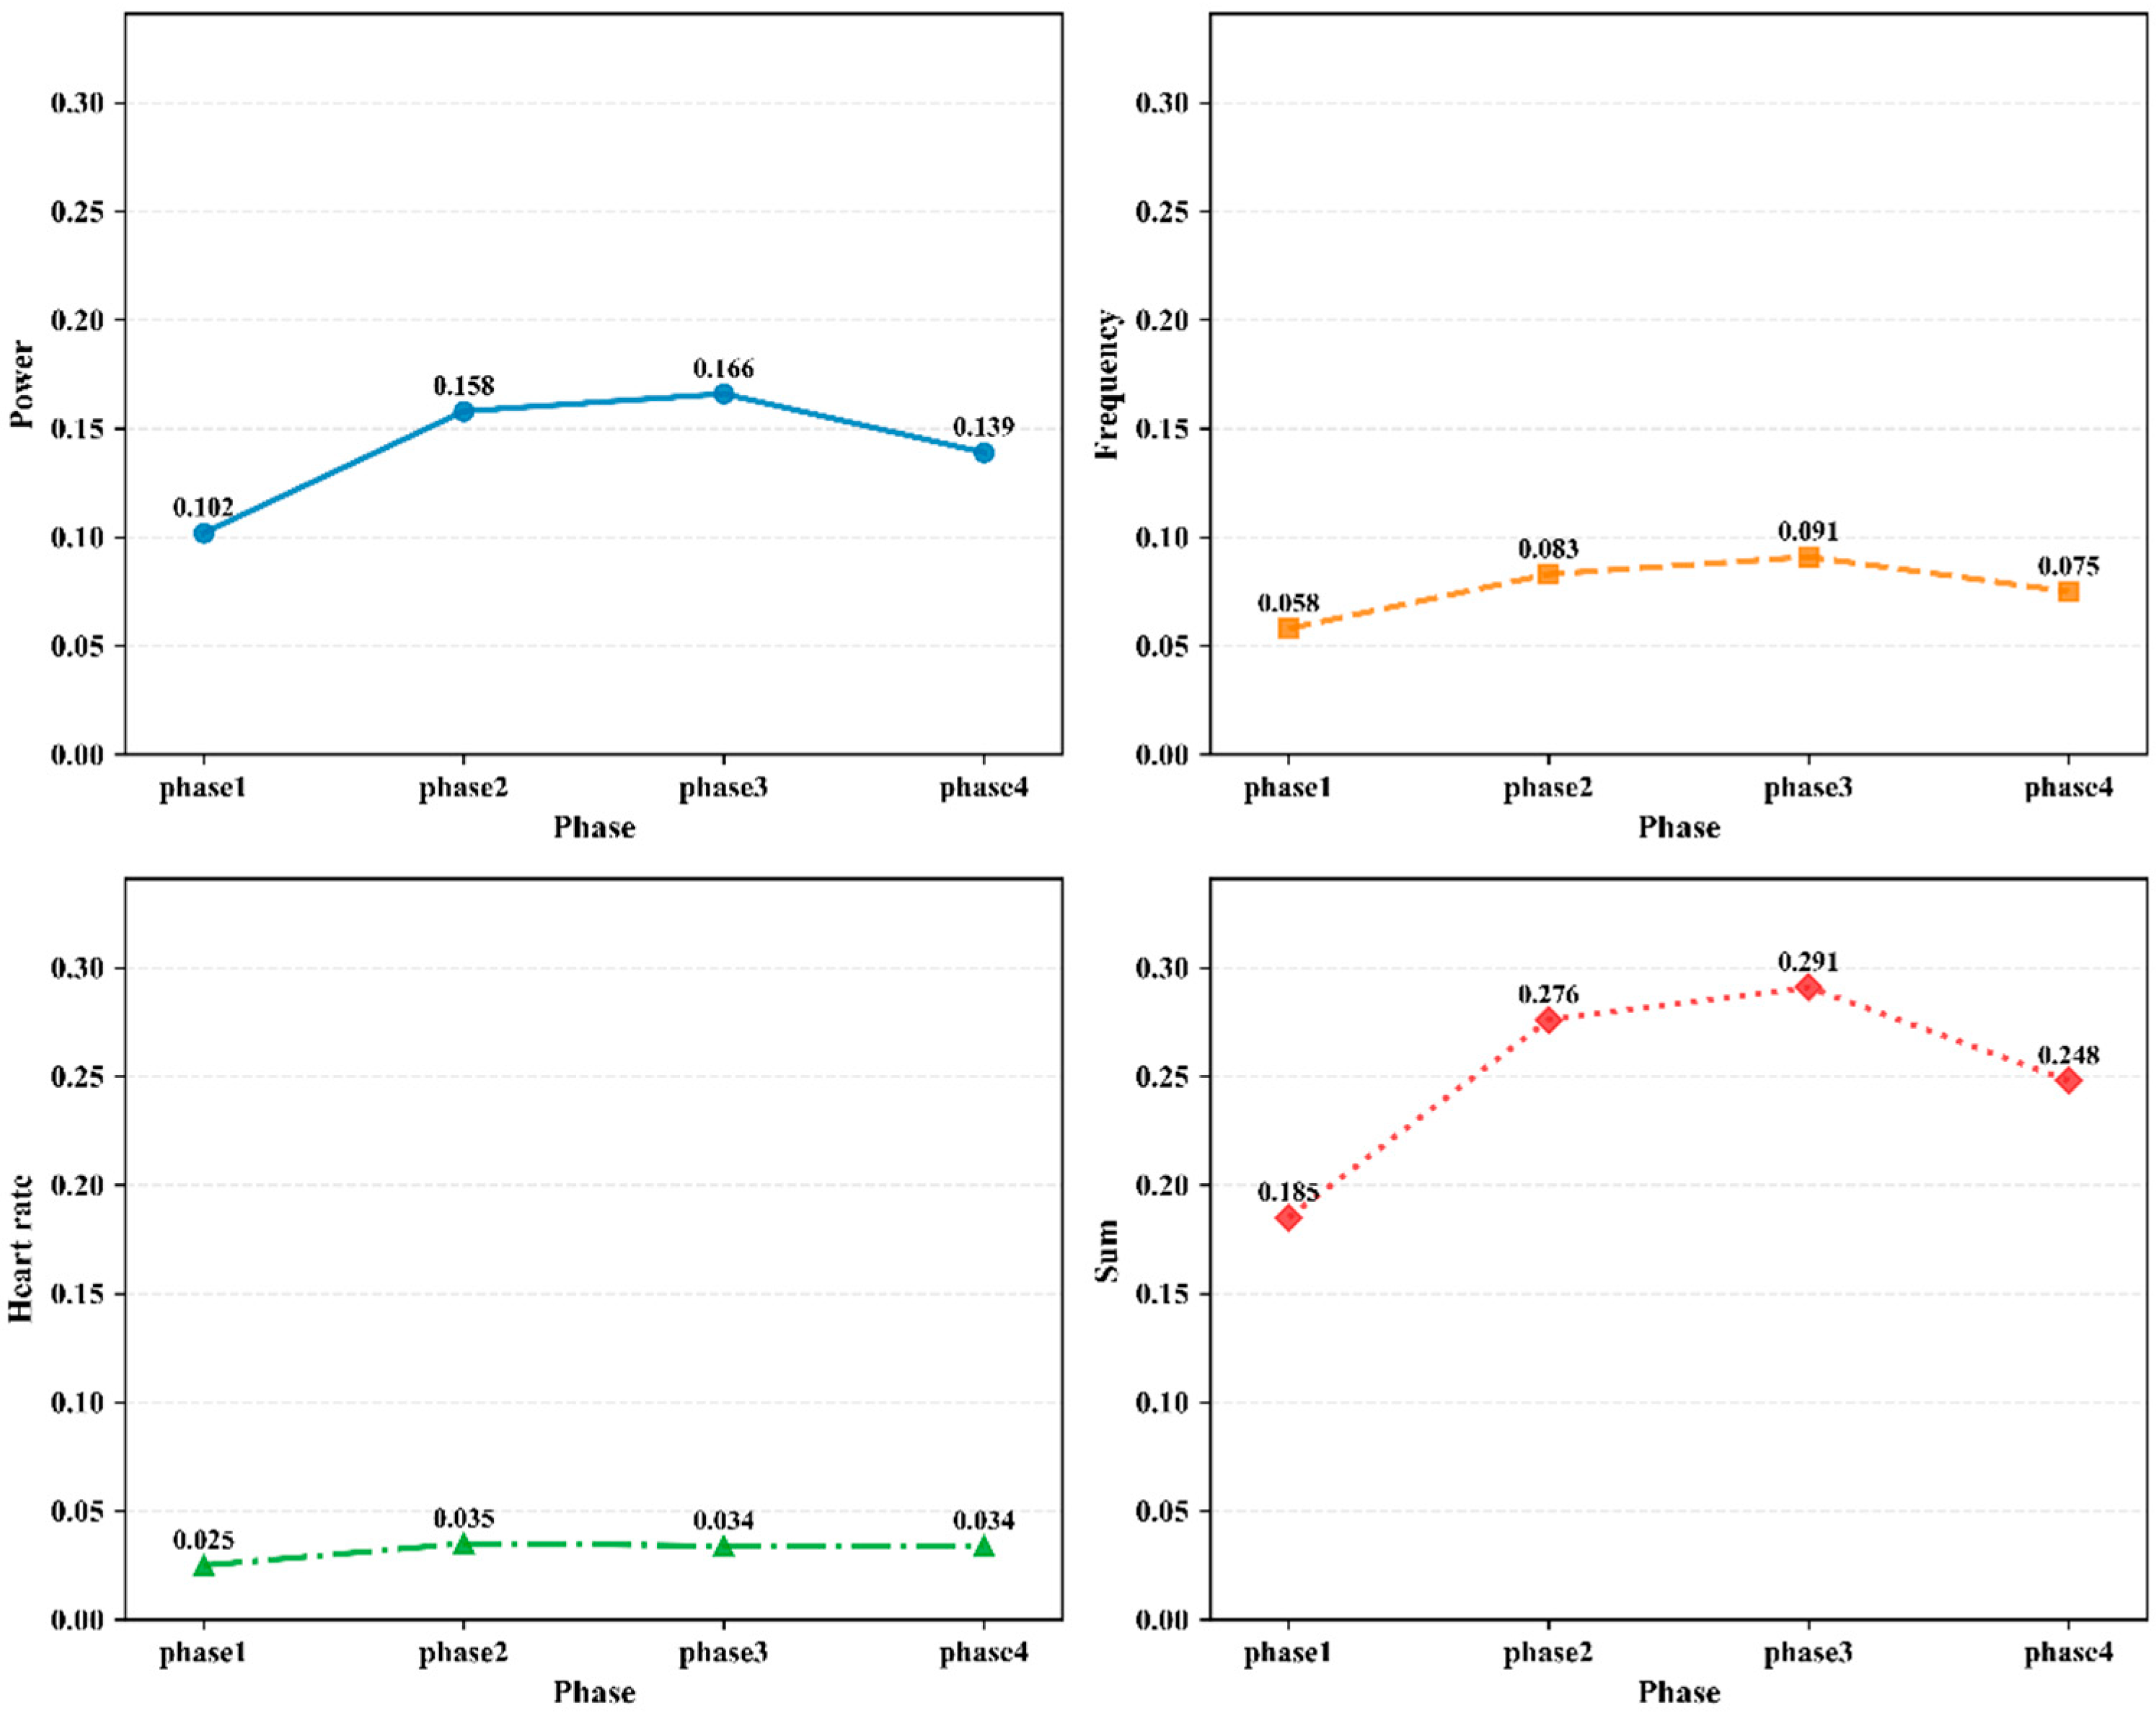
The results in Table 5 show that the attention weight allocated in the acceleration stage and maintenance stage is significantly higher than that in the initial stage and sprint stage (p < 0.01), and the average weight in the maintenance stage is the highest (0.291). This distribution shows that the model pays more attention to the stability of the load in the middle of the game when judging the final competition time. Although the initial stage needs high explosive power to establish the rhythm of the game, its direct contribution to the final result is relatively limited. Although the attention weight in the sprint stage is higher than that in the initial stage, it is still lower than that in the acceleration stage and maintenance stage, which shows that the performance in the later stage depends largely on the energy reserves accumulated in the previous stage. In addition, to reduce the influence of the normality hypothesis and homogeneity of variance on the statistical results, this study further uses the Kruskal-Wallis nonparametric test to verify the difference of stage weights, and the results also reach a significant level (p < 0.001). This indicates that the difference of attention distribution between different training stages has good statistical robustness. Figure 2 further shows the decomposition results of characteristic contribution in different competition stages, and depicts the attention distribution ratio of power output, rowing frequency, and heart rate in each stage.
The results in Figure 2 show that the paddle power always has the highest attention weight contribution across all competition stages, especially in the maintenance stage, where its value reaches 0.166, accounting for more than half of the total attention weight in this stage. In contrast, the contribution of rowing frequency and heart rate is relatively low, and their average attention weights are 0.091 and 0.034, respectively, indicating that their influence on model learning representation is limited. Although the contribution of paddle power decreased slightly (0.139) in the sprint stage, it remained dominant in all stages. Generally speaking, the model always gives priority to power-related signals in the whole competition sequence. In addition, the comprehensive contribution of the acceleration and maintenance stages exceeds 0.32, further verifying that rowing power is the core factor in determining the quality of pre-competition training load and competition performance.

4.2. Analysis of Power-Race Time Correlation Under Monotonic Constraints

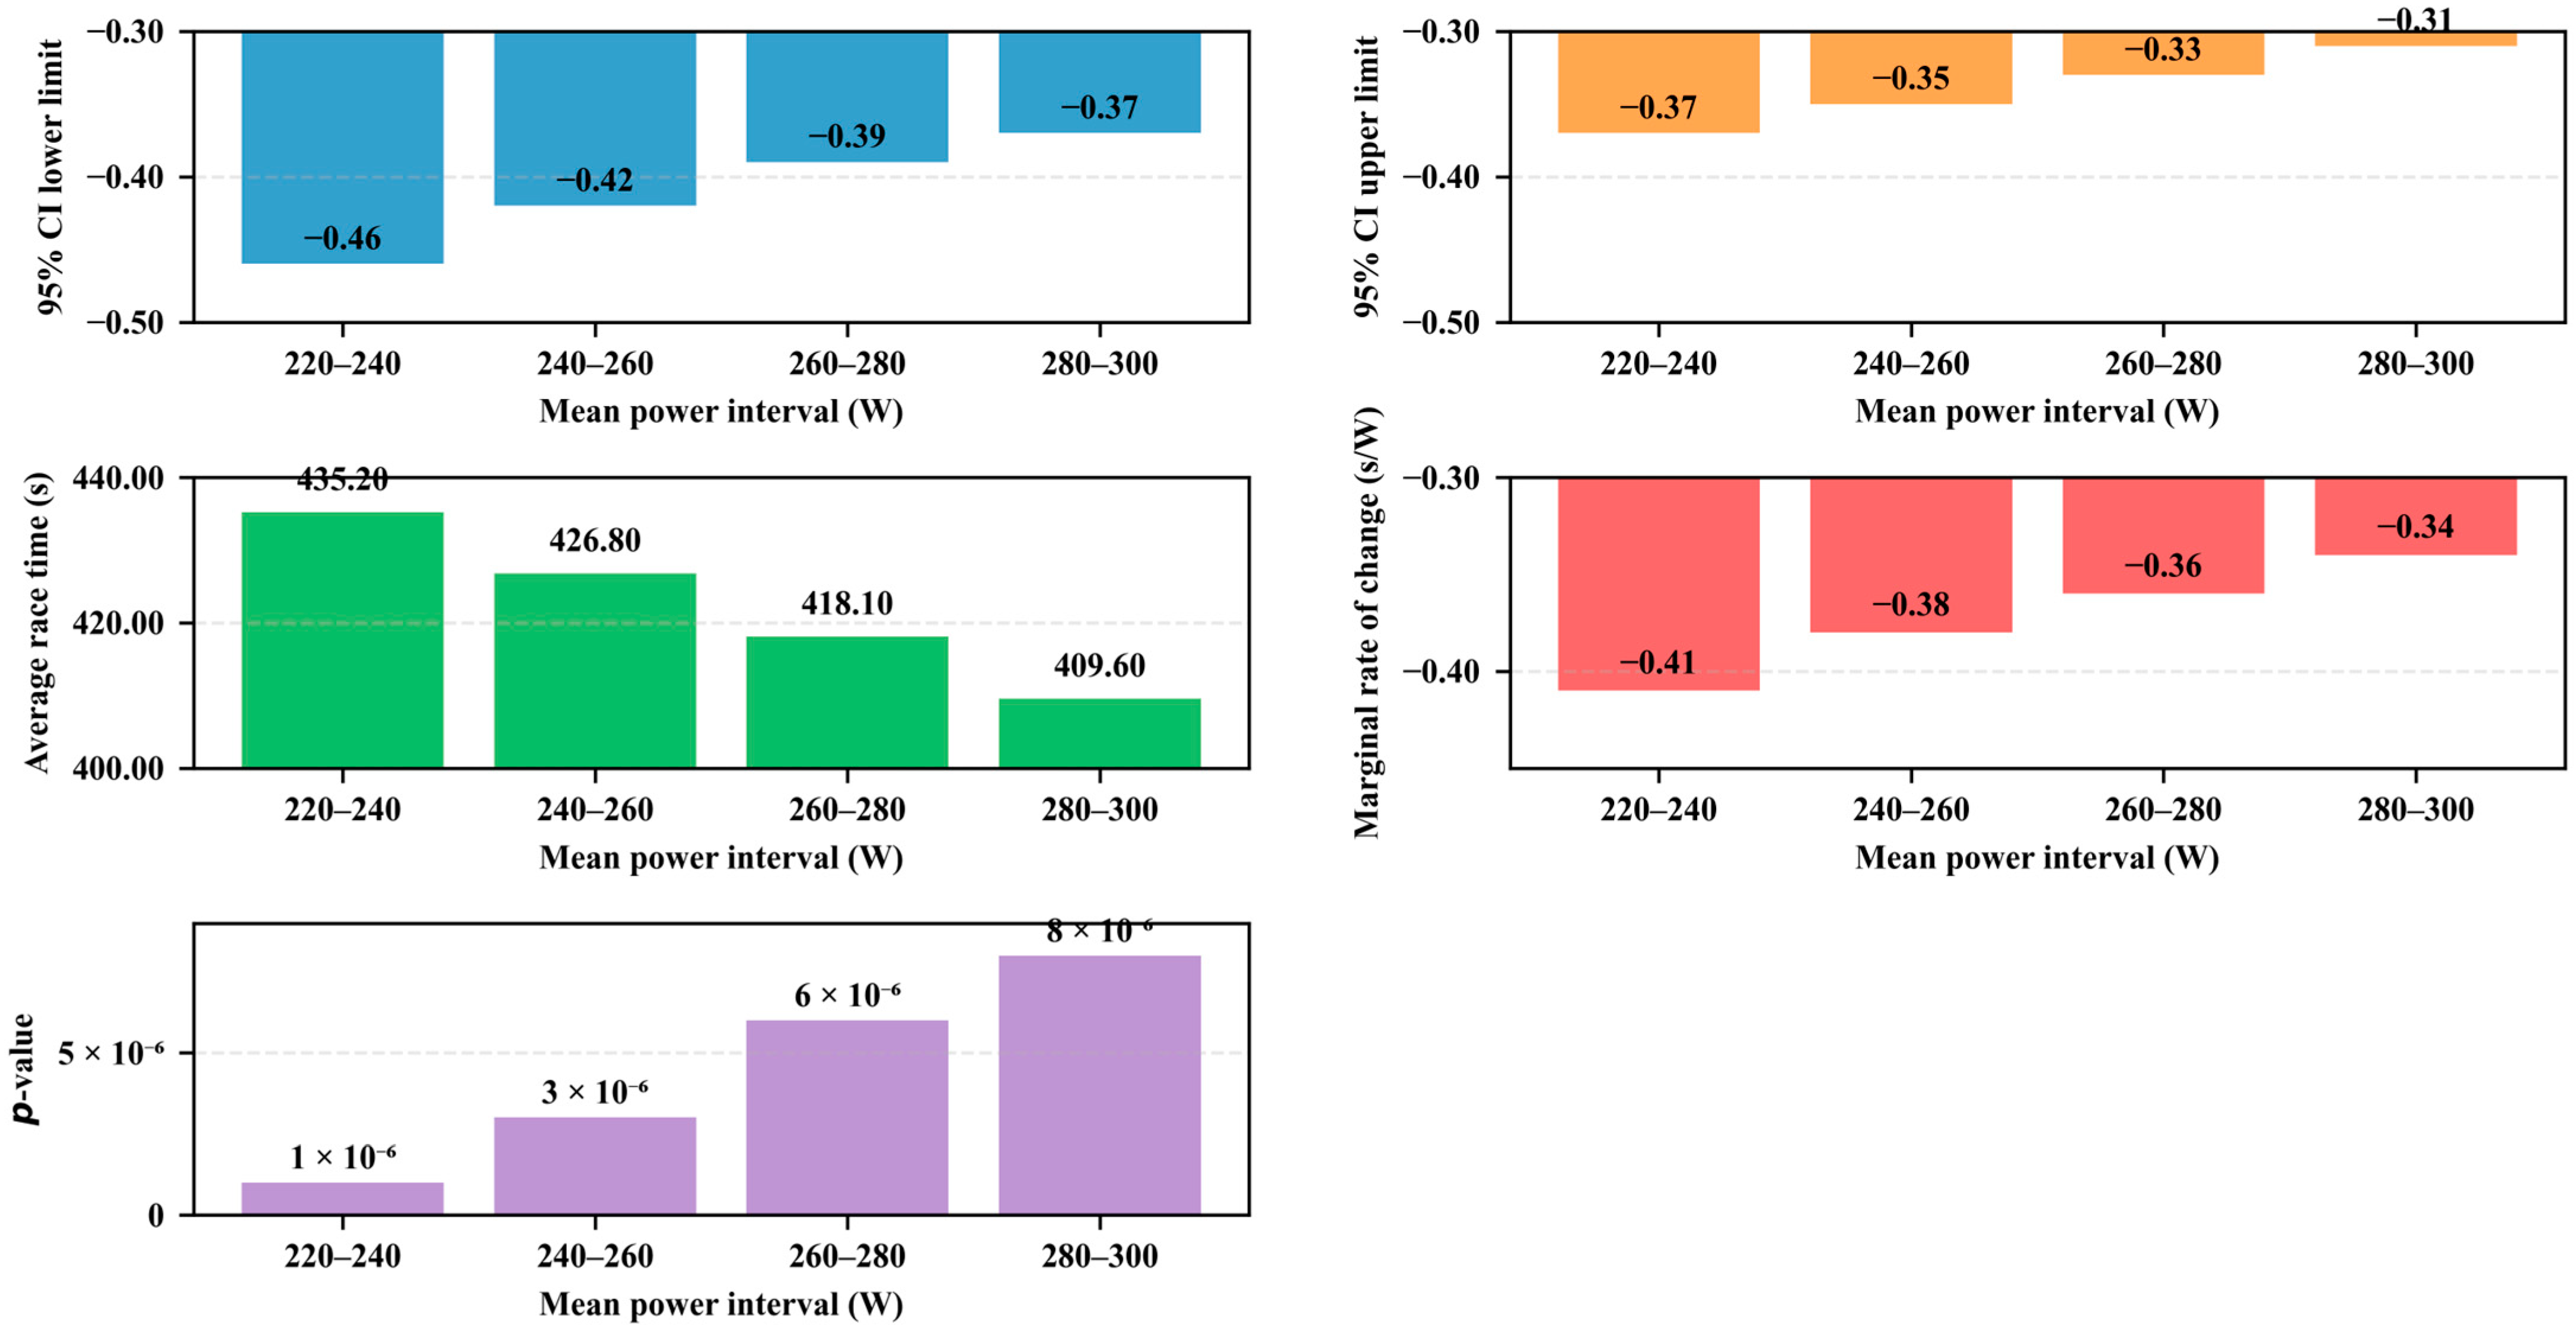
Under the condition of introducing monotone constraints, Figure 3 shows the changes in the average power output corresponding to the predicted race time in different intervals.
Figure 3 shows that there is a stable, monotonic negative correlation between the average power output and the competition time. When mean_power is increased from 220–240 W to 280–300 W, the competition time is reduced from 435.2 s to 409.6 s, with an overall decrease of 25.6 s. This result shows that power output is a key variable that is highly related to the change in sports performance. From the perspective of marginal effect, the influence of mean_power on the competition time is roughly between 0.41–0.34 s/w, and gradually converges in the high power range, reflecting the obvious diminishing marginal revenue effect. At a lower power level, a power increase of 20 W can shorten the time by about 8.2 s; However, at a higher power level, the same amplitude boost only corresponds to a time improvement of about 6.8 s. Although the marginal effect decreases with the increase of power, the overall negative correlation is still statistically significant (p < 0.001). This result further shows that the average power is not only an important variable to predict the competition results, but also an effective index to distinguish the athletes’ competitive level.
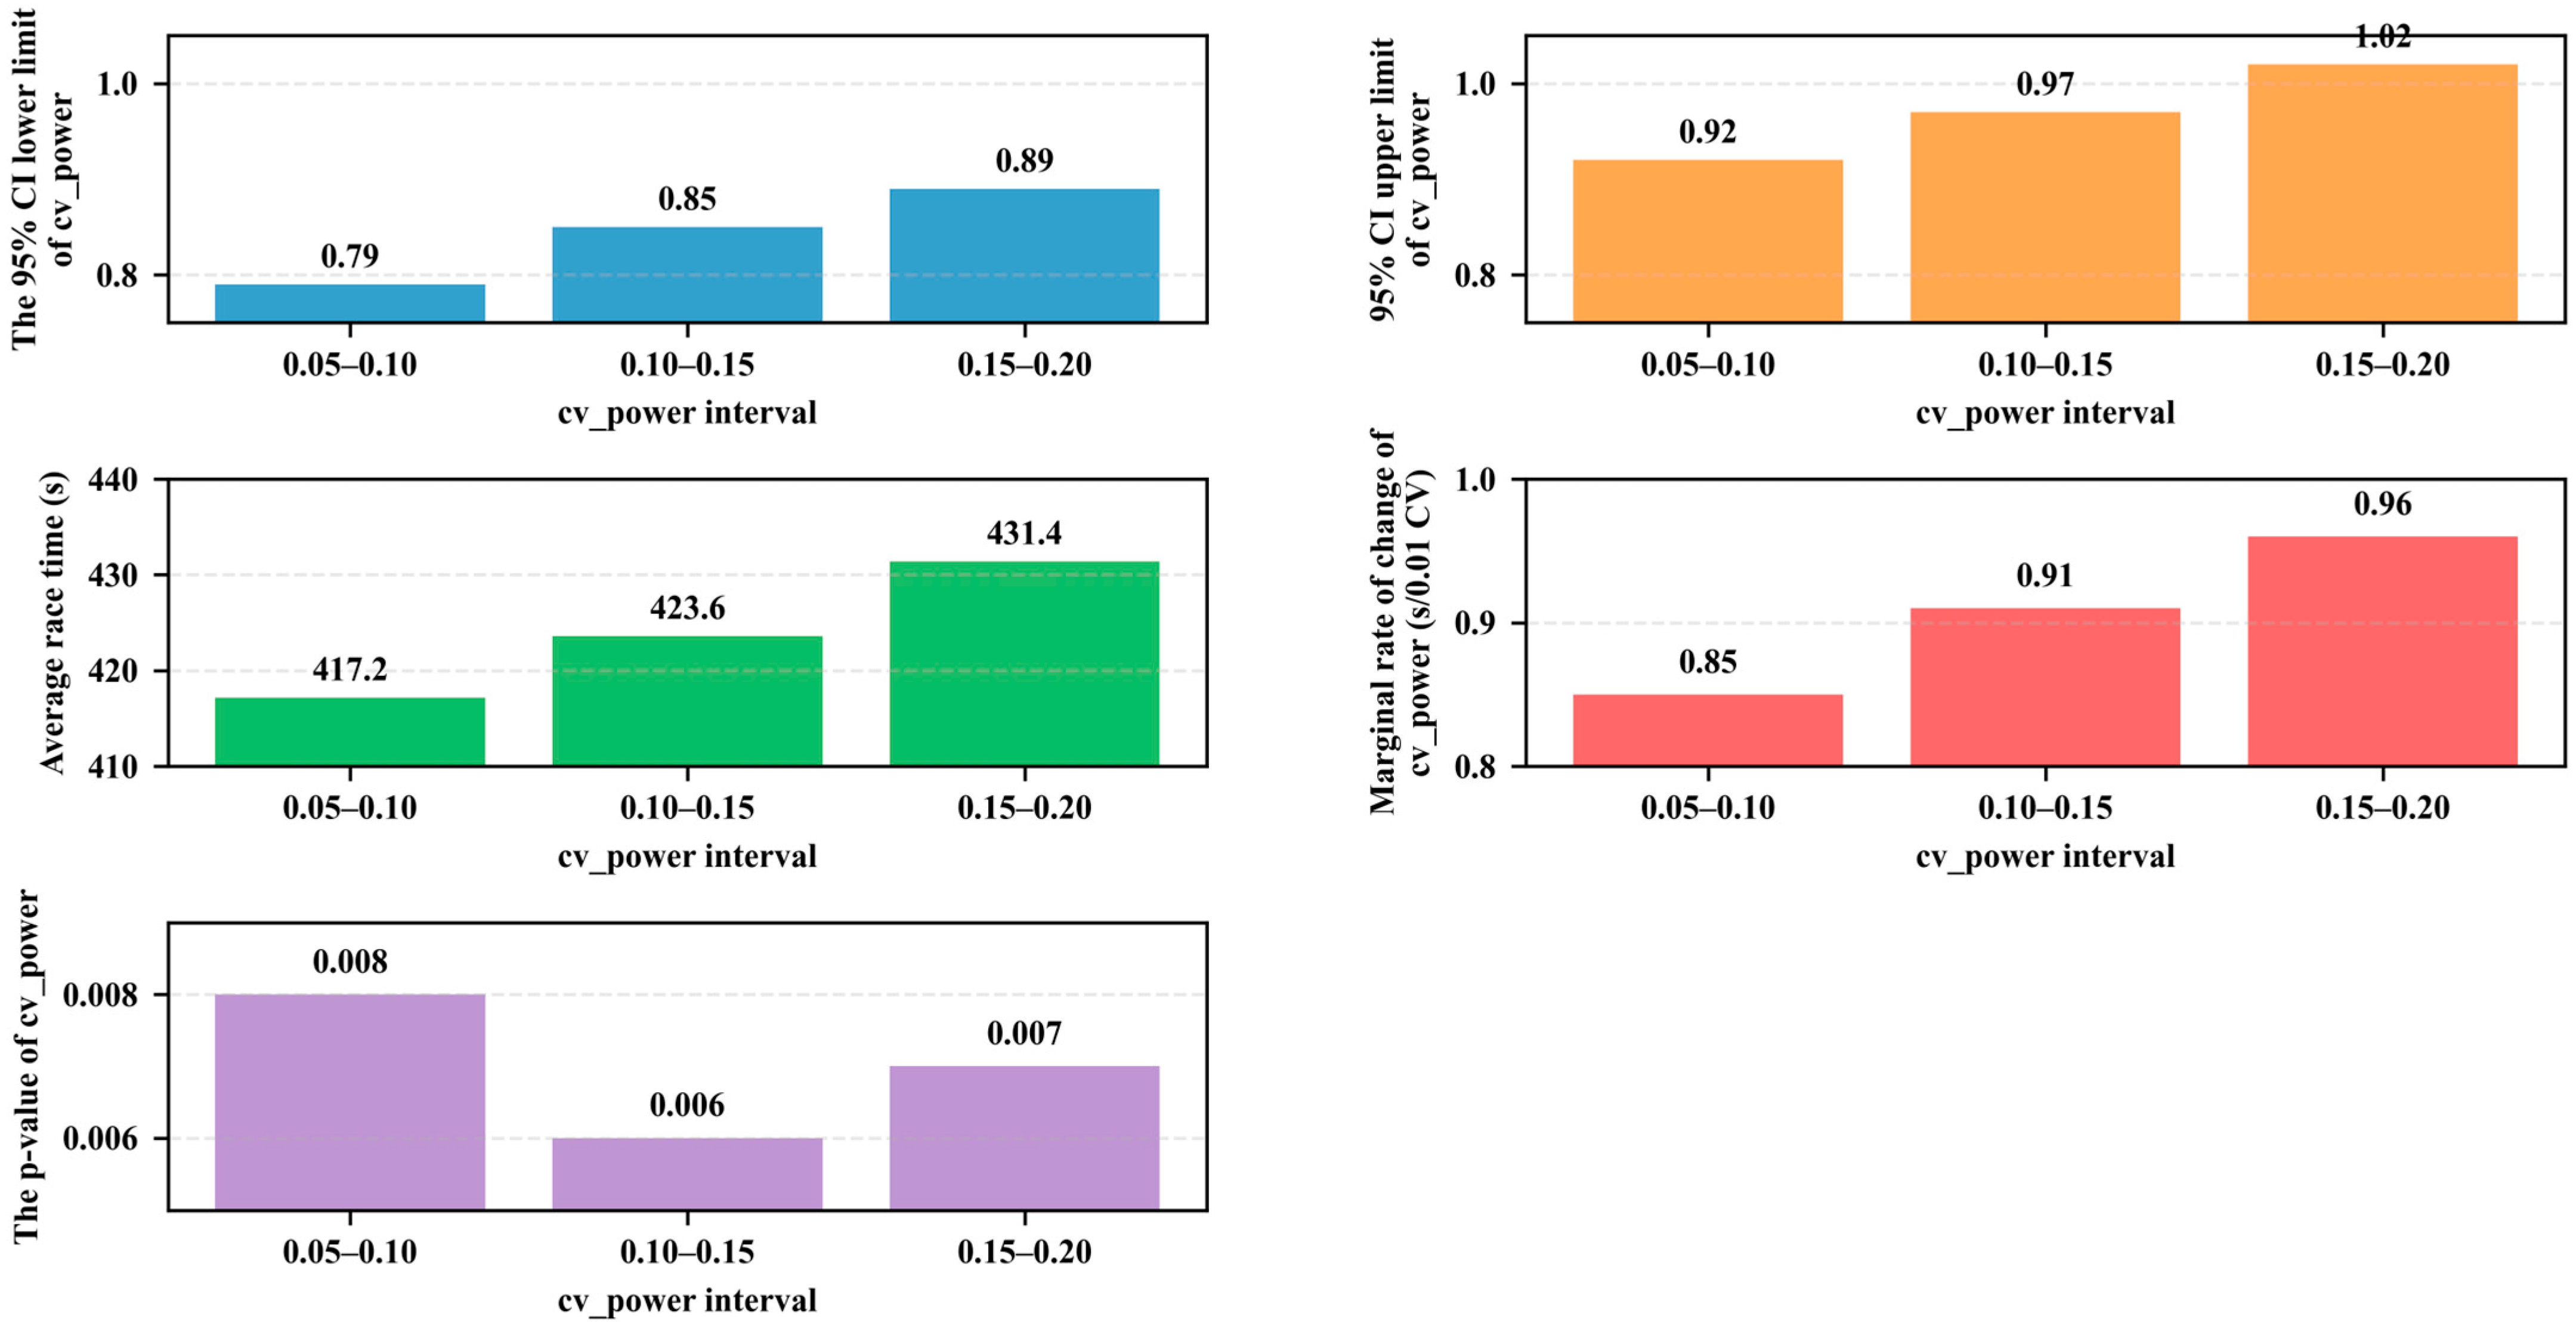
In terms of stability, the effect of cv_power on race time is further illustrated in Figure 4.
Figure 4 demonstrates that power variability (cv_power) has a statistically significant positive effect on race time. As cv_power increases from the range of 0.05–0.10 to 0.15–0.20, race time rises from 417.2 s to 431.4 s, corresponding to an overall increase of 14.2 s. This result indicates that insufficient power stability is generally associated with degraded race performance. The estimated marginal effect shows that the competition time will be extended by about +0.85 to +0.96 s for every 0.01 increase in power variation coefficient, which shows that the adverse effects of power fluctuation have strong consistency under different variation levels. This correlation is statistically significant (p < 0.01), which further verifies that power stability is an important determinant of competition time. These results emphasize that it is very important to maintain a stable rowing rhythm and continuous power output during training. Excessive power fluctuation may hurt sports performance by weakening energy utilization efficiency and reducing the effectiveness of training strategies. In addition, stable power output helps to improve the pace control ability and promote a more predictable physiological adaptation process, thus enhancing the stability and reliability of competition results. At the same time, it also provides a basis for coaches to formulate more personalized training programs, which is helpful to reduce the potential risk of performance fluctuation.
Finally, the correlation between training load balance, measured by ACWR, and race time is presented in Figure 5.
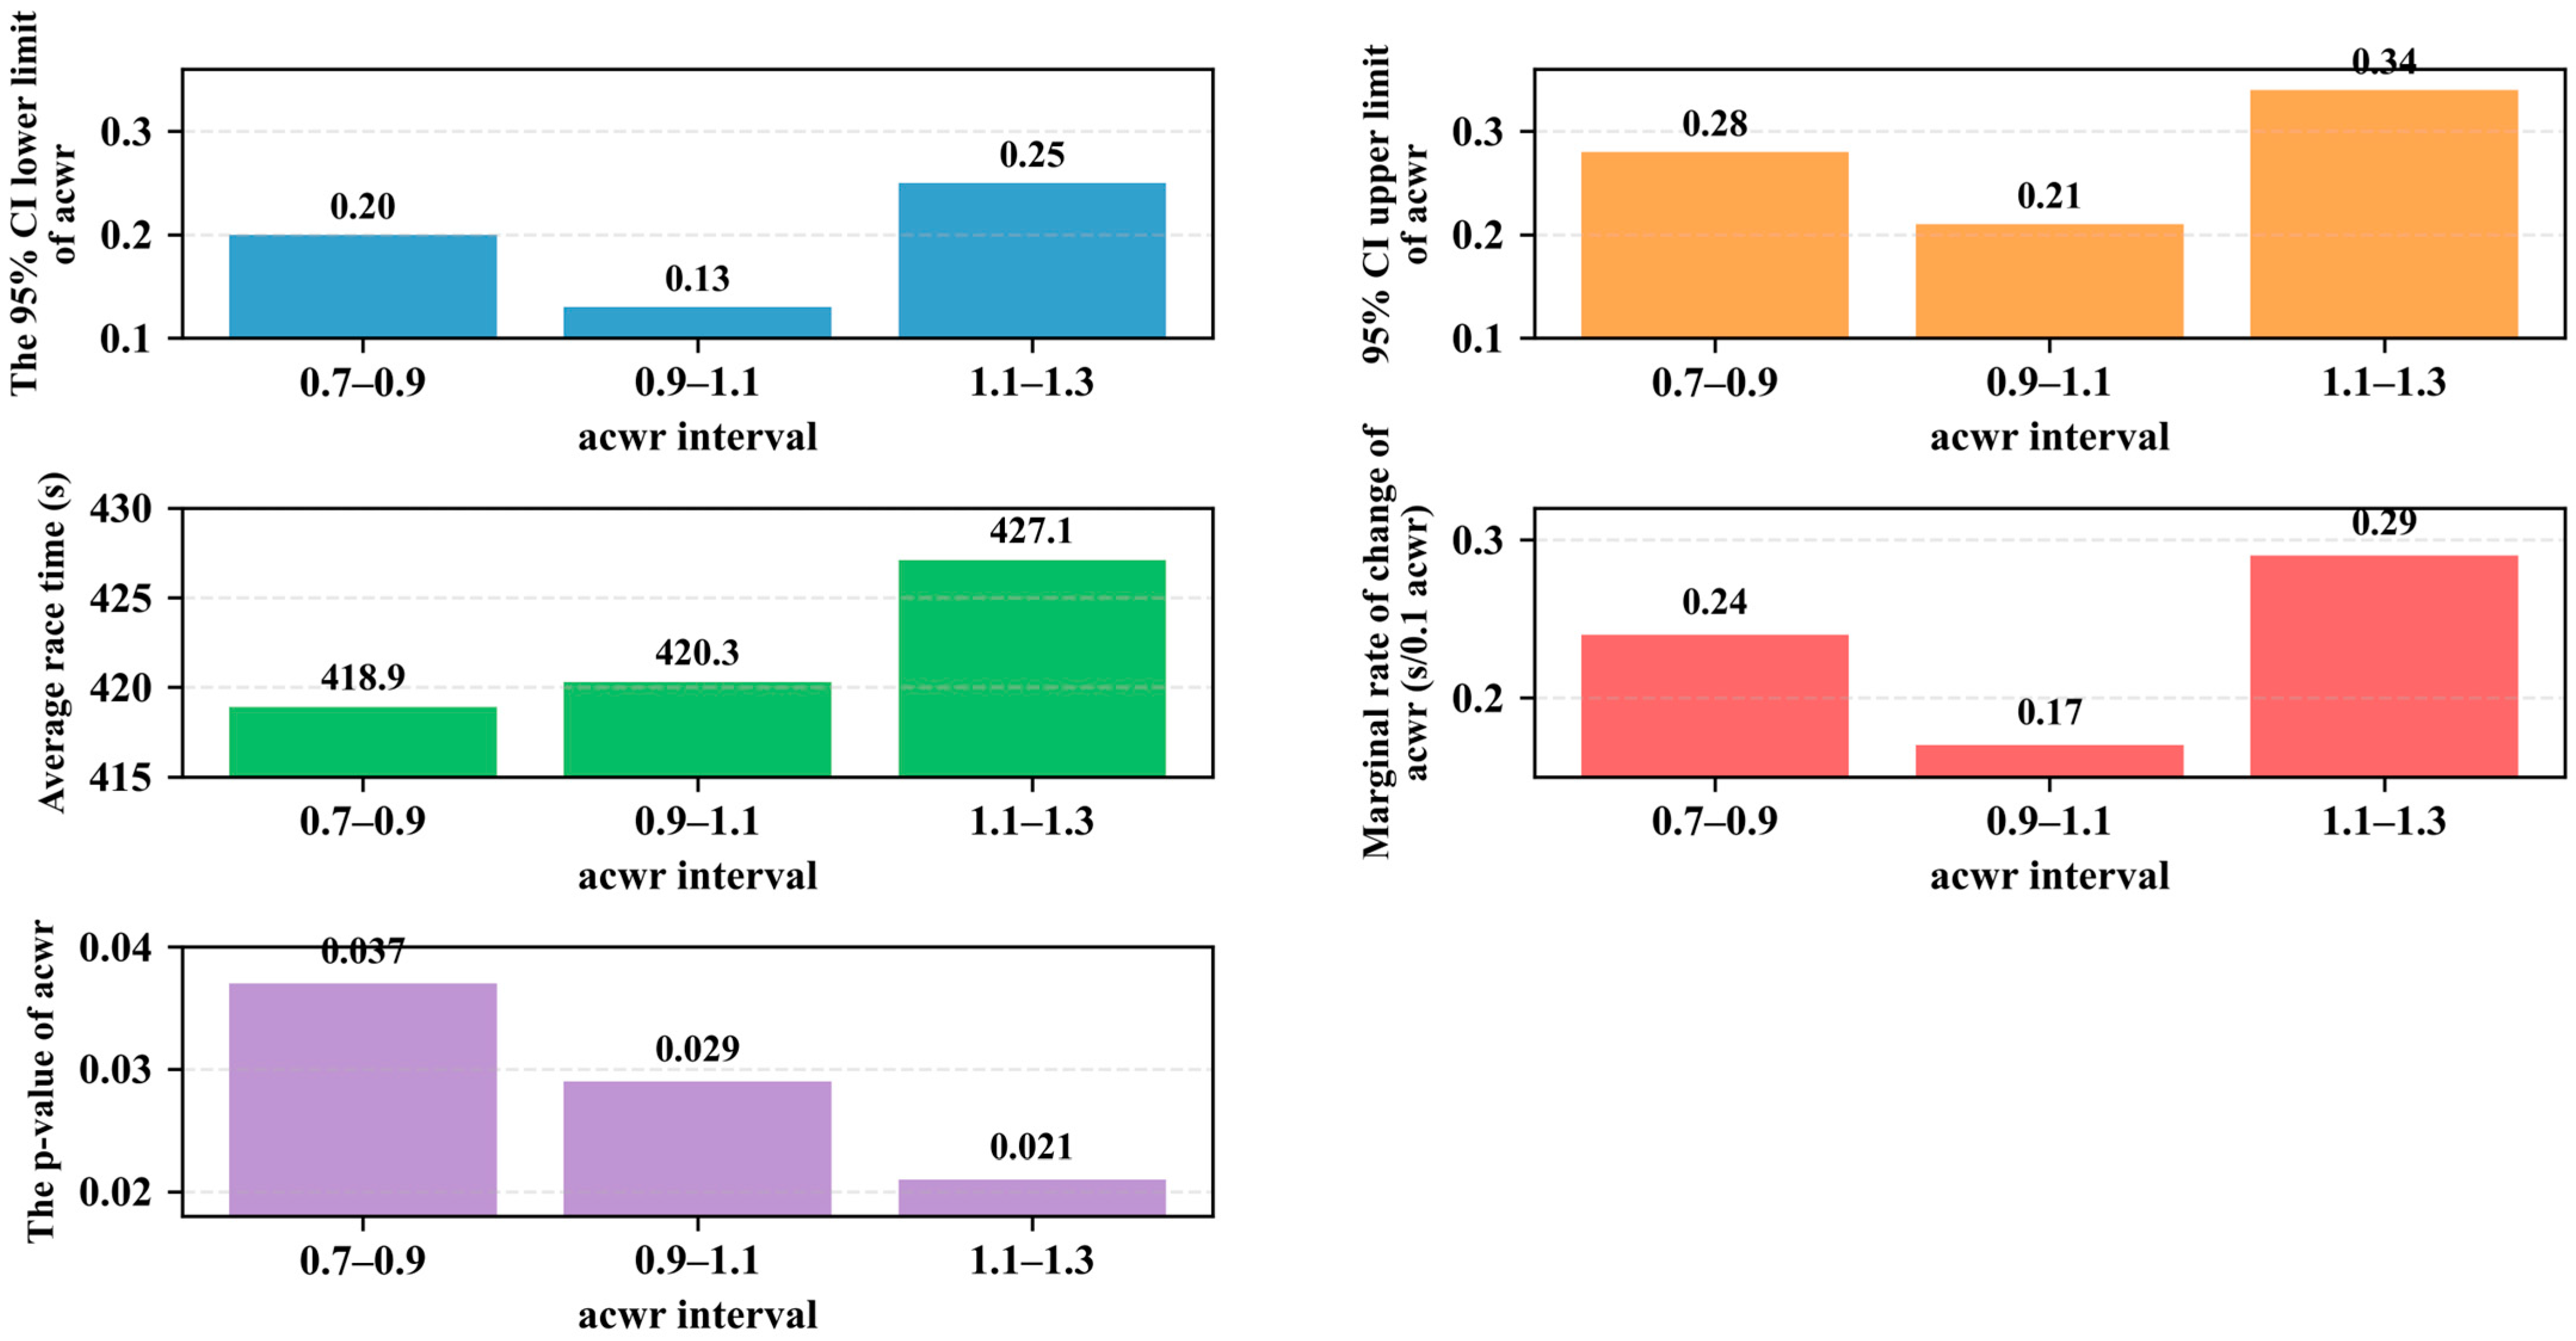
Figure 5 shows that ACWR exhibits a positive association with race time, although its effect magnitude is weaker compared with mean power (mean_power) and power variability (cv_power). When ACWR is maintained within the optimal range of 0.9–1.1, the average race time is 420.3 s, which is notably lower than 427.1 s observed when ACWR exceeds 1.2, corresponding to a difference of 6.8 s. The estimated marginal effect ranges from +0.17 to +0.29 s for every 0.1 increase in ACWR, indicating that deviations beyond the optimal load balance range lead to prolonged race duration and may contribute to additional fatigue accumulation. Especially when ACWR is close to 1.3, compared with the value in the optimal range, the increase in competition time is more significant, indicating that there is a nonlinear performance deterioration effect under the condition of excessive training load. The statistical results (p < 0.05) further verify that excessive or unbalanced training load can not only improve the competitive performance, but also weaken the pre-competition preparation effect, reduce the recovery efficiency, and interfere with the energy distribution during the competition. Therefore, it is of great significance to control ACWR within a reasonable range in the pre-competition training stage to ensure the stability of sports performance and optimise the training adaptation process.
The results in Table 6 show that mean_power has the strongest negative average gradient (0.044), indicating that there is a significant negative correlation between power output and competition time. Followed by cv_power, which has a positive influence (+0.030), highlighting the important role of power stability in sports performance. ACWR ranks third, which reflects the adjustment of the overall training load balance. Although the effect of best_interval_pace is the smallest, it still offers supplementary value in local intensity assessment. Generally speaking, the average power output and power stability are the core factors that determine the performance of the competition, followed by the regulation of training load and the optimization of segment pace strategy.

4.3. Comparative Analysis of SAP-MC and Baseline Models

To further evaluate the performance of the proposed SAP-MC model in the power sequence modeling of rowing pre-competition, based on the experimental setup in Section 3.2.2, several commonly used regression algorithms are selected as external comparison baseline models, including Linear Regression, Ridge Regression, support vector regression (SVR), Random Forest regression, and multi-layer perceptron (MLP). All baseline models are trained and evaluated under the same data conditions to ensure the fairness of comparison. Specifically, the race time (s) is used as the prediction target, and the input features are obtained by averaging the paddling sequence, including statistical description indicators such as mean_power, cv_power, best_interval_pace, and ACWR. The data partitioning strategy is consistent with Section 4.2, and all models are trained and evaluated on the same training set, verification set, and test set. At the same time, the hyperparameter of each baseline model is optimized to obtain its optimal performance. Three standard regression indexes are used for model evaluation: mean square error (MSE), mean absolute error (MAE), and determination coefficient (R2). The final experimental results are summarized in Table 7.
As shown in Table 7, under the same evaluation settings, the proposed SAP-MC model is stable and superior to all baseline methods in all indicators. Linear regression and ridge regression are relatively weak due to their inherent linear assumptions, and the prediction error is high, and r is about 0.69, which indicates that simple linear mapping is difficult to describe the complex correlation between training load and competition performance. Although nonlinear models such as random forest and multi-layer perceptron (MLP) have achieved some performance improvement, the overall gain is still limited. In contrast, SAP-MC achieved the best performance in all evaluation indices, reducing the mean square error (MSE) to 193.4 and increasing the determination coefficient (R) to 0.83. These results show that the model has more advantages in capturing the internal correlation between the dynamic change of training load and the competition time, and at the same time, it can achieve higher precision prediction on the premise of ensuring structural consistency and interpretability.

5. Discussion

Based on the existing data, this study proposes a monitoring framework of rowing training power before competition based on SAP-MC. By fusing the paddle-level sequence signals and derived statistical features, the model can analyze the competition time and describe the correlation between pre-competition training load and competitive performance in an interpretable manner. Under this background, the proposed model is mainly used as an analysis tool of sports performance, rather than a direct decision-making system. The experimental results show that the attention pooling mechanism can effectively identify the key stages in the training sequence, while the monotone constraint ensures the logical consistency between power output and competition time. The model reveals the marginal effects of power stability, speed fluctuation, and load structure on endurance, and forms an interpretable mapping path to realize the quantitative description of the correlation between training monitoring and competition performance. The relevant results mainly reflect the statistical correlation between training load and endurance in the controlled indoor dynamometer environment. At this stage, it is more suitable for training correlation analysis than direct performance guidance in real competition scenarios. Under the current data set and modeling framework, the goal has been achieved, that is, to describe the correlation between training load and competition time under controlled conditions.
It should be emphasized that the results of this study reflect the statistical correlation obtained from model learning, rather than the causal explanation of the underlying physiological mechanism. However, despite the good effect of SAP-MC in relation modeling, there are still some limitations. First of all, the experimental data mainly come from the indoor dynamometer environment, and it is difficult to fully reflect the complex influence of external factors such as wind, water flow, meteorological changes, and equipment differences in the real water training situation. In addition, the controlled data environment fails to cover key variables such as game tactics, confrontation factors, and individual differences. Therefore, the results of this study are more suitable for indoor training analysis and overall trend explanation, but not directly for specific competition situations or individual athletes’ level evaluation. From the perspective of data distribution, the sample duration range is consistent with the common performance range of the open indoor 2000 m competition. However, because the specific competitive level is not distinguished, the relevant results are more suitable for the overall trend analysis, rather than the direct comparison and evaluation of single-level athletes. Further, the framework of this study is mainly used to verify the modeling correlation between the training power sequence and the flight time under the condition of controllable data, rather than directly predicting the actual game performance. On the other hand, the design of derived features is still biased towards the statistical dimension, and the capture of the quality of technical movements and psychological factors in the training process is still not comprehensive enough, or it can continue to be optimized. In addition, this study has not externally verified SAP-MC based on real water training or formal competition data, so the generalization ability of the model in a complex real rowing environment still needs to be further tested. These improvements are expected to enhance the robustness of the model in complex environments and provide more targeted and practical decision support for coaches and athletes.

6. Conclusions

The SAP-MC model is put forward in this study, and it is verified based on the paddle-class indoor rowing data published in the RowPro data set. The results show that the SAP-MC model can effectively describe the correlation between the average power, power stability, load structure, and competition time by fusing the paddle power, paddle frequency, and heart rate series. At the same time, in terms of prediction accuracy and interpretation consistency, the model is more stable than the baseline method without introducing sequence modeling or monotone constraints. Based on this result, the goal of the study is to construct an analysis method for training monitoring, mainly focusing on the scene of rowing pre-competition training under controlled indoor conditions, so the focus is on interpretability modeling and load-performance correlation. The pre-race training of rowing is usually completed in an indoor controllable environment, in which the data record is stable, and there are few interference factors. Experiments show that the model can stably reflect the change trend between training power characteristics and endurance in the indoor environment, and identify the key load indicators that affect the performance, which can provide data-driven training load analysis reference for coaches and athletes. The relevant conclusions are mainly based on the correlation modeling results under the condition of public indoor rowing dynamometer data. It should be noted that the current conclusions are based on controlled data conditions and have not yet involved complex water competition situations. Subsequent research will combine real water training and competition data to further test and expand the applicability of the model in complex environments.

Author Contributions

Y.W.: formal analysis, writing—original draft preparation, writing—review and editing. H.Y., L.L.: Conceptualization, methodology. All authors have read and agreed to the published version of the manuscript.

Funding

This research received no external funding.

Data Availability Statement

The data used in this study were obtained from the public database available at http://www.digitalrowing.com/download/rowfiles.htm (accessed on 17 May 2026). The datasets are available from the First author upon reasonable request.

Conflicts of Interest

The authors declare no conflict of interest.

References

  1. Dobra, V.A.; Dobra, I.M.; Folea, S. Real-Time Paddle Stroke Classification and Wireless Monitoring in Open Water Using Wearable Inertial Nodes. Sensors 2025, 25, 5307. [Google Scholar] [CrossRef]
  2. Clark, J.R.; McKune, A.J.; Wood, P.S. Reliability and usefulness of a self-regulated 6-km submaximal ergometer training test set in elite rowers. Int. J. Sports Sci. Coach. 2025, 20, 2613–2623. [Google Scholar] [CrossRef]
  3. Astridge, D.J.; Peeling, P.; Goods, P.S.R.; Girard, O.; Binnie, M.J. Rowing at the 2028 Los Angeles Olympic Games: 1500-m Versus 2000-m Performance and the Predictive Accuracy of a Critical Speed Model. Int. J. Sports Physiol. Perform. 2026, 21, 482–486. [Google Scholar] [CrossRef]
  4. Gavala-González, J.; Porras-García, M.E.; Fernández-García, J.C.; Real-Pérez, M. Effects of specific training using a rowing ergometer on sport performance in adolescents. Appl. Sci. 2024, 14, 3180. [Google Scholar] [CrossRef]
  5. Yu, T.; Zhong, J.; Ding, C.; Zhang, Z.; Xu, Y. Supramaximal interval training using anaerobic speed reserve or sprint interval training in rowers. Front. Physiol. 2025, 16, 1516268. [Google Scholar] [CrossRef] [PubMed]
  6. Ellis, C.; Ingram, T.E.; Kite, C.; Taylor, S.R.; Howard, E.; Pike, J.L.; Lee, E.; Buckley, J.P.; Howard, L. Effects of a transoceanic rowing challenge on cardiorespiratory function and muscle fitness. Int. J. Sports Med. 2024, 45, 349–358. [Google Scholar] [CrossRef]
  7. Behm, S.; Jacobs, M.W.; Schumann, M. Does Maximum Strength Predict Rowing Performance in Elite Female Rowers? Int. J. Sports Physiol. Perform. 2025, 20, 622–628. [Google Scholar] [CrossRef]
  8. Janicijevic, D.; Quidel-Catrilelbún, M.E.L.; Baena-Raya, A.; García-Ramos, A. Interference Effects of Different Resistance-Training Protocols on Rowing Ergometer Performance: A Study on Semiprofessional Rowers. Int. J. Sports Physiol. Perform. 2023, 18, 1345–1351. [Google Scholar] [CrossRef]
  9. Mentz, L.; Winkert, K.; Steinacker, J.M.; Engleder, T.; Treff, G. Validity of the RP3 rowing ergometer’s mechanical power output measurement. Sports Eng. 2025, 28, 24. [Google Scholar] [CrossRef]
  10. Duchene, Y.; Simon, F.R.; Ertel, G.N.; Maciejewski, H.; Gauchard, G.C.; Mornieux, G. The stroke rate influences performance, technique and core stability during rowing ergometer. Sports Biomech. 2025, 24, 1576–1593. [Google Scholar] [CrossRef] [PubMed]
  11. Watts, S.P.; Binnie, M.J.; Goods, P.S.R.; Peeling, P. Training prescription and monitoring in rowing: Perspectives from Elite Australian Coaches. Eur. J. Sport Sci. 2025, 25, e12328. [Google Scholar] [CrossRef]
  12. Zhong, Y.; Zheng, H.; Weldon, A.; Nugent, F.; Gee, T.I.; Sperlich, B.; Moore, D.; Zi, W.; Li, Y. Training volume, intensity, and performance of world-class Chinese rowers prior to the 2019 world championships: A case study. Int. J. Sports Sci. Coach. 2025, 20, 319–329. [Google Scholar] [CrossRef]
  13. Watts, S.P.; Binnie, M.J.; Goods, P.S.R.; Hewlett, J.; Peeling, P. Exploring the depths of on-water training in highly-trained rowing athletes. Eur. J. Sport Sci. 2024, 24, 597–605. [Google Scholar] [CrossRef]
  14. Mikulic, P.; Gulin, J. The physiological and performance development of two multiple Olympic champion rowers: A 20-year follow-up study. Med. Sci. Sports Exerc. 2024, 56, 2211–2219. [Google Scholar] [CrossRef]
  15. Das, A.; Kaniganti, U.S.; Shenoy, S.J.; Majumdar, P.; Syamal, A.K. Monitoring training load, muscle damage, and body composition changes of elite Indian rowers during a periodized training program. J. Sci. Sport Exerc. 2023, 5, 348–359. [Google Scholar] [CrossRef]
  16. Naghizadeh, F.; Gholami, M.; Ebrahim, K. A Comparison of the Effect of High-Intensity Interval Resistance Training and Traditional Resistance Training on the Performance and Physiological Indicators in Young Female Rowers. J. Sci. Sport Exerc. 2024, 8, 64–72. [Google Scholar] [CrossRef]
  17. Mănescu, A.M.; Mănescu, D.C. Self-Supervised Gait Event Detection from Smartphone IMUs for Human Performance and Sports Medicine. Appl. Sci. 2025, 15, 11974. [Google Scholar] [CrossRef]
  18. Navakauskas, D.; Dumpis, M. Wearable sensor-based human activity recognition: Performance and interpretability of dynamic neural networks. Sensors 2025, 25, 4420. [Google Scholar] [CrossRef] [PubMed]
  19. Tan, T.; Shull, P.B.; Hicks, J.L.; Uhlrich, S.D.; Chaudhari, A.S. Self-supervised learning improves accuracy and data efficiency for IMU-based ground reaction force estimation. IEEE Trans. Biomed. Eng. 2024, 71, 2095–2104. [Google Scholar] [CrossRef]
  20. Zhang, J.; Oh, S.S. An Interpretable Deep Learning Framework for Human Activity Recognition in Smart Sport Using Wearable Devices. Int. J. Comput. Intell. Syst. 2026, 19, 170. [Google Scholar] [CrossRef]
  21. Wang, Y.; Liu, L. Rowing load and performance modeling by integrating random forest algorithm. Discov. Comput. 2026, 29, 182. [Google Scholar] [CrossRef]
  22. González-García, I.; Moreno-Villanueva, A.; Obregón-Sierra, Á. Performance model in fixed bench rowing to predict the outcome in competition. J. Phys. Educ. Sport 2025, 25, 1297–1305. [Google Scholar] [CrossRef]
  23. Borges, I.; Veiga, S.; González-Frutos, P. The Evaluation of Physical Performance in Rowing Ergometer: A Systematic Review. J. Funct. Morphol. Kinesiol. 2025, 10, 437. [Google Scholar] [CrossRef]
  24. DeBlauw, J.A.; Stein, J.A.; Blackman, C.; Haas, M.; Makle, S.; Echevarria, I.; Edmonds, R.; Ives, S.J. Heart rate variability of elite female rowers in preparation for and during the national selection regattas: A pilot study on the relation to on-water performance. Front. Sports Act. Living 2023, 5, 1245788. [Google Scholar] [CrossRef] [PubMed]
  25. Dai, X.; Yan, J.; Bi, X. Concurrent validity and reliability of the session rating of perceived exertion scale among high-trained rower during training sessions. BMC Sports Sci. Med. Rehabil. 2025, 17, 196. [Google Scholar] [CrossRef]
  26. Cerasola, D.; Bellafiore, M.; Cataldo, A.; Zangla, D.; Bianco, A.; Proia, P.; Traina, M.; Palma, A.; Capranica, L. Predicting the 2000-m rowing ergometer performance from anthropometric, Maximal oxygen uptake and 60-s mean power variables in national level young rowers. J. Hum. Kinet. 2020, 75, 77–83. [Google Scholar] [CrossRef] [PubMed]
  27. Watts, S.P.; Binnie, M.J.; Goods, P.S.R.; Hewlett, J.; Fahey-Gilmour, J.; Peeling, P. Demarcation of intensity from 3 to 5 zones aids in understanding physiological performance progression in highly trained under-23 rowing athletes. J. Strength Cond. Res. 2023, 37, e593–e600. [Google Scholar] [CrossRef]
  28. Pitto, L.; Simon, F.R.; Ertel, G.N.; Gauchard, G.C.; Mornieux, G. Estimation of forces and powers in ergometer and scull rowing based on long short-term memory neural networks. Sensors 2025, 25, 279. [Google Scholar] [CrossRef]
  29. Penichet-Tomas, A.; Calavia-Carbajal, S.; Pueo, B.; Villalon-Gasch, L. Kinematic Analysis of Olympic and Traditional Rowing Mechanics at different Stroke Rates. Int. J. Exerc. Sci. 2025, 18, 610–621. [Google Scholar] [CrossRef]
  30. Wang, X.Y.; Wu, H. Data-augmented machine learning for personalized carbohydrate-protein supplement recommendation for endurance. Sci. Rep. 2025, 15, 40181. [Google Scholar] [CrossRef]
Figure 1. Implementation Process of the SAP-MC Model.
Applsci 16 05322 g001
Figure 2. Proportion of Attention Contributions by Feature across Different Phases.
Applsci 16 05322 g002
Figure 3. Monotonic Correlation between mean_power and Race Duration. Note: In the figure, mean_power is measured in watts (W), and average race time is measured in seconds (s). The term “marginal rate of change of mean_power” refers to the change in race time (s) associated with a 1 W increase in mean_power (s/W). The 95% CI denotes the confidence interval of the estimated marginal effects within each interval.
Applsci 16 05322 g003
Figure 4. Marginal Effects of cv_power on Race Duration. Note: cv_power denotes the coefficient of variation of power output (dimensionless). Average race time is measured in seconds (s). The term “marginal rate of change of cv_power” refers to the change in race time (s) associated with an increase of 0.01 in cv_power (s/0.01 CV). The 95% CI represents the confidence interval of the estimated marginal effects within each interval.
Applsci 16 05322 g004
Figure 5. Correlation between acute-chronic load ratio and Race Duration. Note: ACWR denotes the acute-to-chronic workload ratio (dimensionless). Average race time is measured in seconds (s). The term “marginal rate of change of ACWR” refers to the change in race time (s) associated with an increase of 0.1 in ACWR (s/0.1 ACWR). The 95% CI represents the confidence interval of the estimated marginal effects within each interval.
Applsci 16 05322 g005
Table 1. Dataset Field Mapping for SAP-MC.
Data SourceField NameDescriptionRole in SAP-MC
Global Info (Session & Rower metadata)distanceTotal distance (m)Distinguishes race/training type for different events
durationTotal time (s; converted from ms)Prediction target (race duration)
athleteAthlete name/IDGrouping and target encoding
fileFile nameUnique sample ID linking stroke sequences
Stroke Info (Stroke nodes)timeCumulative timestamp (s)Sequence index construction
powerOutput power (W, from)Core input for attention pooling
pacePace (s/500 m, from)Supplementary performance feature
spmStroke rate (strokes/min, from)Captures motion rhythm and stability
hrHeart rate (bpm, from)Reflects physiological load
Derived Features (from stroke data)mean_powerAverage powerTabular feature, monotonic constraint (power ↑ → race duration ↓)
cv_powerPower variability coefficientTabular feature, monotonic constraint (variability ↑ → race duration ↑)
best_interval_paceBest segment pace (min stroke pace)Supplementary indicator of individual ability
acute-chronic workload ratio (ACWR)Acute-to-chronic workload ratioSecondary derived feature to quantify training load fluctuation
Note: “power ↑ → race duration ↓” indicates that an increase in power corresponds to a decrease in race duration, while “variability ↑ → race duration ↑” indicates that increased power variability corresponds to increased race duration.
Table 2. Ablation Experiment Results.
ModelMSE (s2)MAE (s)R2
Baseline 268.312.10.74
w/o Attention239.5110.77
w/o Monotonicity227.810.70.79
SAP-MC193.49.50.83
Table 3. Experimental Environment Configuration.
TypeItemConfiguration
HardwareCPUIntel Xeon Gold 6330 × 2
GPUNVIDIA Tesla V100 32 GB
Memory256 GB
Storage2 TB SSD
SoftwareOSUbuntu 20.04 LTS
Python3.9
LightGBM3.3
PyTorch1.12
Table 4. Key Hyperparameters of the SAP-MC Model.
Module/ProcessParameterValueDescription
Attention EncoderHidden Dimension64Controls the embedding size of per-stroke features
Temporal Decay Factor0.05Adjusts weight emphasis on strokes closer to the race
LightGBM RegressorLearning Rate0.05Controls gradient boosting update speed
Max Depth7Limits tree complexity
Monotonic Constraint[−1, +1]Negative constraint for mean power, positive for power variability
TrainingBatch Size128Samples per iteration
Iterations500Maximum number of iterations
Table 5. Attention Weight Statistics across Four Phases of the 2k Race.
PhaseDistance RangeMeanStdMedian95% CI Lower95% CI Upperp-Value
Start (phase 1)0–250 m0.1850.0140.1860.1810.189<0.01
Acceleration (phase 2)250–1000 m0.2760.0180.2770.2710.281<0.01
Maintenance (phase3)1000–1750 m0.2910.0170.2900.2860.296<0.001
Sprint (phase 4)1750–2000 m0.2480.0160.2490.2440.252<0.05
Note: The reported statistics are computed at the sample level. For each sample, attention weights within each phase are first averaged, and then phase-level mean values and standard deviations are calculated across all samples. Since the paddle-by-paddle attention weight belongs to continuous time series data, there is a significant time correlation between adjacent paddles. Therefore, this paper uses the sample stage mean as the statistical unit to avoid the non-independent paddle-by-paddle observation directly used for the inter-group significance test. At the same time, different stages come from the continuous rowing process of the same sample. Therefore, the statistical analysis in this paper is mainly used to compare the overall weight distribution trend between different stages, rather than strictly inferring each stage as a completely independent sample. After examining the stage mean distribution, no significant difference between extreme skewness and abnormal variance was observed, so ANOVA was retained as the stage trend comparison method. At the same time, the Kruskal-Wallis non-parametric test was further used to verify the robustness. The 95% confidence intervals are estimated using a normal approximation. Statistical significance of differences in attention weights across phases is assessed using a one-way analysis of variance (ANOVA).
Table 6. Marginal Gradient Contributions of Derived Features under Monotonic Constraints.
FeatureAverage GradientDirection95% CIp-ValueRelative Contribution Rank
mean_power−0.044Negative[−0.049, −0.039]0.00011
cv_power0.030Positive[+0.025, +0.035]0.0012
best_interval_pace−0.012Negative[−0.018, −0.006]0.0384
ACWR0.021Positive[+0.015, +0.027]0.0123
Note: The average gradient reported in the table is computed by first estimating sample-level local derivatives of each feature under the monotonic constraints of the LightGBM model, and then averaging these values across all samples. The above-average gradient, 95% confidence interval, and p-values are the results of the posterior statistical analysis after the model training is completed, and are not the direct output function of the LightGBM library. Specifically, this study first calculates the local gradient response of the corresponding features of each sample under monotonic constraints, and then performs statistical summary and significance analysis based on the gradient empirical distribution of all samples. Because the predicted response of the tree model is segmented, the local gradient distribution may have some discreteness and skewness. Therefore, the 95% confidence interval obtained based on the normal approximation is mainly used to describe the overall gradient change trend, rather than as a strict probability distribution inference result. The 95% confidence intervals are estimated using a normal approximation based on the empirical distribution of gradients. The p-values are obtained via one-sample t-tests assessing whether the mean gradient significantly deviates from zero.
Table 7. Performance Comparison between SAP-MC and Baseline Models.
ModelMSE (s2)MAE (s)R2
Linear Regression325.714.60.69
Ridge Regression301.213.50.71
SVR271.812.30.73
Random Forest258.611.80.75
MLP248.911.30.76
SAP-MC193.49.50.83
Disclaimer/Publisher’s Note: The statements, opinions and data contained in all publications are solely those of the individual author(s) and contributor(s) and not of MDPI and/or the editor(s). MDPI and/or the editor(s) disclaim responsibility for any injury to people or property resulting from any ideas, methods, instructions or products referred to in the content.