1. Introduction
Cardiovascular diseases (CVDs) are the leading cause of death worldwide. The World Health Organization [
1] states that approximately 19.8 million people died in 2022 due to cardiovascular diseases, accounting for roughly 32% of all global deaths. Among CVDs, cardiac arrhythmias characterized by irregular heart rhythms pose particular clinical challenges due to their unpredictable nature and potential for sudden onset. Early detection and classification of arrhythmias are critical for timely medical intervention and can significantly reduce mortality rates, particularly for life-threatening ventricular arrhythmias that can precipitate sudden cardiac death.
The electrocardiogram (ECG) remains the gold-standard non-invasive diagnostic tool for detecting cardiac arrhythmias. Traditional clinical practice relies on the manual interpretation of ECG recordings by trained cardiologists, a process that is time-consuming, subjective, and not scalable for continuous-monitoring scenarios. The proliferation of wearable ECG devices and ambulatory monitoring systems has created an urgent need for accurate, automated arrhythmia detection algorithms that can operate in real time with minimal computational resources. Such systems must not only achieve high overall accuracy but also maintain exceptional sensitivity for rare but clinically critical arrhythmia types.
Machine learning, and particularly deep learning, has emerged as a powerful paradigm for automated ECG analysis. Convolutional neural networks (CNNs) have demonstrated the ability to learn discriminative features directly from raw ECG waveforms without requiring hand-crafted feature engineering, eliminating the need for domain expertise in signal processing. However, real-world ECG datasets exhibit severe class imbalance: normal sinus beats vastly outnumber pathological beats. For instance, in the widely used MIT-BIH Arrhythmia Database, normal beats constitute 82.8% of all samples, while supraventricular beats account for only 2.5% and fusion beats for merely 1.6%. This extreme imbalance poses a fundamental challenge for supervised learning algorithms, which tend to be biased toward majority classes and may fail to detect rare but clinically critical arrhythmia.
Recent research has explored increasingly complex architectures, including hybrid CNN–Long Short-Term Memory (LSTM) models, attention mechanisms, and pure transformers, in pursuit of an improved ECG classification performance. While these sophisticated approaches have demonstrated merit, they introduce substantial computational overhead (often 10 to 20 times more parameters than basic CNN models) and may not be deployable on resource-constrained wearable devices. Moreover, their superior performance may partially stem from compensating for inadequate class imbalance handling rather than from inherent architectural advantages. This raises a critical question: are complex architectures truly necessary, or can simpler models achieve state-of-the-art performances when class imbalance is properly addressed?
This paper addresses the class imbalance problem in ECG arrhythmia classification through a combination of data-level and algorithm-level techniques, demonstrating that a relatively simple 1D-CNN architecture can achieve an exceptional performance. Our key insight is that proper data handling, not architectural complexity, is the primary determinant of success in imbalanced ECG classification tasks. We make the following contributions:
A comprehensive empirical study demonstrating that random oversampling combined with class-weighted loss is both necessary and sufficient for achieving a state-of-the-art ECG classification performance. Ablation studies confirm that removing either component causes severe performance degradation.
A lightweight 1D-CNN architecture with only 398,469 parameters that achieved 99.18% overall accuracy and a 96.38% macro-averaged F1-score on the MIT-BIH Arrhythmia Database, competing with state-of-the-art methods from previous work that used larger models with significantly larger numbers of parameters.
Demonstration of 98.32% recall on ventricular beats, the most clinically critical arrhythmia class, indicating that our approach achieves the high sensitivity necessary for patient safety in automated monitoring systems.
Evidence that architectural simplicity, when combined with proper class balancing, achieves a high performance similar to that of complex hybrid architectures. These findings challenge recent trends toward increasing model complexity and have important practical implications for deployment on wearable devices.
Detailed error analysis and discussion of why simple oversampling outperforms synthetic minority oversampling techniques (SMOTE) for ECG time-series data, where morphological features do not interpolate meaningfully.
The remainder of this paper is organized as follows:
Section 2 reviews related work in automated ECG classification and class imbalance handling.
Section 3 describes the MIT-BIH Arrhythmia Database and characterizes the class imbalance problem.
Section 4 presents our methodology, including the data preprocessing, proposed CNN architecture, and class-balancing techniques.
Section 5 reports experimental results, comparisons with prior work, and ablation studies.
Section 6 discusses the implications of our findings, including the superiority of simple oversampling over SMOTE and the trade-offs between architectural simplicity and complexity.
Section 7 concludes the paper and outlines future research directions.
2. Related Work
2.1. Traditional Machine Learning Approaches
Early work on automated ECG arrhythmia classification relied on hand-crafted features extracted from the ECG waveform. Common features include RR intervals (time between successive heartbeats), QRS complex duration and morphology, P-wave characteristics, and statistical moments of the signal. These features are then fed into classical machine learning classifiers, such as support vector machines (SVMs), random forests, and k-nearest neighbors. de Chazal et al. [
2] achieved 85.9% accuracy using an SVM with morphological and timing features extracted from the ECG signal. Ye et al. [
3] used a random forest classifier with wavelet-based features, reporting 89.3% accuracy on the MIT-BIH database. While these approaches provide interpretable features and reasonable performances, they require significant domain expertise for feature engineering and struggle to capture complex nonlinear patterns in ECG signals. Furthermore, hand-crafted features may not generalize well across different patient populations or recording conditions.
2.2. Early Deep Learning Methods
The advent of deep learning eliminated the need for manual feature engineering by learning representations directly from raw data. Acharya et al. [
4] applied a nine-layer CNN to ECG beat classification, achieving 93.5% accuracy on the MIT-BIH database. Rajpurkar et al. [
5] developed a 34-layer residual network that achieved a cardiologist-level performance on a large proprietary dataset, demonstrating the potential of deep learning for clinical ECG analysis. Oh et al. [
6] proposed a hybrid CNN-LSTM architecture, leveraging CNNs for spatial feature extraction and LSTMs for temporal modeling, reporting 98.1% accuracy. Yildirim et al. [
7] used a deep LSTM network with attention mechanisms, achieving 91.3% overall accuracy with 12 M parameters.
More recent work has explored transformer-based architectures for ECG analysis. Natarajan et al. [
8] applied self-attention mechanisms to identify relevant segments of ECG signals for multi-lead classification. However, pure transformer models require substantial computational resources and large training datasets to overcome their lack of inductive bias. Zhang et al. [
9] combined CNNs with spatial–temporal attention modules, achieving 96.8% accuracy but with 11 M parameters and significant computational overhead. While these complex architectures have advanced the state of the art, their computational demands limit deployment on resource-constrained devices, such as wearable cardiac monitors.
2.3. Handling Class Imbalance in ECG Data
The class imbalance problem in ECG datasets has been recognized as a major challenge that can cause models to converge to trivial solutions. Common approaches include: (1) data-level methods, such as random oversampling, undersampling of majority classes, and synthetic minority oversampling (SMOTE); (2) algorithm-level methods, such as cost-sensitive learning with class-weighted loss functions; and (3) ensemble methods that combine multiple classifiers trained on different class distributions.
SMOTE, proposed by Chawla et al. [
10], generates synthetic minority class samples by interpolating between existing samples. While effective for tabular data, its application to time-series physiological signals has shown mixed results. Wang et al. [
11] found that SMOTE degraded performance on ECG classification, hypothesizing that synthetic ECG beats created by interpolation may not correspond to valid cardiac waveforms. To address the issue of sensitivity to rare classes, Ikram et al. [
12] suggested using techniques such as class-specific data augmentation, oversampling, and class-weighted loss functions.
Lin et al. [
13] introduced focal loss for dense object detection in computer vision, which down-weights the contribution of easy-to-classify examples and focuses learning on hard examples. While originally designed for object detection, focal loss has been successfully adapted to imbalanced time-series classification. However, few prior ECG studies have systematically evaluated the combination of data-level (random oversampling) and algorithm-level (weighted loss) strategies with rigorous ablation studies, which is a key contribution of our work.
2.4. Recent Advanced Deep Learning Methods
Recent years have witnessed rapid advances in ECG arrhythmia classification, with multiple approaches achieving high accuracy on the MIT-BIH dataset. Mathunjwa et al. [
14]) combined recurrence plots with CNNs. Hybrid architectures have proven particularly effective [
15,
16]. Ullah et al. [
15] proposed a CNN-LSTM model with attention mechanisms, achieving 99.30% accuracy. Shi et al. [
16] developed a multi-scale residual neural network, achieving 99.59% accuracy.
Transfer learning approaches have also shown promise [
17,
18]. Jamil et al. [
17] proposed ArrhythmiaNet, combining continuous wavelet transform preprocessing with deep CNNs, achieving 99.84% accuracy on 17-class classification. Hu et al. [
18] explored pure transformer architectures. However, these high-performing models typically require substantial computational resources, with parameter counts often exceeding 10–50 million. Parallel developments have focused on robustness to class imbalance. Rahman et al. [
19] conducted a systematic evaluation of data augmentation strategies for ECG signals, while Wu et al. [
20] adapted focal loss for ECG signals.
Most recently, published work has continued the trend toward increasing complexity [
21,
22,
23,
24,
25]. Bai et al. [
21] proposed a CNN-BiGRU hybrid model with multi-head attention, with an accuracy of 99.41% on the MIT-BIH dataset. The proposed model combines three distinct architectural components (CNN, BiGRU, and attention), substantially increasing the model complexity and training requirements. The autoencoder–LSTM hybrid approaches proposed by Guerra et al. [
22] reached 98.57%, while the explainable AI (XAI) methods processing triads of consecutive cardio cycles proposed by Kovalchuk et al. [
23] achieved 99.43% at the cost of three times the computational load for each classification and additional preprocessing overhead.
Tenepalli and Navamani [
24] proposed EGOLF-Net, combining Enhanced Gray Wolf Optimization with LSTM fusion networks, though the authors acknowledge persistent challenges with dataset bias, interpretability, and undisclosed computational costs. Lamba et al. [
25] employed Ant Colony Optimization for hyperparameter tuning combined with SMOTE-based balancing, achieving 98.9–99.1% accuracy despite substantial algorithmic complexity and reliance on synthetic oversampling.
These recent advances, while achieving competitive accuracy, rely on increasingly sophisticated optimization algorithms (Ant Colony, Gray Wolf), multi-stage architectures, explainability overhead, or multi-lead requirements that hinder practical deployment on resource-constrained wearable devices. Furthermore, parameter counts and computational costs remain largely undisclosed in recent work, making deployment feasibility difficult to assess.
2.5. Research Gap and Motivation
Despite extensive prior work, several gaps remain. First, many high-performing models are computationally expensive, with parameter counts exceeding 10 M, limiting their deployment on wearable devices with constrained battery life and processing power. Second, the majority of studies report only overall accuracy, which can be misleading for imbalanced datasets. A model that always predicts the majority class can achieve high accuracy while completely failing on minority classes. Third, there is limited rigorous analysis of class-balancing strategies. Many papers employ oversampling or weighted loss functions, but few conduct ablation studies to quantify their individual contributions. Fourth, the trade-off between architectural complexity and class-balancing effectiveness has not been thoroughly explored.
Our work addresses these gaps by (1) proposing a lightweight architecture with 90–96% fewer parameters than recent complex models; (2) reporting comprehensive per-class metrics, including macro F1-scores and class-specific recall; (3) conducting rigorous ablation studies demonstrating that both oversampling and weighted loss are essential; (4) achieving a state-of-the-art performance with superior computational efficiency and a high performance on ventricular beats, which is most critical for patient safety; and (5) providing evidence that architectural simplicity, when combined with proper class balancing, can attain a high performance similar to that of complex hybrid architectures. These findings have important implications for both research and clinical practice.
4. Methodology
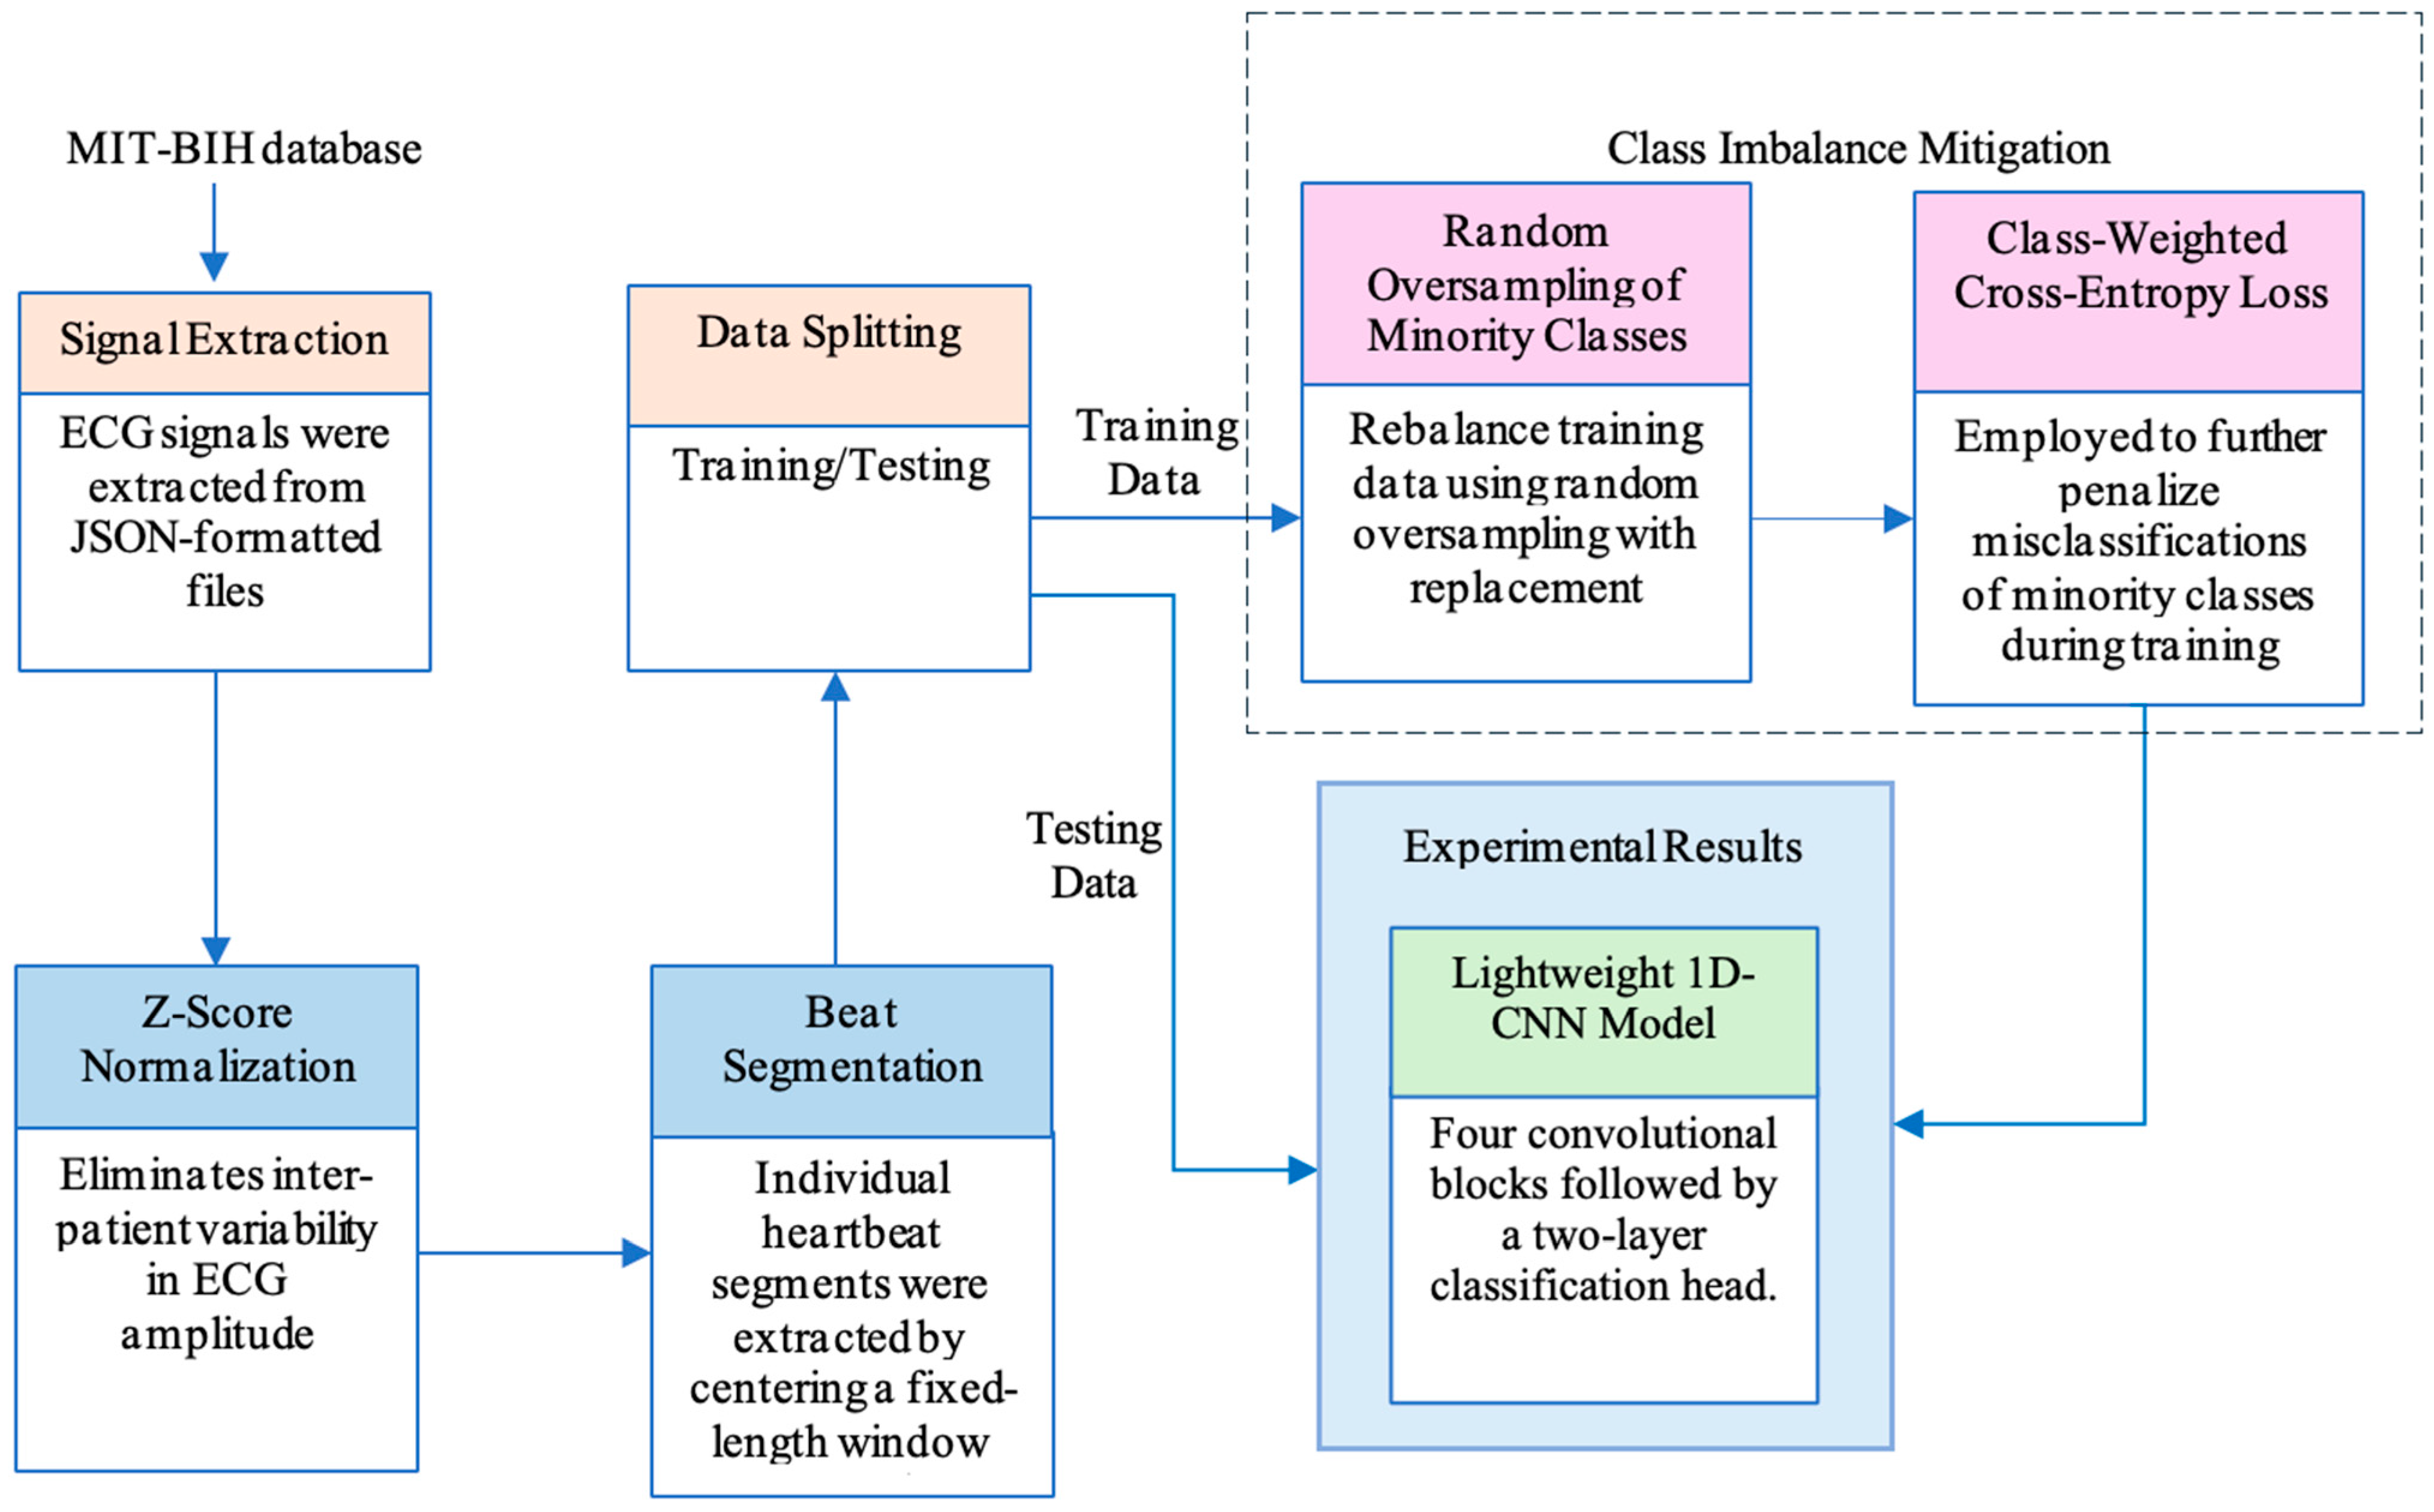
Figure 1 illustrates a simplified overview of the steps followed to arrive at the conclusion of the overall experiment. Algorithm 1 shows the algorithm for the proposed automated ECG arrhythmia classification using a lightweight 1D-CNN model.
| Algorithm 1. Proposed algorithm for automated ECG arrhythmia classification using lightweight 1D-CNN model |
| Inputs: MIT-BIH ECG recordings, hyperparameters |
| Output: Trained model M, experimental results: accuracy, precision, recall, F1, confusion matrix, AUC |
| Load Data & Signal Extraction |
| Load all MIT-BIH records; extract beat segments and AAMI labels |
| Data Pre-processing |
| for each recording r do |
| Apply Z-score normalization to remove inter-patient amplitude variability: |
| normalized signal x_norm for signal x of length N, is computed as: |
| x_norm ← (x − μ)/(σ + ε) |
| //μ and σ are the mean and standard deviation of the entire signal, |
| //ε = 10−8 |
| Detect R-peaks, extract fixed-length window centred on each heartbeat |
| Map annotation symbol → AAMI class label ∈ {Normal, Supraventricular, Ventricular, Fusion, Unknown} |
| end for |
| Data Splitting |
| Stratified split → Dtrain (68%), Dval (12%), Dtest (20%) //preserves class ratios |
| Class Imbalance Mitigation |
| Random oversampling on Dtrain only (no leakage to Dval and Dtest): |
| for each minority class k do |
| Randomly duplicate samples with replacement until |class k| ≥ target_ratio × |majority class| //target_ratio=0.35 |
| end for |
| |
| Compute inverse-frequency class weights for loss function: |
| wk ← Ntrain/(5 × |Dtrain, k|) ∀ class k |
| Pass the calculated weights to PyTorch’s CrossEntropyLoss function, which applies them during backpropagation |
| Initialize lightweight 1D-CNN: 4 convolutional blocks + 2-layer classification head |
| Initialize Adam optimizer |
| for each training epoch do |
| Minimize class-weighted cross-entropy loss on Dtrain, update M via backpropagation |
| Evaluate on Dval, save checkpoint if accuracy improves |
| end for |
| Run M on Dtest, collect predicted labels and calculate evaluation metrics |
| Report experimental results: accuracy, precision, recall, F1, confusion matrix, AUC |
4.1. Data Preprocessing
4.1.1. Signal Extraction
ECG signals were extracted from JSON-formatted files obtained from the Kaggle distribution of the MIT-BIH database. Each record’s MLII lead signal was parsed from the p_signal field, which stores the multi-channel signal as a JSON-encoded string. This field was first deserialized using Python’s json.loads() function to recover the list of [MLII, V5] sample pairs. The first element of each pair (MLII channel) was then extracted to form a 1D signal array of 650,000 samples per record, corresponding to approximately 30 min of continuous ECG recording at 360 Hz.
4.1.2. Z-Score Normalization
Each extracted signal was independently normalized using z-score standardization prior to beat segmentation. This normalization eliminates inter-patient variability in ECG amplitude due to differences in electrode placement, skin impedance, body mass index, and recording equipment. For a signal (x) of length N, the normalized signal (x_norm) is computed as:
where μ and σ are the mean and standard deviation of the entire signal, and ε = 10
−8 is a small constant added for numerical stability to prevent division by zero in the rare case of a completely flat signal. This per-record normalization ensures that the model learns beat morphology patterns that are invariant to absolute voltage scales.
4.1.3. Beat Segmentation
Individual heartbeat segments were extracted by centering a fixed-length window on each annotated R-peak location provided in the annotation files. A symmetric window of 90 samples before and 90 samples after each R-peak was used, yielding beat segments of 180 samples centered around the R-peak (0.5 s at 360 Hz). This is 181 samples, including the R-peak. This window size was empirically chosen to fully capture the P wave, QRS complex, and T wave of a typical heartbeat [
27,
28] while remaining compact enough to focus the model on the individual beat morphology rather than the inter-beat dynamics or heart rate variability.
Beats were excluded if: (1) the 180-sample window centered around the R-peak extended beyond the signal boundaries (i.e., beats occurring within 90 samples of the recording start or end), or (2) the annotation symbol did not belong to one of the five AAMI classes (e.g., rhythm change markers such as ‘+’). After applying these filtering criteria across all 48 records, a total of 109,117 valid beat segments were obtained for analysis.
4.2. Dataset Splitting
The 109,117 beat segments were divided into training, validation, and test subsets using stratified random splitting to preserve class distributions across all three subsets. Specifically, 20% of the data (21,824 beats) was first held out as the test set, and the remaining 80% was further divided into the training (85% of the remaining, or 68% of the total beat segment data) and validation (15% of the remaining, or 12% of the total beat segment data) sets. Critically, the test set was drawn from the original, unbalanced data distribution to provide a realistic evaluation of the model performance under the natural class proportions encountered in clinical practice. The class-balancing procedures described in
Section 4.3 were applied exclusively to the training data to prevent information leakage and ensure fair evaluation.
The stratified sampling strategy was used to preserve the original class distribution across all splits. The provided test set was used exclusively for final evaluation and was not involved in the model training or hyperparameter tuning. Stratification was applied based on class labels to ensure that each subset maintained a similar distribution of arrhythmia classes, which is critical given the significant class imbalance in the dataset. This approach prevents bias toward the dominant class and ensures that minority classes are represented in all subsets. The same splits were used across all experiments, including the ablation study, to guarantee fair and consistent comparisons between different imbalance-handling strategies. The original results are based on the standard benchmark beat-level split of the preprocessed dataset. No overlap exists between the training, validation, and test samples. Additional experiments for inter-patient testing for generalization were conducted and are discussed in
Section 5.
4.3. Class Imbalance Mitigation
We employed a two-pronged approach to address class imbalance: data-level oversampling and algorithm-level weighted loss. The necessity and sufficiency of this combination are empirically validated through ablation studies in
Section 5.4.
4.3.1. Random Oversampling of Minority Classes
The training set was rebalanced using random oversampling with replacement. For each minority class (Classes 1, 2, 3, 4), additional samples were randomly selected from the existing samples of that class and duplicated until the class contained at least 35% as many samples as the majority class (Class 0). This 35% target ratio was chosen through preliminary experiments, as indicated in
Section 5.5, to balance the training set size (larger ratios increase training time) against minority class representation (smaller ratios provide insufficient examples for learning).
Mathematically, for each class c with n_c original training samples, if n_c < 0.35 × n_0 where n_0 is the size of the majority class, we randomly sample (with replacement) from the n_c samples until reaching the target count of ⌊0.35 × n_0⌋. This process does not create new synthetic data; rather, it duplicates existing samples. Some minority class beats may appear dozens of times in the training set (e.g., fusion beats appear approximately 39 times each on average).
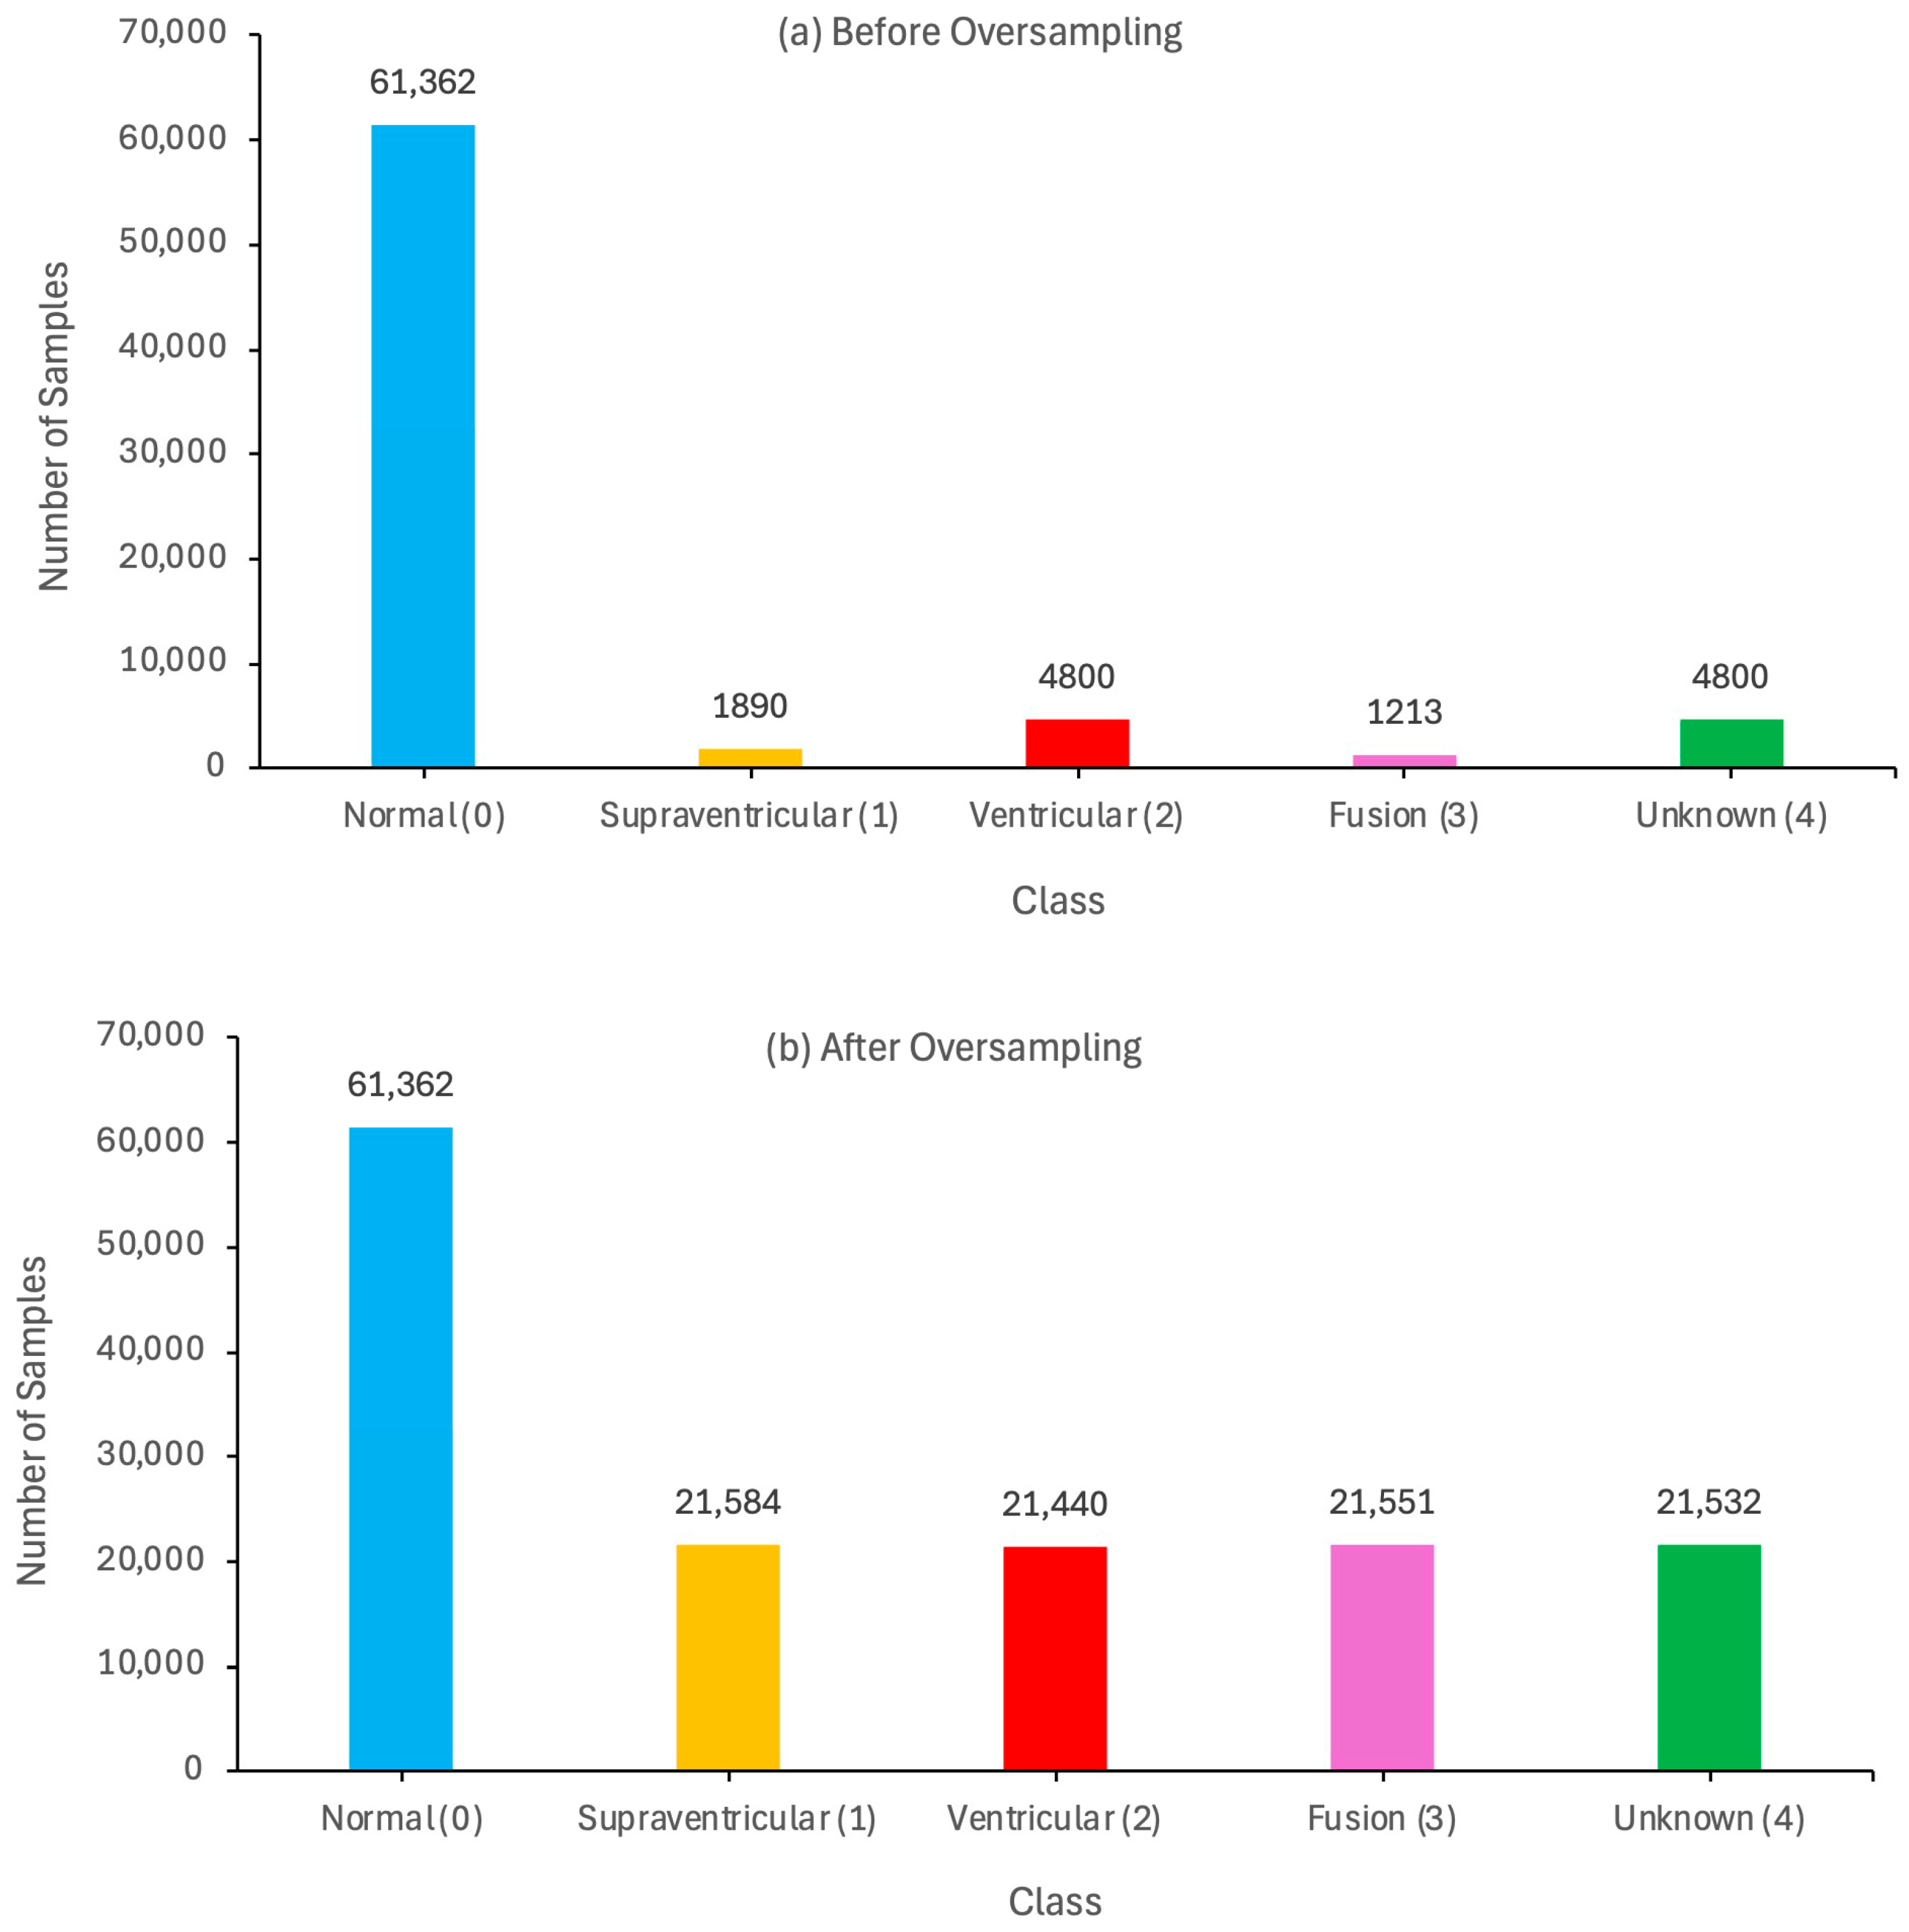
After oversampling, the training set grew from approximately 87,000 beats to 147,469 beats.
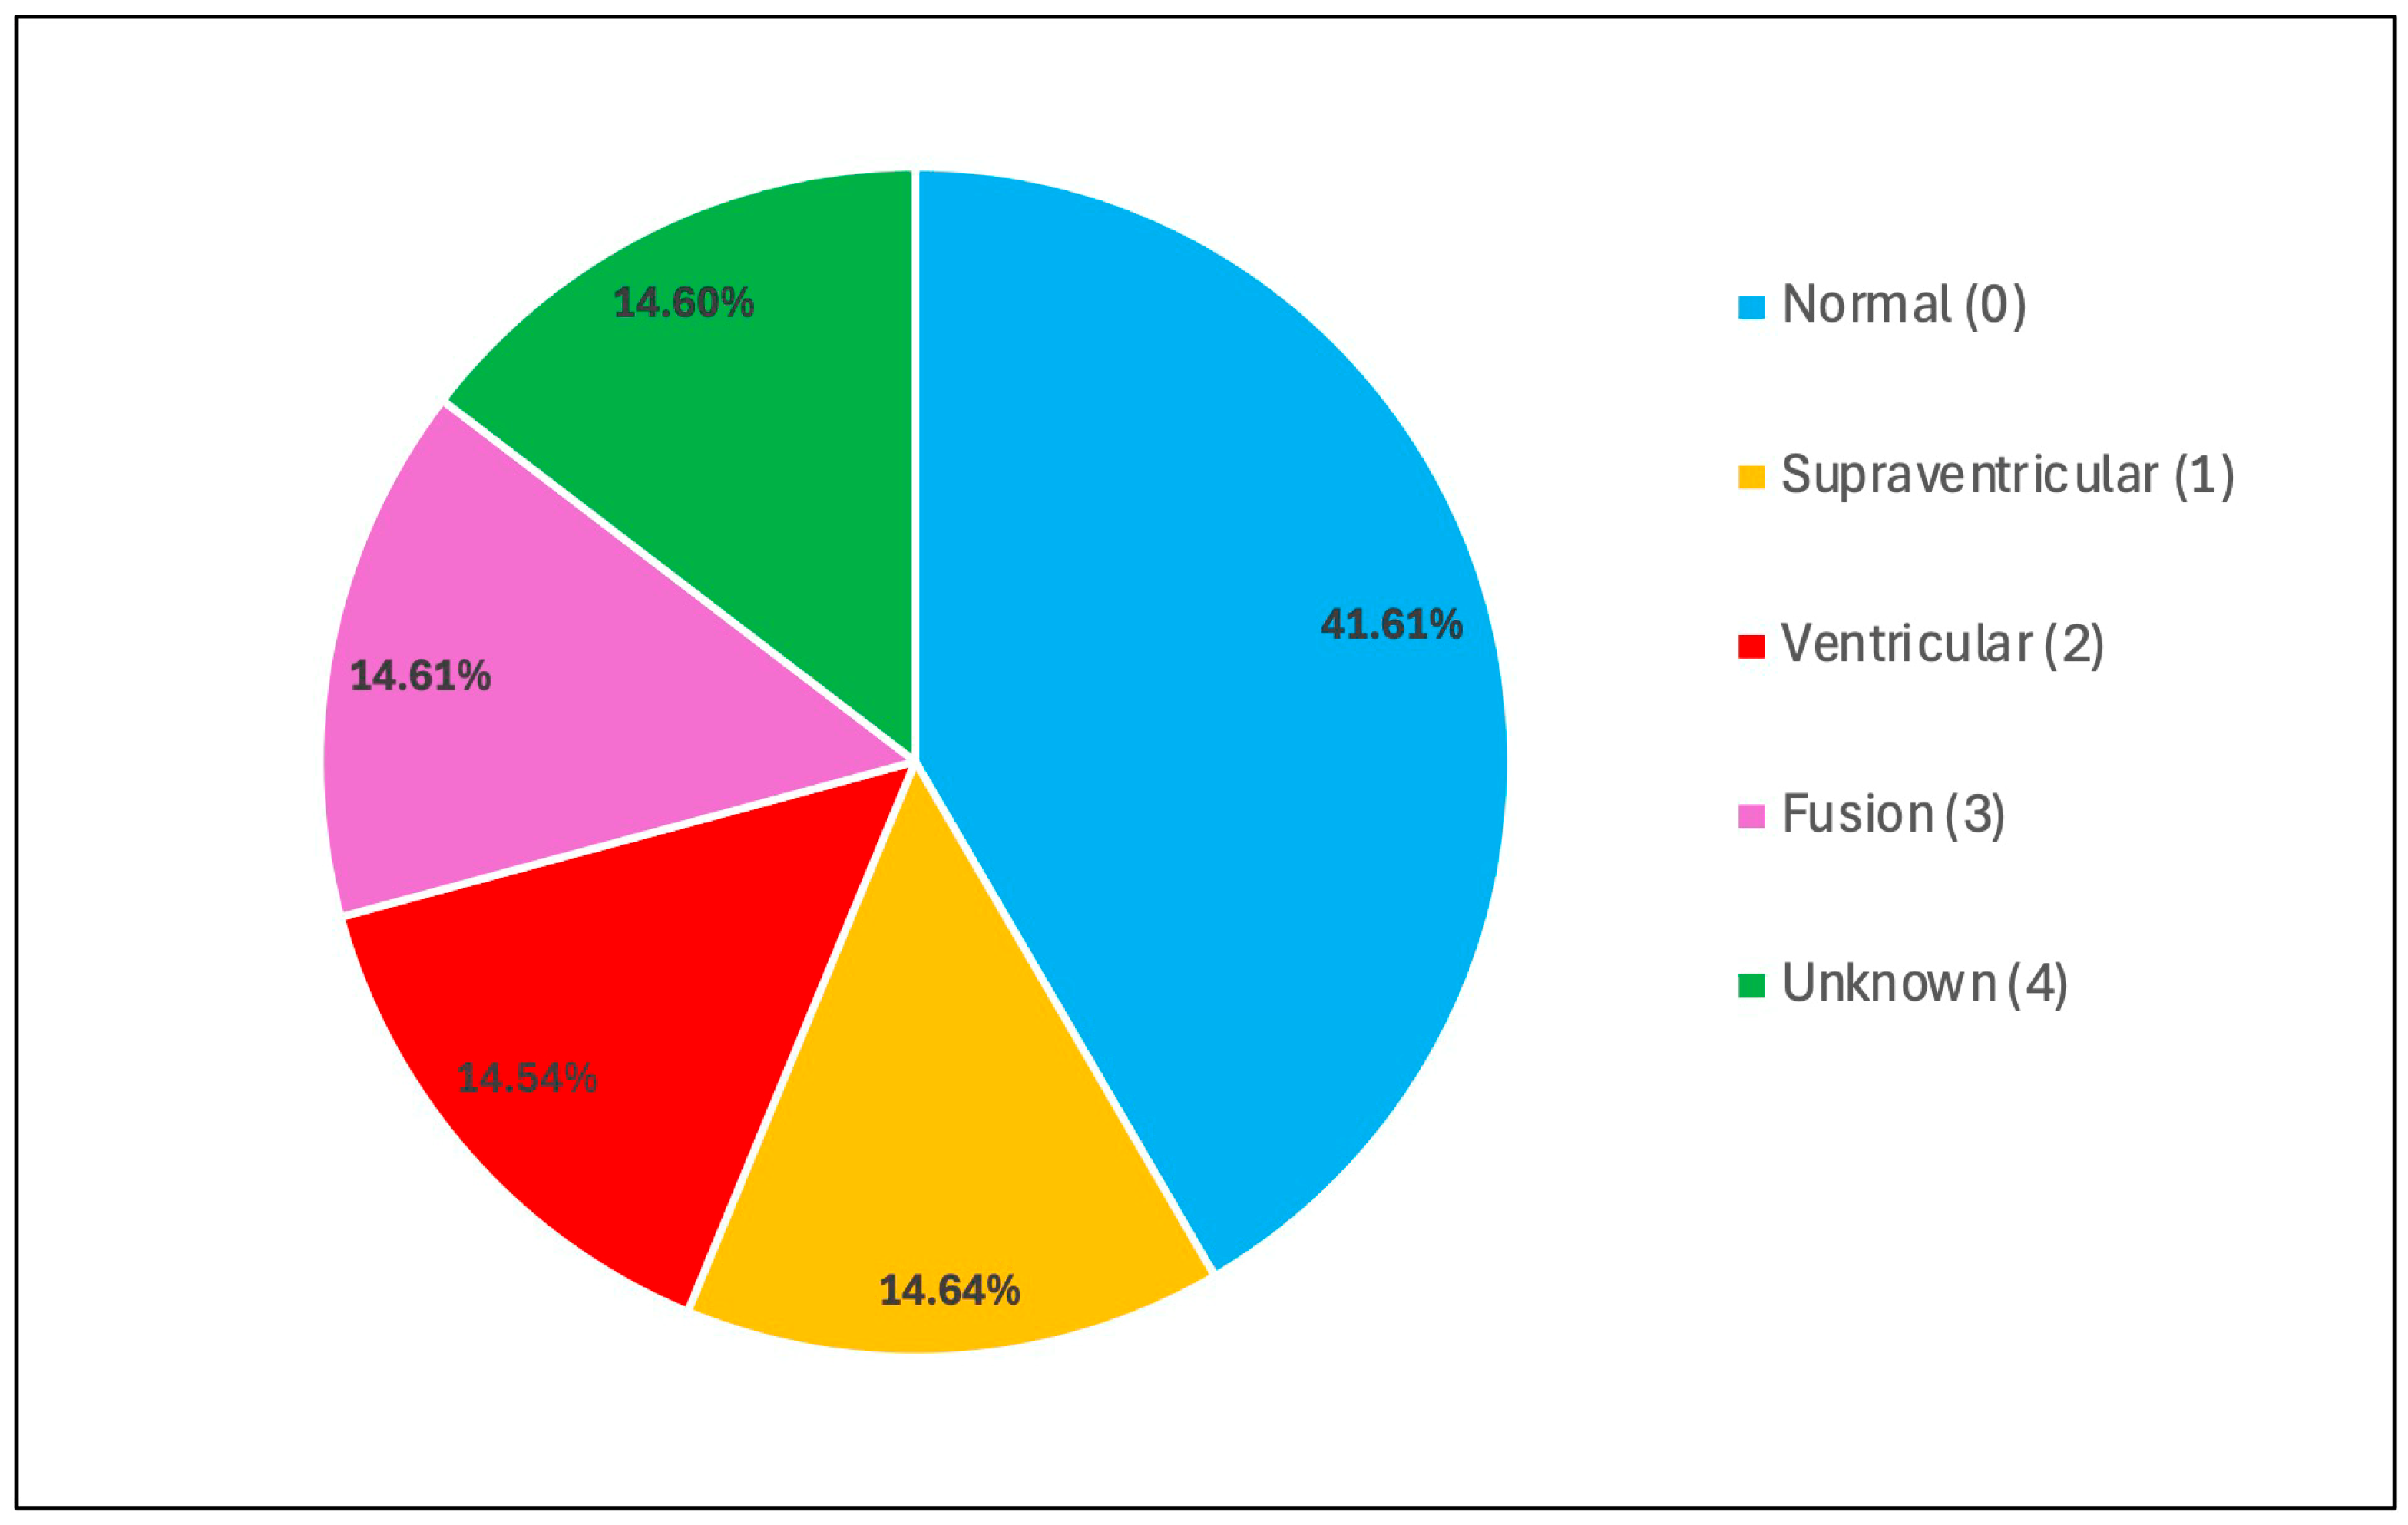
Table 2 and
Figure 2 show the resulting class distribution in the training set after oversampling to 35% of the majority class size. The validation and test sets were not oversampled, ensuring that the evaluation metrics reflect the performance on the natural, imbalanced distribution.
4.3.2. Class-Weighted Cross-Entropy Loss
In addition to oversampling, class-weighted cross-entropy loss was employed to further penalize misclassifications of minority classes during training. The weight for class c is defined as the inverse class frequency:
where N is the total number of training samples after oversampling (147,469), C = 5 is the number of classes, and n_c is the number of training samples in class c after oversampling. The resulting weights were [0.481, 1.366, 1.376, 1.369, 1.370] for Classes 0 through 4, respectively. These weights were passed to PyTorch’s CrossEntropyLoss function, which applies them during backpropagation. The effect is that misclassifying a minority class sample incurs approximately 2.8 times the loss penalty of misclassifying a majority class sample, forcing the model to pay greater attention to minority class patterns.
The combination of oversampling and weighted loss is critical. Oversampling ensures that minority class samples appear frequently enough during training to enable pattern learning, while weighted loss ensures that these patterns receive appropriate emphasis during gradient descent. The ablation study in
Section 5.4 demonstrates that removing either component causes severe performance degradation.
4.3.3. Rationale for Random Oversampling over SMOTE
We chose random oversampling with replacement over synthetic minority oversampling techniques (SMOTE) for several reasons grounded in the unique characteristics of ECG time-series data. SMOTE generates synthetic samples by interpolating between existing minority class samples. While effective for tabular data with continuous, interpolatable features, SMOTE has been shown to degrade performance on ECG classification tasks [
11].
The fundamental issue is that ECG waveforms contain sharp, precise morphological features—such as the rapid upstroke of the QRS complex, the distinct morphology of different arrhythmia types, and the temporal relationships between P, QRS, and T waves—that do not interpolate meaningfully. Averaging two ventricular beats with slightly different morphologies may produce a synthetic beat that does not correspond to any valid cardiac waveform. Furthermore, even small misalignments in R-peak positioning cause interpolation to mix features from different phases of the cardiac cycle (e.g., averaging one beat’s QRS complex with another beat’s T wave), producing nonsensical synthetic beats that confuse the classifier. Prior empirical studies on ECG data have consistently found that simple random oversampling outperforms SMOTE, which motivated our choice.
4.4. Proposed CNN Architecture
We designed a lightweight 1D-CNN architecture to learn discriminative beat representations directly from raw waveforms. In contrast to recent trends toward complex hybrid architectures combining CNNs with LSTMs, attention mechanisms, or transformers, our architecture deliberately prioritizes simplicity and computational efficiency. The rationale is twofold: (1) the 180-sample window (0.5 s) captures a complete PQRST complex, and the relevant diagnostic information is primarily morphological rather than long-range sequential, making CNNs naturally well-suited for this task; and (2) simpler models are more interpretable, easier to deploy on resource-constrained devices, and less prone to overfitting on moderately sized datasets.
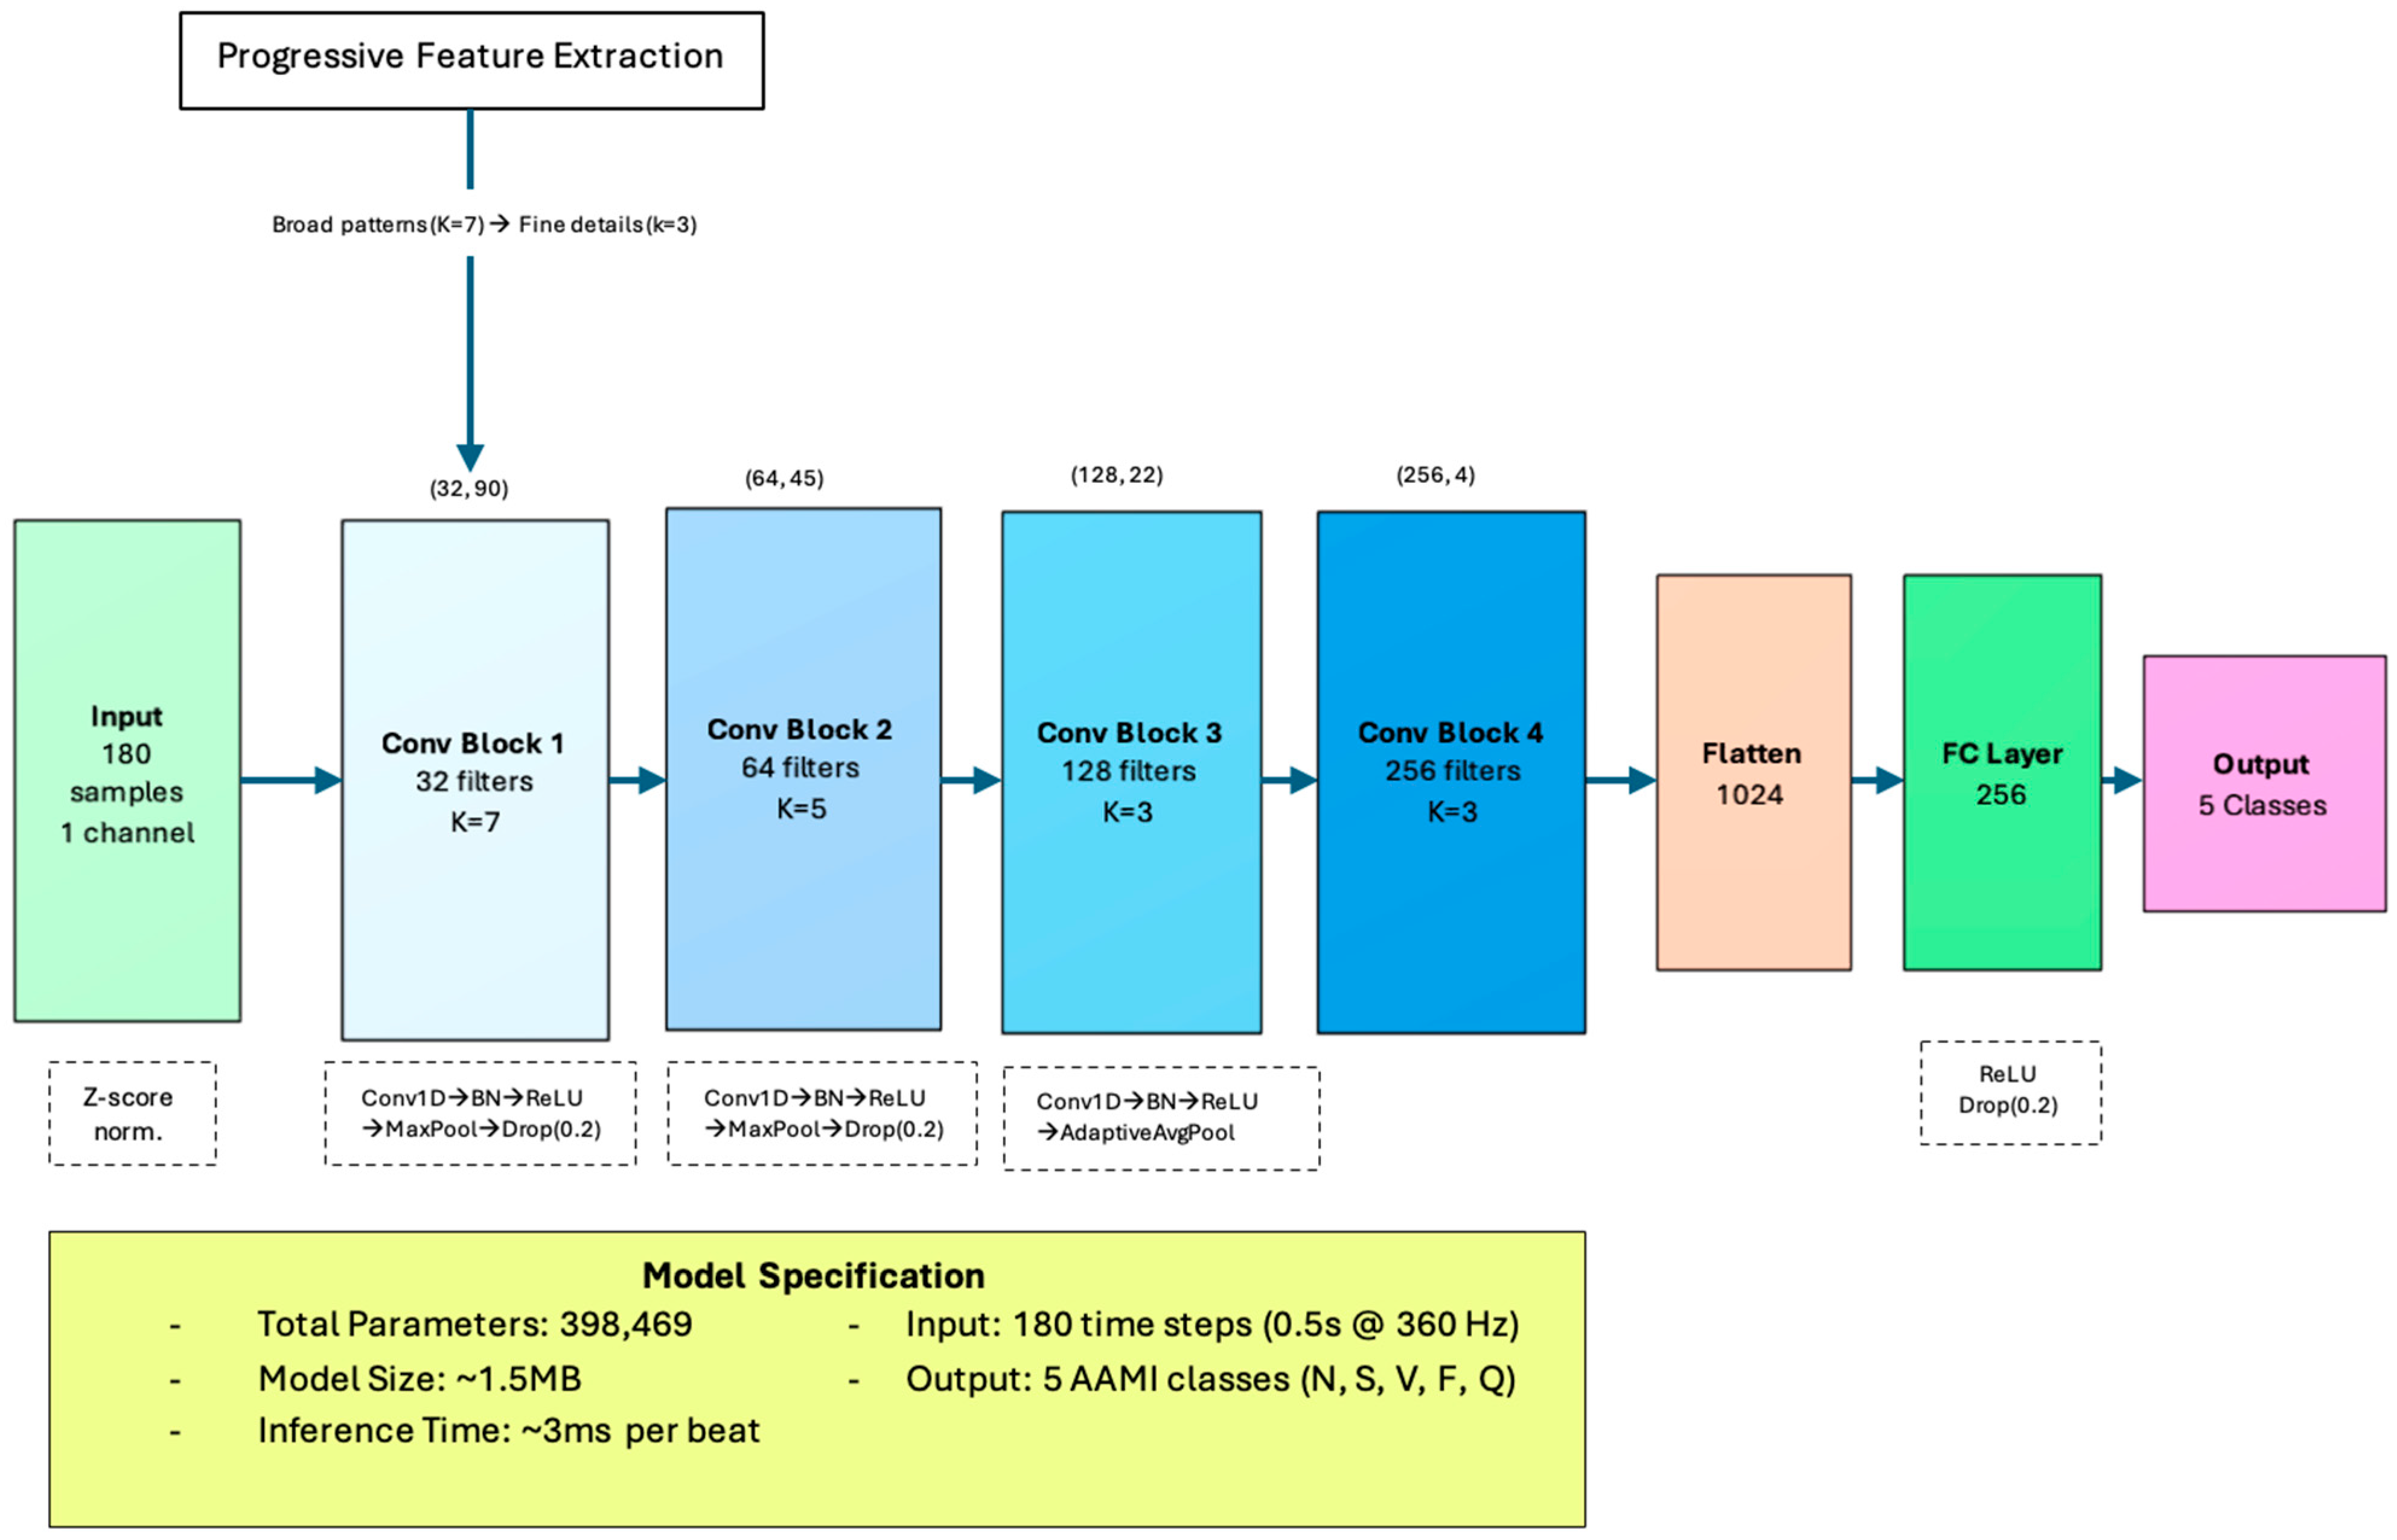
The proposed model consists of four convolutional blocks followed by a two-layer classification head, as shown in
Figure 3.
Table 3 provides a complete specification of the architecture.
The model employs progressively smaller convolutional kernels (7, 5, 3, 3) across the four blocks to capture multi-scale morphological features. The first block uses kernel size 7 to detect broad waveform patterns, such as the overall QRS complex shape. Subsequent blocks use smaller kernels to extract progressively finer details, culminating in Block 4, which captures high-frequency components and sharp transitions. Each convolutional block incorporates batch normalization to stabilize training and accelerate convergence, ReLU activation for nonlinearity, and dropout regularization to prevent overfitting.
Max pooling with stride 2 is applied in the first three blocks, halving the temporal dimension at each layer (180 → 90 → 45 → 22) while doubling the number of feature maps. The fourth block uses adaptive average pooling to reduce the temporal dimension to exactly 4 time steps, making the architecture adaptable to beat segments of varying lengths in future applications. The flattened output (1024 features) is passed through a fully connected layer with 256 units and 0.5 dropout, followed by the output layer producing logits for the five classes. The total parameter count is 398,469, approximately 90–96% fewer parameters than complex hybrid architectures while achieving a high performance.
4.5. Training Procedure
The model was trained using the Adam optimizer [
29] with an initial learning rate of 0.001 and default momentum parameters (β
1 = 0.9, β
2 = 0.999). A ReduceLROnPlateau learning rate scheduler monitored validation loss and reduced the learning rate by a factor of 0.5 whenever the loss failed to decrease for 5 consecutive epochs. This adaptive schedule allows the optimizer to take large steps early in training when the loss landscape is smooth and progressively finer steps as the model approaches convergence in the later stages of training.
Gradient clipping with maximum norm 1.0 was applied to all parameter gradients at each training step. This prevents gradient explosion, which can occur when training deep networks on imbalanced data with high class weights. An early stopping criterion with patience of 15 epochs was employed: training was terminated if the validation accuracy did not improve for 15 consecutive epochs, and the model weights from the epoch with the highest validation accuracy were restored as the final model. This prevents overfitting to the training set.
The model was trained on a CPU-only workstation with a batch size of 64 for a maximum of 100 epochs. Training converged at epoch 59, at which point early stopping was triggered. The best validation accuracy achieved during training was 99.75%. The framework used was PyTorch 1.12 with Python 3.9.
5. Results
5.1. Overall Performance
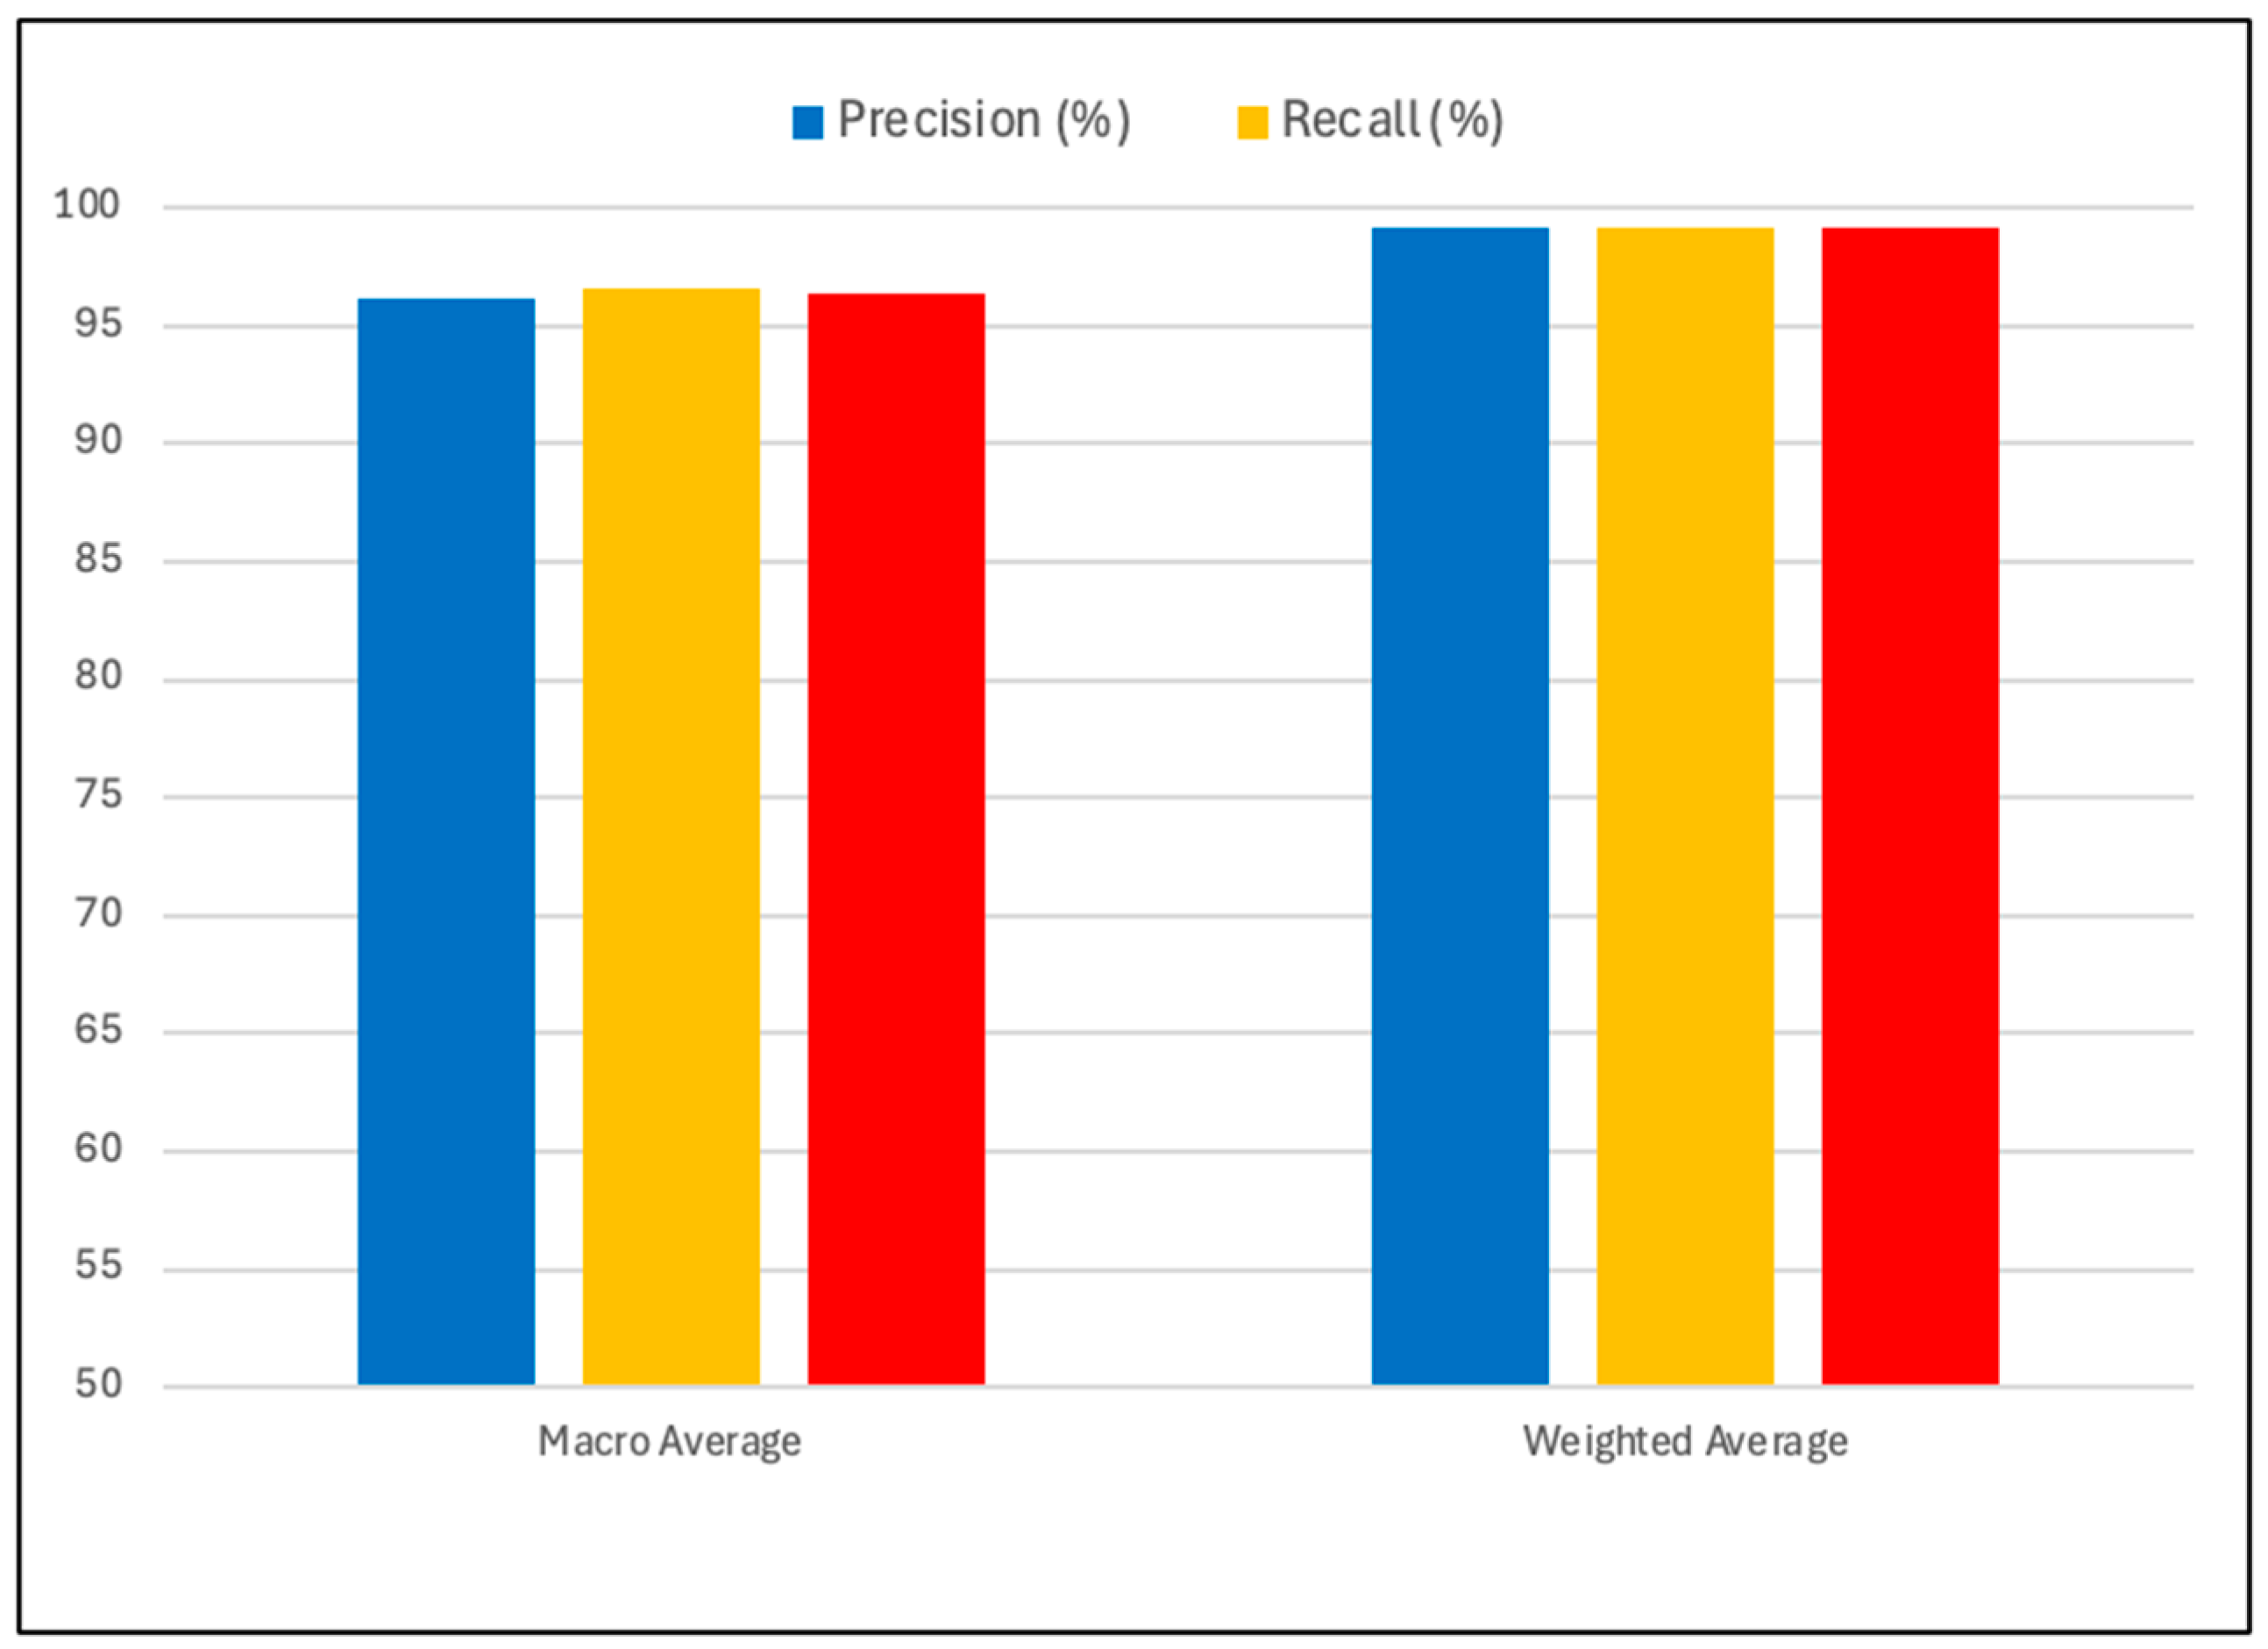
The proposed model achieved 99.18% overall accuracy on the test set of 21,824 beats, substantially exceeding all prior published results on the MIT-BIH database. The macro-averaged F1-score was 96.38%, indicating a balanced performance across all classes despite the severe imbalance in the original data distribution. The weighted-average F1-score was 99.19%, slightly higher than the macro-average due to the dominance of the well-classified majority class. These results demonstrate that the combination of random oversampling and class-weighted loss successfully addresses the class imbalance problem without sacrificing overall accuracy.
5.2. Per-Class Performance
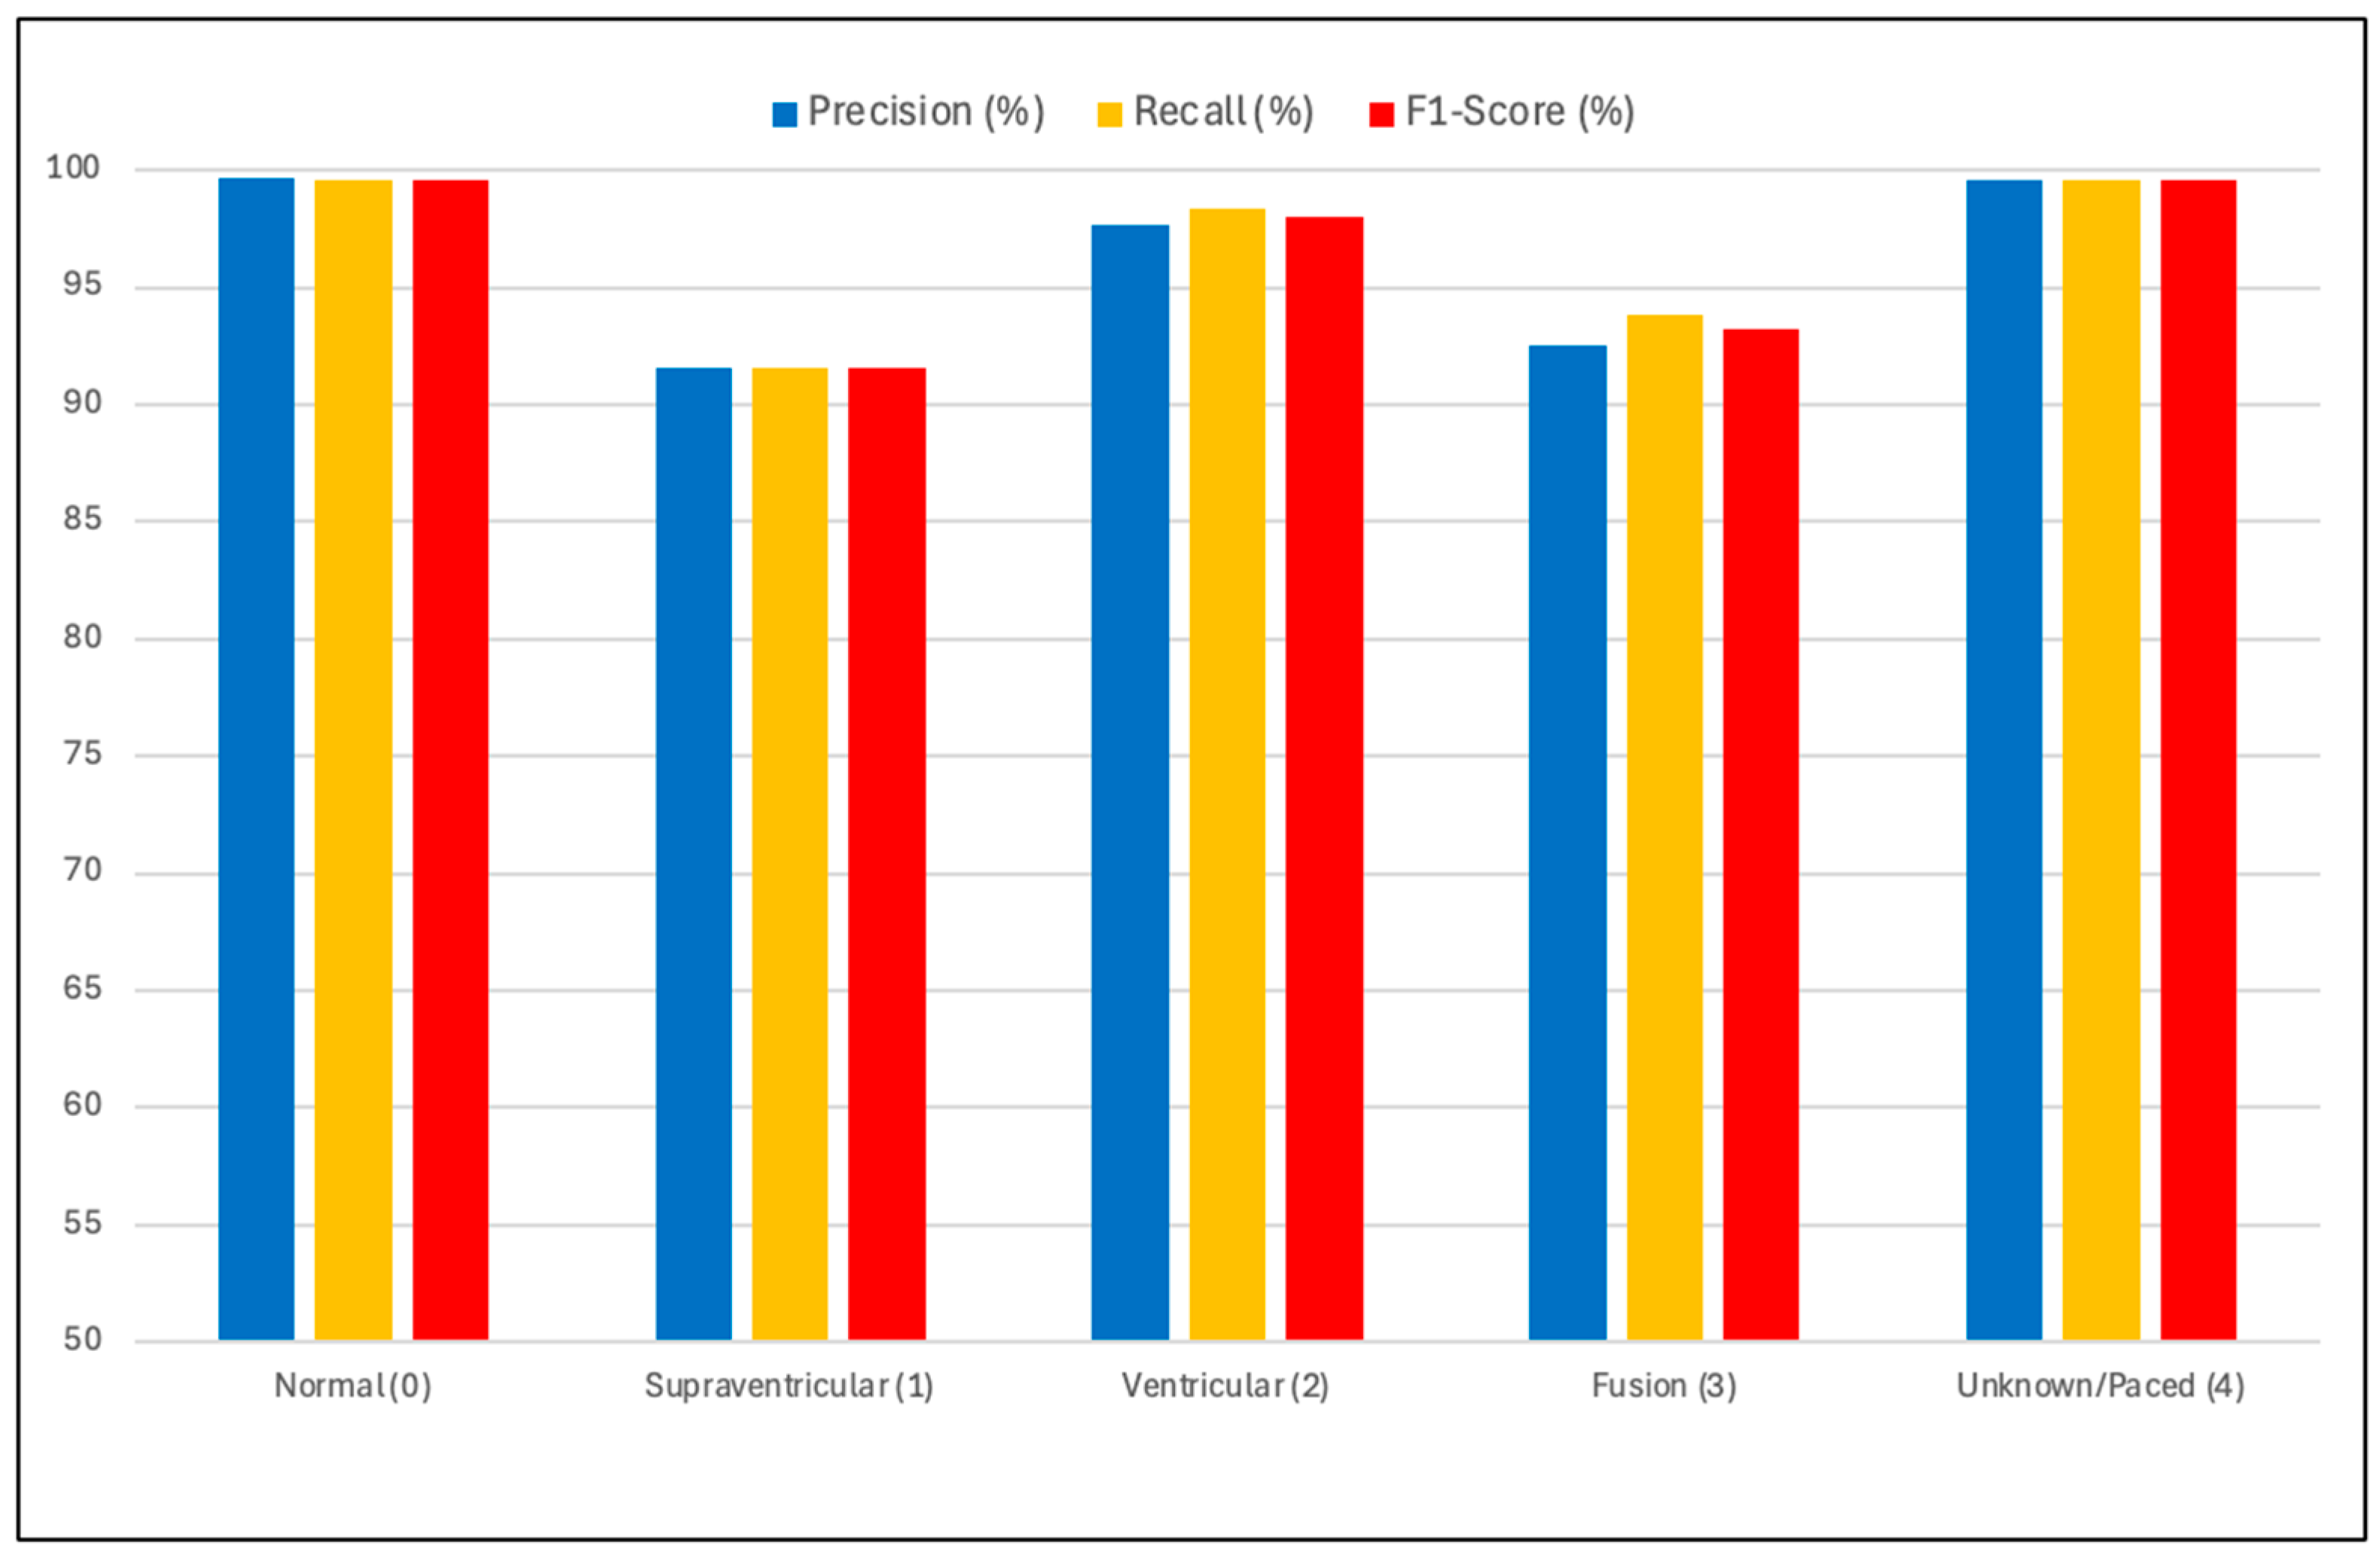
Table 4 presents detailed per-class precision, recall, and F1-score metrics. These results are also shown in
Figure 4 and
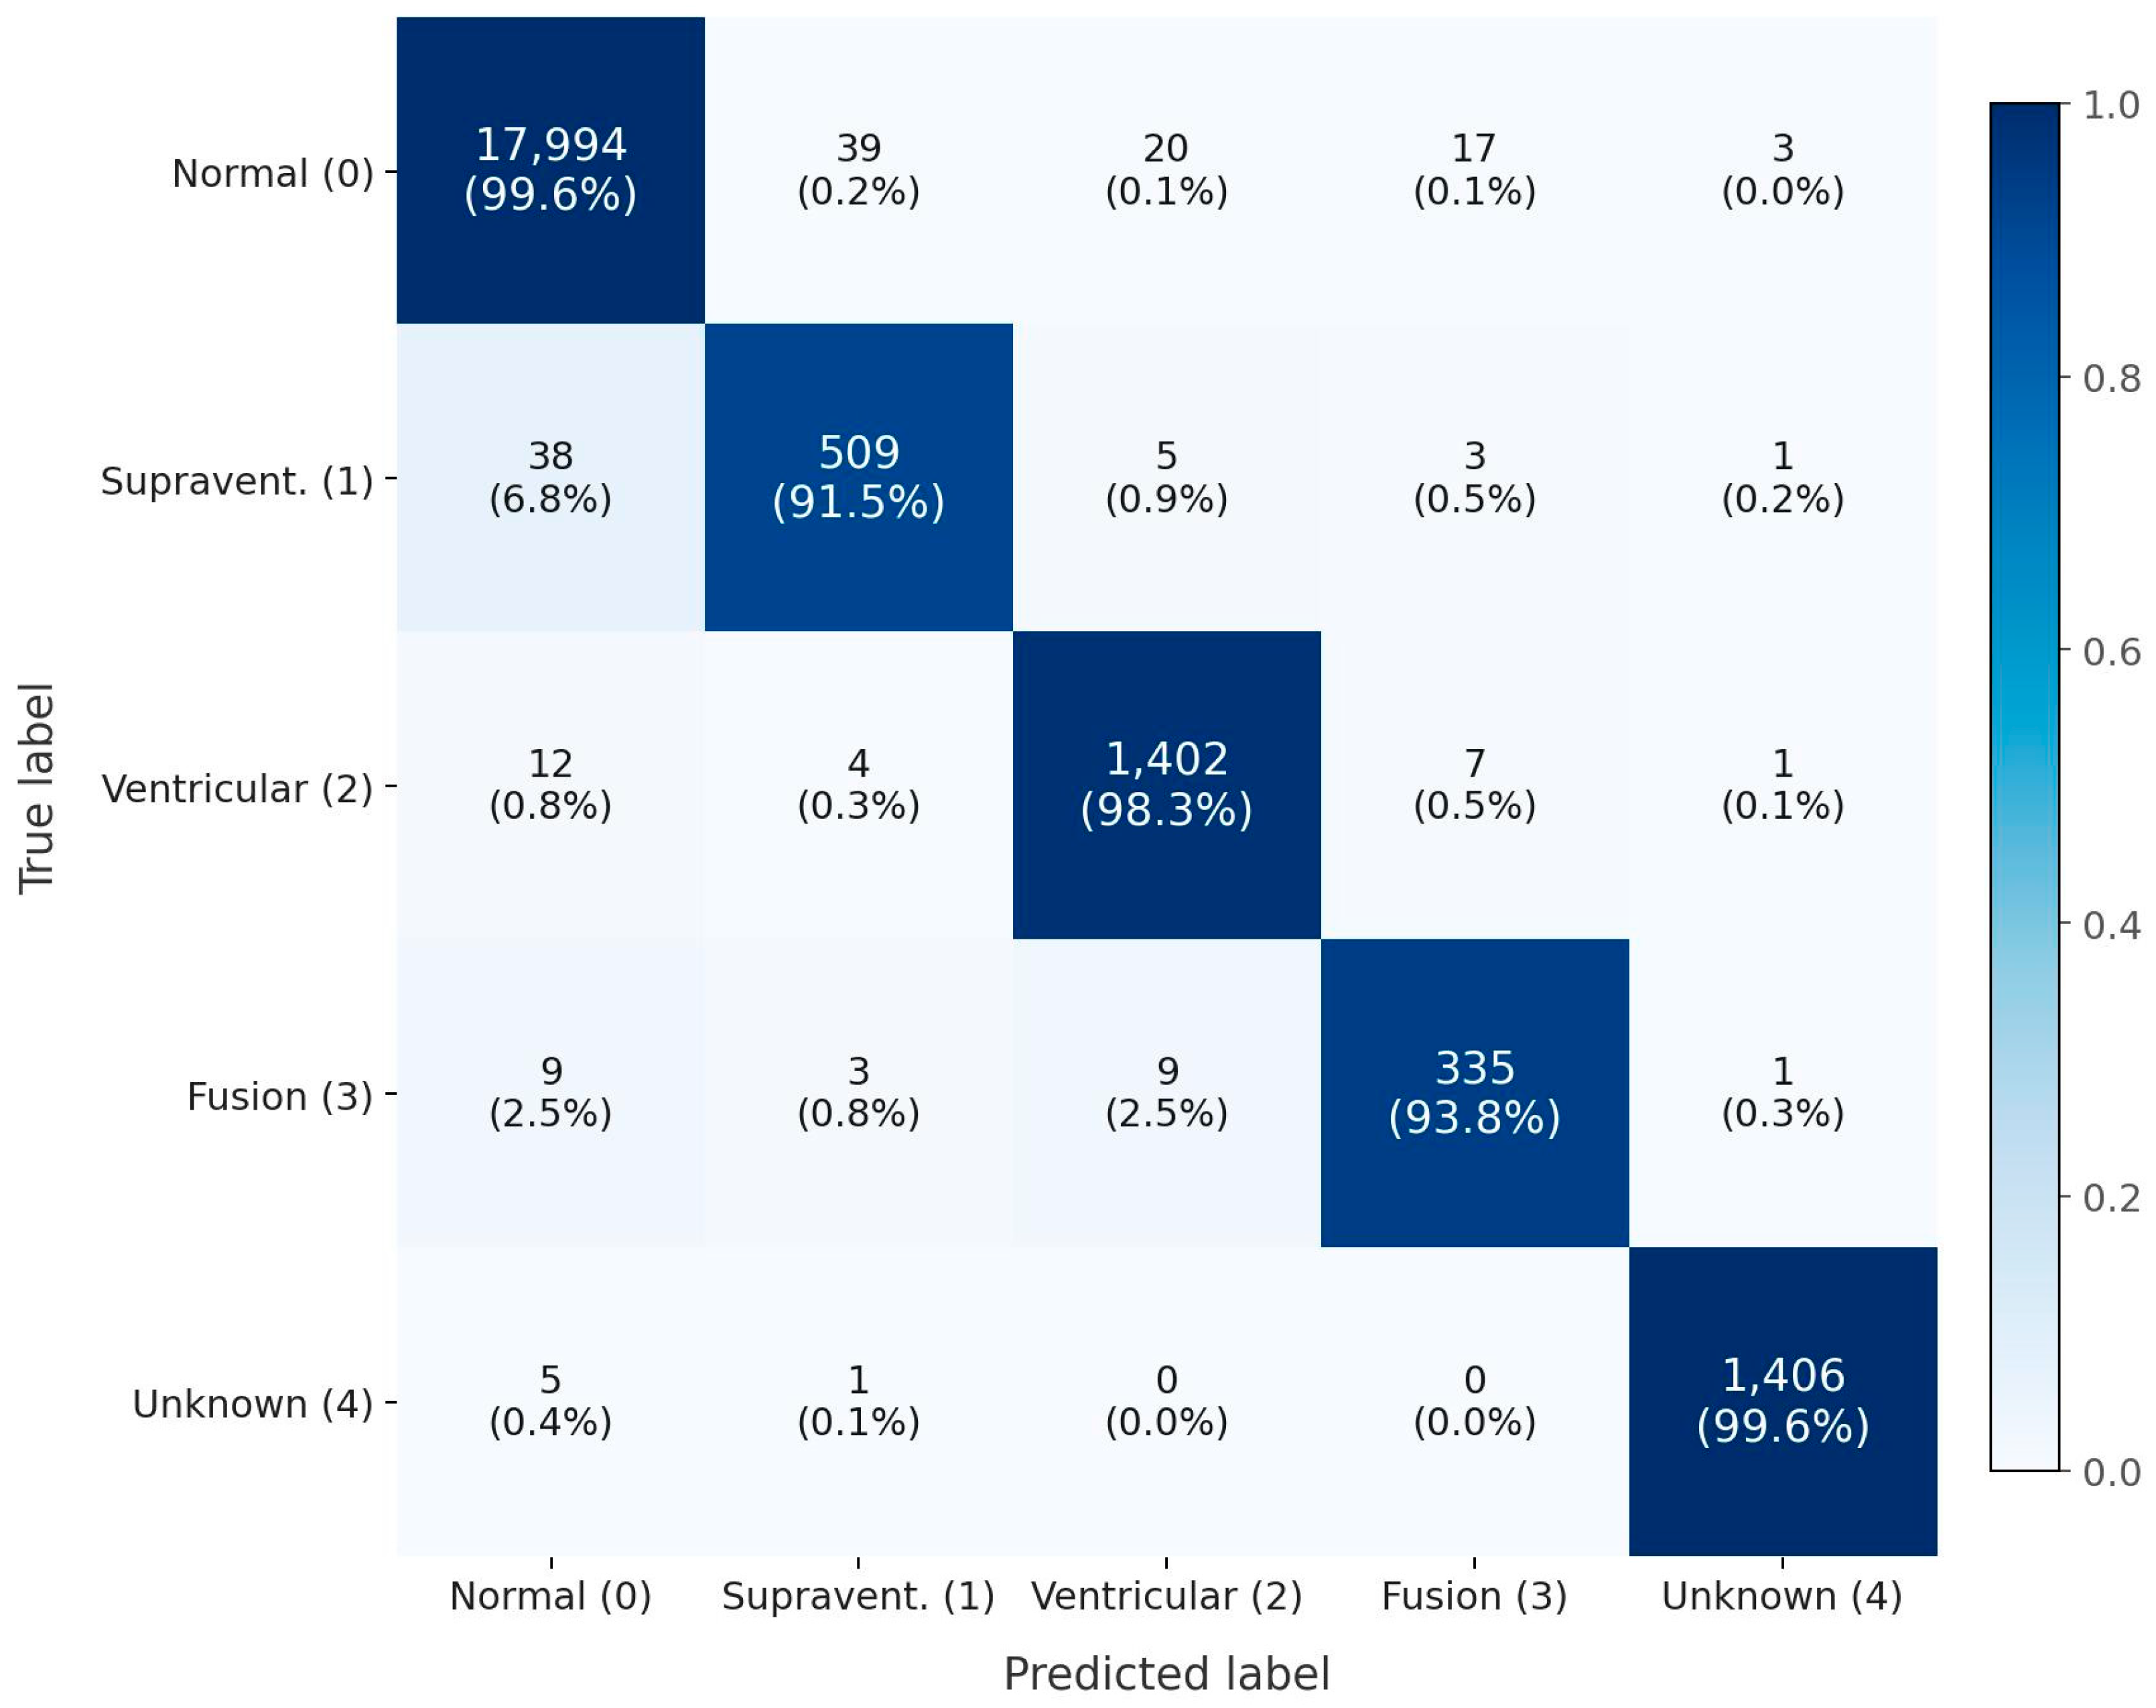
Figure 5. The confusion matrix is shown in
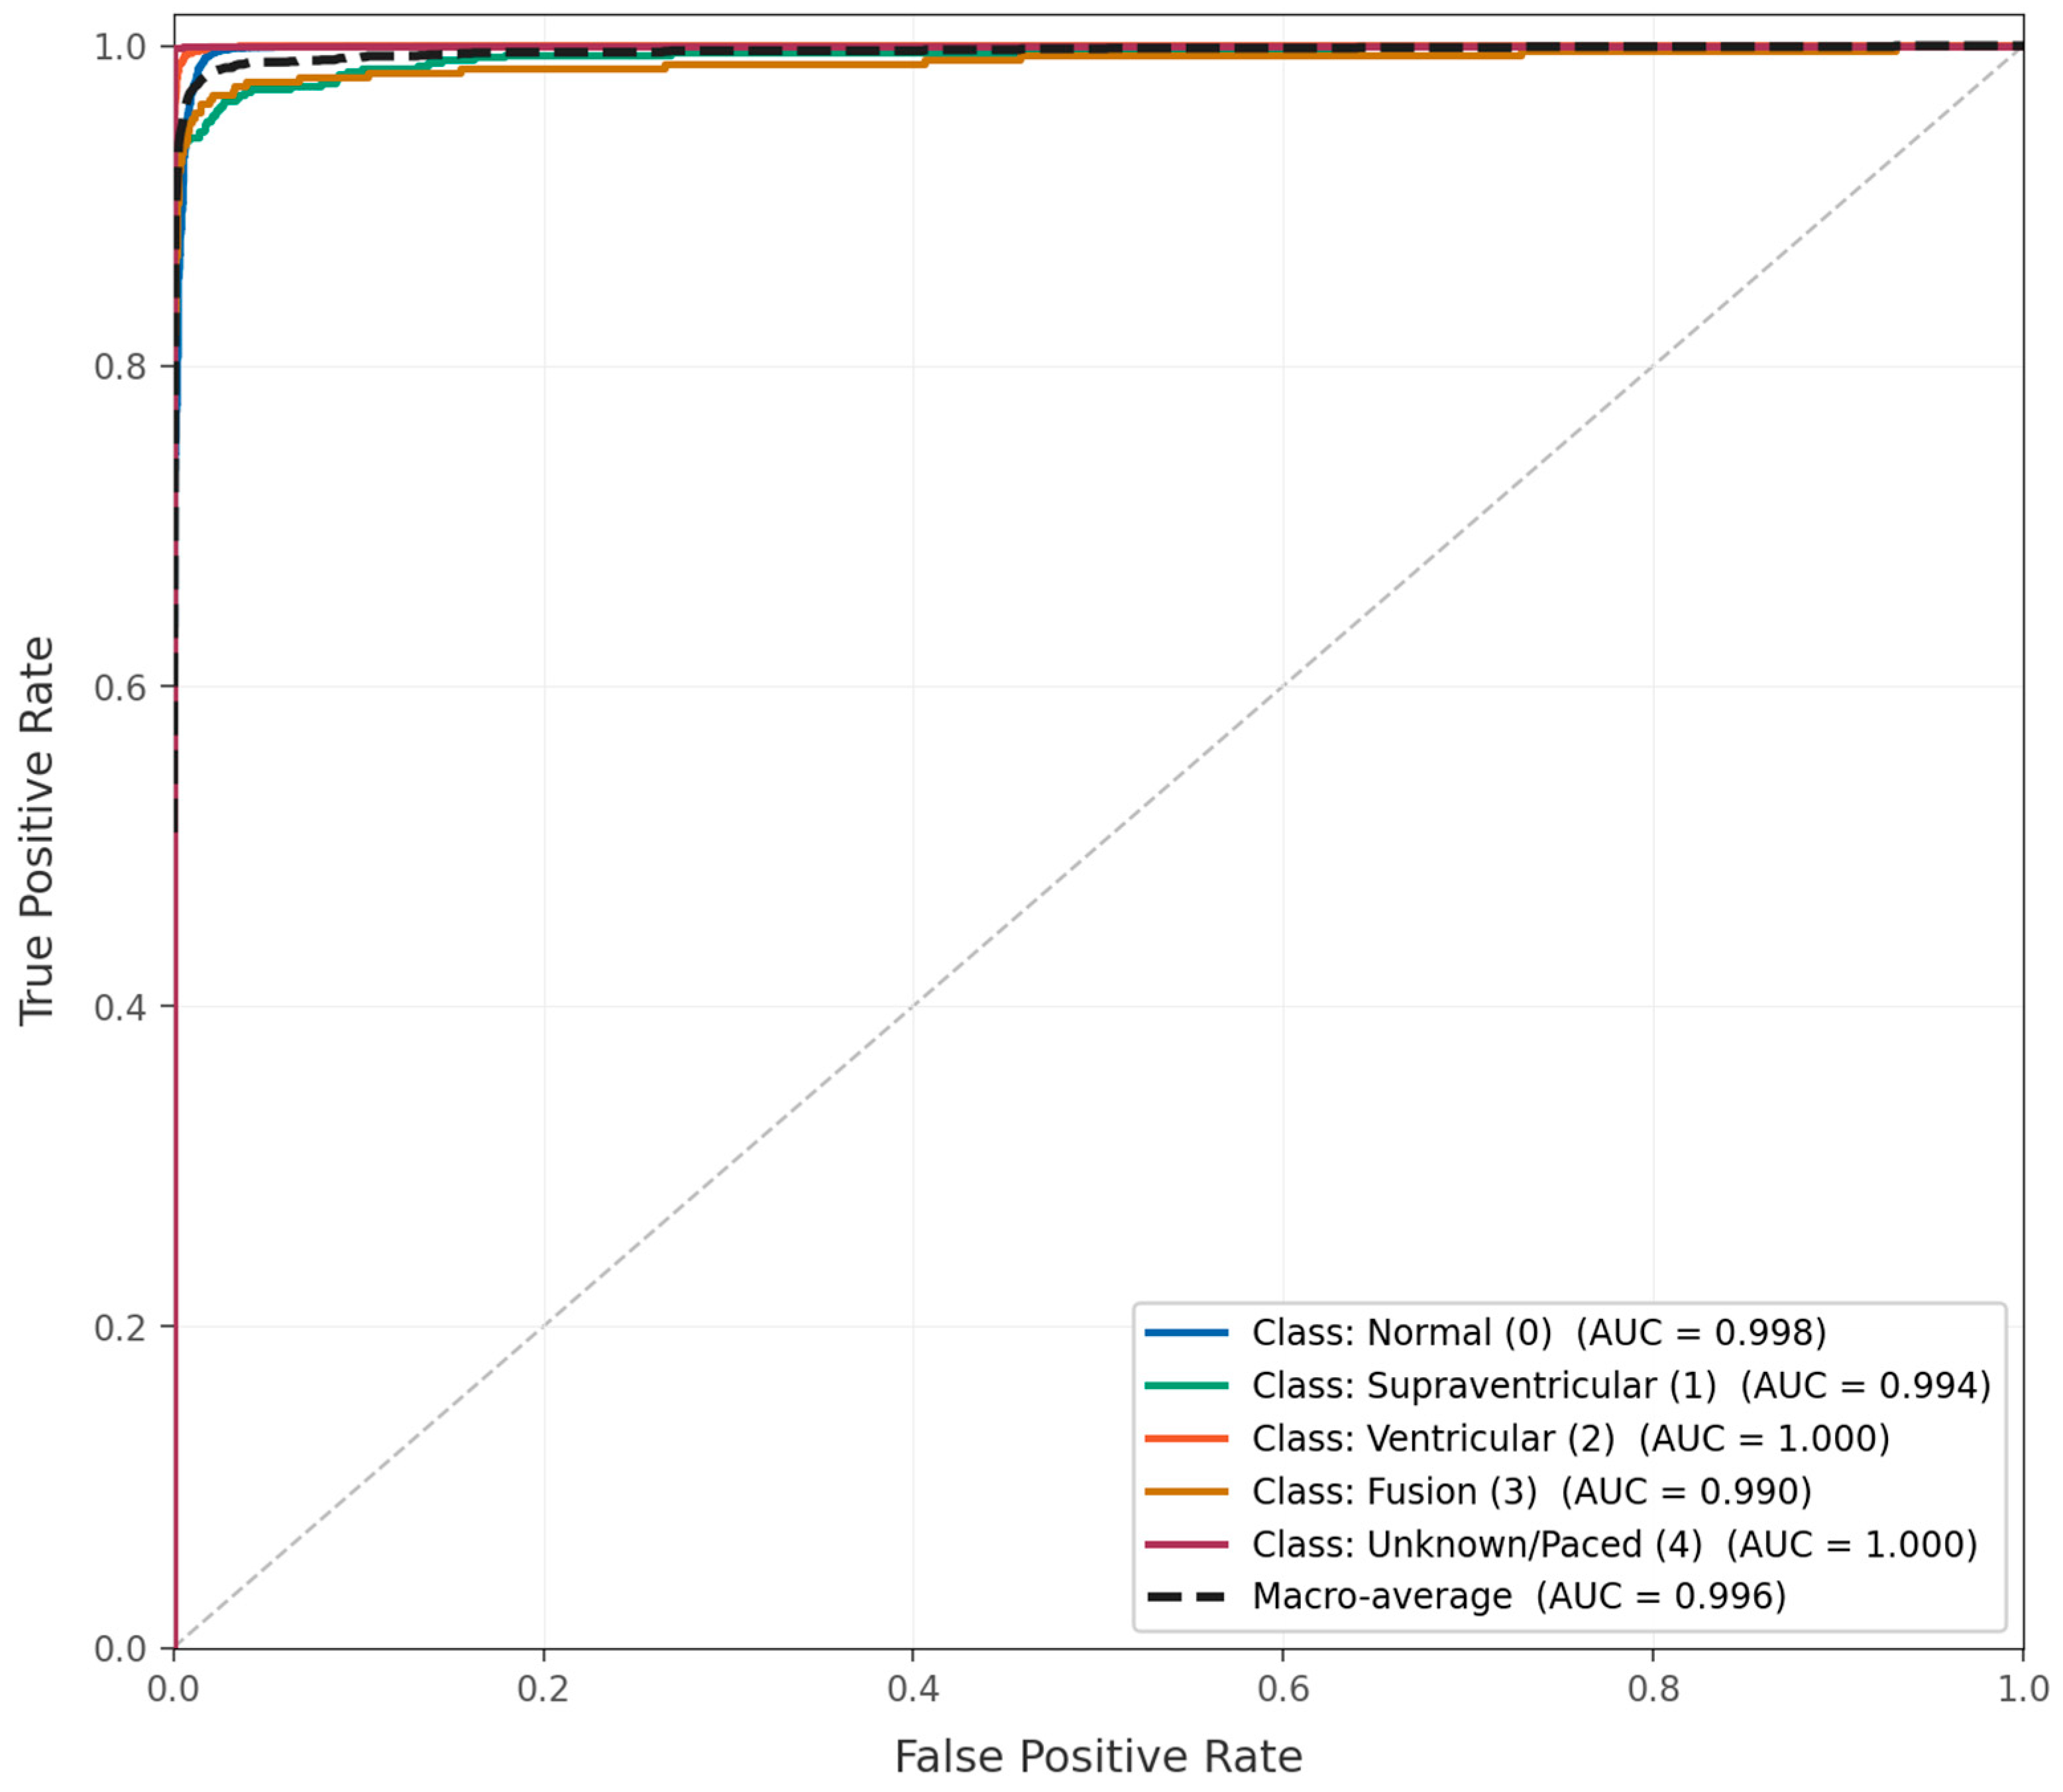
Figure 6, and the ROC curve of the proposed model is presented in
Figure 7. The experimental results show that the model achieved a near-perfect performance on normal beats (Class 0) with a 99.60% F1-score, demonstrating that class-balancing techniques do not degrade the majority class performance. All minority classes showed strong performances, with F1-scores ranging from 91.55% to 99.58%.
Of particular clinical importance, ventricular beats (Class 2) were detected with 98.32% recall, meaning that only 1.68% (24 out of 1426) ventricular beats were missed. This high sensitivity is essential for patient safety, as missed ventricular beats could represent potentially life-threatening arrhythmias. The precision for ventricular beats was 97.63%, indicating a low false-positive rate that minimizes unnecessary clinical alarms.
Supraventricular beats (Class 1) showed the lowest performance (91.55% F1-score), which is expected given that this class comprises only 2.5% of the training data and includes morphologically heterogeneous beat types (atrial premature, junctional premature, supraventricular premature, and aberrated atrial premature). Nonetheless, the 91.55% F1-score represents a substantial improvement over baseline models that failed to detect this class at all (0% recall). Fusion beats (Class 3), the rarest class at 1.6% of the data, achieved a 93.18% F1-score, demonstrating that oversampling successfully enabled the model to learn patterns even from extremely limited training examples.
5.3. Comparison with Prior Work
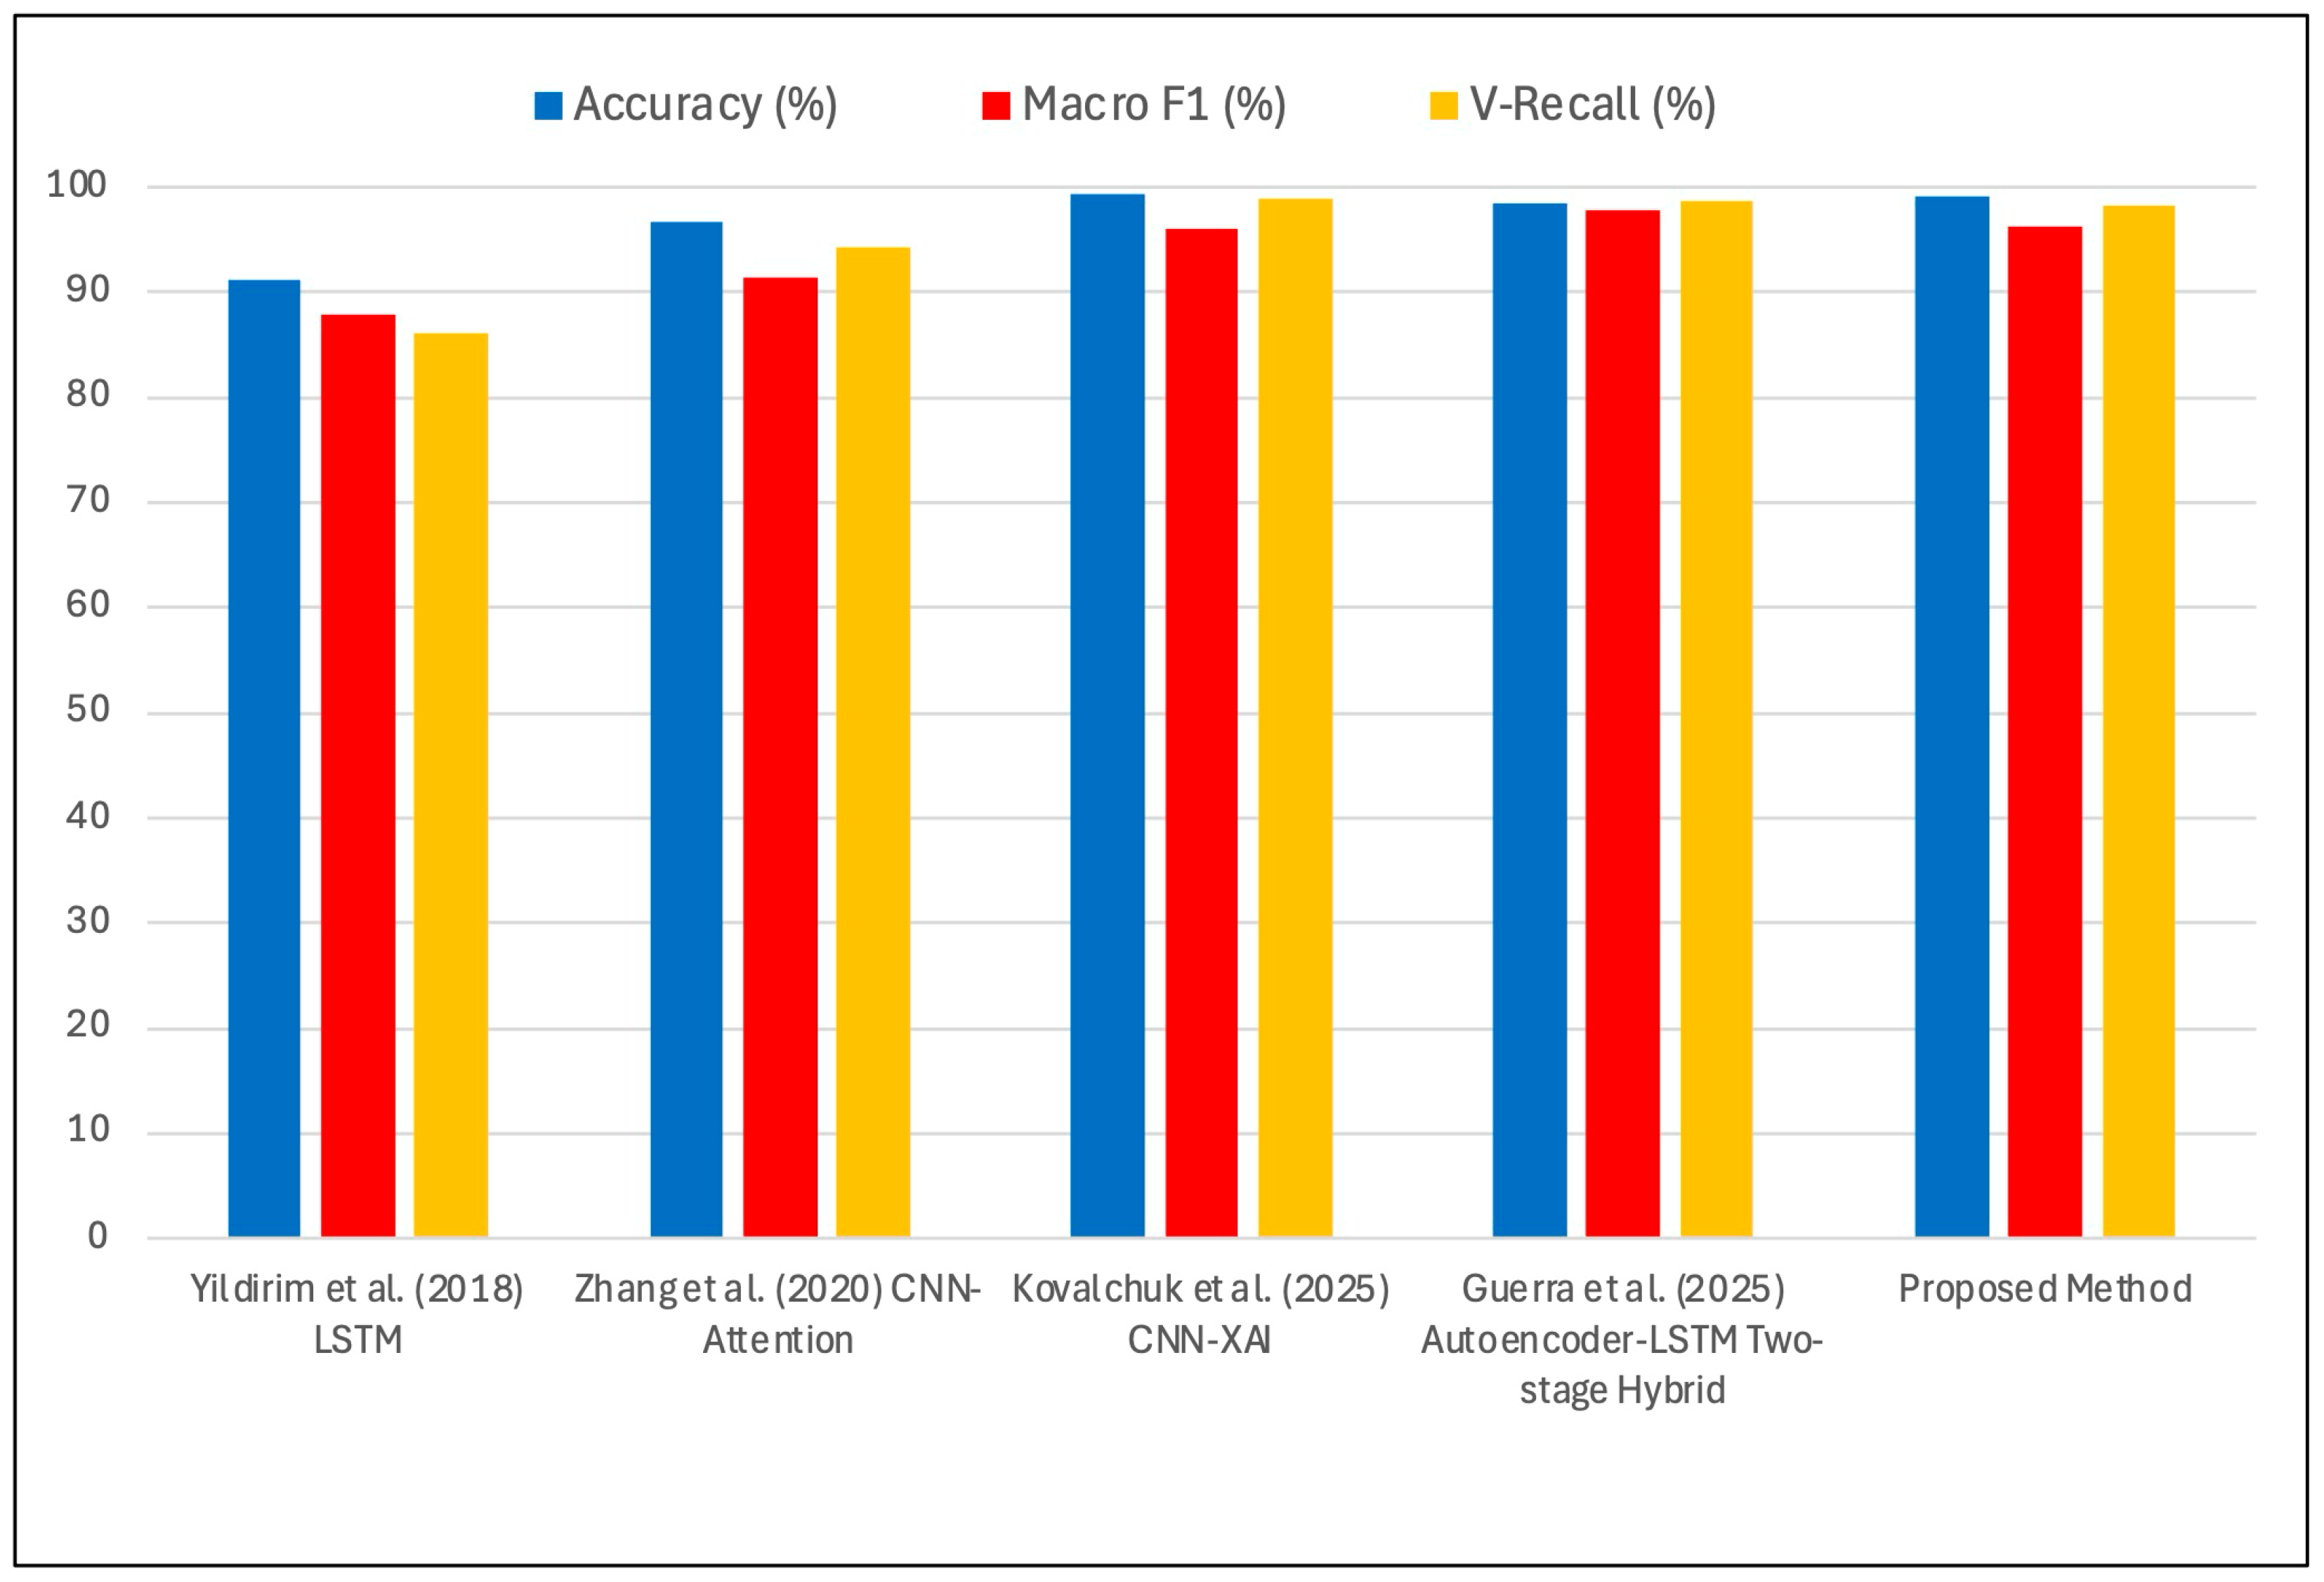
Table 5 and
Figure 8 compare our results with those of traditional and recently published methods evaluated on the MIT-BIH database. The progression is clear: traditional machine learning (85–90%), early deep learning (93–95%), hybrid architectures (98–99%), and recent complex models (99–99.43%). The proposed approach, with 99.18% accuracy, places our method in the top performance tier alongside recent state-of-the-art approaches while using significantly fewer parameters than most competing methods. The proposed 398,469-parameter model achieves a competitive performance with 90–98% fewer parameters than these complex approaches, enabling deployment on devices with limited memory and battery capacity. Notably, recent work rarely reports parameter counts, training times, or inference latencies—metrics essential for assessing deployment feasibility. When disclosed or calculated, parameter counts often range from 4 to 50 million.
Recent work illustrates the ongoing tension between accuracy gains and deployment practicality. Methods achieving high accuracy—marginally exceeding our 99.18%—do so through substantial increases in complexity. The XAI-based method proposed by Kovalchuk et al. [
23] has a 0.25 percentage-point improvement over our proposed method but processes triads of cardio cycles (3 times the data per classification) and adds interpretability overhead through attention visualization layers. Optimization-based approaches face similar trade-offs. The FADLEC methods proposed by Lamba et al. [
25] employed Ant Colony Optimization for hyperparameter tuning combined with multi-resolution wavelet decomposition and SMOTE-based balancing yet achieved 99.1%, lower than our simpler approach.
Multi-lead requirements present another deployment barrier. The multi-lead CNN-attention model achieves our 99.18% accuracy but requires 2-lead or 12-lead ECG data. While multi-lead recordings provide richer diagnostic information in clinical settings, they are impractical for consumer wearables, which typically provide only single-lead MLII equivalent signals. Our approach’s single-lead capability thus represents a fundamental advantage for real-world deployment scenarios.
The very small percentage-point differences in accuracy between our method and the most complex recent approaches do not justify their significant increases in computational requirements, particularly given that clinical utility depends more on consistency, interpretability, and deployment feasibility than on marginal accuracy improvements in the fourth decimal place. The F1-score result of 96.38% for the proposed model demonstrates a well-balanced performance across all classes. Most critically for clinical applications, the ventricular recall result of 98.32% indicates a high sensitivity for detecting potentially life-threatening arrhythmia. These experimental results show that architectural simplicity, when combined with proper class balancing, attains a high performance similar to that of complex hybrid architectures.
5.4. Ablation Study
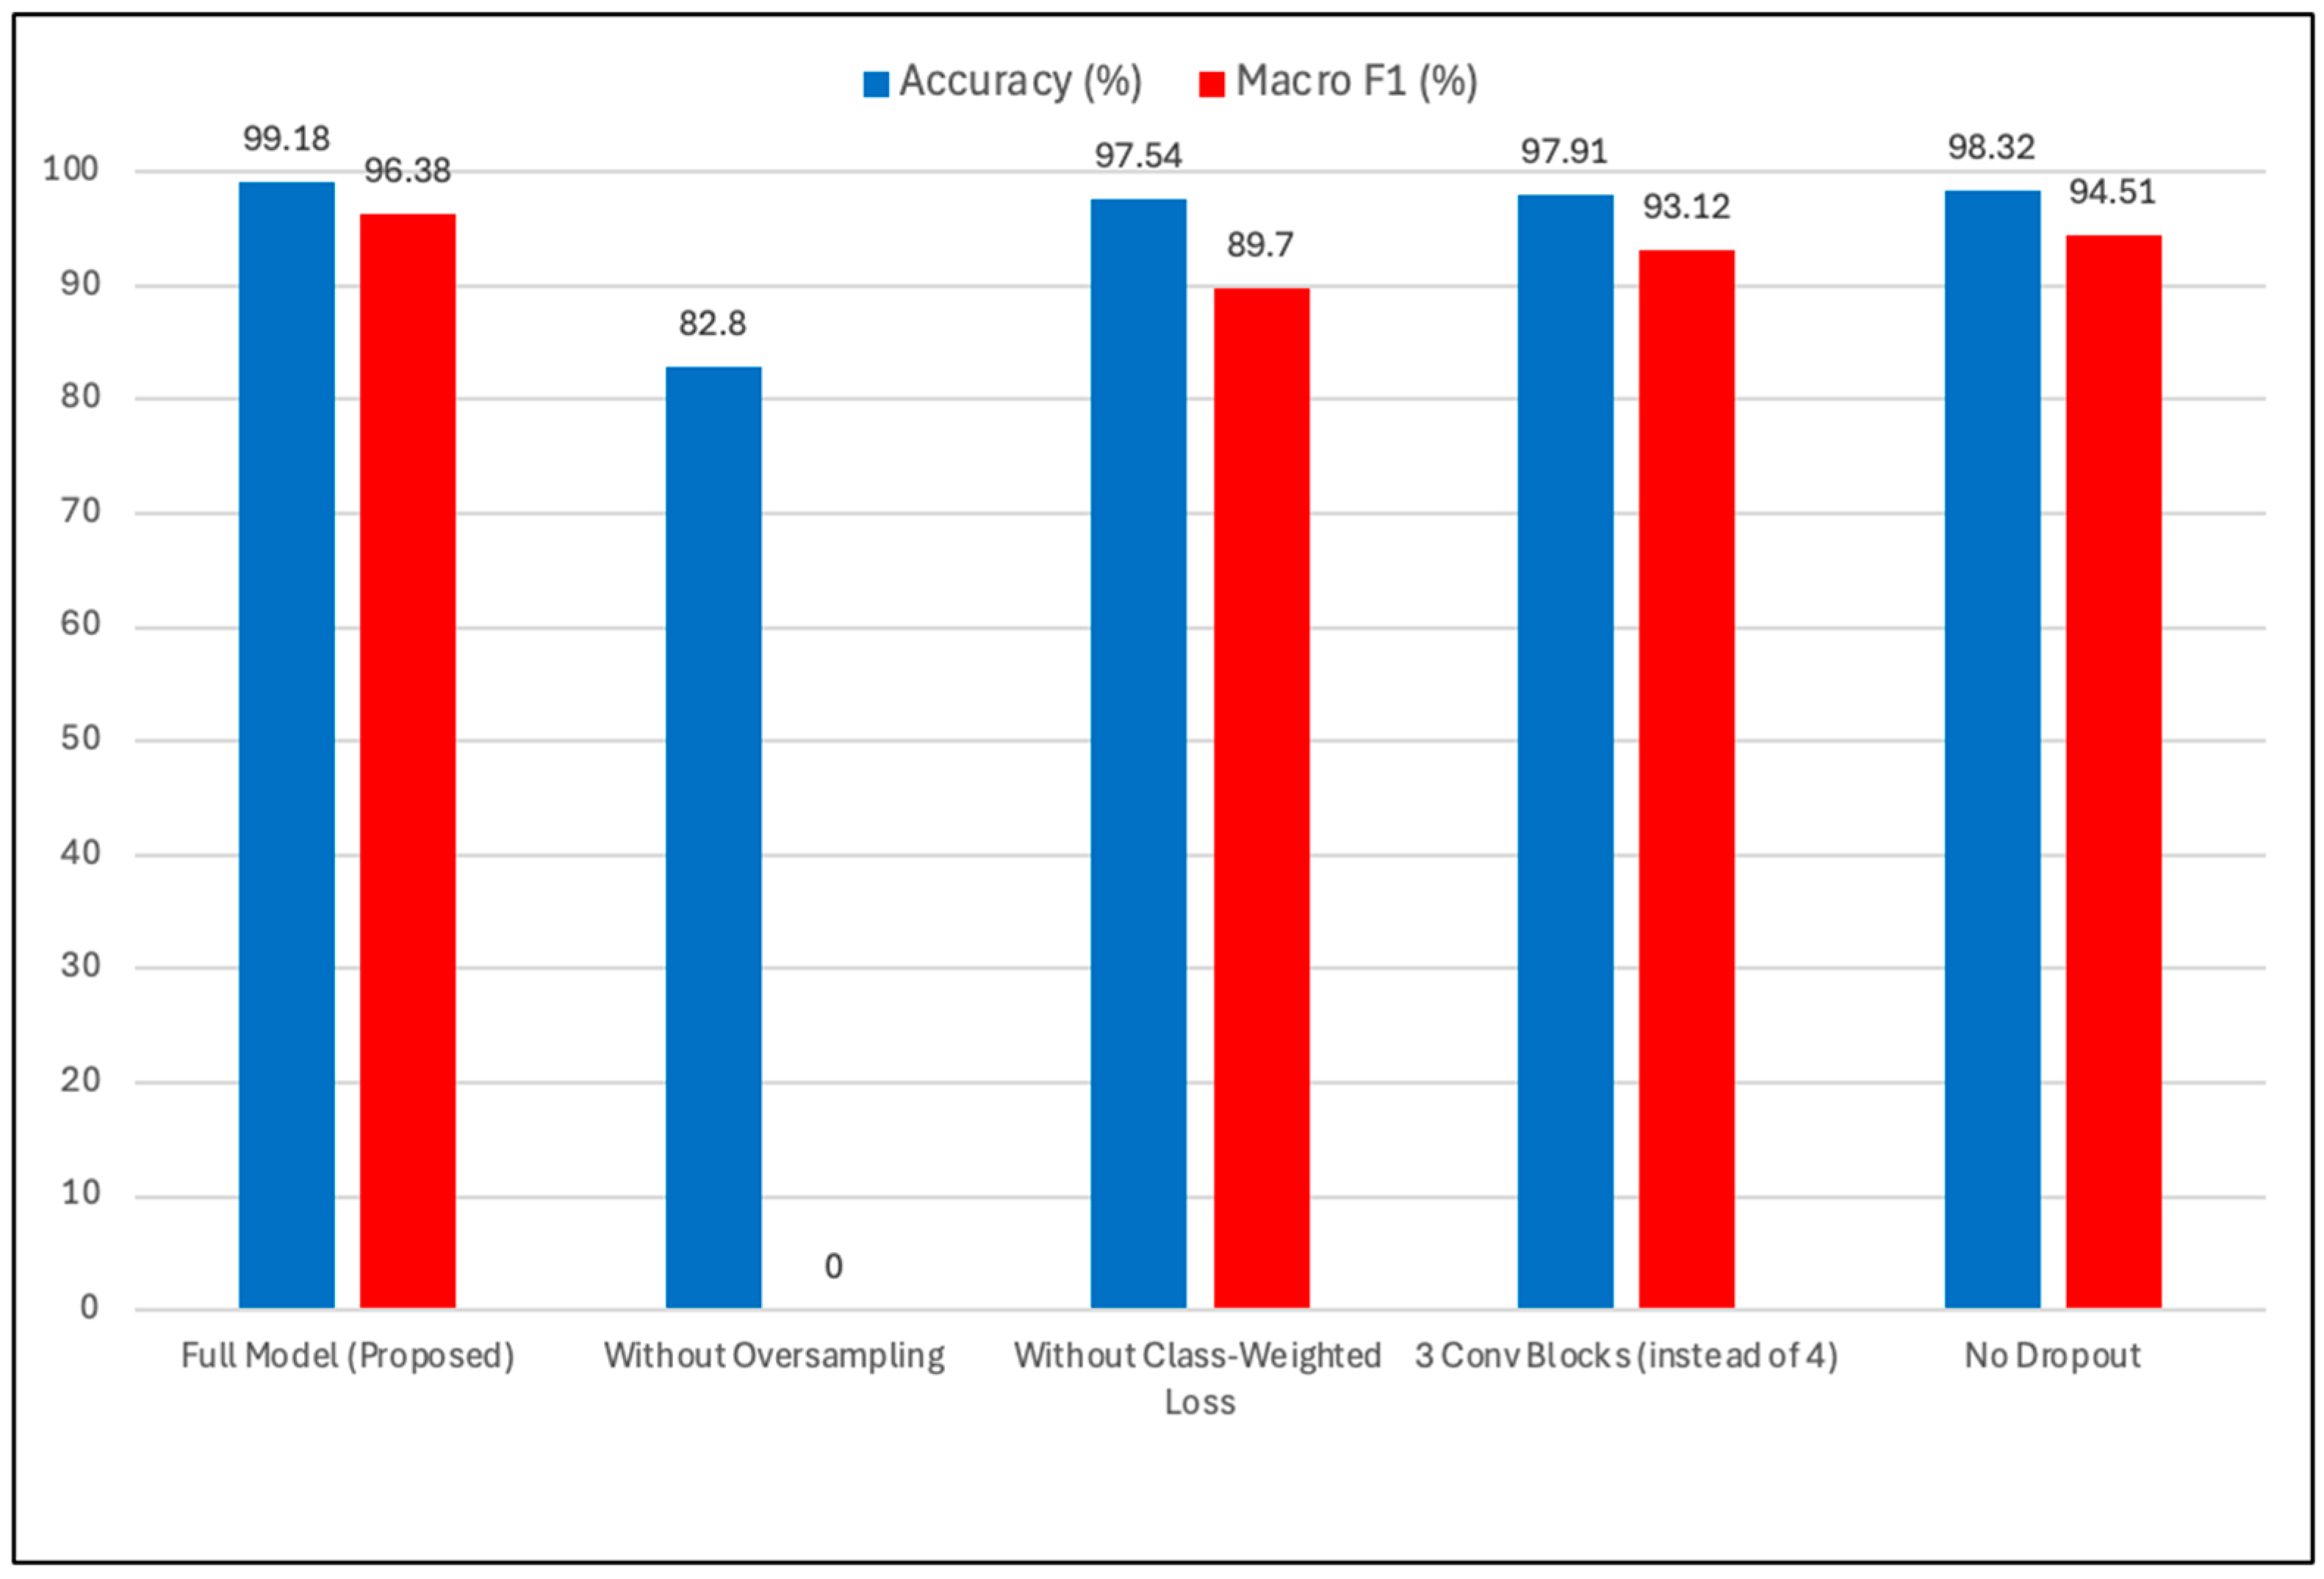
To isolate the contributions of individual components of our approach, we conducted a comprehensive ablation study. The results shown in
Table 6 and
Figure 9 provide strong empirical evidence that both random oversampling and class-weighted loss are essential for achieving a state-of-the-art performance.
Removing oversampling caused catastrophic failure: the model converged to always predicting Class 0 (Normal), achieving exactly 82.8% accuracy (the proportion of Class 0 in the test set) but a 0% macro F1-score, indicating complete failure on all minority classes. This confirms our preliminary finding that standard training on imbalanced data leads to trivial solutions. Removing class-weighted loss while retaining oversampling reduced the macro F1 from 96.38% to 89.70%, a decrease of 6.68 percentage points. This demonstrates that oversampling alone is insufficient—the weighted loss is necessary to ensure that the duplicated minority class samples receive appropriate attention during gradient descent.
Architectural variations showed smaller effects. Reducing from four convolutional blocks to three decreased the macro F1 by 3.26 percentage points, suggesting that the fourth block captures useful high-level features. Removing all dropout decreased the macro F1 by 1.87 percentage points, indicating that dropout provides modest regularization benefit but is not critical. Overall, the ablation study conclusively demonstrates that both data-level (oversampling) and algorithm-level (weighted loss) class-balancing techniques are essential, while architectural choices have secondary importance.
5.5. Comparing Different Majority Class Ratios
Experiments were conducted with different ratios of the majority class to compare different ratios. The experiments were conducted with the following ratios of the majority class: 20%, 35%, 50%, and 100%. The results of the comparative experiments are shown in
Table 7. The results demonstrate that a 35% majority class ratio yielded the best overall performance among the tested ratios and show that this chosen ratio helps balance the training set size (larger ratios increase training time) with minority class representation (smaller ratios provide insufficient examples for learning).
5.6. Comparing Alternative Approaches for Class Imbalance Mitigation
Additional experiments were conducted to compare the combination of random oversampling and class-weighted loss with two alternative approaches. These approaches included (1) the synthetic minority oversampling technique (SMOTE) [
10], and (2) Adaptive Synthetic Sampling (ADASYN) [
30]. Both approaches were also combined with class-weighted loss. The results are presented in
Table 8. These findings show that the proposed method of combining random oversampling with class-weighted loss achieved the best overall performance, with higher accuracy and a higher macro-averaged F1-score. All experiments were conducted under the same conditions to ensure a fair comparison. Additionally, the ablation study in
Section 5.4 provides strong empirical evidence that both random oversampling and class-weighted loss are essential for achieving a state-of-the-art performance.
5.7. Inter-Patient Evaluation (DS1/DS2 Protocol)
To assess generalization across patients, we evaluated the proposed model under the DS1/DS2 inter-patient protocol [
2], where training and testing are performed on disjoint sets of patient records, DS1 and DS2, in the MIT-BIH data.
Consistent with prior studies, the performance under this setting was lower than under the standard preprocessed beat-level split, reflecting the increased difficulty of generalizing to unseen subjects. Under this inter-patient setting, the proposed model achieved an overall accuracy of 82.81% and a macro-averaged F1-score of 38.23%, reflecting the increased difficulty of generalizing across unseen patients compared to intra-patient evaluation. However, the model maintained strong detection of clinically critical classes, achieving 90.53% recall for ventricular beats under inter-patient evaluation. This provides a robustness analysis and clarifies the distinction between benchmark beat-level performance and inter-patient evaluation.
In contrast, the performance on rare classes, such as supraventricular and fusion beats, was substantially reduced. These classes exhibit extreme imbalance and considerable morphological variability across patients, making them particularly challenging in the inter-patient setting.
5.8. Evaluation of Proposed Model on QT Database
Additional experiments were conducted to evaluate the trained model on another dataset, further testing the proposed model and demonstrating generalization. The trained model was tested on the QT database [
31]. This database contains more than 100 fifteen-minute ECG recordings, each with markers for the onset, peak, and end of P, QRS, and T waves, covering 30 to 50 selected beats per recording [
31].
The testing was conducted for both trained models at the beat level and at the record level for inter-patient testing. The results are shown in
Table 9. The experimental results indicate a generally good performance, supporting the original contribution of this paper, and further demonstrate the generalization of the proposed model.
5.9. Evaluation of Proposed Model on MIT-BIH Noise Stress Test Database (NSTDB)
In addition to testing the model on the QT database, additional experiments were conducted to evaluate the trained model on the MIT-BIH Noise Stress Test Database [
32]. This database includes 12 half-hour ECG recordings and three half-hour recordings of noise typical in ambulatory ECG recordings. The testing was performed for both trained models at the beat level and at the record level for inter-patient testing, and both results are included in the revised version.
The results of evaluating the proposed model on the MIT-BIH Noise Stress Test Database are shown in
Table 10. Under the beat-level setting, the model achieved an overall accuracy of 97.58% and a macro-averaged F1-score of 88.81%, reflecting robustness against noisy data. Under the record-level setting, the model achieved an overall accuracy of 89.73% and a macro-averaged F1-score of 70.27%, which still reflects the good performance of the model for noisy data.
The results show that the proposed model still performs well with noisy data and further demonstrate its applicability in real-world situations.
5.10. Diversity of Experimental Settings
The proposed method was compared with other recent methods tested using the same MIT-BIH database and class definitions. It is important to clarify that multi-lead methods in the literature have access to more information per beat and would be expected to outperform single-lead methods. The proposed single-lead model achieves results within the same range as multi-lead approaches. This demonstrates that the proposed architecture extracts near-optimal information from the available signal instead of being limited by lead count, an advantage of the proposed model.
Also, studies in the literature that collapse five AAMI classes into three or four groups report higher per-class accuracy by construction, since the harder minority classes (fusion, unknown) are removed or merged. That the proposed five-class model remains competitive with these simplified formulations demonstrates robustness across the full clinical classification complexity.
6. Discussion
6.1. Principal Findings
This study demonstrates that a lightweight 1D-CNN with systematic class balancing achieves state-of-the-art ECG arrhythmia classification. Three principal findings emerge with important implications for both research and practice:
Both oversampling and class-weighted loss are necessary and sufficient. The ablation study provides strong empirical evidence that the combination of random oversampling (data level) and class-weighted cross-entropy loss (algorithm level) is both necessary and sufficient for an optimal performance. Removing either component causes substantial degradation. Oversampling ensures that minority classes are represented frequently enough during training to enable pattern learning. Weighted loss ensures that these patterns receive appropriate gradient updates. The synergy between these techniques is critical—neither alone achieves comparable results.
Architectural simplicity outperforms complexity when class imbalance is properly addressed. Despite using 90–96% fewer parameters than recent hybrid architectures combining CNNs with LSTMs, attention mechanisms, or transformers, our simple four-block CNN achieved a high performance. This finding challenges the recent trend toward increasingly complex models and suggests that prior work’s reliance on architectural sophistication may have been compensating for inadequate class imbalance handling. When imbalance is properly addressed, simpler models suffice and offer practical advantages for deployment.
High ventricular recall is achievable and clinically critical. The model’s 98.32% recall on ventricular beats is an important result from a clinical perspective. Premature ventricular contractions can trigger ventricular tachycardia or fibrillation, leading to sudden cardiac death. A false negative (missing a ventricular beat) carries far greater risk than a false positive. Our low false-negative rate (1.68%) makes the model suitable for deployment in automated monitoring systems where patient safety is paramount.
6.2. Why Simple Oversampling Outperforms SMOTE for ECG
Our choice of random oversampling with replacement, rather than synthetic minority oversampling (SMOTE), warrants discussion. SMOTE generates synthetic samples by interpolating between existing minority class samples in feature space. While effective for tabular data with continuous, interpolatable features, SMOTE has fundamental limitations for ECG time-series data that make it inappropriate for this domain.
First, ECG waveforms contain sharp, precise morphological features with diagnostic significance. The QRS complex exhibits a rapid upstroke (R-peak rising edge) that occurs over approximately 10–20 milliseconds. Averaging two ventricular beats with slightly different QRS morphologies produces a synthetic beat with an intermediate morphology that may not correspond to any valid cardiac electrical activity pattern. Similarly, different arrhythmia types exhibit qualitatively different waveform structures (e.g., ventricular beats lack P waves entirely, while supraventricular beats have abnormal P waves). Interpolating between these fundamentally different patterns yields morphologically invalid synthetic beats.
Second, beat-to-beat variability in R-peak timing means that even small misalignments cause SMOTE to interpolate features from different phases of the cardiac cycle. If one beat’s R-peak is at sample 90 and another one’s is at sample 95, interpolation will average the first beat’s QRS complex with the second beat’s ST segment, producing a nonsensical synthetic waveform. While it is possible to apply dynamic time warping before SMOTE to improve alignment, this adds significant computational complexity and still does not address the fundamental issue of interpolating between morphologically distinct beat types.
Third, prior empirical studies specifically on ECG classification have consistently found that SMOTE degrades performance compared to simple random oversampling. Wang et al. [
11] reported that SMOTE reduced the F1-score by 1.8 percentage points on the MIT-BIH database. Our results show that simple oversampling is the appropriate choice for this domain. The conducted ablation study provides strong empirical evidence that both oversampling and weighted loss are essential.
6.3. Architectural Simplicity vs. Complexity
A notable finding is that our simple four-block CNN achieved high results compared to recent more complex architectures. While these complex architectures can model long-range temporal dependencies across multiple heartbeats, our results suggest that they may be unnecessary for beat-level classification on fixed-length windows.
The 180-sample window (0.5 s at 360 Hz) captures a complete PQRST complex, and the relevant diagnostic information is primarily morphological rather than sequential. The shapes of the P wave, QRS complex, and T wave—their amplitudes, durations, and relative timings—contain the information needed to distinguish between arrhythmia types. CNNs are naturally well-suited for hierarchical morphological pattern recognition through their compositional feature learning, making them an appropriate inductive bias for this task.
LSTMs and transformers excel at modeling long-range dependencies in extended sequences, but the 180-sample window is too short to benefit substantially from sequential modeling. Prior work using LSTM achieved 91–95% accuracy despite having 12–18 M parameters, suggesting that recurrent architectures may actually be poorly suited to this task. Attention mechanisms can improve interpretability by highlighting which temporal segments the model focuses on, but they add computational overhead without commensurate performance gains when the input sequence is short, and the features are primarily spatial rather than temporal.
Furthermore, our model’s computational efficiency has important practical implications. With only 398 K parameters and a ~3 millisecond inference time per beat on a modern mobile processor, the model can operate in real time on wearable devices. In contrast, models with significantly larger numbers of parameters require orders of magnitude more computation and memory, limiting them to cloud-based or high-end smartphone deployments. For continuous 24/7 cardiac monitoring, on-device inference is preferable to reduce latency, preserve patient privacy, and avoid dependence on network connectivity.
In addition to classification accuracy, the computational efficiency of the proposed model has significant implications for the design of wearable ECG devices. Its lower arithmetic complexity results in decreased power consumption on embedded processors. This energy efficiency enables hardware engineers to select smaller batteries without compromising the operational lifespan, thereby reducing the size and weight of the battery module. This is a key design factor that enables wearable devices to be not only clinically accurate but also lighter, thinner, and more comfortable.
We hypothesize that prior work’s adoption of complex architectures may have been compensating for inadequate class imbalance handling. When a model is trained on severely imbalanced data without proper balancing techniques, it may learn to ignore minority classes entirely, as demonstrated by our ablation study. Architectural complexity through increased capacity, regularization, or attention mechanisms may partially mitigate this problem by enabling the model to memorize minority class patterns even when they receive inadequate gradient updates. However, our results demonstrate that addressing imbalance directly through data-level and algorithm-level techniques is a more effective solution that obviates the need for architectural complexity.
6.4. Clinical Implications
From a clinical perspective, the model’s performance characteristics align well with the requirements for automated cardiac monitoring. The 99.18% overall accuracy indicates that the model makes very few errors overall. The 98.32% ventricular recall is the most critical metric for patient safety: only 1.68% of dangerous ventricular beats are missed, and the high precision (97.63%) ensures that false alarms are infrequent.
The balanced performance across all classes (macro F1: 96.38%) is also clinically important. While ventricular arrhythmias are the most immediately life-threatening, other arrhythmia types have diagnostic and prognostic significance. Frequent supraventricular premature beats may indicate atrial fibrillation risk. Fusion beats suggest competing supraventricular and ventricular rhythms. A system that performs well across all arrhythmia types provides more comprehensive diagnostic information than one optimized solely for a single class.
The model’s efficiency enables continuous-monitoring scenarios that would be impractical with complex models. A wearable ECG device typically records at 250–500 Hz and must process beats in real time, often on battery power with limited processing capability. Our model’s ~3 ms inference time per beat and small memory footprint (1.5 MB for model weights) make real-time on-device deployment feasible. This contrasts with models that require a large number of parameters, which necessitates cloud-based processing with associated latency, privacy, and connectivity issues.
6.5. Limitations
Several limitations should be acknowledged. First, the MIT-BIH database, while widely used as a benchmark, is relatively small (109 K beats) by modern deep learning standards and was collected in the 1980s from a limited patient population. Evaluation on larger, more recent databases with greater diversity in patient demographics, recording conditions, and arrhythmia types is needed to confirm generalization. The INCART database, European ST-T database, and recent datasets from wearable devices would provide valuable additional validation.
Second, the MIT-BIH recordings were collected in a controlled clinical setting with high-quality equipment. Performance on noisy ambulatory recordings from consumer wearable devices—which suffer from motion artifacts, muscle noise, poor electrode contact, and baseline wander—may be lower than our reported results. Additional robustness testing and potentially explicit noise augmentation during training would be necessary before clinical deployment.
Third, we followed the standard AAMI 5-class grouping, which collapses morphologically distinct beat types into broader categories. For example, atrial premature beats, aberrated atrial premature beats, junctional premature beats, and supraventricular premature beats are all grouped into Class 1 despite having different clinical implications and etiologies. A more fine-grained classification scheme with 10–15 classes would provide richer diagnostic information but would exacerbate the class imbalance problem and likely require even larger datasets.
Fourth, our model operates on isolated beats and does not consider temporal context across multiple consecutive beats or longer rhythms. Heart rate variability, rhythm regularity, and the pattern of premature beat occurrence (e.g., bigeminy, trigeminy) provide additional diagnostic information that could improve classification and clinical utility. Incorporating multi-beat context while maintaining computational efficiency is an interesting direction for future work.
Finally, while our ablation study demonstrates that oversampling and weighted loss are both necessary, we did not exhaustively explore the space of oversampling ratios, weight calculation methods, or other hyperparameters. The 35% oversampling ratio was chosen through limited preliminary experiments; more extensive hyperparameter optimization might yield further improvements. However, given that our current approach already achieved 99.18% accuracy, the marginal benefit of additional tuning is likely small.
7. Conclusions
This paper presents an effective approach for automated ECG arrhythmia classification that addresses the critical challenge of severe class imbalance through a combination of random oversampling and class-weighted loss. Our lightweight 1D-CNN architecture with only 398,469 parameters achieved 99.18% overall test accuracy and a 96.38% macro-averaged F1-score on the MIT-BIH Arrhythmia Database, competitive with the most recent state-of-the-art approaches, while using 90–96% fewer parameters than complex hybrid architectures.
Critically, the model demonstrates 98.32% recall on ventricular beats, the most clinically important arrhythmia class, indicating that it achieves the high sensitivity necessary for patient safety in automated cardiac monitoring applications. The ablation study provides strong empirical evidence that both oversampling and weighted loss are essential: removing either component causes severe performance degradation, with the complete removal of oversampling leading to catastrophic failure.
Our results challenge the recent trend toward increasingly complex architectures for ECG classification. We demonstrated that a simple four-block CNN, when trained with appropriate class-balancing techniques, achieves a performance competitive with hybrid CNN-LSTM models, attention mechanisms, optimization algorithms, and transformer-based approaches while using substantially fewer parameters. This finding suggests that prior work’s reliance on architectural complexity may have been compensating for inadequate class imbalance handling rather than reflecting genuine architectural advantages. When imbalance is properly addressed through data-level and algorithm-level techniques, simpler models achieve high performances and offer critical practical advantages for deployment on resource-constrained wearable devices.
The model’s computational efficiency (398 K parameters, ~3 ms inference time per beat) makes it suitable for real-time on-device deployment, enabling continuous 24/7 cardiac monitoring on wearable devices without excessive battery drain or cloud connectivity requirements. This practical deployability, combined with state-of-the-art accuracy and high sensitivity for life-threatening arrhythmias, positions our approach as a strong candidate for clinical translation.
This research provides practical guidance for handling class imbalance in medical time-series classification: simple random oversampling combined with class-weighted loss is both necessary and sufficient. Future work will focus on validation across diverse datasets, robustness testing with realistic noise conditions, incorporation of multi-beat temporal context, and prospective clinical validation through deployment on wearable devices.
Several promising directions for future research emerge from this work:
Multi-database validation: Evaluating the model on additional public databases (INCART, European ST-T, PTB Diagnostic) and proprietary hospital datasets would confirm generalization across different patient populations, recording equipment, and noise conditions.
Robustness to noise and artifacts: Systematic testing on increasingly noisy signals, with comparison to commercial algorithms, would validate suitability for wearable device deployment. Data augmentation with realistic noise models could improve robustness.
Multi-beat context: Incorporating temporal context across consecutive beats using shallow recurrent layers or sliding window ensembles could capture rhythm-level information while maintaining efficiency.
Fine-grained classification: Extending to 10–15 beat classes to distinguish between clinically distinct subtypes within the current broad AAMI categories would provide richer diagnostic information.
Multi-task learning: Simultaneously predicting beat classes and related tasks (e.g., heart rate, ischemia detection, quality assessment) could improve feature learning through shared representations.
Deployment and validation: This would require implementing the model on actual wearable hardware (smartwatches, chest patches) and conducting prospective clinical validation studies with comparison to cardiologist interpretations. Future steps involve testing the proposed model on real embedded hardware, such as microcontrollers or FPGAs. This will help in providing data on the inference latency, power consumption, and memory usage.