Article

Effects of Friction and Viscous Forces on Fluid Invasion

School of Mechanical Engineering, Guangxi University, Nanning 530004, China
*
Author to whom correspondence should be addressed.
Appl. Sci. 2026, 16(11), 5305; https://doi.org/10.3390/app16115305
Submission received: 30 April 2026 / Revised: 15 May 2026 / Accepted: 21 May 2026 / Published: 25 May 2026
(This article belongs to the Special Issue Novel Advances in Fluid Mechanics)

Abstract

Multiphase flow involving fluids and particles is inherently complex due to the coupled effects of viscosity, capillary forces, and particle-scale friction. The fluids exhibit viscous behavior, which manifests as instabilities at the interface; changes in fluid viscosity also significantly affect the interface. In this study, we injected aqueous solutions of varying viscosities into a layer of dry, hydrophobic particles. As the viscous and frictional forces changed, we observed alterations in the number and width of the finger-like invasion patterns. When the pressure gradient exceeds a critical threshold, the finger-like structures expand radially outward. The fractal dimension of the invasion patterns was calculated using the standard box-counting method applied to binarized invasion masks, allowing the space-filling degree and morphological transition of the patterns to be quantified under different particle layer filling ratios, injection rates, particle sizes, and liquid viscosities.

1. Introduction

Viscous multiphase flow involving two fluids and a particulate material is widely observed in various natural and industrial settings [1,2]. Particles originate from a wide range of sources, including: debris generated during rock fracturing and erosion; mineral crystals formed by chemical reactions between fluids and the host medium; particles or solid pollutants (such as microplastics) transported by fluid-carried solutes; and particulate proppants used in energy extraction. However, the complex flow processes involving particles and fluids within particulate media are difficult to observe directly. Consequently, elucidating the flow patterns and governing mechanisms of gas–liquid-particle multiphase flow in particulate media has become a leading international scientific challenge in the fields of Earth resources, the environment, and disaster management. In such particulate multiphase flows, the phenomenon of fluid intrusion—where one fluid displaces another immiscible fluid—is widespread. For example, biogas emissions from swamps, estuaries, and lakes [3], as well as methane emissions through sediments, constitute significant sources of greenhouse gas emissions into the atmosphere. Methane flux rates are closely related to complex gas migration [4], and seafloor gas emissions have led to the formation of seafloor continental shelf pockmarks [5]. Other examples in nature include volcanic and magmatic systems, where gas (volatiles) migration through extensive crystal and melt systems influences eruption behavior and the release of large volumes of gas into the atmosphere [6]. In industry, gas-driven fracturing in soil and porous media is a key process for enhancing production in sensitive oil and gas reservoirs [7], for pneumatic fracturing to improve contaminated soil remediation [8], and for carbon dioxide injection and storage. In enhanced oil recovery, the phenomenon of gas migration within porous media is also particularly important. Gas-driven (pneumatic) fracturing differs from the well-known hydraulic fracturing or “fracking” process used to extract shale gas and oil [9,10,11,12,13].
This flow behavior is governed by the competition between capillary and viscous forces. The presence of particulate matter introduces solid friction, which joins viscosity, capillary action, and gravity as a controlling force. The multitude of interacting elements and forces can lead to instabilities and the emergence of complex patterns [14], rendering these multiphase friction flows inherently difficult to predict or control. These flows are more complex than single-phase flows, as momentum, mass, and energy transfer can occur across phase interfaces. In multiphase flows, the complex interactions between particles and fluid typically take place within the particulate medium [15], where interfacial instabilities cause interfaces to deform and stretch, thereby triggering intricate interfacial dynamics [16].
Since Saffman and Taylor first discovered viscous finger-injection (classic Saffman–Taylor instability) in Hele–Shaw cell experiments [17], the Hele–Shaw cell model has been widely used to study fluid displacement interface instabilities in multiphase flow. Viscous finger growth is a classic example of unstable flow: a low-viscosity fluid in the flow cell displaces a high-viscosity fluid. Any bulge at the interface steepens the pressure gradient within the high-viscosity fluid and accelerates its growth, resulting in a finger-like pattern [18].
Studies have shown that the unstable flow of particulate materials—including suspended particles [19] and particles settled within a protective fluid—can give rise to a variety of flow regimes, including: viscous advection of suspended particles [20], frictional advection [21,22], channeling [23,24], and capillary fracturing [25,26].
For mobile particles, soil pushing occurs whenever capillary forces are strong enough to overcome friction between the particles and the wall [27,28], as well as between the particles themselves (i.e., the capillary inlet pressure must be sufficiently greater than the frictional resistance to sliding and rearrangement). This bulldozing behavior further destabilizes the system, as the accumulation of particles on the interface defense side hinders uniform displacement [29], leading to the formation of cracks [30], fingers and other patterns [31,32,33], the specific morphology of which depends on the injection rate and the fraction of the fill.
For systems of mobile particles, flow exhibits friction-controlled invasion morphology at all rates. However, there has been limited research on the competitive mechanisms between viscous and frictional forces. To address this, this paper explores this competition through an experimental system. Here, we use the Hele-Shaw model for experimental studies, employing dry hydrophobic particles as the displaced fluid (with air as the wetting phase), with pure water or glycerol-water solutions of varying viscosities serving as the invading fluid. By varying the particle diameter, layer filling ratio, injection rate, and viscosity of the injected fluid, we systematically discuss the fluid invasion patterns under high-viscosity radial spreading conditions and elucidate the competitive mechanisms among frictional, capillary, and viscous forces.
Compared with previous studies on viscous fingering and drainage in Hele–Shaw cells, the present study focuses on liquid invasion into a dry hydrophobic granular layer, where the displaced phase is air and the particles are mobile. This configuration differs from classical Saffman–Taylor experiments, in which two fluids are displaced without explicit particle rearrangement, and also differs from drainage experiments in water-saturated granular media. For example, Islam et al. analyzed air invasion in a water-saturated vertical Hele–Shaw cell and used fractal dimensions to distinguish capillary invasion, viscous fingering, and fracturing. In contrast, the present study isolates the role of particle-layer confinement and particle-scale friction in a dry hydrophobic medium, and quantifies the resulting morphology using finger number, finger width, asymmetry ratio, and fractal dimension. The main contribution is therefore not the observation of fingering alone, but the combined quantification of viscosity-controlled and friction-influenced invasion patterns in a mobile-particle Hele–Shaw system.

2. Materials and Methods

2.1. Materials

Commercial hydrophobic agent (a 2 wt% solution in hydrofluoroether (HFE) of a fluorine-modified acrylic-resin): Shenzhen Weijing High Tech Materials Technology Company (Shenzhen, China). pure water (Res istivity 18.25 MΩ·cm; Total Organic Carbon < 5 ppb; Microbial Count < 1 cfu/mL; Particle Count (diameter > 0.2 μm) < 1/mL): Chongqing Yiyang Enterprise Development Co., Ltd. (Chongqing, China). glycerol: Changzhou Qidi Chemical Co. (Changzhou, China). Glass grains (composition: SiO2 > 67%, CaO > 8%; surface roughness Ra: 1.2 ± 0.1 μm): Hongsheng Trading House, Luanzhou City, China. Glass plates (SiO2 = 72.5 ± 0.5%, CaO = 9.5 ± 0.5%, Na2O = 14 ± 0.3%): Shenzhen Tesi Optoelectronics Technology Company (Shenzhen, China).

2.2. Preparation of Experiment

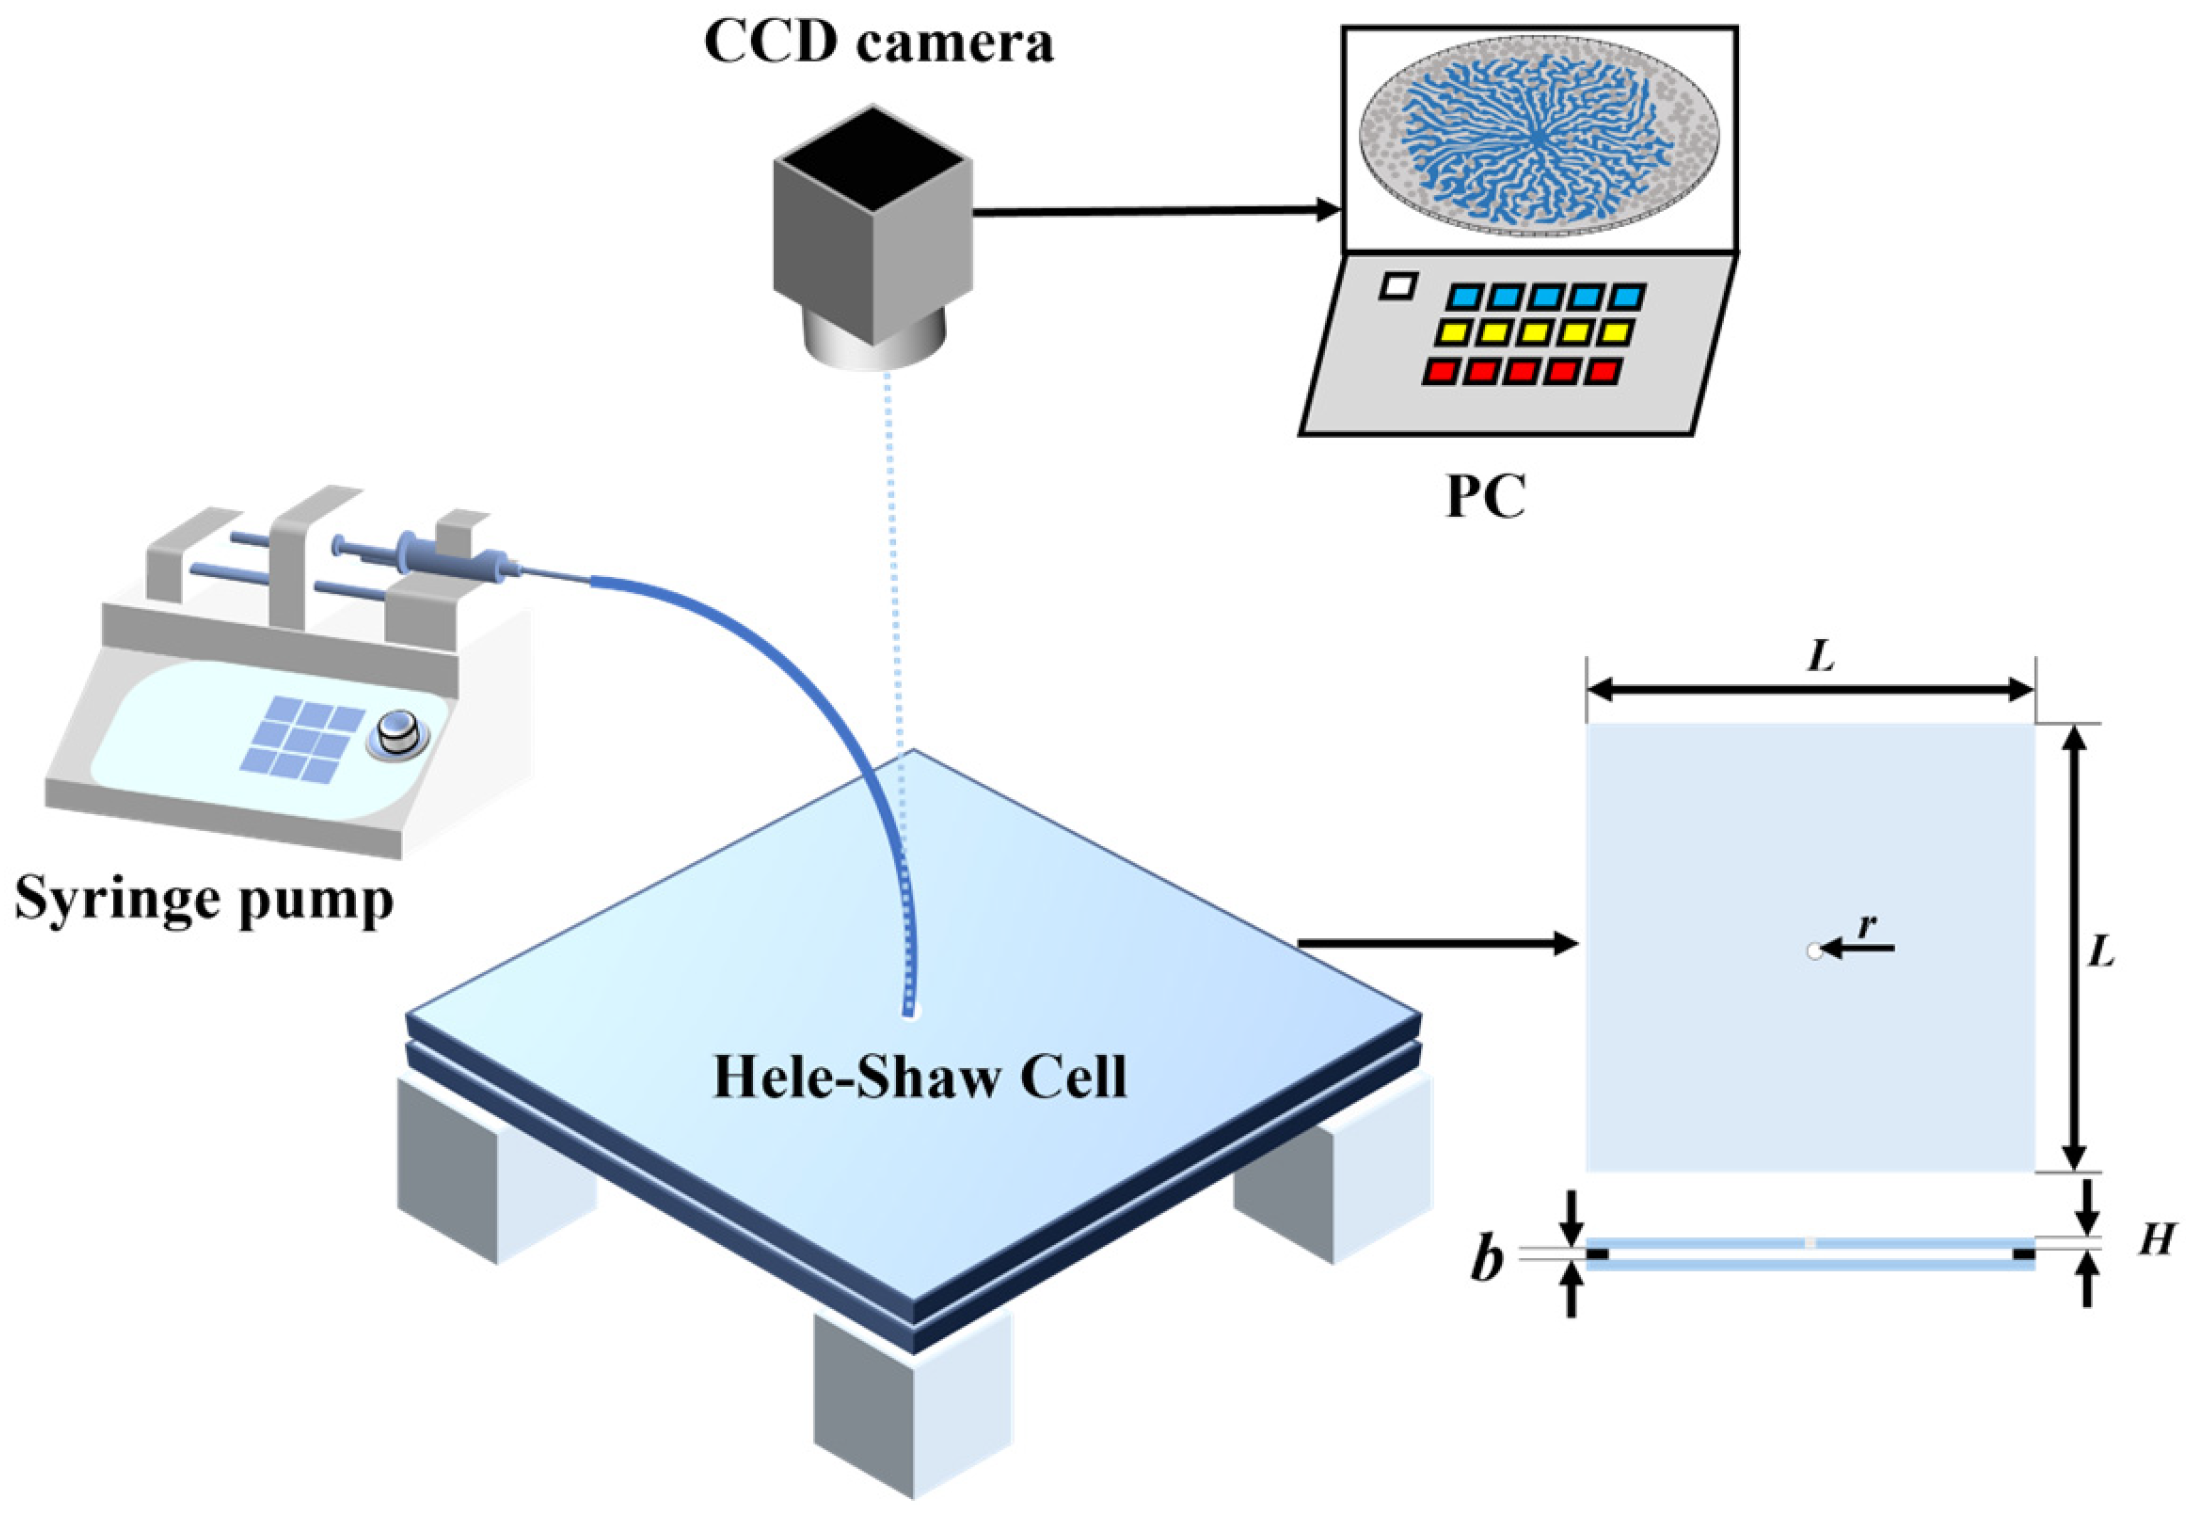
This study aims to investigate the phenomenon of liquid penetration into dry hydrophobic particles. It examines how changes in the particle layer filling ratio φ, liquid injection rate Q, particle diameter d, and viscosity μ of the penetrating liquid affect this phenomenon. The experimental setup consists of a syringe pump, an optical stage, an LED light source, an industrial camera, and a computer. As shown in Figure 1.
In this experiment, the viscosity of the intruding fluid was adjusted by adding glycerol at different volume fractions. The prepared solutions were thoroughly mixed using a magnetic stirrer, and their viscosities were measured with a viscometer. The viscosities of the intruding fluids used in this experiment were 1.01 mPa·s, 10 mPa·s, and 400 mPa·s, corresponding to pure water, a 58% glycerol-water solution, and a 96% glycerol-water solution, respectively. The particle diameters were 70 μm, 100 μm, and 130 μm, respectively.
By treating glass particles with a commercial hydrophobic agent, the particles are made hydrophobic. The procedure is as follows: 1. Remove surface impurities. First, soak the glass particles in hydrochloric acid (HCl, 0.1 mol/L) and stir with a magnetic stirrer for at least 0.5 h. 2. Thoroughly rinse with deionized water and dry in an oven at 80 °C. After drying, sieve the glass particles to separate them by diameter. 3. Immerse the sieved glass particles in the hydrophobic agent in a beaker and heat in an oven at 80 °C to accelerate the evaporation of the solution. After drying, sieve the hydrophobic glass particles again to ensure that no glass microspheres have agglomerated.
The glass plates measure 400 × 400 × 10 mm, with a 6 mm-diameter hole drilled at the center of the top plate to serve as the injection port. The spacing between the plates is b = 1.0 mm. A syringe pump is used to inject the infiltration solution at a flow rate Q controlled between 1 and 100 mL/min, and an industrial camera is used to record the images.
The glass plate was treated by applying a hydrophobic reagent and wiping it repeatedly to ensure an even coating. The resulting dried glass plate exhibited hydrophobic properties, with a contact angle of 120°. Method for hydrophobic treatment of glass plates: Applying the hydrophobic layer: Pour a commercial hydrophobic agent into a glass beaker. Using a soft-bristled brush, dip it into the solution and apply multiple coats to the surface of the glass plate to form a hydrophobic layer. During application, move from one side of the glass plate to the other; back-and-forth application within the same area will result in an uneven hydrophobic layer. After application, allow the plate to air dry for 30 min.
Preparation of the particle layer: Spread the dried mixed glass beads evenly over one of the prepared glass plates (the bottom surface of the Hele–Shaw cell). We define the thickness of the particle layer as h. To obtain a layer of uniform thickness, place two strips of adhesive tape on the left and right sides of the bottom plate, and rest a straight-edged glass ruler on the tape. Use the ruler to scrape the beads along the tape, forming a uniform particle layer. Then, the top plate is installed on top, separated from the bottom plate by a 1.0 mm spacer. We vary the height of the particle layer by adjusting the thickness of the adhesive tape strips. With tape thicknesses of 0.2 and 0.5 mm, the particle layer thicknesses are 0.5, 0.6, 0.7, and 0.8 mm, respectively.
Fluid intrusion was considered complete when the furthest point of the pattern reached 16 cm from the inlet. After fluid intrusion ceases, the resulting patterns are recorded as video using an industrial camera. The video is then exported frame-by-frame as images, which are processed using ImageJ v2 and Photoshop software v2024. All experiments were conducted at a room temperature of 22 °C. To more clearly observe and compare the patterns formed by fluid intrusion, the experimental images were binarized and converted into contrast images with varying grayscale values. The specifications of the materials used are as follows:
For the quantitative fractal analysis, all images were processed using the same workflow. First, the final invasion frame for each experimental condition was extracted from the recorded video. The image was then cropped to a fixed region of interest containing the entire invasion pattern (5120 × 5120) while excluding the injection hole, the outer boundary of the Hele-Shaw cell, and irrelevant background areas. The cropped image was converted into an 8-bit grayscale image. The invaded-liquid region was then segmented from the dry-particle background using a fixed thresholding procedure in ImageJ, followed by manual checking in Photoshop to ensure that the segmented foreground corresponded to the physically observed liquid invasion region. The resulting binary mask contained foreground pixels representing the invaded-liquid pattern and background pixels representing the non-invaded particle/air region.
To minimize operator-dependent bias, the same segmentation criterion was used for images belonging to the same experimental series. Small isolated pixels caused by image noise were removed only when they were not connected to the invasion pattern. No artificial smoothing of the invasion boundary was applied before fractal-dimension calculation, so that the measured fractal dimension reflected the experimentally observed morphology.
Each experimental condition was repeated at least three times to assess reproducibility. The finger number N, finger width W, asymmetry ratio rmax/rmin, and fractal dimension Df were measured independently for each replicate. The reported values in the quantitative plots are presented as mean and standard deviation. Error bars in figures represent the standard deviation among repeated experiments. For quantities measured multiple times within a single image, such as finger width, the intra-image measurement uncertainty was first calculated and then combined with the inter-experiment variability. The experiment was repeated three times under identical conditions, and the measurement data was recorded, and the standard deviation was calculated based on the results of these three trials.

2.3. Fractal Dimension Analysis and Uncertainty Assessment

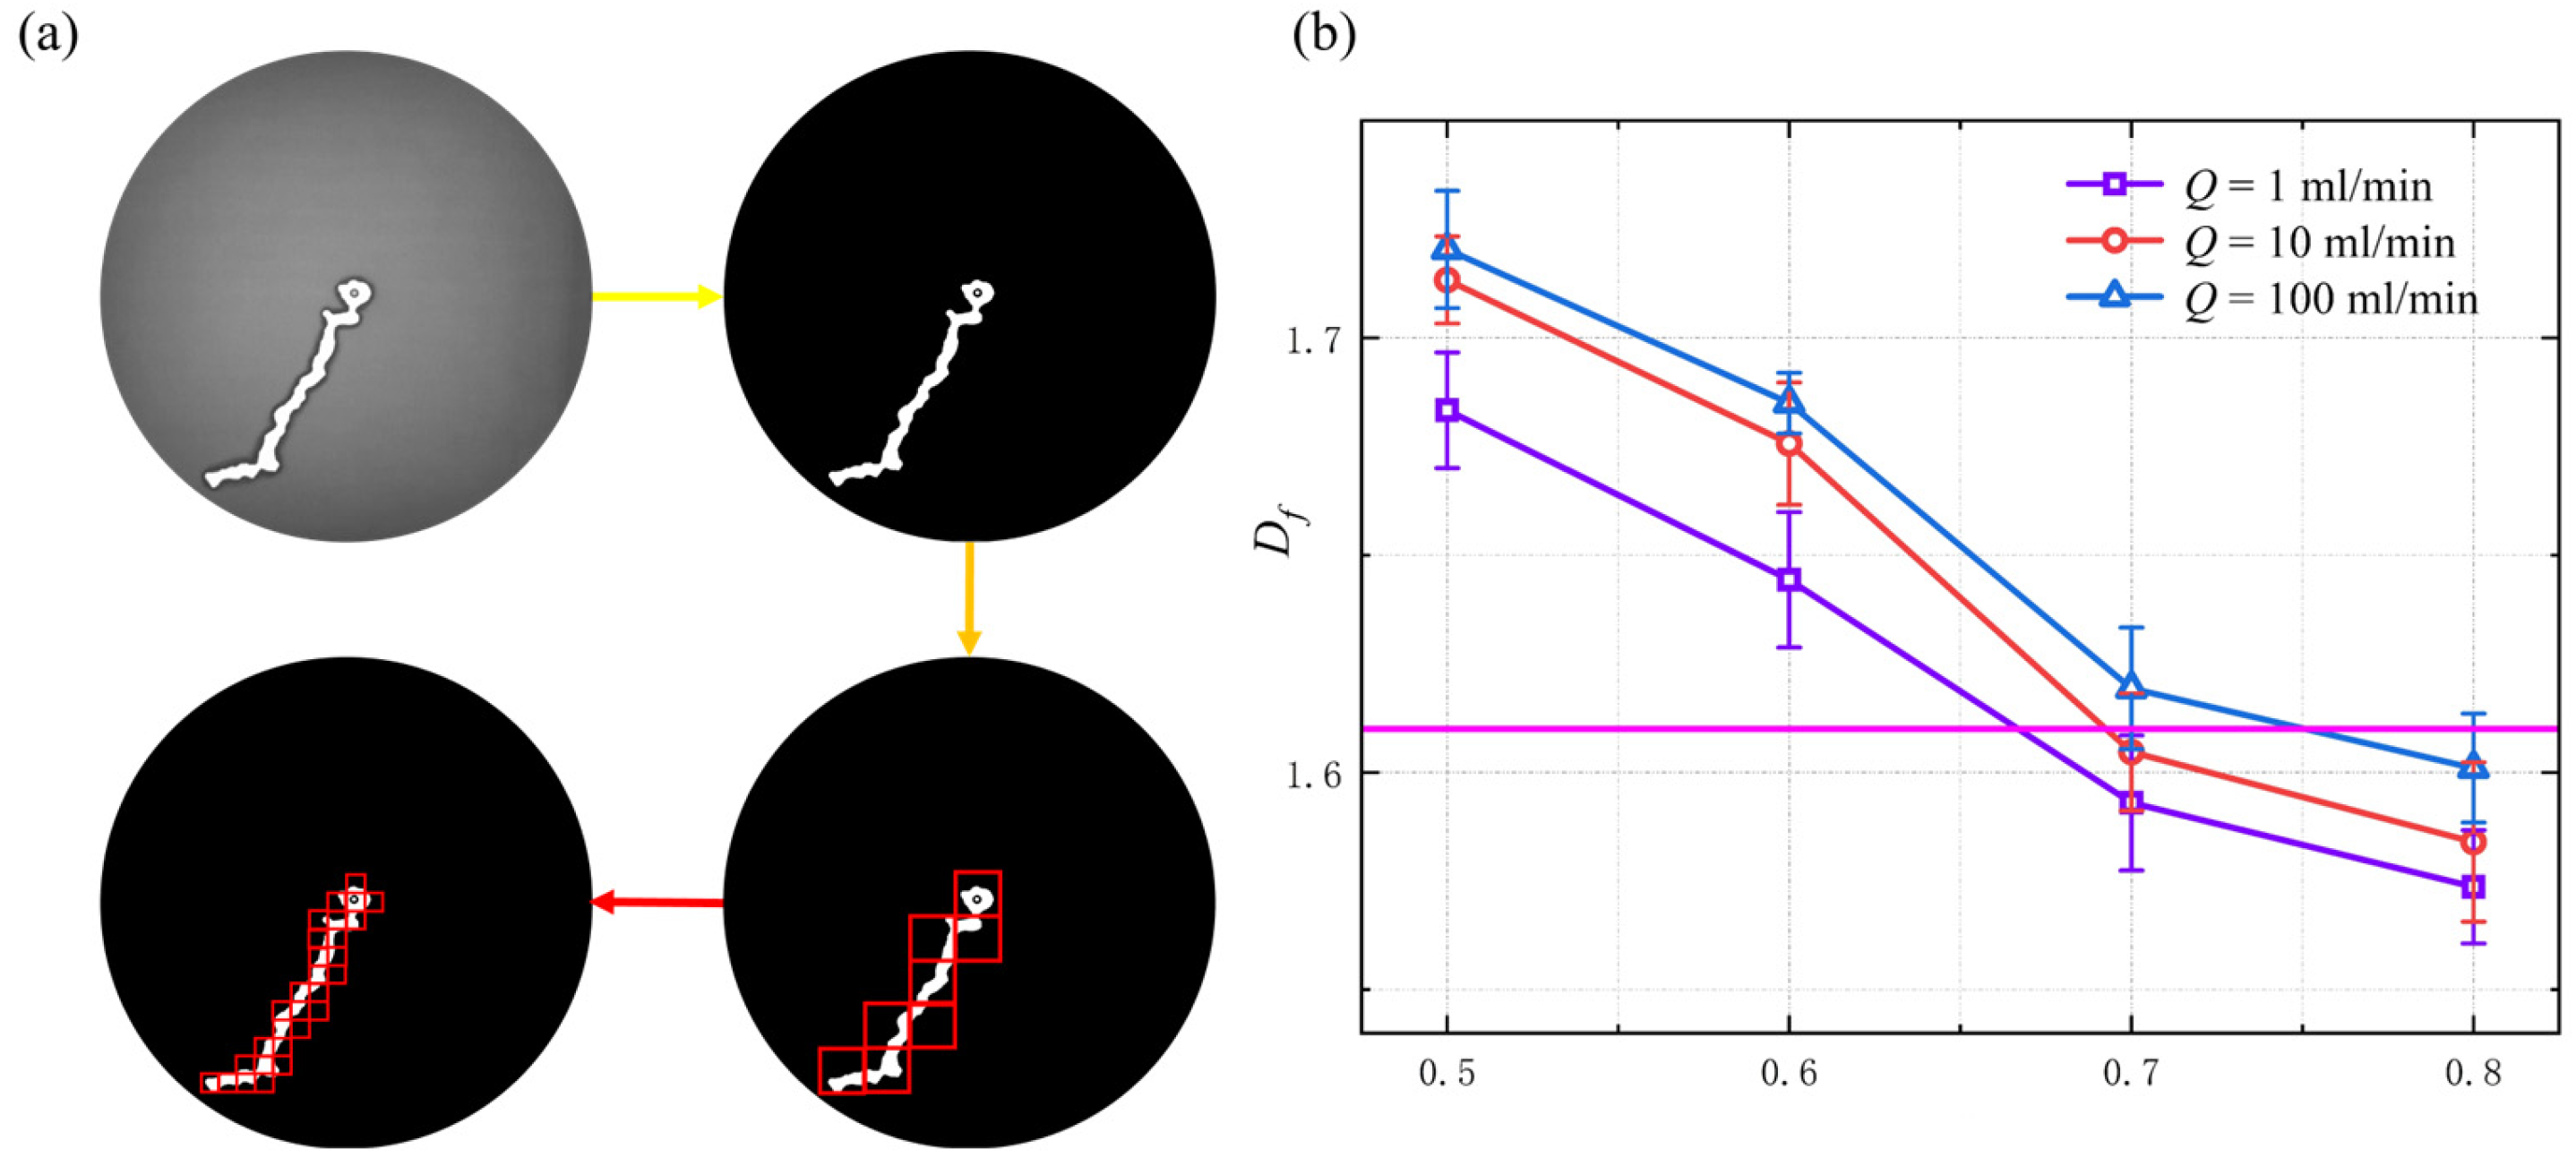
The fractal dimension Df was calculated using the standard box-counting method, following the procedure commonly used for drainage and invasion-pattern analysis in Hele-Shaw porous-media experiments. In this method, the binary image of the invasion pattern is covered by square boxes of side length ε. For each box size, the number of boxes N(ε) containing at least one foreground pixel is counted. The fractal dimension is then obtained from the slope of the linear scaling relationship between logN(ε) and log(1/ε):
D f = d log N ( ε ) d log ( 1 ε )
Equivalently, when logN(ε) is plotted against logε, Df is the absolute value of the fitted slope. In the present study, the calculation was performed using the FracLac/Fraclab plug-in in ImageJ. Box sizes were selected within the scale range over which the log-log relationship was linear; boxes that were too small to represent physical morphological features and boxes that were too large to resolve the pattern were excluded from the fitting. The coefficient of determination R2 of the linear regression was used to evaluate the quality of the box-counting fit. In our study, the number of boxes was uniformly set to 2, 4, 8, 16, 32, 64, and 128 pixels. Across all analyzed images, the regression quality was high, with R2 values ranging from 0.9976 to 0.9979. Because our images have very high contrast, errors rarely occur during conversion using ImageJ; therefore, the impact on threshold sensitivity in actual measurements is negligible, and the effect on Df is also negligible, so it has not been taken into account in this paper.
The parameters of the materials used are shown in Table 1. The symbols used for parameters in this paper are shown in Table 2.
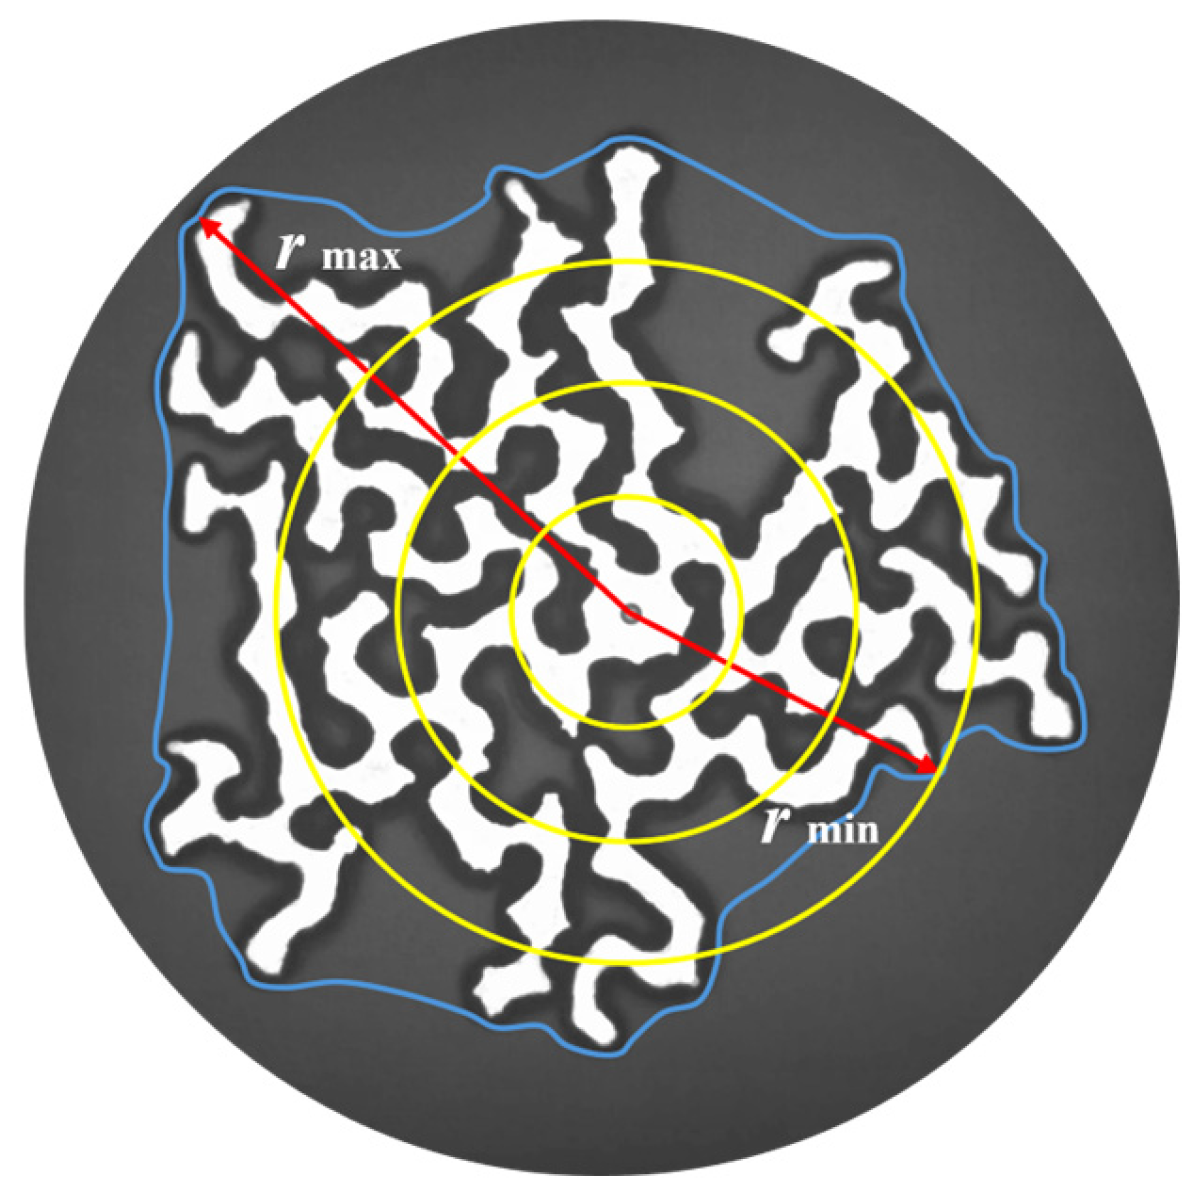
Method for measuring finger width: We define the minimum radius rmin of the pattern as the radial distance from the injection port to the shortest fingertip. We then average the widths of the fingers that intersect with the three yellow circles and calculate their average value W.

2.4. Estimation of Permeability and Dimensionless Pressure Ratio

Because permeability is a key parameter in the capillary-number and pressure-balance analysis, the effective permeability of the particle layer was estimated for each experimental condition. For a granular layer, the permeability was estimated using a Kozeny–Carman-type scaling:
k = d 2 ε 3 C ( 1 ε ) 2
where d is the particle diameter, ε is the effective porosity of the particle layer, and C is the Kozeny constant. In the present quasi-two-dimensional system, ε was estimated from the projected particle area fraction obtained from binarized images of the prepared particle layer before invasion. Therefore, the calculated k should be interpreted as an effective in-plane permeability rather than a three-dimensional intrinsic permeability.
To test the sensitivity of the interpretation to permeability, we also calculated the relative permeability trend using the layer filling ratio, which reduces the available pore space and thus decreases the effective permeability, which increases the viscous pressure drop required for flow through the invading fingers.

3. Result

Viscously stable frictional finger motion was achieved by injecting water or a mixture of water and glycerol at a flow rate Q into a Hele-Shaw cell consisting of two parallel glass plates separated by a gap of thickness b = 1.0 mm and containing a dry layer of polydisperse hydrophobic beads (Figure 2). Thus, air serves as a low-viscosity protective fluid in which the particles are “submerged.” Flow cells were prepared with different bead packing levels φ = h/b, where h is the initial layer thickness; the beads consist of hydrophobic glass with a diameter of d = 100 μm.
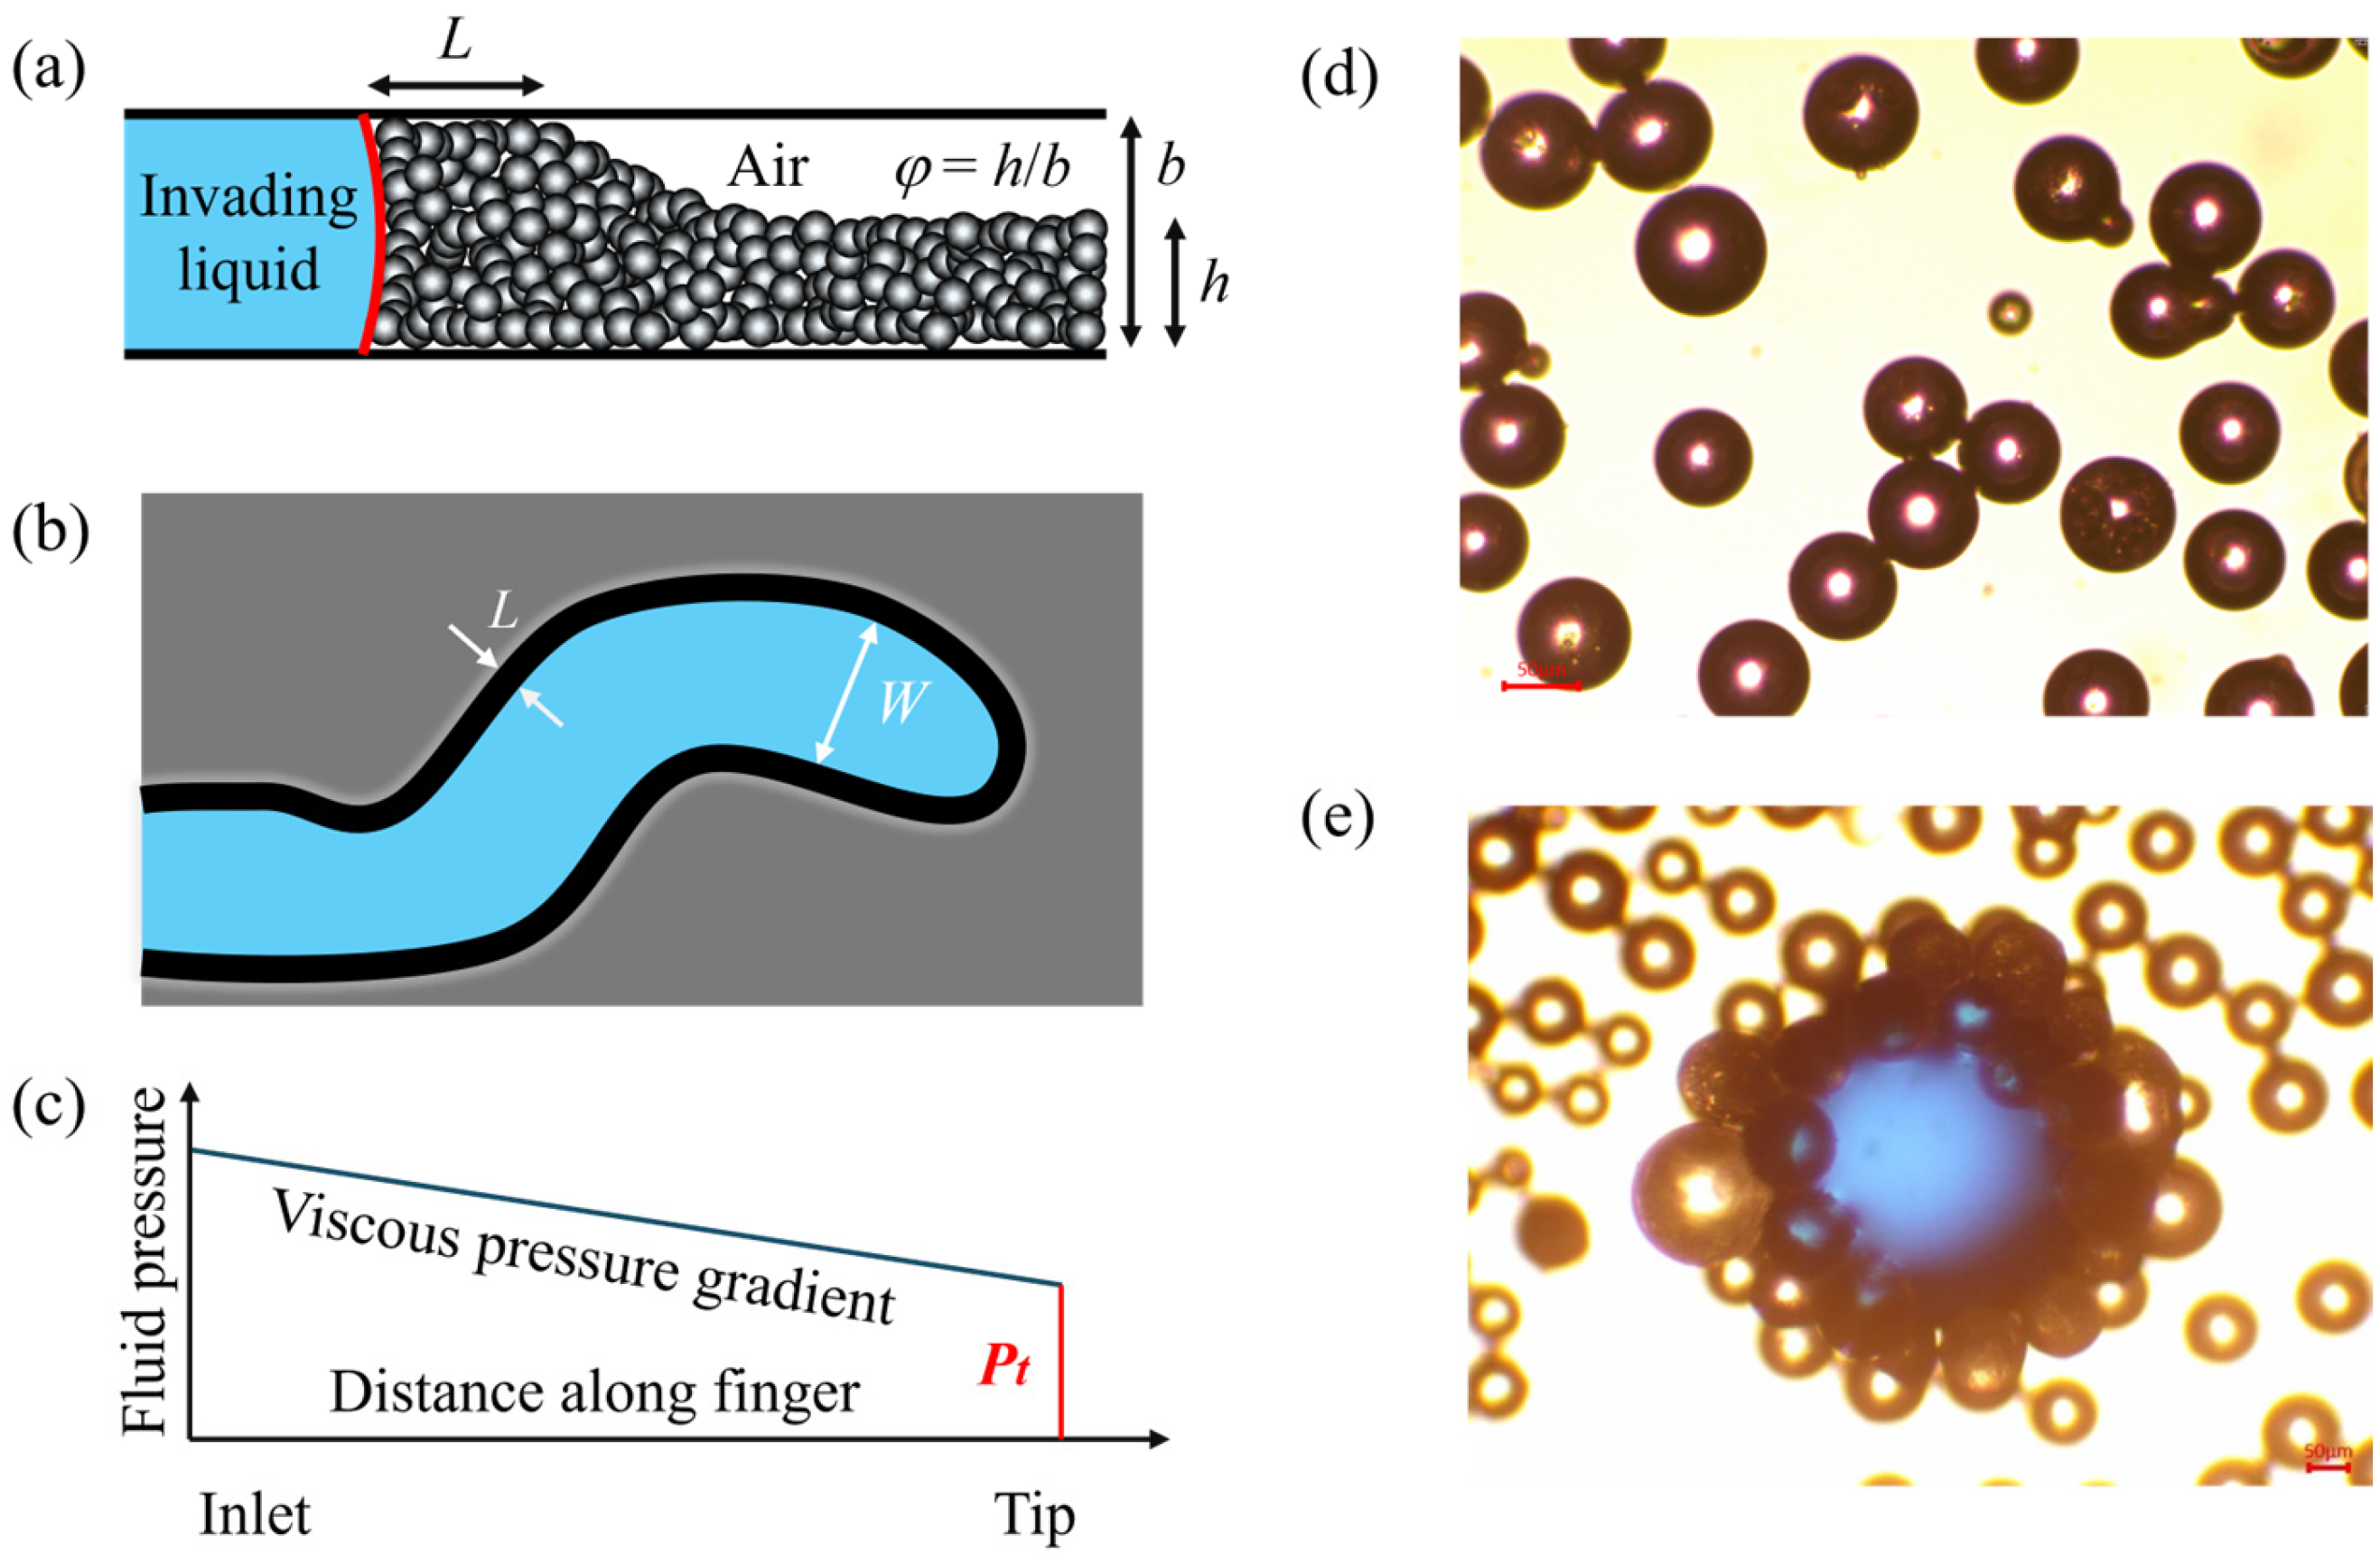
In all cases, friction-controlled invasion morphology causes the invading water to form one or more finger-like structures of width W, surrounded by a compacted front of dry particles, flattened particles of thickness L. These fingers grow only at their tips; the sidewalls remain stationary after their initial formation, except where new fingers begin to form at higher Q values. At the tips of the growing fingers, the leading edges are curved (Figure 3b).
No wetting occurs during the water-injection displacement process involving hydrophobic particles; rather, the particles are moistened by the surrounding fluid, but the water is repelled by the particles’ hydrophobic properties. This is known as the drainage phenomenon in porous media. When the hydrophobic particles are relatively small, the liquid tends to form spherical droplets on their surfaces; the interaction between the small hydrophobic particles and water results in the formation of liquid marbles, as shown in Figure 3e.

3.1. Role of Particles in the Pattern

This section evaluates how the particles affect the pattern by injecting different concentrations of g/w solutions at a constant injection rate Q = 100 mL/min into the dry hydrophobic granular material with different volume fractions and sizes.
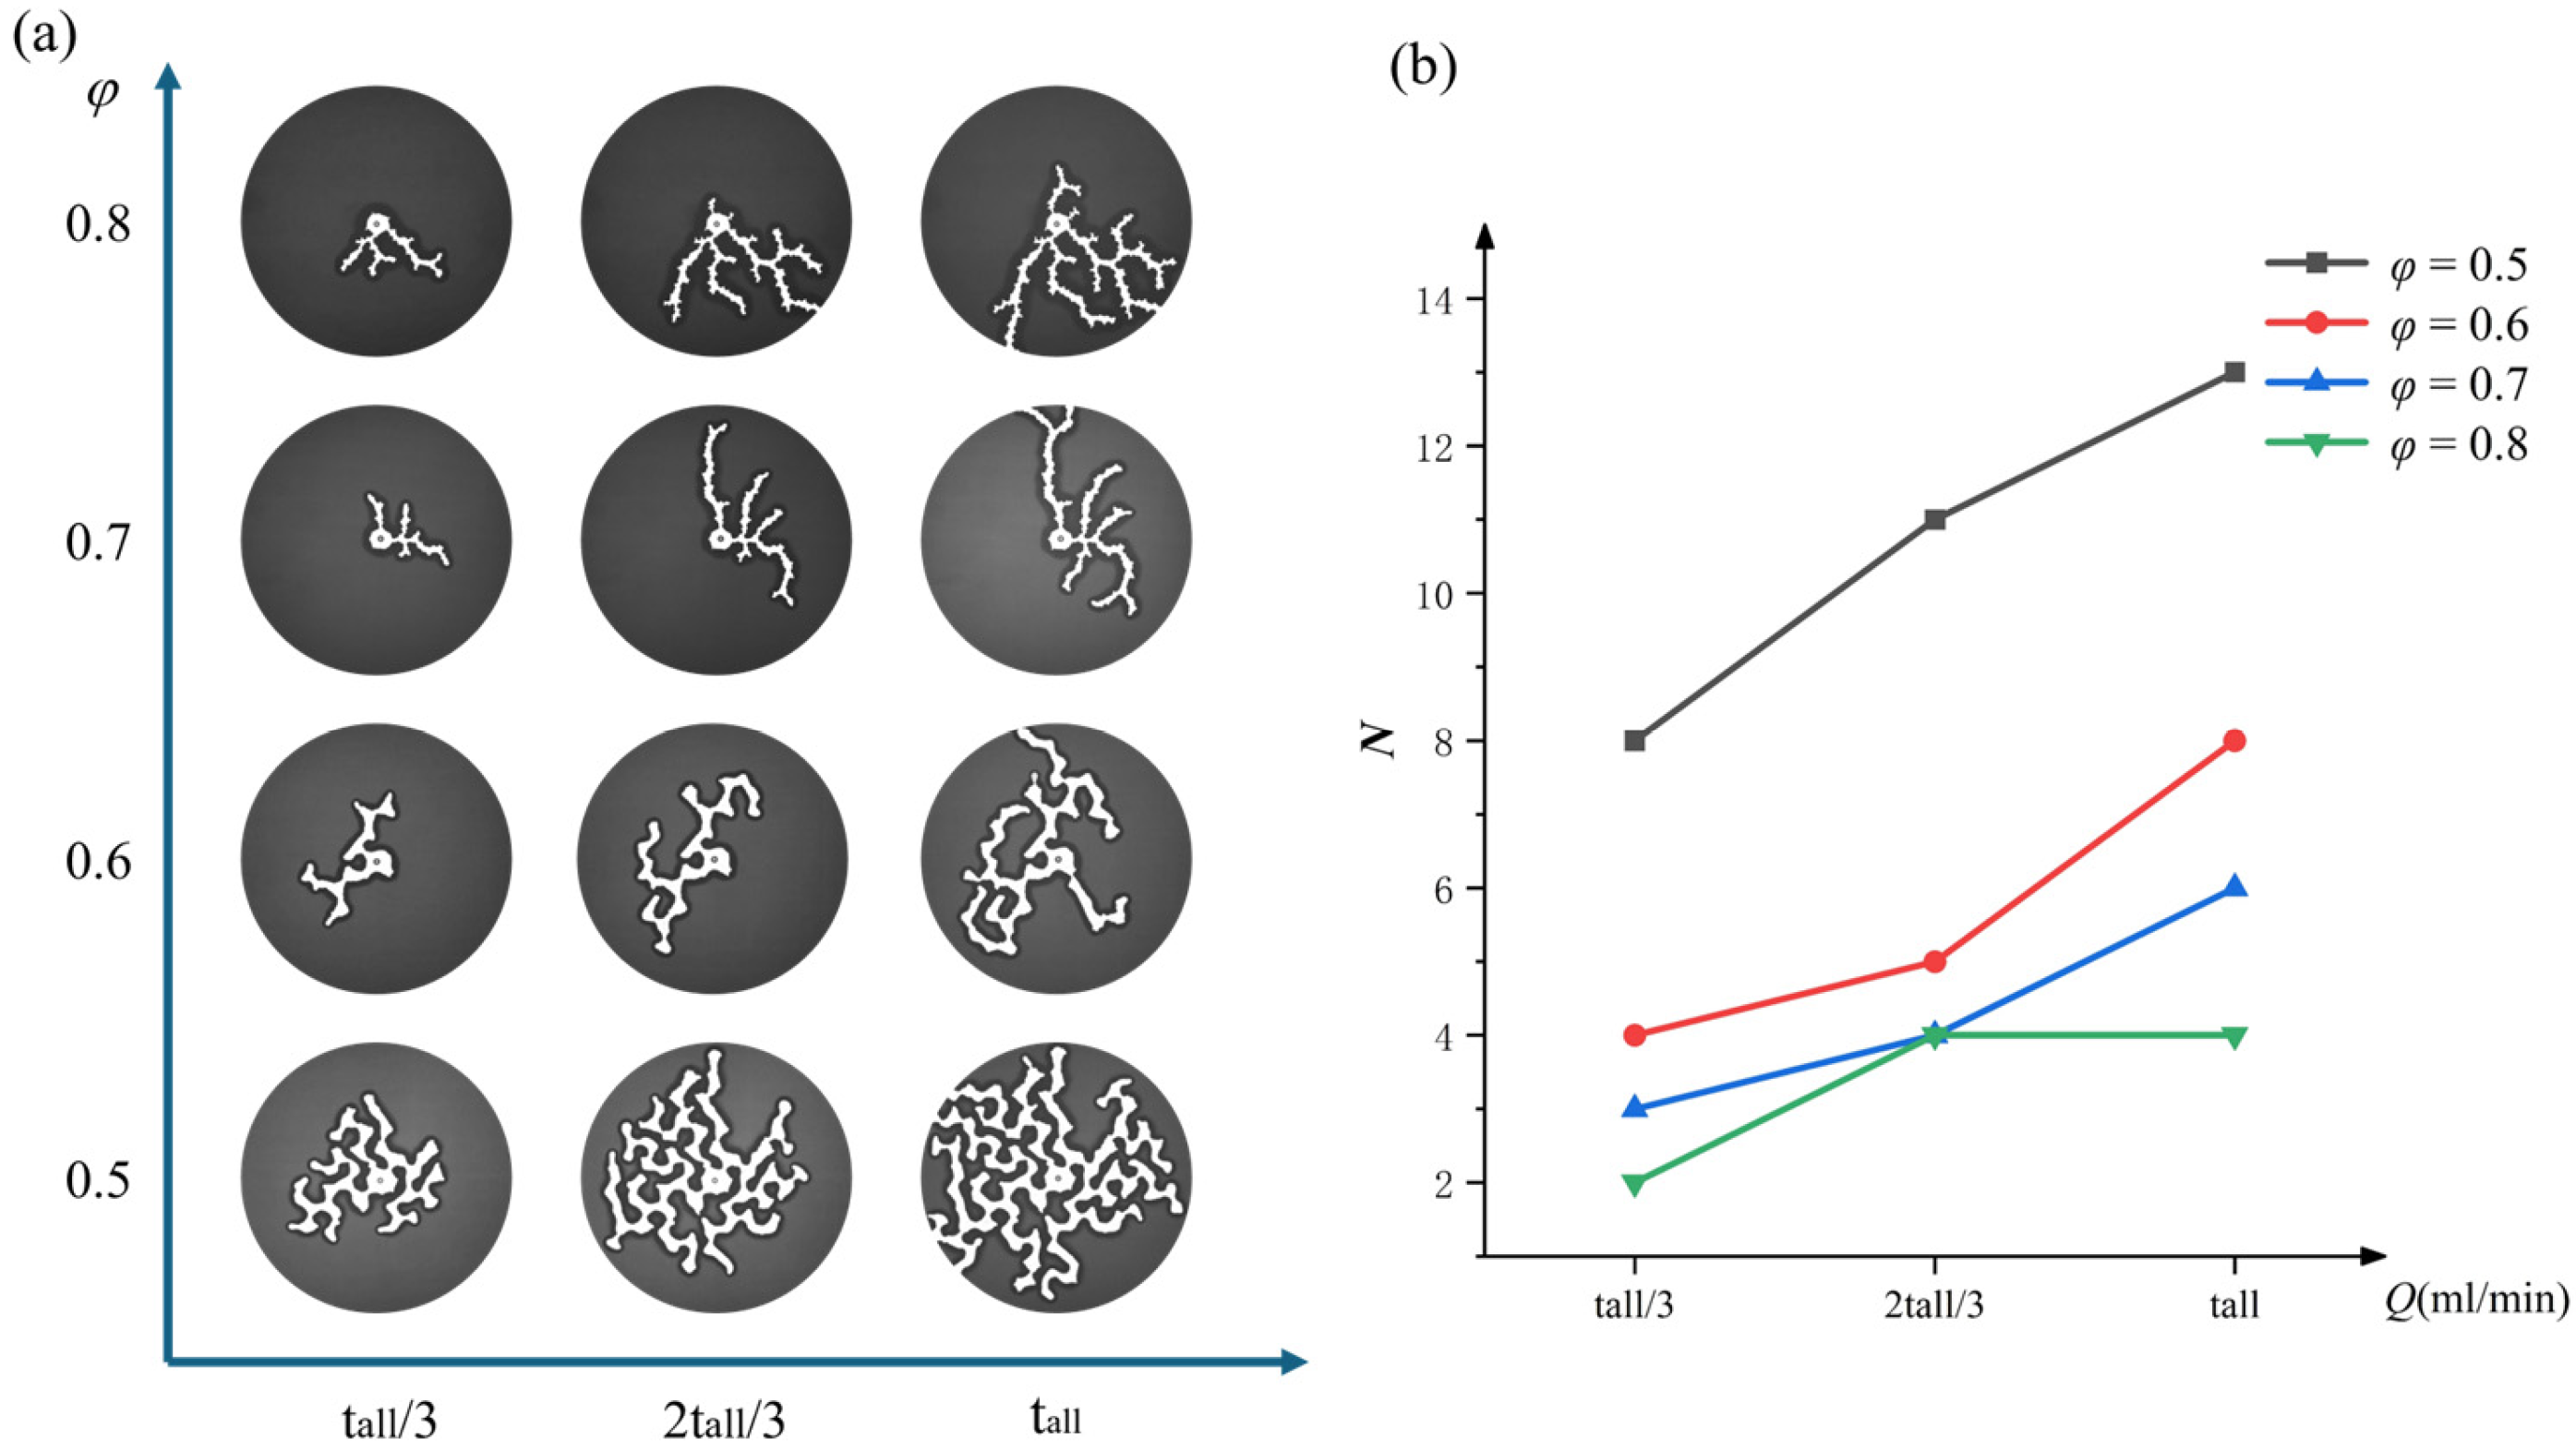
Figure 4a shows the evolution of the infiltration pattern as pure water (μ = 1.01 mPa·s) is injected into dry particles, hydrophobic spherical particles with a diameter of 100 μm, at different layer filling ratio φ. At the start of injection, water penetrates radially, forming a pattern whose radius increases with the injected volume. When φ = 0.5, upon contact with the particle layer, the water first pushes the particles to form a compacted layer (compaction front), creating an approximately circular pattern with a diameter larger than the injection orifice. As the injection time increases, the water overcomes the resistance of the compaction front and flows in random directions, diffusing outward in all directions rather than concentrating in a single direction. Furthermore, during this breakthrough process, the flow splits at the tips of the fingers, generating new fingers; as the injection time increases, these fingers spread throughout the entire model.
When φ increases to 0.6, the breakthrough pattern is consistent with that observed at φ = 0.5. However, the number of fingers (N) is relatively smaller. Although the fingers can still split, they occupy a relatively smaller area of the pattern and are unable to occupy more space. Due to the higher layer filling ratio, it becomes more difficult for water to break through the resistance of the compacted front; it must overcome greater friction, which arises from both interparticle friction and friction between the particles and the glass plate. As φ continues to increase, the pattern of the fingers gradually shifts from expanding outward in all directions to converging in a single direction.
Figure 4b shows the evolution of the number of finger-like features N, as a function of injection time t. The rate of increase in the number of finger-like features decreases at longer injection times t, because it is more difficult for new finger-like features to detach from static, straight sidewalls than it is for them to detach from static, straight sidewalls. As the layer filling ratio increases from 0.5 to 0.7, the number of finger-like structures decreases significantly. A higher layer filling ratio results in greater frictional resistance, which inhibits the splitting of the fingers. At a layer filling ratio of 0.7, fine inverted triangular structures appear on the sidewalls of the fingers. At a layer filling ratio of 0.8, the sidewalls of the fingers exhibit a certain degree of fine branching. This is because, with the continuous injection of fluid, the pressure at the triangular regions of the sidewalls is lower than at regions without such triangles, leading to the accumulation of viscous pressure differences and velocity gradients. Consequently, the fluid breaks through the triangular regions of the sidewalls, resulting in the formation of fine branches.
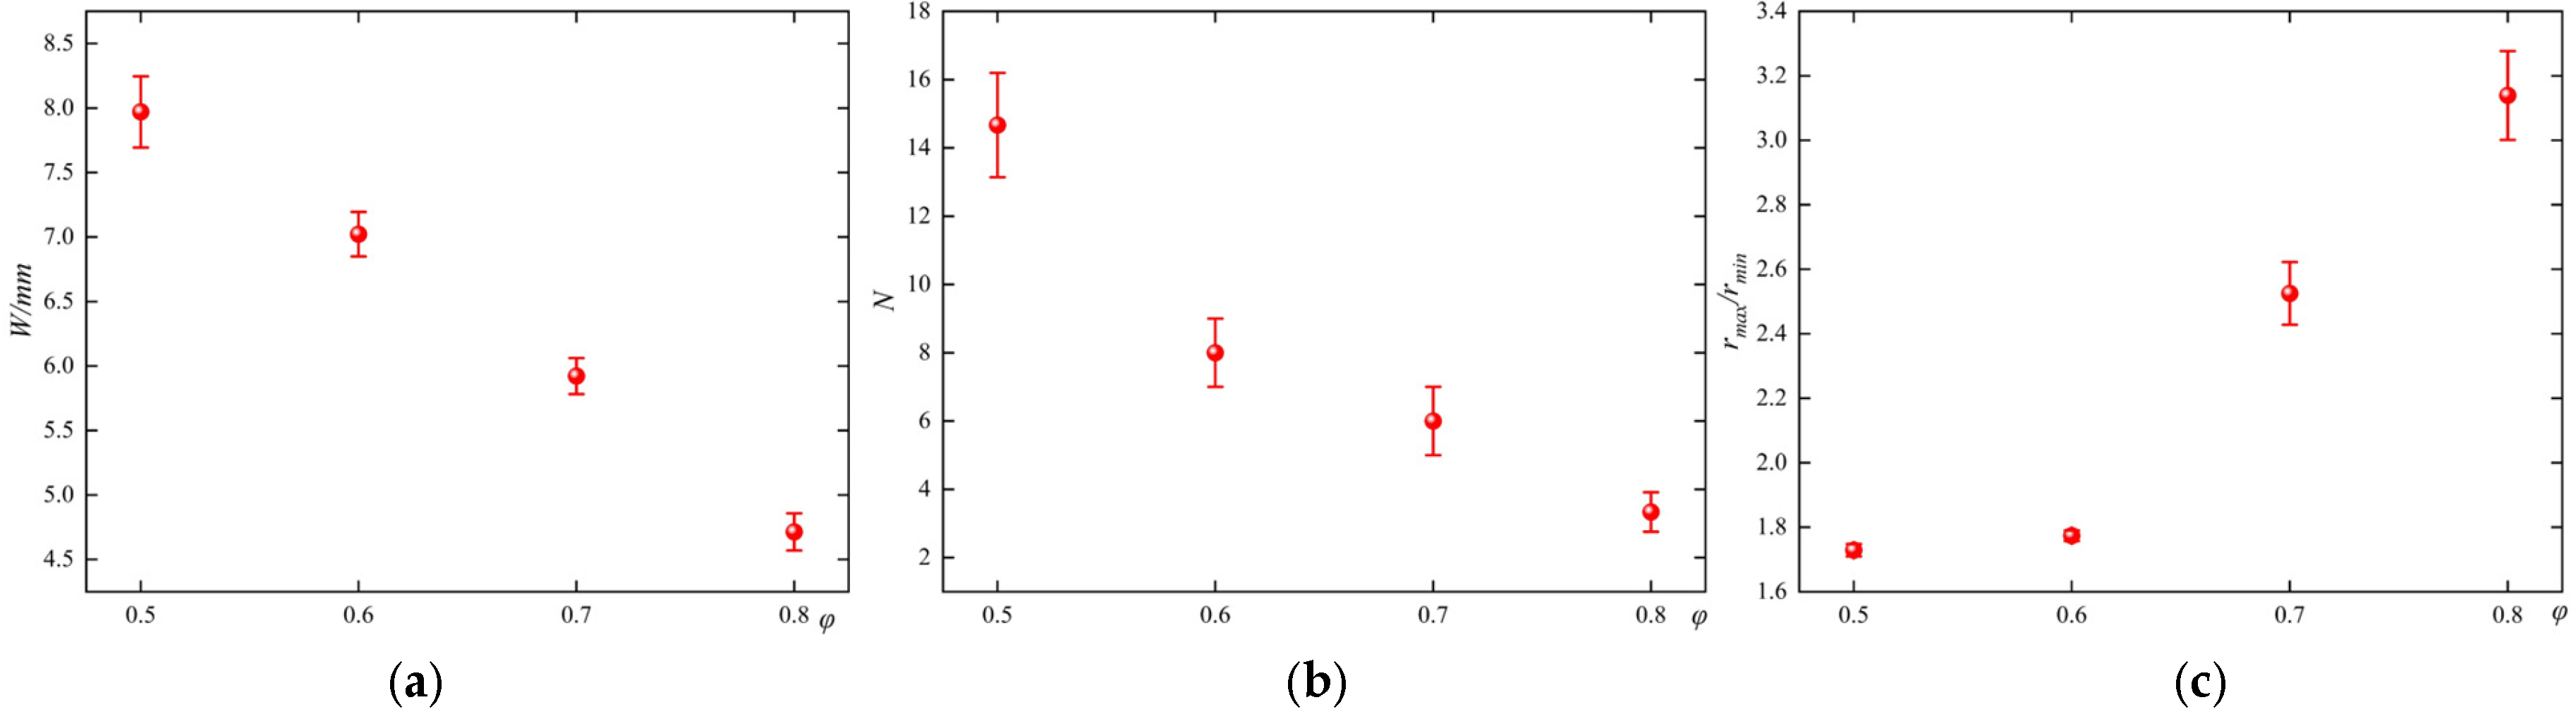
To more clearly define the asymmetry of the pattern, we introduce a dimensionless ratio here: rmax/rmin. rmax and rmin are shown in Figure 1. Figure 5c shows the ratio of the maximum radius (rmax) to the minimum radius (rmin) of the final pattern for different layer filling ratios, illustrating the increasing asymmetry as the layer filling ratio increases.
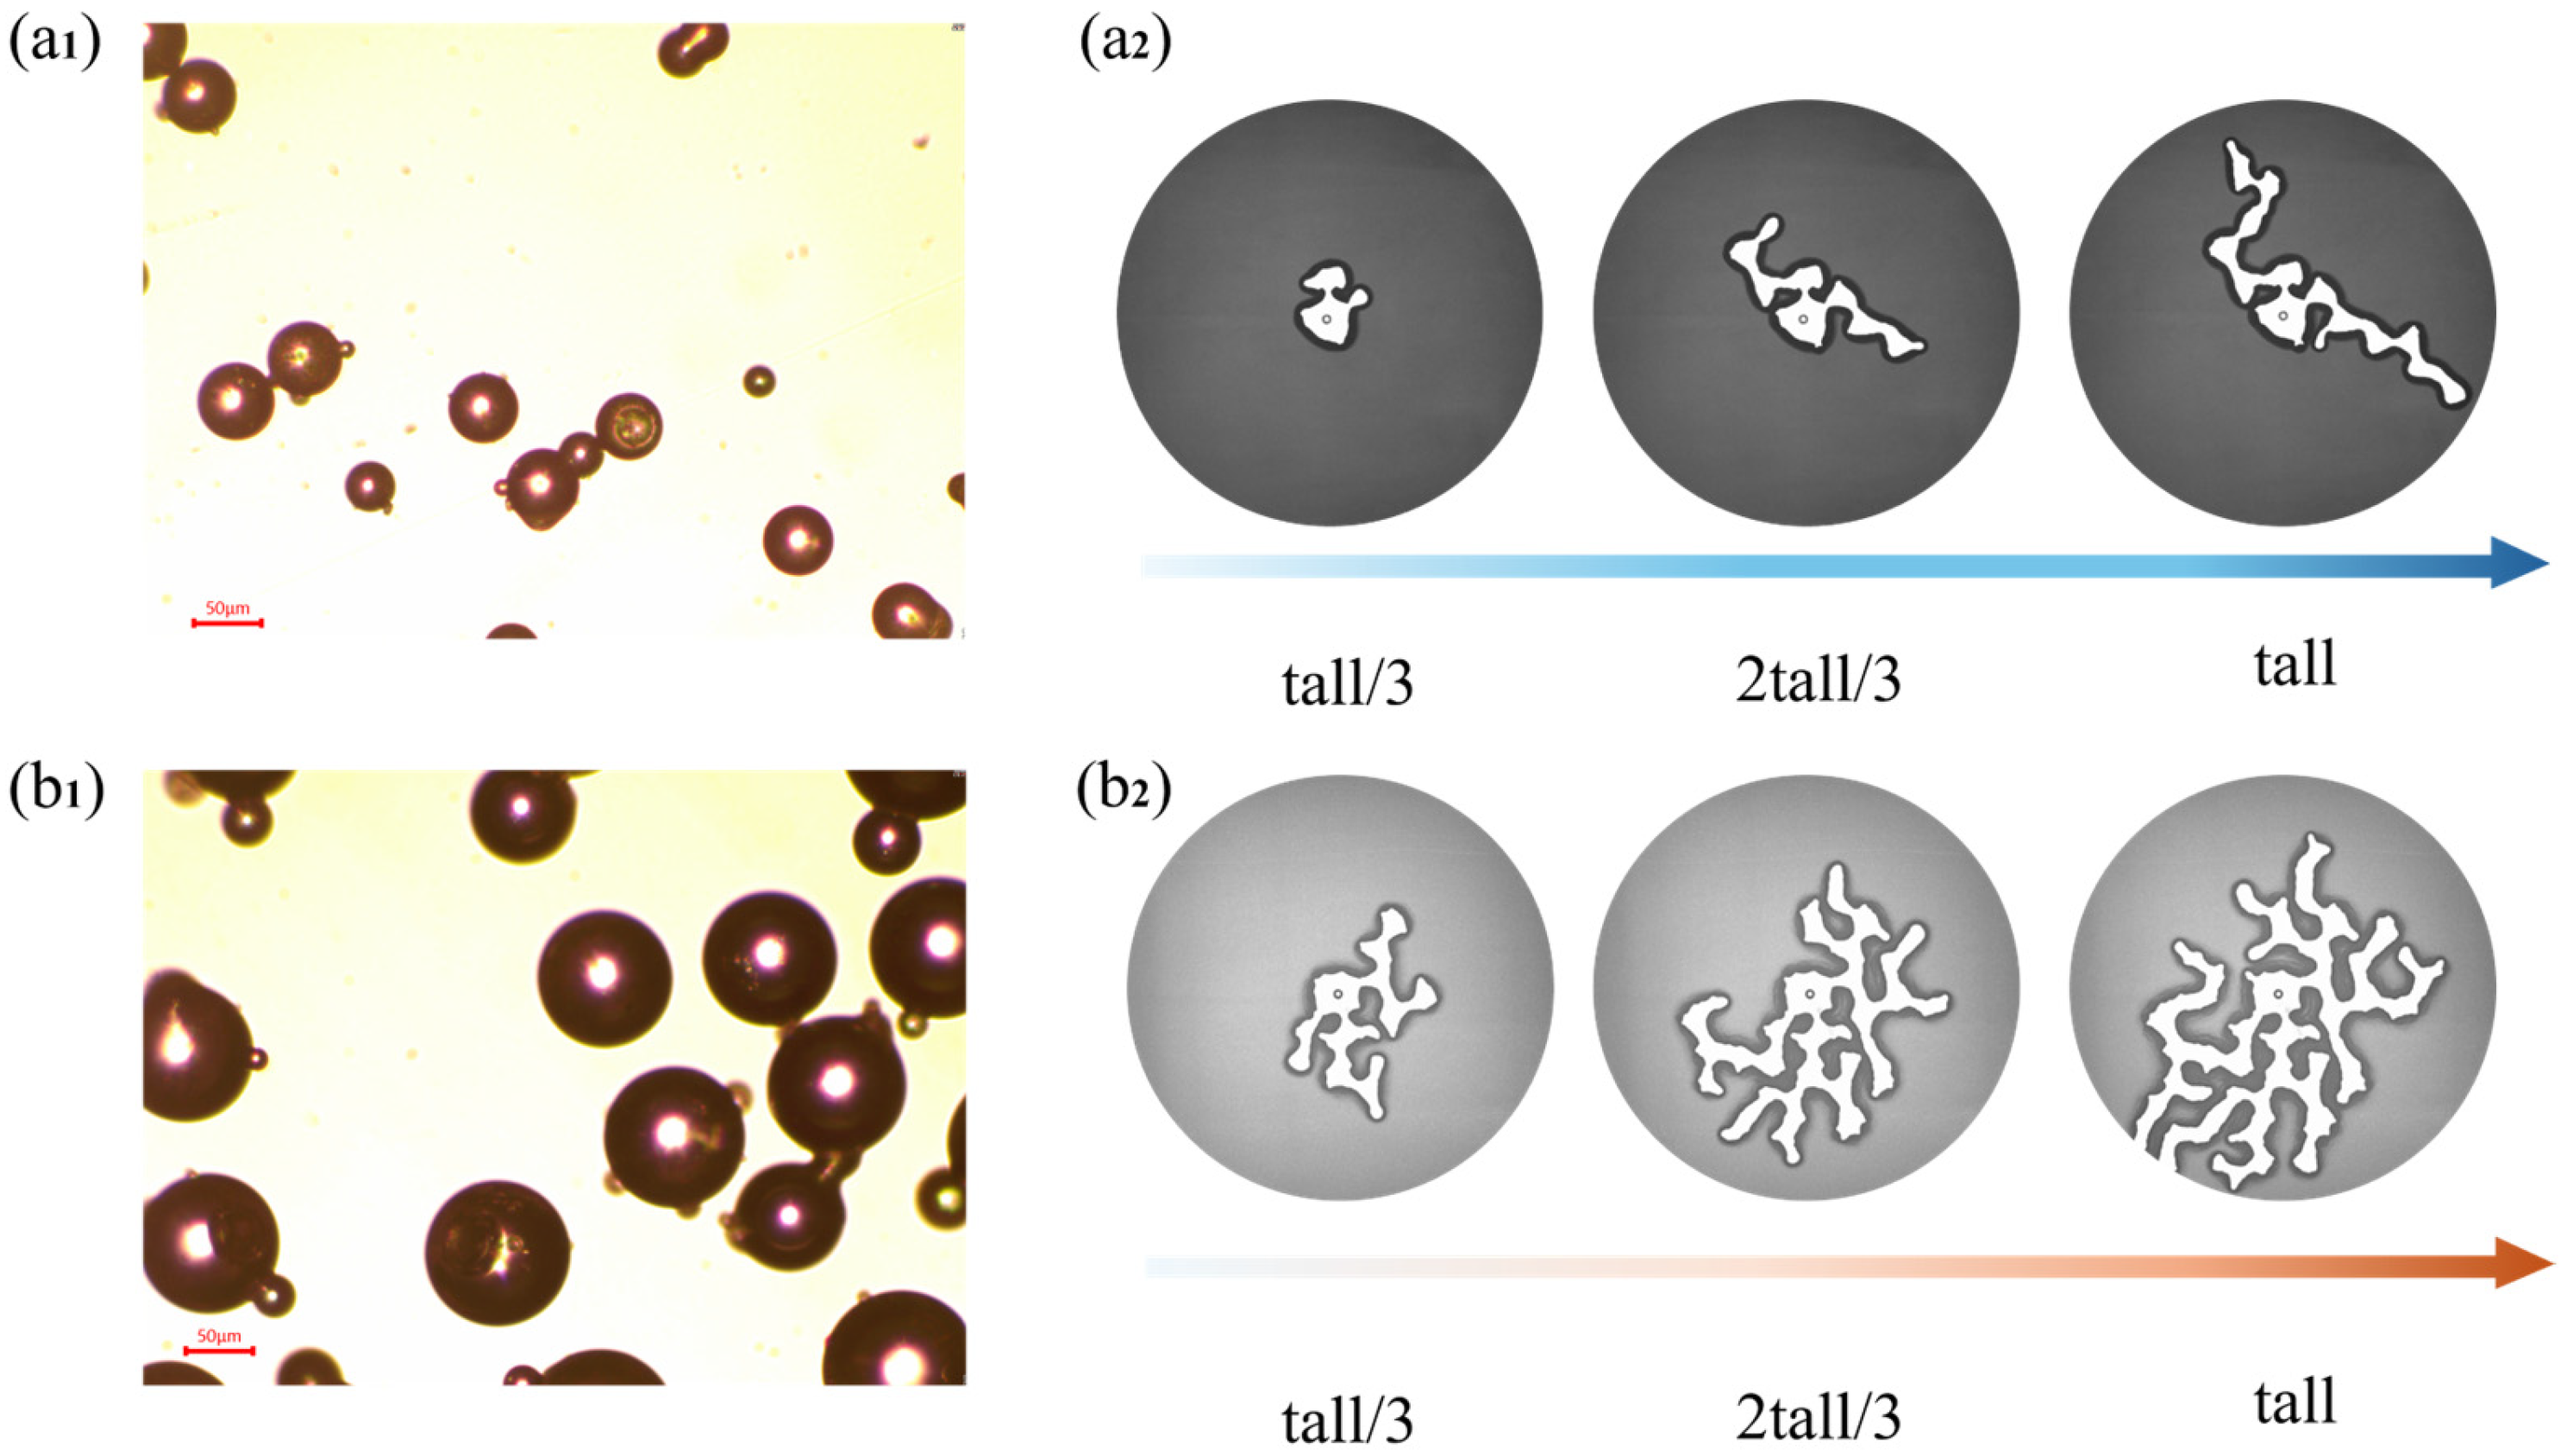
Next, we varied the particle size to investigate how changes in particle size affect pattern formation. First, we reduced the particle diameter to 70 μm while maintaining the flow rate at 100 mL/min. Figure 6(a1) shows a micrograph of the 70 μm particles, and (a2) illustrates the change in the pattern over injection time. We observed a significant decrease in the number of fingers, pattern unevenness increased, and most unpenetrated areas remained, with the finger widths becoming wider. In layers of smaller-volume particles, a larger injection volume is required to generate finger-like structures. This is because, for the same layer filling ratio, a smaller particle diameter requires more particles to fill the space; the gaps between particles are smaller, they pack more densely, the grayscale values after image binarization increase, light transmittance decreases, and the fluid requires greater energy to overcome friction and form fingers. Furthermore, increased friction makes it more difficult to form new fingers, forcing the accumulating pressure to develop laterally, resulting in wider fingers.
Next, we increased the particle diameter to 130 μm; Figure 6(b1) shows a micrograph of the result. Using the same injection speed, the particles were distributed nearly uniformly across the entire pattern. At the same layer filling ratio, an increase in particle size leads to larger gaps between particles. Although the mass of individual particles increases, fewer particles are required at the same layer filling ratio. Friction between particles is significantly reduced, allowing more particles to more easily break through the compaction front and generate more new fingers. Furthermore, because friction is easier to overcome, lateral development becomes wider, enabling fingers to form earlier and increasing finger width.

3.2. The Role of the Liquids on the Pattern

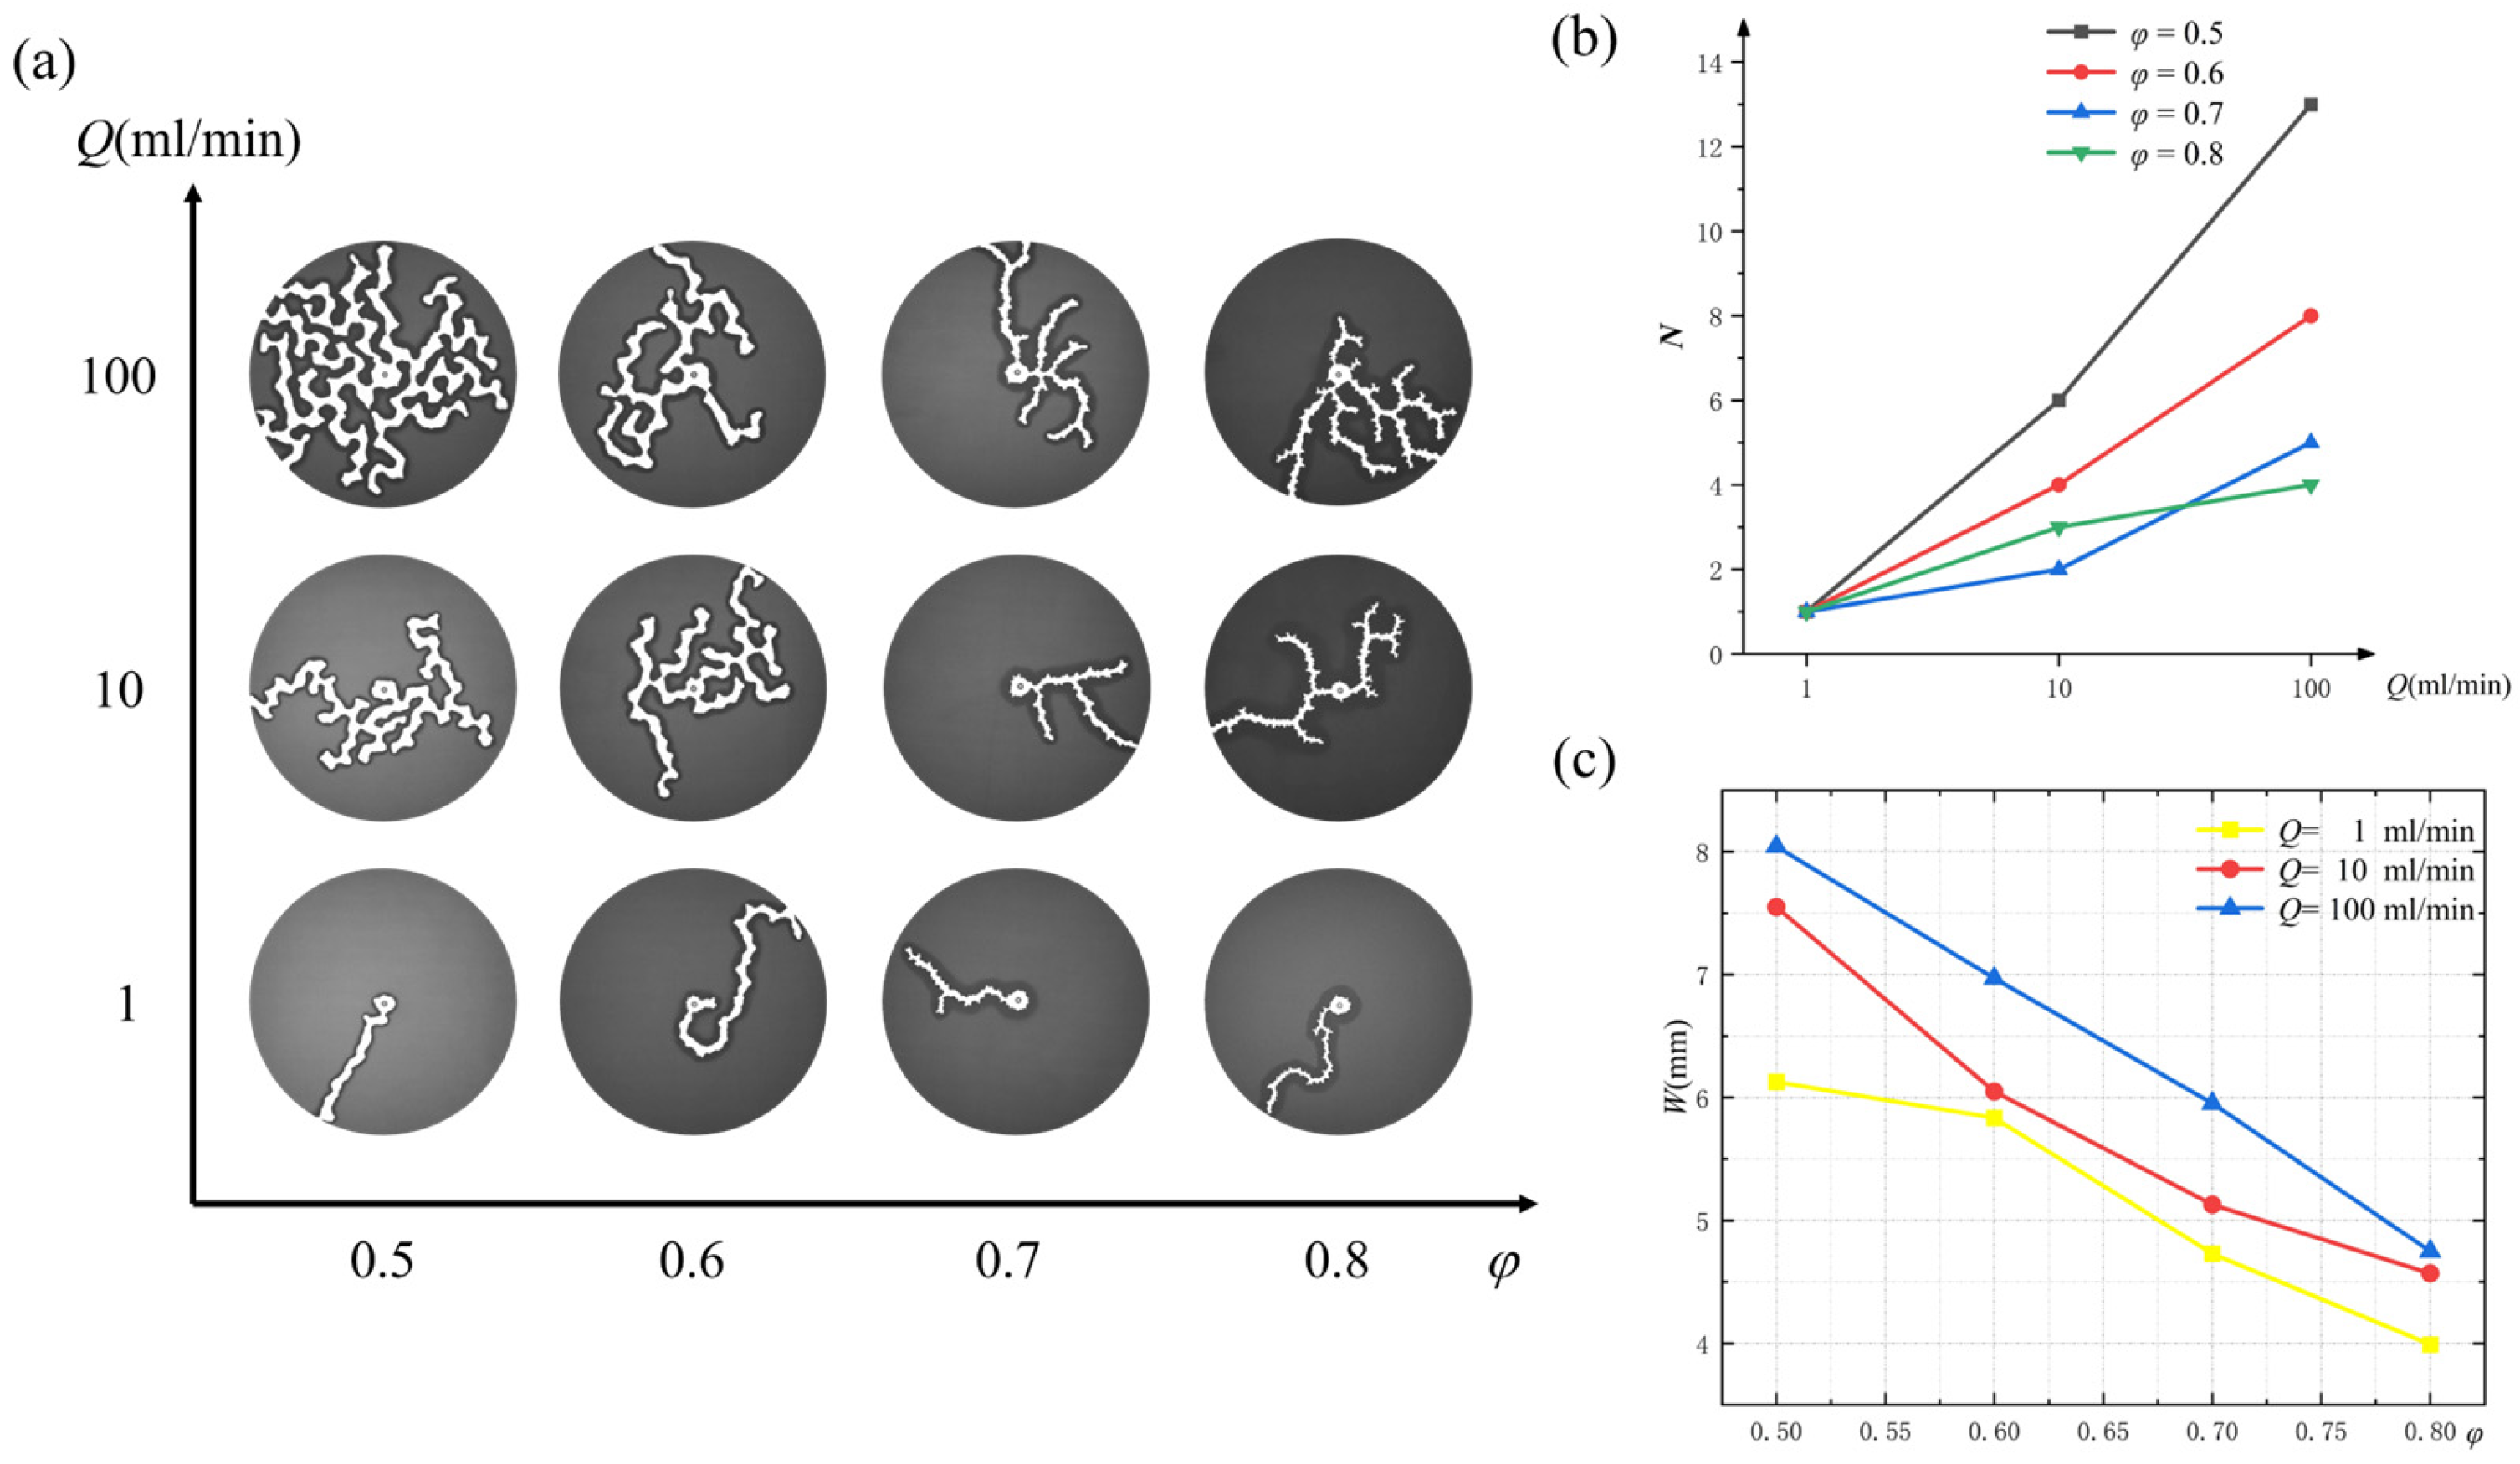
Figure 7a shows the phase diagram for different injection rates and different layer filling ratios. It was found that when Q = 1 mL/min, the number of fingers was one. As the injection rate increased to 10 mL/min, the number of fingers increased significantly, and the pattern became closer to completely filling the entire model. Figure 7b shows that the number of fingers increases with increasing injection rate. This increase in the number of fingers (N) is due to a higher flow rate, which increases the viscosity gradient of the injected liquid, significantly boosting the fluid’s kinetic energy. This energy overcomes particle friction, generating more fingers and promoting their lateral expansion, resulting in wider finger widths. Figure 7c shows that finger width gradually decreases with increasing layer filling ratio; however, at higher flow rates, the finger width becomes wider.
An increase in the particle layer filling ratio causes the particle layer to thicken and reduces the particle-free volume of the plate, leading to increased friction between particles as well as between particles and the plate wall. As friction increases, so do the inhomogeneities and noise within the particle layer, resulting in the formation of fingers that are more irregular and disordered. Specifically, when the layer filling ratio is 0.7, numerous fine triangular patterns appear on the sidewalls of the fingers formed by the fluid intrusion pattern. This phenomenon occurs because friction hinders particle movement, increasing system stability; however, particle accumulation simultaneously increases local particle distribution heterogeneity.
At the same injection rate, increasing the layer filling ratio thickens the particle compaction front and reduces the available pore space for liquid invasion. This affects the invasion pattern through two distinct mechanisms. First, the reduced pore space lowers the permeability of the granular layer and increases the viscous pressure drop required for flow through the invading fingers. Second, the denser particle network strengthens particle-particle and particle-wall contacts, thereby increasing the frictional resistance to particle rearrangement. Therefore, the narrowing of the fingers at a higher layer filling ratio is not caused by capillary pressure alone, but by the combined effect of reduced permeability and enhanced frictional resistance in the compaction front.
To clarify the force balance, we define the three contributions separately. The viscous contribution, ΔPv, is the pressure drop generated by liquid flow inside the invading fingers. According to Darcy’s law, it scales as
Δ P v ~ μ U Δ z k
where μ is the liquid viscosity, U is the characteristic velocity, Δz is the finger length, and k is the permeability of the granular layer. This expression has the dimension of pressure because μUΔz/k gives Pa.
The second contribution is the capillary entry pressure at the liquid–air–particle interface:
Δ P c = 2 σ | cos θ | r p
where σ is the liquid–air surface tension, θ is the apparent contact angle, and rp is the characteristic pore-throat radius. The third contribution is the frictional stress σf, which represents the resistance to particle rearrangement caused by particle–particle and particle–wall contacts in the compaction front.
Therefore, liquid invasion or sidewall breakthrough is expected when the viscous driving pressure becomes comparable to or larger than the combined capillary–frictional resistance:
Δ P v Δ P c + σ f
Thus, viscosity and injection rate mainly control the driving pressure gradient, capillarity controls the local interfacial entry pressure, and particle friction controls the resistance to granular rearrangement.
We define a dimensionless viscous-driving ratio:
v = Δ P v Δ P c + σ f
When Πv < 1, the liquid preferentially advances only at locally weak points of the compaction front, producing localized and asymmetric fingering. When Πv ≈ 1, finger growth and limited sidewall breakthrough coexist. When Πv > 1, the viscous pressure is sufficient to activate multiple sidewall breakthroughs, leading to a more radially distributed spoke-like morphology.
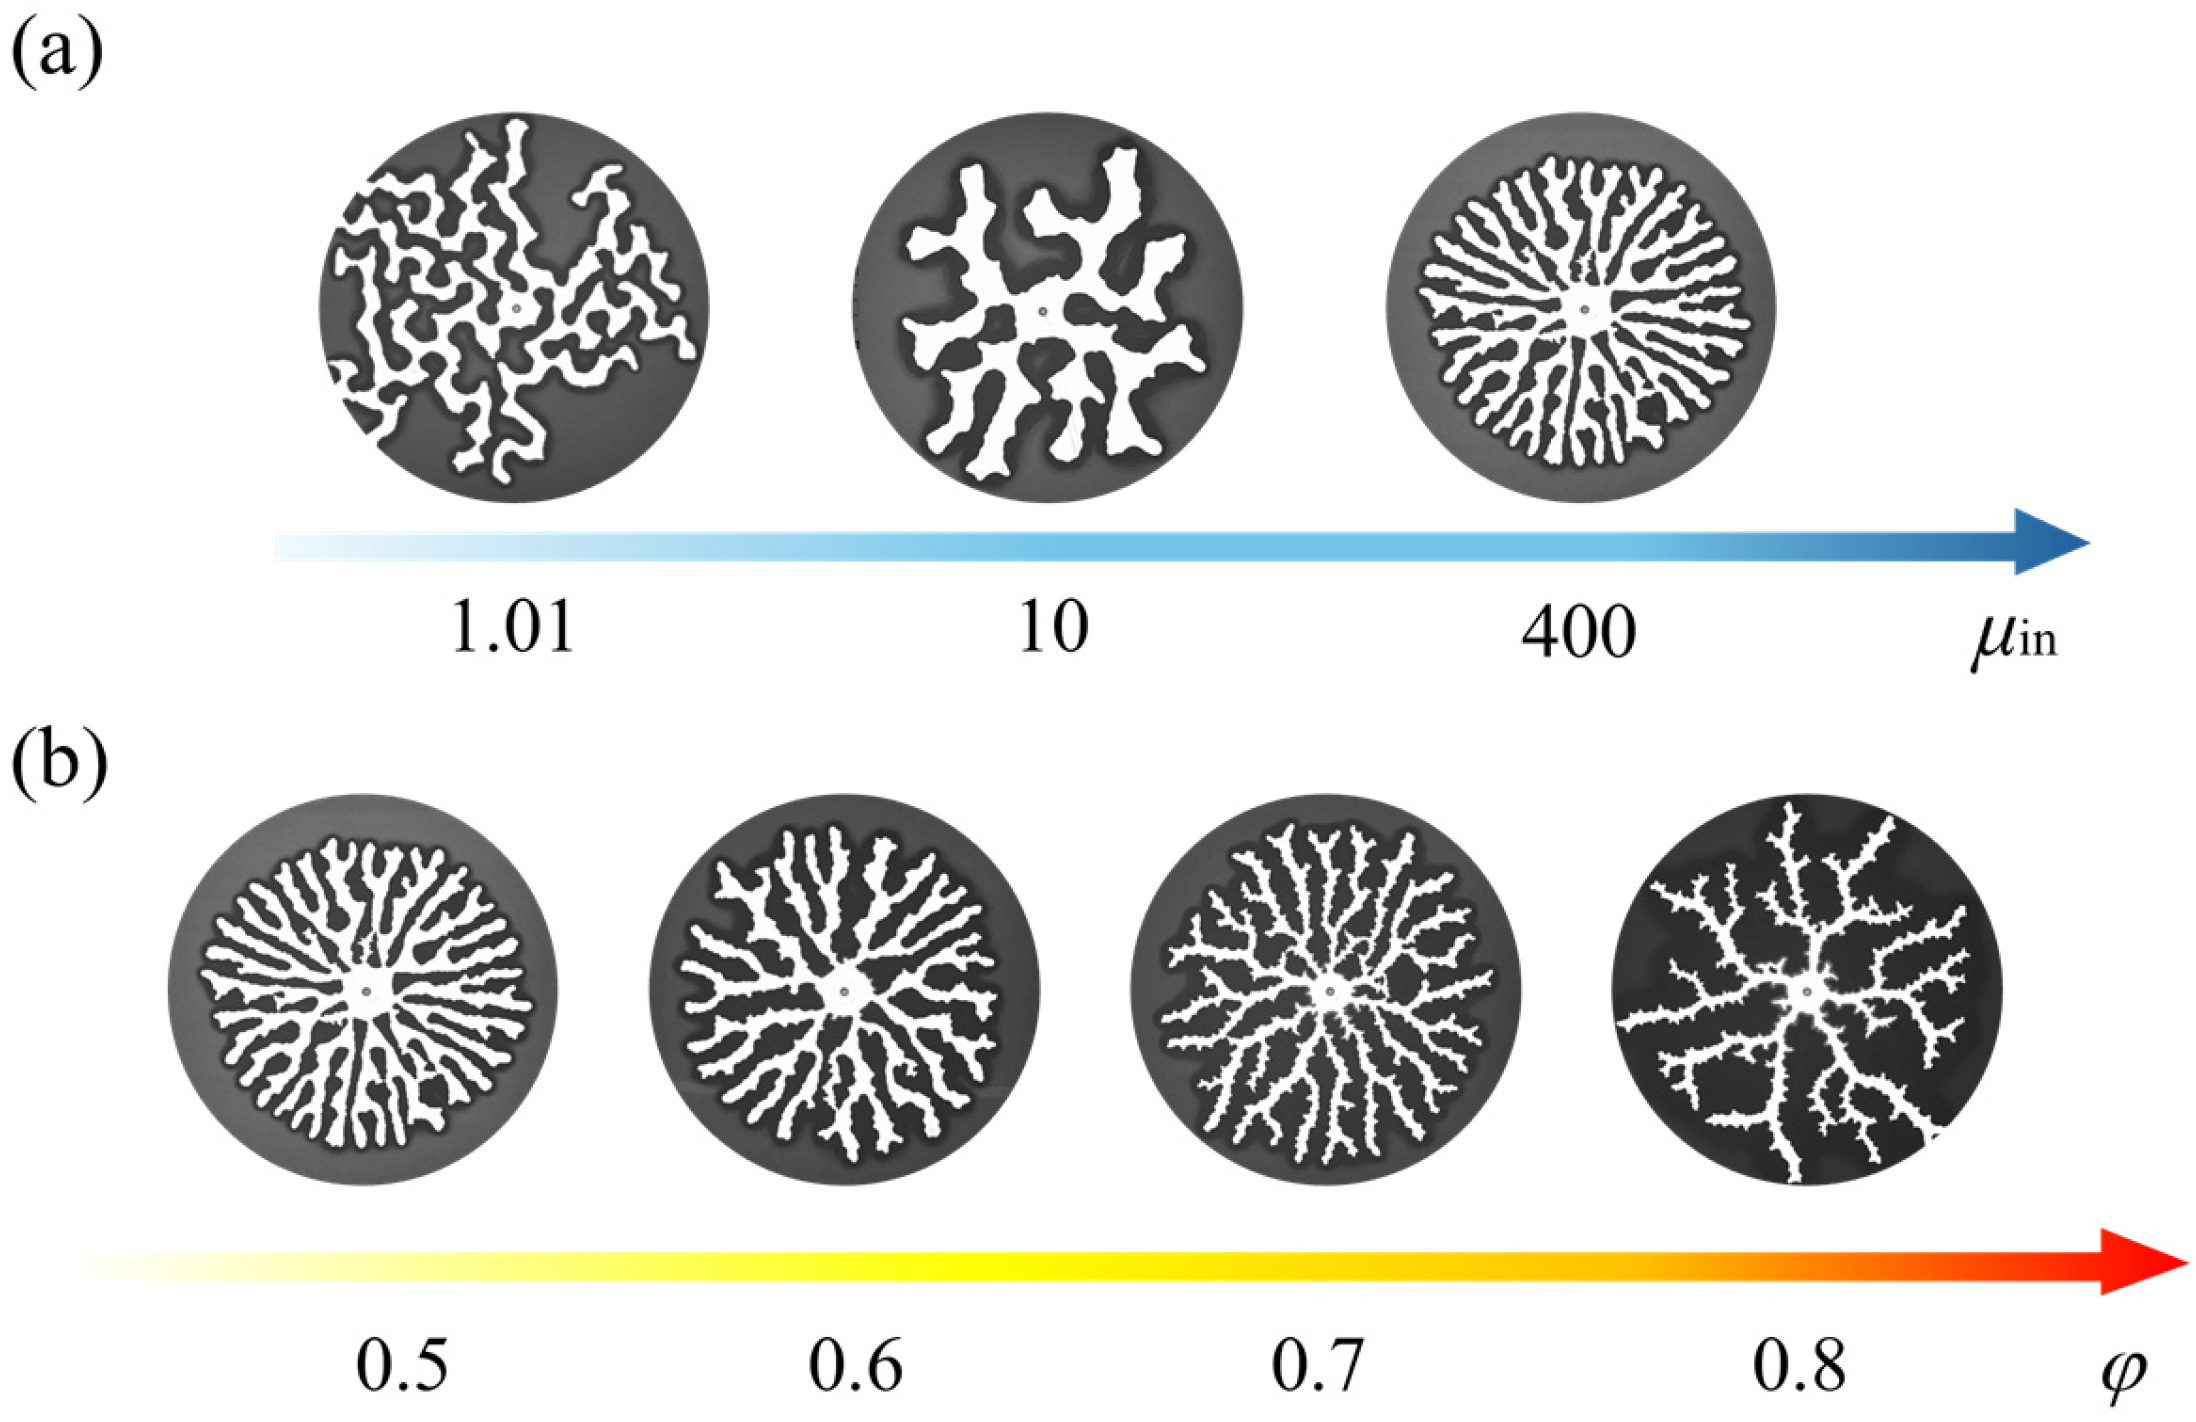
Figure 8a shows a phase diagram of invasion patterns over time for different viscosities of the injected liquid at the same layer filling ratio. We found that when the viscosity of the injected liquid increased to 10 mPa·s, the invasion pattern was similar to that at 1 mPa·s, with the finger spreading approximately across the entire model. Under the same velocity conditions, as viscosity increased, the viscous pressure difference within the finger grew, causing the finger width to become wider. When the fluid viscosity increases to 400 mPa·s, the invading filaments tend to radiate outward in all directions. A decrease in fluid viscosity leads to a transition toward an asymmetric pattern, in which many filaments no longer grow radially but instead grow in random directions. Consequently, at lower fluid viscosities, the pattern exhibits lower spatial filling, and more filament-free regions appear within the domain.
This suggests that the viscosity of the injected liquid strongly affects the global symmetry and spatial distribution of the invasion pattern. At the highest viscosity, the injected 96% glycerol aqueous solution forms a stable, axially symmetric spoke-like pattern, in which most of the spokes radiate outward while maintaining a roughly constant spoke width from the inlet to the tip.
Figure 8b shows a phase diagram of invasion morphology patterns over time for different layer filling ratios at the same injection fluid viscosity. We found that under high-viscosity conditions, where the viscous pressure gradient is large, the patterns continued to exhibit a radial diffusion toward the periphery even as the layer filling ratio increased. Measurements revealed that finger width decreased with increasing layer filling ratio, and higher layer filling ratio led to greater instability, specifically manifested by the appearance of more spiky protrusions on the sidewalls of the fingers.
The term “stabilization” in this study refers to the increase in global radial symmetry of the invasion pattern, not to the complete suppression of branching. Increasing viscosity raises the viscous pressure gradient within the invading liquid. When this pressure is below the capillary–frictional threshold, the invasion remains localized and asymmetric. When it exceeds the threshold over a broader portion of the compaction front, multiple sidewall breakthrough events are activated, producing a spoke-like radial morphology. Thus, high viscosity can simultaneously increase the global symmetry of the pattern and promote additional radial branches.
Based on the force balance defined above, the transition from local interfacial instability to radial expansion can be understood as a change in the spatial range over which the viscous pressure drop exceeds the combined capillary-frictional threshold. At low viscosity, the viscous pressure drop is only sufficient to drive growth at locally weak positions of the compaction front. The invasion direction is therefore strongly affected by local heterogeneity in packing structure and frictional resistance, resulting in disordered and asymmetric fingering.
In contrast, when the viscosity or injection rate is sufficiently high, the pressure inside the existing fingers becomes large enough to overcome the capillary-frictional threshold not only at the active tips but also near the sidewalls. New branches are then activated around the growing perimeter, causing the pattern to expand outward in multiple radial directions. This explains the transition from local fingering to the spoke-like radial morphology observed for the high-viscosity glycerol-water solution in Figure 8.
The permeability and layer filling ratio regulate this transition, but do not act independently. A higher layer filling ratio reduces the permeability and increases the viscous pressure gradient; however, it also thickens the particle compaction front and strengthens the frictional resistance. As a result, high-viscosity invasion can still maintain an overall radial expansion, but the number of spokes decreases and the fingers become narrower as the layer filling ratio increases. Therefore, the observed transition is mainly controlled by the viscous pressure gradient, with the effective capillary number, permeability, and particle friction jointly determining the threshold for radial growth.
Because the present experiments do not directly measure particle-scale contact forces, terms such as frictional resistance and local heterogeneity are used as mechanistic interpretations based on the observed morphology and scaling analysis, rather than as direct measurements of force-chain structures.

3.3. Pattern Intrusion Mode Transformation

To quantitatively distinguish the invasion patterns, we used the fractal dimension Df obtained from the box-counting analysis described in Section 2.3. Figure 9a summarizes the image-processing and box-counting workflow, and Figure 9b shows the measured Df values under different injection rates and particle layer filling ratios. The fractal dimension provides a quantitative measure of the space-filling degree of the invasion pattern: a larger Df corresponds to a more highly branched and spatially distributed pattern, whereas a smaller Df corresponds to a more localized, channelized, or finger-dominated pattern.
We found that as the layer filling ratio increases, Df gradually decreases. Based on previous research, we observed that at a layer filling ratio of 0.5, capillary-dominated invasion occurs regardless of whether the flow velocity is high or low; at this point, the frictional forces to be overcome are relatively small, and capillary forces dominate within the liquid. As the particle layer thickens, the flow eventually transitions to a viscous-dominated invasion mode at a layer filling ratio of 0.8.
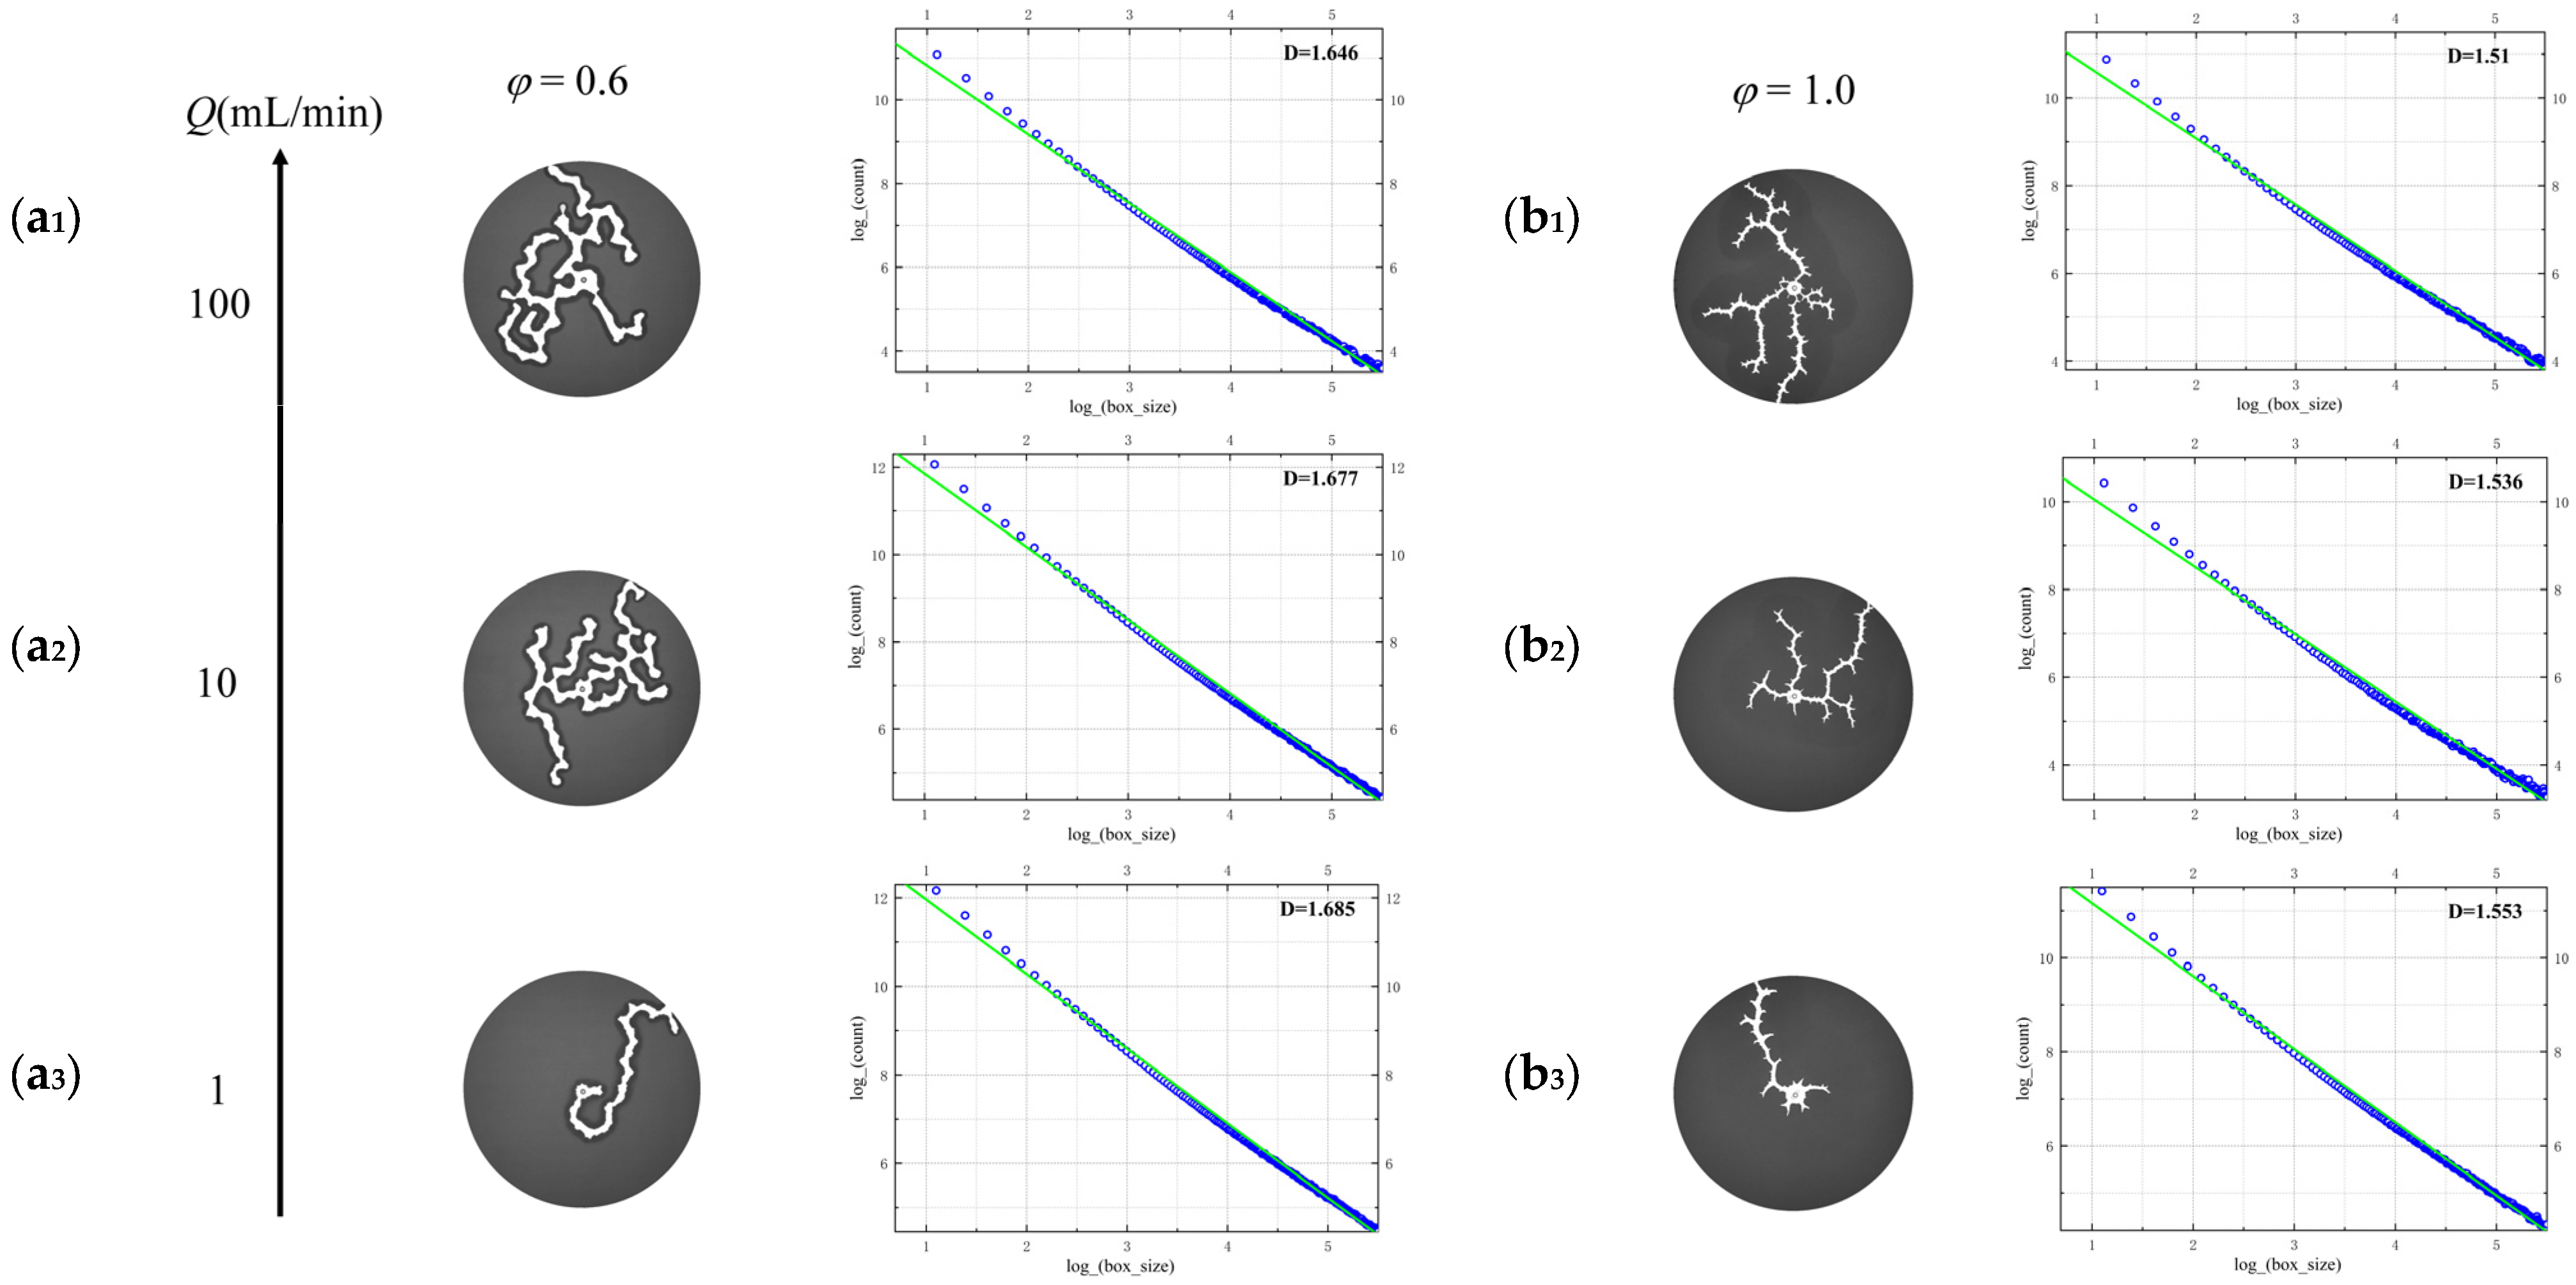
Figure 10(a1–a3) shows the fractal dimensions at a layer filling ratio of 60%. According to previous studies, the invasion patterns at this layer filling ratio exhibit capillary fingering at various flow velocities, whereas at a layer filling ratio of 1.0, the invasion patterns exhibit viscous fingering at various flow velocities. The definition of the capillary number Ca is [25]:
C a = μ υ d 2 σ k
where ν represents the flow speed at the injecting point and is calculated from the injection rate Q and the radius of the injecting hole r as ν = Q/(πr2).
A larger capillary number indicates that viscous forces become more important relative to capillary forces. However, in the present particle-filled system, the invasion mode cannot be determined by Ca alone, because the layer filling ratio also changes the permeability and the frictional resistance of the compaction front. As φ increases, the permeability k decreases, which enhances the viscous pressure buildup. At the same time, the particle contact network becomes stronger and the frictional resistance at the finger sidewalls increases. These two effects act together to suppress excessive branching and reduce the spatial filling of the invasion pattern. Therefore, the decrease in fractal dimension Df with increasing φ reflects the combined influence of viscous pressure buildup, permeability reduction, and particle-friction resistance.
When φ is high, the system becomes increasingly dominated by viscous pressure loss and frictional resistance within the compacted particle front. Under this condition, the invasion pattern is no longer highly space-filling; instead, the liquid tends to propagate through fewer preferential channels. Therefore, the decrease in Df should be interpreted as a reduction in spatial filling and side-branching, rather than as a reduction in the total length of the invasion path. At low layer filling ratio (φ = 0.5–0.6), the relatively high permeability and weak frictional resistance allow repeated tip splitting and lateral branching, producing capillary-like patterns with higher Df values of approximately 1.65–1.75. At high layer filling ratio (φ = 1.0), the permeability is much lower and the compaction-front friction is stronger; the invasion becomes more channelized and less spatially distributed, leading to lower Df values of approximately 1.50–1.58. This interpretation is consistent with previous drainage studies in which capillary invasion shows higher fractal dimensions than viscous fingering or fracture-like invasion patterns.
At φ = 0.5 and φ = 0.6, despite variations in injection rate Q from 1 to 100 mL/min, all experimental patterns exhibited capillary finger-like flow (Df ≈ 1.65–1.75). This is because the permeability remains relatively high at a low layer filling ratio, even though the Ca corresponding to the maximum Q has not yet exceeded the critical value.
At φ = 0.5–0.6, the characteristic finger width W is large and the sidewall breakthrough pressure is small; the viscous pressure drop is insufficient to overcome sidewall friction, resulting in multi-finger branching. Conversely, when φ = 1.0, the Hele–Shaw gap is fully occupied by the prepared particle layer, and the permeability is extremely low; even at the minimum flow rate Q = 1 mL/min, Ca far exceeds the critical value, and viscous forces completely dominate, causing the pattern to transition to typical viscous finger-like flow (Df ≈ 1.50–1.58). Therefore, the critical layer filling ratio (approximately 0.7–0.8) serves as a threshold: below this value, even at increased injection rates, viscous forces remain insufficient to overcome capillary resistance (since permeability is not yet sufficiently low); above this value, even at the lowest injection rates, viscous forces dominate due to extremely low permeability.


4. Conclusions

In this study, Hele-Shaw cell experiments were employed to systematically investigate the fluid invasion patterns and their evolution when high-viscosity liquids (water and glycerol-water solutions of varying concentrations) invade a layer of dry hydrophobic particles (with air serving as the low-viscosity displaced phase). The experiments focused on the effects of the particle layer filling ratio φ, injection rate Q, particle diameter d, and the viscosity μ of the invading fluid on the morphology of the invasion pattern, the number of fingers N, finger width W, pattern asymmetry rmax/rmin, and fractal dimension Df.
The fractal dimension was calculated using the standard box-counting method applied to binary invasion masks. The robustness of the fitting was assessed using the linear regression quality, and experimental variability was evaluated through repeated experiments and standard deviations. The observed decrease in Df with increasing layer filling ratio reflects a transition from highly branched, space-filling invasion to more localized and channelized invasion controlled by viscous pressure loss and frictional resistance.
Experimental results indicate that, at a fixed injection rate and particle size, the intrusion pattern changes significantly as the particle layer filling ratio φ increases. From the perspective of the fractal dimension Df, Df decreases monotonically as φ increases. The fundamental reason for this phenomenon is that an increase in the layer filling ratio φ leads to a rise in particle bulk density and a significant decrease in permeability k. According to the definition of the capillary number, the decrease in k causes Ca to increase, and viscous forces gradually dominate over capillary forces. At the same time, an increase in φ increases the thickness L of the compaction front, causing the frictional resistance of the side walls to grow exponentially, thereby suppressing finger branching and reducing the spatial filling of the pattern.
When particle size decreases, the number of fingers decreases significantly, pattern irregularity increases, finger widths widen, and a larger injection volume is required to form fingers. This is because, at the same layer filling ratio, smaller particles pack more densely, leaving smaller interparticle voids and resulting in extremely low permeability; the fluid must overcome greater frictional resistance to penetrate the compaction front. Simultaneously, the increased friction makes it difficult for new fingers to form, forcing the pressure to develop laterally and causing the fingers to widen. Conversely, when particle size increases, the particle contact network becomes less confined, making it easier for fingers to push particles outward and form wider fingers; whereas smaller particles form a denser contact network, increasing frictional resistance and suppressing finger branching, which results in fewer but wider fingers.
The viscous pressure gradient of a high-viscosity invading fluid increases the global radial symmetry of the invasion pattern. In this study, “stabilization” refers to the formation of a more symmetric spoke-like morphology, rather than the complete suppression of branching. When the viscosity of the invading liquid is much higher than that of the displaced air phase, the viscous pressure becomes sufficient to overcome the capillary–frictional threshold over a broader region of the compaction front, resulting in more radially distributed invasion.
Although the present experiments are motivated by multiphase flow in porous and particulate media, the system studied here is an idealized quasi-two-dimensional Hele–Shaw model with dry hydrophobic particles and controlled liquid injection. Therefore, the results should not be directly extrapolated to subsurface CO2 sequestration, polymer-enhanced oil recovery, or other three-dimensional reservoir processes. Instead, the experiments provide a simplified physical model for isolating how viscosity, particle-layer confinement, and frictional resistance affect invasion morphology. The relevance to engineering systems lies primarily in identifying qualitative mechanisms and dimensionless trends, rather than in providing direct design rules for field-scale injection.
In summary, through systematic experimental studies combined with theoretical modeling and fractal analysis, this paper elucidates the invasion patterns and force competition mechanisms when high-viscosity fluids invade dry hydrophobic particle layers. The main contributions include: (1) revealing the layer filling ratio φ as the core parameter controlling the balance among capillary, viscous, and frictional forces, and determining the critical layer filling ratio range (0.7–0.8); (2) clarifying the transition conditions from single-finger to multi-finger and then to spoke patterns; (3) verified that the fractal dimension Df serves as an effective quantitative indicator for identifying invasion patterns; (4) linked experimental results with the classical Saffman–Taylor theory, the Hele–Shaw model, and particle friction theory, providing experimental evidence and theoretical support for the prediction and control of multiphase particle flow. Future work could be further extended to three-dimensional systems, different combinations of wettability, and non-Newtonian fluids to gain a more comprehensive understanding of multiphase particle flow behavior under complex conditions.
The scope of the present study is limited to three liquid viscosities, three particle sizes, one particle wettability condition, and a fixed Hele–Shaw gap. Therefore, the proposed regime interpretation should be regarded as valid within the tested parameter range. Future work should systematically vary wettability, interfacial tension, and confinement ratio b / d , particle shape, and three-dimensional packing structure to determine whether the same transition criteria apply more generally.

Author Contributions

Conceptualization, Z.Q.; methodology, H.L.; formal analysis, H.L.; resources, Z.Q.; data curation, Z.Q. and H.L.; writing—original draft preparation, H.L.; writing—review and editing, Z.Q. and H.L.; supervision, Z.Q.; project administration, H.L.; funding acquisition, Z.Q. All authors have read and agreed to the published version of the manuscript.

Funding

This research was funded by the National Natural Science Foundation of China (Grant. No. 12172094).

Institutional Review Board Statement

Not applicable.

Informed Consent Statement

Not applicable.

Data Availability Statement

The raw data supporting the conclusions of this article will be made available by the authors on request.

Conflicts of Interest

The authors declare no conflicts of interest.

References

  1. Eriksen, J.A.; Toussaint, R.; Måløy, K.J.; Flekkøy, E.; Galland, O.; Sandnes, B. Pattern formation of frictional fingers in a gravitational potential. Phys. Rev. Fluids 2018, 3, 013801. [Google Scholar] [CrossRef]
  2. Makki, S.; Maalouf, E.; Yehya, A. Review of the environmental and health risks of hydraulic fracturing fluids. Heliyon 2025, 11, e40883. [Google Scholar] [CrossRef] [PubMed]
  3. Algar, C.K.; Boudreau, B.P. Transient growth of an isolated bubble in muddy, fine-grained sediments. Geochim. Cosmochim. Acta 2009, 73, 2581–2591. [Google Scholar] [CrossRef]
  4. Scandella, B.P.; Delwiche, K.; Hemond, H.F.; Juanes, R. Persistence of bubble outlets in soft, methane-generating sediments. J. Geophys. Res. Biogeosci. 2017, 122, 1298–1320. [Google Scholar] [CrossRef]
  5. Gafeira, J.; Dolan, M.F.J.; Monteys, X. Geomorphometric Characterization of Pockmarks by Using a GIS-Based Semi-Automated Toolbox. Geosciences 2018, 8, 154. [Google Scholar] [CrossRef]
  6. Cashman, K.V.; Sparks, R.S.J.; Blundy, J.D. Vertically extensive and unstable magmatic systems: A unified view of igneous processes. Science 2017, 355, eaag3055. [Google Scholar] [CrossRef]
  7. Birdsell, D.T.; Rajaram, H.; Dempsey, D.; Viswanathan, H.S. Hydraulic fracturing fluid migration in the subsurface: A review and expanded modeling results: Subsurface flow model of fracturing fluids. Water Resour. Res. 2015, 51, 7159–7188. [Google Scholar] [CrossRef]
  8. Barati, R.; Liang, J.-T. A review of fracturing fluid systems used for hydraulic fracturing of oil and gas wells. J. Appl. Polym. Sci. 2014, 131, 40735. [Google Scholar] [CrossRef]
  9. Armstrong, C.; Sandnes, B.; Andreoli, E. Sub-millibar pressure gradient along a gravity-driven percolated CO2 gas diffusion electrode for vertical scale-up. Ind. Chem. Mater. 2026, in press. [Google Scholar] [CrossRef]
  10. Qin, Z.; Huang, W.; Wang, J.; Zhang, S.; Li, H.; Li, H. Effects of liquid viscosity and air injection rate on air invasion in a highly compacted granular material. Phys. Fluids 2024, 36, 053322. [Google Scholar] [CrossRef]
  11. Qin, Z.; Wang, J.; Xie, J.; Zhang, H. Gas invasion in stratified porous medium. Phys. Fluids 2025, 37, 063304. [Google Scholar] [CrossRef]
  12. Khobaib, K.; Reis, P.; Moura, M.; Toussaint, R.; Flekkøy, E.G.; Måløy, K.J. Gravity stabilized drainage in porous media with controlled disorder. Phys. Rev. Res. 2025, 7, 023040. [Google Scholar] [CrossRef]
  13. Makki, S.; Yehya, A.; Maalouf, E. Complex fracture networks prohibit safe fracturing fluid recovery. Eng. Rep. 2025, 7, e70036. [Google Scholar] [CrossRef]
  14. Campbell, J.M.; Ozturk, D.; Sandnes, B. Gas-driven fracturing of saturated granular media. Phys. Rev. 2017, 8, 064029. [Google Scholar] [CrossRef]
  15. Ke, F.; Kwok, C.Y.; Duan, K. Impact of intergranular bonds on morphology transition of two-phase fluid-induced deformation. Phys. Rev. Fluids 2025, 10, 013902. [Google Scholar] [CrossRef]
  16. Ding, Y.; Chang, F.; Jia, L. Experimental investigation and modeling of low-surface-tension droplets self-transport on conical surfaces. Surf. Interfaces 2026, 20, 108548. [Google Scholar] [CrossRef]
  17. Saffman, P.G.; Taylor, G.I. The Penetration of a Fluid into a Porous Medium or Hele-Shaw Cell Containing a More Viscous Liquid. Proc. R. Soc. Lond. Ser. A Math. Phys. Sci. 1958, 245, 312–329. [Google Scholar] [CrossRef]
  18. Cao, J.; Li, Y.; Zhang, Y.; Tang, X.; Liu, Z.; Li, Q.; Song, T.; Zhang, Y. Viscous and capillary forces competition triggered flow instability in porous media. Phys. Fluids 2025, 37, 082138. [Google Scholar] [CrossRef]
  19. Fardin, M.A.; Divoux, T.; Lee, S.; Bischofberger, I. Pattern Formation and Instabilities in Particulate Suspensions. Annu. Rev. Fluid Mech. 2025, 58, 275–300. [Google Scholar] [CrossRef]
  20. Ozturk, D.; Morgan, M.L.; Sandnes, B. Flow-to-fracture transition and pattern formation in a discontinuous shear thickening fluid. Commun. Phys. 2020, 3, 119. [Google Scholar] [CrossRef]
  21. Sandnes, B.; Knudsen, H.A.; Måløy, K.J.; Flekkøy, E.G. Labyrinth patterns in confined granular-fluid systems. Phys. Rev. Lett. 2007, 99, 038001. [Google Scholar] [CrossRef]
  22. Zhang, D.; Campbell, J.M.; Eriksen, J.A.; Flekkøy, E.G.; Måløy, K.J.; MacMinn, C.W.; Sandnes, B. Frictional fluid instabilities shaped by viscous forces. Nat. Commun. 2023, 14, 3044. [Google Scholar] [CrossRef]
  23. Xue, K.; Han, P.; Du, K.; Gan, Y.; Wang, Z.; Bai, C. Morphodynamics of a dense particulate medium under radial explosion. Soft Matter 2020, 16, 1498–1517. [Google Scholar] [CrossRef] [PubMed]
  24. Dalbe, M.-J.; Juanes, R. Morphodynamics of fluid-fluid displacement in three-dimensional deformable granular media. Phys. Rev. Appl. 2018, 9, 024028. [Google Scholar] [CrossRef]
  25. Islam, A.; Chevalier, S.; Ben Salem, I.; Bernabe, Y.; Juanes, R.; Sassi, M. Characterization of the crossover from capillary invasion to viscous fingering to fracturing during drainage in a vertical 2d porous medium. Int. J. Multiph. Flow 2014, 58, 279–291. [Google Scholar] [CrossRef]
  26. Choi, J.-H.; Seol, Y.; Boswell, R.; Juanes, R. X-ray computedtomography imaging of gas migration in water-saturated sediments: From capillary invasion to conduit opening. Geophys. Res. Lett. 2011, 38, L17310. [Google Scholar] [CrossRef]
  27. Morrow, L.C.; Paulin, O.W.; Hennessy, M.G.; Hewitt, D.R.; Morgan, M.L.; Sandnes, B.; MacMinn, C.W. Bulldozing an immersed granular material in a confined channel. arXiv 2025, arXiv:2505.05129. [Google Scholar] [CrossRef]
  28. Xia, A.; Chang, H.; Fu, J.; Zhang, J.; Zhu, X.; Huang, Y.; Zhu, X.; Liao, Q. Continuous hydrothermal catalytic hydrolysis of biomass in a packed-bed reactor loaded with solid acids. Int. J. Heat Mass Transf. 2026, 264, 128760. [Google Scholar] [CrossRef]
  29. Druecke, B.C.; Hooshanginejad, A.; Mukherjee, R.; Poureslami, P.; Lee, S. Particle-laden filaments from a draining suspension. Soft Matter 2025, 21, 8479–8488. [Google Scholar] [CrossRef] [PubMed]
  30. Meakin, P. Models for Material Failure and Deformation. Science 1991, 252, 226–234. [Google Scholar] [CrossRef]
  31. Parmar, V.R.; Bandyopadhyay, R. Interfacial instabilities in confined displacements involving non-Newtonian fluids. Europhys. Lett. 2024, 145, 47001. [Google Scholar] [CrossRef]
  32. Li, D.; Yang, Z.; Zhang, R.; Pahlavan, A.A.; Hu, R.; Chen, Y.F. Interfacial patterns of stretching suspension. Phys. Rev. Fluids 2025, 10, 104004. [Google Scholar] [CrossRef]
  33. Kings, J.E.; Folkow, L.P.; Hammer, Ø.; Kjelstrup, S.; Mason, M.J.; Xiong, F.; Flekkøy, E.G. A model for maxilloturbinate morphogenesis in seals. PLoS ONE 2025, 20, e0316669. [Google Scholar] [CrossRef]
Figure 1. Schematic diagram of the experimental setup. Liquids of different viscosities are injected through a 3 mm-radius hole located at the center of the model into a Hele-Shaw cell filled with dry hydrophobic particles. The Hele-Shaw cell is placed on a platform and leveled to prevent the effects of gravity. CCD camera is mounted directly above the cell; recording begins before injection starts, and the final footage is imported into a computer for analysis.
Applsci 16 05305 g001
Figure 2. Schematic diagram of the fluid intrusion pattern and the method for determining the measurement parameters. The blue outline represents the outer edge of the pattern. By measuring this outer edge, the minimum radius (rmin) and maximum radius (rmax) are determined. The minimum radius is divided into three equal parts to define three concentric circles, with the center of each circle located at the injection port.
Applsci 16 05305 g002
Figure 3. (a) shows a schematic diagram of fluid intrusion into dry hydrophobic particles driving particle movement. The blue portion represents the invading liquid, and the gray spherical particles are the dry hydrophobic particles. The hydrophobic particles are completely wetted by air, and the particle aggregate is referred to as the compaction front, with a length of L. (b) shows the liquid finger-like structure formed after invasion due to Saffman-Taylor instability, with a finger width of W. (c) The viscous flow of the liquid along the growing finger creates a pressure gradient ranging from the injection pressure at the inlet to the capillary pressure Pt at the tip. Subfigure (d) is a microscopic schematic of a 100-micrometer particle, and (e) depicts a liquid bead formed when a droplet is encapsulated by a hydrophobic particle.
Applsci 16 05305 g003
Figure 4. (a) Evolution of the infiltration pattern over time when pure water is injected into a granular material composed of dry spherical hydrophobic particles. The injection rate Q = 100 mL/min, and the diameter d of the spherical particles is 100 μm. (b) Variation in the exponent N with injection time t.
Applsci 16 05305 g004
Figure 5. (a) When Q = 100 mL/min and d = 100 μm, the finger-like structure width decreases as the layer filling ratio increases. (b) The number of finger-like structures decreases as the layer filling ratio increases. (c) rmax/rmin increases as the particle layer filling ratio increases. The error bars represent the standard deviation of repeated experiments.
Applsci 16 05305 g005
Figure 6. (a1,b1) show microscopic schematics of particles with diameters of 70 μm and 130 μm, respectively, as captured by gold-labeled microscopy. (a2,b2) show the patterns over time, respectively.
Applsci 16 05305 g006
Figure 7. (a) Phase diagrams obtained by varying the injection rate from 1 mL/min to 100 mL/min for φ = 0.5, 0.6, 0.7, and 0.8. (b) Finger number N derived from the data in (a). (c) Finger width plots derived from the data in subfigure (a).
Applsci 16 05305 g007
Figure 8. We fixed the injection rate at Q = 100 mL/min but injected liquids of different viscosities into a dry hydrophobic particle material composed of 100-micrometer spherical particles. (a) shows the penetration patterns of pure water, a 58% glycerol-water solution, and a 96% glycerol-water solution, with viscosities of 1.01, 10, and 400 mPa·s, respectively. (b) shows the invasion patterns of the 96% glycerol-water solution at different layer filling ratios; it is observed that the invasion pattern continues to spread outward, and the number of spokes decreases as the layer filling ratio increases.
Applsci 16 05305 g008
Figure 9. Fractal-dimension analysis of the invasion patterns. (a) Image-processing and box-counting workflow: original experimental image, cropped region of interest, grayscale conversion, binary segmentation of the invaded-liquid region, box-counting grids with decreasing box sizes, and log-log linear fitting for Df. (b) Fractal dimension Df measured at different injection rates and particle layer filling ratios. The error bars represent the standard deviation of repeated experiments. The pink horizontal line marks the boundary between the moving average and the stochastic indicator.
Applsci 16 05305 g009
Figure 10. Representative box-counting plots used to calculate the fractal dimension. (a1a3) Results for φ = 0.6 at injection rates of 1, 10, and 100 mL/min, respectively. (b1b3) Results for φ = 1.0 at injection rates of 1, 10, and 100 mL/min, respectively. The linear fitting region corresponds to the scale range used for calculating Df.
Applsci 16 05305 g010
Table 1. Density ρ of solid particles and working liquid [pure water or glycerol/water (g/w) solutions], surface tension σ at the liquid-air interface, and liquid viscosity μ.
Materialρ (g/cm3)σ (mN/m)μ (mPa·s)
Particles2.2--
Water172.751.01
58% g/w solution1.1467.810.0
96% g/w solution1.2462.4400.0
Table 2. Symbol meanings and units.
NotationHidden MeaningUnit
μViscositymPa·s
rmaxThe distance from the injection point to the outermost edge of the designmm
rminThe shortest distance from the injection point to the outer edge of the designmm
LWidth of particle accumulationmm
hGranular layer thicknessmm
bPanel spacingmm
φlayer filling ratio
WWidth of the fingermm
dParticle sizeμm
tallTime of the invasions
QInjection ratemL/min
NFinger counting
ΔPtThreshold pressure at the gas–liquid interfacePa
ΔPvViscous pressurePa
ΔPcCapillary pressurePa
σfFrictional stress resisting penetrationPa
ΔzLength of the viscous filamentmm
kPermeability of the granular material
CaCapillary number
Dffractal dimension
νInjection ratemL/min·mm2
Disclaimer/Publisher’s Note: The statements, opinions and data contained in all publications are solely those of the individual author(s) and contributor(s) and not of MDPI and/or the editor(s). MDPI and/or the editor(s) disclaim responsibility for any injury to people or property resulting from any ideas, methods, instructions or products referred to in the content.