1. Introduction
Submicron particulate matter (PM) in the size range of 0.1–1.0 µm remains one of the most challenging fractions to remove in air pollution control systems because conventional collection technologies generally exhibit low capture efficiency for particles within this range [
1,
2]. Since these fine particles are not readily removed by conventional mechanisms, increasing their size prior to collection has emerged as a promising preconditioning strategy for improving overall removal performance. Among the available approaches, condensational growth offers considerable potential because it enlarges suspended particles through phase change, thereby increasing their aerodynamic diameter and facilitating subsequent capture.
Condensation, defined as the phase transformation of vapor into liquid, is a fundamental process in coupled heat and mass transfer phenomena [
3]. Due to its fundamental role in heat and mass transfer, condensation is widely utilized across various engineering fields, including seawater desalination [
4], electronics cooling [
5,
6], refrigeration [
7], chemical distillation [
8], and thermal power generation [
9]. In heterogeneous condensation, water vapor condenses on a non-gaseous surface, such as suspended particles that act as cloud condensation nuclei (CCN) [
10,
11]. The behavior of this process is governed by several parameters, including pressure, temperature, flow velocity, particle size, and the vapor diffusion coefficient. Among these variables, pressure has been identified as one of the dominant factors because it strongly influences vapor transport, supersaturation development, and condensational growth kinetics [
12,
13]. Despite extensive studies on droplet condensation, the quantitative effect of pressure variation in confined tubular flows, where pressure recovery may induce supersaturation, remains insufficiently characterized for micron- and submicron-scale particle systems.
Accordingly, this study investigates pressure recovery-induced supersaturation as a controllable mechanism for promoting heterogeneous condensation on submicron particles. A three-dimensional CFD-DPM–UDF framework was developed to predict condensation time, droplet growth, and associated heat and mass transfer characteristics for particles with initial diameters of 0.1–1.0 µm growing to 5 µm under pressure-recovery conditions from 0.5–0.9 bar to 1 atm. The novelty of this work lies in systematically quantifying the role of pressure recovery-induced supersaturation in accelerating submicron particle growth for potential use as a preconditioning stage in air pollution control systems.
2. Methodology
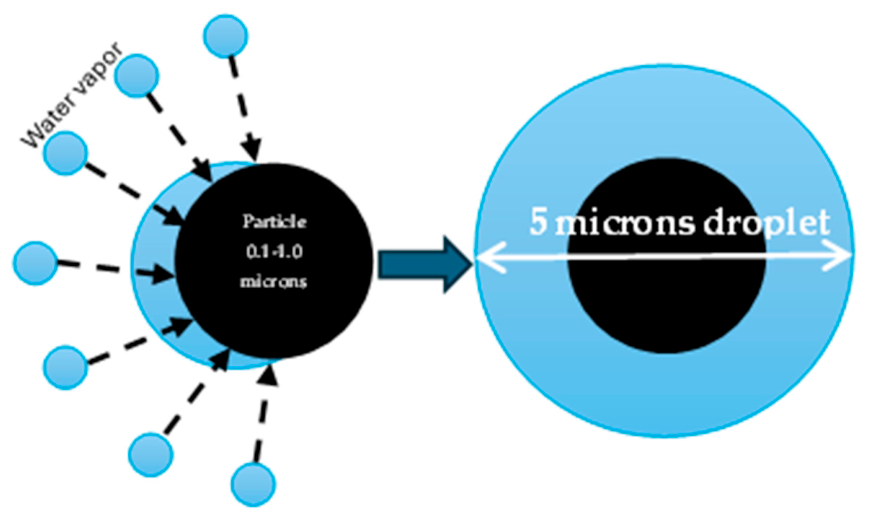
Based on previous studies on submicron particle enlargement, condensation of water vapor onto particle surfaces is considered the primary mechanism driving this process [
11,
12,
13]. Typically, heterogeneous condensation on submicron particles occurs in two distinct stages. First, critical embryo droplets form on the particle surface and gradually enlarge to form a spherical cap that spreads across the surface. In the second stage, this droplet further develops into a larger spherical droplet, eventually encapsulating the entire particle, as illustrated in
Figure 1.
According to Fletcher’s theory of heterogeneous condensation [
11], water vapor spontaneously condenses on a particle surface once the ambient supersaturation exceeds a critical threshold [
13]. This principle aligns with the Kelvin equation, which states that smaller particles require a higher critical supersaturation to initiate condensation [
14,
15]. For submicron particles, the vapor must reach a sufficient supersaturation level to overcome the energy barrier arising from the increased free energy associated with forming a new liquid–vapor interface [
13,
14,
15,
16,
17]. This condition is defined by the vapor supersaturation ratio S, given as the ratio of the water vapor partial pressure
Pv to its saturation pressure
Psat [
10,
17,
18]:
2.1. Tube Design
2.1.1. Inlet Air Characteristics
To simulate the condensation process under realistic conditions, the inlet air properties were defined based on the climatology of Chiang Mai Province, Thailand. The focus period was from March to May, which consistently experiences severe particulate matter pollution. Analysis of meteorological data from the Thai Meteorological Department (2016–2024) yielded representative hot-season conditions: a temperature of 34 °C (307.15 K), a relative humidity of 52.5%, and standard local atmospheric pressure. The thermodynamic and transport properties of the moist air for these conditions were calculated based on standard relations [
19,
20,
21,
22].
2.1.2. Droplet Characteristics
To model the heterogeneous condensation process, the initial submicron particles were represented as spherical water-equivalent condensation nuclei with diameters ranging from 0.1 to 1.0 µm. This simplification was adopted to isolate the effect of pressure-induced supersaturation on condensation-driven size enlargement and to maintain consistency with the DPM–UDF droplet-growth framework. The liquid phase was assumed to have pure-water properties, and the thermophysical properties used for the droplet phase are summarized in
Table 1.
It should be noted that this representation does not imply that real atmospheric PM2.5 particles are composed of pure water. Real aerosols may contain solid particles, soot, sulfates, salts, organics, dust, or mixed inorganic–organic materials. These compositions can affect hygroscopicity, wettability, contact angle, surface tension, and the critical supersaturation required for activation. In particular, soluble or hygroscopic particles may grow at lower supersaturation because of the solute effect, whereas hydrophobic particles may require higher supersaturation because of poor wettability and increased heterogeneous nucleation barriers. Therefore, the present water-equivalent assumption provides an idealized baseline for evaluating pressure-induced supersaturation, while Köhler-effect and composition-dependent growth should be considered in future studies.
2.1.3. Droplet Condensation Dynamics
The condensation behavior of droplets is governed by their surface curvature. High curvature reduces the molecular binding energy at the liquid–vapor interface, resulting in an elevated equilibrium vapor pressure,
e(
r), above a droplet compared to that over a flat surface, es. Consequently, the minimum relative humidity required for condensational growth is size-dependent, as described by the Kelvin equation [
17,
18]. This study simulates the condensation-driven growth of droplets from an initial diameter of 0.1–1.0 µm to 5 µm under ambient conditions (the input parameters used in the calculation were obtained from the thermophysical properties of moist air and pure water summarized in
Table 1 and
Table 2).
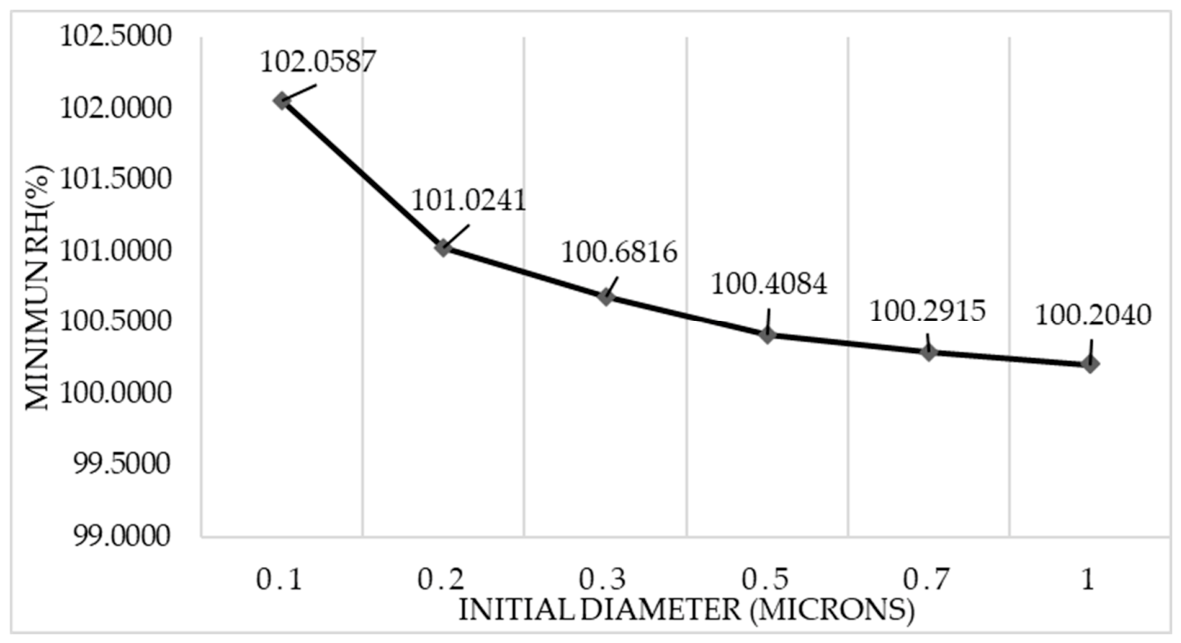
The calculated minimum
RH threshold for growth across this size range is presented in Equations (1) and (2) and
Figure 2.
The Kelvin equation is often expressed in terms of equilibrium relative humidity:
If the ambient relative humidity is lower than RHeq (r), the droplet evaporates; if it is higher than RHeq (r), the droplet grows by condensation.
Figure 2 presents the variation in the minimum relative humidity (
RH) required to sustain droplet growth as a function of the initial droplet diameter within the submicron size range (0.1–1.0 µm). The results reveal a clear inverse relationship between droplet size and the minimum
RH necessary for condensation-driven growth. Specifically, smaller droplets require higher supersaturation levels, with the minimum
RH reaching approximately 102.06% for droplets with a diameter of 0.1 µm, whereas droplets approaching 1 µm in diameter require only about 100.20%
RH to maintain growth.
This behavior is consistent with the Kelvin effect, which predicts that droplets with smaller radii exhibit higher equilibrium vapor pressures due to increased surface curvature. As a result, a greater degree of supersaturation is required to overcome the curvature-induced elevation in vapor pressure and allow net condensation to occur. As the droplet diameter increases, the influence of curvature progressively diminishes, reducing the supersaturation requirement and causing the minimum
RH to approach the saturation condition asymptotically [
17,
18,
24].
3. CFD Simulation Methodology
While
Section 2 describes the physical basis, thermodynamic assumptions, inlet air properties, and droplet characteristics used to define the condensation-growth problem,
Section 3 presents the numerical implementation of the CFD model. The CFD methodology is described separately to clearly distinguish the theoretical condensation framework from the computational procedures, including geometry generation, mesh design, boundary conditions, solver settings, turbulence modeling, DPM tracking, and UDF-based droplet-growth calculations.
Simulating water vapor condensation on particles requires a multiphysics framework that couples fluid flow, heat and mass transfer, vapor-species transport, and phase-change phenomena. In the present study, heterogeneous condensation was modeled by combining the species transport model with the Discrete Phase Model (DPM) and a custom User-Defined Function (UDF) for condensation-driven particle growth. This framework resolves the interaction between the continuous gas phase (air–water vapor mixture) and the dispersed droplet/particle phase, while predicting particle growth along Lagrangian trajectories under local vapor and thermal conditions [
25,
26,
27].
The model was implemented in ANSYS Fluent 2024 R2 to simulate the heterogeneous condensation of water vapor onto submicron particles in a tubular domain under varying pressure conditions. The continuous phase was solved using a Eulerian formulation, whereas the dispersed phase was treated in a Lagrangian manner through DPM. A species transport formulation was used to describe vapor generation, convection, diffusion, and mixing in the carrier gas, and the condensation-growth law was supplied through a custom UDF. This Eulerian–Lagrangian framework provides a physically consistent basis for evaluating interphase momentum, heat, and mass transfer associated with vapor–particle interactions [
25,
26,
28,
29]. The governing equations and constitutive relations are presented in the following sections.
3.1. Computational Geometry and Grid
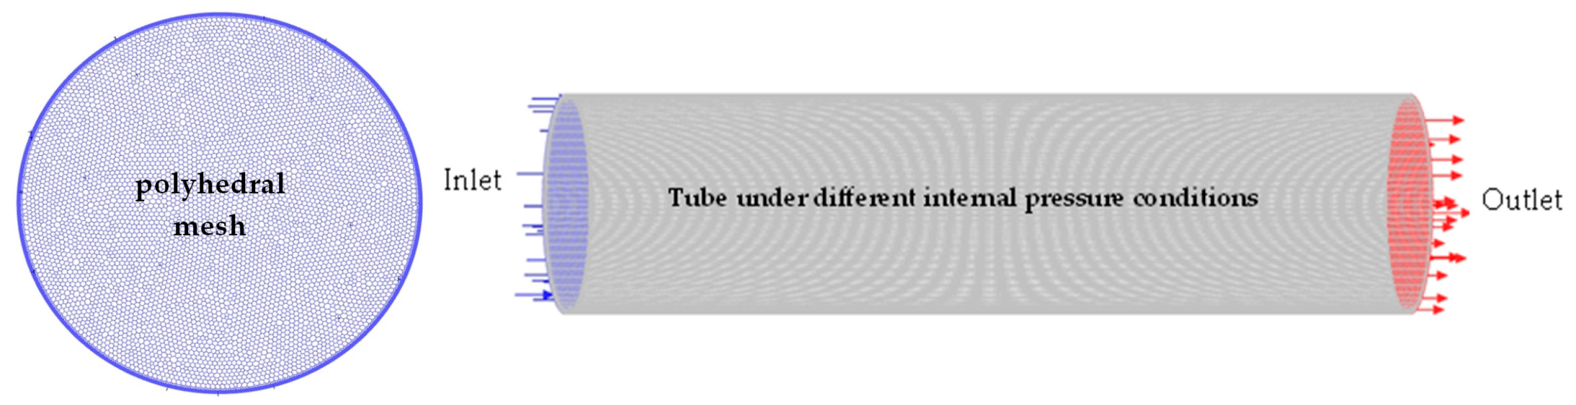
A three-dimensional computational domain representing a cylindrical tube with an inner diameter of 0.30 m and a length of 1.50 m was developed to investigate condensation-driven growth of submicron water droplets under different pressure-recovery conditions. The carrier-gas phase was solved using a Eulerian framework, whereas droplet motion and growth were treated in a Lagrangian manner through the Discrete Phase Model (DPM) coupled with a custom User-Defined Function (UDF) growth law [
25,
26,
27]. All simulations were performed under quasi-steady-state gas-phase conditions, and the realizable
k-ε turbulence model was employed to represent turbulent transport in the tube [
30,
31]. This numerical framework enabled the local gas-phase velocity, pressure, temperature, and water-vapor concentration fields to be resolved and subsequently coupled to droplet-growth calculations.
The geometry was constructed in ANSYS DesignModeler, and the computational mesh was generated using a hybrid polyhedral–prism strategy, as shown in
Figure 3.
Polyhedral cells were used in the core flow region because they provide higher face connectivity, improved gradient reconstruction, reduced numerical diffusion, and enhanced convergence stability compared with conventional tetrahedral cells. These characteristics are advantageous for internal-flow CFD simulations involving turbulence, species transport, heat transfer, and phase-change phenomena, where accurate prediction of velocity, temperature, and water-vapor concentration gradients is required. In addition, polyhedral meshes generally require fewer cells than equivalent tetrahedral meshes to achieve comparable accuracy, thereby reducing computational cost while maintaining numerical stability.
Prism-layer inflation was applied near the tube wall to improve the resolution of boundary-layer gradients in velocity, temperature, and water-vapor concentration. This near-wall refinement is important because condensation growth depends on the local thermodynamic and transport conditions experienced by droplets along their Lagrangian trajectories. Mesh quality was controlled by maintaining an acceptable aspect ratio, skewness, and orthogonal quality. In general, skewness values below 0.5 and orthogonal quality values greater than 0.5 were targeted to ensure numerical stability and reliable gradient evaluation.
A grid-independence study was conducted by systematically refining the mesh and monitoring the average static pressure at the tube midpoint. This variable was selected as the primary grid-independence indicator because pressure recovery is directly related to supersaturation generation, which is the main driving mechanism for condensation in this study. Based on this assessment, a mesh containing 3,018,750 elements was selected as an optimum compromise between numerical accuracy, convergence stability, and computational cost.
However, for condensation-coupled simulations, pressure-based grid verification should be interpreted as an initial numerical consistency check rather than a complete validation of the condensation-growth prediction. Condensation growth depends not only on the pressure field but also on local temperature distribution, water-vapor mass fraction, relative humidity, near-wall scalar gradients, and the thermodynamic conditions experienced by droplets along their Lagrangian trajectories. Therefore, a more comprehensive grid-independence assessment should include additional variables such as axial temperature profiles, water-vapor mass-fraction distributions, local relative humidity, condensation time, average condensation mass transfer rate, average heat transfer rate, and final droplet diameter. These quantities are directly related to the coupled momentum, energy, species transport, and DPM–UDF droplet-growth calculations.
3.2. Boundary Conditions
The boundary conditions were prescribed in terms of the inlet gas velocity, temperature, pressure, and relative humidity. The gas-phase inlet velocity was fixed at 1.00 m/s, and the inlet temperature was set to 307.15 K (34 °C) under adiabatic wall conditions. The present results were obtained under a fixed inlet velocity of 1.00 m/s. Since inlet velocity affects residence time, turbulent mixing, and vapor transport, future work should include velocity sensitivity analysis to assess the applicability of the pressure-controlled condensation mechanism under broader operating conditions. The pressure-recovery section of the tube was represented by restoring the operating pressure to atmospheric pressure, thereby establishing the reference condition for evaluating the thermodynamic state after pressure recovery. Under these conditions, the pressure transition was associated with an increase in relative humidity to supersaturated levels, which provided favorable conditions for heterogeneous condensation on suspended particles [
12,
13,
18].
In the present study, the condensational growth of droplets with initial diameters in the range of 0.1–1.0 µm to a target diameter of 5 µm was investigated. The initial pressure inside the tube was varied from 0.5, 0.6, 0.7, 0.8, and 0.9 bar before recovery to 1 atm, corresponding to nominal supersaturated RH values of 202.65%, 168.88%, 144.75%, 126.66%, and 112.58%, respectively. The pressure values of 0.5–0.9 bar represent the initial thermodynamic pressure cases before recovery, whereas 1 atm represents the recovered/reference pressure state. These nominal supersaturated
RH values were calculated under the assumption that the water-vapor mole fraction remained constant during isothermal pressure recovery from the initial pressure to 1 atm. Accordingly, the reported nominal supersaturated
RH values represent thermodynamic input conditions based on isothermal pressure recovery with a constant water-vapor mole fraction. They do not represent measured or spatially uniform
RH distributions inside the tube. The highest value, 202.65%, corresponds to the idealized 0.5 bar to 1 atm recovery case and should be interpreted as an upper-bound supersaturation condition for evaluating condensation-growth sensitivity. These thermodynamic transitions strongly influenced the condensation kinetics and produced differences in condensation time, as well as in the coupled mass and heat transfer processes governing droplet growth [
17,
18,
28,
32,
33,
34]. The continuous gas-phase CFD solution was treated as quasi-steady for each pressure-recovery case, whereas droplet growth was tracked in time using the DPM–UDF framework. Thus, the reported condensation time represents the Lagrangian particle-growth time required for droplets with initial diameters of 0.1–1.0 µm to reach 5 µm, rather than the duration of the pressure-recovery event itself.
Because droplets in the 0.1–1.0 µm size range are strongly affected by curvature, the equilibrium vapor pressure over a curved droplet surface is higher than that over a planar liquid interface. Consequently, smaller droplets require higher supersaturation levels to sustain condensational growth. The minimum relative humidity required for droplet growth was therefore evaluated using the Kelvin equation (
Figure 2), which accounts for the curvature-induced increase in equilibrium vapor pressure and defines the size-dependent supersaturation threshold for stable droplet growth under the specified ambient conditions [
17,
18,
24]. For this reason, the Kelvin effect was incorporated as a thermodynamic criterion for assessing whether the local vapor field was sufficient to support continued droplet growth.
3.3. Solver Settings
The governing equations for mass, momentum, energy, and species transport were solved using the pressure-based solver in ANSYS Fluent [
25,
26]. Pressure–velocity coupling was handled using the Pressure Implicit with Splitting of Operators (PISO) algorithm, originally introduced by Issa [
35]. Although PISO is particularly recommended for transient calculations, it can also provide robust pressure–velocity coupling in strongly coupled transport problems when stable resolution of velocity, pressure, temperature, and species fields is required [
26,
35]. In the present study, PISO was used for pressure–velocity coupling during the numerical solution procedure to improve coupling stability; however, the gas-phase fields were interpreted as quasi-steady fields for each pressure-recovery case.
Spatial discretization of the governing equations was performed using second-order accurate schemes for the convective terms, while the diffusion terms were treated with the default second-order central differencing formulation in Fluent. Pressure interpolation was also performed using a second-order scheme to improve solution accuracy in regions with appreciable pressure gradients [
26,
36]. These higher-order discretization schemes were selected to reduce numerical diffusion and to improve the prediction of heat and mass transfer associated with condensation processes.
Solution convergence was assessed primarily from the reduction in scaled residuals for the continuity, momentum, energy, and species equations, and the solution was considered numerically converged when these residuals decreased to 10
−6 or lower. However, residual reduction alone is insufficient to demonstrate complete physical convergence of the numerical solution. Accordingly, key solution variables, such as pressure, temperature, species transport, and other problem-relevant parameters, should also be monitored [
25,
26,
36]. In the present study, grid independence was evaluated independently through a mesh-refinement analysis and was not determined solely on the basis of residual convergence.
3.4. Numerical Modeling
The continuous phase was modeled as an ideal-gas mixture consisting of dry air and water vapor, and the governing equations for mass, momentum, energy, and species transport were solved to describe the carrier-gas flow field [
26,
36,
37]. Turbulent transport was represented using the realizable
k–ε turbulence model, which has been shown to provide improved performance for internal flows involving curvature, pressure gradients, and recirculation relative to the standard
k–ε model [
30,
31]. Appropriate interphase source terms were included to account for the exchange of momentum, heat, and mass between the continuous phase and the discrete droplets [
29].
To simulate condensation-driven droplet growth, the Discrete Phase Model (DPM) was coupled with a custom User-Defined Function (UDF) growth law. In this framework, the gas phase was solved in a Eulerian manner, whereas the droplets were tracked individually along Lagrangian trajectories. The custom UDF was used to evaluate droplet growth from the local gas-phase thermodynamic and transport conditions, thereby allowing the condensational response of each droplet to be determined from the surrounding vapor, temperature, and flow fields. This approach therefore predicts the time-dependent growth of droplets under supersaturated conditions in a physically consistent Eulerian–Lagrangian framework [
28,
29].
3.4.1. Continuity Equation
The continuity equation is fundamental to modeling condensation, as it ensures the conservation of mass for the continuous air phase and the discrete water droplet phase [
36]. Its mathematical formulation for this system is given in Equation (3).
- -
Continuity Equation for the Continuous Phase (Air)
where
is the mixture density,
is the velocity vector, and
is the mass source term representing the transfer of mass to/from the discrete phase due to condensation.
- -
Discrete Phase (Water Droplets)
For an individual droplet in the Lagrangian frame, the rate of mass change is given by:
where
is the mass of a single droplet, and
is the rate of mass gain or loss due to condensation. This source term is directly coupled to the
term in the continuous phase equation.
3.4.2. Momentum Equations
The momentum equations govern the motion of the continuous fluid phase (air-vapor mixture), accounting for the influence of pressure gradients, viscous stresses, body forces, and interphase momentum exchange with the discrete droplet phase due to condensation [
26,
36,
37]. These equations, known as the Navier–Stokes equations for a Newtonian fluid, express the conservation of momentum in vector form, as shown below.
3.4.3. Energy Equation
The energy equation is essential for accurately capturing the thermal dynamics of the condensation process. During droplet growth, the latent heat of condensation is released locally into the surrounding air, influencing the temperature field and subsequent heat transfer [
37]. This energy exchange is incorporated into the conservation equation via a volumetric source term,
, representing the latent heat transfer rate per unit volume. The general form of the energy conservation equation is given below:
3.4.4. Species Transport Equation
The species transport equation is fundamental for modeling the condensation process, as it governs the spatial and temporal distribution of water vapor within the air. This equation accounts for the convective and diffusive transport of the vapor species and incorporates a source term to model the mass transfer due to phase change between the vapor and liquid droplet phases [
37]. The conservation equation for the mass fraction of water vapor is given by:
3.5. Discrete Phase Model (DPM)
The Discrete Phase Model (DPM) is employed to simulate the two-way interphase exchange of mass, momentum, and energy between the dispersed droplet phase and the continuous air-vapor phase [
29]. This coupling is achieved by calculating source terms from the discrete phase and incorporating them into the governing Eulerian equations for the continuous phase.
In this study, the DPM utilizes a Lagrangian formulation to track the motion and state (temperature, diameter, mass) of individual water droplets, while the continuous airflow is solved using a standard Eulerian framework. This Eulerian–Lagrangian approach is particularly appropriate for modeling the condensation of submicron droplets in turbulent flow, as it accurately resolves the history and local microphysics of the growing droplets [
28]. The specific governing equations and the coupling methodology are detailed in the following sections.
3.5.1. Droplet Motion
The motion of individual droplets is governed by Newton’s second law, applied within the Lagrangian framework. This approach calculates the forces acting on each droplet to determine its trajectory through the continuous air-vapor flow [
29]. The governing equation for a droplet of mass
is:
The right-hand side sums the dominant forces: drag (), gravity/buoyancy (), thermophoresis (), and Saffman lift (). This formulation resolves the droplet’s trajectory and its coupling with the continuous air phase.
3.5.2. Heat Transfer
The droplet temperature is governed by an energy balance that accounts for convective heat exchange with the surrounding air and the latent heat released during condensation [
38]. This balance for a single droplet is expressed as:
The convective heat transfer coefficient
h is obtained from the empirical Ranz–Marshall correlation, which relates the Nusselt number (
Nu) to the droplet Reynolds number (
Rep) and the Prandtl number (
Pr) of the surrounding air:
3.5.3. Mass Transfer
Accurate simulation of droplet condensation requires modeling the mass transfer between the droplet surface and the surrounding air. In the DPM, the temporal change in droplet mass due to condensation is governed by a quasi-steady diffusion equation, which accounts for vapor diffusion in air and is expressed in terms of the Spalding mass transfer number [
32,
33,
34].
The rate of droplet mass change is given by:
The Spalding mass transfer number (
) is a dimensionless parameter that characterizes the ratio of the mass transfer driving force to the diffusion resistance in phase-change processes. It is defined in terms of the vapor mass fractions at the droplet surface and in the far-field environment as follows:
3.6. Custom User-Defined Function (UDF) Growth Law
The condensational growth of water droplets was simulated in ANSYS Fluent using the Discrete Phase Model (DPM) coupled with a custom User-Defined Function (UDF) growth law. In Fluent, DPM allows the user to define the initial position, velocity, size, and temperature of individual particles and then computes their trajectories together with heat and mass transfer interactions with the surrounding continuous phase. Customization of droplet behavior can be implemented through DPM UDF macros such as DEFINE_DPM_LAW, DEFINE_DPM_TIMESTEP, and DEFINE_DPM_OUTPUT, making this approach suitable for problems in which the built-in particle laws are not sufficiently specific for supersaturated condensational growth [
27].
The continuous phase was modeled with energy transport and species transport so that the local gas temperature and water-vapor concentration could be resolved throughout the computational domain [
25,
26]. The custom UDF growth law was then used to read the local water-vapor mass fraction from the continuous-phase cell surrounding each droplet at every particle-tracking step. Together with the local gas temperature, pressure, density, viscosity, and relative velocity, these variables were used to evaluate the instantaneous mass transfer and heat transfer coefficients governing droplet growth. This formulation allowed the droplet growth rate to respond directly to the local supersaturation field rather than to a prescribed uniform ambient condition [
25,
27].
The condensational growth model was formulated within a quasi-steady, diffusion-controlled framework. Under this assumption, the vapor-concentration and temperature fields around the droplet are considered to adjust much faster than the droplet radius changes, so the surrounding transport problem can be treated as locally steady during each time increment. This approximation is widely used in droplet-growth theory because condensational growth is governed primarily by vapor diffusion toward the droplet surface and by latent heat removal from the interface to the surrounding gas [
34].
To improve the physical realism of the model for droplets in the 0.1–1 µm size range, the UDF included the Kelvin effect, which accounts for the increase in equilibrium vapor pressure over a curved liquid surface. This correction is especially important for very small droplets because the high curvature of small droplets raises the surface vapor pressure and therefore reduces the thermodynamic driving force for condensation relative to a flat interface [
17,
18,
24]. The surface saturation condition used in the UDF was therefore corrected with the Kelvin relation before the condensation flux was calculated [
18,
32,
33,
34].
An energy balance was also incorporated into the custom growth law. At each tracking step, the droplet temperature was updated from the balance between convective heat exchange with the surrounding gas and the latent heat released by condensation at the droplet surface. This treatment is necessary because droplet temperature directly influences the surface saturation vapor pressure and, consequently, the condensation rate. The droplet mass and temperature were therefore updated simultaneously, and the new droplet diameter was obtained from the updated droplet mass by assuming spherical geometry and constant liquid-water density [
32]. Numerically, an auxiliary DPM time-step function was used to impose sufficiently small particle time steps during the early stages of growth, when small droplets can respond rapidly to local supersaturation. In addition, a DPM output function was used to record particle time, droplet diameter, droplet temperature, and particle position during tracking [
27]. The condensation time was then defined as the particle time required for a water droplet with an initial diameter in the range of 0.1–1 µm to grow to 5 µm under the prescribed flow and humidity conditions. This DPM–UDF framework therefore provides a practical and physically grounded method for predicting time-dependent condensational enlargement of ultrafine droplets in flowing humid air [
18,
25,
26,
27,
28,
32,
33,
34].
3.7. Realizable k-ε Turbulence Model
The realizable
k-ε model was employed as the primary turbulence closure for this study owing to its improved physical realism and enhanced predictive capability for complex turbulent flow phenomena. The term “realizable” refers to the fact that the model satisfies certain mathematical constraints on the Reynolds stresses, such as the positivity of the normal stresses and the boundedness of the turbulent shear stresses [
30]. Compared with the standard
k-ε model, the realizable
k-ε formulation introduces an alternative expression for the turbulent viscosity and a modified transport equation for the dissipation rate, ε, derived from the transport of the mean-square vorticity fluctuation [
31]. These improvements have been shown to provide better predictions for flows involving strong streamline curvature, vortices, rotation, separation, and boundary layers subjected to adverse pressure gradients. The Reynolds number of the carrier-gas flow was estimated to justify the turbulence treatment. Using the tube diameter of 0.30 m, inlet velocity of 1.00 m/s, moist-air density of 1.14 kg/m
3, and dynamic viscosity of 1.9 × 10
−5 Pa/s, the Reynolds number at the recovered atmospheric-pressure condition was approximately 1.8 × 10
4. This value is above the commonly accepted turbulent pipe-flow threshold of Re > 4000, indicating that the flow should be treated as turbulent rather than laminar or transitional. Even when the gas density is scaled with the lower initial pressure cases of 0.5–0.9 bar, the estimated Reynolds number remains in the range of approximately 9.0 × 10
3 to 1.62 × 10
4, which is still within the turbulent regime. Based on this Reynolds number estimate, the realizable
k-ε model was considered appropriate for representing turbulent transport in the present tubular flow.
In the present study, the realizable
k-ε model was considered appropriate because the carrier-gas flow in the cylindrical domain is characterized by internal turbulent flow, local acceleration and deceleration, pressure recovery, and possible recirculation, all of which strongly influence vapor transport, local supersaturation, and the interphase heat and mass transfer conditions governing condensation on small particles. Since droplet and particle growth in the DPM–UDF framework depends directly on the local gas-phase velocity, turbulence level, temperature, and water-vapor distribution, the use of the realizable
k-ε model provides a robust and physically consistent basis for predicting the gas-phase flow field required for condensation-growth calculations [
30].
The governing transport equations for k and ε are:
Turbulent Kinetic Energy (
k) Equation:
Turbulent Dissipation Rate (
ε) Equation:
A defining feature of the realizable
k-ε turbulence model is its formulation of the turbulent viscosity, which relates the Reynolds stresses to the mean strain rate through a variable model coefficient. The eddy viscosity is expressed as
In contrast to the standard
k-ε model, the coefficient
Cμ is not assumed to be constant. Instead, it is dynamically evaluated as a function of the local mean flow deformation and turbulence properties in order to satisfy realizability constraints. The formulation proposed by Shih et al. [
30] is given by
where the velocity scale
* is defined in terms of the invariants of the mean strain-rate and rotation tensors as
Here,
Sij denotes the mean strain-rate tensor and
represents the mean rate-of-rotation tensor evaluated in a reference frame rotating with angular velocity
ωk,
where
is the rotation tensor in a stationary frame and
is the Levi-Civita symbol.
The model constants appearing are defined as
where the angle
is determined from the invariants of the strain-rate tensor:
In addition, the coefficient
C1 appearing in the ε-equation is also formulated as a variable to maintain realizability. It is defined as
where
η is a dimensionless parameter representing the ratio of turbulent to mean strain time scales:
Here, S is the magnitude of the mean strain-rate tensor Sij. This formulation allows C1 to adapt to local flow conditions, enhancing the model’s accuracy for flows with strong shear and streamline curvature.
The remaining model constants are assigned the following standard values established in the original formulation [
30]:
3.8. Near-Wall Turbulence
Near-wall resolution is important in the present DPM–UDF framework because local velocity, temperature, and water-vapor concentration gradients influence the heat and mass transfer conditions experienced by droplets along their Lagrangian trajectories. Therefore, prism-layer inflation was applied adjacent to the tube wall to improve the resolution of near-wall momentum and scalar transport.
The dimensionless wall distance,
, was used as an indicator of near-wall mesh resolution and is defined as following equation:
The appropriate range depends on the wall-treatment option used with the realizable - turbulence model. For wall-function approaches, the first near-wall cell is generally placed in the logarithmic region, typically . In contrast, enhanced wall treatment requires finer near-wall resolution, commonly , to resolve the viscous sublayer. Thus, should be interpreted according to the selected wall-treatment strategy.
In this study, near-wall prism layers were used to improve the prediction of boundary-layer gradients while maintaining reasonable computational cost. Since the primary objective was to predict condensation-driven droplet growth rather than detailed wall-bounded turbulence, future work should include detailed distributions and wall-treatment sensitivity analysis to quantify their effects on local vapor transport, heat transfer, supersaturation, and droplet-growth predictions.
4. Results and Discussion
The simulations evaluated droplet growth from initial diameters of 0.1–1.0 µm to a target diameter of 5 µm under the pressure-recovery cases defined in
Section 3.2. The condensation time, initial and average mass transfer rates, and initial and average heat transfer rates were extracted from the DPM particle history and UDF output files.
4.1. Representative Water-Vapor Mass-Fraction Distribution
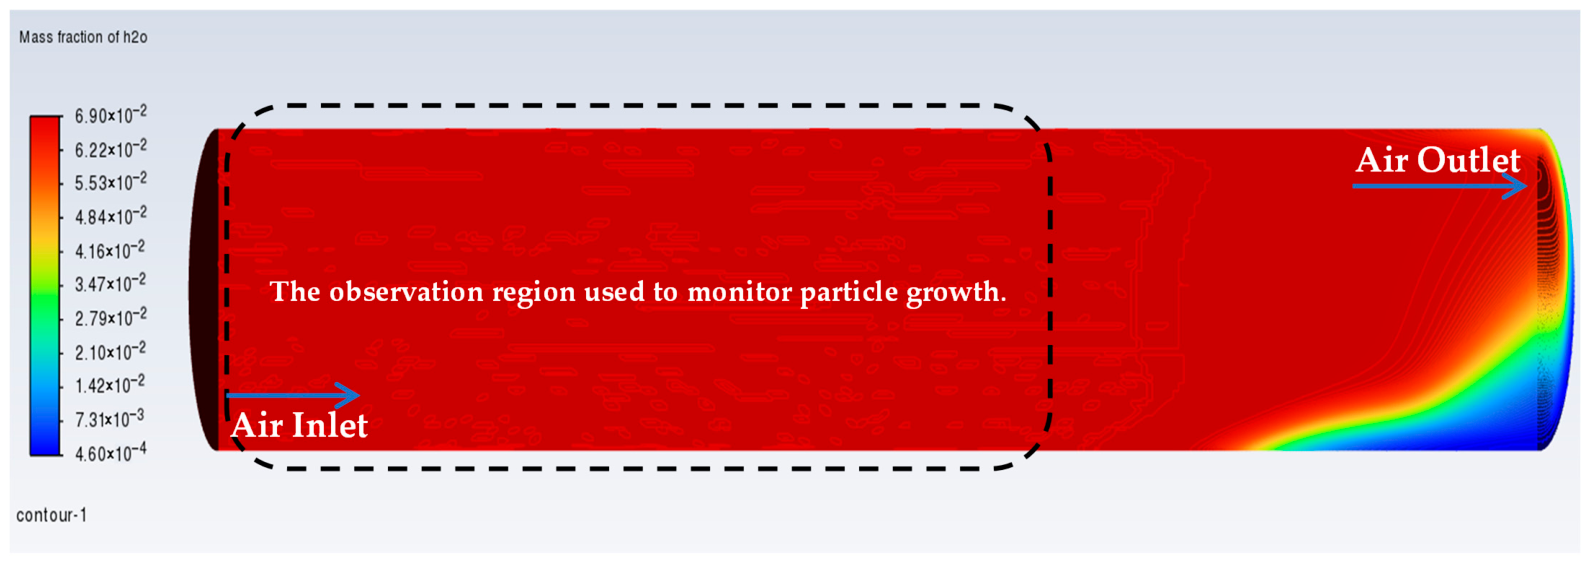
To better illustrate the local gas-phase conditions under which condensation occurs, a representative water-vapor mass-fraction contour was extracted from the CFD solution, as shown in
Figure 4. The 0.5 bar to 1 atm pressure-recovery case was selected because it corresponds to the highest nominal supersaturated RH condition and produced the shortest condensation time and the highest heat and mass transfer rates among the investigated cases.
Figure 4 shows the spatial distribution of water-vapor mass fraction within the cylindrical tube. The contour indicates that the vapor mass fraction remains high and nearly uniform throughout the observation region used to monitor particle growth, with values close to the upper limit of the plotted range, approximately 6.90 × 10
−2. A noticeable decrease in water-vapor mass fraction appears only farther downstream, outside the observation region, where the contour transitions toward lower values near the tube outlet.
Prior to particle tracking, the continuous gas-phase field was solved until a quasi-steady condition was obtained, so that the intended vapor-rich environment had been established within the observation region before droplet growth was monitored. In the DPM–UDF framework, condensation growth was not calculated from a fixed vapor value assigned directly to the droplets. Instead, during particle tracking, the UDF read the local water-vapor mass fraction from the surrounding continuous-phase cell, together with the local gas temperature, pressure, density, viscosity, and relative velocity, to calculate the instantaneous condensation mass transfer rate, heat transfer rate, droplet temperature, mass, and updated diameter.
The high local vapor availability within the monitored region provides a large vapor-concentration driving force between the surrounding gas and the Kelvin-corrected droplet surface, thereby promoting condensation mass transfer and reducing the time required for droplets to reach the target diameter of 5 µm. Thus,
Figure 4 supports the interpretation that the rapid droplet growth observed in the 0.5–0.9 bar to 1 atm case results from the combined effects of high nominal supersaturation and a locally vapor-rich gas phase resolved by the CFD species-transport mode.
4.2. Condensation-Driven Growth Time at Different Initial Diameters of Submicron Particles
The data in
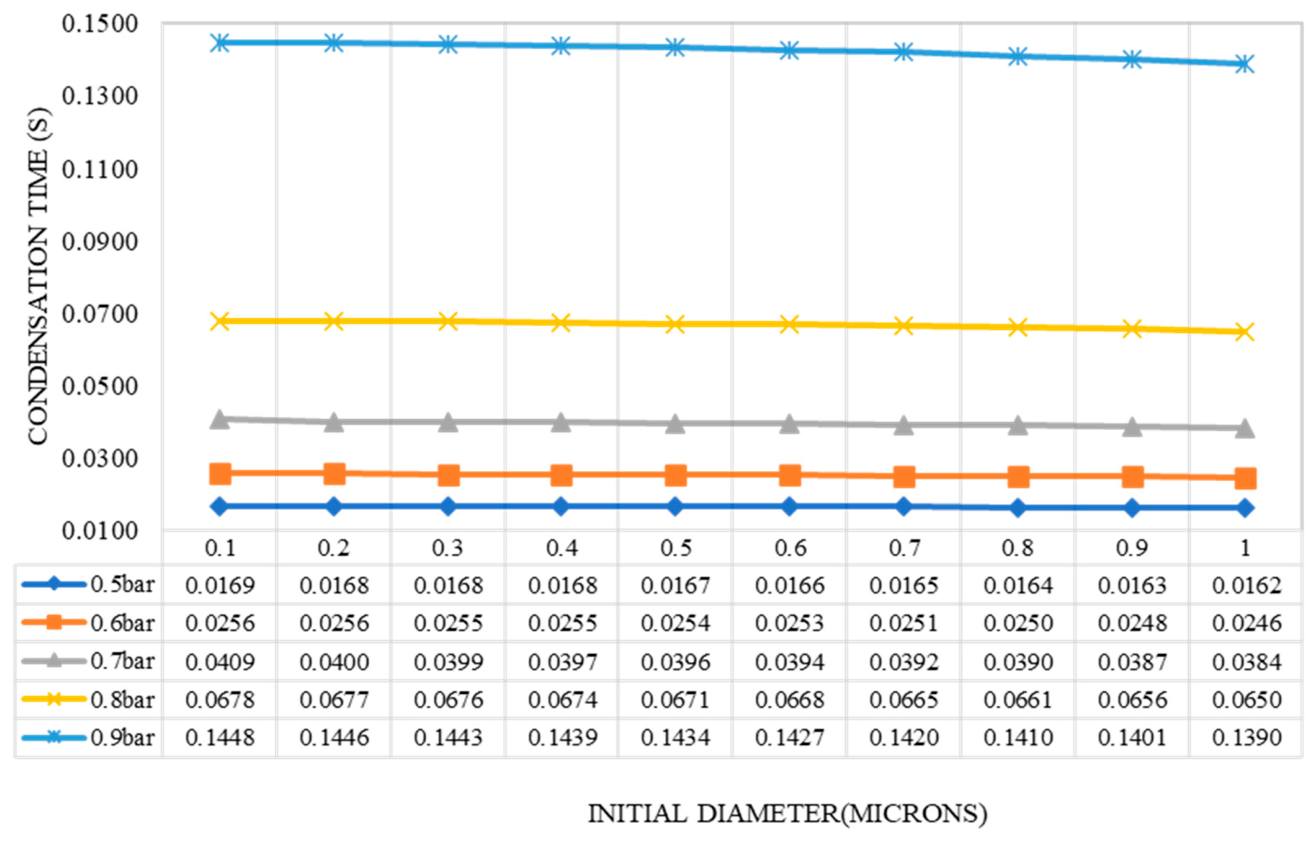
Figure 5 were obtained from the DPM particle-tracking output. Condensation time was defined as the particle residence time required for each droplet to grow from its initial diameter of 0.1–1.0 µm to the target diameter of 5 µm. The UDF monitored the instantaneous droplet diameter during tracking, and the time at which the droplet reached 5 µm was recorded as the condensation time.
Figure 5 shows the variation in condensation time with the initial droplet diameter in the range of 0.1–1.0 µm under different pressure-recovery conditions from 0.5–0.9 bar to 1 atm. In all cases, the condensation time decreased slightly as the initial droplet diameter increased. This trend is physically consistent with diffusion-controlled condensational growth, because larger initial droplets experience a weaker Kelvin effect, require a lower supersaturation threshold for continued growth, and have a shorter remaining growth path to the target diameter of 5 µm [
28]. As a result, droplets with larger initial diameters reached the target size in slightly less time than smaller droplets. For example, at an initial pressure of 0.5 bar, the condensation time decreased from approximately 0.0169 s for a 0.1 µm droplet to 0.0162 s for a 1.0 µm droplet, corresponding to a reduction of about 4.14%.
The condensation time showed a strong dependence on the magnitude of the pressure change. Cases with lower initial pressures, followed by recovery to 1 atm, produced substantially shorter condensation times than cases with smaller pressure differences. In particular, the condition of 0.5 bar to 1 atm yielded the shortest condensation times, whereas 0.9 bar to 1 atm produced the longest. For example, for an initial droplet diameter of 0.5 µm, the predicted condensation time decreased from approximately 0.1434 s at 0.9 bar to 0.0167 s at 0.5 bar, corresponding to a reduction of about 88.35%. This result demonstrates the strong sensitivity of condensation kinetics to the imposed pressure recovery.
This behavior can be explained by the thermodynamic effect of pressure recovery on the degree of supersaturation. A larger pressure difference generated a higher nominal supersaturation level after recovery, thereby increasing the vapor-concentration driving force for condensation at the droplet surface and accelerating droplet growth. In the present calculations, the nominal supersaturation ratio increased from approximately 1.12 for the 0.9 bar to 1 atm case to about 2.02 for the 0.5 bar to 1 atm case. Such an increase in supersaturation is consistent with classical diffusion-controlled condensational growth theory, in which stronger supersaturation enhances the rate of droplet growth and shortens the time required to reach the target size [
18,
34]. Nevertheless, the condensation time is also influenced by other coupled effects, including droplet curvature, latent heat removal, and the initial droplet size.
Having established the dependence of condensation time on both the initial pressure and the initial droplet diameter, the next section examines the corresponding mass transfer characteristics governing droplet growth under different supersaturation conditions.
4.3. Condensation Mass Transfer Rate at Different Initial Droplet Diameters
The data in
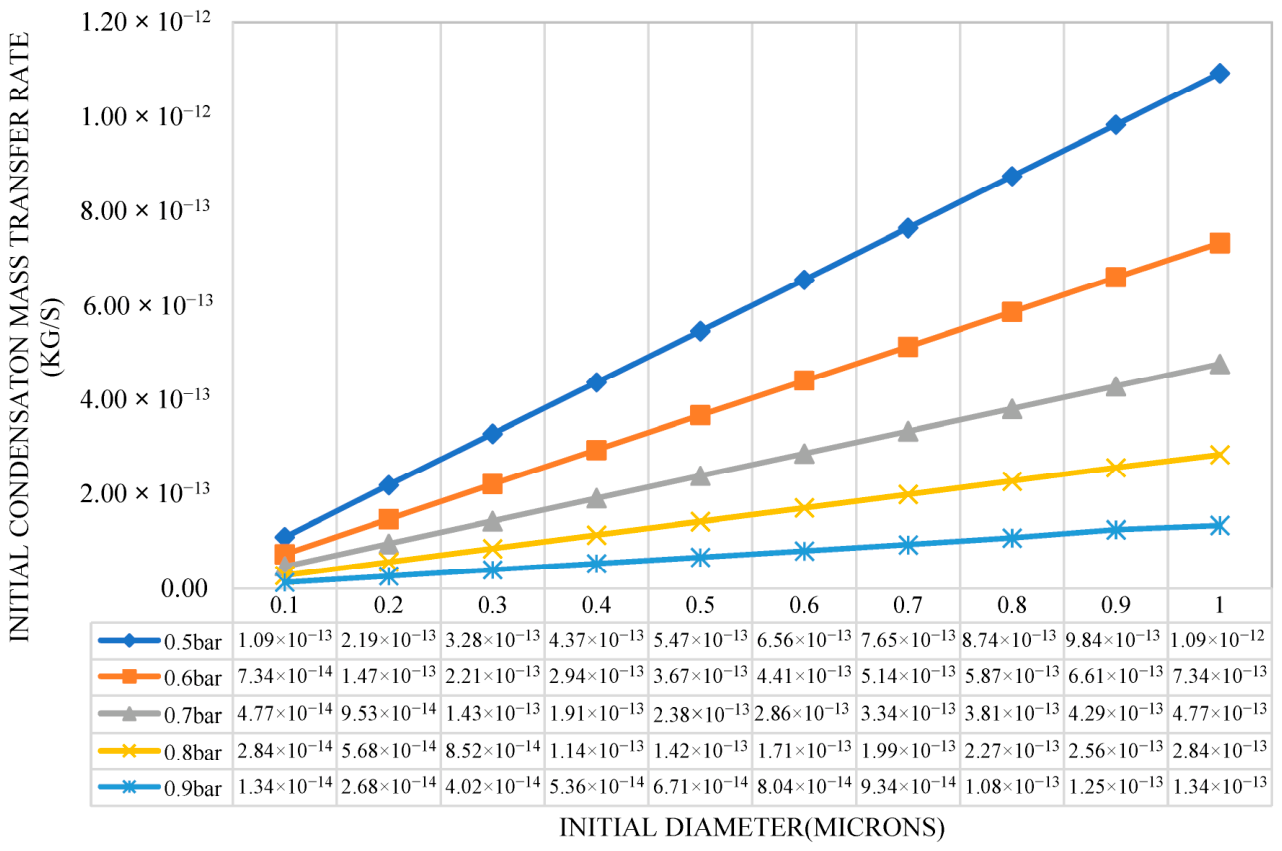
Figure 6 were extracted from the UDF-calculated condensation mass transfer rate at the initial stage of droplet growth. At the first particle-tracking step, the local vapor mass fraction, gas temperature, pressure, density, viscosity, and relative velocity surrounding each droplet were used to calculate the instantaneous condensation mass transfer rate.
Figure 6 shows the dependence of the condensation mass transfer rate on the initial droplet diameter in the range of 0.1–1.0 µm for different pressure-recovery conditions from 0.5–0.9 bar to 1 atm. As discussed in the previous section, the magnitude of the pressure change determines the nominal supersaturation level calculated after pressure recovery; therefore, it also strongly affects the rate of mass transfer during condensation. The trends shown in
Figure 6 are useful for explaining the variations in condensation time reported earlier, since a higher condensation mass transfer rate promotes faster droplet growth toward the target diameter.
Figure 6 shows that the condensation mass transfer rate increased monotonically with increasing initial droplet diameter over the range of 0.1–1.0 µm under all investigated pressure-recovery conditions. Within the present simulation framework, this trend is consistent with diffusion-controlled condensational growth, for which the instantaneous mass transfer rate increases with droplet radius when the surrounding thermodynamic conditions are favorable for condensation [
32]. As a result, larger droplets exhibited higher condensation mass transfer rates than smaller droplets under the same pressure condition.
To provide a more quantitative interpretation of this mass transfer behavior, the transport process was also considered using relevant dimensionless parameters. At the recovered atmospheric-pressure condition, the carrier-gas Reynolds number was approximately 1.8 × 10
4, confirming turbulent pipe-flow conditions. Based on the moist-air properties listed in
Table 2, the Schmidt and Prandtl numbers were estimated as
Sc = 0.64 and
Pr = 0.72, respectively. The corresponding mass and thermal Peclet numbers were therefore
Pem =
ReSc = 1.15 × 10
4, and
Peh =
RePr = 1.30 × 10
4, indicating that convective transport dominates over molecular diffusion at the tube scale.
At the droplet scale, heat and mass transfer were evaluated from the local gas-phase properties along each Lagrangian trajectory. The heat transfer calculation was based on the Nusselt number through the Ranz–Marshall correlation, whereas the condensation mass transfer rate was evaluated using a quasi-steady diffusion-controlled formulation expressed in terms of the Spalding mass transfer number. Therefore, the predicted condensation rate reflects the coupled effects of local supersaturation, vapor-concentration driving force, droplet size, droplet Reynolds number, heat removal, and Kelvin curvature correction.
Turbulence affects condensation mainly by modifying vapor mixing, heat transfer, and droplet–gas relative motion. In the present model, the realizable – turbulence closure influenced the local velocity, temperature, and water-vapor mass-fraction fields used by the DPM–UDF growth law. These local fields affect the droplet Reynolds number, Nusselt number, vapor-concentration driving force, and convective heat removal from the droplet surface. Therefore, turbulence can indirectly promote condensation by enhancing vapor transport toward droplets and heat removal from the interface. However, the present study did not isolate the independent effect of turbulence intensity; thus, the predicted growth trends should be interpreted as the combined effect of nominal supersaturation, turbulent scalar transport, droplet trajectory, Kelvin curvature correction, and droplet energy balance.
The magnitude of the condensation mass transfer rate also showed a strong dependence on the initial pressure. The lowest-pressure case produced the highest mass transfer rates, whereas the highest-pressure case yielded the lowest values throughout the entire droplet-size range. This behavior can be attributed primarily to the higher nominal supersaturation after pressure recovery, which increases the vapor-concentration driving force toward the droplet surface. Pressure-dependent variation in vapor diffusivity may also affect the transport rate; however, this effect was not isolated in the present study. In the present calculations, the supersaturation ratio increased from approximately 1.12 for the 0.9 bar to 1 atm case to approximately 2.02 for the 0.5 bar to 1 atm case, which explains the substantial increase in condensation intensity at lower initial pressures.
Accordingly, the results in
Figure 6 confirm that both initial droplet size and pressure-induced supersaturation play important roles in determining the condensation mass transfer rate. Under the present conditions, the pressure effect was particularly significant because it directly altered the thermodynamic driving force for condensation and thereby controlled the rate of droplet growth.
The data in
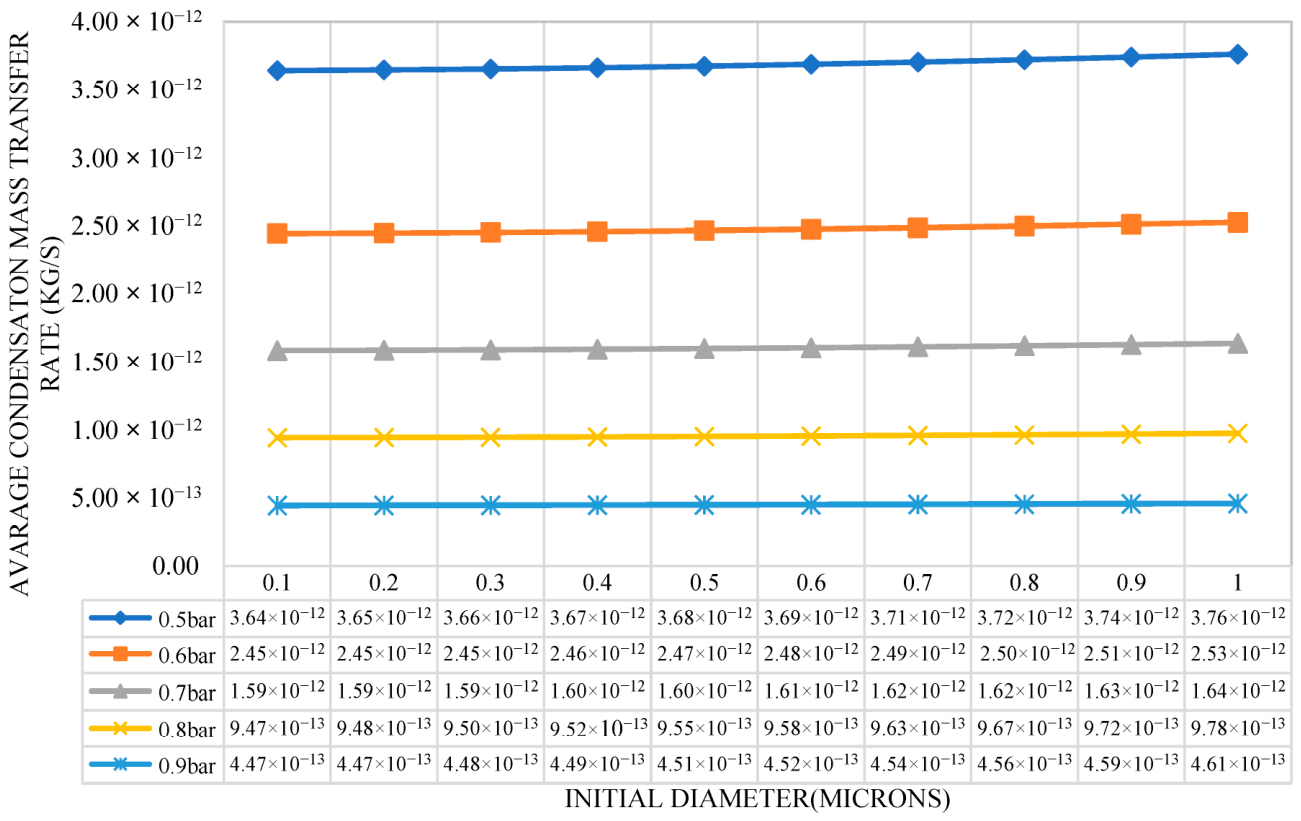
Figure 7 represent the average condensation mass transfer rate over the entire growth period from the initial droplet diameter to 5 µm. The average value was calculated from the time history of the UDF-predicted mass transfer rate along each droplet trajectory. Therefore,
Figure 7 reflects the integrated condensation behavior rather than only the initial local condition.
Figure 7 presents the average condensation mass transfer rate over the entire droplet-growth period. Similar to the initial condensation rate shown in
Figure 6, the average mass transfer rate increased slightly with increasing initial droplet diameter for all investigated pressure conditions, indicating that droplet size exerted only a secondary influence within the 0.1–1.0 µm range. In contrast, the effect of pressure was much more pronounced. The 0.5 bar to 1 atm case consistently produced the highest average condensation mass transfer rates, whereas the 0.9 bar to 1 atm case yielded the lowest values. For example, at an initial droplet diameter of 0.5 µm, the average condensation mass transfer rate increased from approximately 4.51 × 10
−13 kg/s at 0.9 bar to 3.68 × 10
−12 kg/s at 0.5 bar, corresponding to an increase of about 8.16 times. This trend is physically consistent with diffusion-controlled condensational growth, because lower initial pressure is associated with higher supersaturation after pressure recovery and higher water-vapor concentration in air, both of which enhance the vapor flux toward the droplet surface. The nearly parallel behavior of the curves further suggests that, under the present conditions, pressure-induced supersaturation primarily governs the magnitude of the condensation rate, whereas initial droplet size contributes only a modest increase.
4.4. Condensation Heat Transfer Rate at Different Initial Diameter of Submicron Particles
The data in
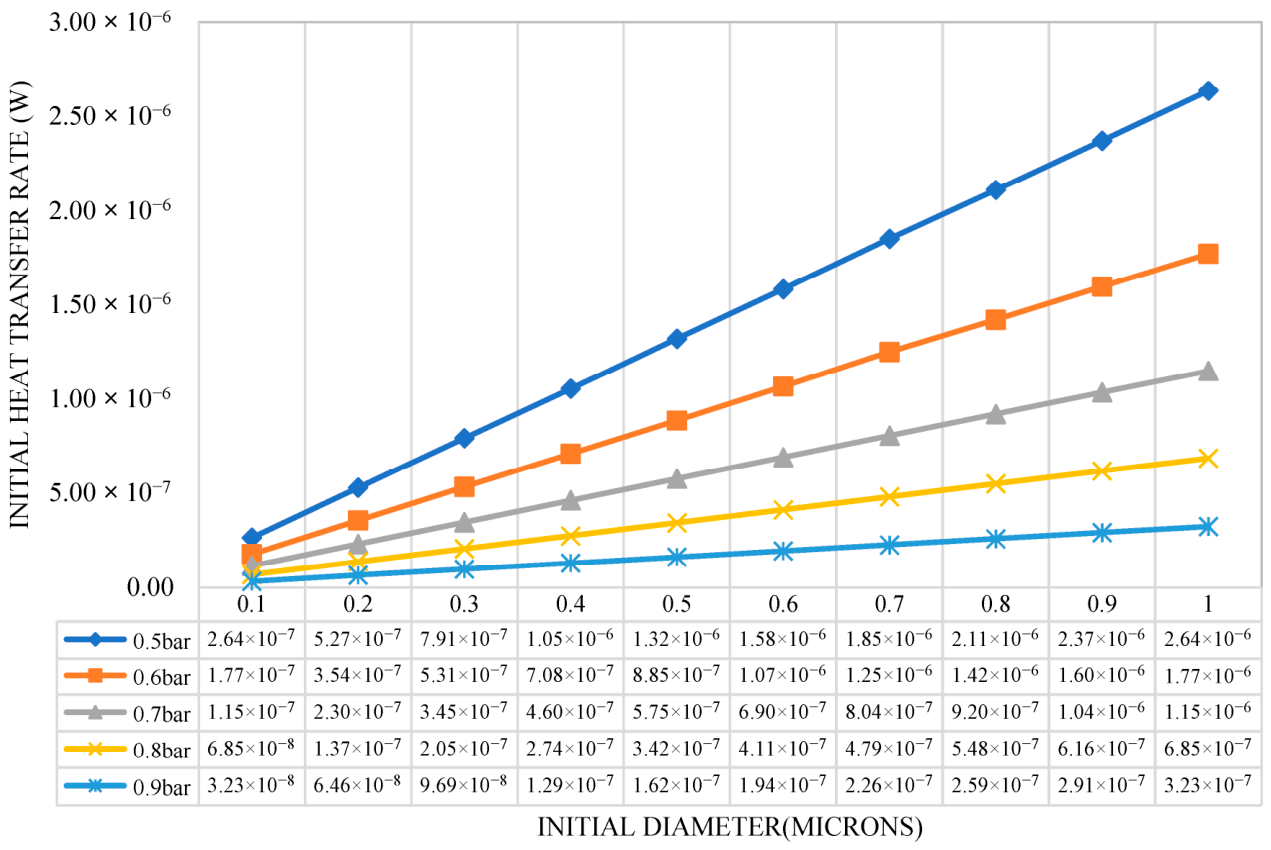
Figure 8 were obtained from the initial heat transfer rate calculated by the droplet energy balance in the UDF. The heat transfer rate includes convective heat exchange between the droplet and surrounding gas and latent heat released by condensation. Since latent heat release is directly related to the condensation mass transfer rate, the trend in
Figure 8 follows the corresponding initial mass transfer behavior.
Figure 8 shows that the energy transfer rate during condensation increased with increasing initial droplet diameter under all investigated pressure conditions. This trend is consistent with condensation heat transfer theory, because the latent heat released at the droplet surface is directly related to the condensation mass transfer rate through
[
37,
38,
39]. Accordingly, the observed variation in energy transfer rate followed the same general trend as the corresponding mass transfer rate. Lower initial pressures produced higher energy transfer rates, whereas higher initial pressures resulted in lower values, indicating that the thermal response of the droplets was strongly controlled by the thermodynamic conditions established after pressure recovery. This behavior can be attributed to the combined effects of higher supersaturation and higher water-vapor concentration at lower pressure, both of which enhance condensation and therefore increase latent heat release.
A comparison between the two figures further indicates that the initial energy transfer rate exhibited a clearer dependence on droplet diameter than the average energy transfer rate. This difference is physically reasonable because the initial rate reflects the local thermodynamic and transport conditions at the onset of growth, whereas the average value integrates the condensation process over the entire growth period and therefore smooths out part of the diameter-dependent variation. Overall, the results confirm that pressure-induced supersaturation is the dominant factor controlling condensation heat transfer, while droplet size contributes a secondary but systematic effect.
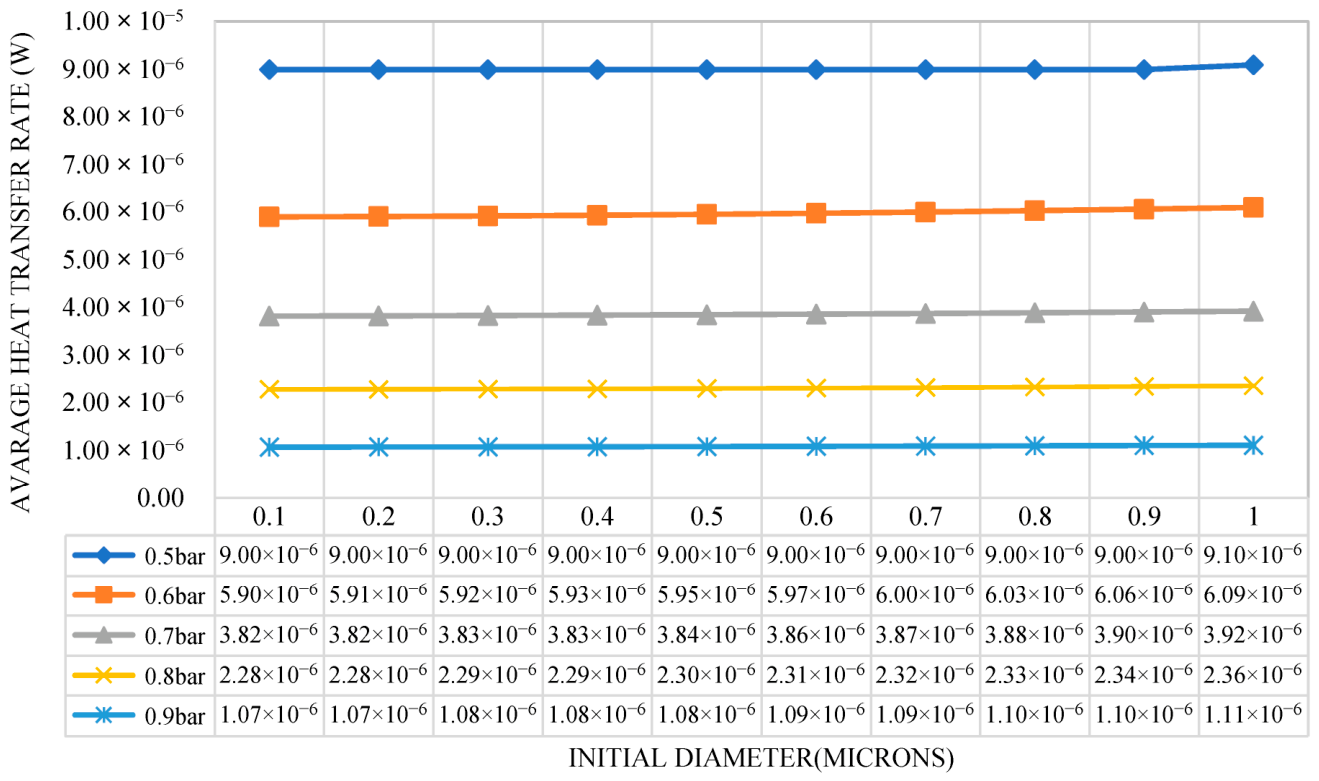
The data in
Figure 9 represent the average condensation heat transfer rate over the entire droplet-growth period. The average heat transfer rate was calculated from the time-resolved UDF output between the initial droplet diameter and the target diameter of 5 µm. This quantity describes the overall thermal response of the droplet during condensation under each pressure-recovery condition.
Figure 9 shows the variation in the average condensation energy transfer rate with the initial droplet diameter (0.1–1.0 µm) under different pressure-recovery conditions. The results indicate that the average energy transfer rate changed only slightly with droplet diameter, whereas its dependence on pressure was much more pronounced. In all cases, lower initial pressures produced higher average energy transfer rates, while higher initial pressures resulted in systematically lower values. This trend is physically consistent with condensation heat transfer, because the latent heat released during condensation is directly related to the condensation mass transfer rate, and lower-pressure conditions are associated with higher supersaturation and enhanced vapor concentration, both of which promote condensation.
Figure 8 and
Figure 9 indicate that ambient pressure represents the primary controlling parameter governing the average condensation heat transfer rate, whereas the influence of the initial droplet diameter remains secondary within the investigated size range. The results further demonstrate that condensation heat transfer behavior is determined by the combined effects of droplet geometry and surrounding thermodynamic conditions: droplet diameter mainly controls the geometric scaling of latent heat release through its influence on interfacial surface area, while ambient pressure predominantly regulates gas-phase transport resistance and, consequently, the overall magnitude of the heat transfer process.
4.5. Literature-Based Benchmark and Theoretical Consistency
To assess the physical reasonableness of the predicted condensation times, the present DPM–UDF results were compared with previous experimental, theoretical, and numerical studies on condensation-induced aerosol growth. Since direct experimental data under identical pressure-recovery conditions are not available, the comparison is intended as a theoretical and literature-based benchmark rather than direct experimental validation, as summarized in
Table 3.
As summarized in
Table 3, previous growth-tube studies and classical Maxwell–Fuchs-type droplet-growth models consistently indicate that supersaturation, residence time, vapor diffusion, Kelvin curvature, and heat removal strongly influence condensational particle growth. The present results follow the same physical trend. Increasing the calculated nominal supersaturated
RH from 112.58% to 202.65% reduced the condensation time for a 0.5 µm droplet from approximately 0.1434 s to 0.0167 s and increased the average condensation mass transfer rate from 4.51 × 10
−13 to 3.68 × 10
−12 kg/s. This agreement supports the physical consistency of the present DPM–UDF predictions, although full validation still requires controlled experimental data under matched pressure-recovery conditions.
4.6. Quantitative Comparison with Maxwell–Fuchs-Type Growth Theory
To provide a more explicit quantitative comparison with classical Maxwell–Fuchs-type diffusion-controlled growth theory, the present results were compared using a simplified supersaturation-scaling approach. For droplets growing from the same initial diameter to the same final diameter, classical diffusion-controlled condensation theory indicates that the growth time is approximately inversely proportional to the vapor concentration driving force. When other transport properties are assumed to remain comparable, this driving force may be approximated by the supersaturation term
S − 1, where
S is the supersaturation ratio. Therefore, the ratio of condensation times between two pressure-recovery cases can be estimated as:
In the present study, the nominal supersaturation ratio increased from approximately
S = 1.1258 for the 0.9 bar to 1 atm case to
S = 2.0265 for the 0.5 bar to 1 atm case. The simplified Maxwell–Fuchs-type scaling therefore predicts a condensation time ratio of:
The corresponding DPM–UDF result for a 0.5 µm initial droplet gives:
Thus, the predicted condensation-time ratio from the present model is of the same order of magnitude and differs by only approximately 5% from the simplified Maxwell–Fuchs-type supersaturation scaling. Similarly, the average condensation mass transfer rate increased from 4.51 × 10⁻¹³ kg/s at 0.9 bar to 3.68 × 10⁻¹² kg/s at 0.5 bar, corresponding to a ratio of approximately 8.16. This agreement supports the theoretical consistency of the present DPM–UDF predictions with classical diffusion-controlled droplet-growth behavior. However, this comparison should be interpreted as an order of magnitude benchmark rather than full validation, because the present DPM–UDF model additionally includes local gas-phase properties, droplet trajectory, Kelvin curvature correction, heat transfer, and droplet energy balance.
The comparison in
Table 4 shows that the present DPM–UDF results follow the expected Maxwell–Fuchs-type diffusion-controlled trend. The simplified theoretical scaling predicts that increasing the supersaturation driving term from 0.1258 to 1.0265 should increase the condensation growth rate, or equivalently reduce the condensation time, by approximately 8.16 times. The present simulation predicts a condensation-time reduction factor of approximately 8.59 and a mass transfer-rate increase factor of approximately 8.16. These values confirm that the pressure-recovery cases produce condensation behavior that is quantitatively consistent, at the order-of-magnitude level, with classical diffusion-controlled droplet-growth theory.
5. Conclusions
This study numerically investigated the condensation-induced growth of submicron particles with initial diameters of 0.1–1.0 µm in a cylindrical tube under pressure-recovery conditions from 0.5–0.9 bar to 1 atm. A CFD framework coupling the Discrete Phase Model (DPM) with a custom User-Defined Function (UDF) growth law was used to predict droplet growth, condensation time, and the associated mass and heat transfer characteristics.
The results show that heterogeneous condensation is the main mechanism responsible for particle enlargement. Condensation time decreased slightly as the initial droplet diameter increased, mainly due to the reduced Kelvin curvature effect, larger interfacial area, and shorter growth distance required to reach the target diameter of 5 µm. However, the effect of initial particle size was relatively small compared with the influence of pressure-induced supersaturation.
Pressure variation was found to be the dominant factor controlling condensation kinetics. Lower initial pressures followed by recovery to atmospheric pressure generated higher nominal supersaturation.
As a result, the 0.5 bar to 1 atm case produced the shortest condensation times and the highest mass and heat transfer rates, whereas the 0.9 bar to 1 atm case showed the slowest growth. For example, at an initial diameter of 0.5 µm, the condensation time decreased from approximately 0.1434 s at 0.9 bar to 0.0167 s at 0.5 bar, corresponding to an 88.35% reduction.
The condensation mass transfer rate increased with both droplet diameter and supersaturation level, while the heat transfer rate followed the same trend because latent heat release is directly linked to vapor condensation. Overall, pressure-induced supersaturation primarily governed the magnitude of condensation transport, whereas initial particle diameter contributed mainly through geometric scaling effects.
Although the DPM–UDF framework captured the coupled effects of pressure recovery, supersaturation, latent heat release, and droplet growth, the results should be interpreted as physics-based numerical predictions rather than experimentally validated data. The predicted reduction in condensation time and increase in heat and mass transfer rates provide useful preliminary guidance for condensation-assisted fine-particle removal. Future work should include controlled experiments measuring pressure, temperature, relative humidity, vapor concentration, and particle-size evolution to validate the predicted growth from 0.1–1.0 µm to 5 µm and improve model reliability for practical applications.
6. Limitations
The present study has several limitations. First, the initial submicron particles were represented as spherical water-equivalent nuclei with pure-water properties. This assumption was adopted to isolate the effect of pressure-induced supersaturation on condensational growth. However, real PM2.5 particles may contain soot, sulfates, organics, dust, soluble salts, or other impurities, which can affect hygroscopicity, wettability, contact angle, surface tension, critical supersaturation, and condensation rate. Therefore, the predicted condensation times and transfer rates should be interpreted as idealized baseline values.
Second, the model was not directly validated against experimental measurements. Although the DPM–UDF framework was developed from established governing equations for fluid flow, species transport, droplet motion, heat transfer, mass transfer, Kelvin-corrected condensation growth, and droplet energy balance, the predicted droplet-size evolution remains a physics-based numerical prediction rather than experimentally confirmed performance data. Future work should include controlled experiments under comparable pressure-recovery conditions to measure local pressure, temperature, relative humidity, vapor concentration, and particle-size evolution.
Third, the simulations were conducted under fixed inlet velocity, temperature, and simplified wall conditions. In practical systems, flow velocity, turbulence intensity, vapor concentration, wall temperature, heat loss, and particle concentration may vary significantly and influence condensation growth. In addition, although the DPM–UDF model resolves three-dimensional velocity, pressure, temperature, and water-vapor concentration fields, this paper primarily reports droplet-growth outputs, including condensation time, droplet-size evolution, and heat and mass transfer rates. Detailed contours of local temperature, humidity, velocity, and supersaturation were not extensively presented. Future work should therefore include sensitivity analyses, spatial field visualizations, and axial profiles to clarify the local gas-phase mechanisms controlling condensation growth.
Finally, particle–particle interactions such as coagulation, coalescence, breakup, and collision-induced growth were not included. These processes may become important in high-concentration aerosol systems or strongly turbulent flows. Future studies should incorporate real particle properties, impurity effects, experimental validation, and benchmark comparisons with classical Maxwell–Fuchs droplet-growth models to improve the predictive reliability and practical applicability of the proposed pressure-controlled condensation-growth framework.
Author Contributions
Conceptualization, P.C., W.T., M.S., P.S. and W.M.; methodology, P.C.; validation, W.T., A.H., M.S. and W.M.; software A.H.; formal analysis, P.C.; investigation, P.C.; resources, W.T., A.H., M.S. and W.M.; data curation, P.C.; writing—original draft preparation, P.C.; writing—review and editing, P.C. and W.T.; visualization, P.C.; supervision, W.T., A.H., M.S. and W.M.; project administration, P.C. All authors have read and agreed to the published version of the manuscript.
Funding
This research received no external funding.
Institutional Review Board Statement
Not applicable.
Informed Consent Statement
Not applicable.
Data Availability Statement
The data utilized in this study were derived from publicly accessible sources and from numerical simulation results generated by the authors, as described in this paper/
Supplementary Material. For additional information or data requests, readers are encouraged to contact the corresponding author.
Acknowledgments
The authors would like to express my deepest appreciation and sincere gratitude to my paper advisor, Watcharapong Tachajapong, for providing me with the opportunity to study in the field of Computational Fluid Dynamics and for his encouragement throughout my research. His expertise and advice have been invaluable. Additionally, I extend my warmest gratitude to my advisory committee members, Woradej Manosroi, Arpiruk Hokpunna, and Mana Saedan. This project would not have been possible without their guidance and support. Finally, the authors would like to thank Chiang Mai University for financial support and Computational Fluid Dynamics (CFD) Simulation Software used in this research.
Conflicts of Interest
The authors declare no conflicts of interest.
Abbreviations and Symbols
The following abbreviations and symbols are used in this manuscript:
| Abbreviation | Definition |
| CFD | Computational Fluid Dynamics |
| CCN | Cloud Condensation Nuclei |
| DPM | Discrete Phase Model |
| UDF | User-Defined Function |
| RH | Relative Humidity |
| PM | Particulate Matter |
| PM2.5 | Particulate Matter with an aerodynamic diameter less than 2.5 µm |
| PISO | Pressure Implicit with Splitting of Operators |
| RANS | Reynolds-Averaged Navier–Stokes |
| 3D | Three-dimensional |
| k-ε | Turbulence model based on turbulent kinetic energy and dissipation rate |
| Y+ | Dimensionless wall distance |
| Symbol | Definition | Unit |
| Surface area of a droplet | m2 |
| Projected area of a droplet or particle | m2 |
| Spalding mass transfer number | – |
| Vapor concentration | kg/m3 |
| Vapor concentration in the bulk gas phase | kg/m3 |
| Vapor concentration at the droplet surface | kg/m3 |
| Drag coefficient | – |
| Specific heat capacity | J/kg·K |
| Characteristic diameter or length scale | m |
| Initial droplet diameter | m |
| Droplet diameter at time | m |
| Diffusion coefficient of water vapor in air | m2/s |
| Molecular mass diffusivity | m2/s |
| Turbulent or eddy diffusivity | m2/s |
| Total energy per unit mass | J/kg |
| Equilibrium vapor pressure over a curved droplet surface | Pa |
| Saturation vapor pressure over a flat liquid surface | Pa |
| Drag force | N |
| Gravitational or buoyancy force | N |
| Lift force acting on a droplet | N |
| Thermophoretic force | N |
| Gravitational acceleration | m/s2 |
| Convective heat transfer coefficient | W/m2·K |
| Sensible enthalpy of species | J/kg |
| Diffusive mass flux | kg/m2·s |
| Diffusive flux of species | kg/m2·s |
| Turbulent kinetic energy | m2/s2 |
| Thermal conductivity of the gas phase | W/m·K |
| Thermal conductivity of liquid water | W/m·K |
| Effective thermal conductivity | W/m·K |
| Condensation growth constant | m2/s |
| Evaporation constant | m2/s |
| Latent heat of vaporization or condensation | J/kg |
| Mass of an individual droplet or particle | kg |
| Mass transfer rate | kg/s |
| Condensation mass transfer rate | kg/s |
| Evaporation mass transfer rate | kg/s |
| Molecular weight of water | kg/mol |
| Nusselt number | – |
| Total pressure | Pa |
| Initial pressure before pressure recovery | Pa |
| Atmospheric pressure | Pa |
| Water vapor partial pressure | Pa |
| Saturation vapor pressure of water | Pa |
| Prandtl number | – |
| Heat transfer rate | W |
| Convective heat transfer rate | W |
| Latent heat transfer rate released by condensation | W |
| Droplet radius | m |
| Initial droplet radius | m |
| Droplet radius at time | m |
| Universal gas constant | J/mol·K |
| Specific gas constant for water vapor | J/kg·K |
| Particle Reynolds number | – |
| Relative humidity | % |
| Equilibrium relative humidity over a curved droplet surface | % |
| Supersaturation ratio | – |
| Energy source term due to phase change | W/m3 |
| Mass source term due to phase change | kg/m3·s |
| Species source term | kg/m3·s |
| Mean strain-rate tensor | s−1 |
| Time | s |
| Condensation time required for droplet growth | s |
| Evaporation time | s |
| Temperature | K |
| Reference or initial temperature | K |
| Droplet surface temperature | K |
| Ambient gas temperature | K |
| Velocity component in the -direction | m/s |
| Continuous-phase velocity vector | m/s |
| Droplet or particle velocity vector | m/s |
| Friction velocity | m/s |
| Characteristic velocity | m/s |
| Mass fraction of species | – |
| Water vapor mass fraction | – |
| Vapor mass fraction at the droplet surface | – |
| Vapor mass fraction in the surrounding gas | – |
| Wall-normal distance | m |
| Dimensionless wall distance | – |
| Elevation or axial coordinate, depending on model definition | m |
| Turbulent thermal diffusivity | m2/s |
| ε | Turbulent kinetic energy dissipation rate | m2/s3 |
| η | Dimensionless strain parameter in the realizable k-ε) | – |
| μ | Dynamic viscosity | Pa·s |
| Dynamic viscosity of the gas phase | Pa·s |
| Dynamic viscosity of liquid water | Pa·s |
| Turbulent or eddy viscosity | Pa·s |
| Effective dynamic viscosity | Pa·s |
| ν | Kinematic viscosity | m2/s |
| Turbulent or eddy kinematic viscosity | m2/s |
| ρ | Density | kg/m3 |
| Gas-phase density | kg/m3 |
| Liquid-water density | kg/m3 |
| Water vapor density | kg/m3 |
| σ | Surface tension of water | N/m |
| Viscous stress tensor | Pa |
| ω | Angular velocity or rotation rate | rad/s |
| Mean rotation-rate tensor | s−1 |
References
- Hinds, W.C. Aerosol Technology: Properties, Behavior, and Measurement of Airborne Particles, 2nd ed.; Wiley: New York, NY, USA, 1999. [Google Scholar]
- Thiessen, R.J. Filtration of respired gases: Theoretical aspects. Respir. Care Clin. N. Am. 2006, 12, 183–201. [Google Scholar]
- IUPAC. Compendium of Chemical Terminology, 2nd ed.; Blackwell Scientific Publications: Oxford, UK, 1997. [Google Scholar]
- Ghalavand, Y.; Hatamipour, M.S.; Rahimi, A. A review on energy consumption of desalination processes. Desalin. Water Treat. 2015, 54, 1526–1541. [Google Scholar] [CrossRef] [Scilit]
- Goswami, A.; Pillai, S.C.; McGranaghan, G. Surface modifications to enhance dropwise condensation. Surf. Interfaces 2021, 25, 101143. [Google Scholar] [CrossRef] [Scilit]
- El Fil, B.; Kini, G.; Garimella, S. A review of dropwise condensation: Theory, modelling, experiments, and applications. Int. J. Heat Mass Transf. 2020, 160, 120172. [Google Scholar] [CrossRef] [Scilit]
- Wang, S.; Yu, X.; Liang, C.; Zhang, Y. Enhanced condensation heat transfer in air conditioner heat exchanger using superhydrophobic foils. Appl. Therm. Eng. 2018, 137, 758–766. [Google Scholar] [CrossRef] [Scilit]
- Haryanto, A.; Fernando, S.; Murali, N.; Adhikari, S. Current status of hydrogen production techniques by steam reforming of ethanol: A review. Energy Fuels 2005, 19, 2098–2106. [Google Scholar] [CrossRef] [Scilit]
- Beér, J.M. High efficiency electric power generation: The environmental role. Prog. Energy Combust. Sci. 2007, 33, 107–134. [Google Scholar] [CrossRef] [Scilit]
- Seinfeld, J.H.; Pandis, S.N. Atmospheric Chemistry and Physics: From Air Pollution to Climate Change, 3rd ed.; Wiley: Hoboken, NJ, USA, 2016. [Google Scholar]
- Fletcher, N.H. Size effect in heterogeneous nucleation. J. Chem. Phys. 1958, 29, 572–576. [Google Scholar] [CrossRef] [Scilit]
- Liu, Z.Y.; Chen, Z.; Li, Y.; Yang, L. The study of heterogeneous condensation of water vapor on submicron particles in cooled tube by population balance model. Chem. Eng. Trans. 2017, 61, 1321–1326. [Google Scholar] [CrossRef] [Scilit]
- Fan, F.; Zhang, S.; Wang, W.; Yan, J.; Su, M. Numerical investigation of PM2.5 size enlargement by heterogeneous condensation for particulate abatement. Process Saf. Environ. Prot. 2019, 125, 197–206. [Google Scholar] [CrossRef] [Scilit]
- McDonald, J.E. Homogeneous nucleation of vapor condensation. I. Thermodynamic aspects. Am. J. Phys. 1962, 30, 870–877. [Google Scholar] [CrossRef] [Scilit]
- McDonald, J.E. Homogeneous nucleation of vapor condensation. II. Kinetic aspects. Am. J. Phys. 1963, 31, 31–41. [Google Scholar] [CrossRef] [Scilit]
- Brin, A.A.; Fisenko, S.P. Growth and motion of heterogeneous water droplets in laminar flow diffusion chambers. Colloid J. 2007, 69, 679–684. [Google Scholar] [CrossRef] [Scilit]
- Fisher, L.R.; Israelachvili, J.N. The Kelvin equation and the capillary condensation of water. Nature 1981, 290, 575–576. [Google Scholar] [CrossRef] [Scilit]
- Stull, R. Practical Meteorology: An Algebra-Based Survey of Atmospheric Science; University of British Columbia: Vancouver, BC, Canada, 2017. [Google Scholar]
- Poling, B.E.; Prausnitz, J.M.; O’Connell, J.P. The Properties of Gases and Liquids, 5th ed.; McGraw-Hill: New York, NY, USA, 2001. [Google Scholar]
- ASHRAE. ASHRAE Handbook—Fundamentals; American Society of Heating, Refrigerating and Air-Conditioning Engineers: Atlanta, GA, USA, 2017. [Google Scholar]
- Perry, R.H.; Green, D.W. Perry’s Chemical Engineers’ Handbook, 9th ed.; McGraw-Hill: New York, NY, USA, 2018. [Google Scholar]
- Rumble, J.R. CRC Handbook of Chemistry and Physics, 102nd ed.; CRC Press: Boca Raton, FL, USA, 2021. [Google Scholar]
- IAPWS. Release on the IAPWS Formulation 1995 for the Thermodynamic Properties of Ordinary Water Substance; International Association for the Properties of Water and Steam (IAPWS): Boulder, CO, USA, 2008. [Google Scholar]
- Good, N.; Topping, D.O.; McFiggans, G.; Williams, P.I.; Flynn, M.; Coe, H. Consistency between parameterisations of aerosol hygroscopicity and CCN activity. Atmos. Chem. Phys. 2010, 10, 3189–3203. [Google Scholar] [CrossRef] [Scilit]
- ANSYS Inc. Ansys Fluent User’s Guide; Release 2025 R2; ANSYS Inc.: Canonsburg, PA, USA, 2025. [Google Scholar]
- ANSYS Inc. Ansys Fluent Theory Guide; Release 2025 R2; ANSYS Inc.: Canonsburg, PA, USA, 2025. [Google Scholar]
- ANSYS Inc. Ansys Fluent Customization Manual; Release 2025 R1; ANSYS Inc.: Canonsburg, PA, USA, 2025. [Google Scholar]
- Sirignano, W.A. Fluid Dynamics and Transport of Droplets and Sprays, 2nd ed.; Cambridge University Press: Cambridge, UK, 2010. [Google Scholar]
- Crowe, C.T.; Sommerfeld, M.; Tsuji, Y. Multiphase Flows with Droplets and Particles; CRC Press: Boca Raton, FL, USA, 1998. [Google Scholar]
- Shih, T.H.; Liou, W.W.; Shabbir, A.; Yang, Z.; Zhu, J. A new k–ε eddy-viscosity model for high Reynolds number turbulent flows—Model development and validation. Comput. Fluids 1995, 24, 227–238. [Google Scholar] [CrossRef] [Scilit]
- Abd Halim, M.A.; Nik Mohd, N.A.R.; Mohd Nasir, M.N.; Dahalan, M.N. The evaluation of k–ε and k–ω turbulence models in modelling flows and performance of S-shaped diffuser. Int. J. Automot. Mech. Eng. 2018, 15, 5161–5177. [Google Scholar] [CrossRef] [Scilit]
- Mordy, W.A. Computations of the growth by condensation of cloud droplets. Tellus 1959, 11, 16–44. [Google Scholar] [CrossRef] [Scilit]
- Li, X.Y.; Svensson, G.; Brandenburg, A.; Haugen, N.E.L. Cloud-droplet growth due to supersaturation fluctuations in stratiform clouds. Atmos. Chem. Phys. 2019, 19, 639–648. [Google Scholar] [CrossRef] [Scilit]
- Grabowski, W.W.; Wang, L.P. Diffusional and accretional growth of water drops in a rising adiabatic parcel: Effects of the turbulent collision kernel. Atmos. Chem. Phys. 2009, 9, 2335–2353. [Google Scholar] [CrossRef] [Scilit]
- Issa, R.I. Solution of the implicitly discretised fluid flow equations by operator-splitting. J. Comput. Phys. 1986, 62, 40–65. [Google Scholar] [CrossRef] [Scilit]
- Versteeg, H.K.; Malalasekera, W. An Introduction to Computational Fluid Dynamics: The Finite Volume Method, 2nd ed.; Pearson Education: Harlow, UK, 2007. [Google Scholar]
- Incropera, F.P.; DeWitt, D.P. Fundamentals of Heat and Mass Transfer, 6th ed.; Wiley: Hoboken, NJ, USA, 2007. [Google Scholar]
- Sazhin, S.S. Advanced models of fuel droplet heating and evaporation. Prog. Energy Combust. Sci. 2006, 32, 162–214. [Google Scholar] [CrossRef] [Scilit]
- Abramzon, B.; Sirignano, W.A. Droplet vaporization model for spray combustion calculations. Int. J. Heat Mass Transf. 1989, 32, 1605–1618. [Google Scholar] [CrossRef] [Scilit]
- Tammaro, M.; Di Natale, F.; Salluzzo, A.; Lancia, A. Heterogeneous condensation of submicron particles in a growth tube. Chem. Eng. Sci. 2012, 74, 124–134. [Google Scholar] [CrossRef] [Scilit]
- Hering, S.V.; Stolzenburg, M.R. A method for particle size amplification by water condensation in a laminar, thermally diffusive flow. Aerosol Sci. Technol. 2005, 39, 428–436. [Google Scholar] [CrossRef] [Scilit]
- Yu, Y.; Lu, Y.; Sang, C.; Xu, C.; Fu, C. Growth characteristics of submicron particles by water vapor condensation in the multi-section growth tube. Powder Technol. 2024, 440, 119797. [Google Scholar] [CrossRef] [Scilit]
- Vesala, T.; Kulmala, M.; Rudolf, R.; Vrtala, A.; Wagner, P.E. Models for condensational growth and evaporation of binary aerosol particles. J. Aerosol Sci. 1997, 28, 565–598. [Google Scholar] [CrossRef] [Scilit]
- Qu, X.; Davis, E.J. Droplet evaporation and condensation in the near-continuum regime. J. Aerosol Sci. 2001, 32, 861–875. [Google Scholar] [CrossRef] [Scilit]
- Mozurkewich, M. Aerosol growth and the condensation coefficient for water. Aerosol Sci. Technol. 1986, 5, 223–236. [Google Scholar] [CrossRef] [Scilit]
- Liu, C.; Zhao, Y.; Tian, Z.; Zhou, H. Numerical simulation of condensation of natural fog aerosol under acoustic wave action. Aerosol Air Qual. Res. 2021, 21, 200361. [Google Scholar] [CrossRef] [Scilit]
| Disclaimer/Publisher’s Note: The statements, opinions and data contained in all publications are solely those of the individual author(s) and contributor(s) and not of MDPI and/or the editor(s). MDPI and/or the editor(s) disclaim responsibility for any injury to people or property resulting from any ideas, methods, instructions or products referred to in the content. |



 and
and