1. Introduction
External flow around bluff bodies at high Reynolds numbers remains a central problem in applied fluid mechanics due to its relevance to different engineering structures and to the strong sensitivity of boundary-layer separation, vortex shedding, and wake formation to flow and surface conditions. Among these geometries, the circular cylinder constitutes the classical configuration for the study of aerodynamic interference, instabilities, and fluid–structure interaction [
1,
2]. When two cylinders interact, especially in a tandem arrangement, the problem becomes more complex than that of an single body, since the downstream cylinder responds not only to its local flow field but also to the incident wake generated by the upstream cylinder. In this configuration, the spacing between the bodies and the Reynolds number govern the transition among the extended-body, reattachment, and co-shedding regimes as well as the intensity of wake interference [
2,
3].
Within this context, wake-induced vibrations (
s) constitute a class of instabilities of particular importance for the downstream cylinder. For two parallel circular cylinders, these wake-induced responses may be classified as wake-induced vortex vibration, wake galloping, and wake-induced flutter [
4]. In the same work, the authors showed that wake galloping is predominantly associated with the transverse oscillation of the downstream cylinder, whereas wake-induced flutter involves simultaneous components in the longitudinal and transverse directions with an elliptical trajectory. Consistently, Dao et al. [
3] showed that the type of
strongly depends on the wake-interference pattern and on the Reynolds-number regime with wake galloping occurring at closer spacings and coupled flutter arising over distinct reduced-velocity ranges and aerodynamic-interference conditions.
Recent studies have further refined the physical interpretation of wake-induced vibration in tandem-cylinder systems. Lin et al. [
5] mapped the properties of
on a circular cylinder and showed that the downstream response may evolve into distinct dynamical states depending on the organization of the incoming wake. In a related experimental investigation, Dulac et al. [
6] demonstrated that the oscillatory characteristics of the upstream cylinder may significantly alter the downstream
response, reinforcing the importance of prescribed wake kinematics. Assi [
7] identified the retro lock-in mechanism in closely spaced tandem cylinders, showing that the motion of the downstream body may feed back into the upstream shedding process. Alam et al. [
8] further organized the responses
into different branches associated with desynchronization and galloping-type behavior, while Li et al. [
9] proposed an activation–modulation framework for the response of the downstream cylinder in tandem configurations. Taken together, these studies show that
should not be viewed as a single uniform mechanism but rather as a family of wake-governed responses that depend strongly on the spacing, wake structure, synchronization state, and body–wake feedback.
In addition to wake interference itself, surface roughness constitutes a first-order parameter because it alters the boundary-layer transition, the mean drag, the Strouhal number, and the wake structure [
4,
10,
11,
12]. Du et al. [
4] showed that increasing roughness shifts the transition to the critical and supercritical regimes to lower Reynolds numbers. In a specific study on circular-cylinder wakes with large relative roughness heights, Sun et al. [
10] observed a reduction in the Strouhal number, thickening of the shear layers, and modification of the wake formation length as roughness increased. In vibration problems, Ghazali et al. [
11] reported a reduction in response amplitude with increasing roughness for a bluff body subjected to transverse
(vortex-induced vibrations), whereas Gao et al. [
12], for a cylinder vibrating in the vicinity of a wall, showed that roughness alters hydrodynamic forces, vibration trajectories, and aspects of the lock-in regions. Taken together, these results indicate that roughness does not act merely as a secondary geometric detail but rather as a parameter capable of reorganizing the dynamics of both the flow and the structural response.
More recent studies have reinforced this interpretation by showing that roughness may substantially modify vibration response even for single cylinders. Han et al. [
13] reported that surface roughness changes the
response branches and may introduce more complex oscillatory behavior at moderate Reynolds numbers. Chen et al. [
14] numerically showed that at subcritical Reynolds numbers, roughness alters the vibration amplitude, hydrodynamic coefficients, and wake-vortex characteristics. Similarly, Jiang et al. [
15] demonstrated that for a two-degree-of-freedom circular cylinder in oscillatory flow, increasing roughness modifies both the vibration response and the associated wake patterns. These results reinforce the idea that roughness may act as an effective dynamic parameter in fluid–structure interaction problems rather than merely as a passive geometric perturbation.
When moving from an isolated cylinder to two-cylinder arrangements, the influence of roughness becomes even more sensitive because it also affects the very nature of wake interference. Du et al. [
4] showed that the roughness of the downstream cylinder has a more pronounced effect on
s than the roughness of the upstream cylinder, and when the downstream cylinder is rough, the response may cease to be divergent and instead occur within a limited reduced-velocity range, characterizing velocity-restrained vibrations. Dao et al. [
3] further showed that interference between two parallel cylinders may take different forms, including reattachment of the upstream-cylinder shear layer onto the downstream cylinder, gap-flow formation, and vortex impingement, with these mechanisms being strongly dependent on Reynolds number. In a different, yet mechanistically relevant, configuration, Yang et al. [
16] showed that for two cylinders with roughness strips, the gap-flow formation depends on the spacing and Reynolds number, and this flow may become the main factor governing vibration under certain geometric and kinematic combinations.
This combined effect of roughness and interference has also been examined in more recent tandem configurations. Hu et al. [
17], in an experimental study on rough risers arranged in tandem, showed that the interference effects and surface condition should be analyzed jointly, since the downstream-body response is sensitive to the coupling between the incoming-wake structure and roughened-body dynamics. Although that configuration differs from the present one, the study supports the broader interpretation that roughness may alter not only the local hydrodynamic loads but also the interference-mediated vibration regime itself.
From a numerical standpoint, the analysis of these phenomena requires a formulation capable of adequately representing detached vortical structures, wake interference, and surface effects without losing the dominant physics of the problem. Carvalho et al. [
1] showed that the Discrete Vortex Method (
), in a purely Lagrangian formulation, constitutes a particularly suitable strategy for bluff-body aerodynamic problems with heat transfer, since it discretizes the vorticity-carrying regions into vortex particles that move with the fluid, restricting the computations to the regions of interest and avoiding the need for the explicit treatment of far-field boundaries. The same authors also showed that this formulation can incorporate viscous diffusion, the panel discretization of solid surfaces, turbulence modeling, and roughness effects. In particular, a two-dimensional roughness model, coupled with LES theory, was employed to modify the boundary-layer flow and the separation point through an effective momentum injection into the near-wall region [
1]. Previous applications of this methodology have already shown that it is capable of capturing relevant physical changes associated with roughness, such as modifications in vortex-shedding frequency, the intermittency or cessation of vortex shedding, and significant changes in aerodynamic loads [
1,
2].
In the specific context most closely related to this paper, Moraes et al. [
18] employed a purely Lagrangian
to numerically investigate the two-dimensional flow around two identical circular cylinders aligned with the incoming flow, considering a fixed upstream cylinder and a downstream cylinder subjected to forced transverse vibration at high Reynolds numbers. In that study, in addition to the analysis of two fixed cylinders in tandem, the fluid-dynamic characteristics of the downstream oscillating cylinder were investigated for
= 4.5 (
g is the gap spacing center-to-tenter between two cylinders), reduced amplitudes
= 0.15 and
= 0.50, and the reduced-velocity range 5 <
< 50, leading to the conclusion that in this arrangement, the
mechanism does not constitute a purely resonant phenomenon [
18]. This research therefore represents a direct basis for this paper, as it established the fluid-dynamic and structural problem of the tandem arrangement with no roughness effect.
In addition, recent evidence indicates that the application of vortex-based Lagrangian formulations to vibration problems involving rough cylinders remains limited. Chiaradia et al. [
19] employed the Lagrangian vortex method to investigate the
response and drag of a rough circular cylinder, showing that roughness can substantially modify both the aerodynamic loading and the oscillatory response. This study is especially relevant from a methodological standpoint because it confirms the suitability of purely Lagrangian vortex formulations for rough-cylinder problems while also highlighting that their extension to tandem arrangements with direct wake interference and forced transverse oscillation is still scarce in the recent literature.
Despite these advances, it still remains insufficiently understood how the distribution of the surface roughness on the downstream cylinder modifies, in a tandem arrangement aligned with the flow, the coexistence, alternation, and transition among mechanisms associated with lock-in and wake-induced response. A significant part of the literature focuses on freely vibrating or elastically mounted cylinders [
4,
11,
12] staggered arrangements with gap flow. Dao et al. [
3] and Yang et al. [
16] studied cylinders with roughness strips or helical protrusions, or they analyzed fixed cylinders in the co-shedding regime. Even in the numerical antecedent closest to the present problem, the study of Moraes and Alcântara Pereira [
2] was conducted for smooth cylinders without incorporating surface roughness on the downstream cylinder. In contrast, the combination of the forced oscillation of the downstream cylinder, direct interference from the wake of the upstream cylinder, and distributed roughness as a dynamic control parameter still lacks specific investigation, particularly under high-Reynolds-number conditions in which wake reorganization and fluid–structure synchronization become especially relevant.
Accordingly, this paper numerically investigates the two-dimensional, incompressible, and unsteady flow around two identical circular cylinders aligned with the incoming flow with the upstream cylinder stationary and the downstream cylinder subjected to forced transverse oscillation. The numerical formulation is based on a purely Lagrangian description through the
, combined with large-eddy simulation (
) subgrid-scale turbulence modeling and the two-dimensional roughness model, in which roughness acts through local modification of the boundary layer and flow separation [
1]. The main contribution of this paper is to extend the problem formulated by Moraes and Alcântara Pereira [
2] to the case in which the downstream cylinder presents distributed surface roughness, thereby allowing an integrated analysis of how the combination of forced vibration and roughness reorganizes wake interference and the synchronization between lift force and body motion. In particular, this paper focuses on three representative relative roughness levels,
= 0,
= 0.0045 and
= 0.01, which were selected because they produce qualitatively distinct responses, thus making it possible to highlight the transition among regimes associated with lock-in, desynchronization, and wake-induced behavior. Therefore, this paper expands the existing literature by addressing a problem in which roughness effects are not analyzed in isolation but rather in direct coupling with forced vibration and with the incident wake of a second cylinder, which constitutes the novel and central element of this paper’s contribution [
1,
2].
The two-dimensional roughness model used in this paper was developed and validated by [
20]. The roughness model was able to capture supercritical flow patterns from a typical subcritical Reynolds number flow. The numerical results successively indicated that two-dimensional roughness modeling is able to capture the drag crisis in a good physical sense at a high Reynolds number of
. The second-order velocity structure function model of the filtered vorticity field presented by Lesieur and Métais [
21] utilizes the concept of velocity fluctuations (velocity differences) instead of the rate of deformation (derivatives), which is a very appropriate association for Lagrangian discrete vortex methods for developing a roughness model, while the latter is based on the physics involved in turbulent boundary layer flows. The sensitivity of the present two-dimensional roughness model has been demonstrated by our research group by capturing the main features of turbulent boundary layer flows past bluff bodies, such as drag crises, separation point displacements, changes in the lift force direction, stagnation point displacements and interference from vortex formation regimes from a bluff body forced to oscillate [
2,
19,
20].
In general, the two-dimensional roughness model can improve the prediction of Strouhal numbers more than other studies without roughness models. The aerodynamic characteristics of a bluff body, as well as the control of intermittence and complete interruption of von Kármán-type vortex shedding, can be discussed in a very good physical sense. The idea behind our simulations is the development of a numerical technique that produces results for aerodynamic loads and vortex-shedding frequencies that are very useful for conservative designs for engineering applications.
4. Results and Discussion
4.1. Convergence of Important Parameters
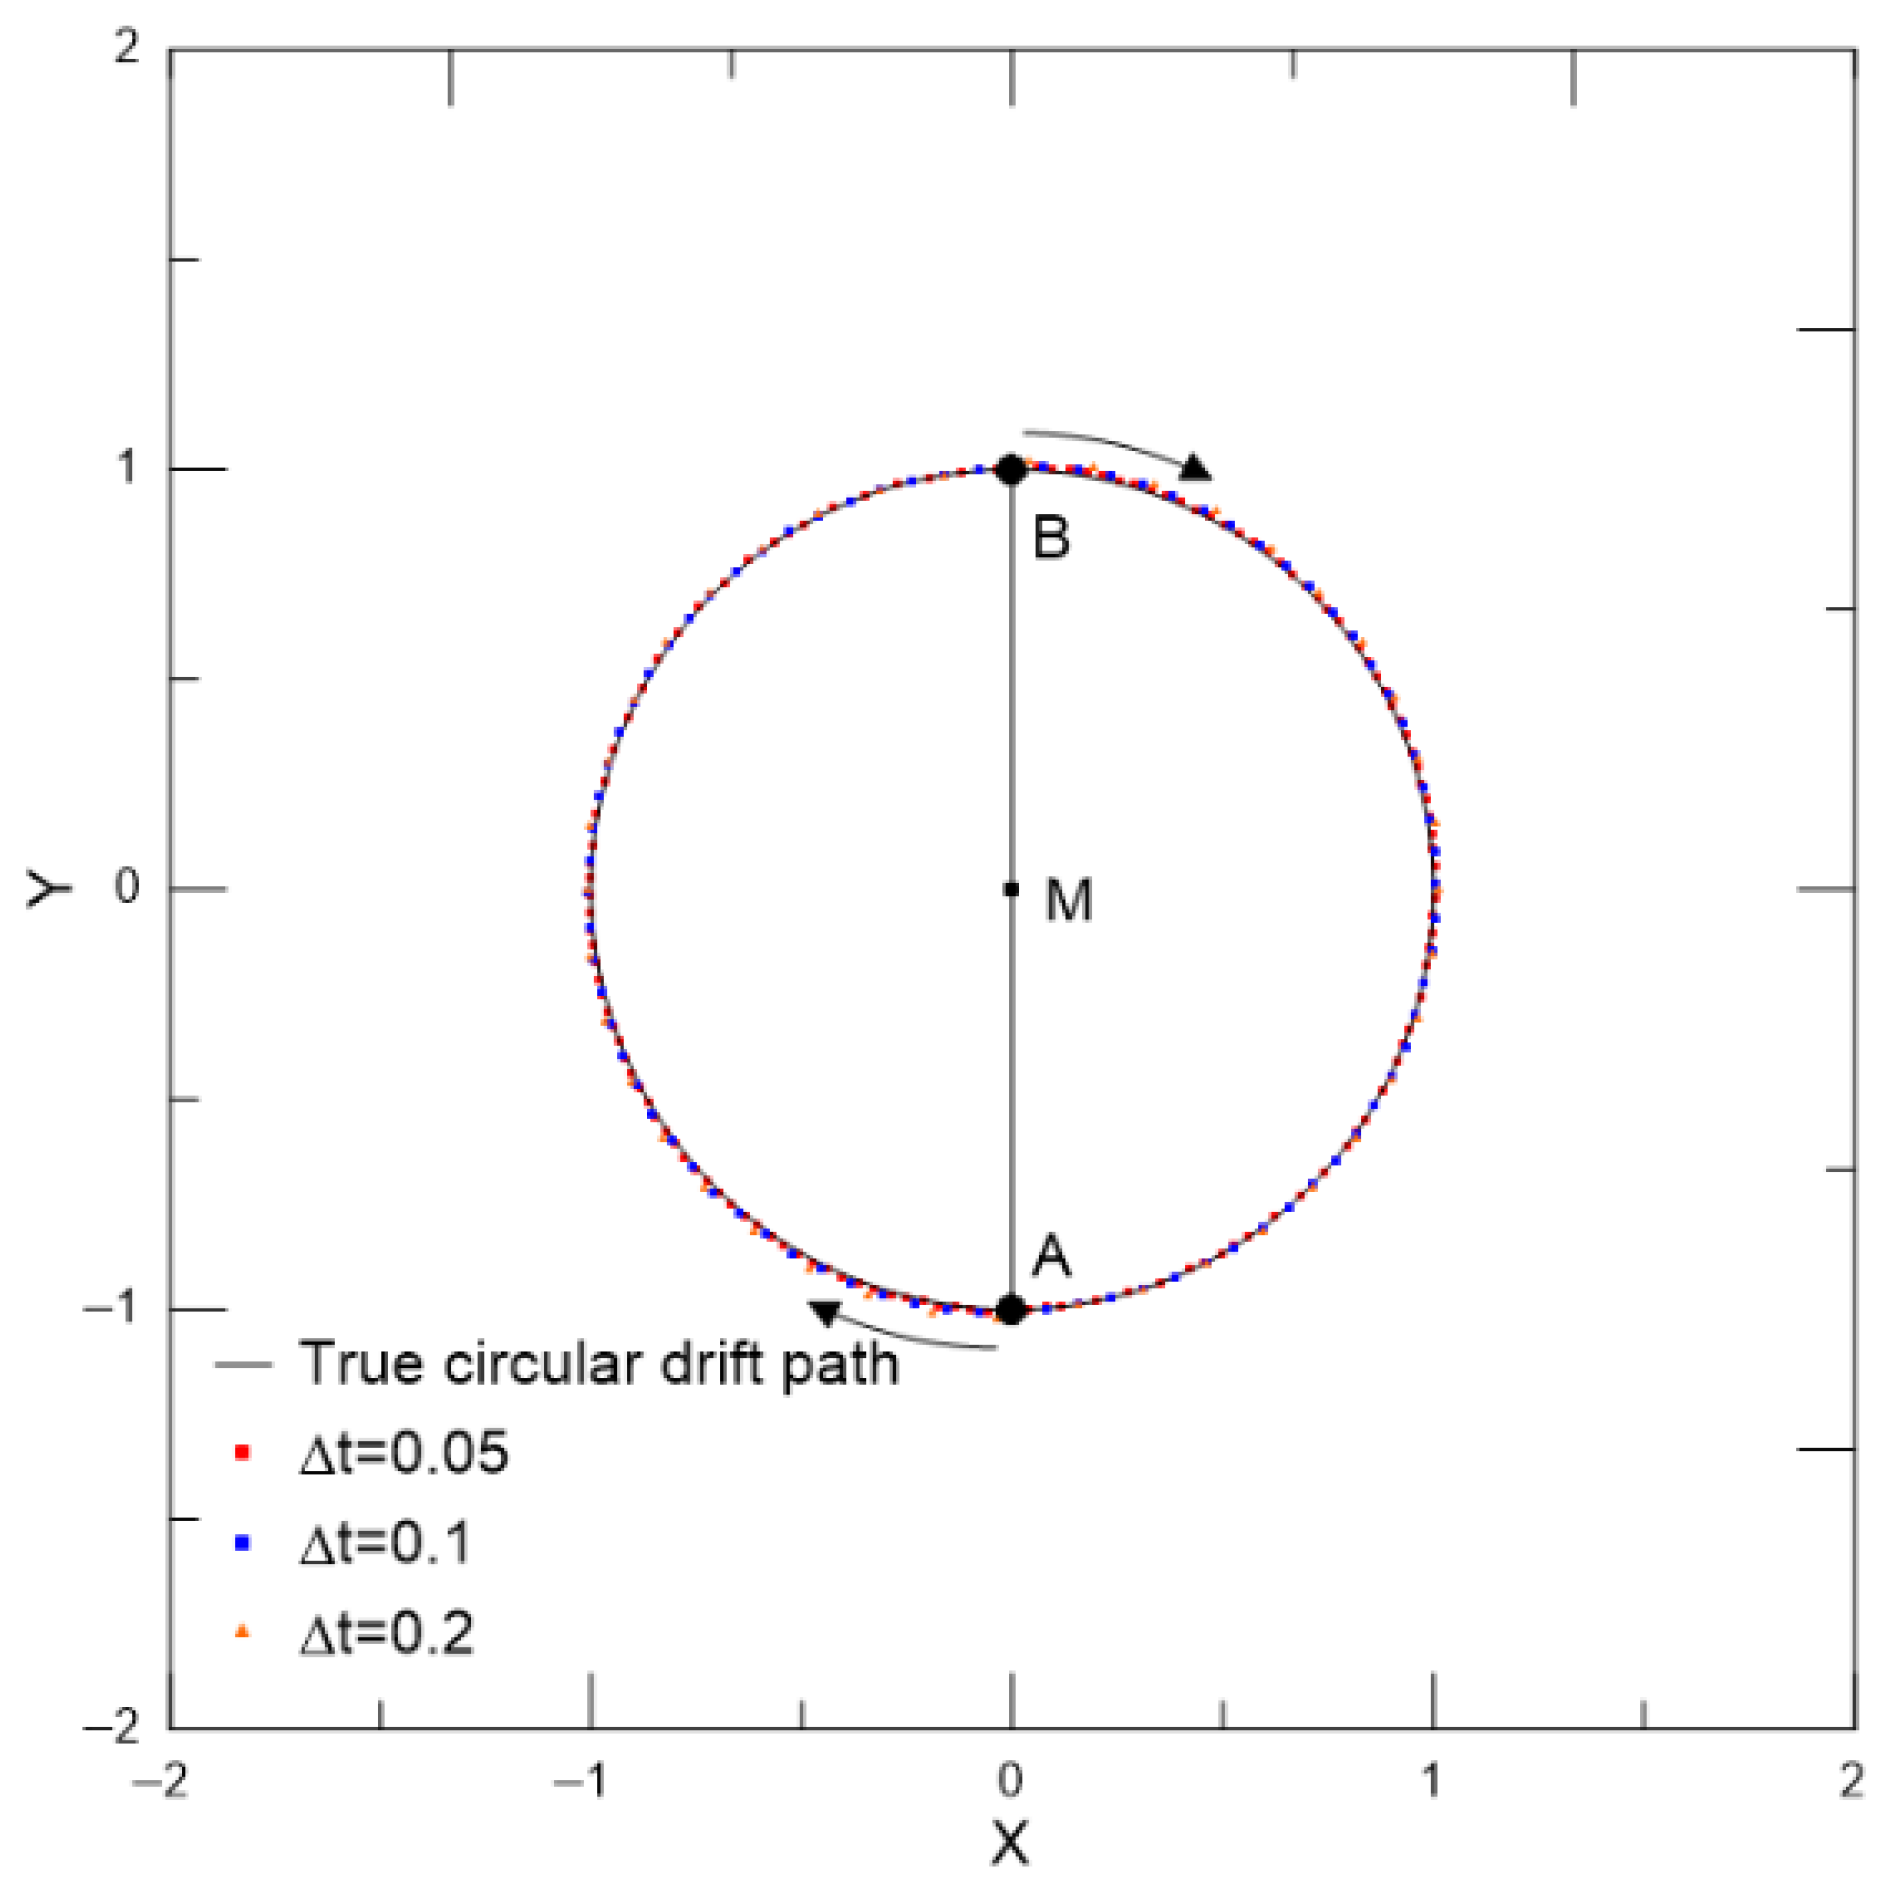
The convergence of the advection problem including the chosen time stepping is shown in
Figure 2. The strategy is to demonstrate that a pair of Lamb discrete vortices of equal strength
, distant AB apart, start to experience an advection velocity and subsequent advective motion in accordance with Equations (
37) and (
38), respectively.
As can be seen in
Figure 2, the vortex particle A is placed at (0.0;−1.0) and induces velocity at vortex particle B; the latter initially located at (0.0;1.0) also induces velocity at vortex particle A. As the time runs, the vortex particles will each experience new advection velocities because of the other acting in the direction normal to the line AB joining them. The advective motion of every vortex particle develops in the form of a circular path about the midpoint of AB (point M). The vortex particles move in clockwise direction over some time steps
.
Table 1 shows the column Steps, in which a number of finite steps, necessary for the vortex particle A to approximately attain the position (0.0,1.0), is reproduced. Additionally, the last column shows the estimated relative error between the true circular drift path of constant distance given by
. That error is computed at the instant that the vortex particle
A approximately reaches the position (0.0;1.0). The vortex particle
B behavior is analogous when it simultaneously and approximately attains the position (0.0;−1.0) identified in
Figure 2. It can be concluded that the time step
= 0.05, used in all numerical simulations of this paper, is appropriated to be used with the explicit Euler scheme.
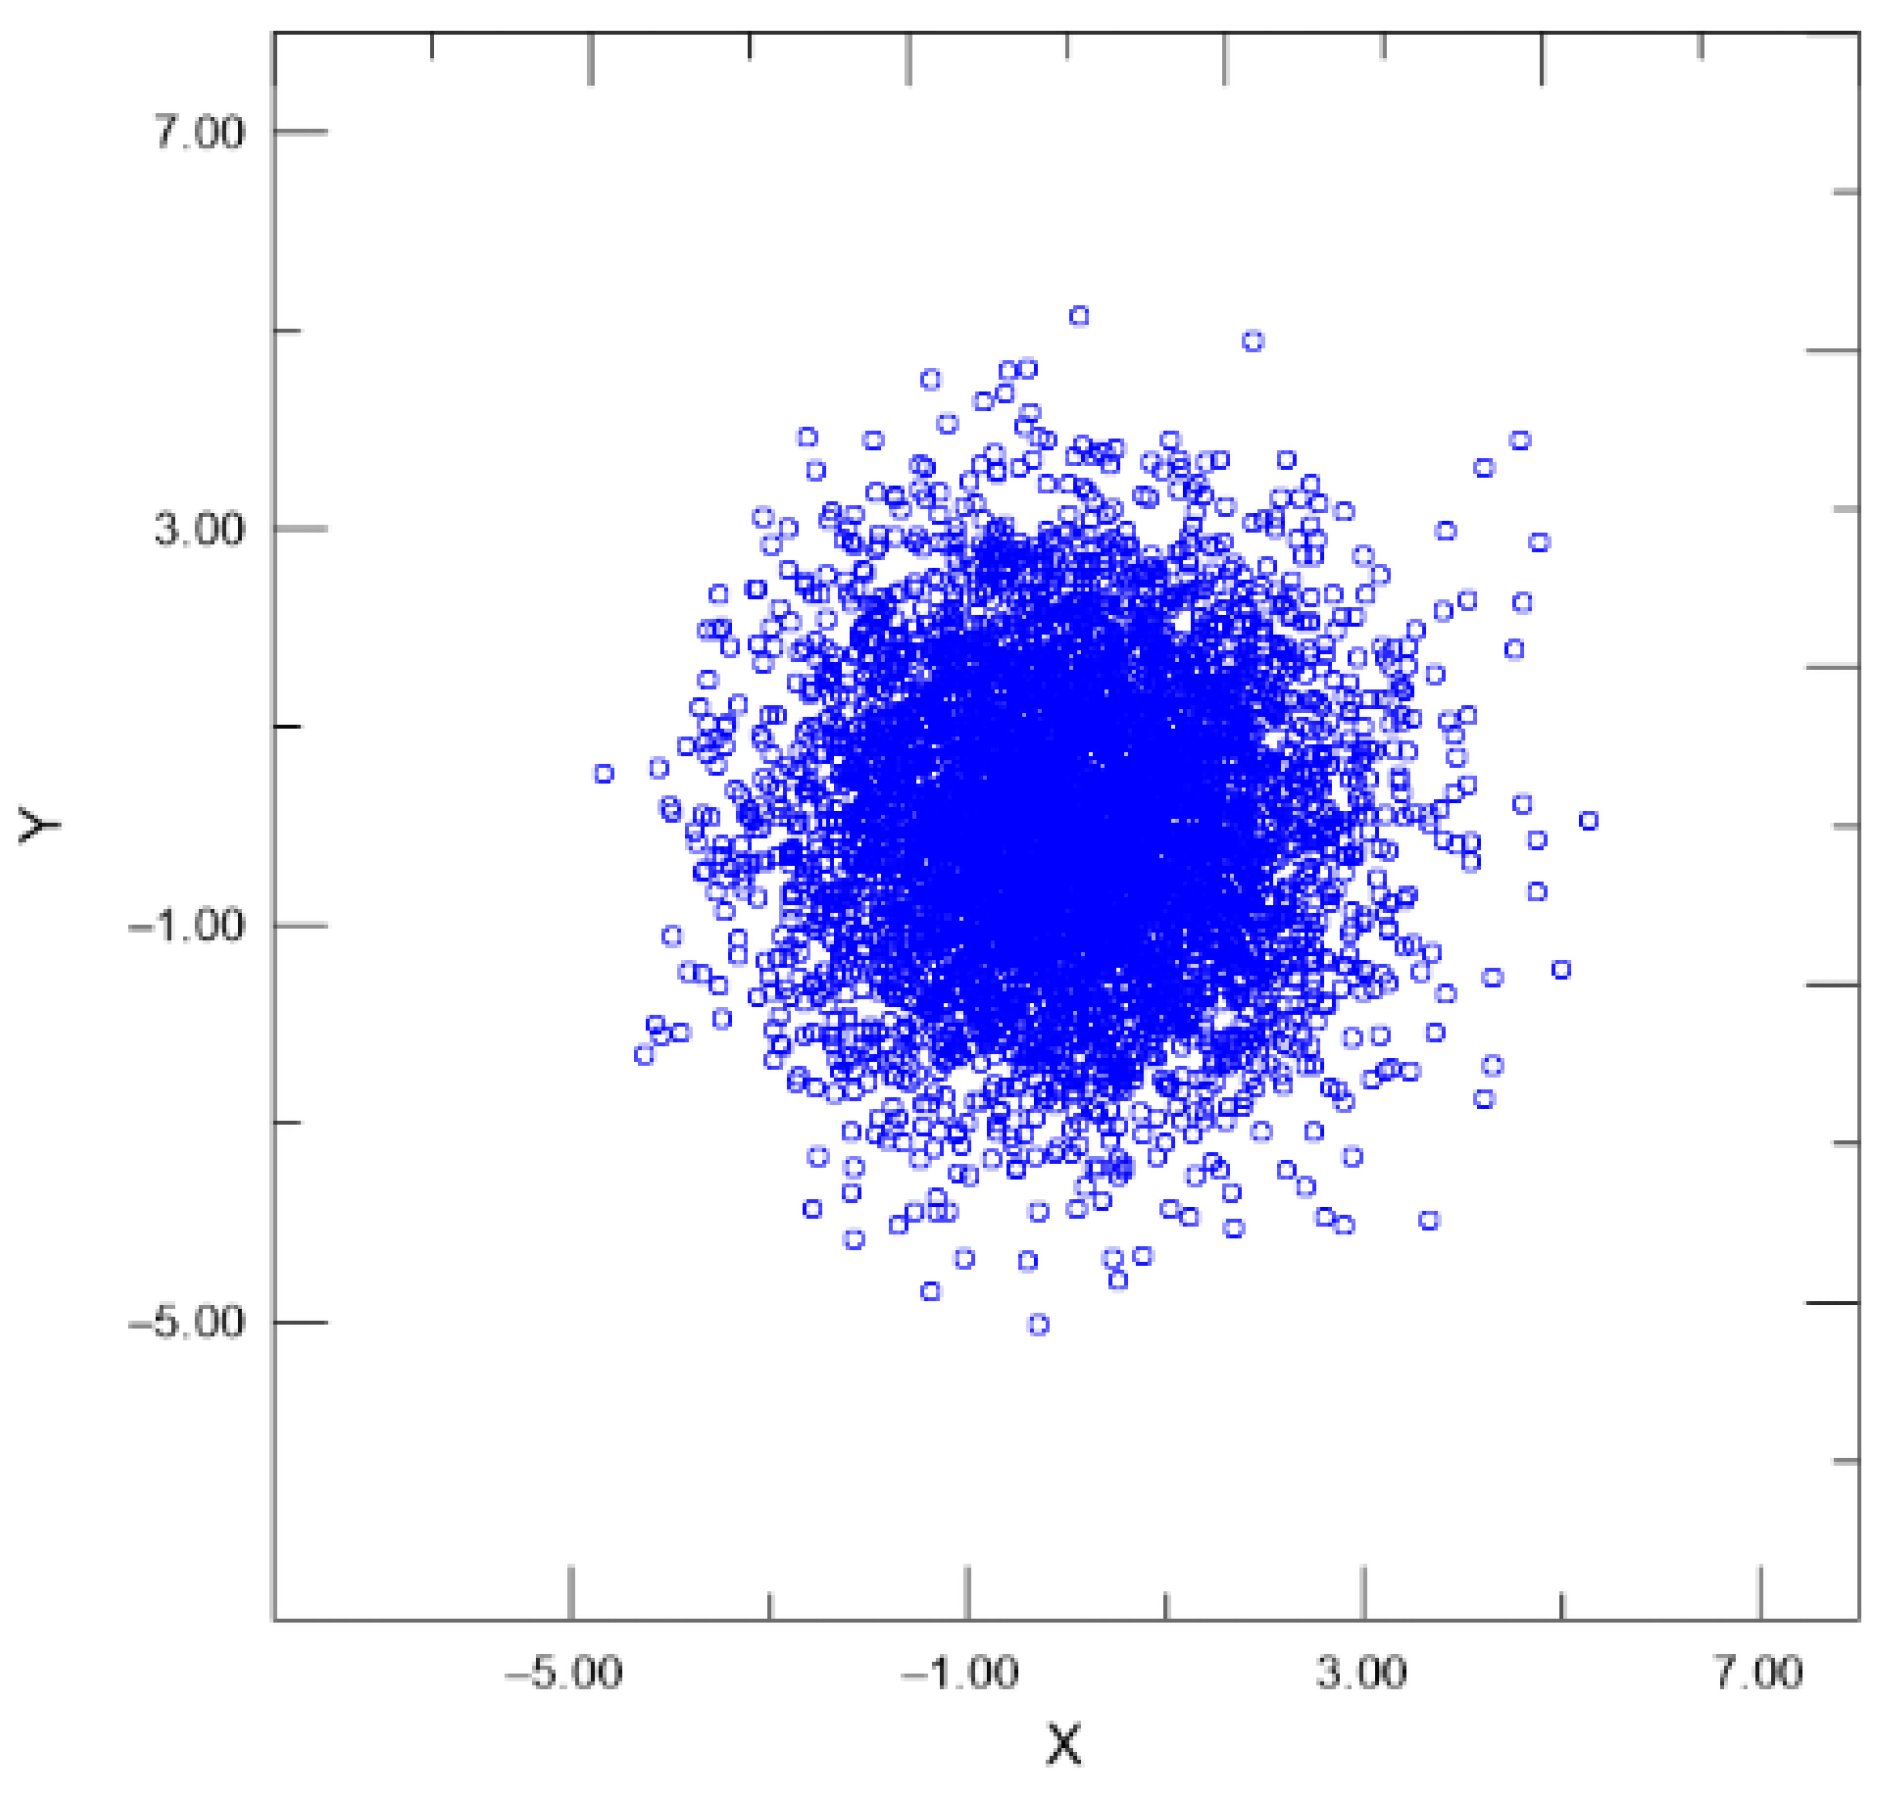
The convergence of the random walk method, employed to model the diffusion process according to Equation (
44), is also evaluated by considering the radial diffusion of a vortical structure with unit circulation,
= 1.0, which was initially located at the origin (0.0;0.0), as shown in
Figure 3. This radial diffusion problem admits an analytical solution for the spatial and temporal evolution of the vorticity distribution, as reported in Lewis [
36]:
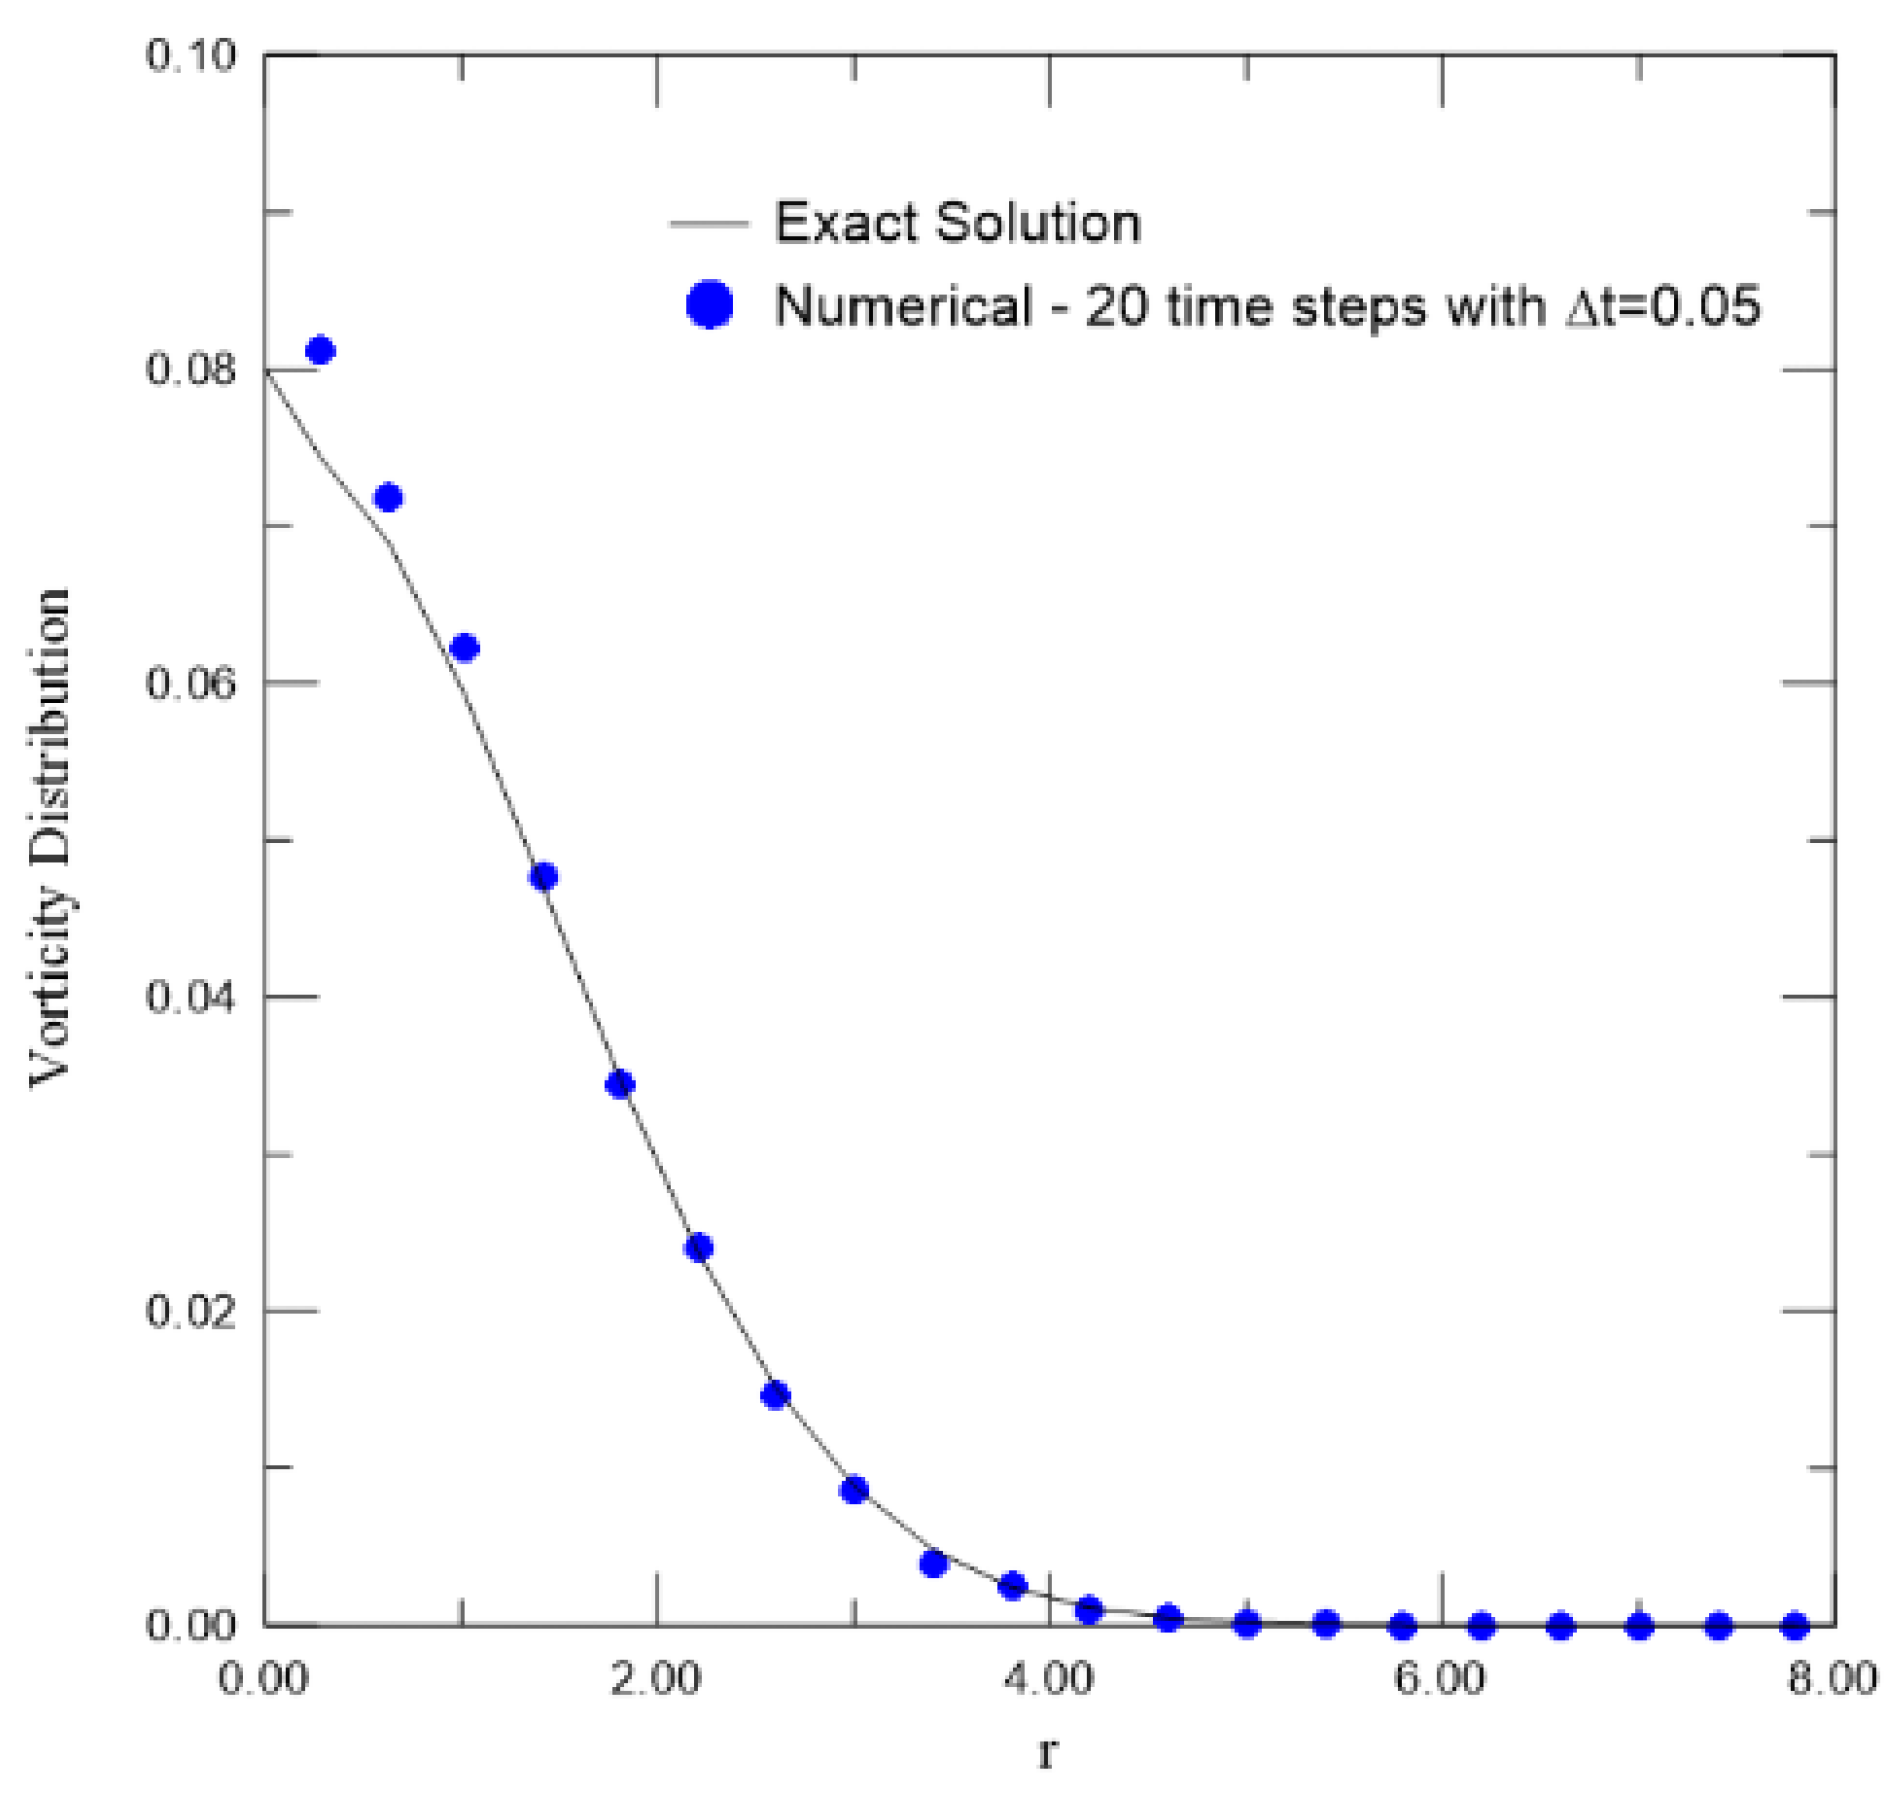
The analytical solution is presented in
Figure 4 for the case where
,
, and
. For comparison purposes, a numerical approximation is also obtained by representing the vortical structure of circulation
with
vortex particles, each carrying a circulation equal to
. At the initial instant,
, all vortex particles are placed at the origin
. After twenty time steps of
, the particles diffuse according to Equation (
44) without the inclusion of turbulence modeling, as illustrated in
Figure 3. The corresponding vorticity distribution is then numerically computed according to Equation (
45):
In
Figure 3, the numerical vorticity field was evaluated using twenty concentric annular bins of uniform thickness
, which were centered at the origin
. These annular regions were used to group the
vortex particles according to their radial position, covering the interval from
to
. The comparison with the analytical solution shows a very good agreement, indicating that the random walk procedure accurately reproduces the radial diffusion process. In Equation (
46), the analytical vorticity distribution is expressed in terms of the r.m.s. radius:
for every strip j of a annular bin. Thus, the time step
is also chosen for the random diffusion of all test cases in
Section 3.
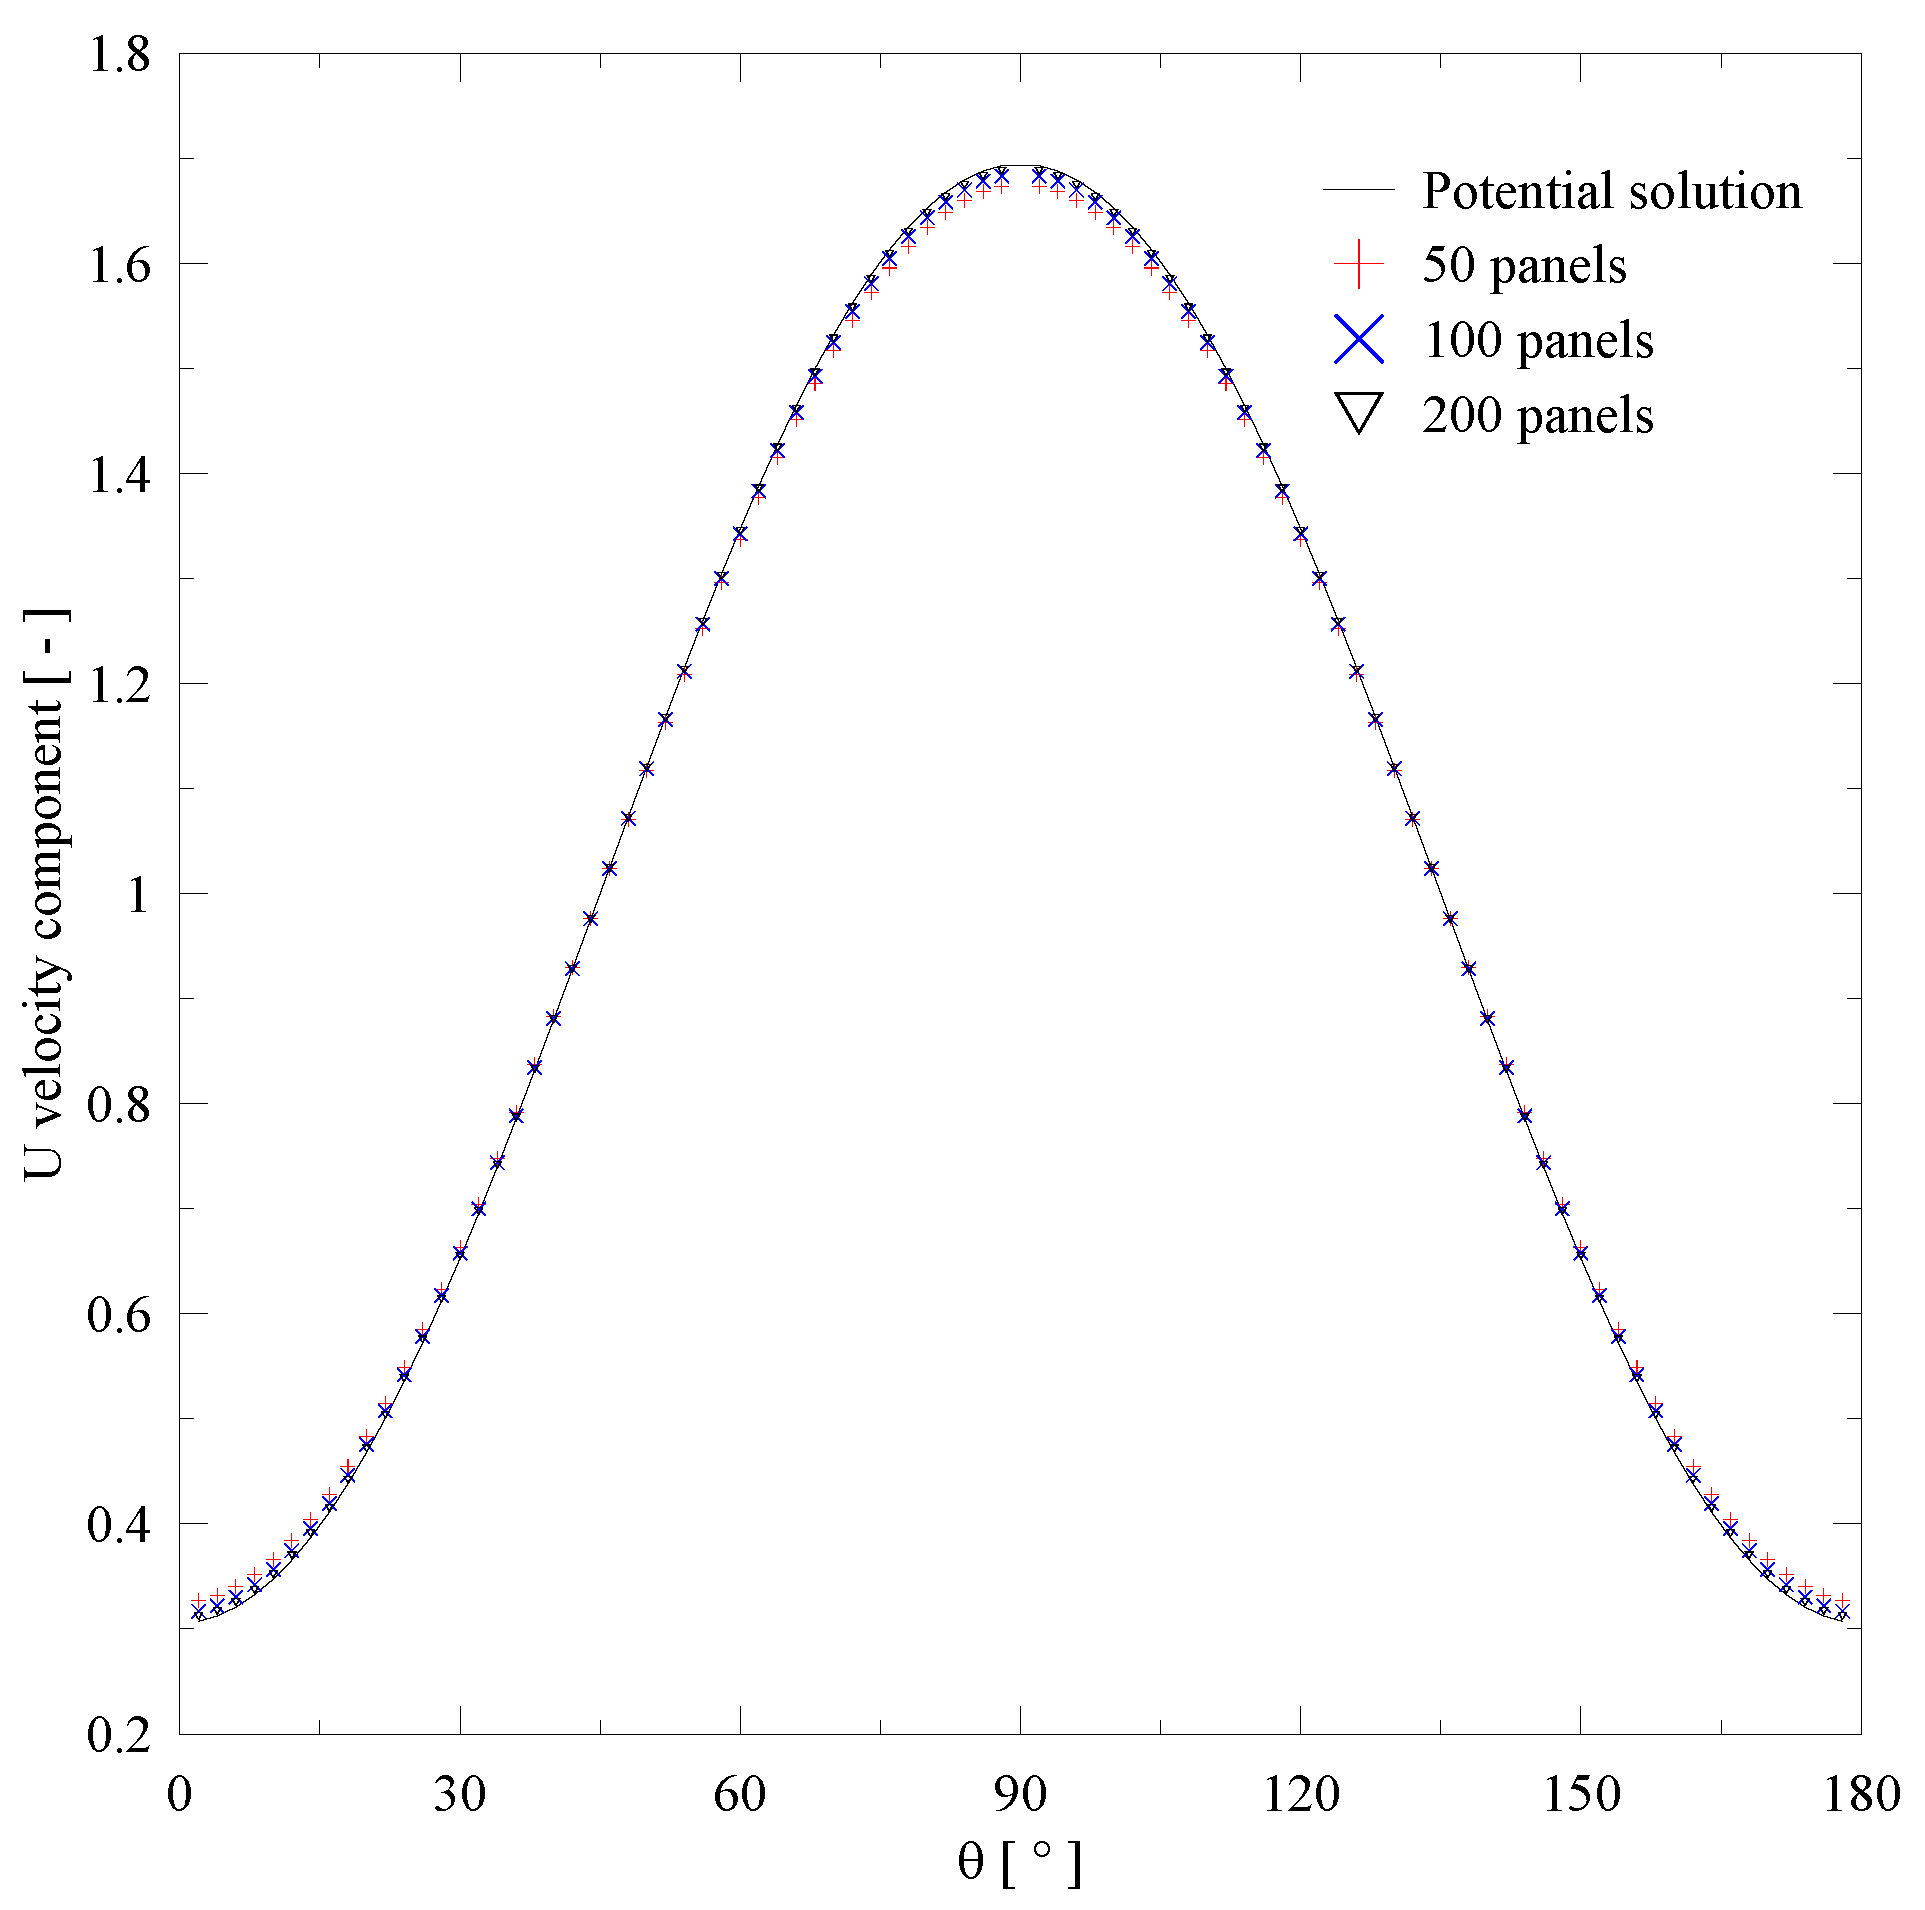
Preliminary verifications were carried out to define the number of panels employed in the discretization of each body considered in the investigated problem. This analysis was performed by evaluating the ability of the panel method to reproduce the analytical potential-flow solution around a two-dimensional circular cylinder. In this validation procedure, a cylinder of radius
is represented by
flat panels with uniform source distribution and subjected to a uniform incident flow. This classical problem in fluid mechanics admits an analytical solution obtained by superposing the incident flow with a dipole located at the center of the cylinder. Using the complex-potential formulation, the velocity components
u and
v at an arbitrary point
in the complex plane can be written as follows:
The numerical solution obtained from the panel method was then compared with the analytical solution for different discretization levels. This comparison was used to verify the fulfillment of the impermeability condition, associated with the Neumann boundary condition, while maintaining an adequate computational cost in terms of CPU time. Based on the results obtained, the use of
panels per body was adopted, since from this refinement level onward, the numerical solution did not show a significant dependence on any further increase in the number of panels. Therefore, this discretization was considered sufficient to accurately represent the geometry of the bodies and to ensure the numerical accuracy required for the problem addressed in this paper.
Figure 5 presents the comparison between the numerical solutions obtained with different numbers of panels and the analytical potential-flow solution, evidencing the convergence of the panel method as the discretization is refined.
4.2. The Surface Roughness Effects on WIV
Moraes and Alcântara Pereira [
2] validated the present vortex code for a configuration of two immovable circular cylinders at a Reynolds number of
and streamwise center-to-center spacing of
.
Table 2 reproduce some results of time-averaged values given by Moraes and Alcântara Pereira [
2], which are compared with experimental data by Alam et al. [
37] at about 92% confidence, when possible.
The common simulation parameters are shown in
Table 3. The summary of the results is presented in
Table 4.
4.3. Case 1: Downstream Circular Cylinder Oscillating Transversely Without Roughness Effect— = 0.0000
For the oscillating downstream cylinder without a rough surface
= 0.0000, subjected to harmonic transverse vibration with an amplitude ratio
and dimensionless frequency
, the time series of the lift coefficient and the distribution of the pressure coefficient along the body surface were analyzed.
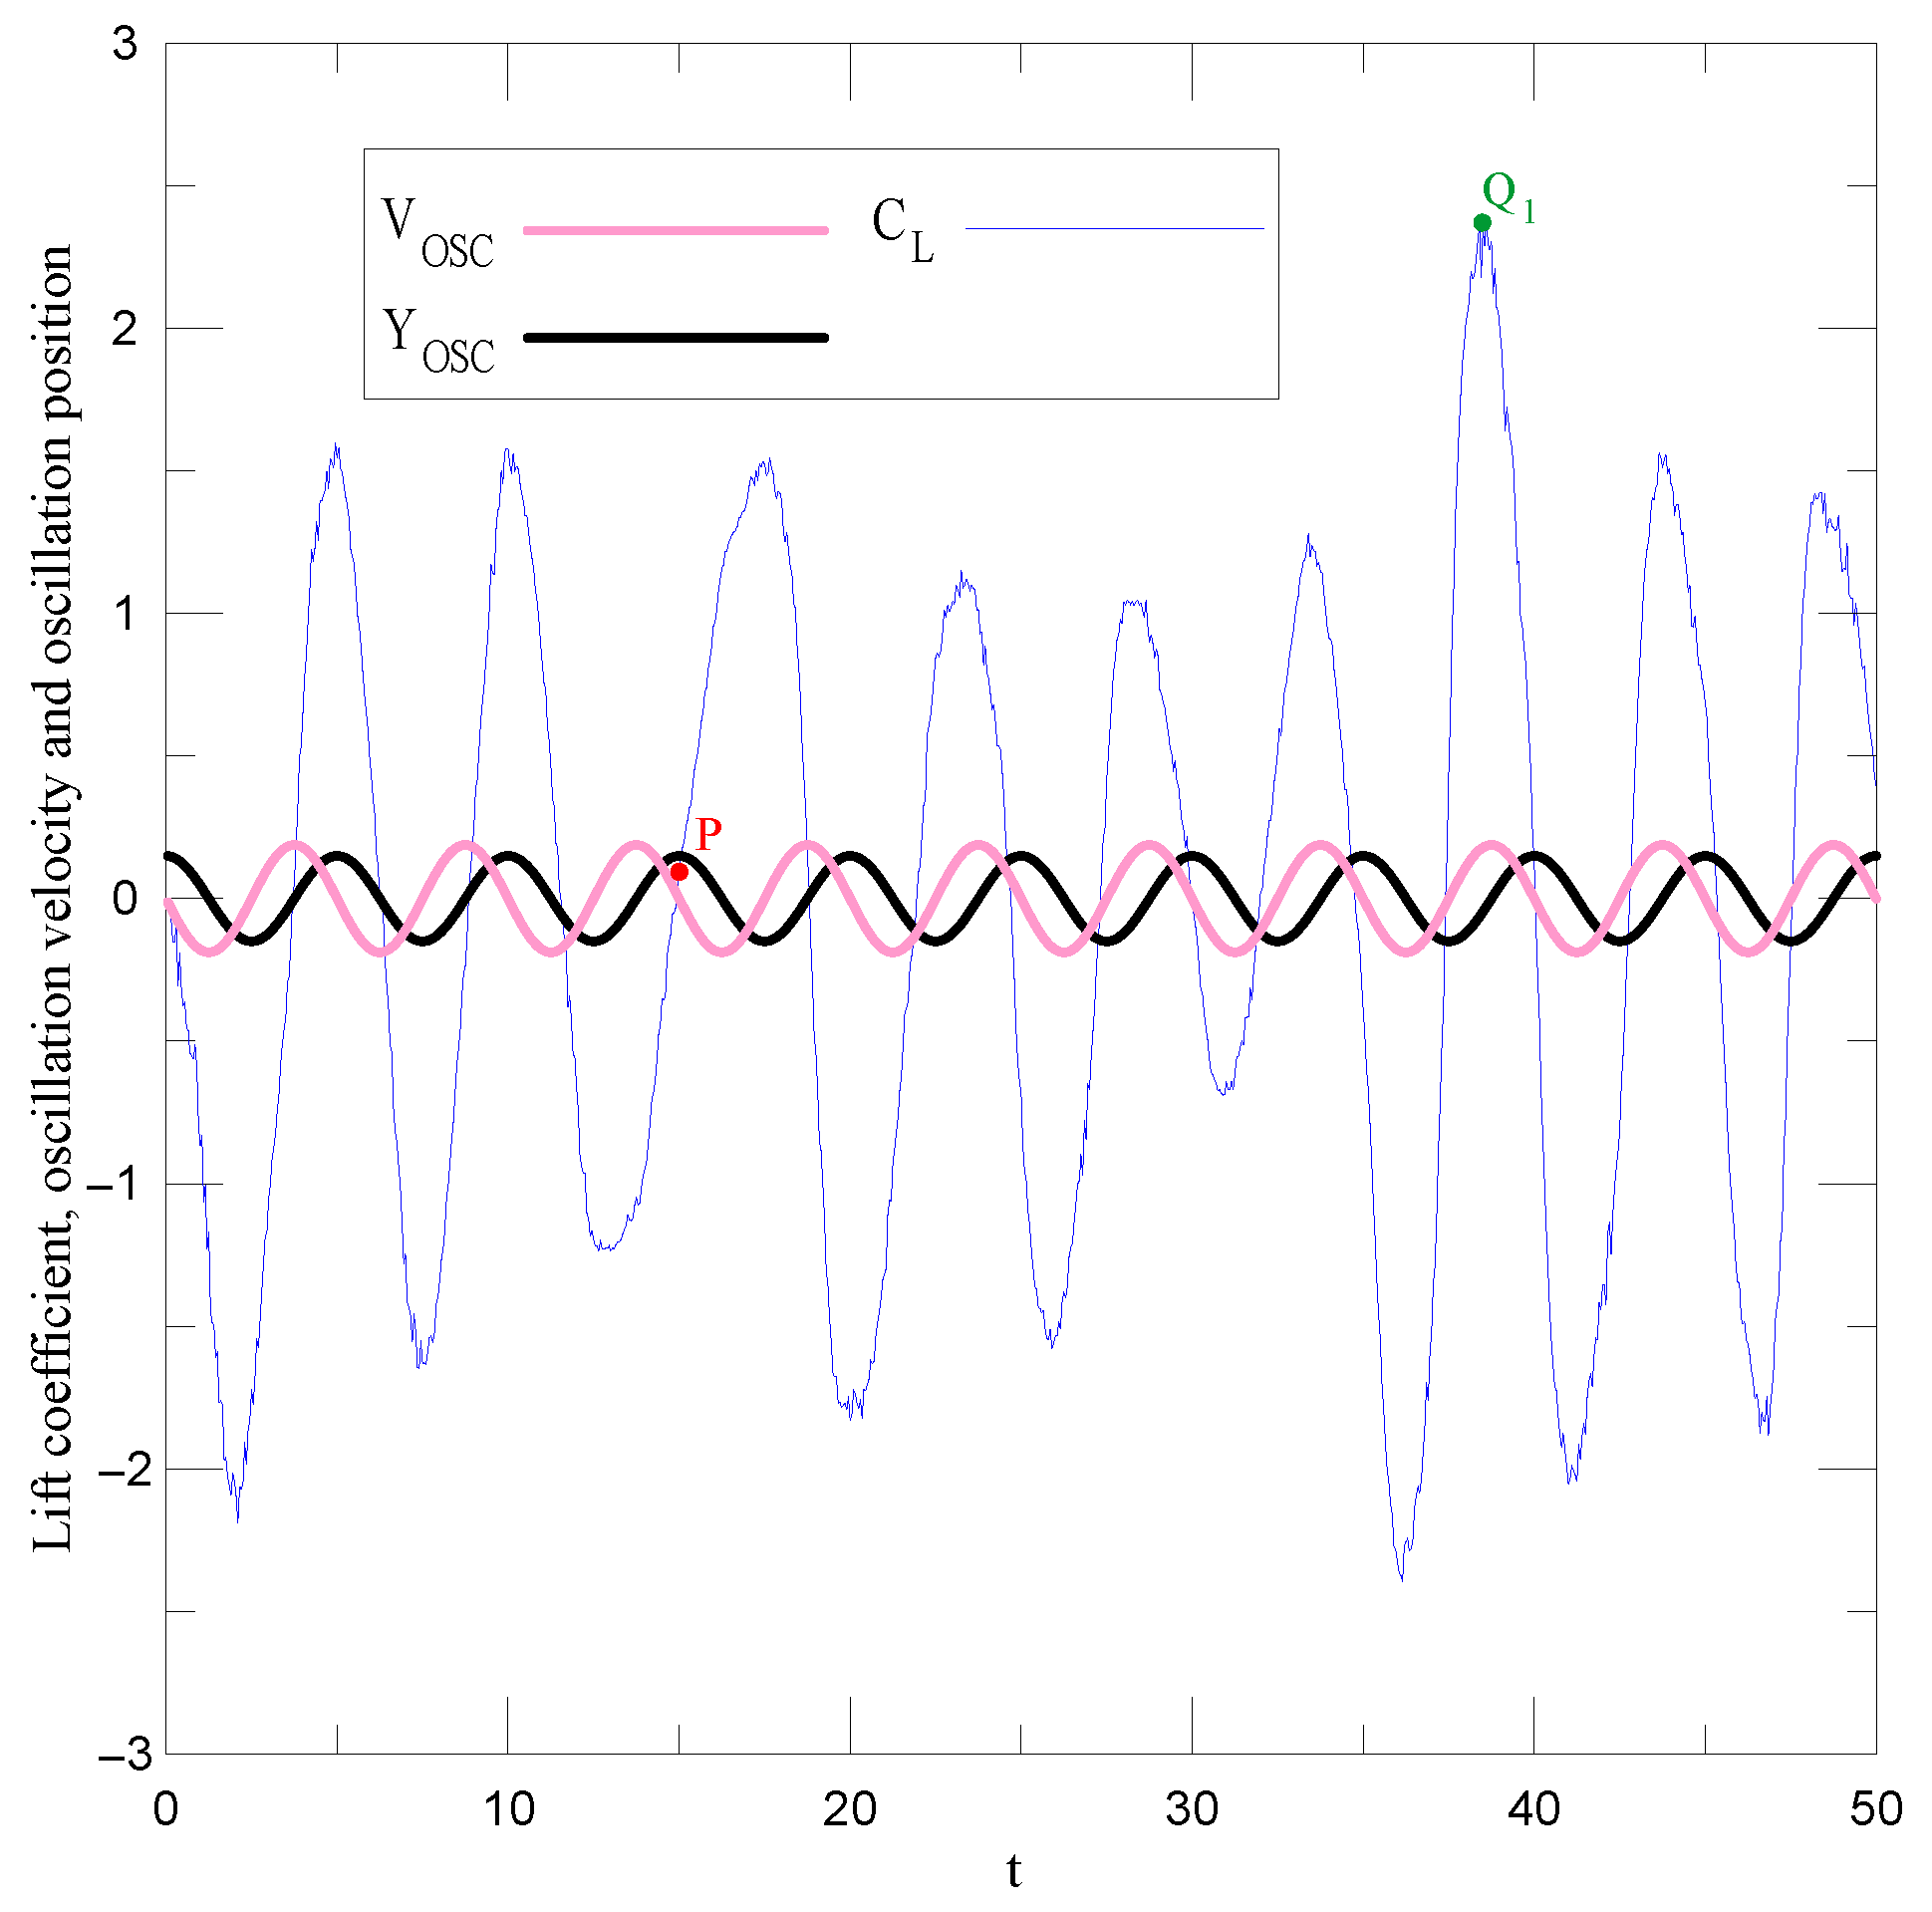
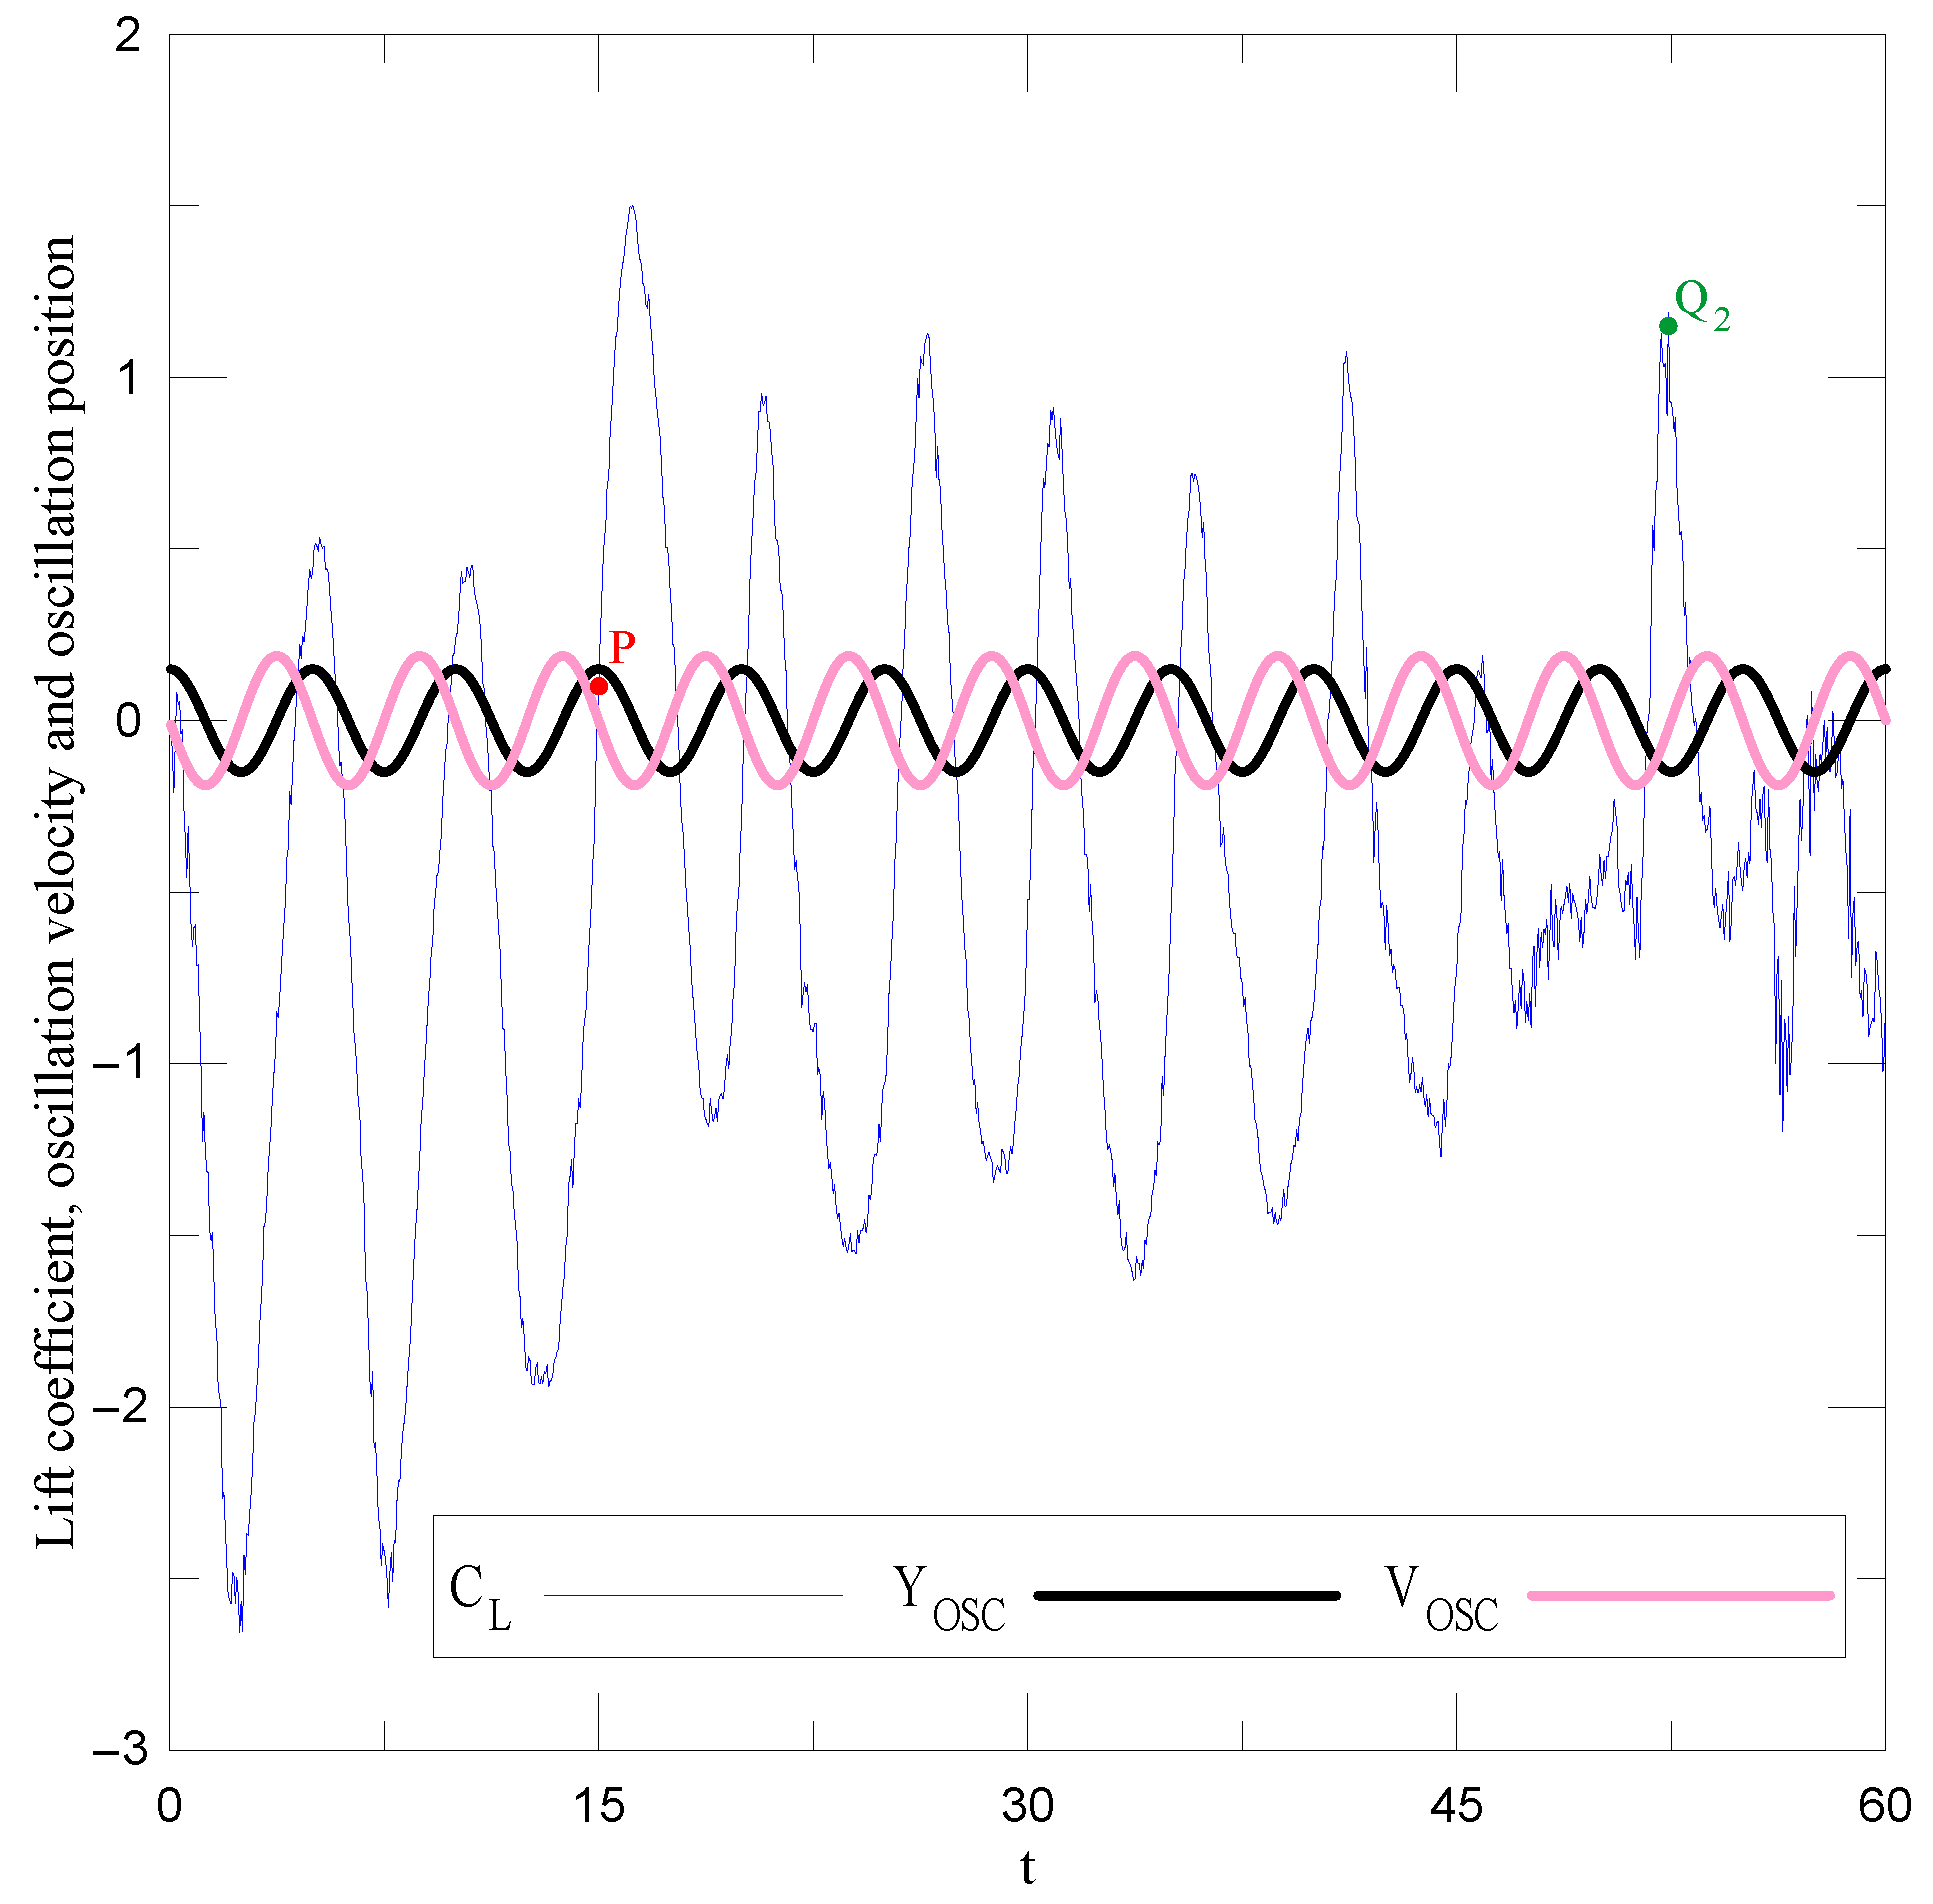
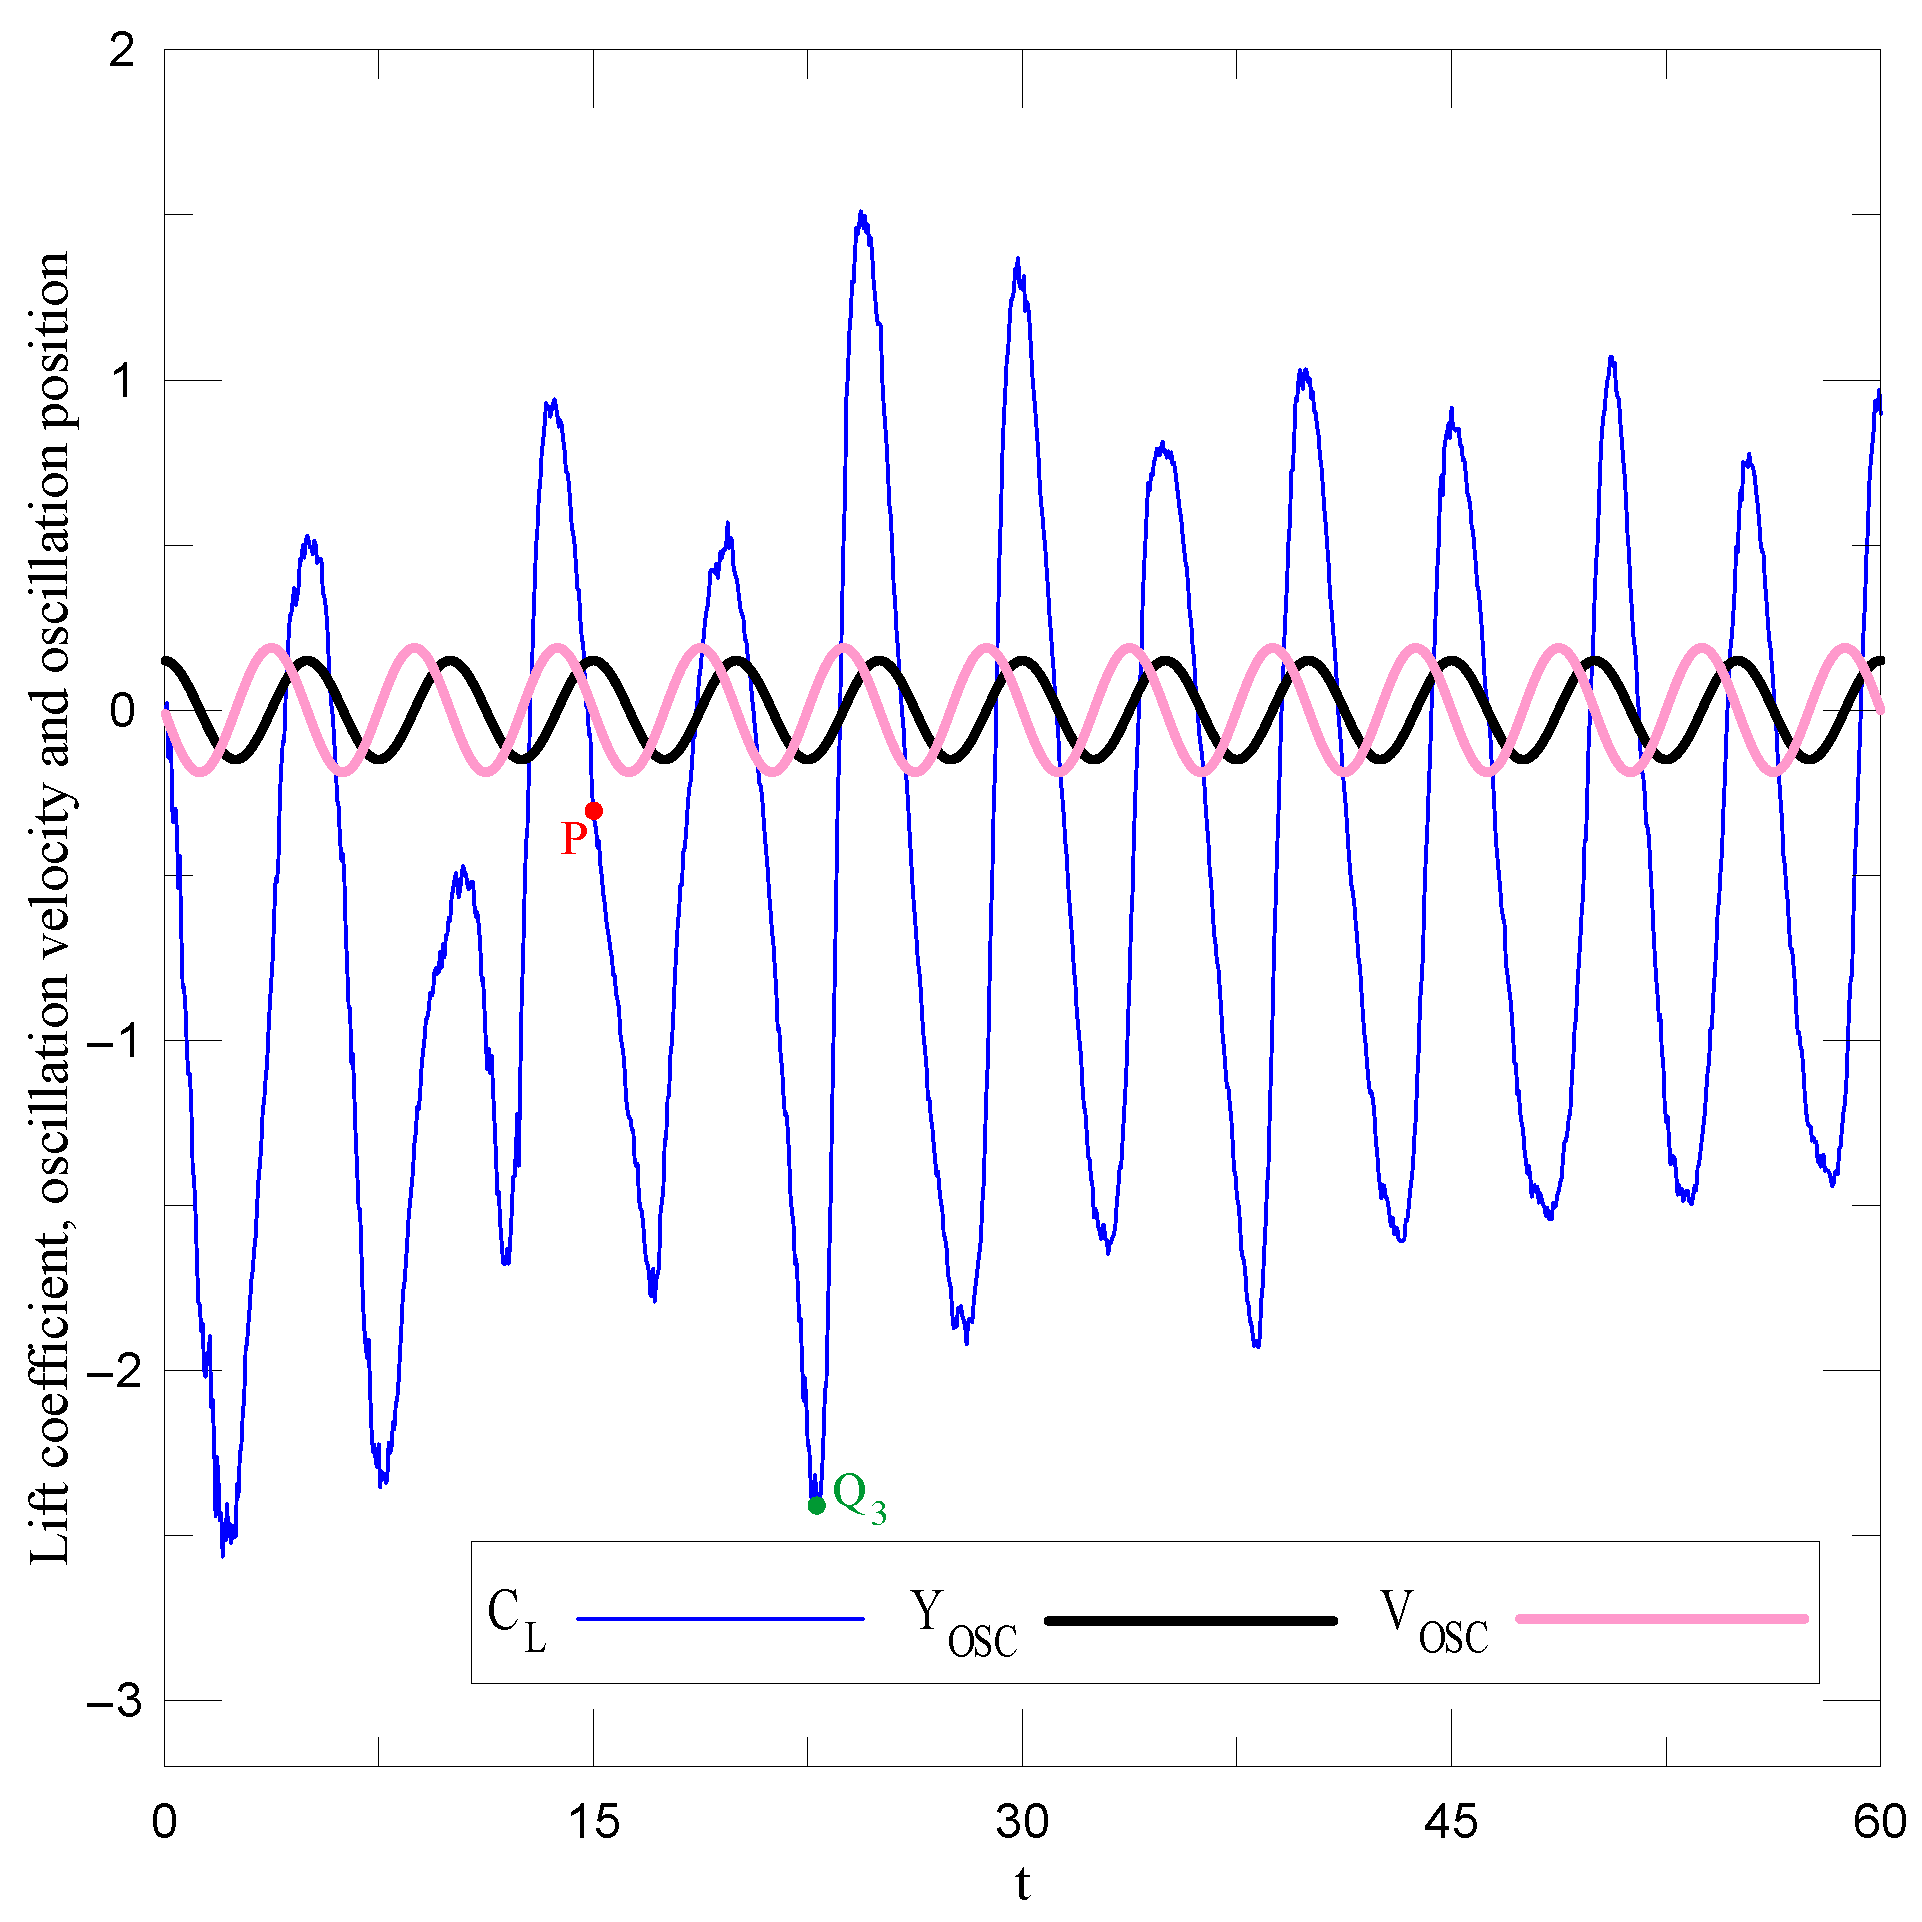
Figure 6 presents the time evolution of the lift coefficient with the displacement and velocity curves. The results indicate the occurrence of
, evidenced by the synchronization between the lift coefficient and the cylinder displacement, or by the proximity between the vortex shedding frequency and the imposed oscillation frequency. Additionally, the occurrence of
may be associated with the wake-galloping phenomenon, which is identified when the lift coefficient is in phase with the vibration velocity, characterizing a net positive transfer of energy from the fluid to the body.
For the hydraulically smooth surface condition (
),
Figure 6 shows that the lift coefficient remains in phase with the displacement curve between the dimensionless times 0 and 12.5, characterizing the occurrence of lock-in within this interval. Between the dimensionless times 12.5 and approximately 24, neither lock-in nor wake galloping is observed. From that instant onward, the lift coefficient remains in phase with the velocity curve until the end of the simulation, indicating the occurrence of wake galloping between the dimensionless times 24 and 50. Therefore, since this behavior is not maintained throughout the entire time series, the analyzed case cannot be characterized as either pure lock-in or pure wake galloping.
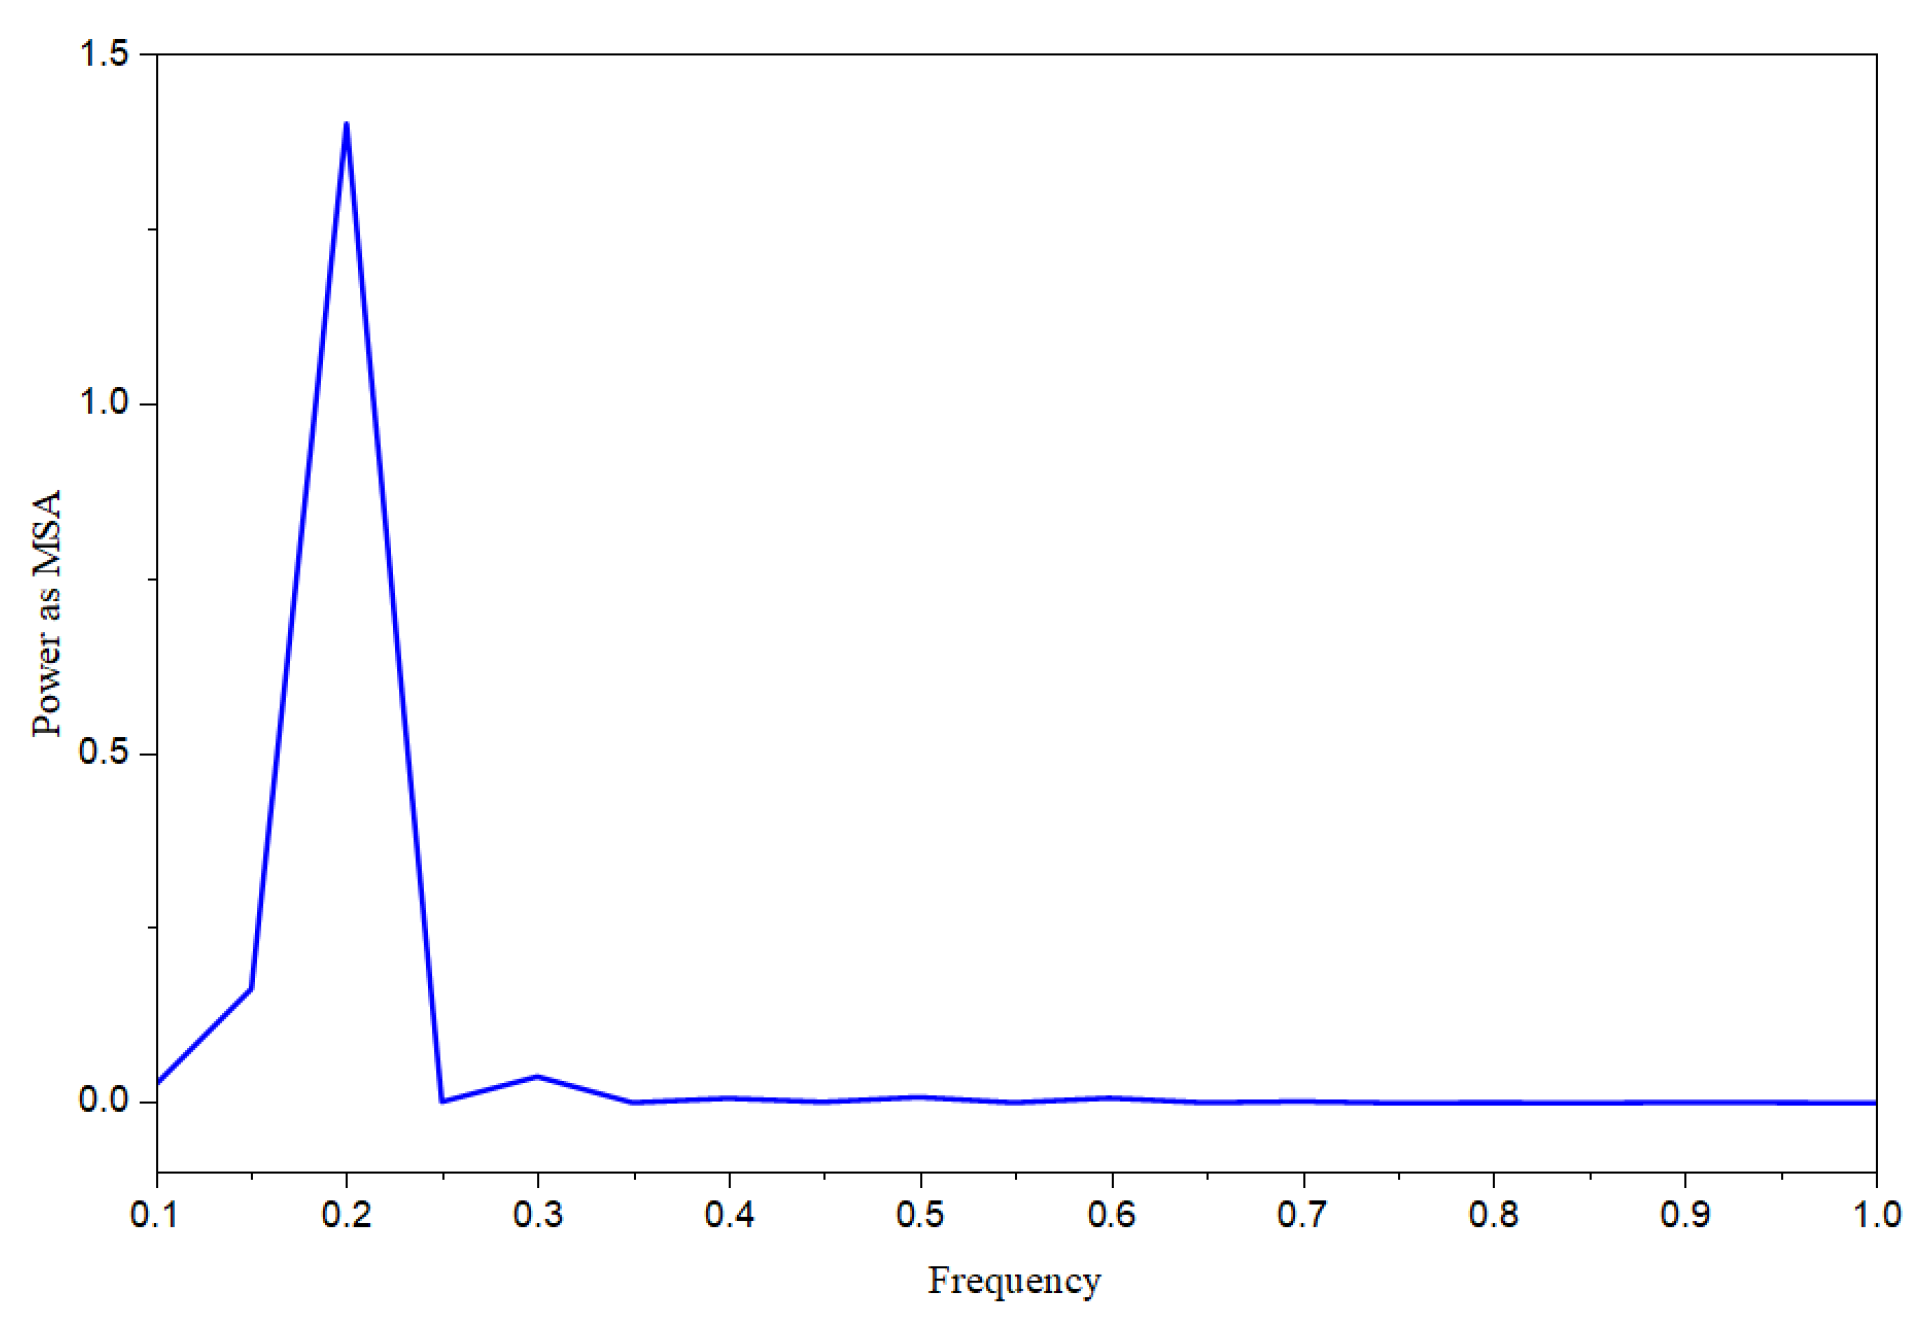
The mean lift coefficient was , whereas the Strouhal number, obtained by applying Fast Fourier Transform (FFT) to the lift coefficient time series, was . Both parameters were determined over the dimensionless time interval from 30 to 50. These results indicate hydrodynamic behavior associated with a stable regime, which is characterized by smooth and well-defined oscillations over time.
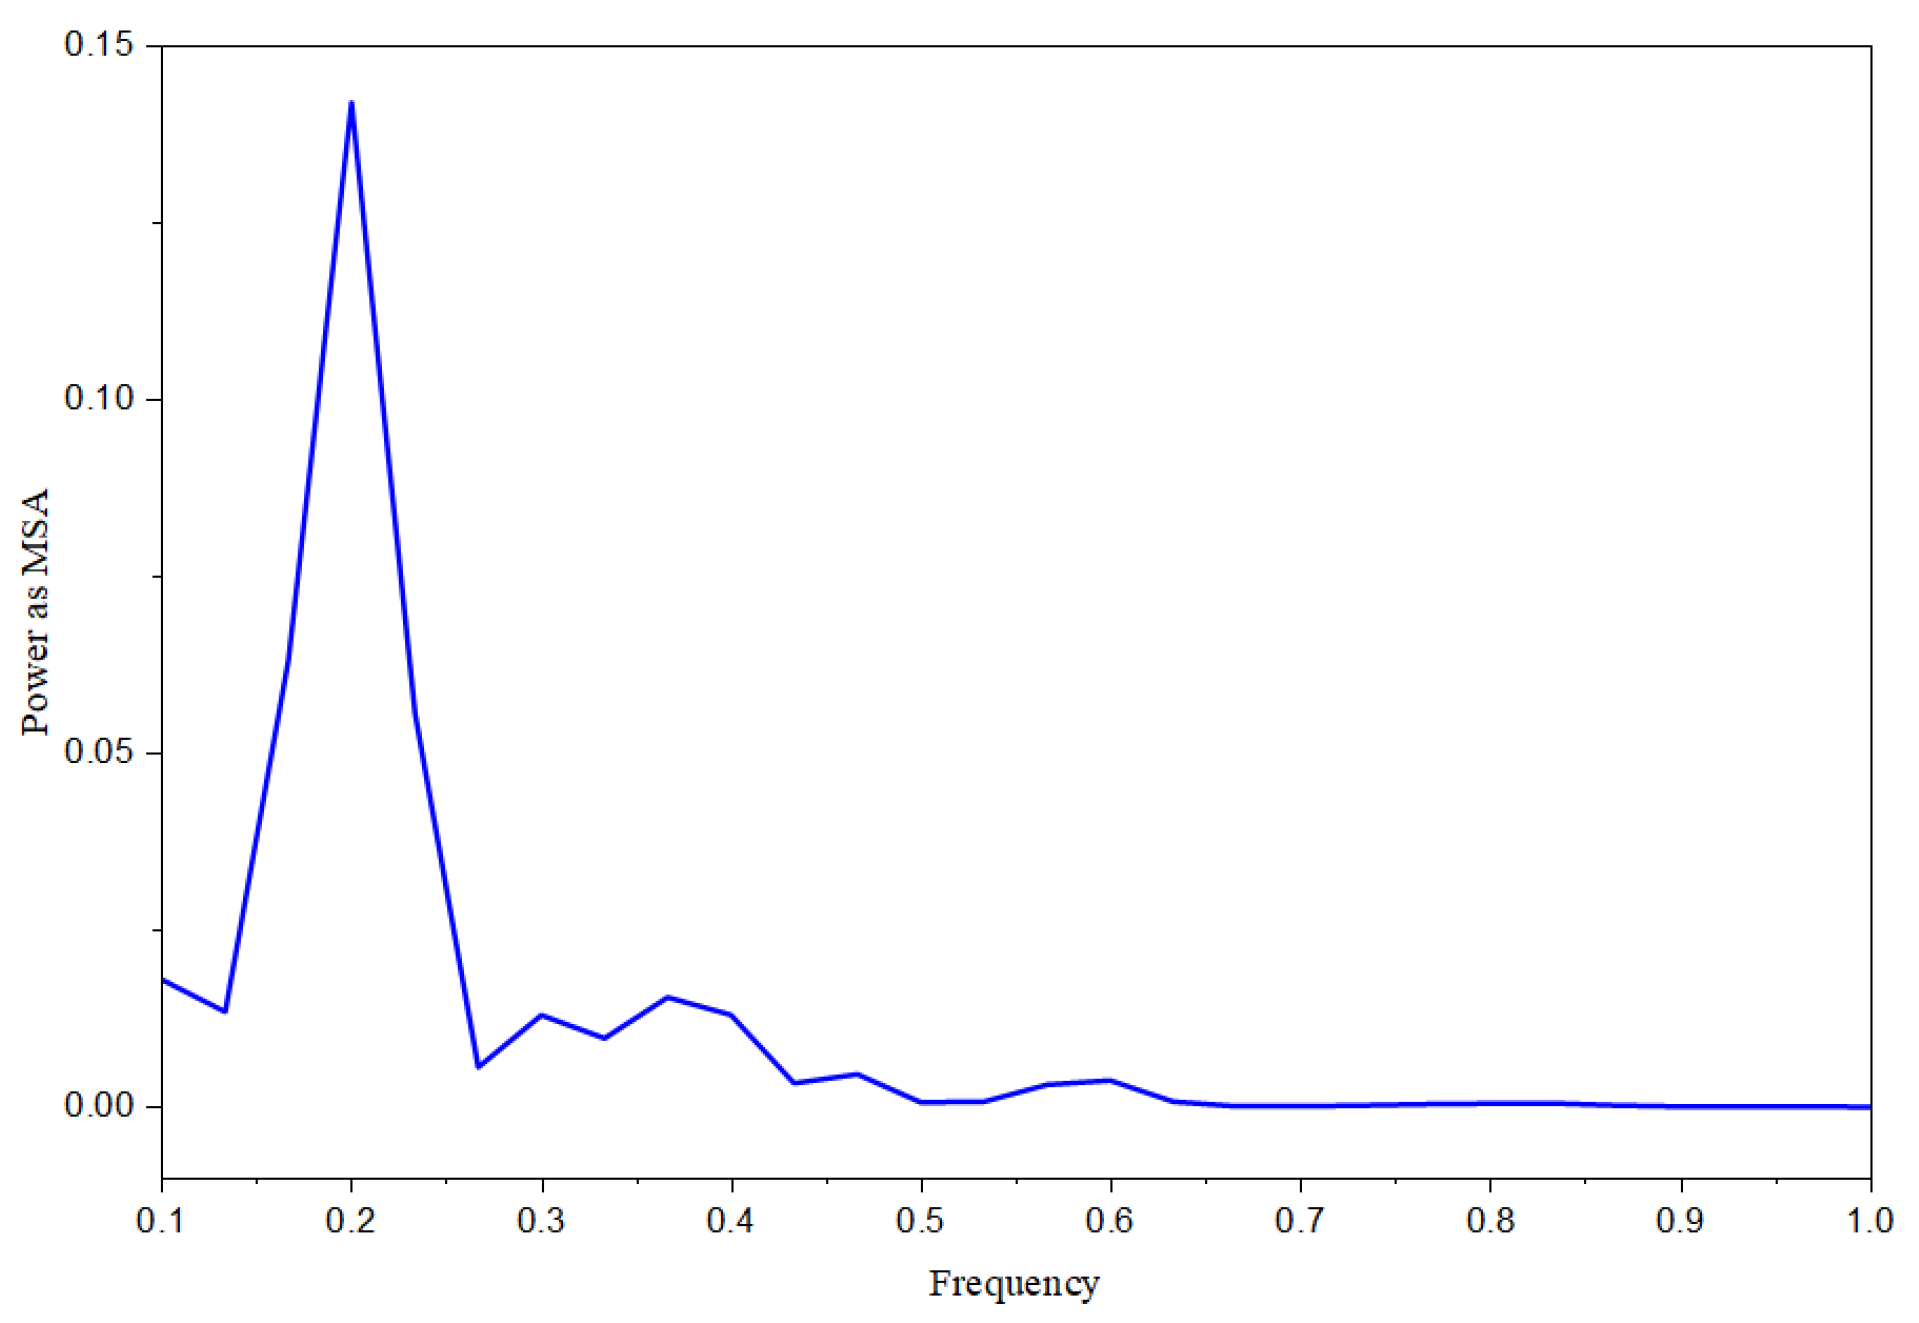
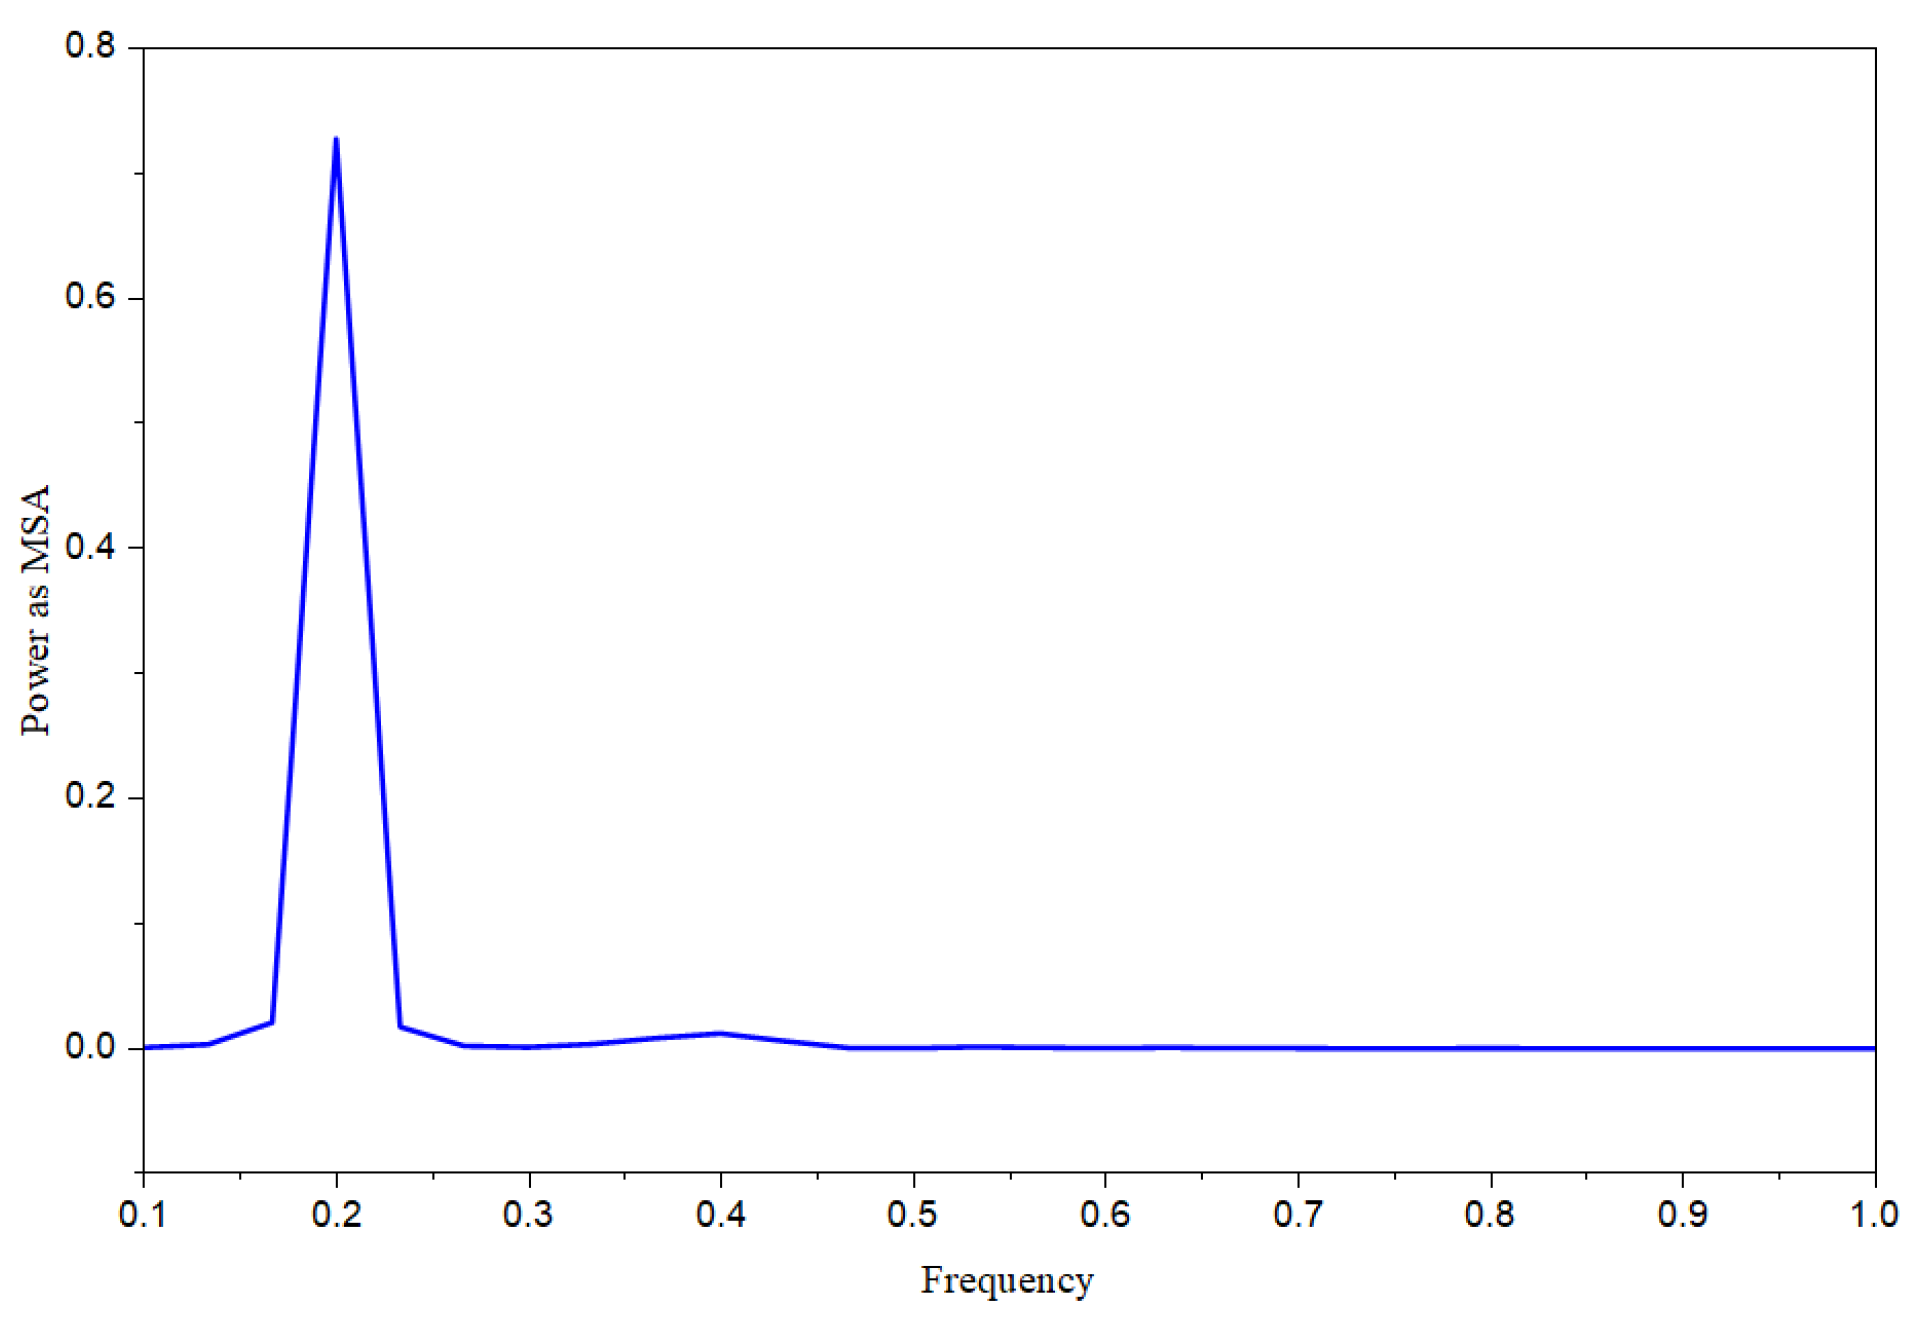
The analysis of the Strouhal number can be complemented by
Figure 7, which presents the FFT of the lift coefficient time series in greater detail. In this figure, the presence of a single dominant frequency is observed, evidencing the predominance of a well-defined oscillatory mode in the flow.
As indicated in
Figure 7, a single significant peak is observed in the frequency spectrum obtained from the lift coefficient time series. This behavior is consistent with the predominance of the wake-galloping phenomenon after the interaction between the wake of the upstream cylinder and the oscillating downstream cylinder, which persists until the end of the numerical simulation. Thus, no significant alternation between different phenomena is observed throughout the time series.
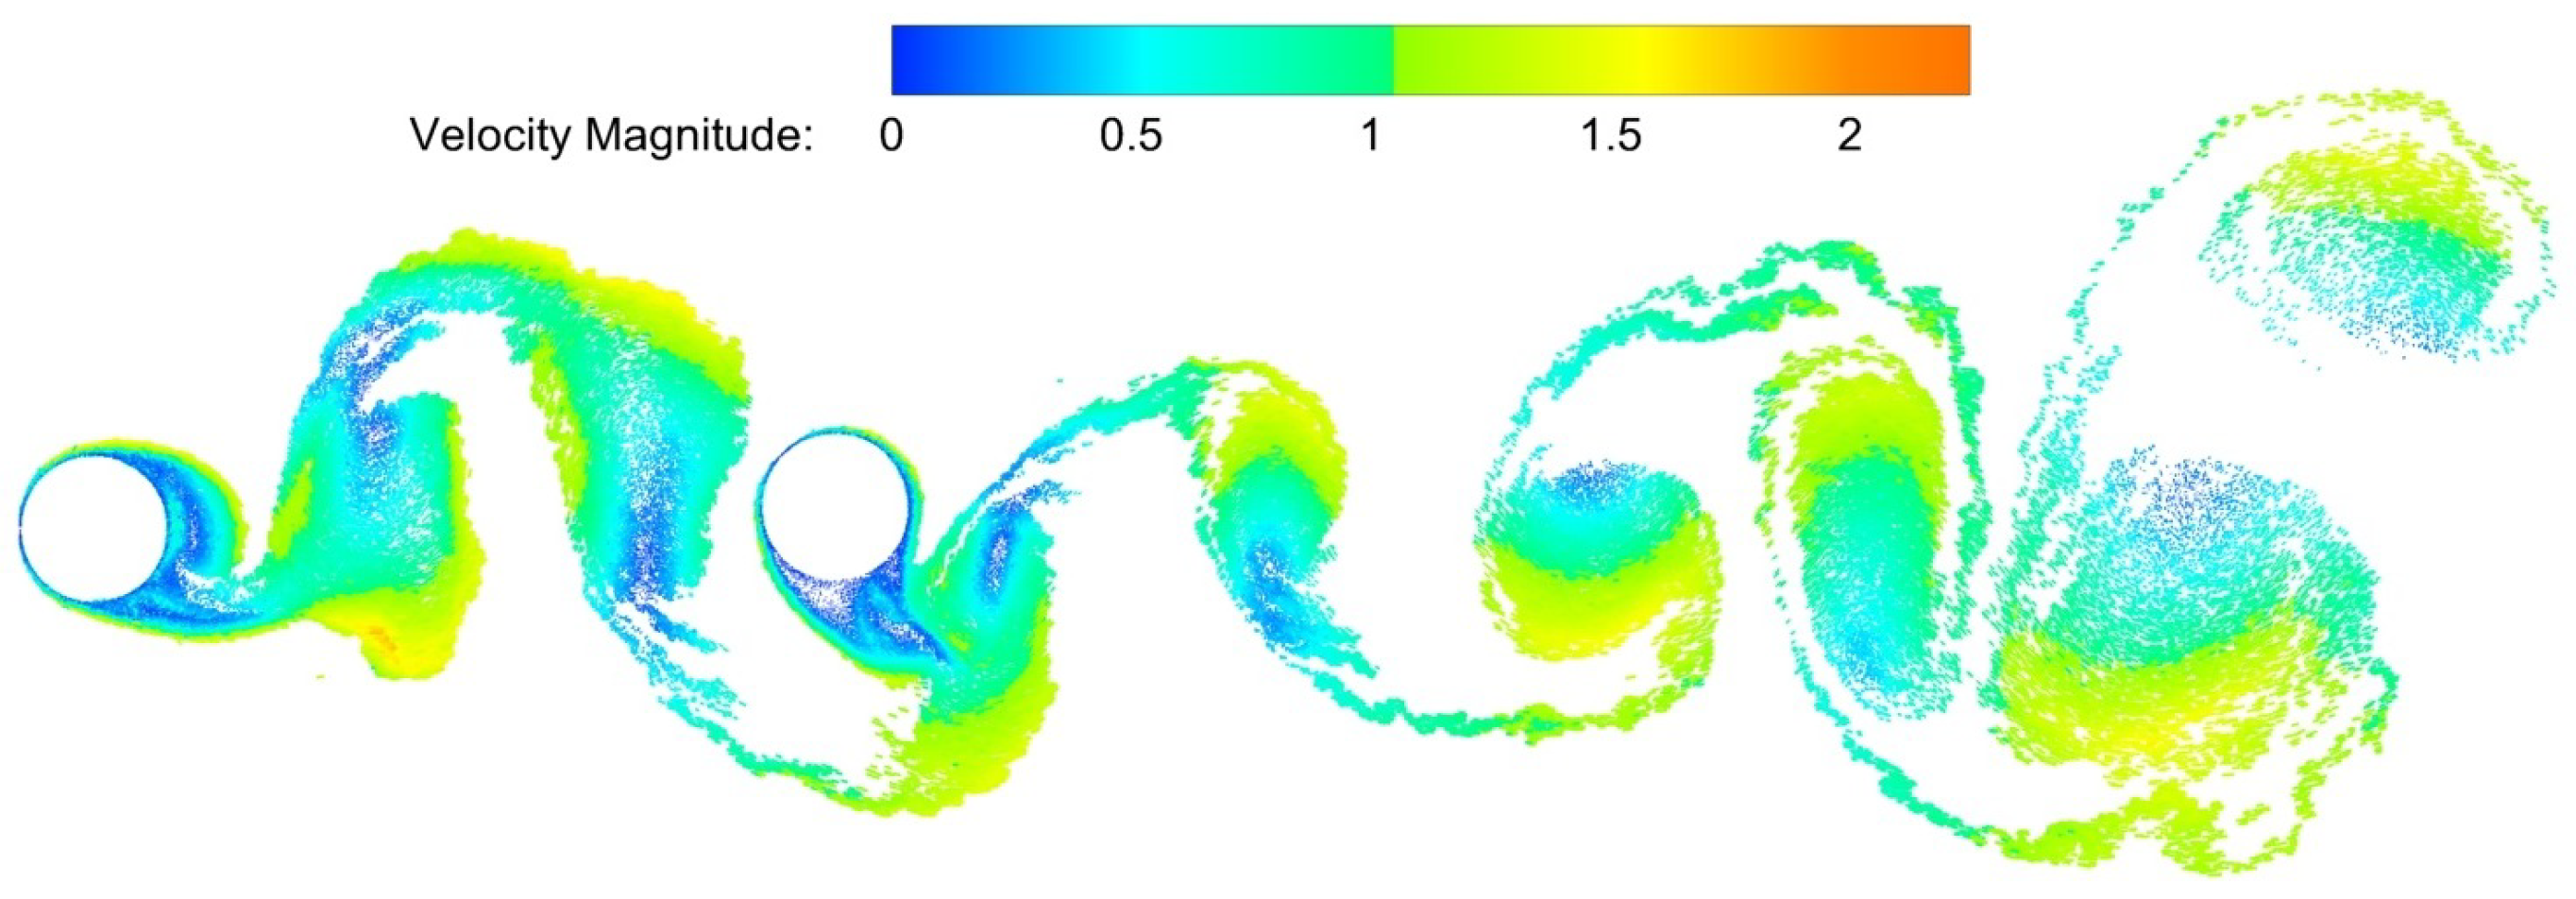
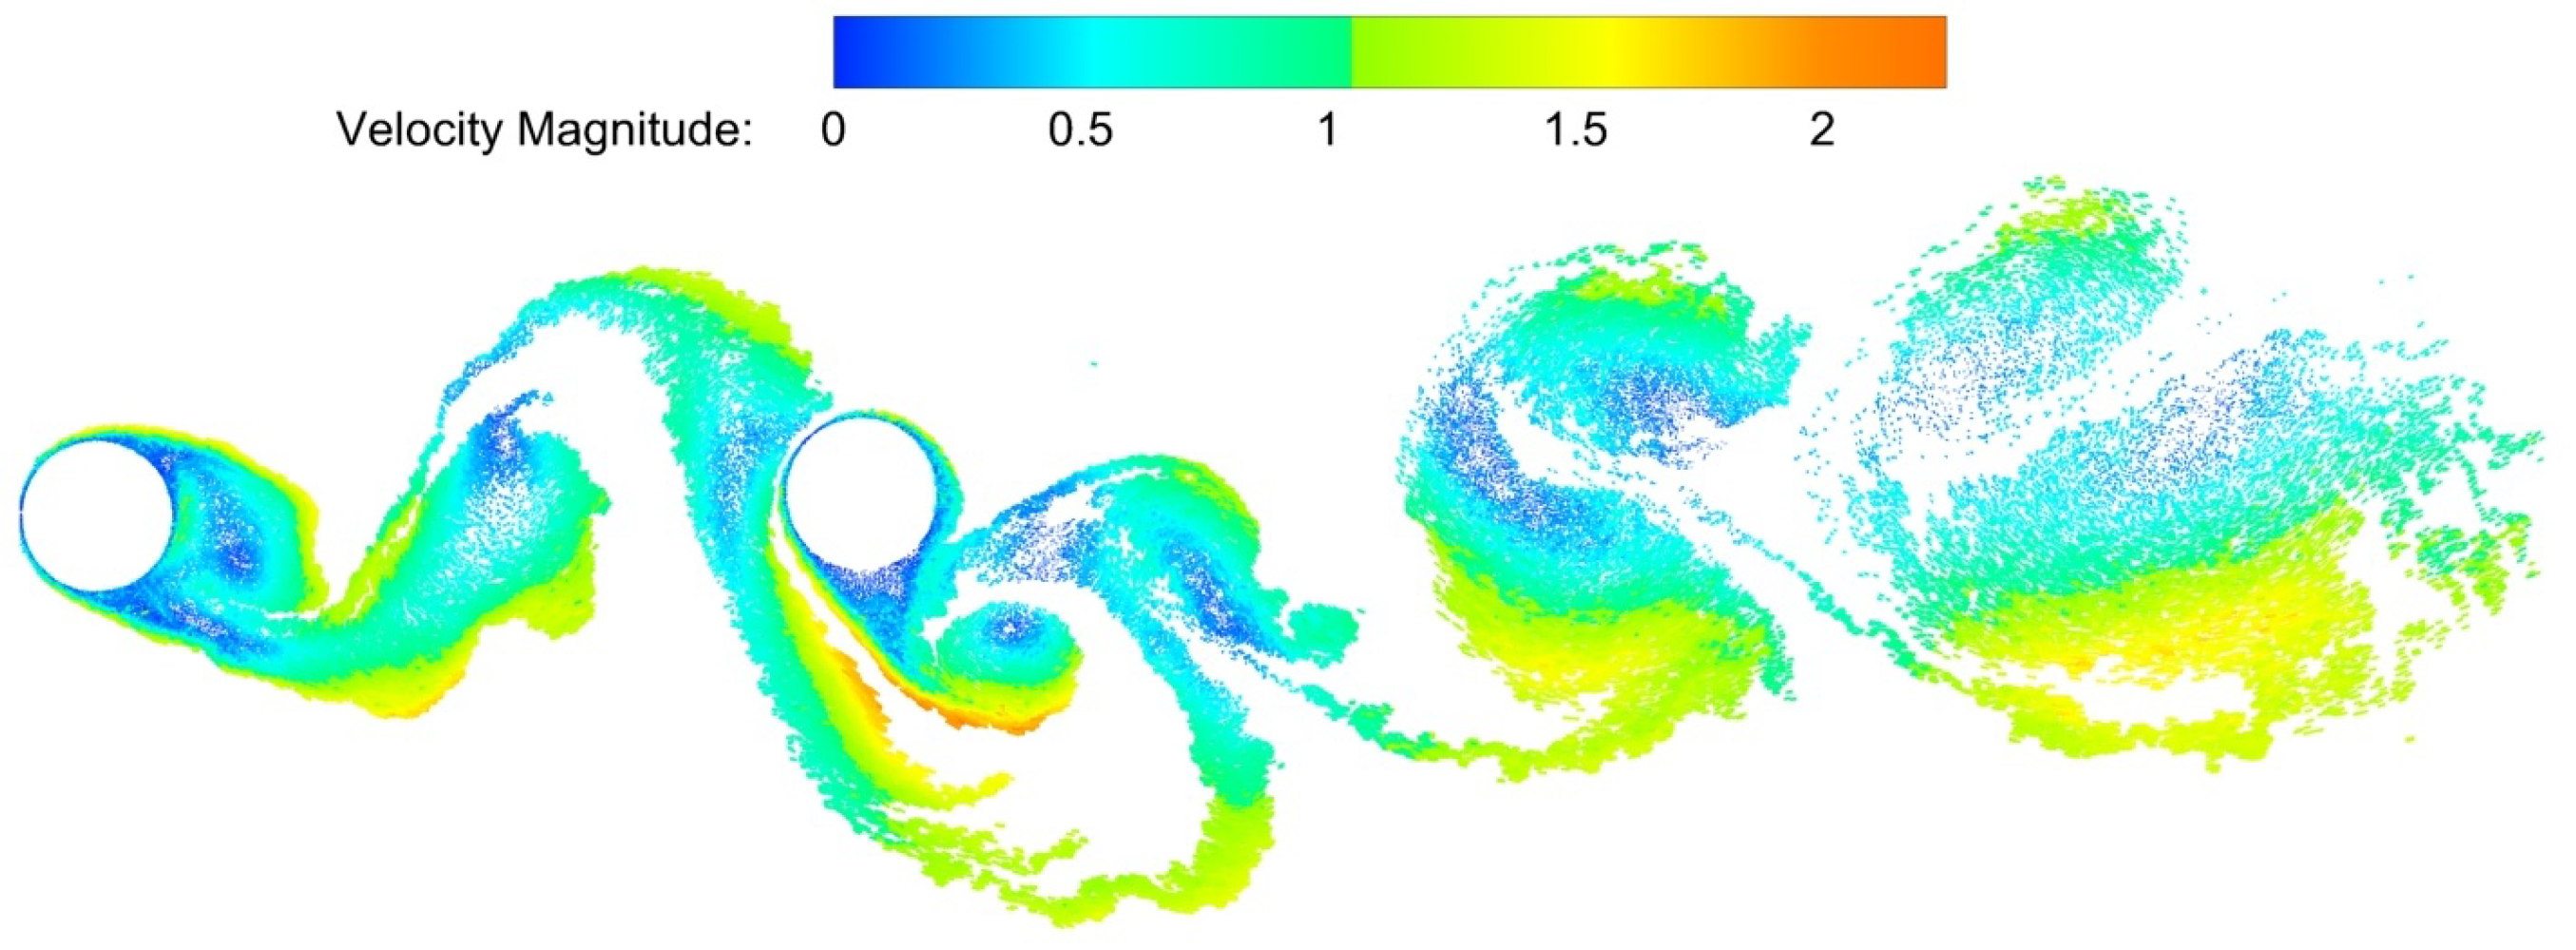
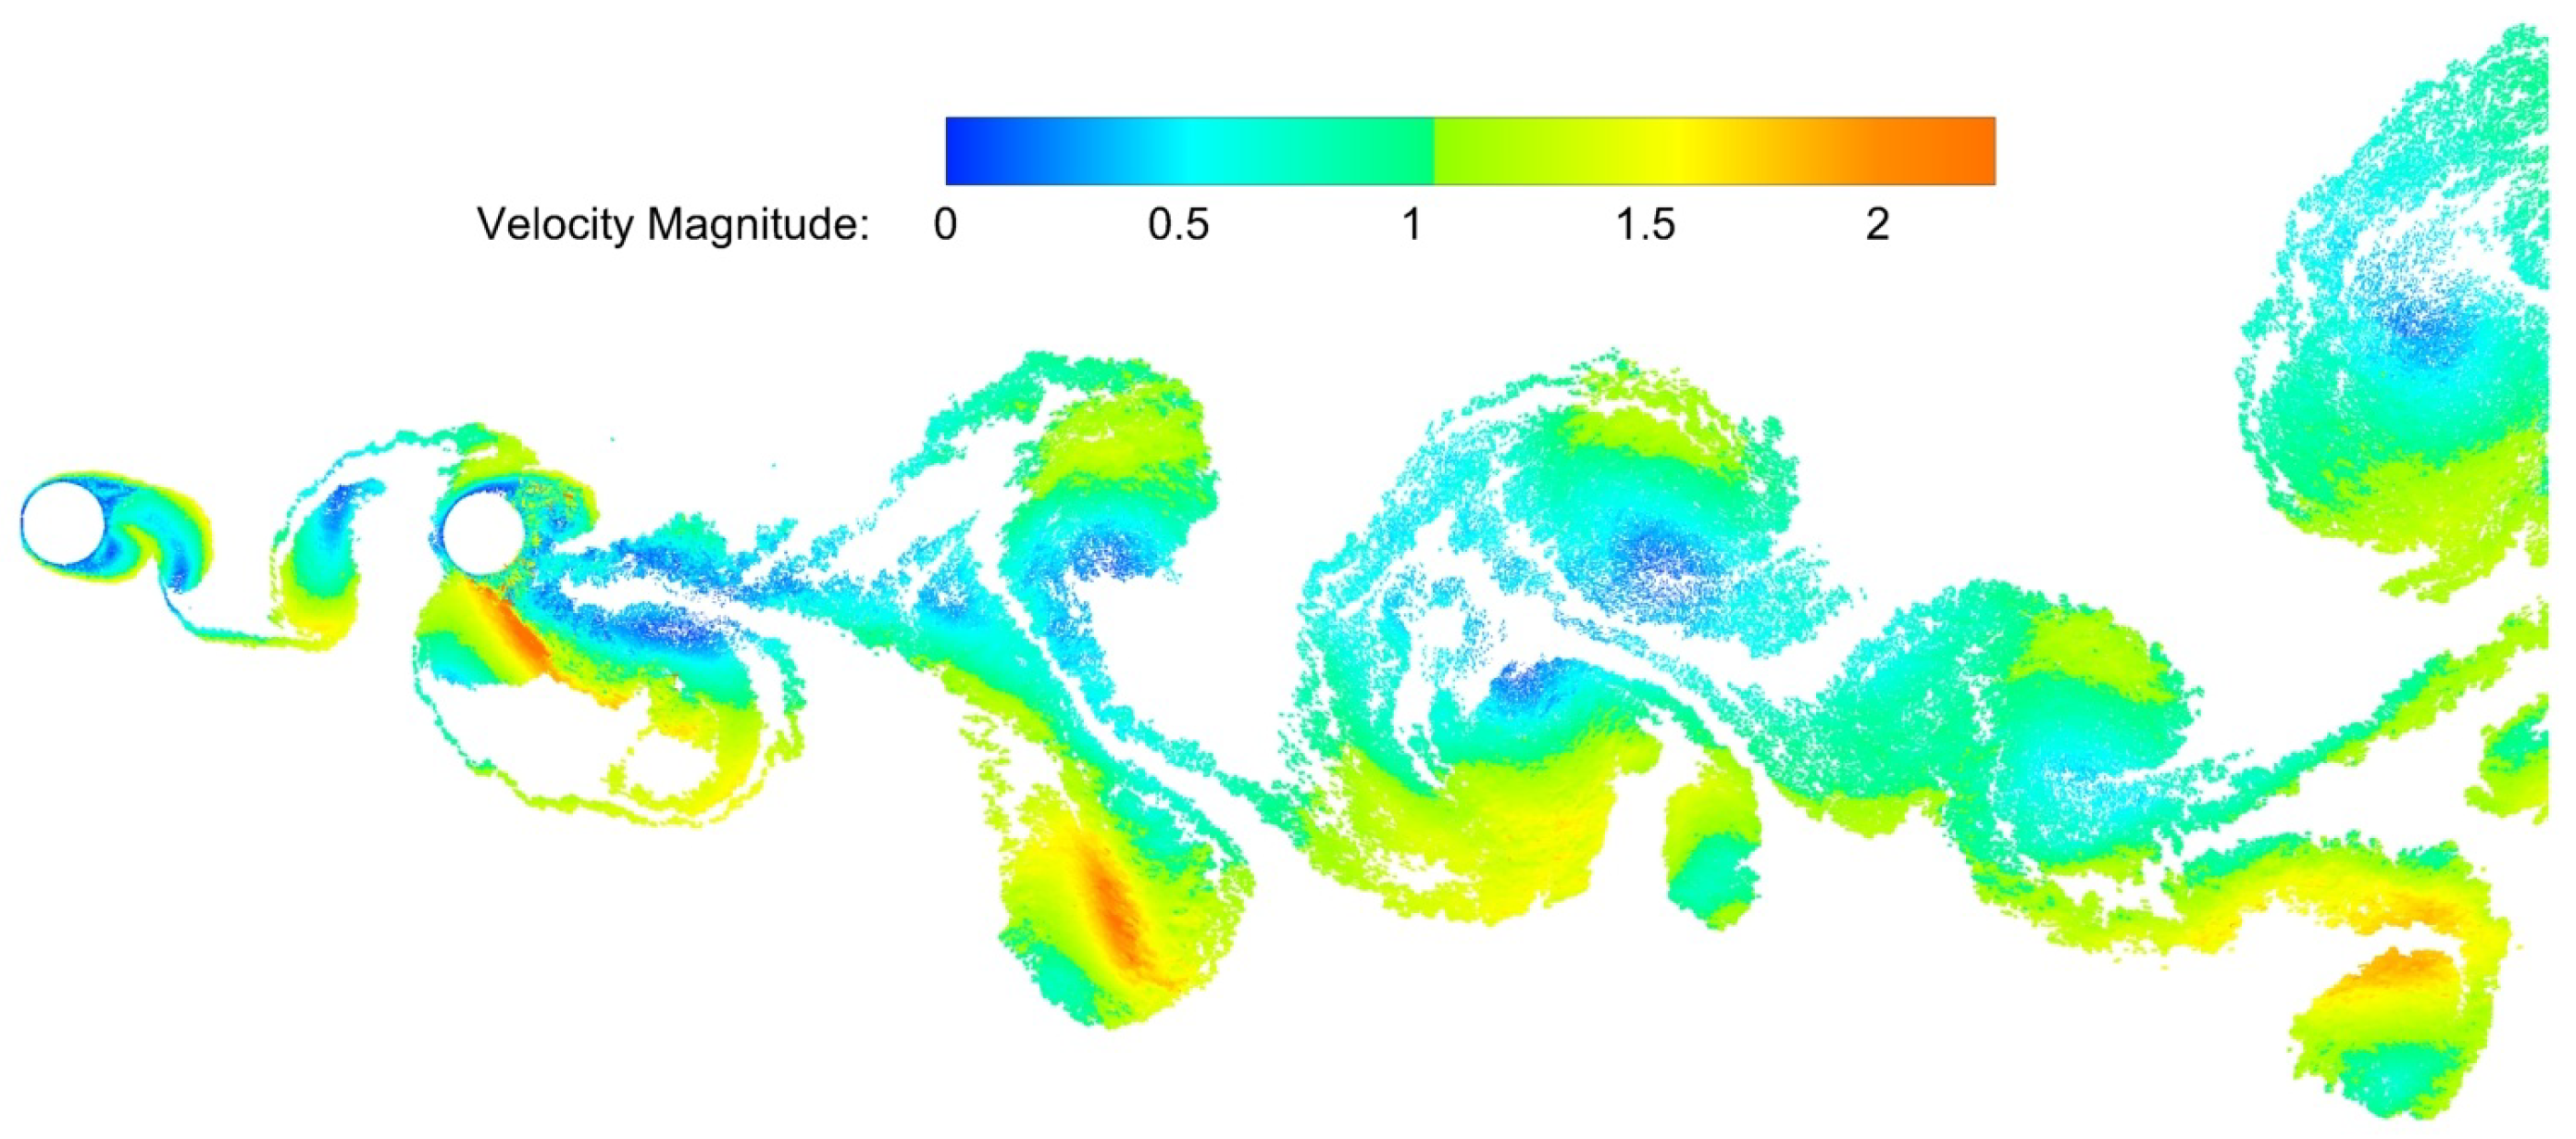
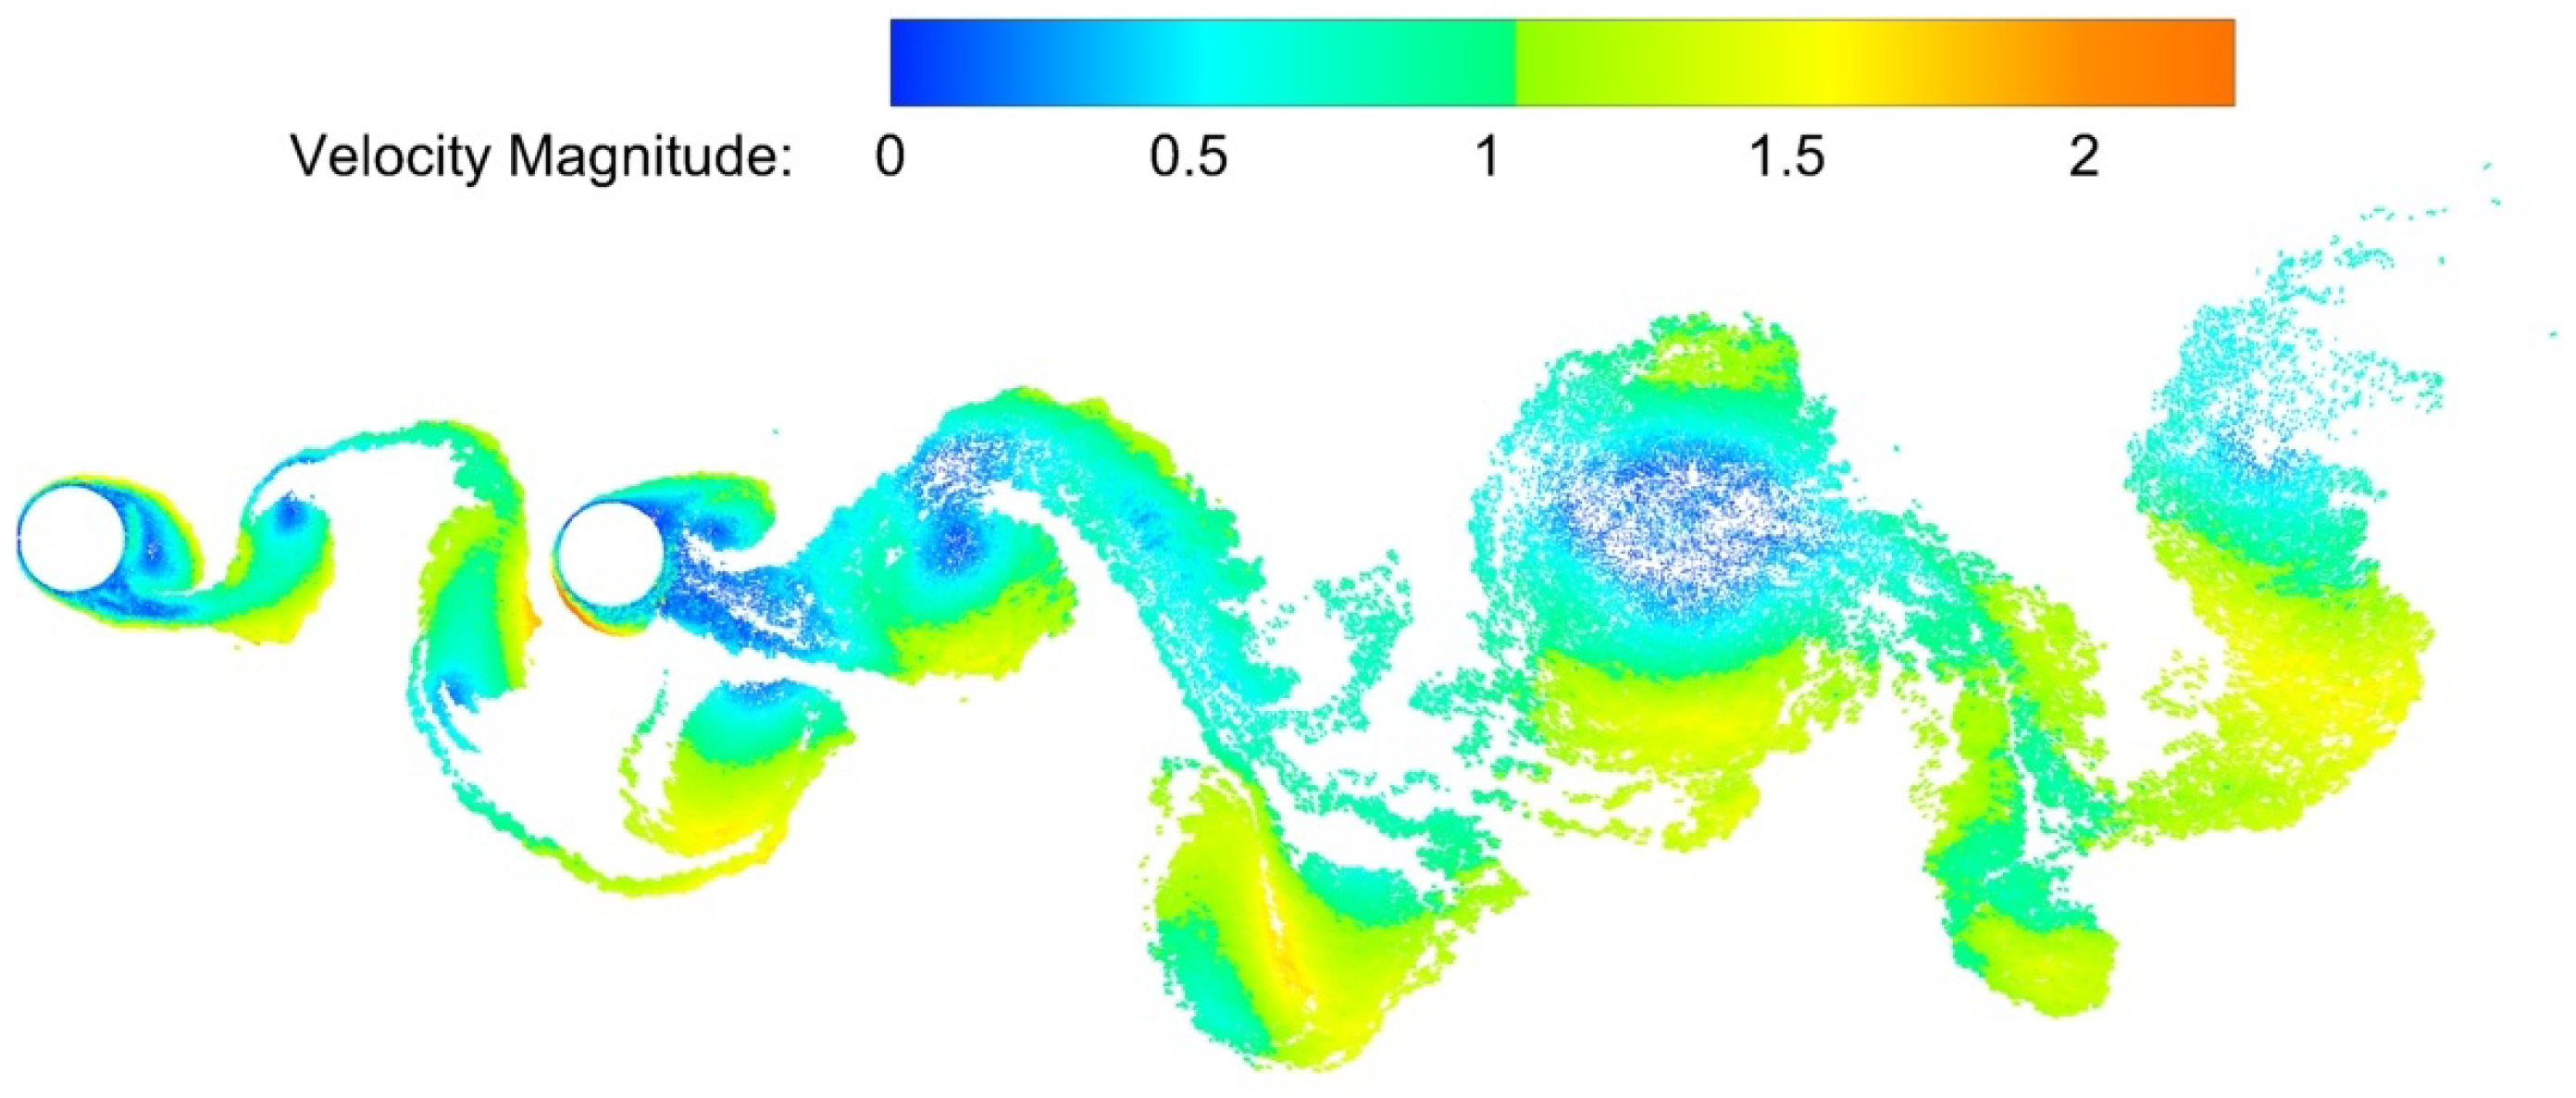
Figure 8 presents the vortical structure generated by the upstream cylinder interacting with the downstream cylinder to the dimensionless time 15. This instant is associated with point P in the lift coefficient time series shown in
Figure 8, through which the downstream cylinder reaches its maximum positive displacement. Therefore, this configuration may be interpreted as an initial stage of the interaction between the wake of the upstream cylinder and the oscillating solid boundary of the downstream cylinder.
It is observed in
Figure 8 that a vortical structure originating from the upstream cylinder crosses the lower region of the downstream cylinder, inducing velocities in the nascent vortical structures generated by the latter. The presence of a vorticity sheet connecting this structure to another large vortical structure originating from the upstream cylinder is also observed, and this second structure is about to interact with the solid boundary of the downstream cylinder.
Point
, corresponding the dimensionless time 38.6 in the lift coefficient time series presented in
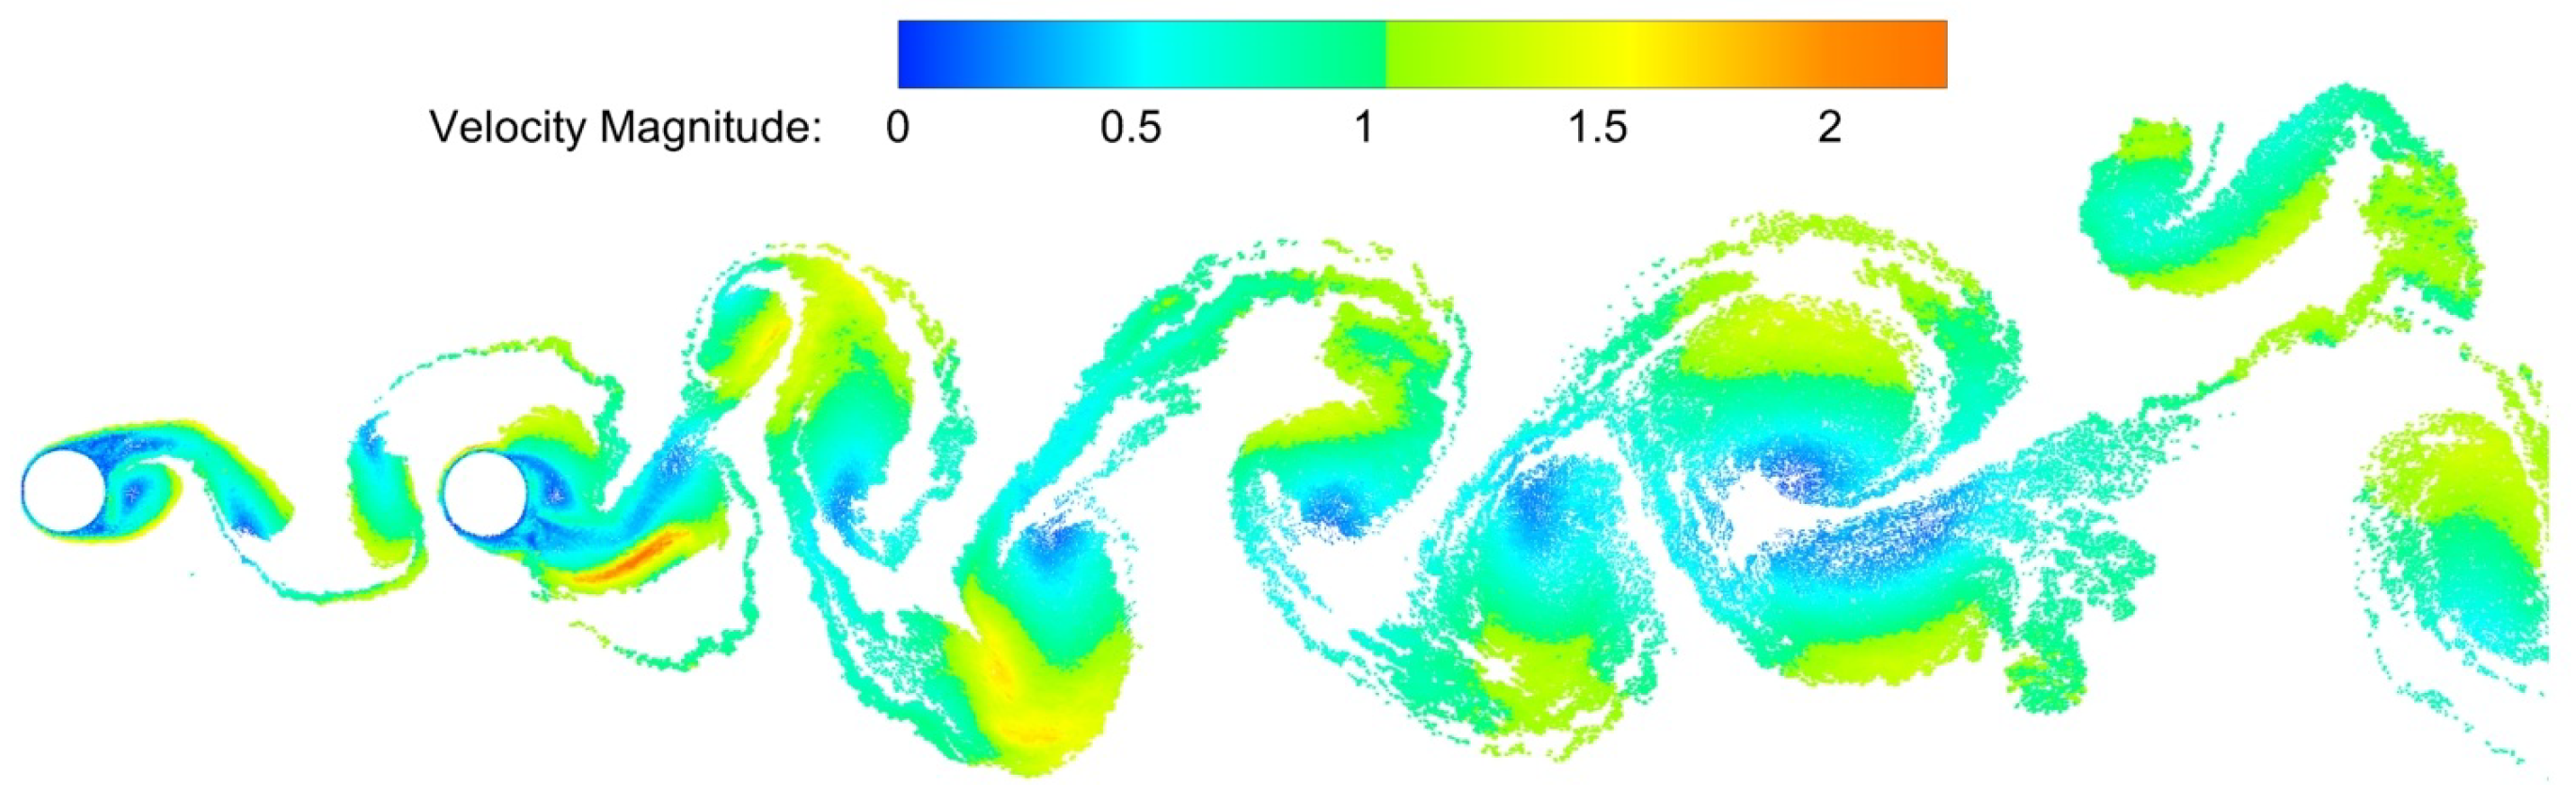
Figure 6, is associated with a high oscillation amplitude resulting from the interaction between the vortical structure shed from the upstream cylinder and the oscillating downstream cylinder.
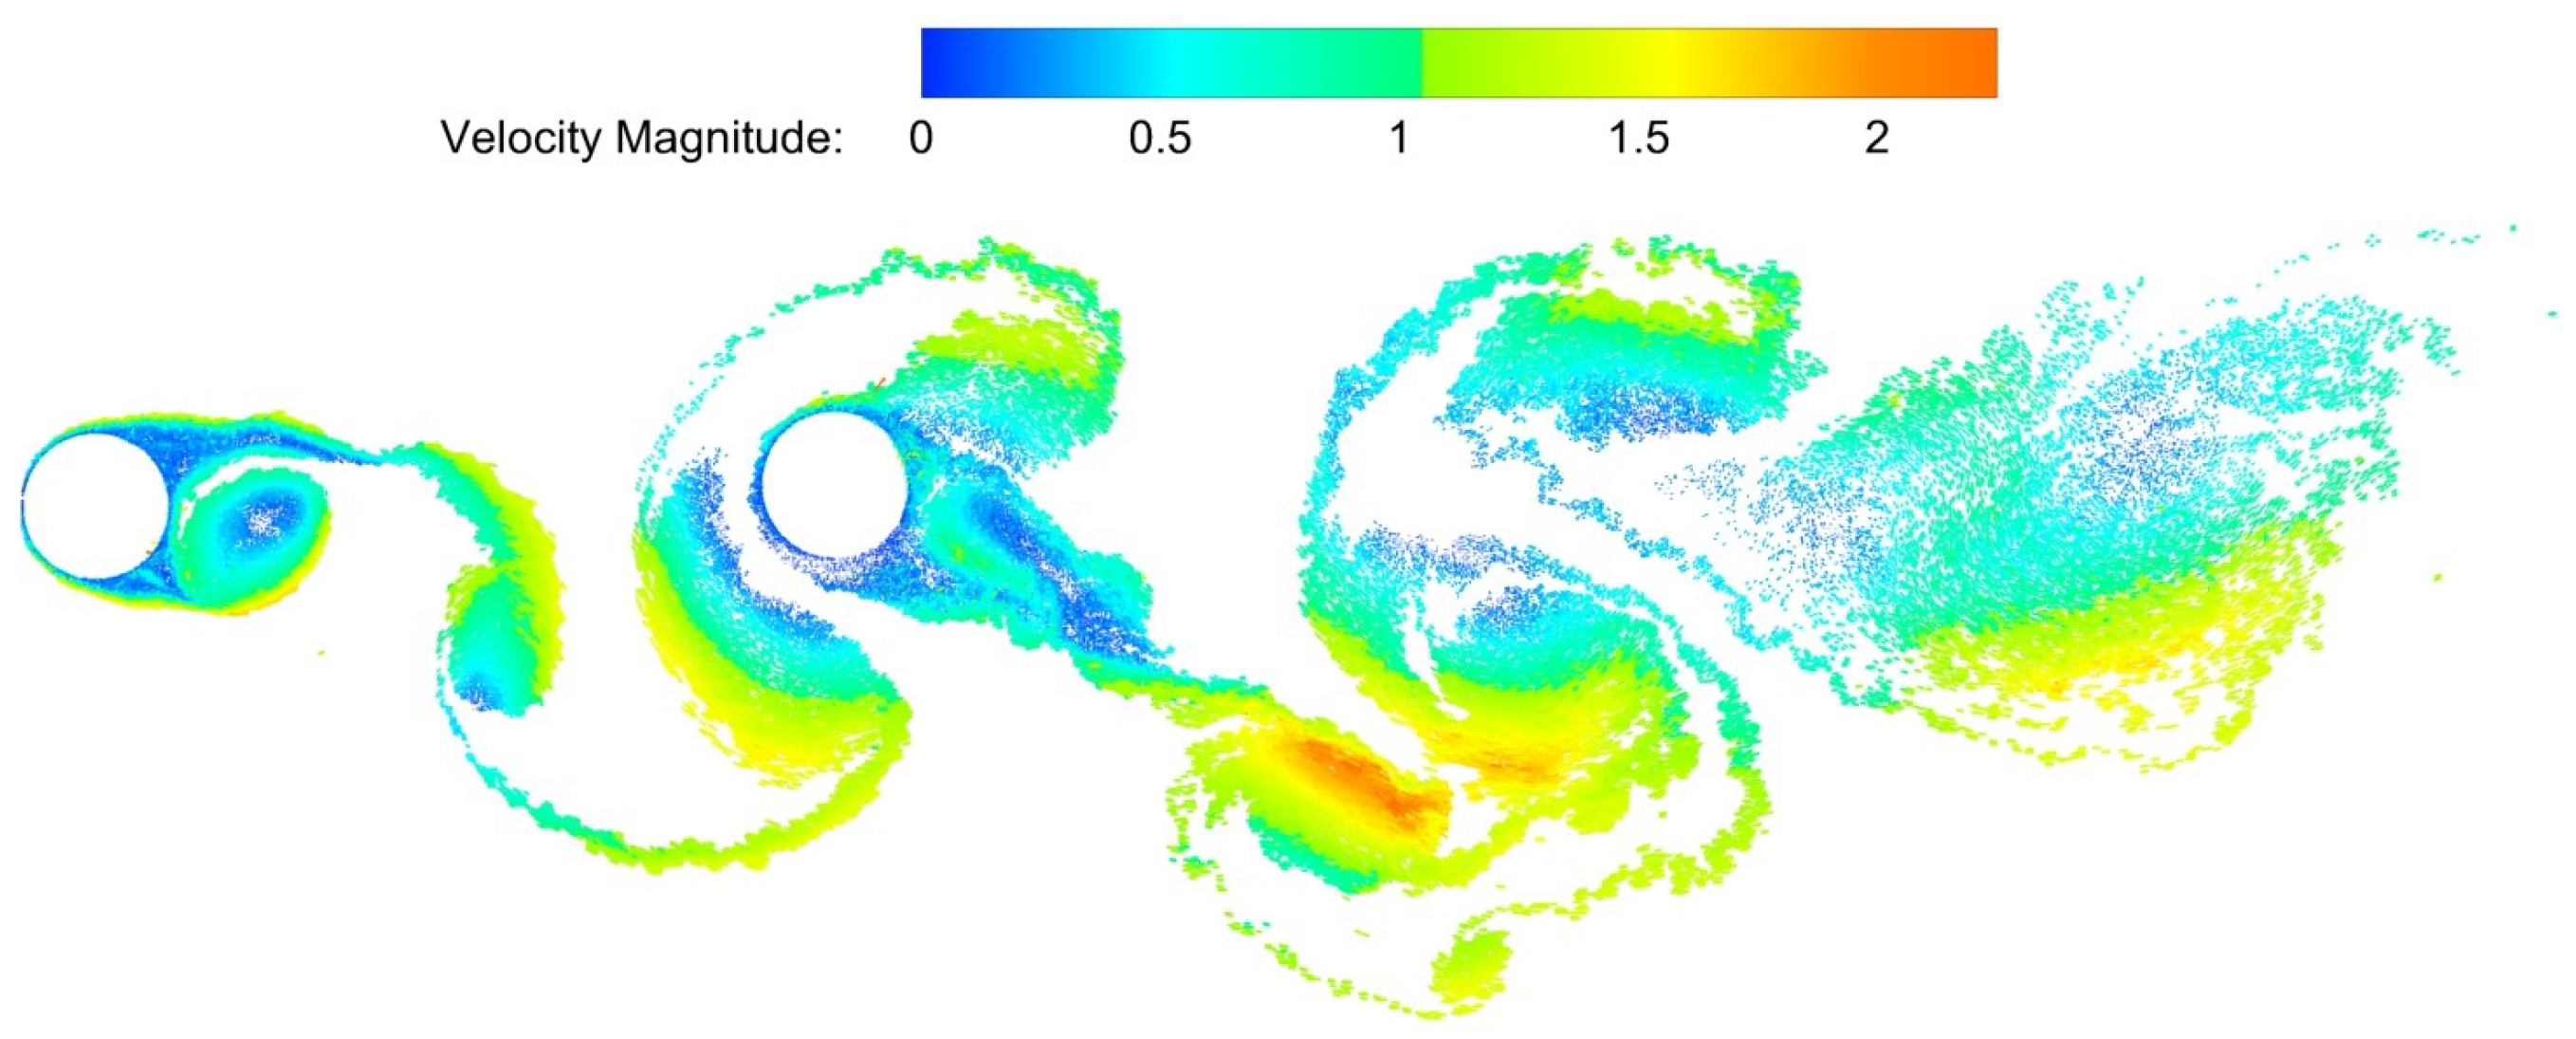
Figure 9 presents the visualization of this interaction at the instant corresponding to point
.
From
Figure 9, it is verified that at point
, a vortical structure crosses the upper region of the cylinder, inducing velocities in the flow and forming a zone of intense circulation. As a consequence, a high-amplitude peak is observed in the lift coefficient.
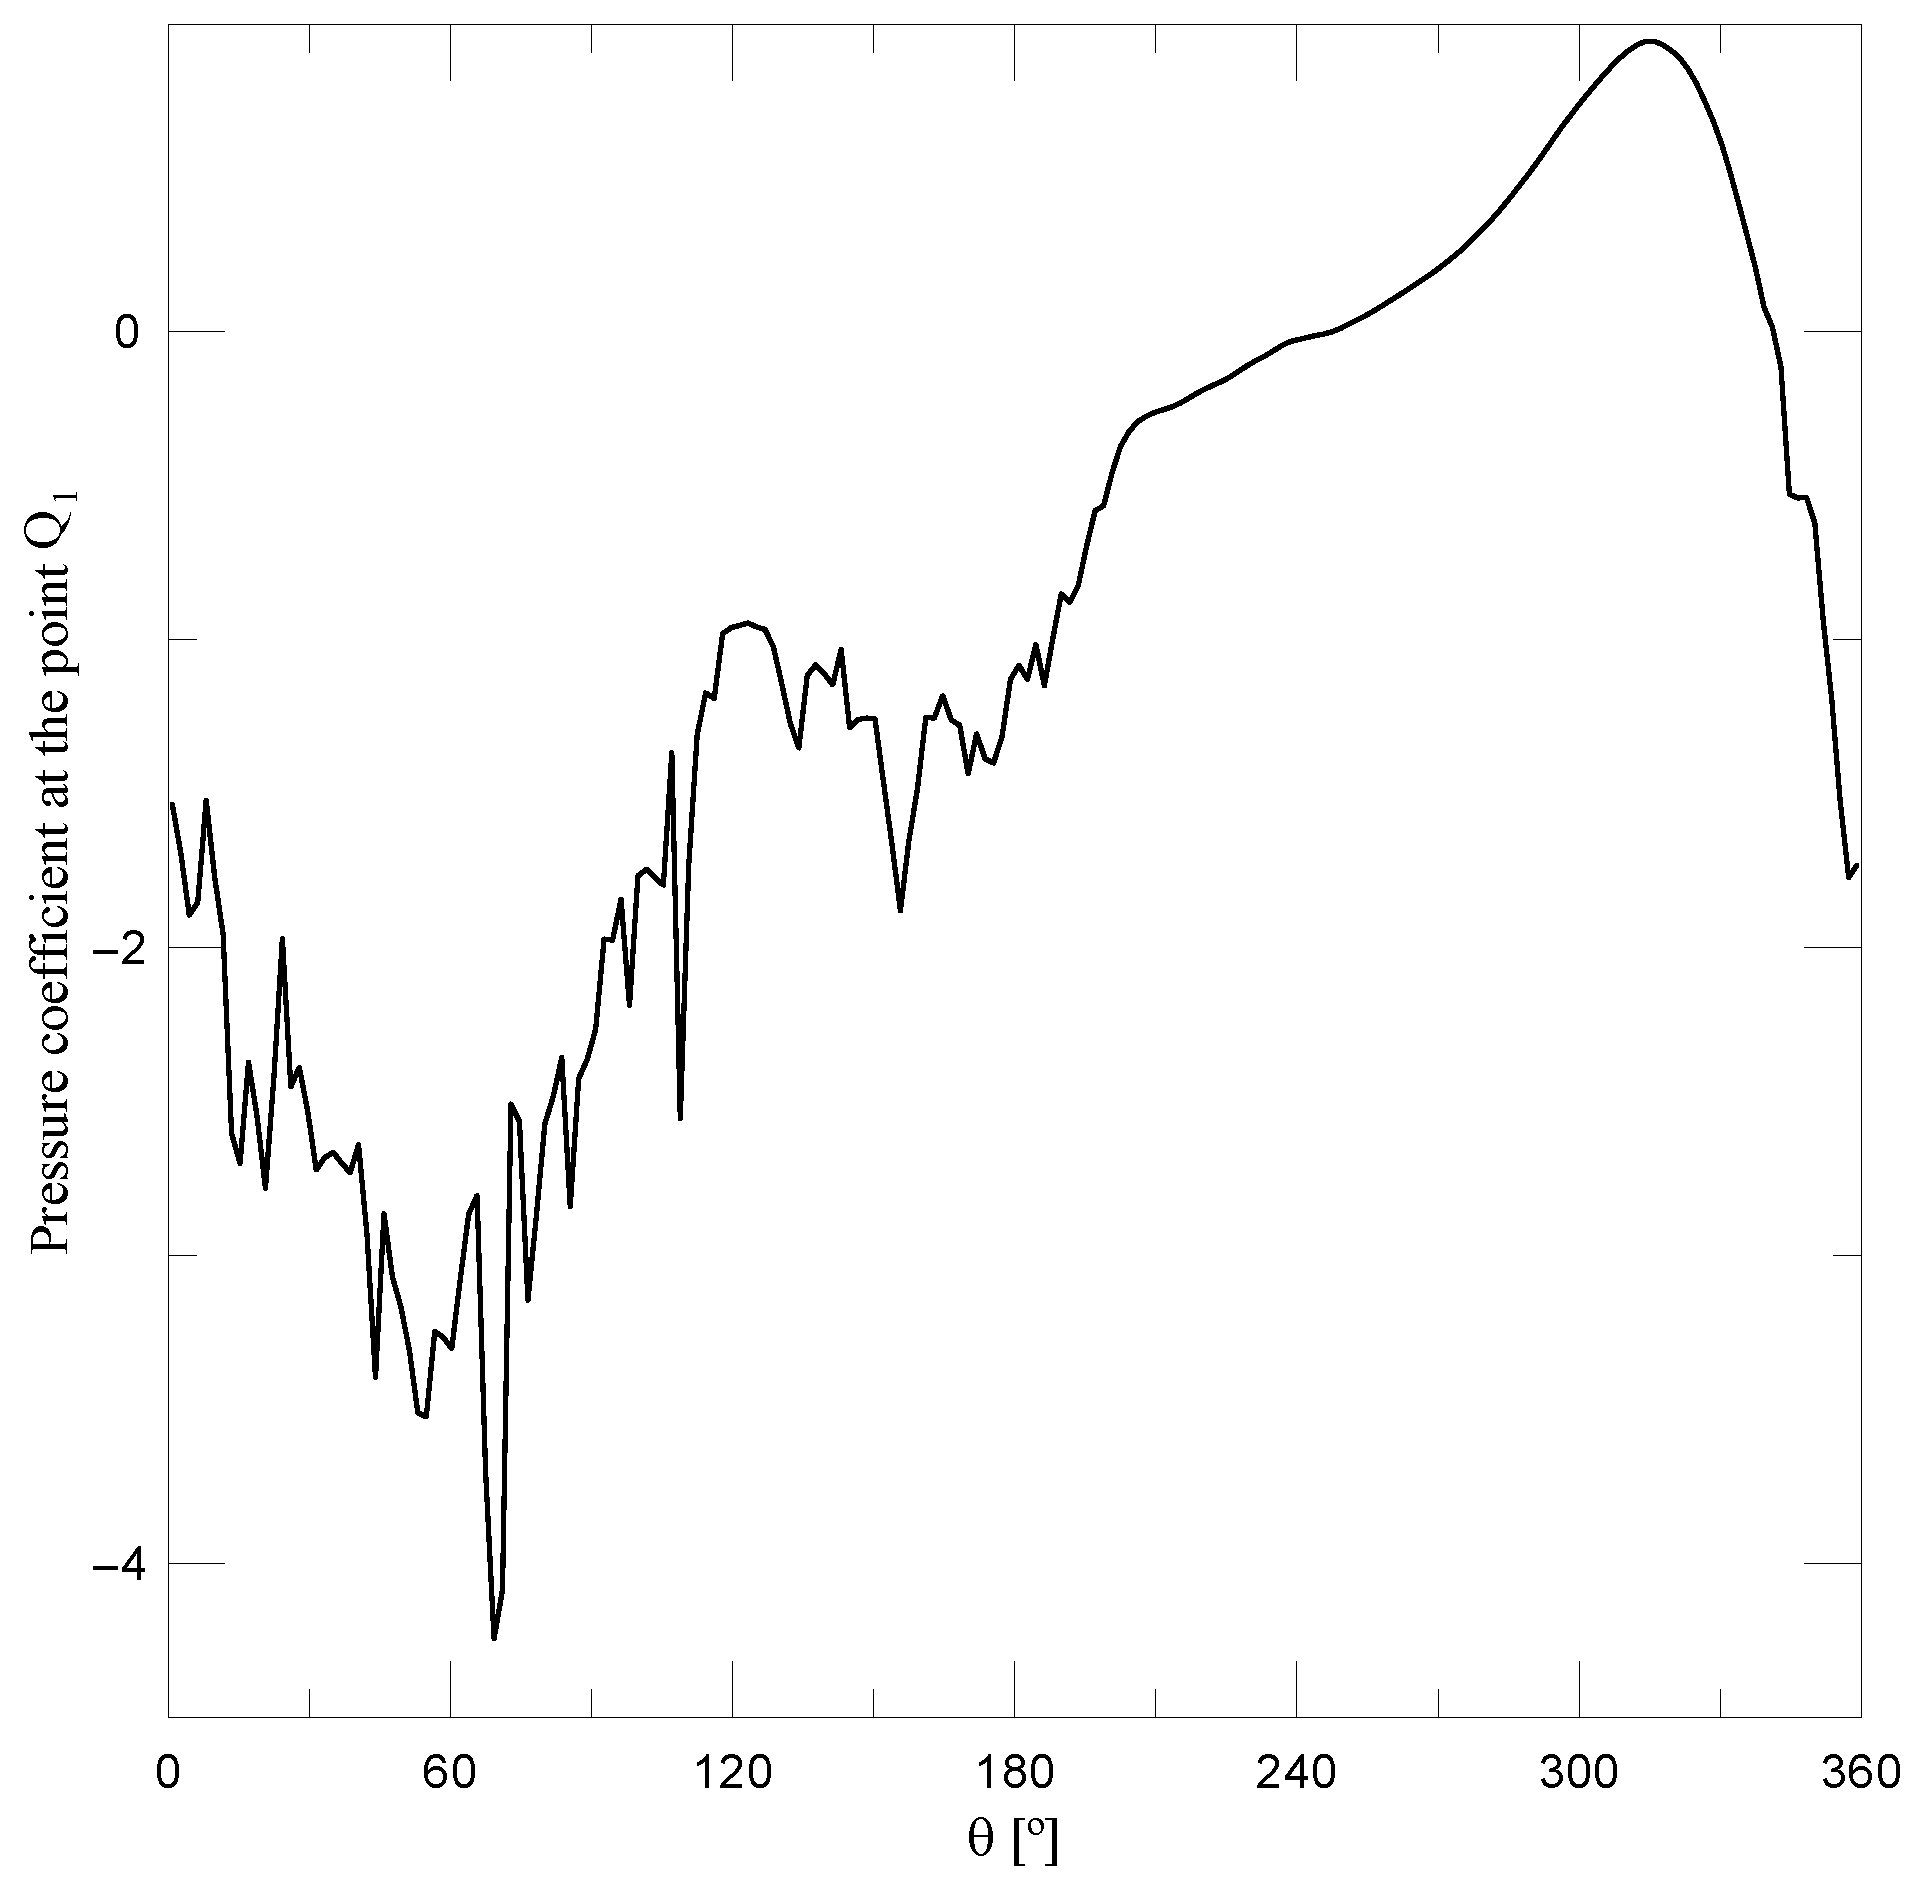
Additionally, the instantaneous pressure coefficient distribution as a function of angle
was analyzed at point
in order to investigate this portion of the lift coefficient time series in greater detail.
Figure 10 presents the instantaneous pressure coefficient curve corresponding to this point.
As shown in
Figure 10, intense negative fluctuations of the pressure coefficient are observed in the upper region of the cylinder, corroborating the interpretation that at this instant, a vortical structure originating from the upstream cylinder crosses this region, inducing velocities and promoting strong local circulation. This interaction substantially modifies the instantaneous pressure field, producing a pronounced suction region and leading to a global minimum of the pressure coefficient on this portion of the surface. As a consequence of this asymmetric pressure distribution, a positive lift force of high magnitude is generated.
The occurrence of these localized pressure fluctuations is therefore a consequence of the resolved unsteady vortical interaction and should not be associated with numerical noise or residual numerical oscillations. These fluctuations are directly related to the physical response of the flow in regions of intense vorticity and the strong local circulation generated by the interaction between the upstream wake and the oscillating downstream cylinder. In the present formulation, this behavior is captured by the Lagrangian vortex representation combined with the LES-based turbulence model, which accounts for the influence of unresolved turbulent scales on the transport and diffusion of vorticity. Thus, the localized variations of the pressure coefficient reflect the unsteady vortical dynamics resolved by the numerical method rather than a spurious numerical effect.
In the cases with nonzero roughness, the same LES-based framework also provides the local turbulent viscosity required by the roughness model near the wall. This coupling allows the roughness effects to modify the generation of nascent vortical structures and, consequently, the pressure redistribution around the downstream cylinder. Therefore, the pressure fluctuations observed in the present analysis are consistent with the physical mechanisms represented by the numerical formulation, especially in regions where strong vortical structures interact with the moving solid boundary.
4.4. Case 2: Downstream Circular Cylinder Oscillating Transversely with Roughness Effect—
The time series of the lift coefficient and the pressure coefficient distribution along the body surface were analyzed.
Figure 11 presents the time evolution of the lift coefficient together with the displacement and velocity curves.
Based on
Figure 11, it is observed that the action of the upstream-cylinder wake on the downstream cylinder interrupts the occurrence of lock-in. In addition, the manifestation of wake galloping, a phenomenon characteristic of
, is not observed. Its main feature is the synchronization between the lift coefficient and the oscillation velocity with coincidence between the peaks and valleys of CL and those of the velocity curve. Under this condition, there is a net positive transfer of energy from the fluid to the body.
However, this behavior is not observed for the roughness height analyzed. After approximately the dimensionless time , when the coincidence between the valleys of the lift coefficient and those of the displacement curve associated with lock-in ceases to occur, a behavior opposite to wake galloping is identified: the peaks of the lift coefficient coincide with the valleys of the velocity curve, while the valleys of coincide with the peaks of that same curve. Therefore, by definition, this regime does not characterize wake galloping but rather a behavior opposite to the mechanism of net positive energy transfer from the fluid to the body.
For the analyzed case, the mean lift coefficient was
, whereas the Strouhal number, obtained by applying the FFT to the lift coefficient time series, was
. In addition, the presence of a second relevant frequency was observed in the spectrum with a value of 0.2329. The joint analysis of these frequencies indicates the absence of synchronization in the dimensionless time interval from 30 to 50. This result is consistent with the flow behavior during this period, in which, under the influence of the wake of the upstream cylinder on the downstream cylinder, neither the lock-in phenomenon nor wake galloping is observed. The results obtained from the application of the FFT to the lift coefficient curve are presented in
Figure 12.
As shown in
Figure 12, two relevant peaks are observed in the frequency spectrum obtained from the lift coefficient time series. However, neither of these frequencies approaches the imposed oscillation frequency, evidencing the absence of synchronization. This result reinforces the interpretation that for the roughness height
, synchronization associated with either the lock-in phenomenon or wake galloping does not occur. Thus, this case exhibits behavior distinct from the other cases analyzed, even indicating an apparent response opposite to that observed in wake galloping.
The response observed for may be interpreted as a transitional behavior between the hydraulically smooth configuration, in which the wake-induced response becomes clearly established after the interaction with the upstream wake, and the rougher case, , in which the lock-in mechanism becomes more persistent over a significant portion of the time series. Therefore, this roughness level does not lead to a purely dominated regime nor does it promote a predominantly like response. Instead, it disturbs the phase relation required for wake galloping while not establishing a stable synchronization between the lift coefficient and the imposed displacement of the downstream cylinder.
In this sense, the designation “Opposite WIV” is used to describe a wake-induced response in which the phase relation between the lift coefficient and the oscillation velocity is contrary to that expected in a wake-galloping regime. In classical wake-galloping behavior, the lift force tends to remain in phase with the transverse velocity of the body, favoring a positive aerodynamic energy transfer from the fluid to the structure. For , however, the opposite trend is observed: the peaks of the lift coefficient tend to coincide with the valleys of the velocity curve, whereas the valleys of tend to coincide with the velocity peaks. This anti-phase behavior indicates that the incoming wake still governs the aerodynamic loading, but the resulting force does not reinforce the prescribed motion in the manner typically associated with .
From a physical standpoint, this behavior suggests that the intermediate roughness modifies the near-wall vorticity generation and the local pressure redistribution around the downstream cylinder, altering the way in which the incident vortical structures interact with the moving surface. The upstream wake continues to induce strong unsteady pressure fluctuations; however, the roughness level promotes an irregular balance between suction and pressure-recovery regions on the upper and lower portions of the cylinder. Consequently, the aerodynamic force loses a stable phase relationship with both the displacement and the velocity of the body. The presence of two relevant spectral peaks further supports this interpretation, indicating that the flow response is governed by competing unsteady mechanisms rather than by a single dominant synchronized regime.
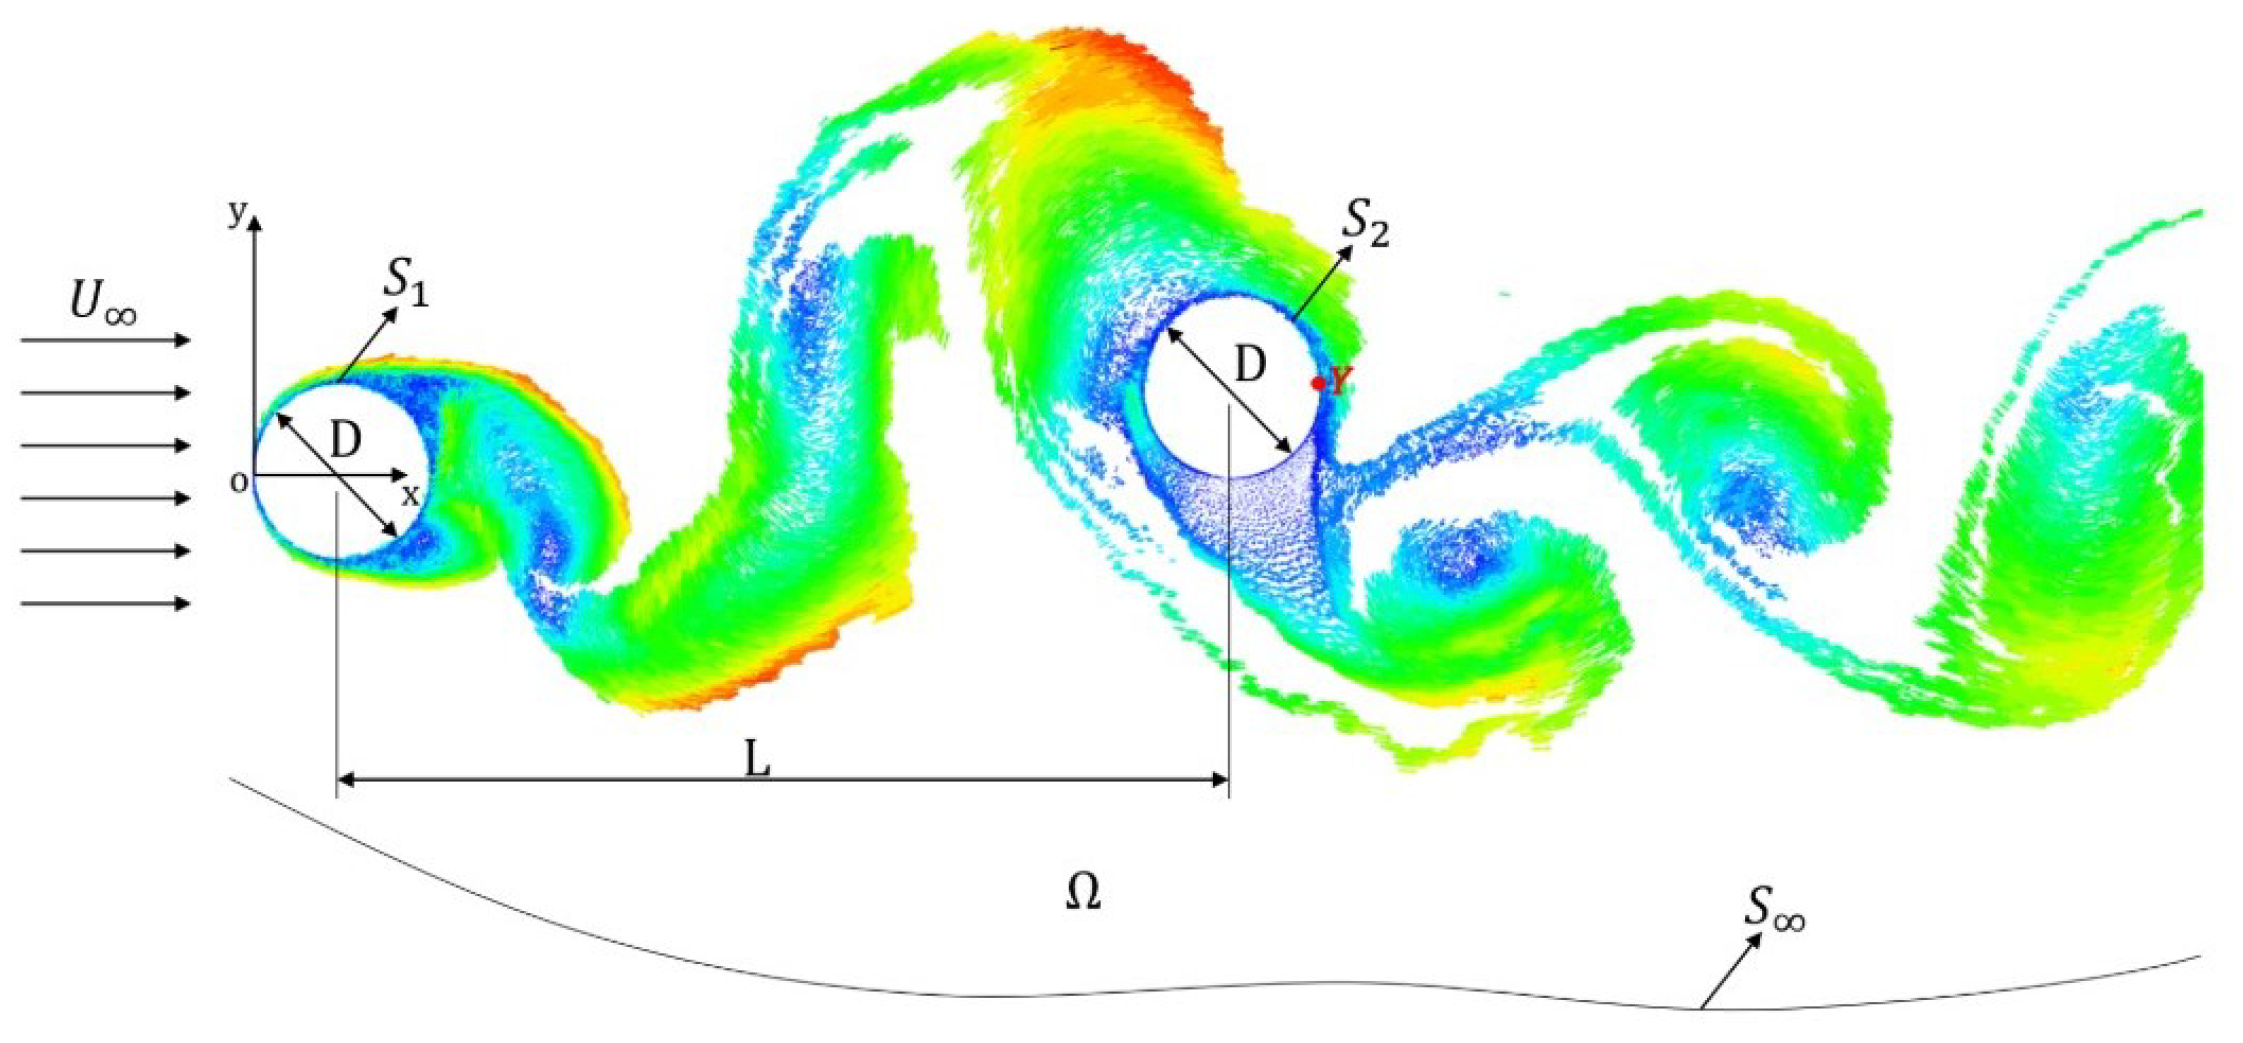
Figure 13 presents the vortical structure generated by the upstream cylinder interacting with the oscillating downstream cylinder with surface roughness
to the dimensionless time
. This instant is associated with point
P, of maximum positive displacement, in the lift coefficient time series. Therefore, this configuration may be interpreted as an initial stage of the interaction between the wake of the upstream cylinder and the oscillating solid boundary of the downstream cylinder.
It is observed in
Figure 13 that a vortical structure originating from the upstream cylinder crosses the lower region of the downstream cylinder, inducing velocities in the nascent vortical structures generated in this region. Simultaneously, another vortical structure from the upstream cylinder is observed that is about to cross the upper region of the downstream cylinder. This arrangement promotes a balance of velocity induction between the lower and upper regions of the body, favoring the equalization of the pressure field and resulting in a lift coefficient close to zero. This behavior is consistent with that observed at point P in the lift coefficient time series presented in
Figure 11. In addition, the interaction between the vortical structures of the upstream and downstream cylinders, connected by vorticity sheets, is evident.
Point
, corresponding to the dimensionless time
in the lift coefficient time series shown in
Figure 11, is characterized by a high-amplitude peak associated with the interaction between a vortical structure shed from the upstream cylinder and the oscillating downstream cylinder.
Figure 14 presents the visualization of this interaction at the instant corresponding to point
.
From
Figure 14, it is observed that at point
, a vortical structure originating from the upstream cylinder begins to cross the upper region of the downstream cylinder, inducing velocities in the nascent vortices of this region. Another vortical structure from the upstream cylinder that has already crossed the lower region of the downstream cylinder is also observed, although it is farther from the body wall. These velocity inductions generate a zone of intense circulation and, consequently, a reduction in pressure in this region, resulting in a peak in the lift coefficient.
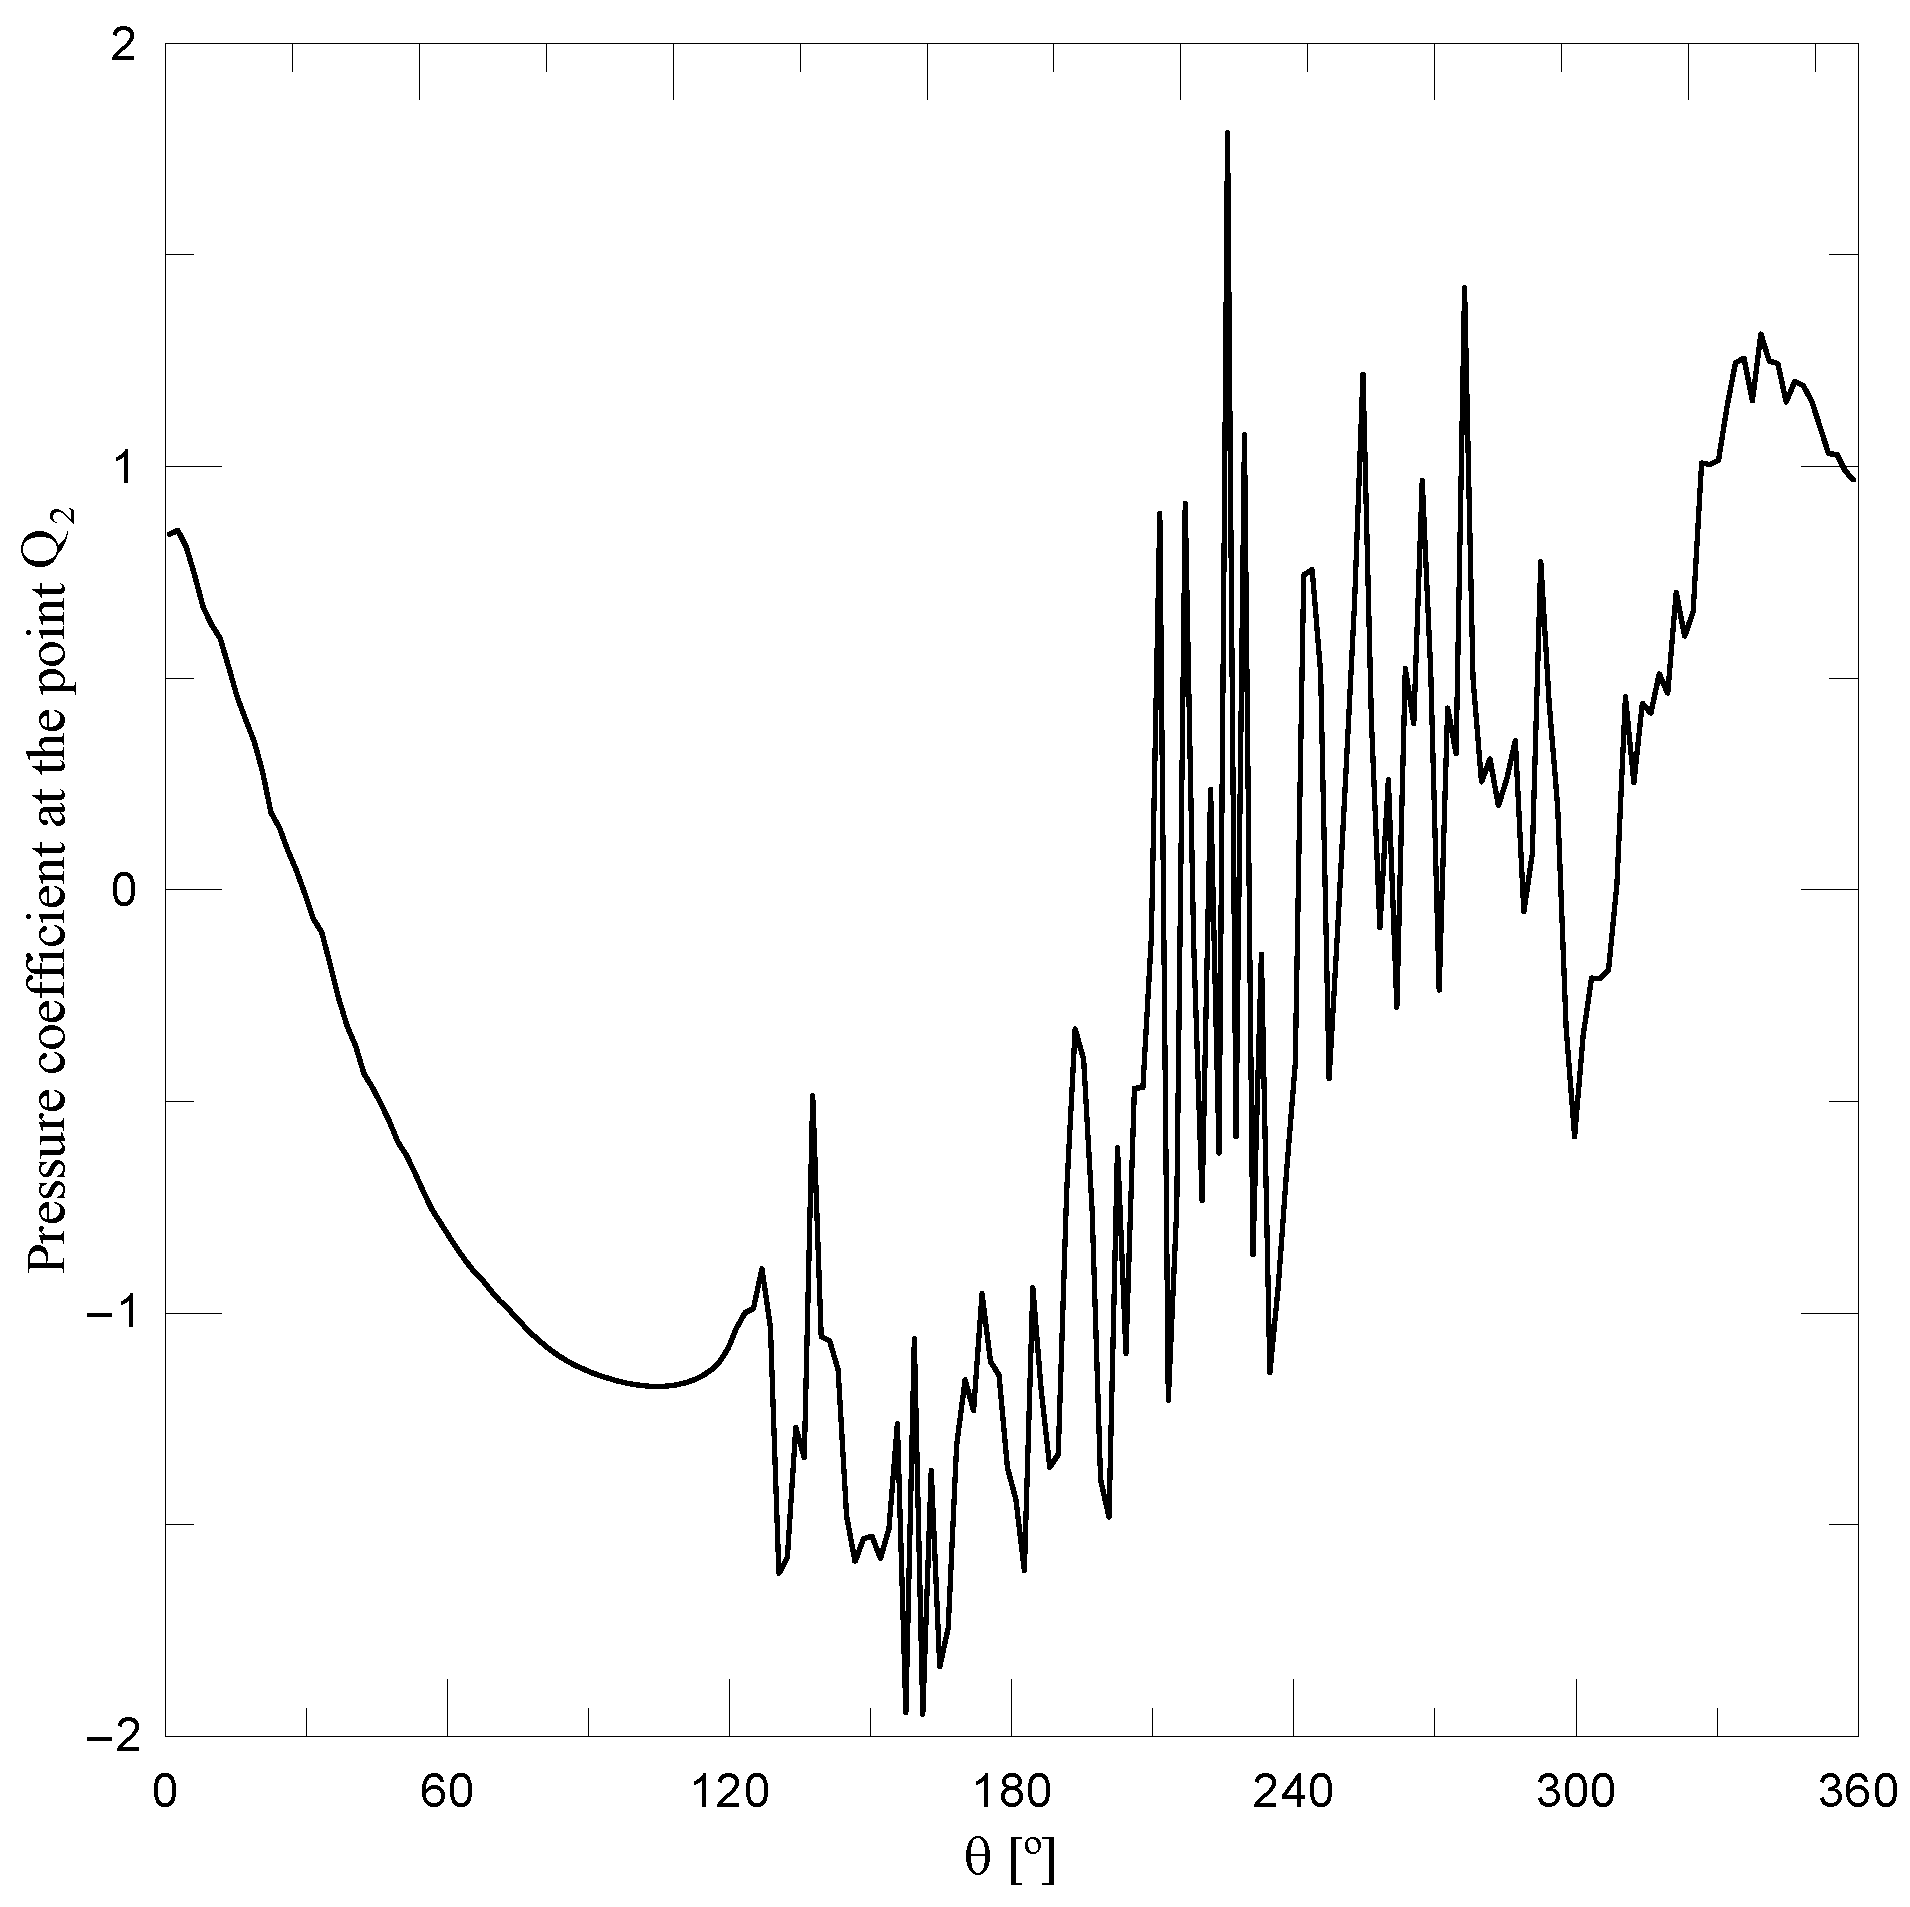
In order to investigate the behavior observed at point
in greater detail, the instantaneous pressure coefficient distribution as a function of angle
was analyzed at this instant. This analysis allows the pressure distribution along the surface of the downstream cylinder to be evaluated and the mechanisms associated with the identified
peak to be understood more rigorously.
Figure 15 presents the instantaneous pressure coefficient curve corresponding to this point, highlighting the regions of suction and pressure recovery around the cylinder, as well as the effects of the interaction between the vortical structures from the upstream cylinder and the nascent structures on the downstream cylinder.
It is observed that at point , corresponding to a peak in the lift coefficient time series, a pronounced pressure drop occurs on the upper surface of the downstream cylinder. In addition, intense pressure fluctuations are observed as a result of the combined action of the wake generated by the upstream cylinder, the prescribed transverse motion of the downstream cylinder, and the surface roughness effects. This coupling favors pressure recovery in the lower region of the body; however, this recovery is not smooth or uniform along the surface. Instead, it occurs in a strongly unsteady manner with significant local variations in the pressure coefficient. Thus, although there is a tendency for pressure to increase in this region, the pressure field remains highly irregular due to the interaction between the incident vortical structures and the rough oscillating surface.
The occurrence of these intensified pressure fluctuations should not be interpreted as numerical noise or residual numerical oscillations. Rather, they are associated with the physical response of the flow to regions of intense vorticity and strong local circulation generated by the wake–body interaction. For the roughness height , this behavior becomes more pronounced because the roughness modifies the near-wall vorticity generation and changes the way in which the incoming wake interacts with the downstream-cylinder surface. Within the set of roughness heights investigated in this paper, this case represents a transitional response between the smooth configuration, in which the wake-induced vibration mechanism is more clearly established, and the rougher case, , in which the lock-in mechanism becomes more persistent. Therefore, the stronger pressure fluctuations observed for are consistent with the transitional character of this response and with the previously identified behavior opposite to the classical /wake-galloping regime.
In the present formulation, these localized variations of the pressure coefficient are captured by the Lagrangian vortex representation combined with the LES-based turbulence model and the roughness model applied to the downstream cylinder. The LES framework accounts for the influence of unresolved turbulent scales on the transport and diffusion of vorticity, while the roughness model uses the local turbulent viscosity near the wall to modify the generation of nascent vortical structures. Consequently, the intensified fluctuations observed in the pressure coefficient are a physical consequence of the modeled interaction among the wake interference, forced transverse motion, and surface roughness. This interpretation supports the conclusion that for , the aerodynamic loading is governed by competing unsteady mechanisms rather than by a single synchronized or -dominated regime.
4.5. Case 3: Downstream Circular Cylinder Oscillating Transversely with Roughness Effect— = 0.01
Figure 16 presents the time evolution of the lift coefficient together with the displacement and velocity curves. Based on these results, the localized occurrence of lock-in is identified, which is a phenomenon characteristic of
that is associated either with the synchronization between the lift coefficient and the displacement of the cylinder or with the proximity between the vortex-shedding frequency and the imposed oscillation frequency.
Based on
Figure 16, it is observed that at the beginning of the time series, the lock-in phenomenon occurs up to approximately the dimensionless time
. Within this interval, the wake of the upstream cylinder does not yet exert a significant influence on the fluid-dynamic loads acting on the downstream cylinder. From
onward, the localized manifestation of wake galloping, characteristic of
, is identified in the approximate interval between
and
. In this range, the peaks of the lift coefficient coincide with the peaks of the velocity curve, characterizing a net positive transfer of energy from the fluid to the body. Thus, for the roughness
, wake galloping occurs in a localized and brief manner, and it is associated with the onset of the influence of the wake of the upstream cylinder.
After , the lock-in phenomenon reappears over a longer interval, extending up to approximately , even with the passage of vortical structures originating from the upstream cylinder through the region of the oscillating downstream cylinder. Thus, unlike the other cases with surface roughness, this case presents a predominant regime over a significant portion of the lift coefficient time series. Still, it cannot be classified as a pure case, since there was a previous manifestation of , even if over a short interval. In addition, after , a desynchronization of with respect to the displacement curve is observed, and later, near , synchronization is observed again. Therefore, although lock-in predominates during a significant part of the simulation, the presence of intermittencies and episodes of desynchronization prevents the regime from being characterized as strictly .
For this case, the mean lift coefficient was
= −0.4120, whereas the Strouhal number, obtained by applying Fast Fourier Transform to the lift coefficient time series, was St = 0.1996. Both parameters were calculated over the dimensionless time interval from
to
. The result of the FFT applied to the lift coefficient curve is presented in
Figure 17.
As indicated in
Figure 17, only one relevant peak is observed in the frequency spectrum obtained from the lift coefficient time series. This dominant frequency is consistent with the predominance of a single regime throughout the CL time series, especially in the interval considered for the application of the FFT, between the dimensionless time
and
.
Figure 18 presents the vortical structure generated by the upstream cylinder interacting with the oscillating downstream cylinder, for the surface roughness
, to the dimensionless time
. This instant is associated with point
P, of maximum positive displacement, in the lift coefficient time series shown in
Figure 16. Thus, this configuration may be interpreted as the initial stage of the interaction between the wake generated upstream and the oscillating solid boundary of the downstream cylinder.
It is observed in
Figure 18 that a vortical structure originating from the upstream cylinder crosses the upper region of the downstream cylinder, while another structure, also originating from the upstream cylinder, is about to cross its lower region. This arrangement promotes a balance of velocity induction between the upper and lower portions of the body, favoring the equalization of the pressure field and resulting in a slightly negative lift coefficient, which is mainly influenced by the vortical structure approaching the lower region. This behavior is consistent with that observed at point
P in the lift coefficient time series presented in
Figure 16.
In addition, it is verified that the binary wake downstream of the oscillating cylinder tends to form and move downward. This occurs because at the instant when the vortical structure originating from the upstream cylinder crosses the vicinity of the downstream cylinder, the latter is near its maximum positive displacement, causing most of the incident wake to pass through the lower region of the body. This effect is consistent with the negative mean displacement of the lift coefficient observed in
Figure 16. The interaction between the vortical structures of the upstream and downstream cylinders, connected by vorticity sheets, is also evident.
Point
, corresponding the dimensionless time
in the lift coefficient time series shown in
Figure 19, is characterized by a high-amplitude valley (
< −2), which is associated with the interaction between a vortical structure shed from the upstream cylinder and the oscillating downstream cylinder.
Figure 19 presents the visualization of this interaction at the instant corresponding to point
.
From
Figure 19, it is observed that at point
, a vortical structure originating from the upstream cylinder is about to cross the lower region of the downstream cylinder, inducing high velocities in the nascent vortices of this region. This process generates a zone of intense circulation and, consequently, a local pressure drop. As a result, the occurrence of a high-amplitude valley in the lift coefficient is observed.
Additionally, the instantaneous pressure coefficient distribution as a function of angle
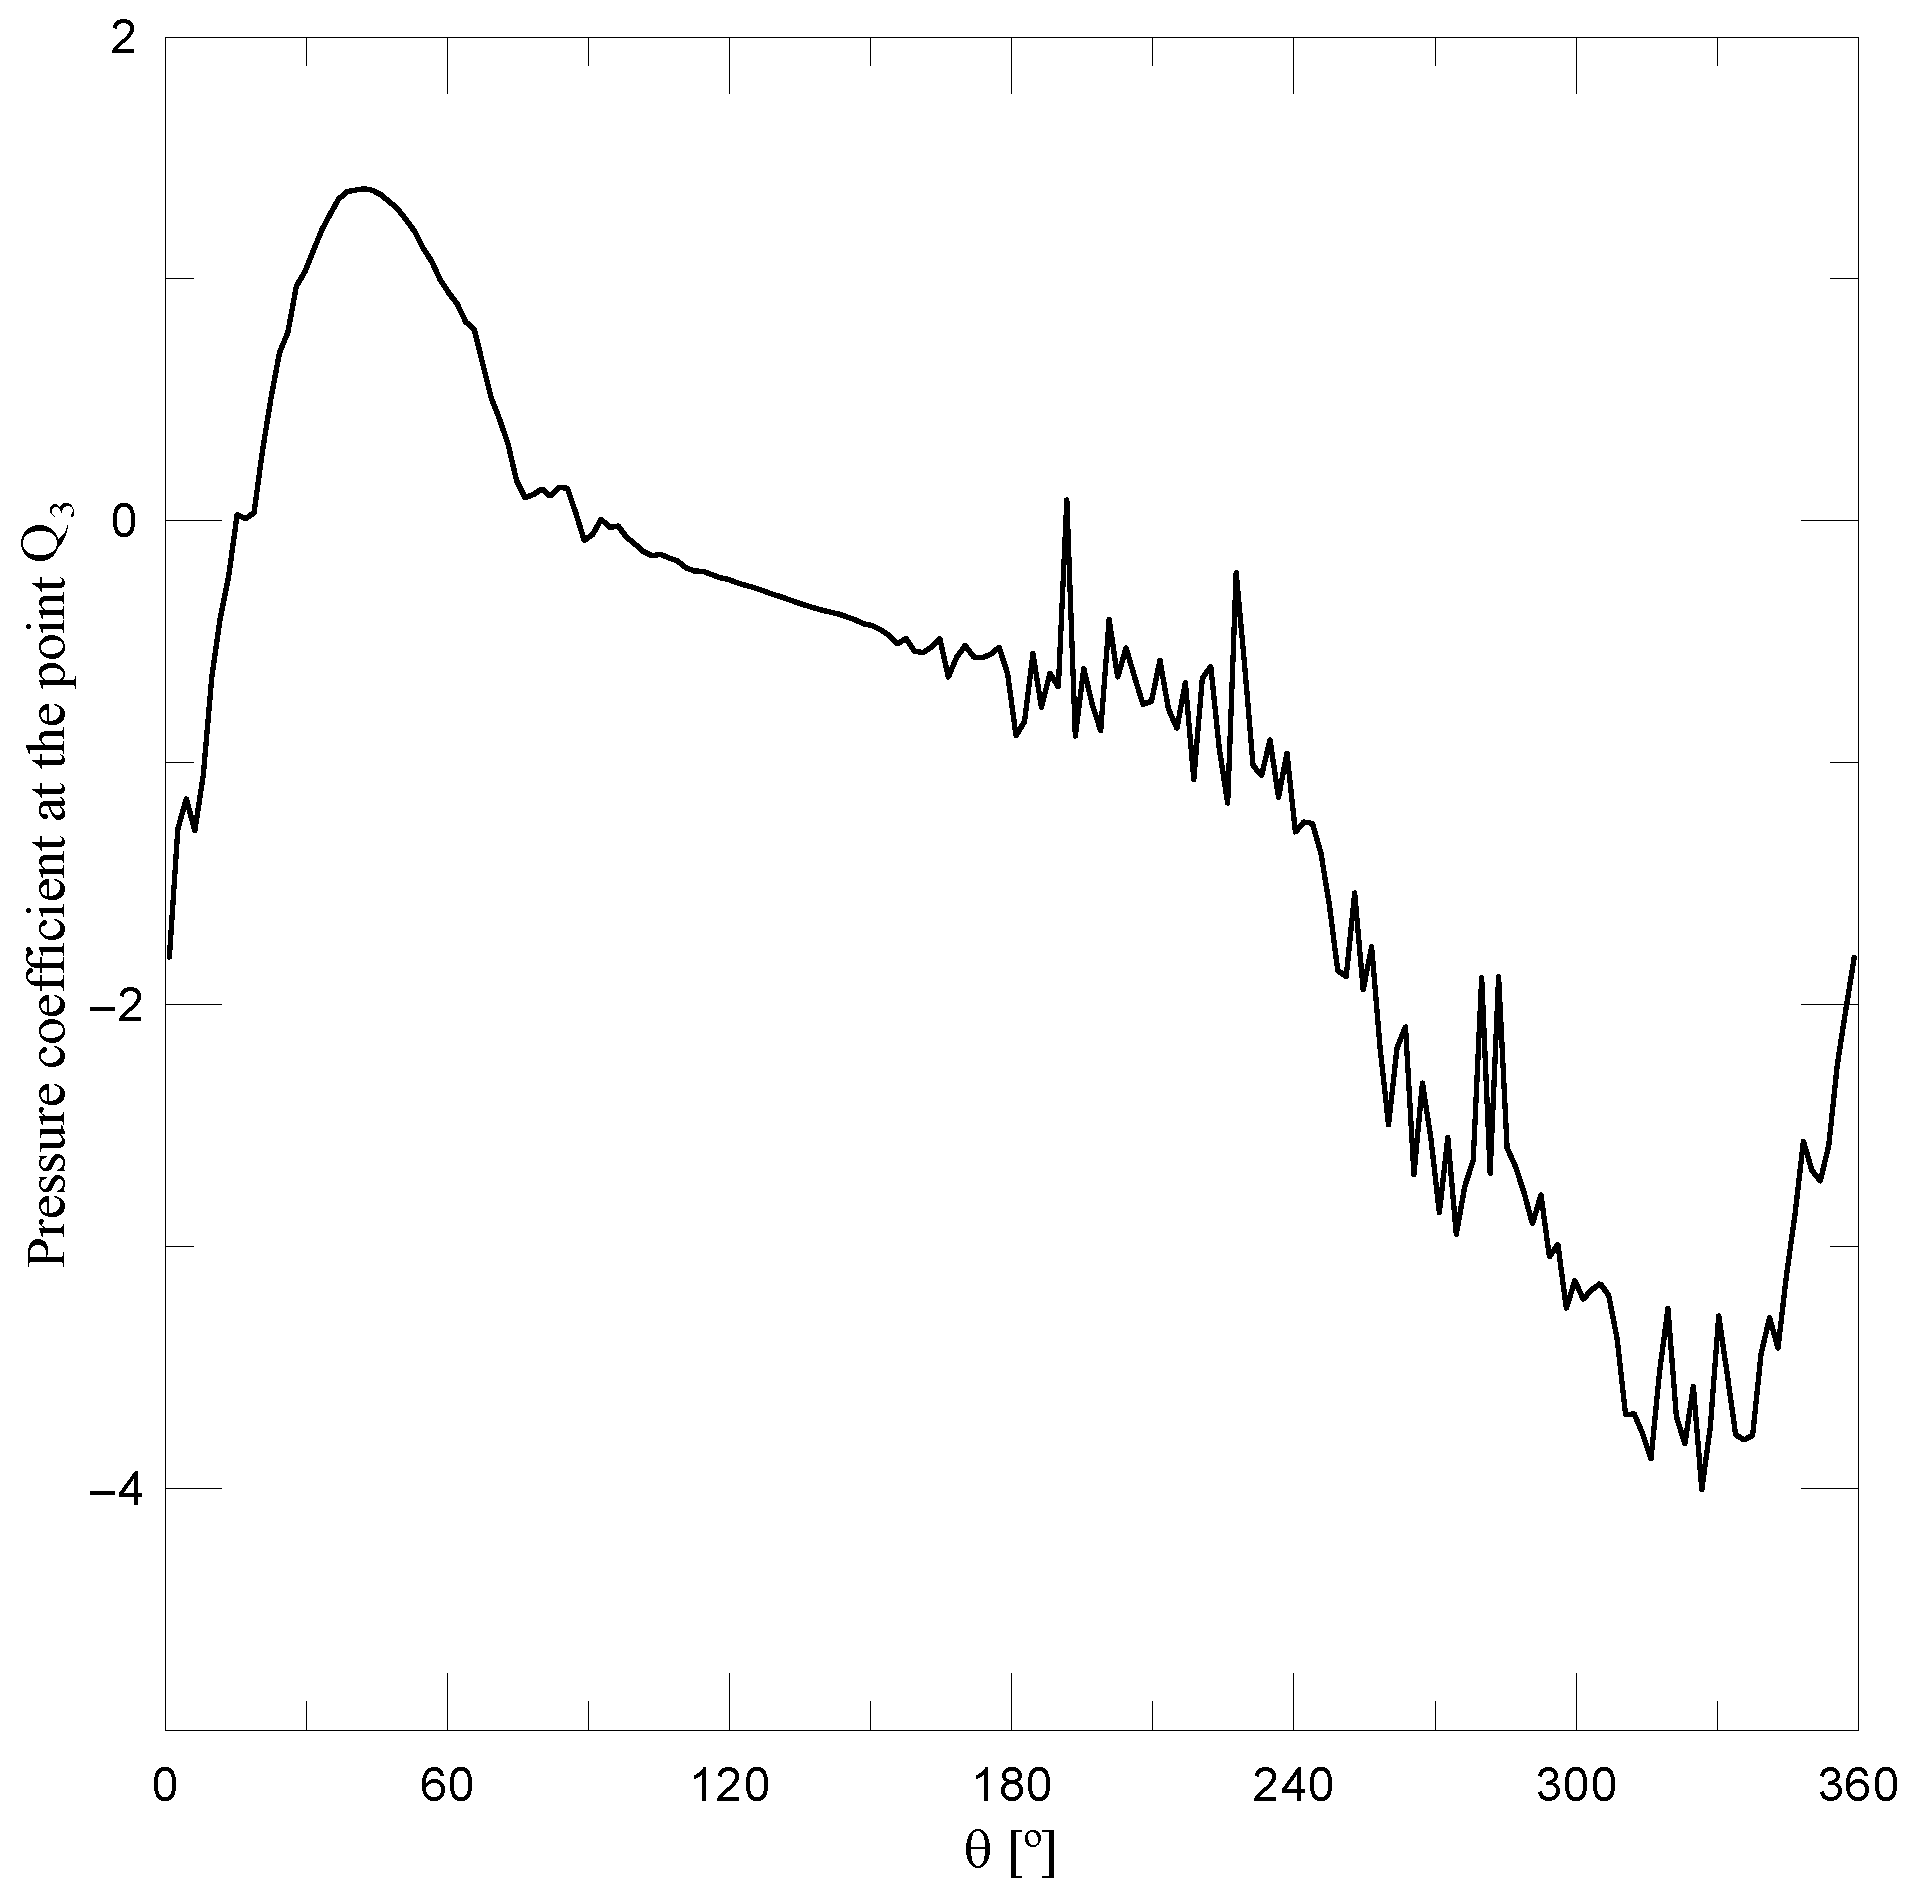
was analyzed at point
in order to investigate this portion of the lift coefficient time series in greater depth.
Figure 20 presents the instantaneous pressure coefficient curve corresponding to this point.
As shown in
Figure 20, intense negative fluctuations of the pressure coefficient are observed in the lower region of the cylinder, corroborating the hypothesis that at this instant, a vortical structure originating from the upstream cylinder is about to cross this region, inducing velocities and promoting strong local circulation. This dynamic significantly modifies the pressure field, making it more negative and unstable, which results in a negative lift force of high magnitude.
The use of parallel computing (OpenMP) to compute the vortex–vortex interactions (the Biot–Savart law) has permitted an increase in the number of particles constructing the viscous wakes and, consequently, a reduction of the final CPU time. The computer used to run the simulations has the following specifications: CPU Intel Core i9-13900KF 3.00 GHz with 32 threads and L2 cache of 32 MB. Every test case needed approximately 150 h of wall clock time to complete.
5. Conclusions
A purely Lagrangian , coupled with a surface roughness model, was developed to simulate the two-dimensional, incompressible and unsteady flow around two identical circular cylinders arranged in tandem and immersed in an incident flow at a high Reynolds number. The investigated problem corresponds to a wake-induced vibration configuration in which the upstream cylinder remains fixed, while the downstream cylinder is forced to oscillate in the transverse direction for , , and . In this context, the main contribution of this paper is to demonstrate, in a systematic manner, how the surface roughness of the downstream cylinder alters the coupling between the imposed vibration and the incident wake generated by the upstream cylinder, thus redefining the dominant fluid–structure interaction regime.
The results show that in all the cases analyzed, the initial response of the system is marked by the occurrence of lock-in before the interference from the upstream wake becomes fully dominant. However, the subsequent evolution of the response is strongly dependent on the roughness height. For the smooth surface, , the flow evolves from an initial lock-in regime to a regime dominated by wake galloping with a mean lift coefficient close to zero, = −0.0033, and a spectrum characterized by a single dominant frequency, , indicating a globally more stable and well-defined response. This result reproduces the classical behavior of the downstream cylinder and establishes the reference condition for interpreting the effects of roughness.
For the intermediate roughness, , the most singular behavior was observed among the investigated cases. Although lock-in still manifests itself during the initial stage, the action of the upstream-cylinder wake interrupts this regime without inducing a typical wake-galloping state. Instead, a non-canonical response is established that is incompatible with both synchronized vortex-induced vibration and a classical wake-galloping-type mechanism. This interpretation is supported by the presence of two relevant frequencies in the spectrum, and , neither of which is close to the imposed oscillation frequency, as well as by the significantly negative value of the mean lift coefficient, = −0.4391. This result shows, quite importantly, that a moderate roughness does not merely modify the response quantitatively but may also disrupt the typical synchronization of the system and drive it into a distinct fluid-dynamic regime governed by more complex interactions among the incident wake, the nascent vortices, and the instantaneous pressure field around the cylinder.
For the highest roughness analyzed, , a partial reorganization of the dynamic response was observed. In this case, an alternation between lock-in and wake galloping occurs with a brief manifestation of at the onset of wake influence and a subsequent predominance of lock-in over a longer interval, although it was still with intermittencies and localized episodes of desynchronization. The spectrum again exhibits a single dominant frequency, , while the mean lift coefficient remains strongly negative, = −0.4120. These results indicate that a further increase in roughness does not restore the behavior observed for the smooth cylinder; rather, it favors a more coherent regime than that obtained for , although it is still not purely associated with . In physical terms, this suggests that the higher roughness reorganizes the interaction between the incident wake and the vorticity layer of the oscillating cylinder, promoting a more structured response over a large portion of the simulation.
Taken together, the three cases show that surface roughness does not act merely as a parameter for local boundary-layer modification but rather as a mechanism capable of redefining the dominant fluid–structure interaction regime in aligned cylinders. The smooth condition favors the transition to wake galloping after the arrival of the upstream wake; the intermediate roughness suppresses the classical synchronization and leads to an anomalous response; and the higher roughness re-establishes a predominance of lock-in, although intermittently. Accordingly, the main advance of this paper lies in showing that small variations in relative roughness can shift the system among different synchronization states, including transitions between typical responses, desynchronized states, and mixed regimes.
In addition, the results show that extreme lift events are directly associated with the passage of vortical structures shed by the upstream cylinder close to the surface of the downstream cylinder, leading to localized suction peaks and marked pressure asymmetry. This confirms that the instantaneous dynamics of the incident wake is the key mechanism controlling the modulation of the fluid-dynamic loads acting on the oscillating body. Within this framework, the proposed methodology, based on the coupling between a Lagrangian and a roughness model, proved capable of capturing not only variations in drag and dominant vortex-shedding frequency but also qualitative changes in the response regime itself.
Therefore, this paper provides a novel contribution to the specialized literature on wake-induced vibration by demonstrating that the surface roughness of the downstream cylinder may play a decisive role in the maintenance, suppression, or reorganization of fluid–structure synchronization in tandem arrangements. This finding is particularly relevant because it shows that roughness should be regarded not merely as a passive boundary-layer feature but also as a parameter with potential for the passive control of dynamic response and fluid-dynamic loads in systems subjected to flow-induced vibrations.
As future improvements to refine the vorticity field solution, CUDA technology will be used to implement the present algorithm. That technology is very efficient in reducing the CPU time and, consequently, provides the means for longer-time simulations to be carried out. As a consequence, the present methodology will be extended to include mixed convection heat transfer [
1] and the moving ground effect [
34] combined with the vortex-induced vibration of a downstream elastically mounted rigid cylinder [
38].



 ,
,