1. Introduction
Over the last years, programming paradigms have undergone a major change due to the rising demand for high-performing, scalable, and responsive software systems [
1]. Today, web platforms, distributed services at scale, and data-intensive applications are supposed to drive large numbers of users while still being able to deliver low latency and a throughput that is predictable. To conform to these requirements, developers have had to resort to architectural and programming models that not only are able to use the hardware resources available efficiently but can also efficiently scale as the workloads vary [
1]. This necessity for computational efficiency is a cross-domain challenge, paralleling the optimization constraints seen in lightweight industrial wireless sensor networks [
2], where resource stewardship is equally paramount.
For a long period, traditional synchronous and multithreaded programming models have been the basis of concurrent application development in the Java ecosystem. Despite their effectiveness in numerous situations, these models struggle with the challenge of easily managing high numbers of concurrent operations, especially when there are conditions of high I/O wait times or complex workloads [
3]. Although thread-per-request architectures are easy to understand, they can raise issues of excessive context switching, thread contention, and inefficient resource utilization [
3]. The adoption of asynchronous, non-blocking programming models has helped to alleviate some problems by separating task execution from thread availability. Using constructs such as CompletableFuture and the java.util.concurrent framework, programmers have been able to build systems that are less I/O bound and more CPU-friendly [
4]. However, asynchronous programming also comes with its own difficulties, particularly regarding flow control, error propagation, and debugging, which can cause maintainability to decrease in large codebases [
4].
As an alternative paradigm, reactive programming has been put forward to leverage the pros of asynchronous execution and, at the same time, facilitate a declarative manner of managing data flows and events [
1]. By using non-blocking I/O, event-driven design, and backpressure mechanisms, reactive systems can become scalable and responsive in highly concurrent environments [
1,
5]. Such mechanisms are crucial for maintaining system integrity under load, a priority shared by secure distributed architectures in vehicular communications [
6]. The properties specified in the Reactive Manifesto (responsiveness, resilience, elasticity, and message-driven communication) have been acknowledged by both academia and industry, leading to adoption by companies such as Netflix, PayPal, and Alibaba for large-scale, latency-sensitive applications [
7,
8,
9,
10,
11].
Our previous research [
12] primarily examined the migration of a Java-based microservices application from a conventional asynchronous, multi-threaded architecture to a fully reactive model implemented with Spring WebFlux. That work provided a detailed, stepwise description of the migration process and offered a systematic comparison of the two paradigms through a series of database-centric experiments. The empirical results showed that, under highly concurrent and I/O-bound conditions, reactive programming can yield significant efficiency gains, such as up to a 56% reduction in 90th-percentile latency and approximately 33% throughput improvements. However, that study intentionally excluded complex workload categories that introduce distinct architectural challenges: distributed caching mechanisms, CPU-bound computation, and legacy blocking operations.
The current work directly extends that foundation by addressing these omitted workloads. While the benefits of reactive programming for pure I/O are well-documented, the behavior of reactive runtimes when confronted with heterogeneous enterprise patterns remains a subject of debate.
Caching layers, typically implemented using Redis [
13], are among the most frequently used techniques for reducing backend load in high-throughput environments [
14]. However, in reactive architectures, the interaction is non-trivial. While local caching solutions like Caffeine [
15] offer exceptional speed for single-node deployments, distributed microservice architectures require shared state management, which introduces network latency and synchronization challenges. In reactive architectures, this interaction is non-trivial. Clients like Lettuce [
16] and Redisson [
17] provide non-blocking drivers, but integrating them requires careful management of the event loop. Unlike synchronous caching, where a miss simply blocks a thread, a reactive cache miss must suspend execution asynchronously. If not properly coordinated, this can lead to unpredictable latency spikes [
18]. Furthermore, in orchestrated environments like Kubernetes, rapid scaling events can introduce scaling lag [
19], where the reactive runtime’s CPU efficiency masks the need for scaling until latency has already degraded [
20].
Similarly, the question of whether reactive programming is suitable for CPU-intensive processing remains contentious. Although the paradigm is optimal for I/O-bound scenarios, the incorrect handling of CPU-bound tasks in the reactive event loop can lead to severe degradation of both throughput and responsiveness [
21]. In production, this often manifests when schedulers are misconfigured or when heavy tasks are not properly isolated to specific thread pools [
5]. With the emergence of Project Loom and virtual threads [
22], which promise to simplify concurrency without the complexity of reactive streams, understanding the precise performance boundaries of the reactive event loop versus thread-based scheduling has become critical for architectural decision-making.
Furthermore, despite the goal of purely non-blocking architectures, integration with legacy APIs and synchronous libraries remains a common requirement. For example, while R2DBC exists as a reactive alternative for database access [
23,
24], the vast majority of enterprise integrations still rely on blocking JDBC drivers [
25] or synchronous third-party clients. If these blocking operations are not rigorously isolated, they can monopolize the limited threads of the event loop, neutralizing the scalability advantages of the reactive model [
26]. Recent studies by Mochniej and Badurowicz documented performance degradations of up to 46% in reactive systems utilizing CPU-bound tasks [
27], while Dahlin highlighted stability risks caused by improperly isolated blocking operations [
28].
This research builds directly on our earlier work by using the same experimental microservices application [
12] and the same baseline architecture to ensure methodological consistency. The primary objective is to extend the empirical evaluation of concurrency paradigms in Java by systematically benchmarking how asynchronous and reactive architectures behave under these three critical boundary conditions: caching, CPU-bound computation, and controlled blocking I/O. Unlike studies that rely on synthetic microbenchmarks, this work isolates the effects of the execution model within a full-stack microservice environment, allowing for a direct quantification of the architectural crossover points where one paradigm surpasses the other.
A second objective is to investigate the resource trade-offs associated with adopting reactive paradigms in these heterogeneous environments. By integrating deterministic CPU-intensive stages and controlled blocking scenarios, this study evaluates how effectively each paradigm contains bottlenecks and mitigates resource contention. Particular emphasis is placed on analyzing scheduler behavior, thread-pool saturation, and memory dynamics, specifically the trade-off between heap allocation and thread-stack consumption, to derive actionable guidance for practitioners deciding whether to adopt reactive programming in complex, mixed-workload systems.
3. Related Work
Recent research presents a more tempered view of concurrency model adoption, revealing new forms of bottlenecks and performance trade-offs in practical deployments. Situating the present study within this broader discourse, the following review examines how prior work has approached issues of scalability, stability, and architectural evolution, and how these findings motivate the need for renewed empirical evaluation under our current work.
3.1. Caching for High-Performance and Scalable Systems
Núñez, Guyer, and Berger delve into the problem of conflicting software caching and garbage collection in managed runtimes [
35]. Their solution is prioritized garbage collection, which allows caches to communicate with the collector directly through priority references. In contrast to traditional soft references that completely hand over eviction to the JVM, this method permits the application to inform the collector about the relative importance of the cached entries and also specify the memory limits for each cache. Their demonstration of this in the Sache cache reveals that it not only adjusts itself to the characteristics of the workload but also does not cause memory leaks or crashes that are typical of Guava’s LRU under pressure [
35].
Tests based on both synthetic and real web workloads confirm that Sache can achieve hit rates that are similar to Guava’s while being stable at different heap sizes, especially when multiple caches are vying for memory [
35]. The main drawback of the method is that it depends on the changes at the VM-level, which means that it cannot be used in a normal environment but only where research is conducted. However, it still points to the possibility that cache–GC alignment can help maintain performance in systems that are sensitive to memory and have a high throughput [
35].
Mertz et al. offer extensive coverage of application-level caching as a scaling technique for modern software systems [
36]. Application-level caching, unlike transparent layers such as HTTP or database caches, is explicitly injected into business or persistence logic with a goal of reusing expensive computations and reducing user-perceived latency [
36]. Their survey notes the benefits such as increased throughput, reduced infrastructure costs, and enhanced responsiveness, but also points out the drawbacks of engineering: cache logic is deeply interwoven with application code, configurations need to be updated along with workloads, and invalidation is a source of inconsistencies [
36]. They categorize support mechanisms into recommender systems (e.g., Speedoo, MemoizeIt) and automated tools (e.g., CacheOptimizer, APLCache) and show that throughput improvements vary from a small 2–17% to a large 27–138% depending on the workload and method [
36].
On the one hand, frameworks like Spring Caching and Caffeine ease the implementation burden; on the other hand, issues of maintenance, especially those related to dynamic workloads and correctness assurance, still exist. The authors regard the issues of adaptive and predictive cache management as the next challenges in high-performance systems, which, in their view, is not only a problem of software engineering but also of runtime optimization [
36].
Mayer and Richards compare and contrast different distributed caching algorithms such as LRU, LFU, ARC, TLRU, and also newer strategies based on machine learning [
37]. Their assessment covers hit ratios, latency reduction, memory usage, and scalability in distributed environments. The findings show that while conventional algorithms such as LRU and LFU are still the basis, they are weak under dynamic workloads due to the cost of synchronization and cache pollution [
37]. Adaptive techniques like ARC become more robust to changes in the workload by balancing recency and frequency, and TLRU offers freshness guarantees by using time-to-live values, resulting in less stale data being returned [
37].
The largest gains in caching come from machine learning–based methods which can raise hit ratios by 15–25% in edge and cloud scenarios, but this is accompanied by higher complexity of implementation [
37]. Besides algorithms, the authors emphasize that cache topology (peer-to-peer, hierarchical, or sharded) and consistency models have a significant impact on performance, with eventual consistency implementations being up to 5 times faster than strong consistency ones [
37]. The paper argues that the best caching performance is the result of not one but a combination of algorithms that are in sync with workload patterns, deployment architecture, and consistency needs [
37].
3.2. CPU-Bound Workloads in Java Environments
Sharma et al. conduct a comparative study on the performance of reactive versus traditional Java frameworks for NLP workloads in cloud-native environments [
38]. They implement a sentence detection service using OpenNLP on Micronaut, Quarkus, Helidon, and Spring Boot, and each is compiled into GraalVM native images and managed on Kubernetes [
38]. Their metrics include CPU usage, memory footprint, throughput, and error rates under intensive load [
38]. The findings suggest that the reactive-functional versions usually have lower latency and higher stability under load, with Spring Boot reactive combined with GraalVM showing the most efficient throughput and fault tolerance. The likes of Quarkus and Micronaut are good in terms of memory consumption, but sometimes go through errors in resent spikes due to their continuity [
38]. Framework choice for CPU-bound workloads in reactive systems is the main focus of the paper, which also states that going for optimized runtimes and reactive programming models can make scalability a lot easier in NLP-driven microservices [
38].
Nowicki, Górski, and Bała shed light on the question whether Java can effectively manage large-scale CPU-bound workloads through the PCJ library, a Partitioned Global Address Space (PGAS) model with one-sided asynchronous operations [
39]. The authors put the language and library through various intensive computational benchmarks, i.e., 2D stencils (Game of Life), 1D FFT, and large-scale WordCount on a Cray XC40, demonstrating that Java/PCJ scales to over 100,000 threads with performance close to Java-MPI, however still lagging behind native C/MPI by about a factor of three [
39]. PCJ consistently opposes Hadoop and Spark in data processing tasks, with WordCount executing at least three times faster and graph search reaching up to 100× speed improvements, as a result of the removal of heavy framework overhead. Additionally, they take PCJ to distributed machine learning, where the asynchronous training with TensorFlow obtains the same level of accuracy as Horovod while the throughput remains competitive [
39]. These outcomes throw light on the fact that Java can efficiently handle CPU-bound workloads when coupled with the right concurrency runtimes, but at the same time, serialization overhead and reliance on socket-based transport are still the main bottlenecks [
39].
Nordlund and Nordström provide an empirical comparison of reactive and non-reactive API implementations using Spring Boot and Quarkus [
40]. By implementing four functionally equivalent services, the authors analyze latency, CPU usage, and memory consumption under different transaction sizes. Their results show that reactive Quarkus excels for small, lightweight transactions, while Spring Boot performs better for larger payloads or computation-heavy processing. The study highlights that framework choice and workload characteristics strongly influence the effectiveness of reactive programming, suggesting that no single concurrency model universally dominates across scenarios [
40].
3.3. Blocking Operations in Non-Blocking Architectures
In their work, Wycislik and Ogorek shed light on the performance tradeoffs of incorporating reactive programming with persistent data sources in Java [
41]. They have particularly dived deep into the performance of Spring WebFlux with PostgreSQL and MongoDB [
41]. The authors’ experiments involve a comparison between the traditional JDBC drivers and the reactive R2DBC driver while measuring sequential and concurrent requests at different chunk sizes and stream lengths [
41]. The data from the experiments indicate that the reactive approach frequently performs worse than the traditional one in simple, low-to-medium loads, in particular with small data chunks. This is mainly caused by the fact that the driver is not mature, and therefore, there is overhead [
41].
In the case of PostgreSQL, the R2DBC driver was able to demonstrate its advantages only under conditions of high concurrency and long data streams, whereas the reactive access to MongoDB was at all times inferior to the blocking drivers [
41]. The research claims that despite the non-blocking architectures being theoretically beneficial, many systems in existence still have blocking database layers; therefore, switching to WebFlux does not remove bottlenecks [
41]. These results are an argument for evaluating the entire stack because blocking dependencies may cancel out the scalability advantages of reactive programming.
Müller analyzes the performance impact of reactive relational database drivers by comparing Oracle R2DBC with traditional JDBC within a shared Spring Boot microservice application [
42]. The evaluation combines local computation, simulated external I/O, and SQL queries, enabling realistic concurrency patterns and out-of-order execution. The results show that while reactive drivers do not necessarily improve average latency under light workloads, they outperform blocking JDBC under heavy load by avoiding thread exhaustion, albeit at the cost of higher resource usage. The study reinforces the argument that partial reactivity is insufficient: performance gains emerge only when the entire execution path, including database access, is consistently non-blocking [
42].
Dobslaw, Vallin, and Sundström investigate how often real Java reactive projects silently violate the non-blocking contract by running BlockHound on 29 GitHub repos and analyzing the logs [
33]. They detect violations in 7 projects, which is 24 percent, with 190 total hits, and demonstrate that only a few roots are responsible for almost everything: file I/O operations like FileOutputStream.writeBytes and FileInputStream.readBytes, intentional sleeps through Thread.sleep, and parking primitives from Unsafe that appear as covert waits deeper in libraries [
33]. The failure rate per project varies from very small to about one-third of the tests, and most of the violations originate from logging, test scaffolding, or inadvertently blocking operators such as block, rather than explicit I/O [
33].
Their remedies are reasonable: relocate the guilty path to elastic or IO schedulers, replace the blocking calls with non-blocking versions, or remove the block if it is not needed anymore [
33]. The message for the WebFlux and RxJava stacks is straightforward: non-blocking at the framework layer is not sufficient if the dependency stack brings back blocking under load, so it is necessary to enforce checks and employ adequate scheduling to be able to keep throughput and responsiveness at the same level [
33].
3.4. Cloud-Native Microservice Architectures and Performance
Pillutla lays out a thorough cloud-native framework of microservices with the Spring ecosystem for enterprises [
43]. The system uses domain-driven design for service decomposition, Spring Modulith for modular boundaries, and reactive APIs with Spring WebFlux to maintain high concurrency [
43]. Service interaction is performedperformed using asynchronous messaging through Spring Cloud Stream and Kafka, providing guarantees of loose coupling and a certain level of resistance to crashing [
43]. In case of failures, the system uses Resilience4j for the circuit breaking and retry patterns, while monitoring is done through OpenTelemetry, Prometheus, and centralized logging [
43]. The methodology that is implemented on Kubernetes with GitOps pipelines promotes the fusion of enterprise business agility with operational reliability via the combination of various contemporary paradigms: DDD, event-driven communication, reactive programming, and cloud orchestration [
43]. The paper emphasizes that distributed systems’ performance cannot be attributed to a single optimization but to the interplay of caching, messaging, and resilience tactics across the stack [
43].
Mekki, Toumi, and Ksentini research how resource configuration options for microservices in Kubernetes can directly impact application performance and availability [
44]. They do a comparative study for various workloads, which include web servers, a RabbitMQ message broker, and a 5G core AMF component, and each is tested under different CPU and memory limitations [
44]. The findings suggest that improperly set containers are often the cause of Out-Of-Memory errors or CPU throttling, leading to restarts and service degradation, while overprovisioning leads to the waste of limited edge resources [
44]. Their analysis points out that relative CPU usage can be a strong indicator of latency spikes and SLA violations: when utilization nears 80–100% of the allocated CPU, service response times go up drastically irrespective of the workload type [
44]. Just like that, low memory allocations are associated with frequent container crashes [
44]. The authors end up with the idea that the best performance of microservices is less about the provision of raw resources and more about the tuning of configuration in line with workload behavior [
44]. The authors also argue that keeping an eye on relative CPU and memory values during runtime makes it possible to detect misconfiguration early and take corrective scaling actions in order to minimize performance issues in distributed systems [
44], highlighting the broader and system-level implications of proper resource allocation and management.
Bhimani et al. investigate the performance interference that arises when multiple I/O-intensive containerized applications share high-performance NVMe SSDs [
45]. Their study characterizes heterogeneous and homogeneous workload mixtures and shows that naïve co-location can significantly degrade throughput and fairness due to competing I/O access patterns. To address this, the authors propose a Docker-level scheduling controller that dynamically batches containers based on workload characteristics, improving overall execution time and resource utilization. The results demonstrate that storage-aware scheduling at the orchestration layer can be as critical as application-level optimizations, highlighting that backend I/O contention may dominate performance even when application concurrency models are efficient [
45].
3.5. Alternative Concurrency Models
Lanka, Devarakonda, and Pothireddy compare the use of advanced functional programming constructs and their impact on the performance and maintainability of Java Virtual Machine (JVM) applications [
46]. They contrast Java, Scala, and Kotlin in this regard by evaluating higher-order functions, immutability, lazy evaluation, and pure functions in three representative domains: data processing, reactive systems, and algorithmic computation [
46]. Overall, Scala is faster and more memory-efficient than both Java and Kotlin, making it the preferred language for developers of the functional programming paradigm [
46]. While Kotlin is better than Java in many respects, it is not able to reach Scala’s level in terms of execution speed and memory usage [
46]. The research suggests that using Scala or Kotlin could have a positive effect on performance as well as the quality of the code in concurrency and data-intensive workloads, positioning alternative JVM languages as potential sources of concurrent and optimization models that are compatible with Java but not mainstream [
46].
Beronić et al. illustrate one of the initial empirical juxtaposition inquiries of Java’s experimental virtual threads, a Project Loom novelty, and Kotlin’s coroutine framework [
47]. A benchmarked HTTP server under a controlled load is used in order to measure latency, heap usage, and OS kernel thread creation for regular threads, virtual threads, and coroutines [
47]. Results indicate that the number of OS kernel threads is significantly reduced in both virtual threads and coroutines as compared to the conventional thread-per-request models; however, coroutines produce more than 4000 times fewer kernel threads than Kotlin threads, while on the Java side, virtual threads decrease kernel thread creation by similar magnitudes [
47]. In all their experiments, virtual threads have the minimal heap memory footprint and do better than coroutines by up to 69%; moreover, they also have better average latency under a heavy load [
47]. On the other hand, coroutines reveal slightly more stability in extreme concurrency situations, where they produce fewer kernel threads at peak request rates [
47]. The paper argues that the introduction of structured concurrency models in both Java and Kotlin leads to the occurrence of performance improvements that can be server-side workloads and virtual threads are the most memory-efficient while coroutines are scalable under very high concurrency [
47].
Pufek et al. delve into an initial version of Project Loom fibers, which are lightweight virtual threads using delimited continuations in the JVM [
22]. They put the traditional thread model against the fiber model in HTTP server benchmarks, and controlled workloads are utilized in order to evaluate latency and throughput under different scheduling scenarios [
22]. Experiments show that fibers are able to bring down latency substantially, and in heavy-load tests, they average only 16% of the latency of threads; fibers also have more stable response times throughout different runs [
22]. As a matter of fact, fibers are slower in starting short-lived tasks, but once the load goes up, they are able to achieve performance and even latency can be reduced up to six times in scenarios of high concurrency [
22]. The research demonstrates how fibers utilize structured concurrency rules, which not only regulate that tasks associated with a scope have to be finished before the control moves on, but also that they enhance programmability and robustness [
22]. Although the technology is still at an early stage, their conclusions suggest that fibers might be one way to make Java better at server-side application scaling without giving up on the asynchronous callback-driven style of programming [
22].
3.6. Reactive Data Layer and Architecture
Hendricks presents a systematic review of NoSQL data stores with the goal of guiding software developers toward data-layer choices that support highly available application architectures [
48]. The study surveys empirical evaluations of wide-column, key–value, document, and graph databases, along with the programming-language drivers used to access them, highlighting how architectural decisions at the data layer directly affect scalability and response times in web-facing systems. Rather than proposing a new database system, the work synthesizes existing experimental evidence and distills it into a conceptual framework for designing a reactive three-tier architecture, where the data store, application logic, and presentation layers are aligned with non-blocking and event-driven principles [
48]. The findings emphasize that achieving high availability is not solely a matter of adopting reactive APIs, but also depends on selecting data stores and access patterns that tolerate load spikes and distribution. While the review offers architectural guidance rather than controlled benchmarking, it motivates the need for empirical validation of reactive designs within realistic, end-to-end application contexts.
Wingerath, Gessert, and Ritter address a fundamental limitation of traditional pull-based database systems when serving reactive and interactive workloads: the reliance on inefficient polling to maintain up-to-date client views [
49]. They propose InvaliDB, a system design that augments pull-based databases with scalable, push-based real-time queries, enabling clients to receive incremental updates as underlying data changes while preserving compatibility with existing technology stacks [
49]. InvaliDB combines linear read and write scalability with support for expressive queries, addressing shortcomings of earlier real-time databases that often trade scalability for functionality. An experimental evaluation of a production-deployed prototype demonstrates that push-based propagation reduces latency and overhead under sustained update rates [
49]. This work highlights how data delivery semantics (push vs. pull) can dominate system responsiveness, reinforcing the need to evaluate reactive behavior beyond the application layer and into data-access and query-processing mechanisms.
Holanda, Brayner, and Fialho extend the discussion of reactive data-layer behavior by focusing on adaptability within the transaction scheduling mechanisms of database systems [
50]. They propose the Intelligent Transaction Scheduler (ITS), a self-adaptable scheduler that dynamically adjusts its concurrency-control strategy in response to changing workload characteristics using an expert system based on fuzzy logic. Unlike traditional database schedulers with static conservative or aggressive behavior, ITS can switch scheduling policies at runtime while preserving correctness guarantees such as syntactic and semantic serializability [
50]. Although developed prior to modern reactive frameworks, this work highlights that responsiveness and stability under varying load conditions can also be achieved through adaptive behavior inside the data layer itself. In the context of reactive architectures, such internal scheduling adaptability complements push-based data delivery and non-blocking access patterns, underscoring that end-to-end reactivity depends not only on APIs and data propagation semantics but also on how the database manages contention and concurrency internally [
50].
3.7. Positioning This Work Within the Literature
The related work examined in this section underscores that the performance characteristics of modern Java systems are shaped by multiple interacting subsystems, caching layers, CPU-intensive computation stages, and blocking persistence or I/O paths. Prior studies, however, tend to isolate these factors rather than evaluate them collectively within a single, controlled application context. For example, research on caching primarily investigates eviction policies, GC interactions, or distributed-consistency trade-offs, while work on CPU-bound workloads focuses either on optimized runtimes or language-level concurrency constructs. Similarly, studies addressing blocking I/O in reactive applications emphasize correctness and theoretical responsiveness but do not quantify the system-level impact under sustained load. Although each study advances understanding within its domain, the fragmentation limits the ability to generalize how asynchronous and reactive paradigms behave under the combined pressures typical of real production systems.
In contrast, the present research evaluates these dimensions together within a unified microservice architecture, enabling a direct comparison between asynchronous and reactive variants under identical conditions. By reusing the application foundation from the prior migration study and adding targeted workload extensions, caching, CPU-bound computation, and blocking media operations, this work bridges the gap between the narrow focus of existing studies and the holistic performance considerations faced by practitioners. Unlike studies that rely on synthetic microbenchmarks, our evaluation embeds these workloads within realistic request patterns, preserving natural concurrency interactions, scheduler decisions, and cross-service dynamics. This approach allows us to observe emergent effects such as backpressure propagation, thread-pool saturation patterns, and the impact of distributed caching under load.
Furthermore, while related work often centers on advanced concurrency mechanisms (e.g., coroutines, virtual threads, PGAS runtimes) or on early-stage reactive drivers, this study provides a grounded comparison of widely deployed, industry-standard frameworks, Spring MVC and WebFlux, using production-grade Redis access patterns, image-processing pipelines, and controlled blocking scenarios. By unifying the fragmented perspectives found in prior research, our study contributes a coherent empirical foundation for understanding how concurrency paradigms behave in the presence of mixed workloads, positioning itself as a practical companion to existing theoretical and system-level analyses.
In order to position the present study within the broader discussion,
Table 1 provides a comparative matrix of key related work. This highlights the specific focus of prior studies, their methodological strengths, and the limitations that we identified or addressed.
4. Experimental System Design and Workload Extensions
The experimental platform was designed as a controlled environment to evaluate legacy and modern models under realistic, bottleneck-heavy workloads, revealing how theoretical concurrency models behave in practical conditions.
4.1. System Overview and Workload Extensions
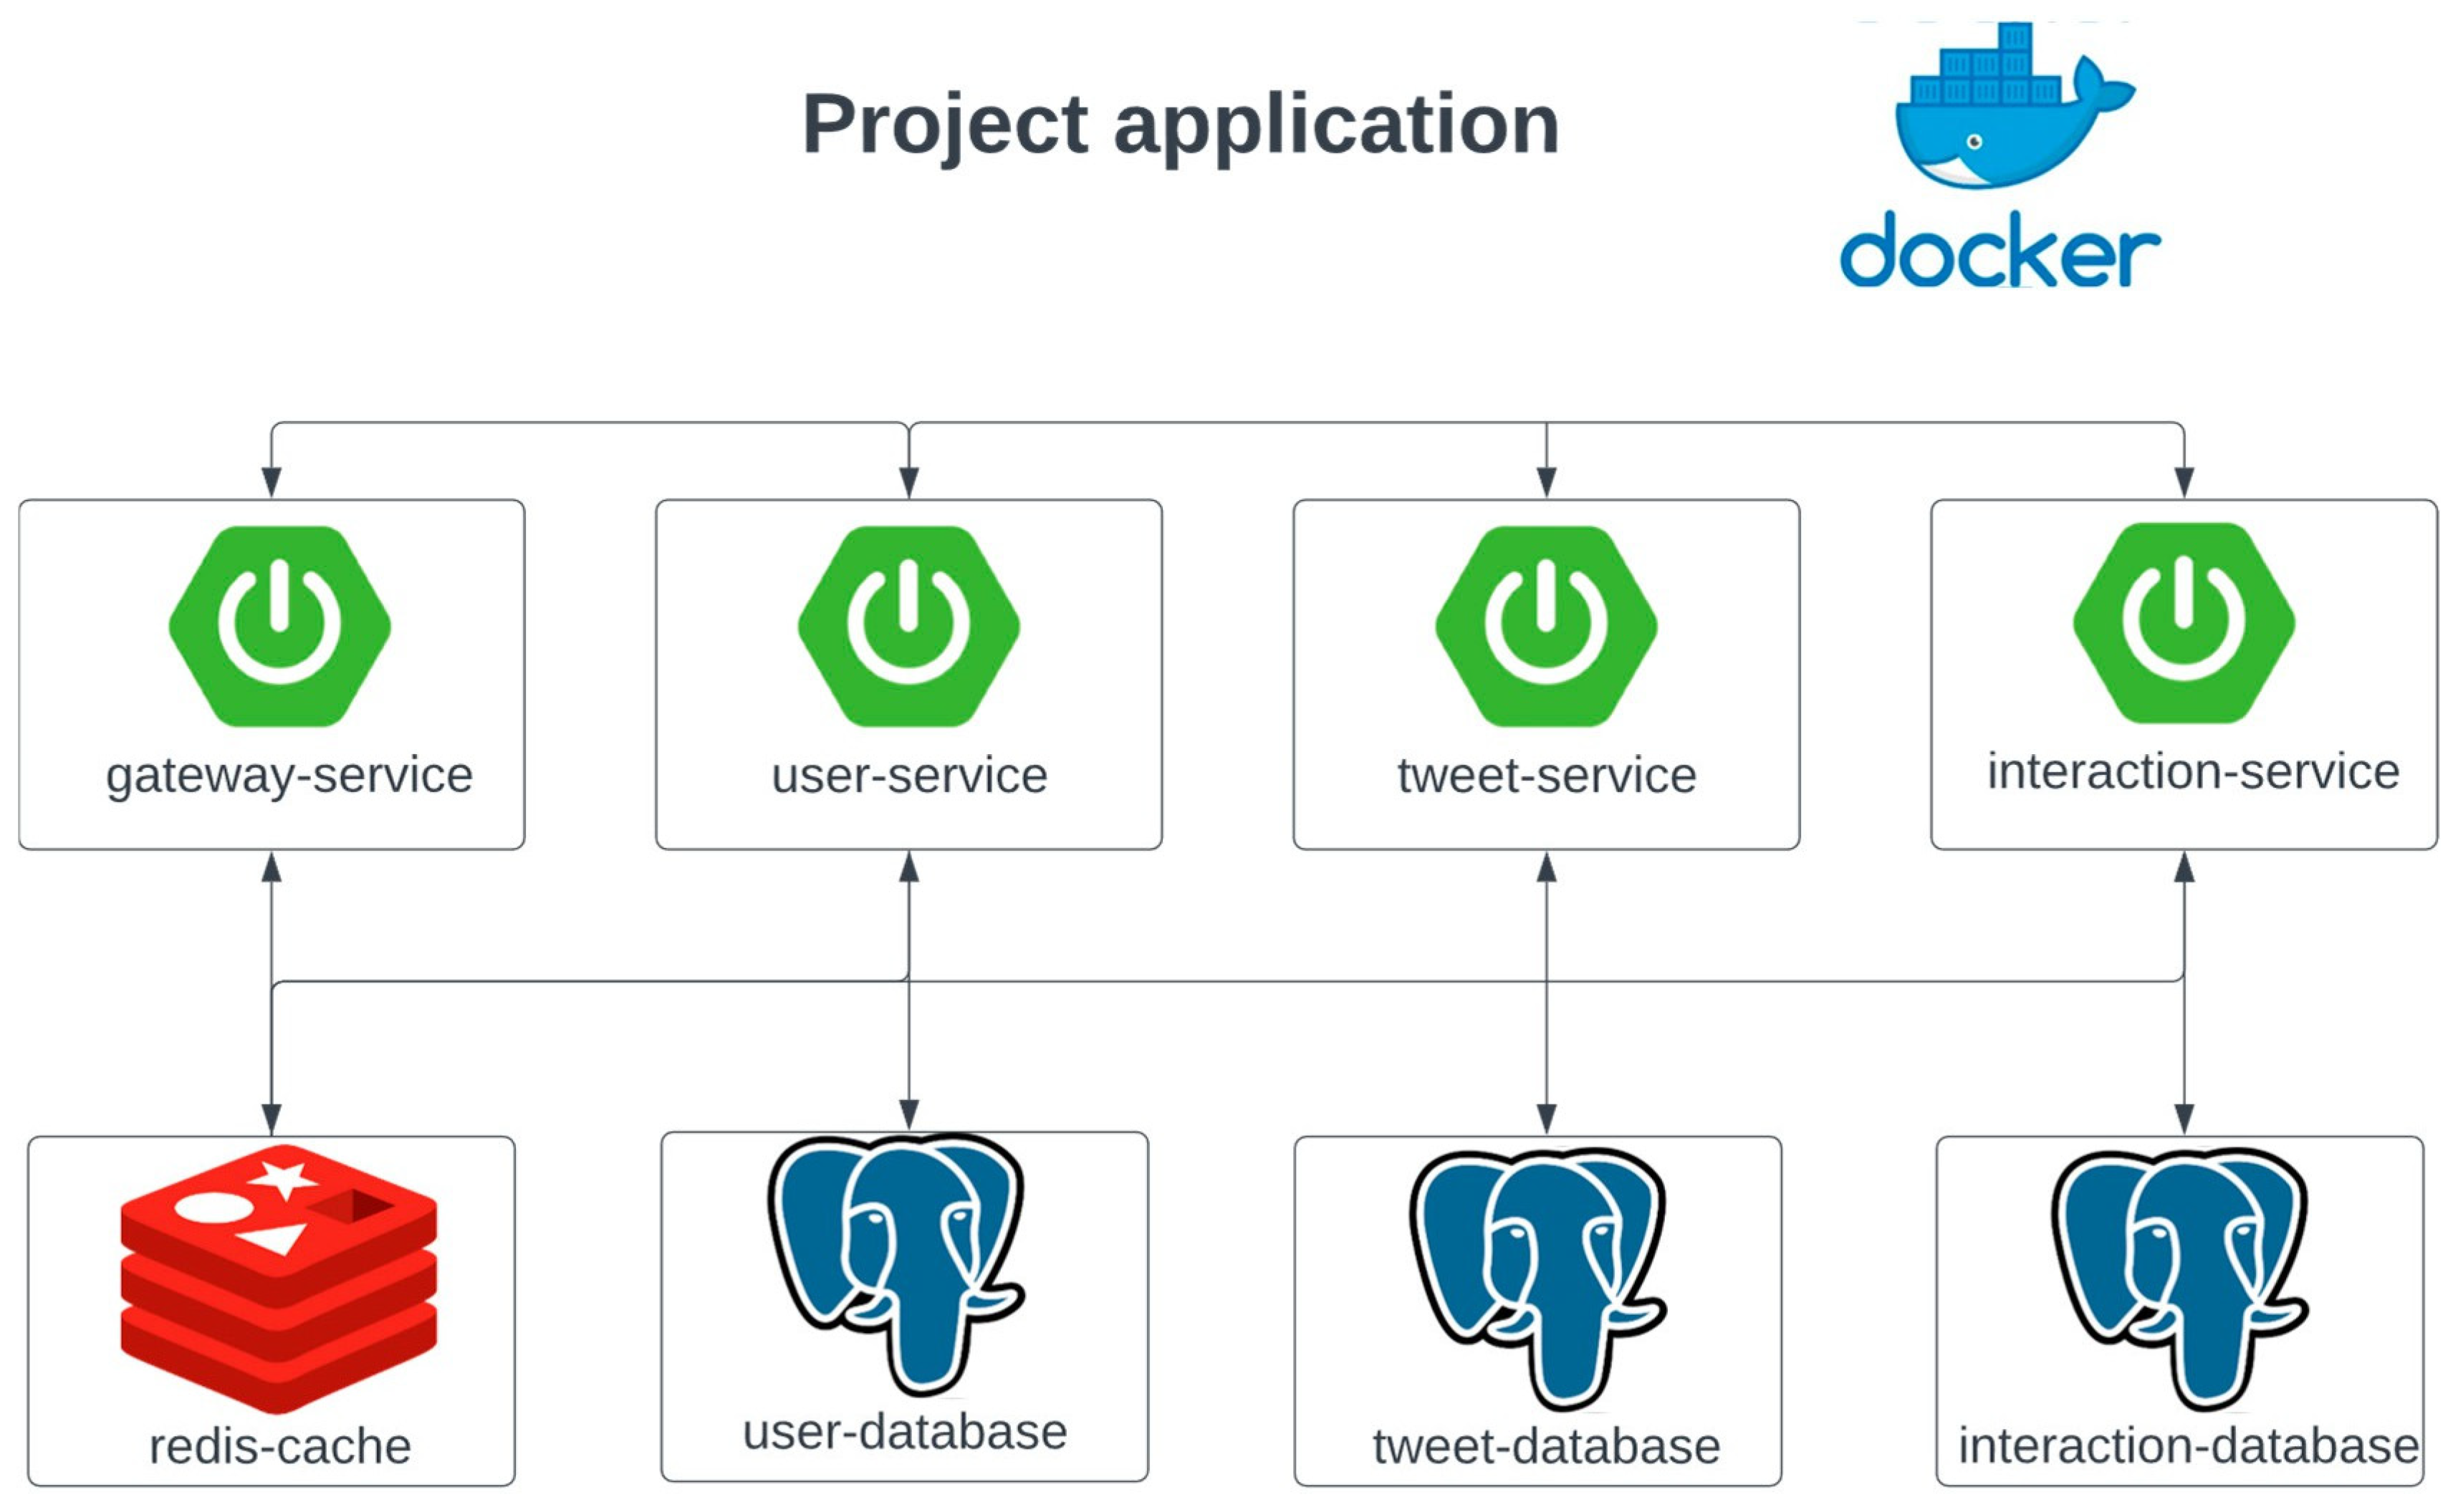
The system comprises Gateway, User, Tweet, and Interaction services, each backed by its own database instance and an existing Redis cache layer. The overall architecture, endpoint structure, and data model remain unchanged, ensuring full comparability with prior results. Like in the previous research, all the services use PostgreSQL as the relational database, populated by the same synthetic data generators that produce about one million user records and a randomly distributed follows graph. This choice is not central to the current study, which focuses on concurrency behavior rather than database performance, but it maintains continuity and ensures that both the asynchronous and reactive implementations operate over identical data [
12].
The present study focuses exclusively on the additional components and scenarios introduced beyond the initial implementation. Specifically, it extends the existing system to analyze: the concrete behavior of caching on hot read and write paths, a strictly CPU-bound computation stage embedded within a request workflow, and a contained integration of an inherently blocking I/O operation representative of media streaming. By narrowing the scope to these incremental extensions, the study isolates and evaluates the distinct performance characteristics of asynchronous and reactive paradigms under controlled and well-defined workload types, without altering the broader system foundation. For reference, the overall system architecture is depicted in
Figure 1 [
12].
4.2. Caching Integrated in Existing Reads and Writes
The application already exposes user profile lookups, single-tweet retrieval, feed pagination, and per-tweet statistics. To evaluate caching behavior under reactive and asynchronous execution models, we integrated a Redis-based cache through Spring’s caching abstraction. This allows the system to remain compatible with other cache providers (including local in-memory or hybrid near-cache configurations), even though the present study focuses solely on Redis as the backing store.
Read operations follow standard cache-aside semantics. For each domain object, profile, tweet, feed page, or per-tweet statistics, the service computes a stable key derived from the domain identifier, checks the cache, and, on a miss, retrieves the value from the repository before storing it in Redis with an appropriate time-to-live. Shorter expirations are used for items that change frequently, such as feed pages and aggregated statistics.
Writes extend the existing logic with explicit invalidation and, where appropriate, write-through of small counters. After creating or editing a tweet, the service commits to the database then invalidates the cached tweet, affected feed pages, and any derived stats. Profile updates invalidate the cached profile and any feed views that render profile data. Engagement counters, such as likes or retweets, update the database and the cached counter in the same step when the cache is available. If the cache becomes unavailable, requests bypass it and continue against the database so that availability is not coupled to the cache tier. Because the baseline stack already includes Redis and a clear config surface, the reactive variant performs cache I/O through the non-blocking client inside the pipeline, while the asynchronous variant uses its matching client. None of these changes alter controllers, entities, or inter-service APIs described in the first paper.
4.3. CPU-Bound Processing Inside the Service
To study CPU pressure without introducing external I/O, we embed a pure in-memory image stage on the path that handles image uploads attached to tweets. The service accepts image bytes in common formats and decodes them in memory. It then produces two thumbnails, applies a grayscale followed by a light blur, and encodes the results back to JPEG for storage via the same persistence path as before. No intermediate files are written to disk. This design gives a deterministic amount of compute that scales with input size and can be tuned without changing endpoints or the data model. In the reactive implementation, the image stage is wrapped by an explicit scheduler boundary so work runs on a pool sized to cores rather than on event loop threads [
5]; concurrency is capped to maintain responsiveness under load. In the asynchronous implementation, the same compute runs on a fixed executor sized to the machine. External behavior and downstream storage stay identical to the baseline so that later sections can attribute differences to pipeline and scheduler behavior rather than to API changes.
4.4. Containing a Blocking Media Operation
Real-world platforms frequently handle media content that requires time-consuming transformation or transfer, introducing unavoidable blocking behavior within otherwise non-blocking systems. This makes such workloads ideal candidates for testing containment and isolation strategies.
The implemented scenario extends the application with a controlled blocking stage that simulates media processing under two operational patterns. For short media objects, the service performs the transformation inline within the request flow but delegates execution to a bounded elastic pool [
5], ensuring that the blocking operation does not occupy event-loop threads. Data is streamed progressively to prevent buffer saturation, and strict timeouts are enforced to maintain responsiveness. For longer or more demanding tasks, the system instead enqueues a background job and returns an immediate acknowledgment with a job identifier, while a separate worker component performs the processing asynchronously and emits a completion event once finished.
Both approaches propagate cancellation and failure signals predictably while constraining concurrency to prevent queue buildup or resource exhaustion. This design reflects common production strategies where lightweight transformations are performed inline, whereas heavy or long-running media operations are delegated to background workers. It supports the broader principle that complete elimination of blocking behavior is impractical in complex systems; instead, such operations should be explicitly contained, monitored, and isolated from the main request flow.
5. Implementation Details
The implementation was realized with the aim of providing fair, repeatable comparisons, using workloads and metrics that capture realistic performance patterns while exposing how each paradigm behaves under stress.
5.1. Caching Scenario and Redis Integrations
One of the examined scenarios focuses on caching operations, which represent a predominantly input/output-bound workload frequently encountered in distributed systems and social networking platforms. The functionality implemented in this context involves retrieving the list of accounts followed by a specific user. To ensure that the observed effects reflect realistic conditions rather than framework-level abstractions, the caching logic was implemented explicitly rather than relying on declarative annotations. This approach enabled precise control over serialization format, cache expiration policies, and the balance between cache and database interactions, ensuring consistent and reproducible benchmarking behavior.
The caching workflow follows a read-through model, in which the system first attempts to retrieve the data from the cache. In the event of a cache miss, the data is retrieved from the database, transformed into the required format, serialized, and stored back into the cache for subsequent requests. The core logic of this process is implemented explicitly in both paradigms, with equivalent behavior adapted to each concurrency model, as illustrated in Listing 1.
| Listing 1. Explicit cache read-through implementation in the asynchronous paradigm. |
@GetMapping(“/{userId}/following”) public CompletableFuture<byte[]> getFollowing(@PathVariable UUID userId) { return followService.getFollowing(userId); }
public CompletableFuture<byte[]> getFollowing(UUID userId) { String key = FOLLOWING_CACHE + “::” + userId; return CompletableFuture.supplyAsync(() -> { byte[] cached = redisTemplate.opsForValue().get(key); if (cached != null && cached.length > 0) { return cached; } var items = followRepository.findByFollowerIdAndStatus( userId, FollowEntity.Status.ACCEPTED ); var dtos = items.stream() .map(e -> followMapper.mapEntityToDto(e, userName)) .toList(); try { byte[] bytes = objectMapper.writeValueAsBytes(dtos); redisTemplate.opsForValue() .set(key, bytes, Duration.ofSeconds(60)); return bytes; } catch (Exception ex) { throw new RuntimeException(ex); } }, executorService); } |
The caching layer stores the computed data as raw byte arrays rather than higher-level data structures. This decision was motivated by the need to keep the experiment predominantly I/O-bound by avoiding repeated serialization and deserialization overhead on cache hits, ensuring that cache operations remain dominated by network and storage interactions at high concurrency levels. By maintaining the payloads in a binary representation, the cache operations focused solely on network and storage interactions, accurately capturing the performance implications of remote data retrieval. The same cache design was mirrored in the reactive paradigm, as presented in Listing 2, to maintain full methodological symmetry between the compared models.
| Listing 2. Equivalent reactive implementation of cache interaction. |
@GetMapping(“/{userId}/following”) public Mono<byte[]> getFollowing(@PathVariable UUID userId) { return followService.getFollowing(userId, null); }
public Mono<byte[]> getFollowing(UUID userId, String authToken) { String key = FOLLOWING_CACHE + “::” + userId; return redisTemplate.opsForValue().get(key) .filter(bytes -> bytes != null && bytes.length > 0) .switchIfEmpty(Mono.defer(() -> followRepository.findByFollowerIdAndStatus( userId, Status.ACCEPTED.name() ) .map(e -> followMapper.mapEntityToDto(e, userName)) .collectList() .flatMap(list -> { try { byte[] bytes = objectMapper .writeValueAsBytes(list); return Mono.just(bytes); } catch (Exception e) { return Mono.error(e); } }) .flatMap(bytes -> redisTemplate.opsForValue() .set(key, bytes, Duration.ofSeconds(60)) .thenReturn(bytes) ) )); } |
The use of direct Redis access through dedicated templates was preferred over declarative caching mechanisms to maintain methodological fairness between the two implementations. The standard caching abstraction available in the reactive framework was observed to perform blocking operations internally, which would have compromised the non-blocking nature of the reactive pipeline and distorted the experimental outcomes. Likewise, while the asynchronous framework supports annotation-based caching, the explicit use of the Redis template provided marginally better throughput and lower latency by reducing proxy overhead. Consequently, both paradigms employed direct Redis access through template-based clients, ensuring that the comparison measured differences in concurrency models rather than disparities in caching mechanisms.
To emulate realistic network latency and avoid artificially optimistic results due to local cache access, all cache operations were performed against a remote Redis instance routed through a Toxiproxy proxy layer, which introduced a bidirectional delay of approximately three milliseconds, with a jitter of one millisecond in each direction, resulting in a total round-trip latency of roughly six milliseconds with a total variation of ±2 ms. This configuration ensured that cache operations remained I/O-dominant and prevented the experiment from shifting toward CPU or memory-bound behavior.
The cache access distribution followed a 90/10 pattern, with approximately ninety percent of requests targeting a small subset of frequently accessed entries, while the remaining ten percent were distributed across infrequently accessed keys. This design specifically approximates the Zipfian distribution observed in production systems, where a minority of ‘hot’ content attracts the majority of traffic (Pareto principle). The ratio was chosen to avoid unrealistically uniform access patterns that might obscure differences in throughput and latency between the evaluated paradigms. Each cache entry is a JSON view derived from the synthetic users–follows dataset, which originates from roughly one million generated user records, while the caching workload itself operates over a 100,000-key subset. Approximately ten percent of these keys (10,000) form the hot set targeted by ninety percent of requests, ensuring consistent and comparable access patterns across both implementations.
Both variants of the application were connected to the same Redis deployment and employed connection pooling to manage resource utilization efficiently. The asynchronous version executed cache operations on a dedicated pool optimized for network-bound tasks, while the reactive version leveraged non-blocking event-driven scheduling inherent to its runtime environment. These choices were made to ensure that each paradigm operated under its respective concurrency model while keeping all other variables identical: key structure, serialization format, expiration time, and access distribution. The resulting setup isolated the influence of the execution model itself, allowing for an objective comparison of how asynchronous and reactive paradigms behave under I/O-intensive workloads with controlled latency and realistic caching dynamics.
5.2. CPU-Bound Workload and Image Processing Operations
Another analyzed workload reproduces a common multimedia scenario in which uploaded images are processed through a sequence of mathematical transformations, including Gaussian blurring, edge detection, and resizing, before returning a compressed result [
51]. It combines several arithmetic operations on large in-memory matrices and can easily saturate available CPU resources under concurrency.
The implemented workflow consists of several consecutive image-processing stages applied to each uploaded file: (1) color-space normalization, (2) three passes of Gaussian blur, (3) Sobel edge detection, (4) resizing to a fixed resolution of 256 × 256 pixels, and (5) JPEG compression with a fixed quality factor of 0.8. This specific sequence of floating-point intensive convolutions was chosen to ensure the workload remains strictly ALU-bound, minimizing the impact of memory bandwidth or I/O latency on the measurement. These steps are representative of practical image-filtering pipelines, where each transformation requires substantial pixel-level computation and exhibits strong data dependencies within each image frame. The general form of the Gaussian convolution [
51] applied in each blur pass is defined as
where
and
denotes the chosen kernel radius. The filter operates by convolving the source image with the kernel matrix
over both horizontal and vertical directions, as shown in Listing 3.
| Listing 3. Gaussian blur operation used in the image-processing pipeline. |
private BufferedImage gaussianBlur(BufferedImage src, int radius) { if (radius < 1) return src; int w = src.getWidth(), h = src.getHeight(); BufferedImage dst = new BufferedImage( w, h, BufferedImage.TYPE_INT_RGB ); float[] kernel = gaussian(radius); int[] pixels = new int[w * h]; int[] temp = new int[w * h]; src.getRGB(0, 0, w, h, pixels, 0, w); //Horizontal and vertical convolution passes omitted return dst; } |
After the blur passes, a Sobel operator [
51] is applied to detect edges by approximating image gradients. The gradient components in the horizontal and vertical directions are computed using discrete kernels
and the resulting magnitude is obtained as
where
denotes the input image and
represents the convolution operator. The implementation of the operator is provided in Listing 4.
| Listing 4. Sobel edge-detection operator. |
private BufferedImage sobel(BufferedImage src) { int w = src.getWidth(), h = src.getHeight(); BufferedImage dst = new BufferedImage( w, h, BufferedImage.TYPE_INT_RGB ); int[] gx = {-1, 0, 1, -2, 0, 2, -1, 0, 1}; int[] gy = {-1, -2, -1, 0, 0, 0, 1, 2, 1}; for (int y = 1; y < h - 1; ++y) for (int x = 1; x < w - 1; ++x) {//described operations } return dst; } |
The processed image is subsequently resized and compressed using a lossy JPEG encoding function that accepts a quality parameter q, which determines the quantization level and the trade-off between size and fidelity:
where I represents the processed image,
the resulting encoded image, and
the selected compression quality.
Each request performs multiple full-image passes followed by compression, causing computational load and small waiting time on external resources. Both implementations process the same image data and apply the same transformations, differing only in their concurrency management and execution models. The presented experiment used a single 256 × 256 RGB input image, ensuring identical per-request computation and eliminating variability arising from heterogeneous or unpredictable image content.
In the asynchronous implementation, task execution is delegated to a dedicated pool of worker threads equal to the number of available processor cores, ensuring that each task can operate without excessive context switching. The delegation to this pool is presented in Listing 5.
| Listing 5. Asynchronous execution of CPU-bound media processing on a dedicated thread pool. |
private final ExecutorService executorService = Executors .newFixedThreadPool(Runtime.getRuntime().availableProcessors());
public CompletableFuture<ResponseEntity<byte[]>> process( MultipartFile file ) { return CompletableFuture.supplyAsync(() -> { try { byte[] input = file.getBytes(); byte[] result = run(input); return ResponseEntity.ok() .contentType(MediaType.IMAGE_JPEG) .body(result); } catch (IOException e) { throw new RuntimeException(e); } }, executorService); } |
The thread pool size was strictly configured to match the available processor cores
This configuration represents the theoretical optimum for CPU-bound workloads, as it maximizes hardware utilization while minimizing the context-switching overhead associated with over-provisioning. Deviating from this ratio (e.g., increasing pool size) would artificially degrade the performance of the asynchronous model by introducing avoidable scheduler contention, thereby obscuring the architectural comparison.
In contrast, the reactive implementation delegates computation to a parallel scheduler specifically optimized for CPU-intensive workloads. This scheduler creates one worker per available core and executes the transformation pipeline concurrently while preserving non-blocking semantics [
5]. The corresponding delegation is shown in Listing 6.
| Listing 6. Reactive execution of CPU-bound media processing on a parallel scheduler. |
public Mono<ResponseEntity<byte[]>> process(FilePart file) { return DataBufferUtils.join(file.content()) .map(this::toBytesAndRelease) .flatMap(bytes -> Mono.fromCallable(() -> run(bytes)) .subscribeOn(Schedulers.parallel()) ) .map(result -> ResponseEntity.ok() .contentType(MediaType.IMAGE_JPEG) .body(result)); } |
The comparison isolates the effects of the concurrency model and scheduling strategy. The asynchronous variant relies on a fixed thread pool explicitly sized to the hardware configuration, while the reactive version uses a parallel scheduler that dynamically partitions computation across the same number of cores. These design choices eliminate discrepancies caused by unequal thread availability or task queuing, enabling a direct comparison of efficiency and resource utilization in a purely CPU-bound context.
5.3. Blocking I/O and Streaming Workloads
In addition to purely computational and cache-oriented scenarios, modern distributed systems frequently involve long-lived connections that stream data to clients at constrained throughput levels. To evaluate how the two paradigms behave under such conditions, a blocking scenario was simulated in which the server streams a fixed-size binary payload to the client in small chunks at a controlled rate. Each response transfers a fixed amount of data, split into chunks, with an artificial delay introduced between writes to emulate a limited outbound bandwidth. The delay for each chunk is computed proportional to the size, and the thread responsible for streaming remains occupied for the entire duration of the transfer. This design ensures that the dominant cost of the scenario is the combination of blocking writes and timed waiting, rather than CPU-intensive computation or external network variability.
In the asynchronous variant, the application relies on servlet-based asynchronous request processing to decouple request handling from the main container threads, delegating streaming operations to a dedicated pool configured specifically for blocking I/O. The configuration defines an executor with 1000 worker threads and a large queue capacity, which is registered as the default executor for asynchronous processing. For each request, a streaming body is created that repeatedly generates deterministic byte patterns, writes them to the response output stream, and parks the current thread for the computed interval between chunks. This implementation keeps the streaming logic simple and fully blocking, allowing the scenario to stress the capacity of the dedicated pool and the server threads under high concurrency, as illustrated in Listing 7.
| Listing 7. Asynchronous blocking I/O streaming on a dedicated executor. |
@Bean public ThreadPoolTaskExecutor ioExecutor() { ThreadPoolTaskExecutor ex = new ThreadPoolTaskExecutor(); ex.setCorePoolSize(1000); ex.setMaxPoolSize(1000); ex.setQueueCapacity(100_000); ex.setThreadNamePrefix(“mvc-io-”); ex.initialize(); return ex; } while (remaining > 0) { out.write(buf, 0, n); remaining -= n; long nanos = (long)((n * 1_000_000_000.0)/BYTES_PER_SEC); LockSupport.parkNanos(nanos); } |
The reactive implementation follows the same functional specification but is adapted to a non-blocking runtime. A dedicated scheduler is configured using a bounded elastic pool [
5] with up to 1000 worker threads and a bounded queue, mirroring the size and capacity choices made in the asynchronous configuration. The streaming logic itself is implemented as a lazily generated sequence of buffers, where each buffer contains a deterministic byte pattern and represents a single chunk of the overall payload. For each element, the remaining byte count is updated, the chunk is emitted as a data buffer, and the producing thread is explicitly parked for the same computed interval as in the asynchronous variant. The entire generation process is executed on the dedicated scheduler so that the event-loop threads remain free to handle connection management and protocol-level work, as presented in Listing 8.
| Listing 8. Reactive blocking I/O streaming on a dedicated scheduler. |
Scheduler readScheduler = Schedulers.newBoundedElastic( 1000, 100_000, “blocking-read”, 60, true );
Flux<DataBuffer> body = Flux.generate(sink -> { if (remaining <= 0) sink.complete(); else { DataBuffer db = factory.wrap(nextChunk()); sink.next(db); LockSupport.parkNanos(delayNanos); } }).subscribeOn(readScheduler); |
In both implementations, the same payload size, chunk size, and effective throughput are enforced, and the streaming logic deliberately occupies a worker for the entire duration of the transfer. In the presented test, the streamed payload consisted of a fixed 256 KiB binary buffer delivered in four 64 KiB chunks, with the per-chunk delay calibrated to a target throughput of approximately 6.25 MB/s. The only systematic differences arise from the underlying concurrency and scheduling strategies: the asynchronous application relies on servlet-based asynchronous processing and a large pool of blocking workers, whereas the reactive application delegates generation to a bounded scheduler while keeping event-loop threads unblocked. By controlling all other parameters, such as payload characteristics, timing, response headers, and connection behavior, the scenario isolates the impact of handling blocking-style workloads in each paradigm and highlights the trade-offs between thread-per-request and event-driven execution models under sustained streaming load.
5.4. Monitoring and Instrumentation of Thread Pools
Observability of concurrency structures is essential for evaluating performance and for enabling adaptive scaling in production environments. Both paradigms expose configurable thread pools or schedulers that can be instrumented through Micrometer and the Spring Boot Actuator to publish Prometheus-compatible metrics.
In the asynchronous application, the configured I/O executor can be monitored directly because it is backed by a standard ThreadPoolExecutor. By registering a few gauges on the queue and active thread count, the application exports real-time utilization and saturation data through the/actuator/prometheus endpoint. These metrics, shown in Listing 9, provide immediate visibility into I/O backlog and thread usage.
| Listing 9. Example of metric registration for the asynchronous I/O executor. |
Gauge.builder( “mvc_io_queue_utilization”, q, queue -> (double) queue.size()/(queue.size() + queue.remainingCapacity()) ) .description(“Queue fill ratio for MVC ioExecutor (0..1)”) .register(registry);
Gauge.builder( “mvc_io_thread_utilization”, executor, ex -> (double) ex.getActiveCount()/ex.getMaximumPoolSize() ) .description(“Active threads/max threads for MVC ioExecutor”) .register(registry); |
In the reactive application, internal schedulers such as boundedElastic do not expose their queue state or task capacity through the public API. For precise monitoring, it is therefore recommended to build custom schedulers backed by instrumented executors, enabling the same Micrometer integration as in the asynchronous case. However, because most production systems rely on Reactor’s built-in boundedElastic scheduler [
5], this study also implemented an experimental solution that inspects its internal fields reflectively to obtain comparable metrics. The simplified version is illustrated in Listing 10.
| Listing 10. Reflection-based extraction of queue metrics from the bounded-elastic scheduler. |
Gauge.builder(“reactor_bounded_elastic_queue_utilization”, this, m -> { Values v = m.readValues(); return (v == null || v.maxTasksTotal <= 0) ? Double.NaN : (v.maxTasksTotal - v.remainingCapacity)/ (double) v.maxTasksTotal; }).register(registry); |
While this approach provides parity between paradigms for experimental analysis, it depends on internal, non-public classes and should therefore be validated after framework updates [
5]. Once exposed, these metrics can be visualized in unified Prometheus dashboards or used by autoscaling systems such as HPA or KEDA, providing an accurate reflection of actual concurrency utilization [
20].
6. Evaluation of Results
The evaluation of results gathered from the extended implementation focuses on verifying the functional equivalence of the asynchronous and reactive variants, followed by a comparative analysis of their performance under distinct workload types. The goal is to ensure that any observed differences are attributable solely to the concurrency model rather than to application logic, configuration, or infrastructure discrepancies.
6.1. Functional Equivalence and Experimental Methodology
Both implementations share the same service architecture and functional scope. The extensions introduced in this work, caching mechanisms, CPU-bound media processing, and controlled blocking I/O, were integrated without altering the public API or data model. This design continuity guarantees a direct and unbiased comparison between paradigms, with all differences attributable solely to concurrency and execution models rather than to business logic or persistence design.
The verification process combined extensive automated testing with controlled performance experiments. Each service maintained or extended its suite of JUnit5 unit tests and Cucumber-based behavior-driven scenarios, covering both component-level and end-to-end functionality. Across both implementations, approximately 150 tests per service were executed, consistently achieving over 90% code coverage and producing identical results for all core operations, including the newly added workloads. Static configuration parameters, CI/CD pipelines, and database schemas were preserved between paradigms, while minor variations in startup time or memory footprint reflected only framework-level differences. For the persistence layer, the asynchronous variant uses JDBC, while the reactive variant uses R2DBC, reflecting the typical blocking vs. non-blocking database access choices in Spring-based stacks [
24].
Beyond functional validation, a comprehensive benchmarking methodology was employed to ensure reproducible and representative performance evaluation. Each test scenario, covering I/O-bound, CPU-bound, and blocking workloads, was executed using k6 as the load-testing tool, replacing the JMeter setup from the previous study to allow finer-grained control and automation, collecting the RPS and latency for each experiment [
12]. Metrics for CPU utilization and heap memory were collected at one-second intervals via Spring Boot Actuator endpoints, providing continuous measurement over time rather than point samples, replacing the VisualVM setup [
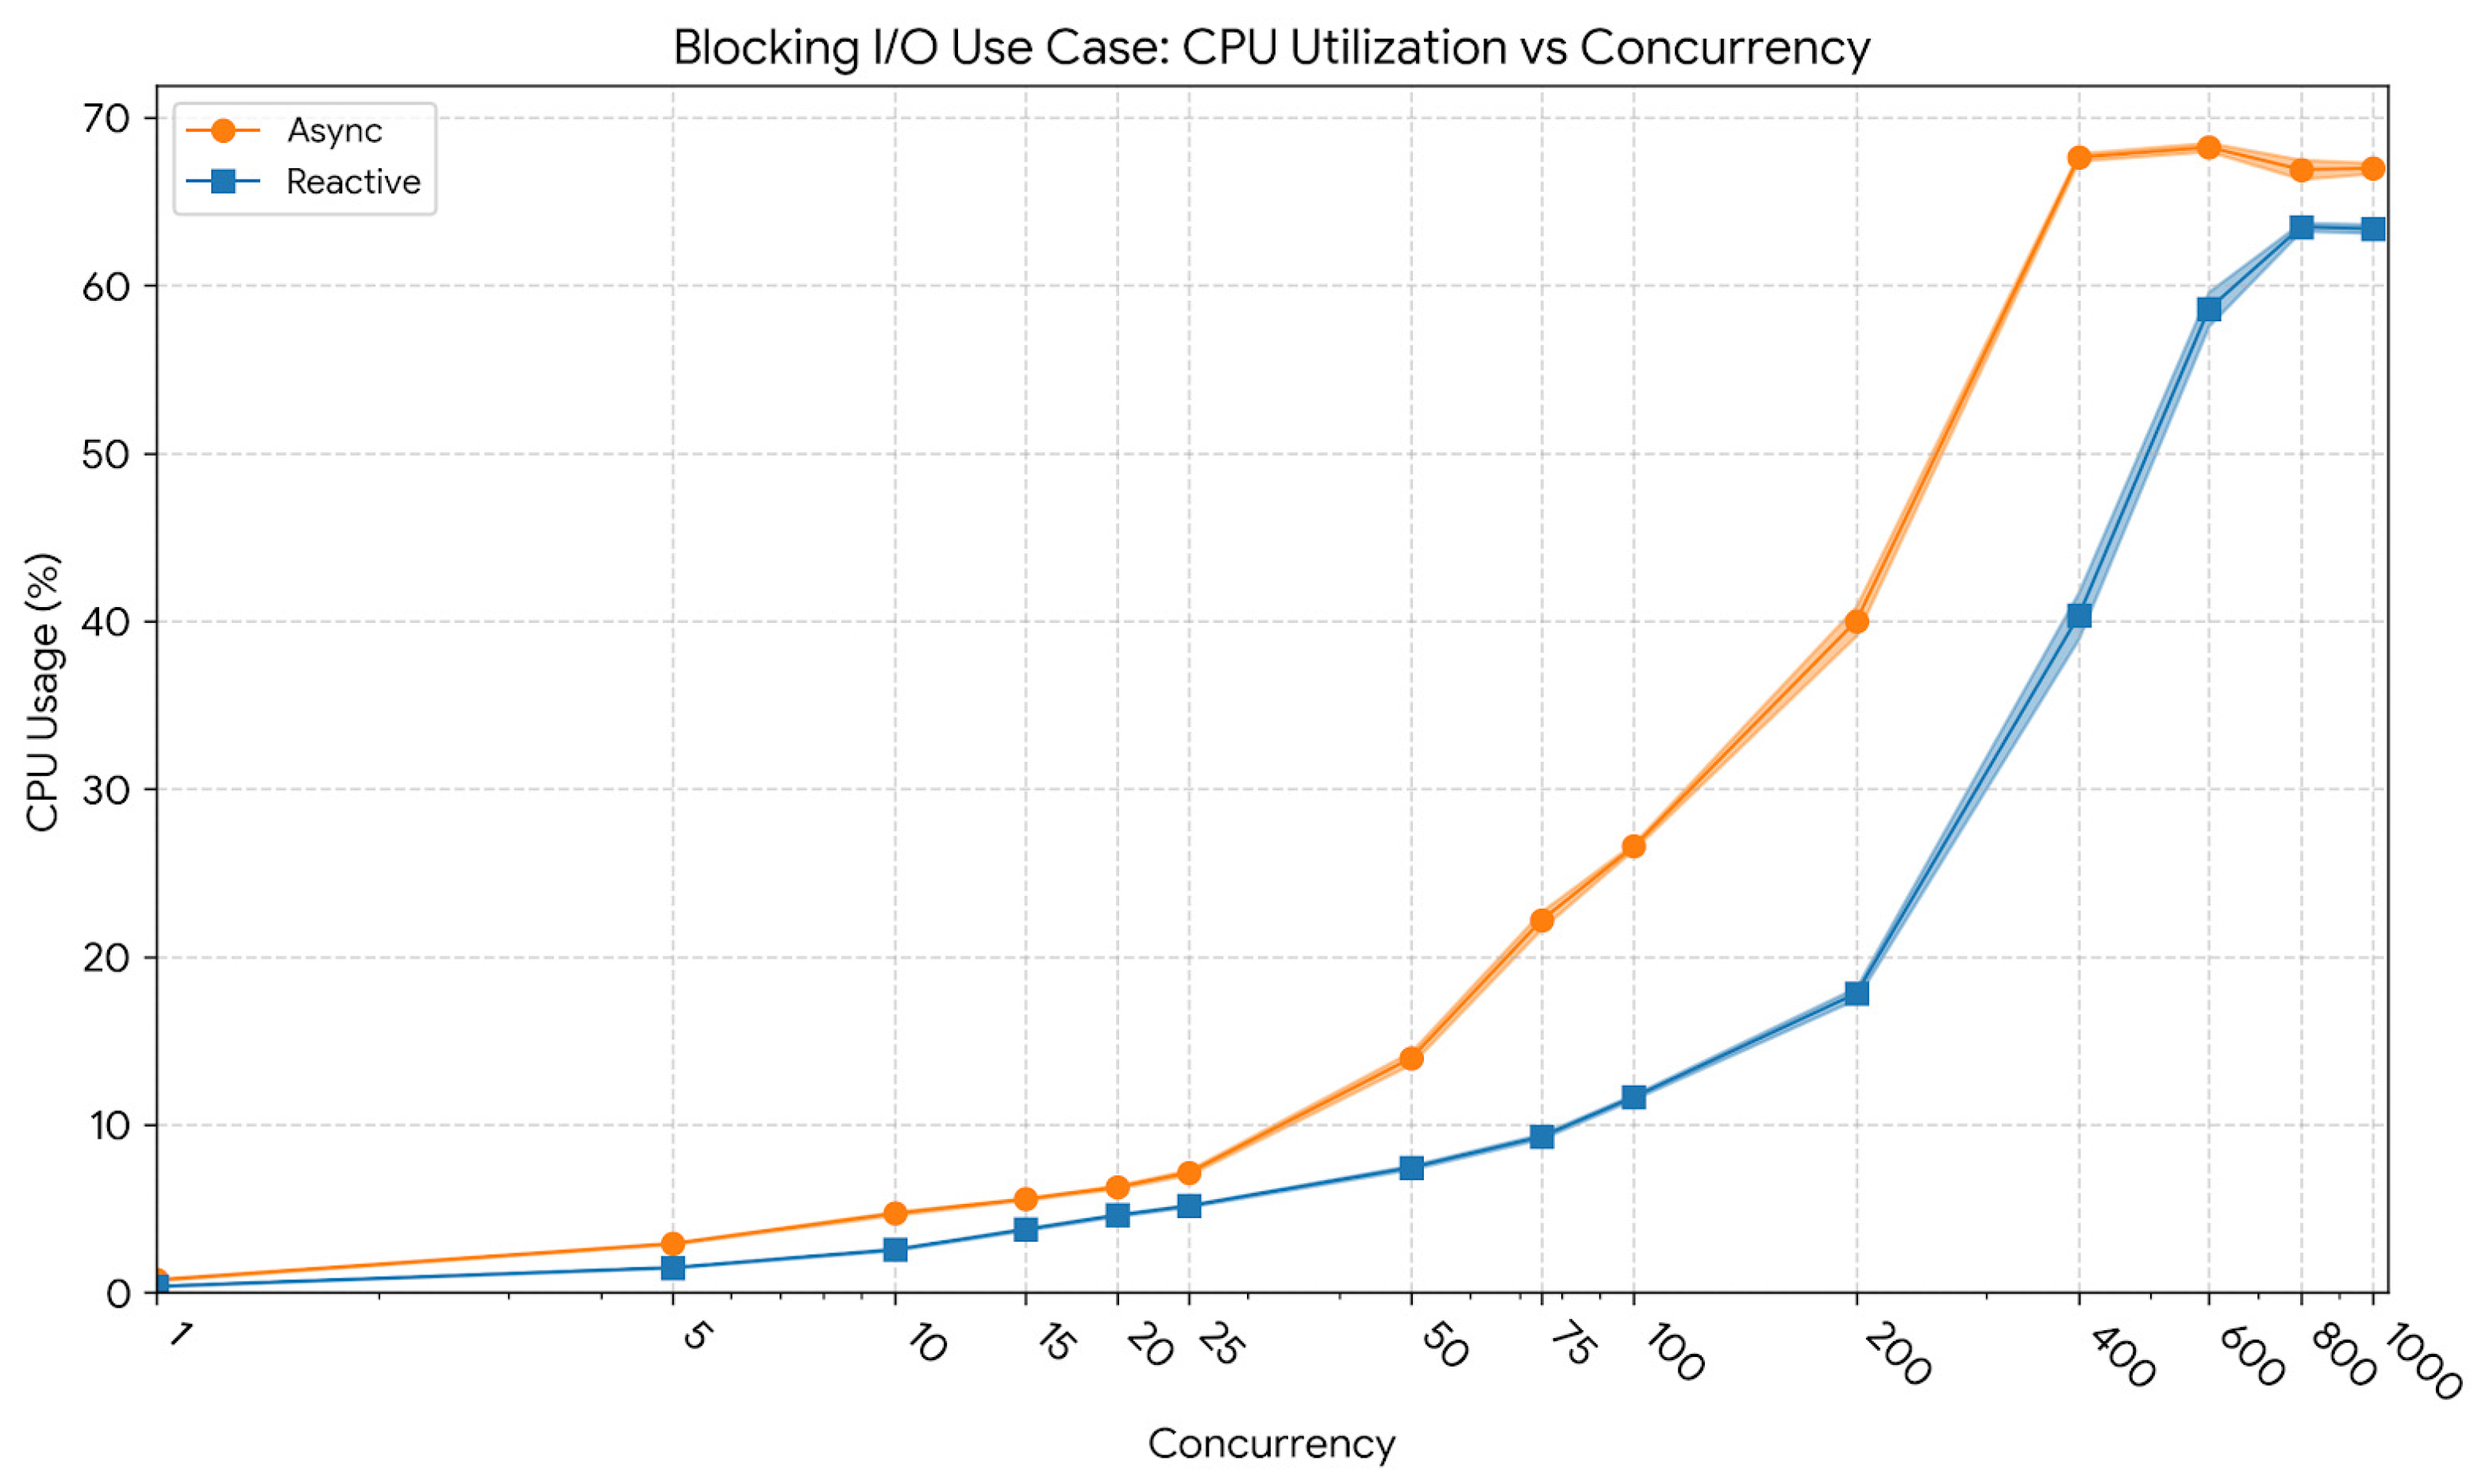
12]. To ensure statistical robustness, all collected samples were aggregated to compute formal performance metrics, including standard deviation (σ), 95th-percentile (p95), and 95% confidence intervals (CI95) distributions. In all performance plots, solid lines represent mean values aggregated across repetitions, while shaded ribbons denote the corresponding 95% confidence intervals (CI95). In cases where measurement variability was negligible, the CI95 bands collapse into the mean curve and may therefore not be visually distinguishable at certain concurrency levels.
For every paradigm and workload type, tests were executed at up to 14 concurrency levels, ranging from 1 and up to 1000 concurrent users, with five independent repetitions per level to account for possible variations. Each run lasted approximately four minutes, including a one-minute warm-up phase that was excluded from statistical aggregation to eliminate jitter. This procedure resulted in roughly 5 h of sustained runtime per workload, with the aim to also account for the effects of software aging, ensuring long-term stability and reproducibility across multiple executions. Regarding data hygiene, a statistical protocol was prepared to filter outliers deviating more than three standard deviations from the mean. However, throughout the collected runs, the measurements exhibited sufficient stability such that no data points required exclusion under this criterion. Consequently, the only data removed from the final analysis was the warm-up interval, ensuring the aggregated results reflect the sustained steady-state performance observed in this environment.
All experiments were conducted in a local containerized environment that was operated under LAN, which ensured negligible network latency between services and the load generator while maintaining consistent timing characteristics across runs. This controlled setup enabled accurate measurement of concurrency effects without interference from variable network conditions typically encountered in distributed or Internet-scale environments.
To isolate the core performance of the services, authentication and authorization mechanisms (JWT validation and token propagation) were temporarily disabled during testing. This decision removed cryptographic overhead and external dependencies, allowing the analysis to focus strictly on the impact of the concurrency model, thread scheduling, and internal I/O performance.
All tests were executed in a local environment, the machine used is a 16-inch MacBook Pro (M3 Max, 16 CPU cores, 40 GPU cores, 64 GB unified memory) running macOS and Docker-based service orchestration. To ensure the reproducibility of the baseline measurements without introducing proprietary tuning bias, the JVM was configured with the default G1 Garbage Collector (G1GC) and fixed heap sizing (4GB) across all experimental runs. The test harness executed all requests against the same host network context, ensuring stable CPU affinity, predictable scheduling behavior, and fully reproducible results. Compared to the prior study, this setup provided higher precision in metric collection, improved repeatability, and a better approximation of real-world steady-state performance [
12].
This combination of functional verification, deterministic configuration, and controlled benchmarking provides a rigorous foundation for analyzing the comparative efficiency and scalability of the asynchronous and reactive paradigms in the following sections. A summary of all executed tests is provided in
Table 2, covering both the functional validation suite and the extended performance benchmarking introduced in this study. The table also accounts for the tests from the previous work, providing a complete view of the experimental coverage and total testing effort across both asynchronous and reactive implementations [
12].
6.2. Evaluation of Caching Impact on Throughput and Resource Utilization
The introduction of a caching layer was further evaluated under concurrent conditions to determine its impact on throughput, latency, and resource consumption. The test plan replicated the same concurrency-ramp strategy as in the previous experiments, gradually increasing the number of simultaneous virtual users from 1 up to 1000, with five independent repetitions for each level. Each scenario was executed using the updated caching-enabled endpoints for both asynchronous and reactive implementations, and metrics were continuously collected via Spring Boot Actuator endpoints. The aggregated data, including the mean, standard deviation, and 95% confidence intervals, provided a statistically grounded comparison of performance stability across concurrency levels.
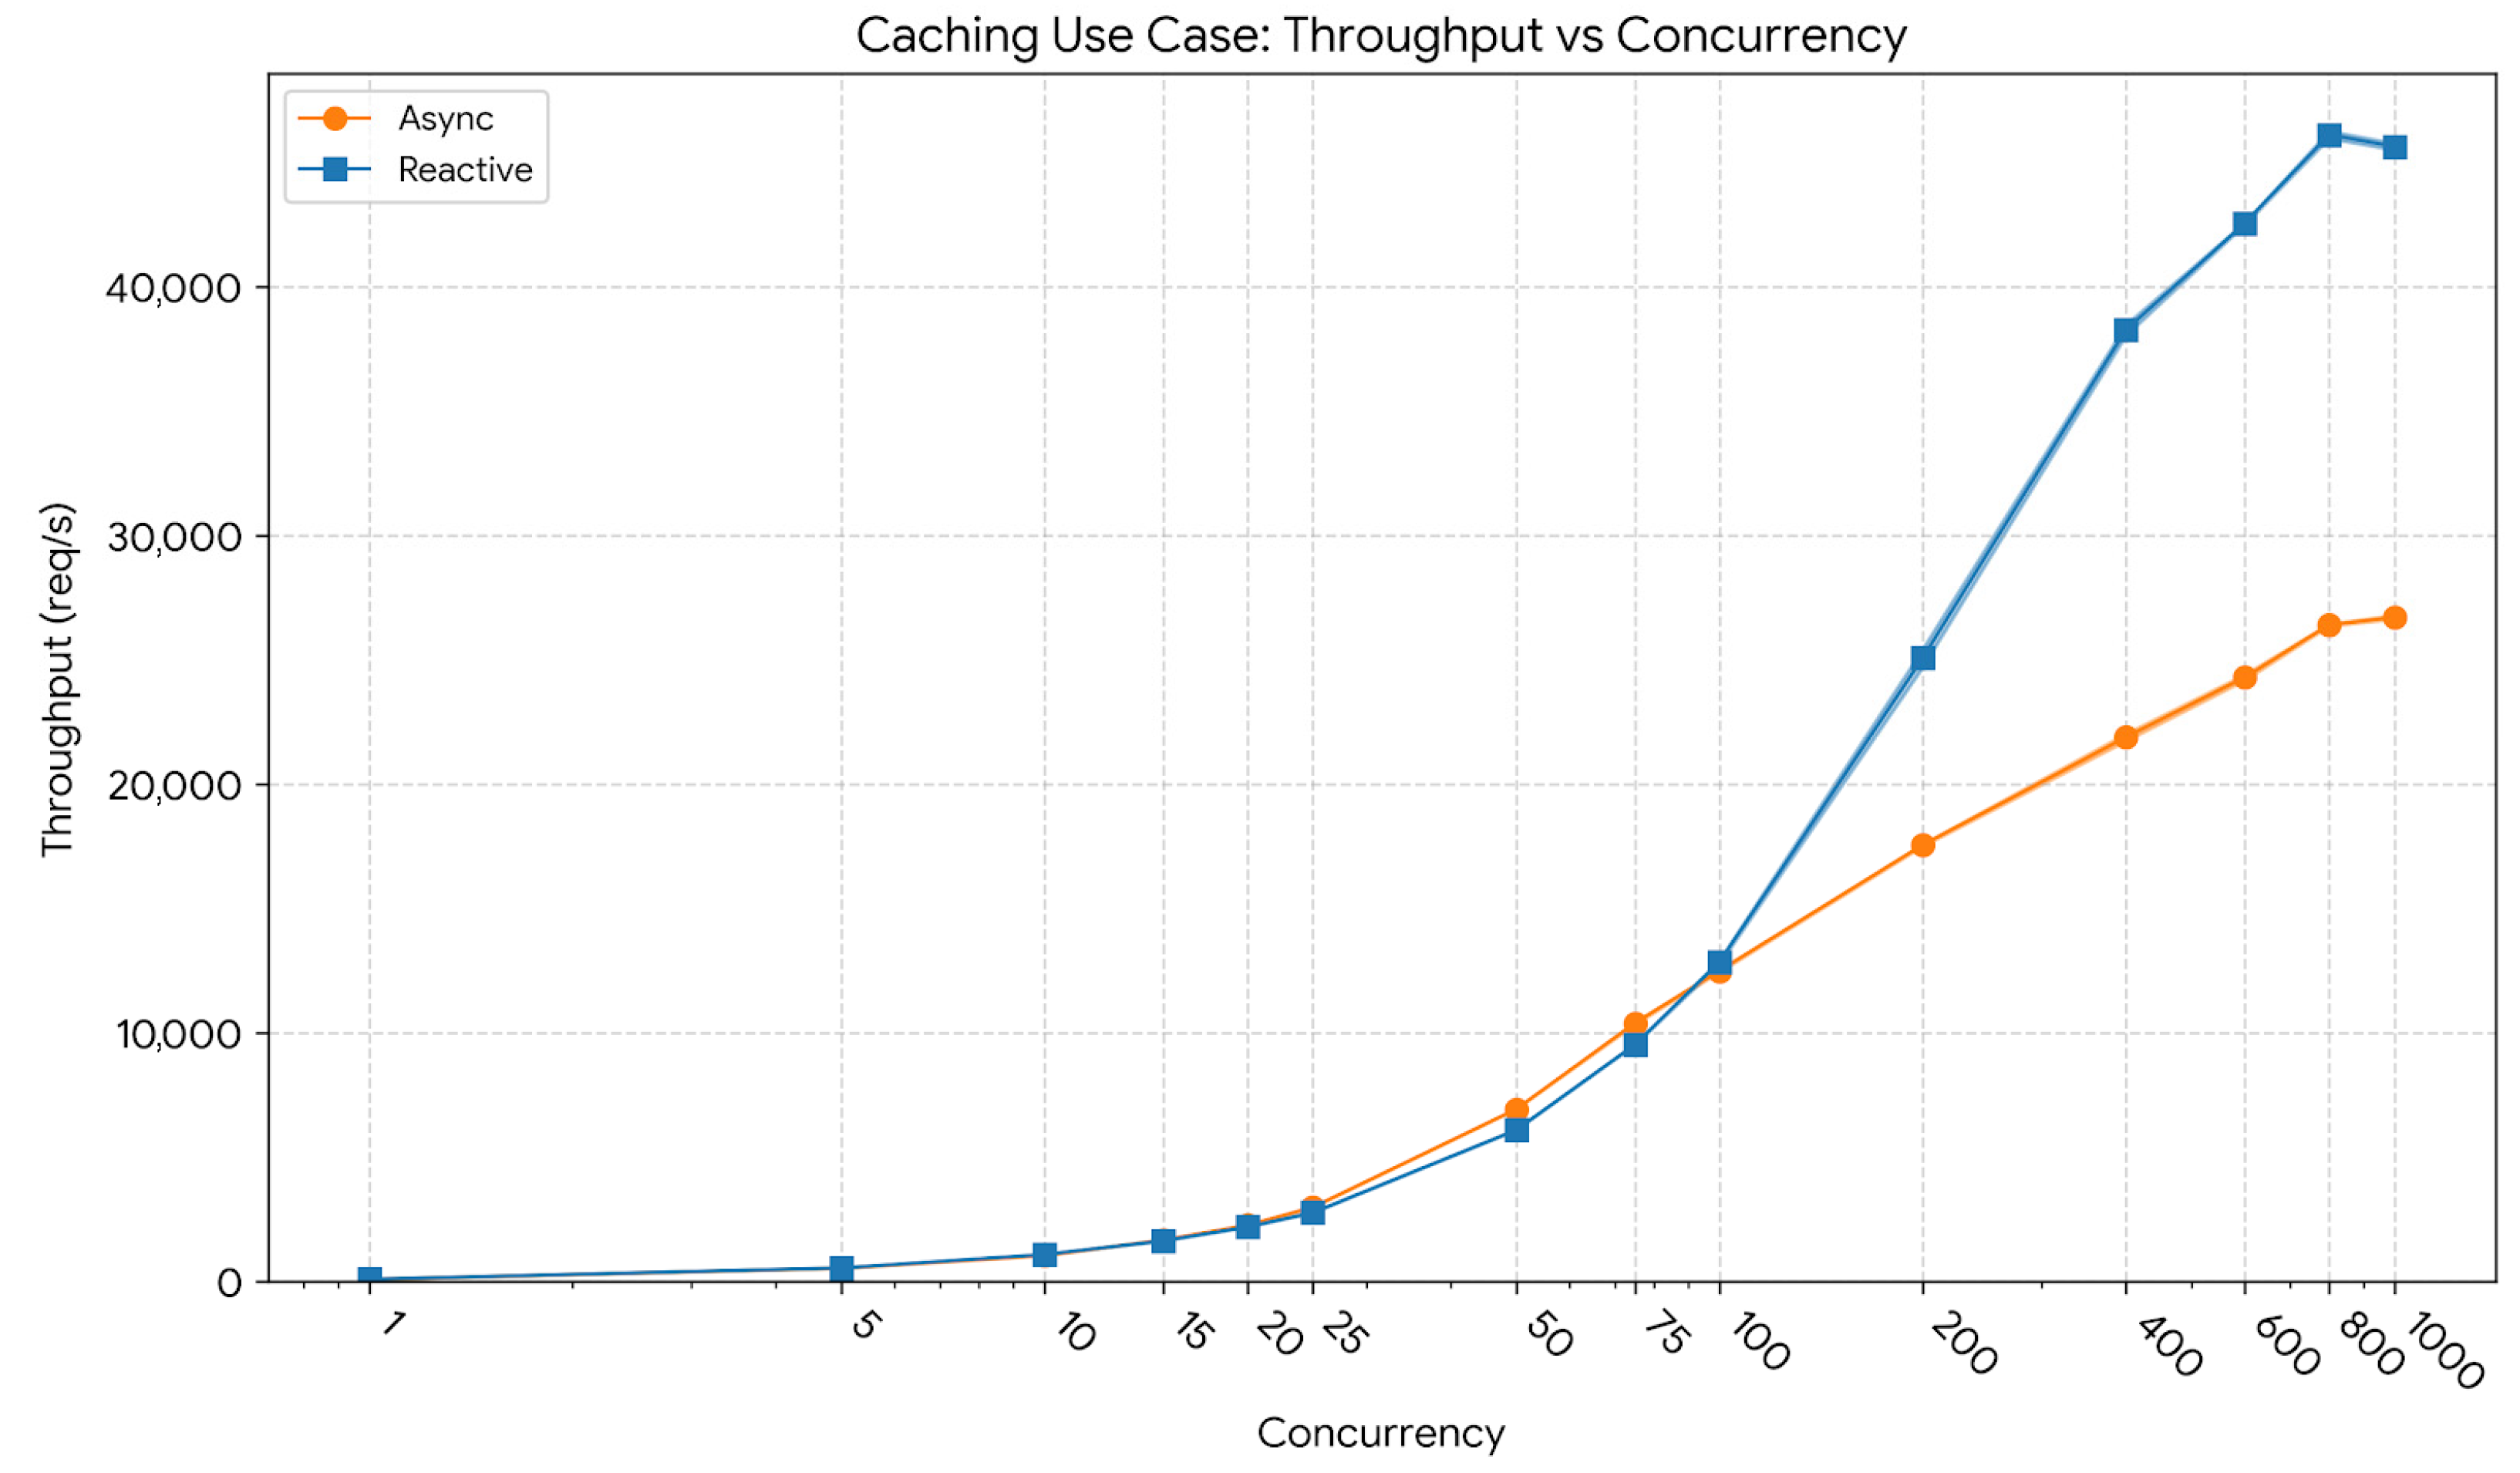
Figure 2 presents the throughput evolution across increasing concurrency levels for the caching workload. At a low concurrency level of 10 users, the reactive model achieved an average throughput of 1094 req/s (CI95: 1092–1096), compared to 1054 req/s (CI95: 1048–1060) for the asynchronous model. At a mid-concurrency level of 400 users, throughput increased sharply, reaching 38,263 req/s (CI95: 38,035–38,490) for the reactive implementation versus 21,892 req/s (CI95: 21,739–22,045) for the asynchronous one. At the peak concurrency of 1000 users, the reactive model sustained 45,641 req/s (CI95: 45,496–45,785), compared to 26,724 req/s (CI95: 26,642–26,806) for the asynchronous backend, representing a throughput improvement of approximately 70%. These results indicate that the reactive caching pipeline scales substantially better under heavy parallel load, maintaining high request-processing efficiency even near saturation.
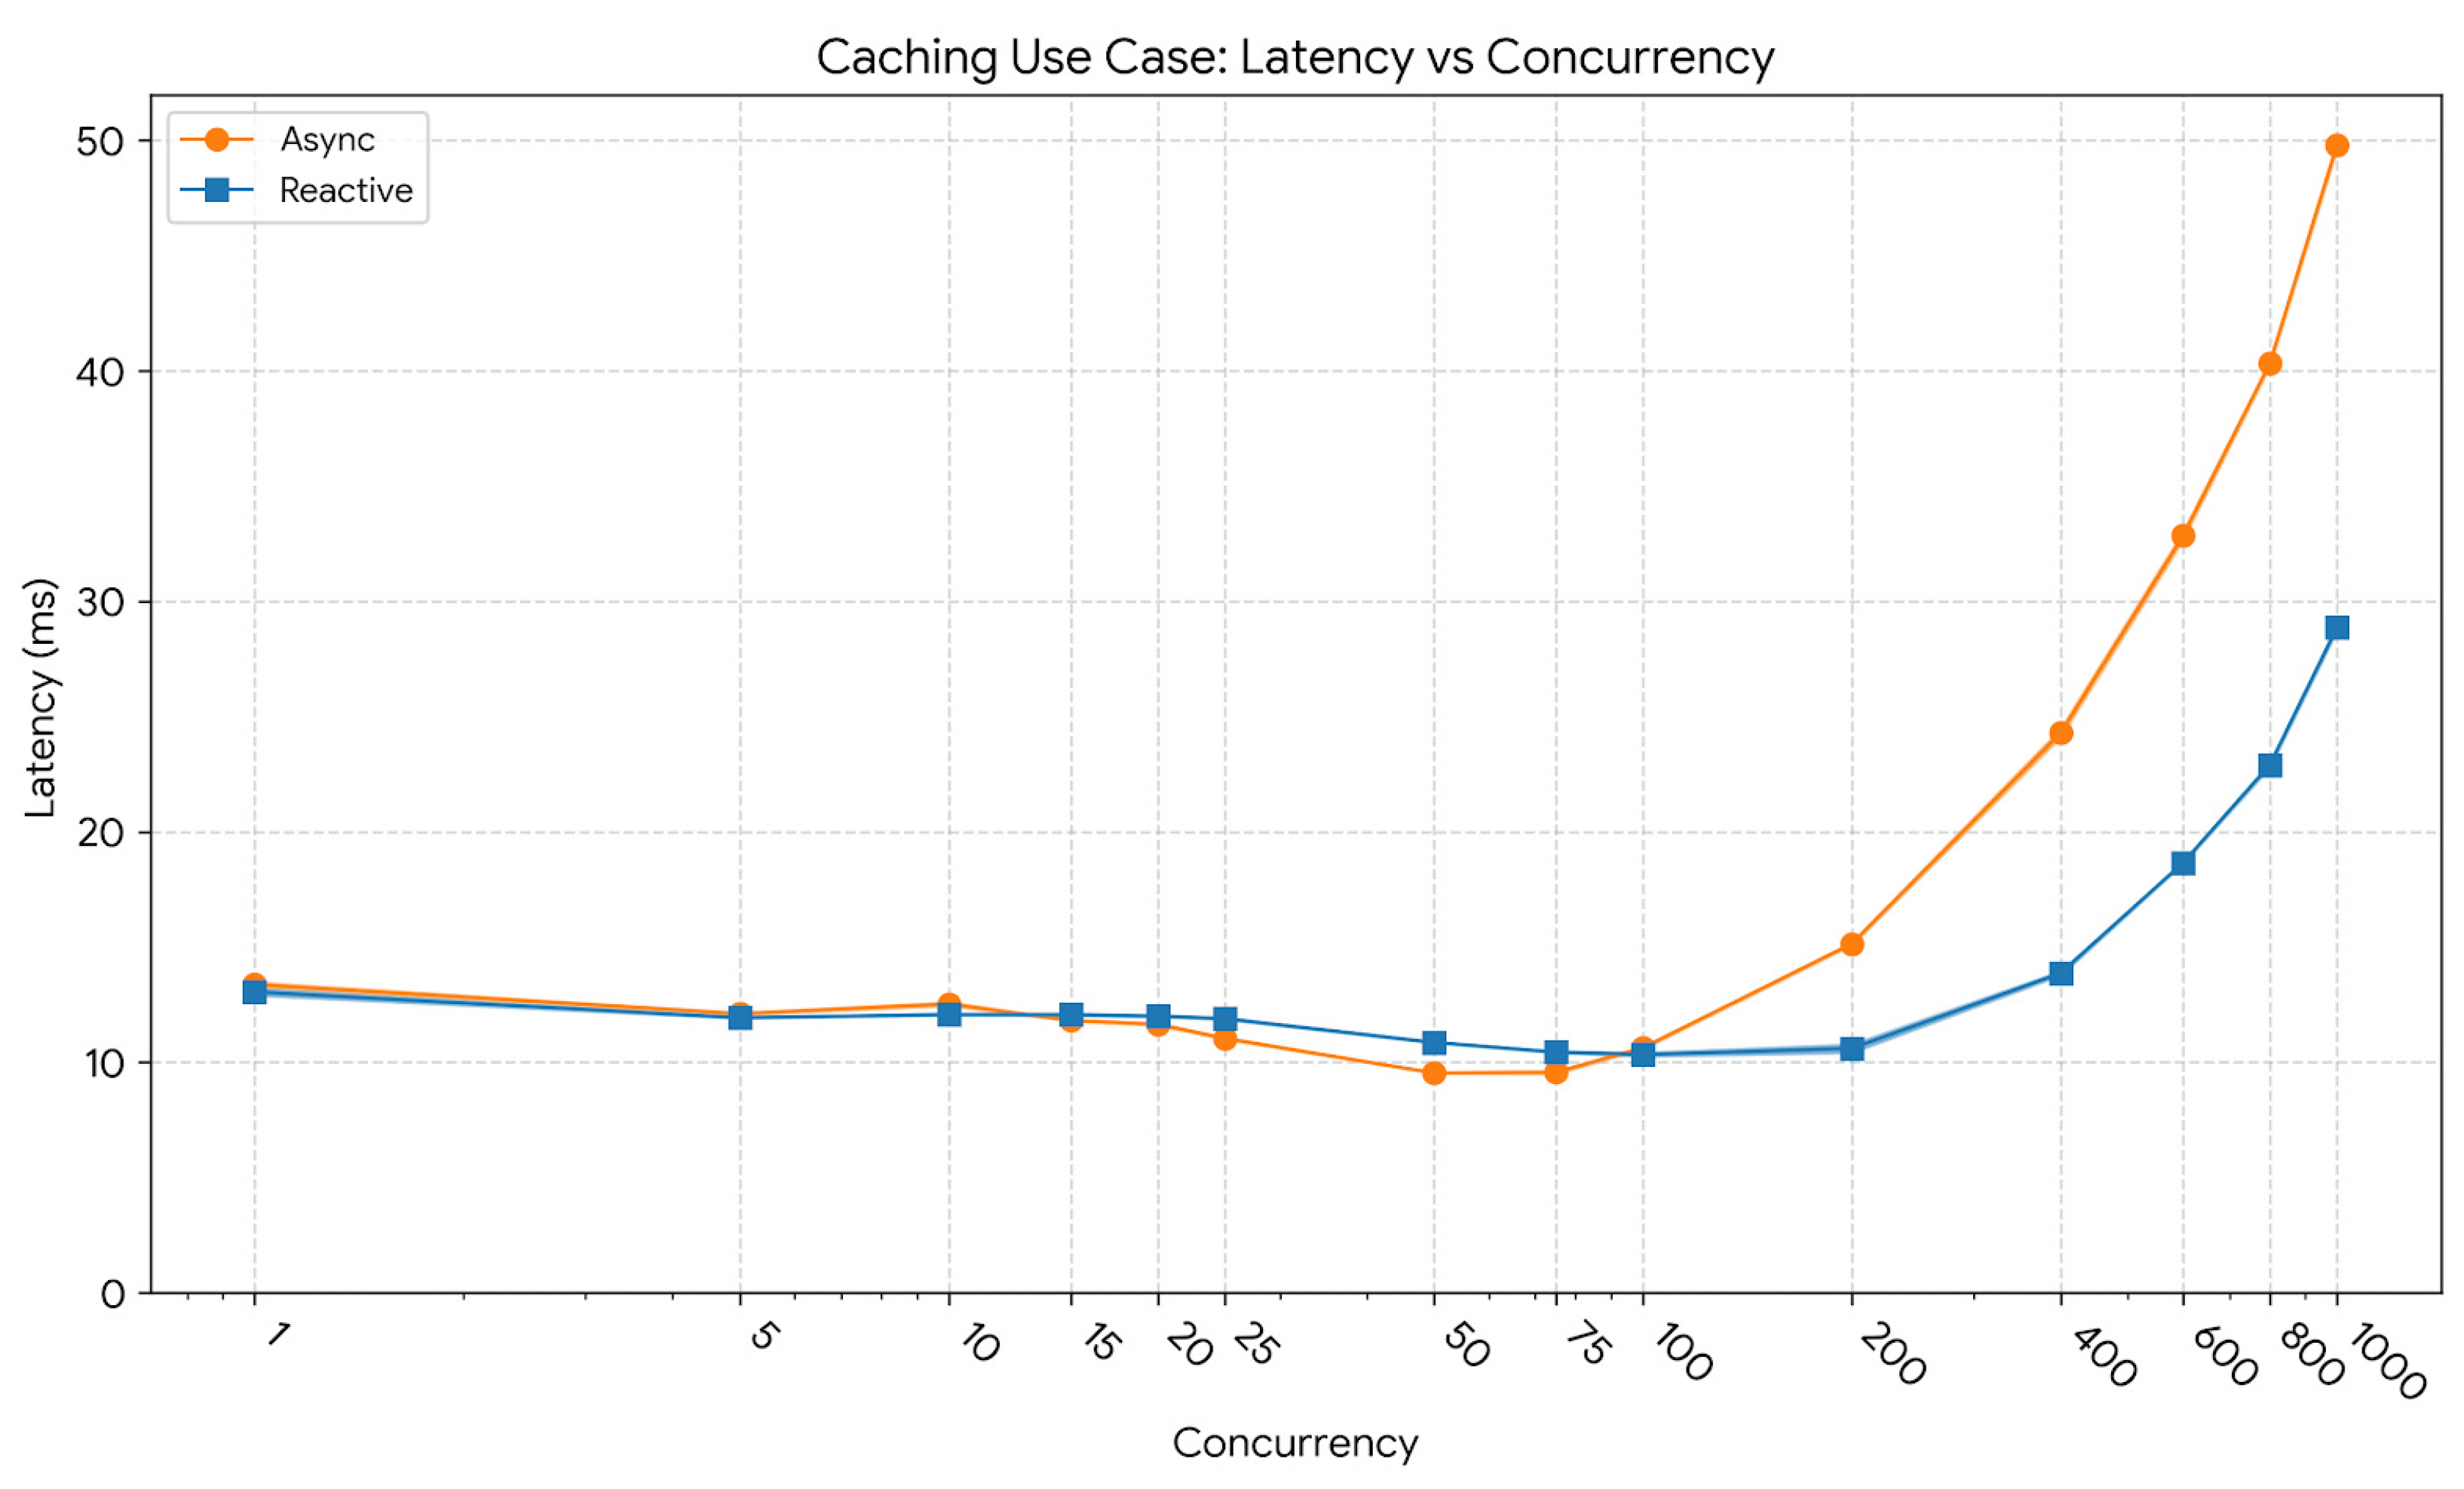
The corresponding latency evolution is shown in
Figure 3. At low concurrency (10 users), the reactive model exhibited an average latency of 12.08 ms and a p95 latency of 22.19 ms, marginally below the asynchronous model’s 12.53 ms and 22.35 ms, confirming equivalent baseline responsiveness. As concurrency increased to 400 users, latency remained well controlled for the reactive implementation, with an average of 13.87 ms and a p95 of 18.05 ms, while the asynchronous variant reached 24.30 ms and 37.18 ms. At 1000 users, the reactive pipeline maintained an average latency of 28.87 ms and a p95 of 45.39 ms, whereas the asynchronous variant exhibited 49.80 ms and 84.02 ms, reflecting a smoother and more predictable response-time distribution as load intensified.
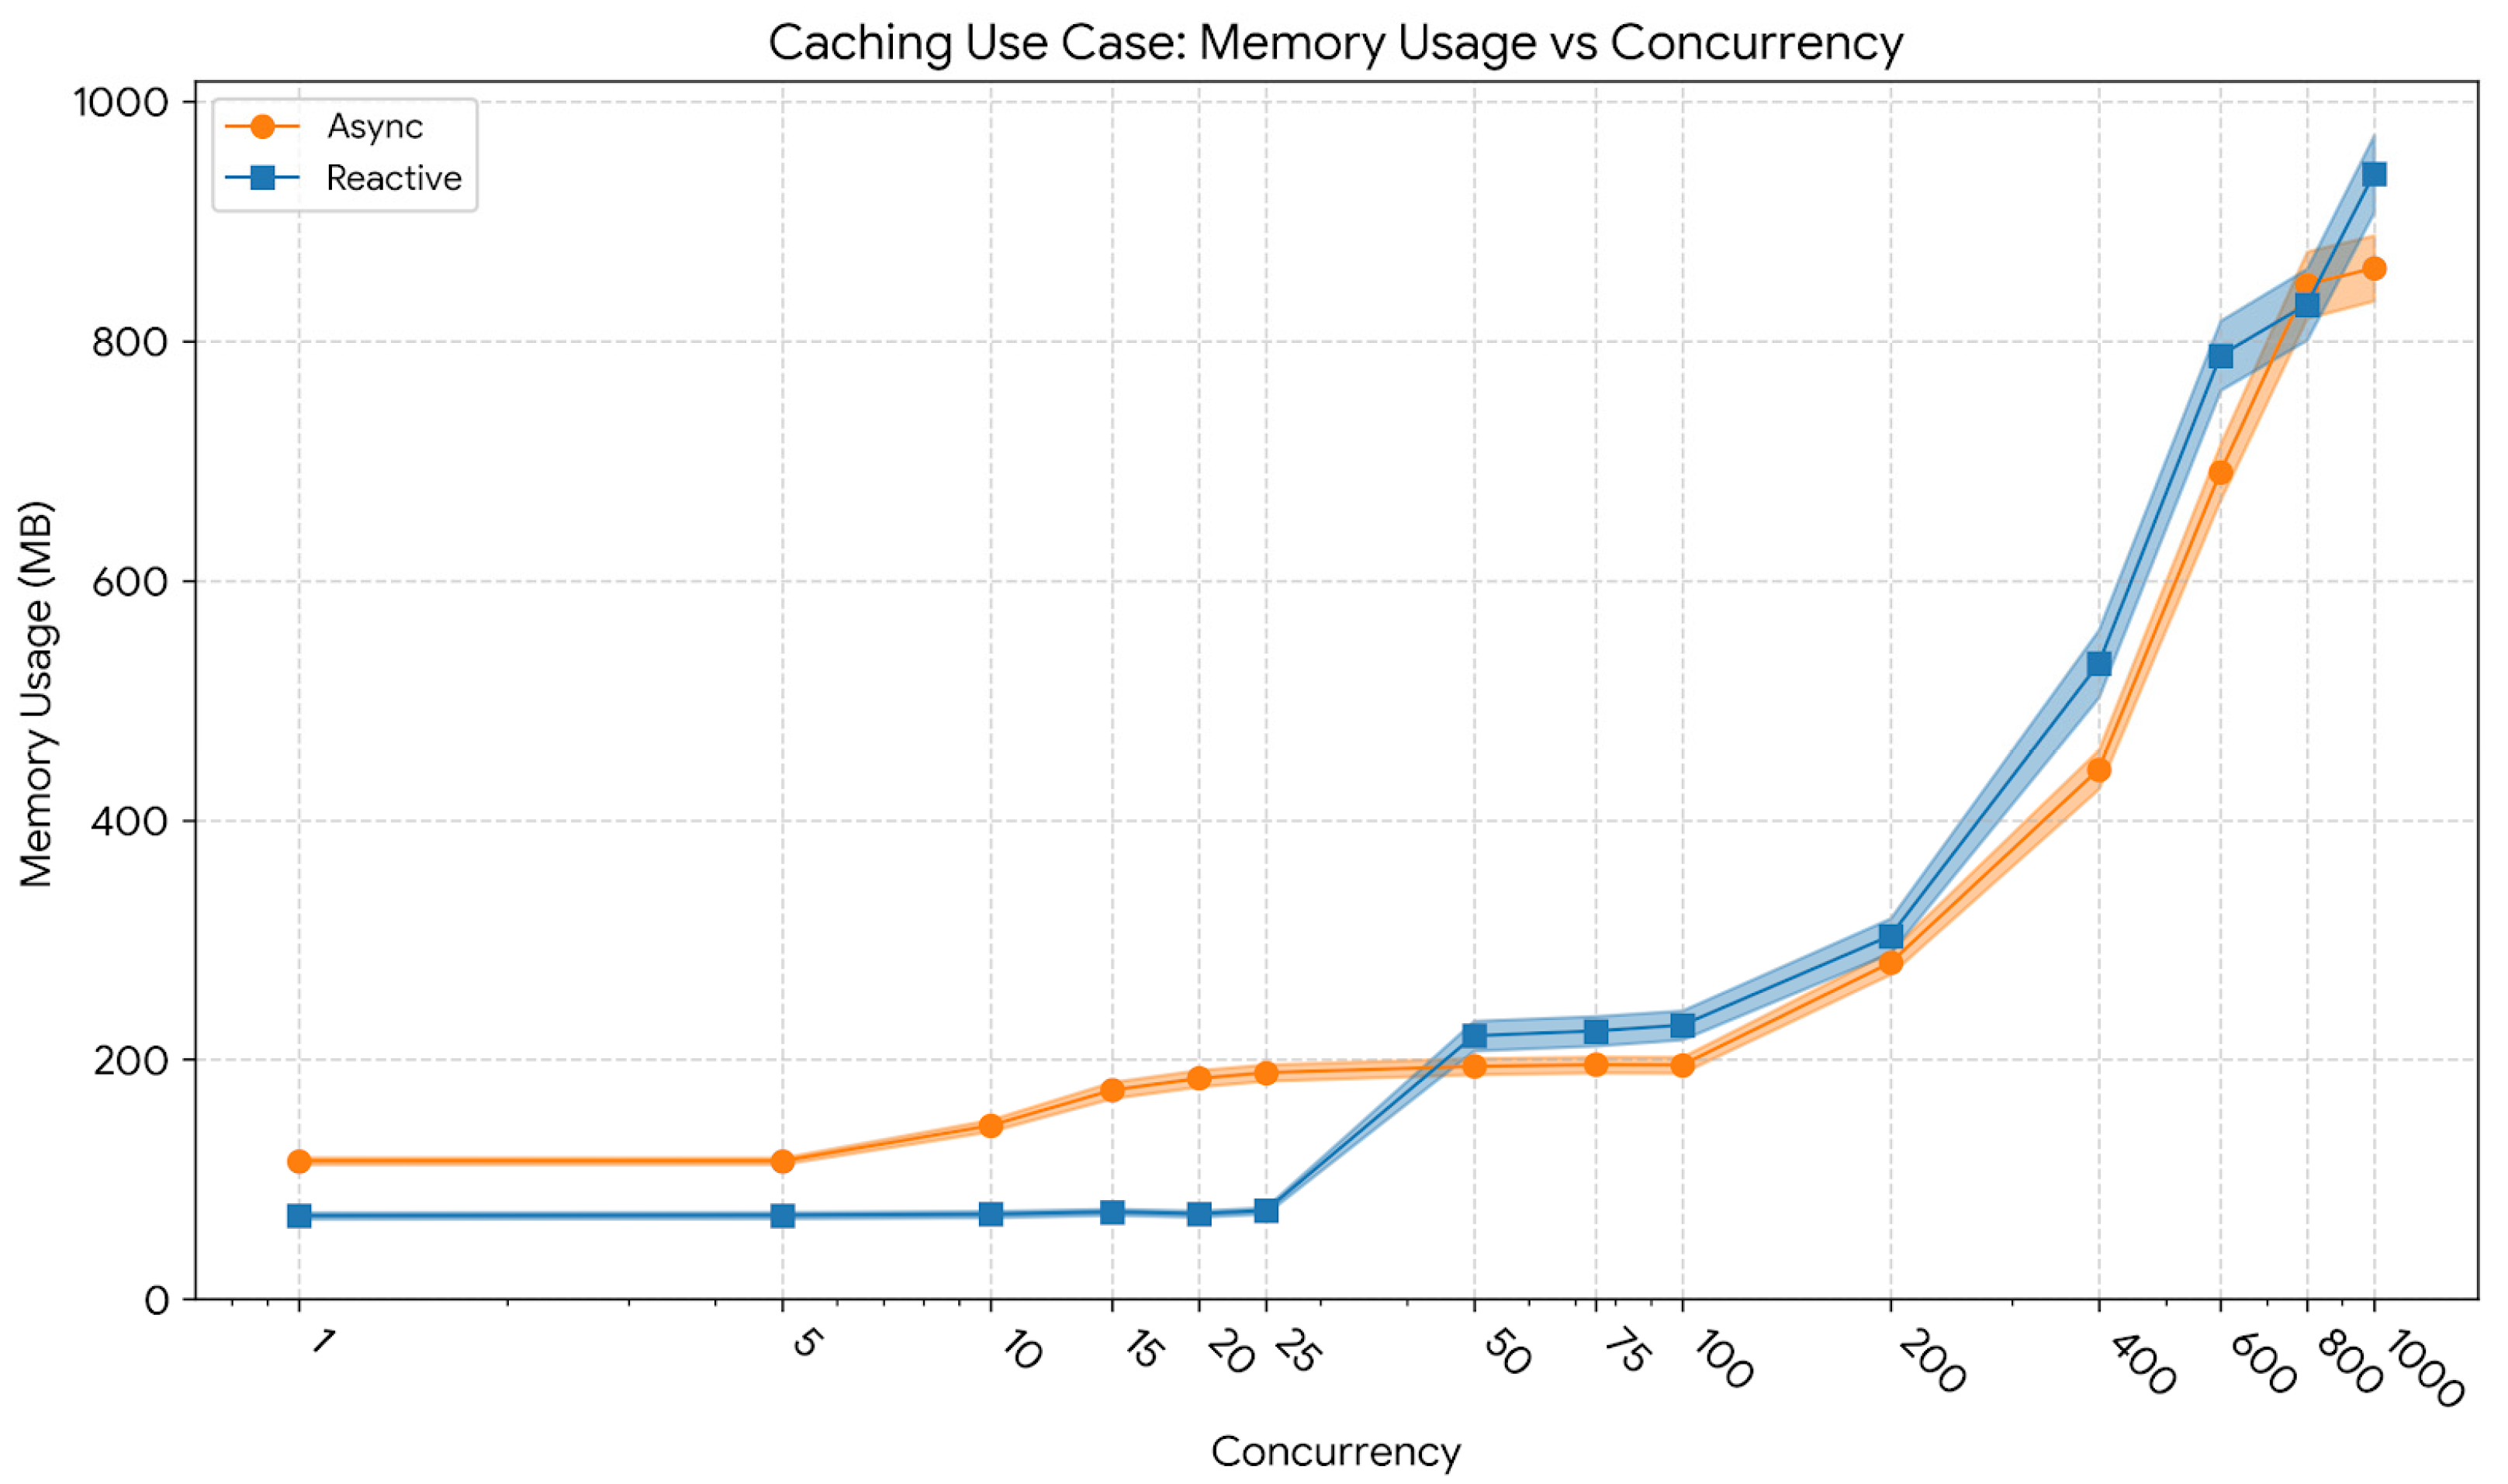
Figure 4 depicts the memory footprint across concurrency levels. At 10 users, the reactive implementation exhibited a substantially lower footprint (≈71 MB) compared to the asynchronous model (≈145 MB). At 400 users, memory consumption increased to 531 MB for the reactive and 442 MB for the asynchronous variant, indicating predictable scaling with load while maintaining manageable heap utilization. At 1000 users, memory usage converged, averaging 940 MB for the reactive and 861 MB for the asynchronous implementation. Overall, memory growth remained bounded and stable, confirming that caching overheads were well-managed under both paradigms.
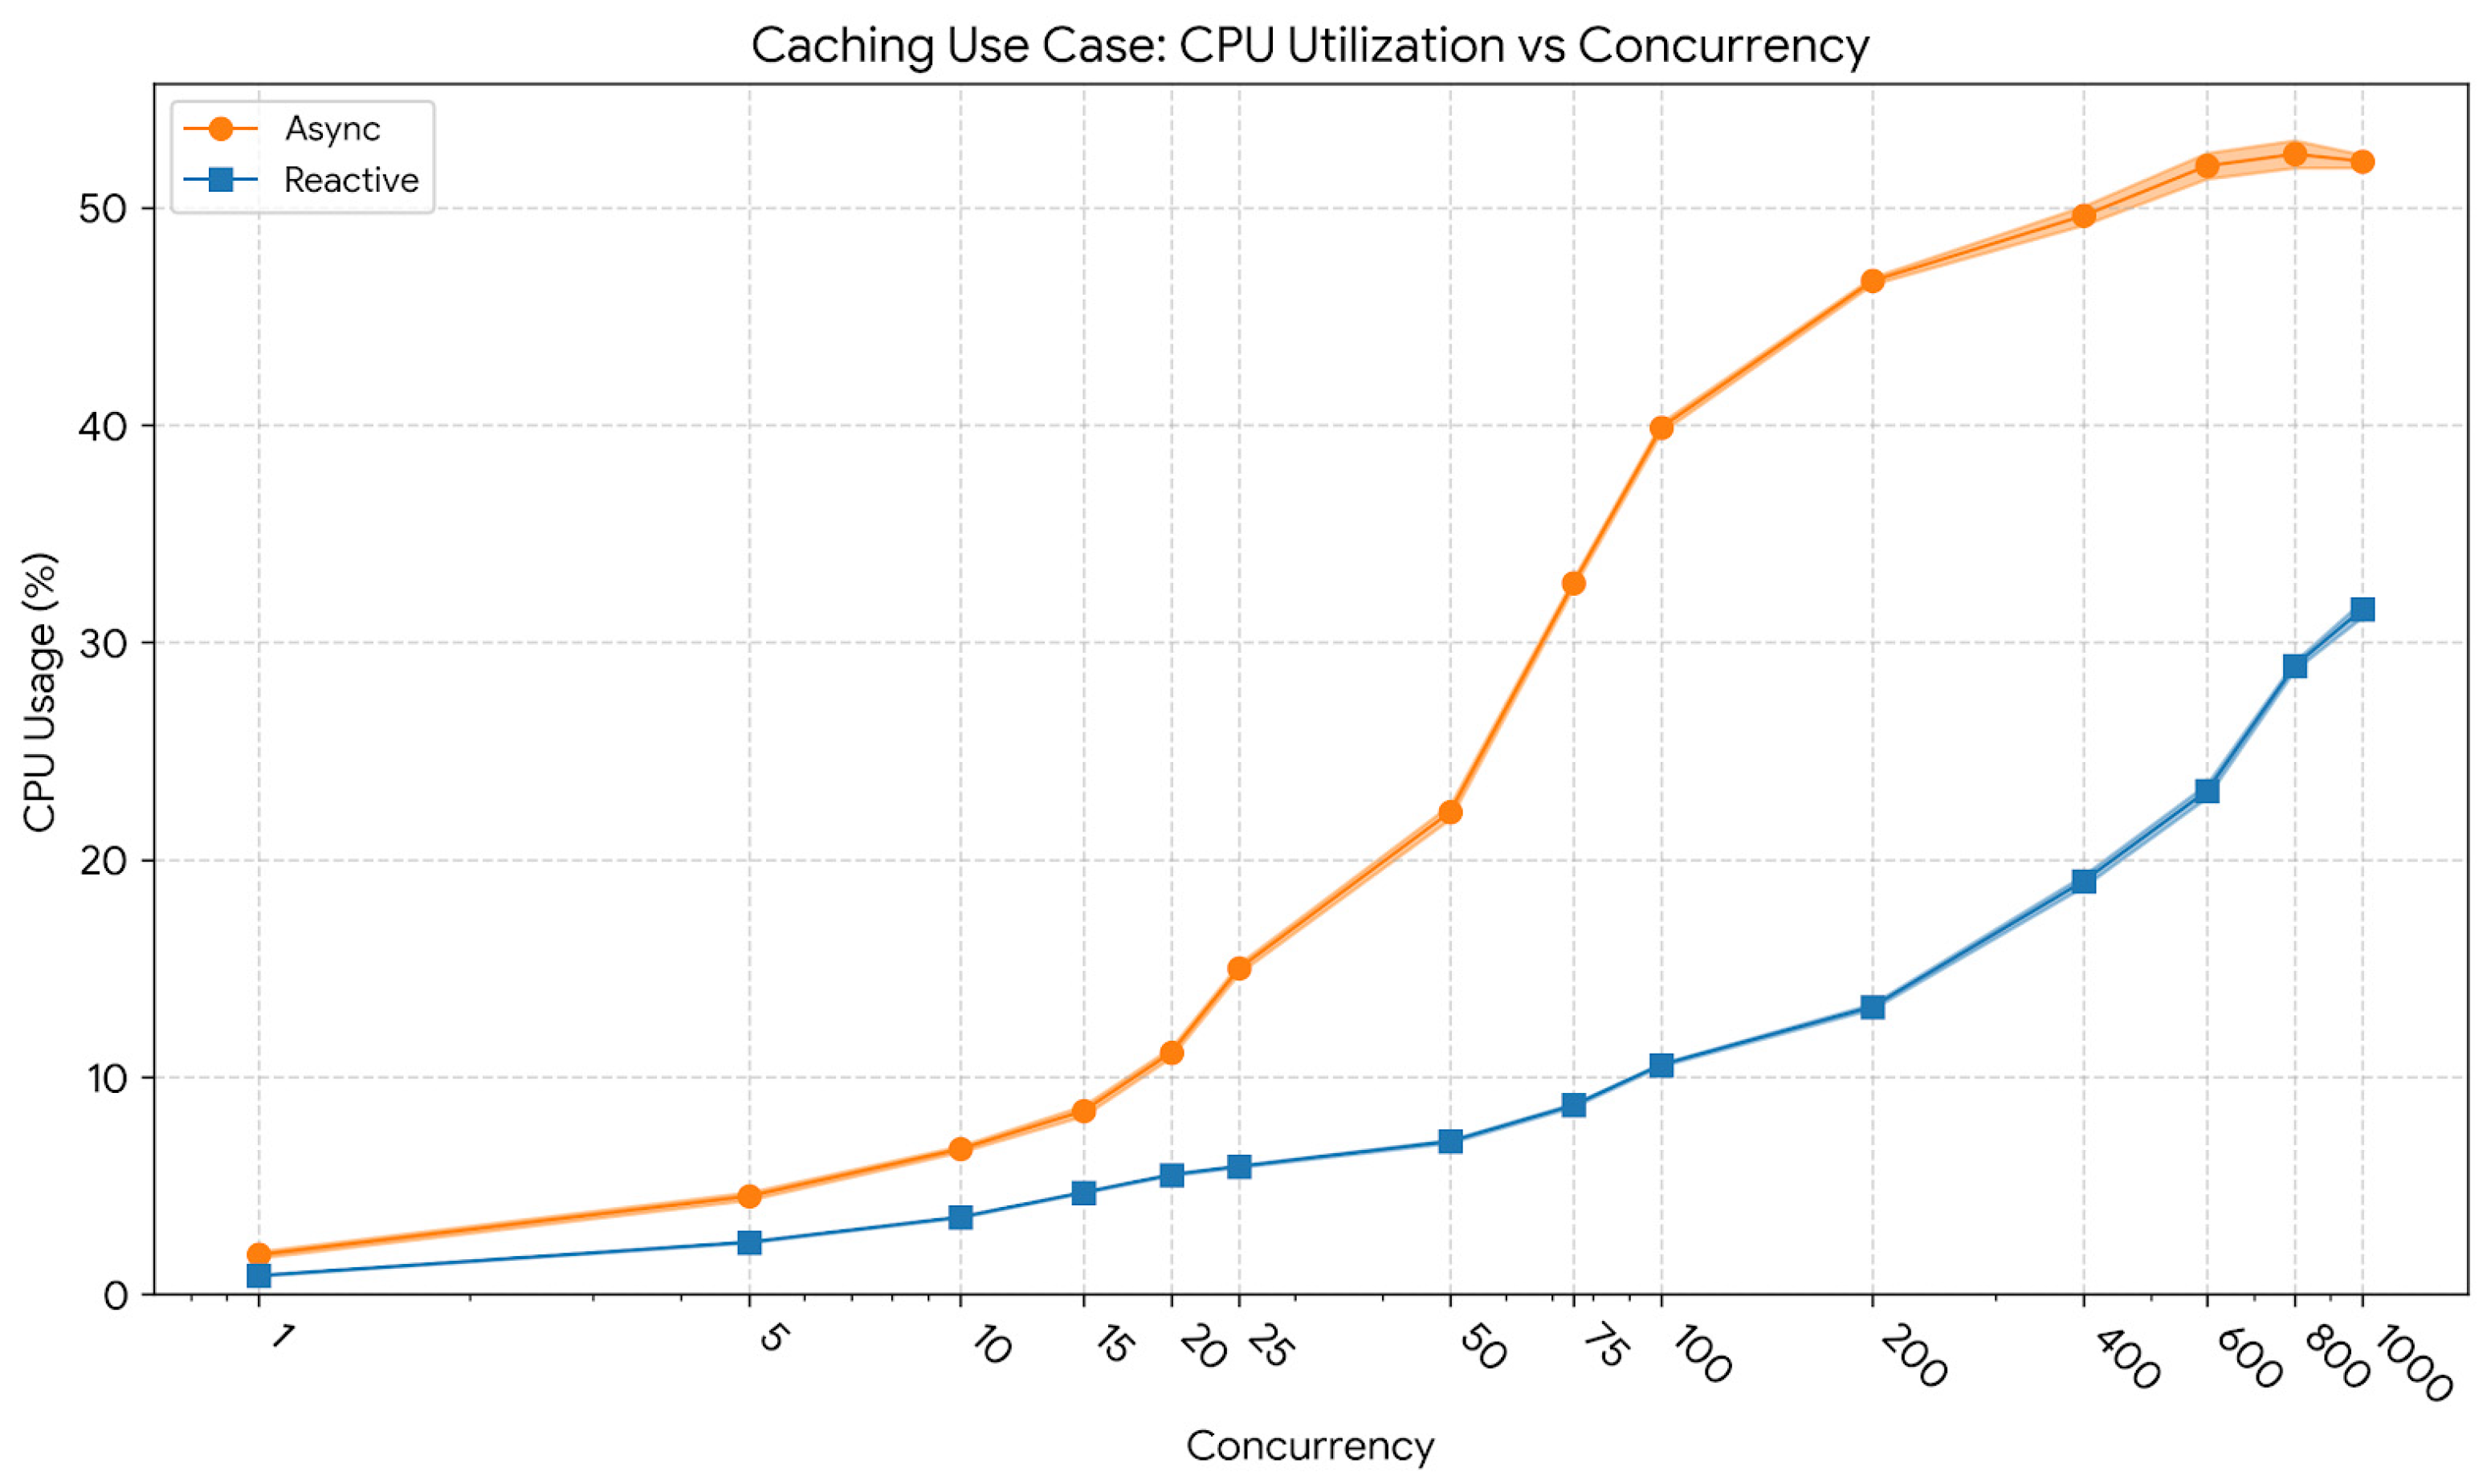
Finally, CPU usage trends are summarized in
Figure 5. At low concurrency, utilization remained modest: 3.55% (std = 0.23) for the reactive model versus 6.68% (std = 1.07) for the asynchronous one. At 400 users, CPU usage averaged 19.0% (std = 2.1) for the reactive and 50.1% (std = 4.3) for the asynchronous model. At the maximum concurrency of 1000 users, CPU utilization reached 31.5% (std = 3.0) for the reactive implementation and 52.1% (std = 5.4) for the asynchronous one. These values demonstrate that the event-driven model sustained significantly higher throughput while consuming fewer processing resources, leading to improved overall efficiency.
Overall, the results confirm that caching provides measurable performance improvements for both paradigms; however, the reactive model consistently outperformed its asynchronous counterpart in terms of resource efficiency and throughput scalability. The combination of non-blocking I/O and localized caching allowed the reactive pipeline to handle higher levels of parallelism with lower CPU variance and reduced memory pressure, ensuring smoother performance degradation patterns under extreme load.
6.3. Evaluation of CPU-Bound Workloads
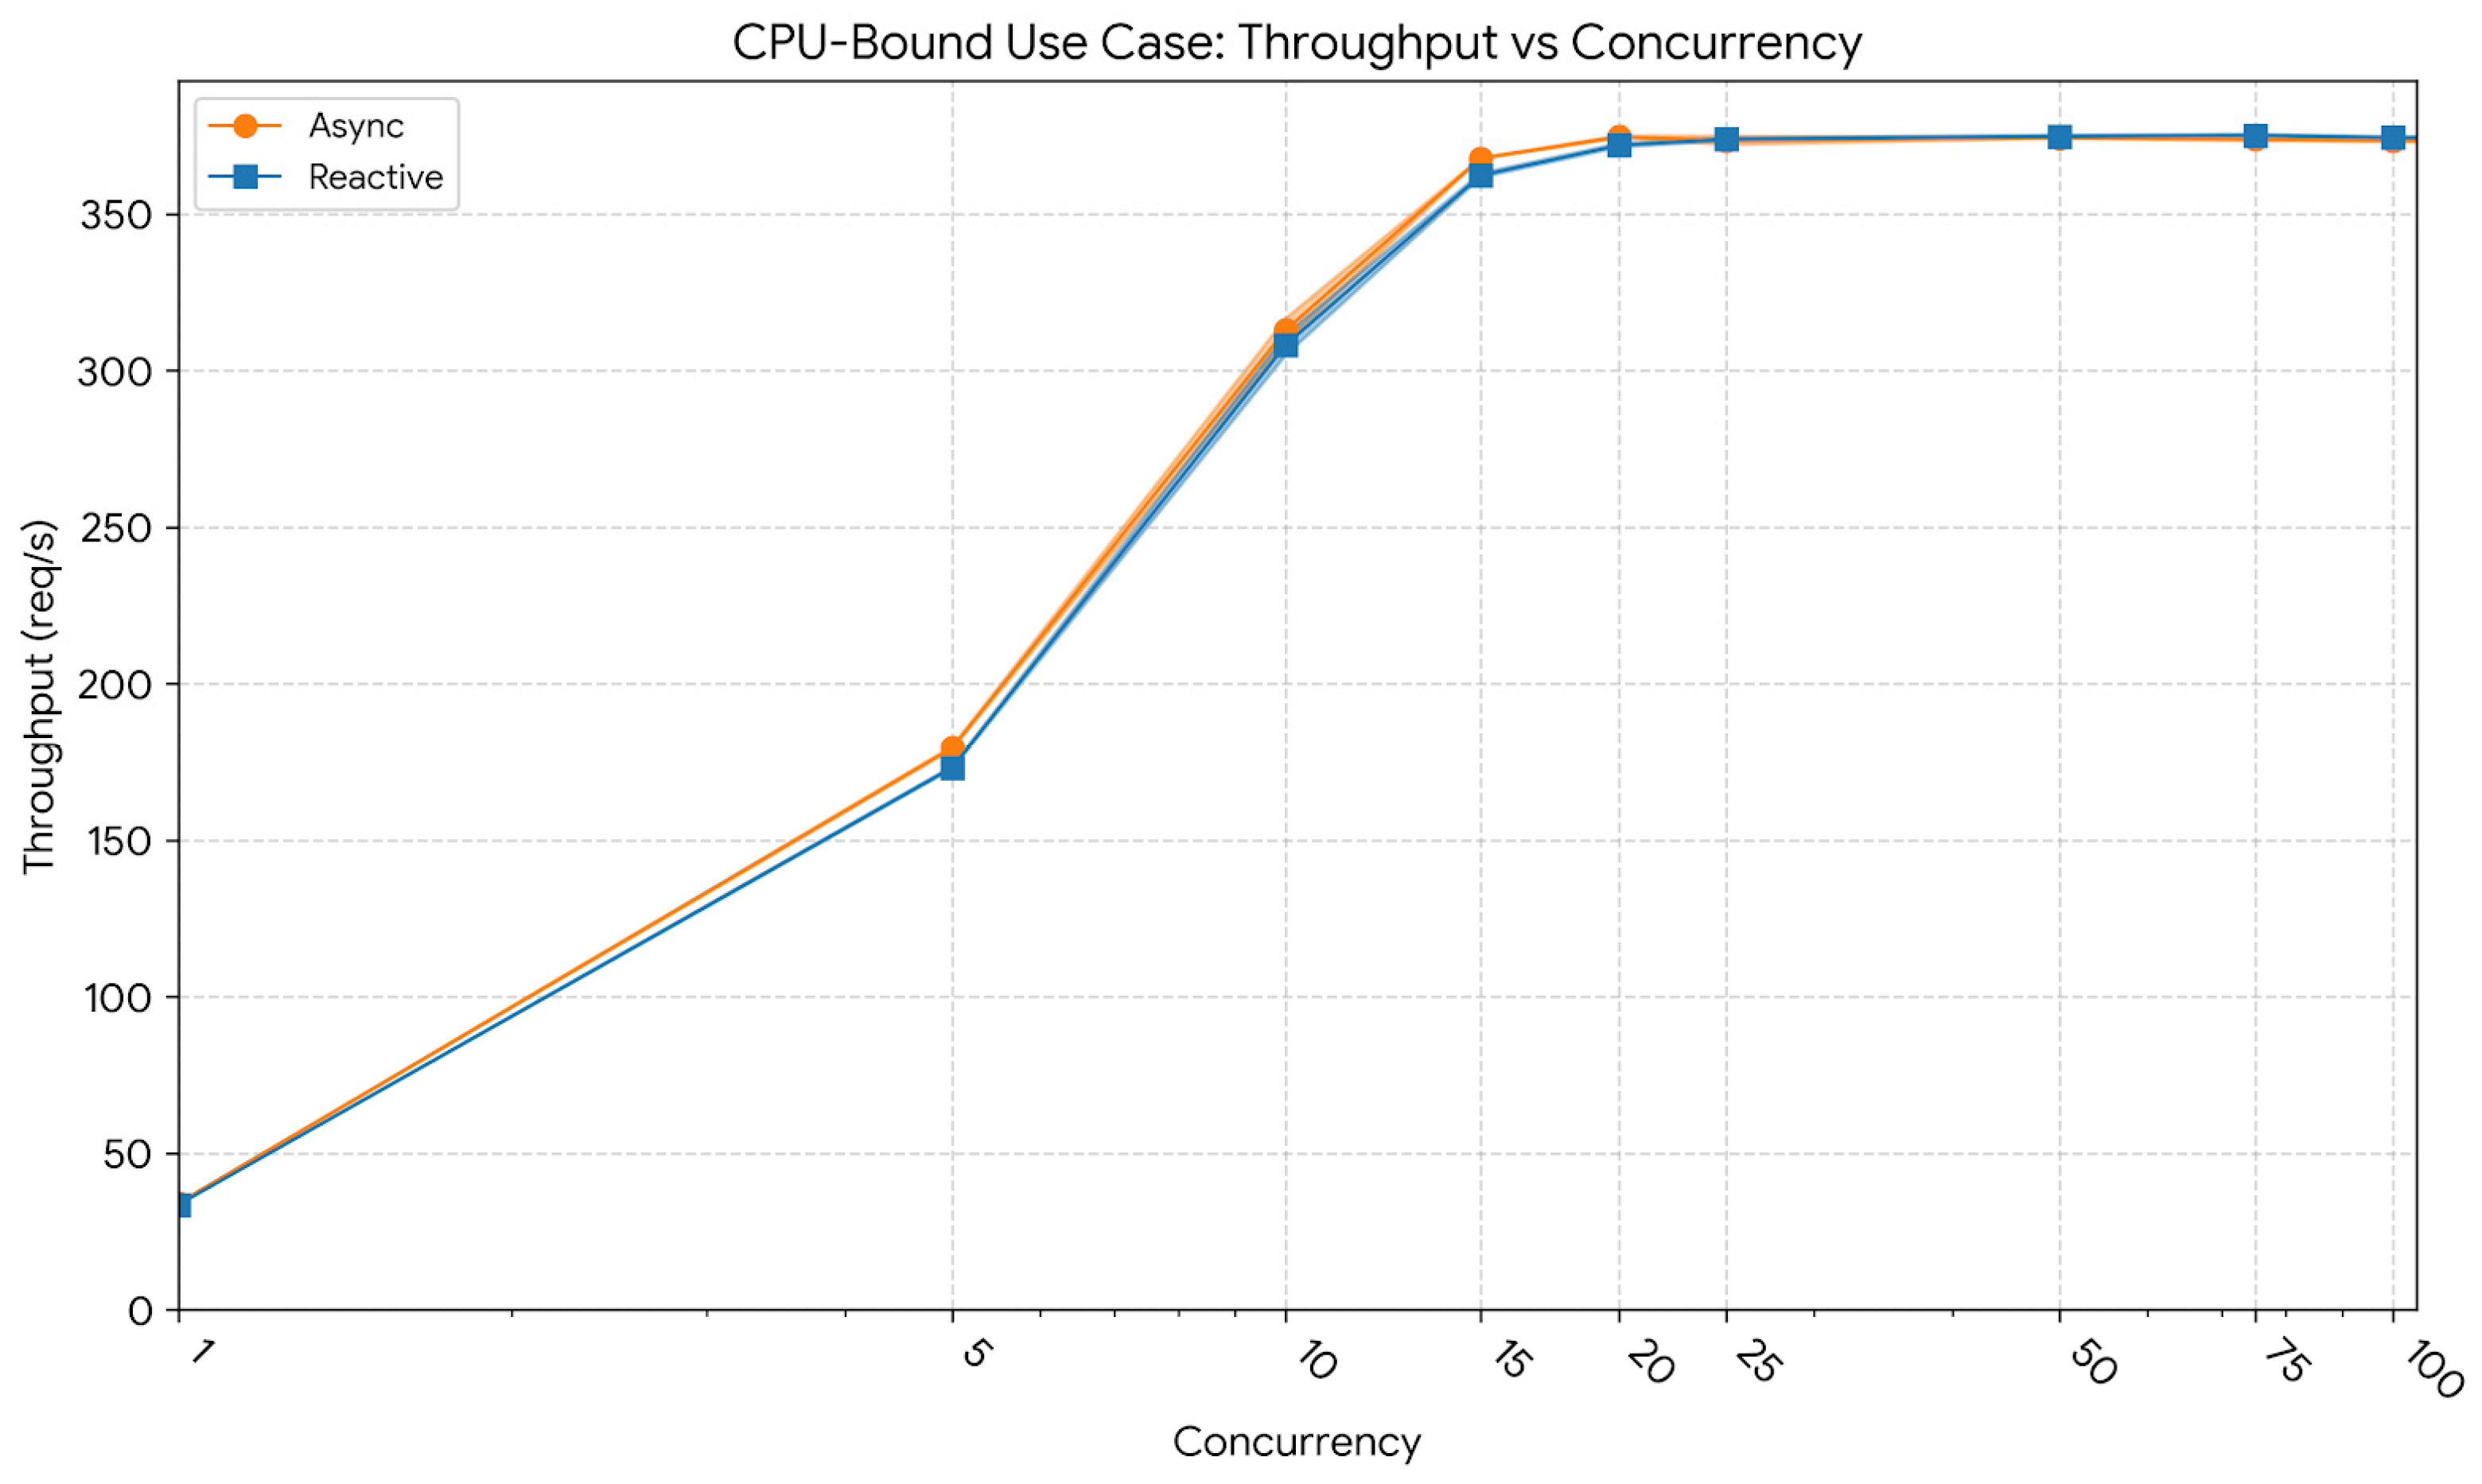
The following test scenario evaluated CPU-intensive operations to assess how both asynchronous and reactive models perform when computational resources become the primary limiting factor. As before, concurrency was gradually increased, this time up to 100 simultaneous users, as higher values were found to provide no further performance benefits, the throughput curve remaining practically plateaued beyond this point. The results capture the relationship between CPU saturation, throughput stability, and latency distribution.
Figure 6 illustrates the throughput behavior of both implementations as concurrency increased. At a low concurrency level of 10 users, the reactive model processed 308 req/s (CI95: 305–312), slightly below the asynchronous model, which achieved 313 req/s (CI95: 309–317). At a mid-concurrency level of 50 users, the asynchronous implementation reached 374 req/s (CI95: 374–375), while the reactive model followed closely at 375 req/s (CI95: 374–375). At the peak of 100 users, both paradigms stabilized near 374 req/s, confirming that throughput plateaued once CPU capacity became saturated. This demonstrates that beyond a certain concurrency threshold, the workload becomes purely computation-bound and no longer benefits from additional parallelism.
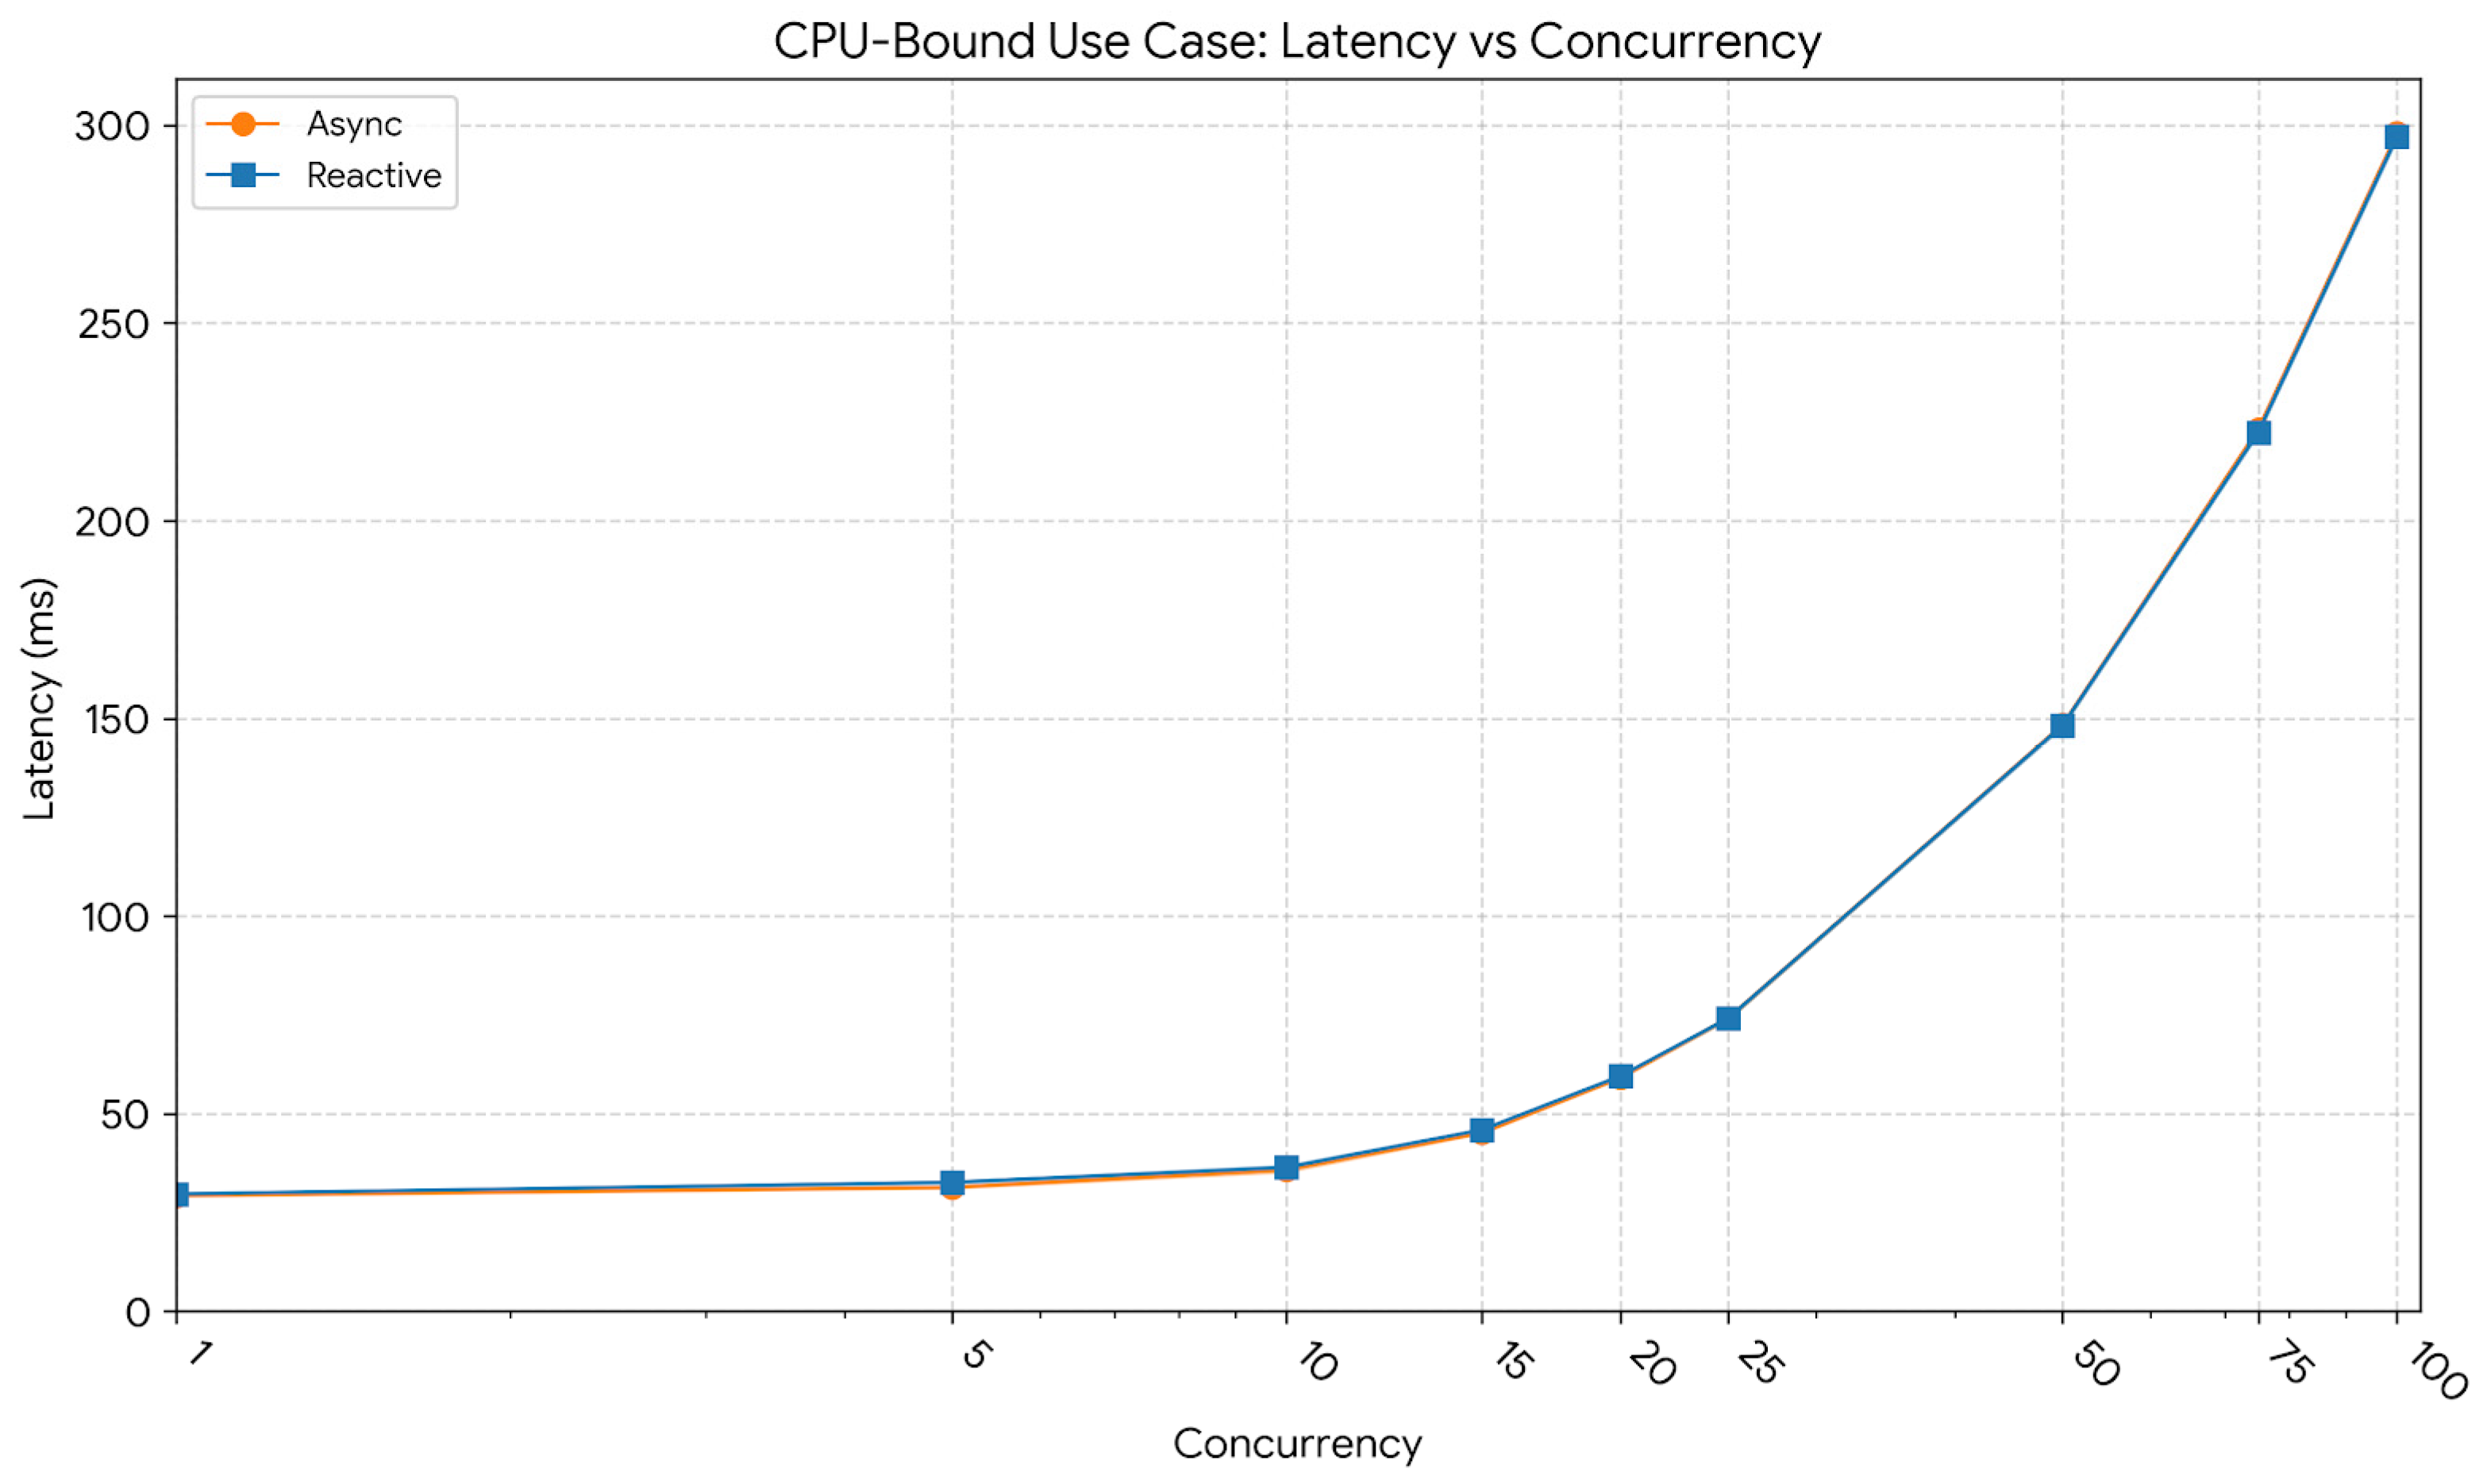
The latency profile corresponding to this workload is presented in
Figure 7. At 10 users, the reactive model exhibited an average latency of 36.34 ms and a p95 latency of 49.77 ms, compared to the asynchronous implementation’s 35.74 ms and 45.80 ms, respectively. At 50 users, latency increased markedly as CPU saturation was approached, reaching an average of 148.24 ms and a p95 of 388.85 ms for the reactive variant, and 148.44 ms and 232.44 ms for the asynchronous model. At 100 users, average latency doubled to approximately 297–298 ms for both models, while the reactive model’s p95 spiked to 742.43 ms (vs. 468.48 ms for async). This linear increase in average latency, coupled with the reactive model’s higher tail latency, reflects the queueing delay inherent in saturated systems, where the single event loop struggles to interleave heavy computational tasks.
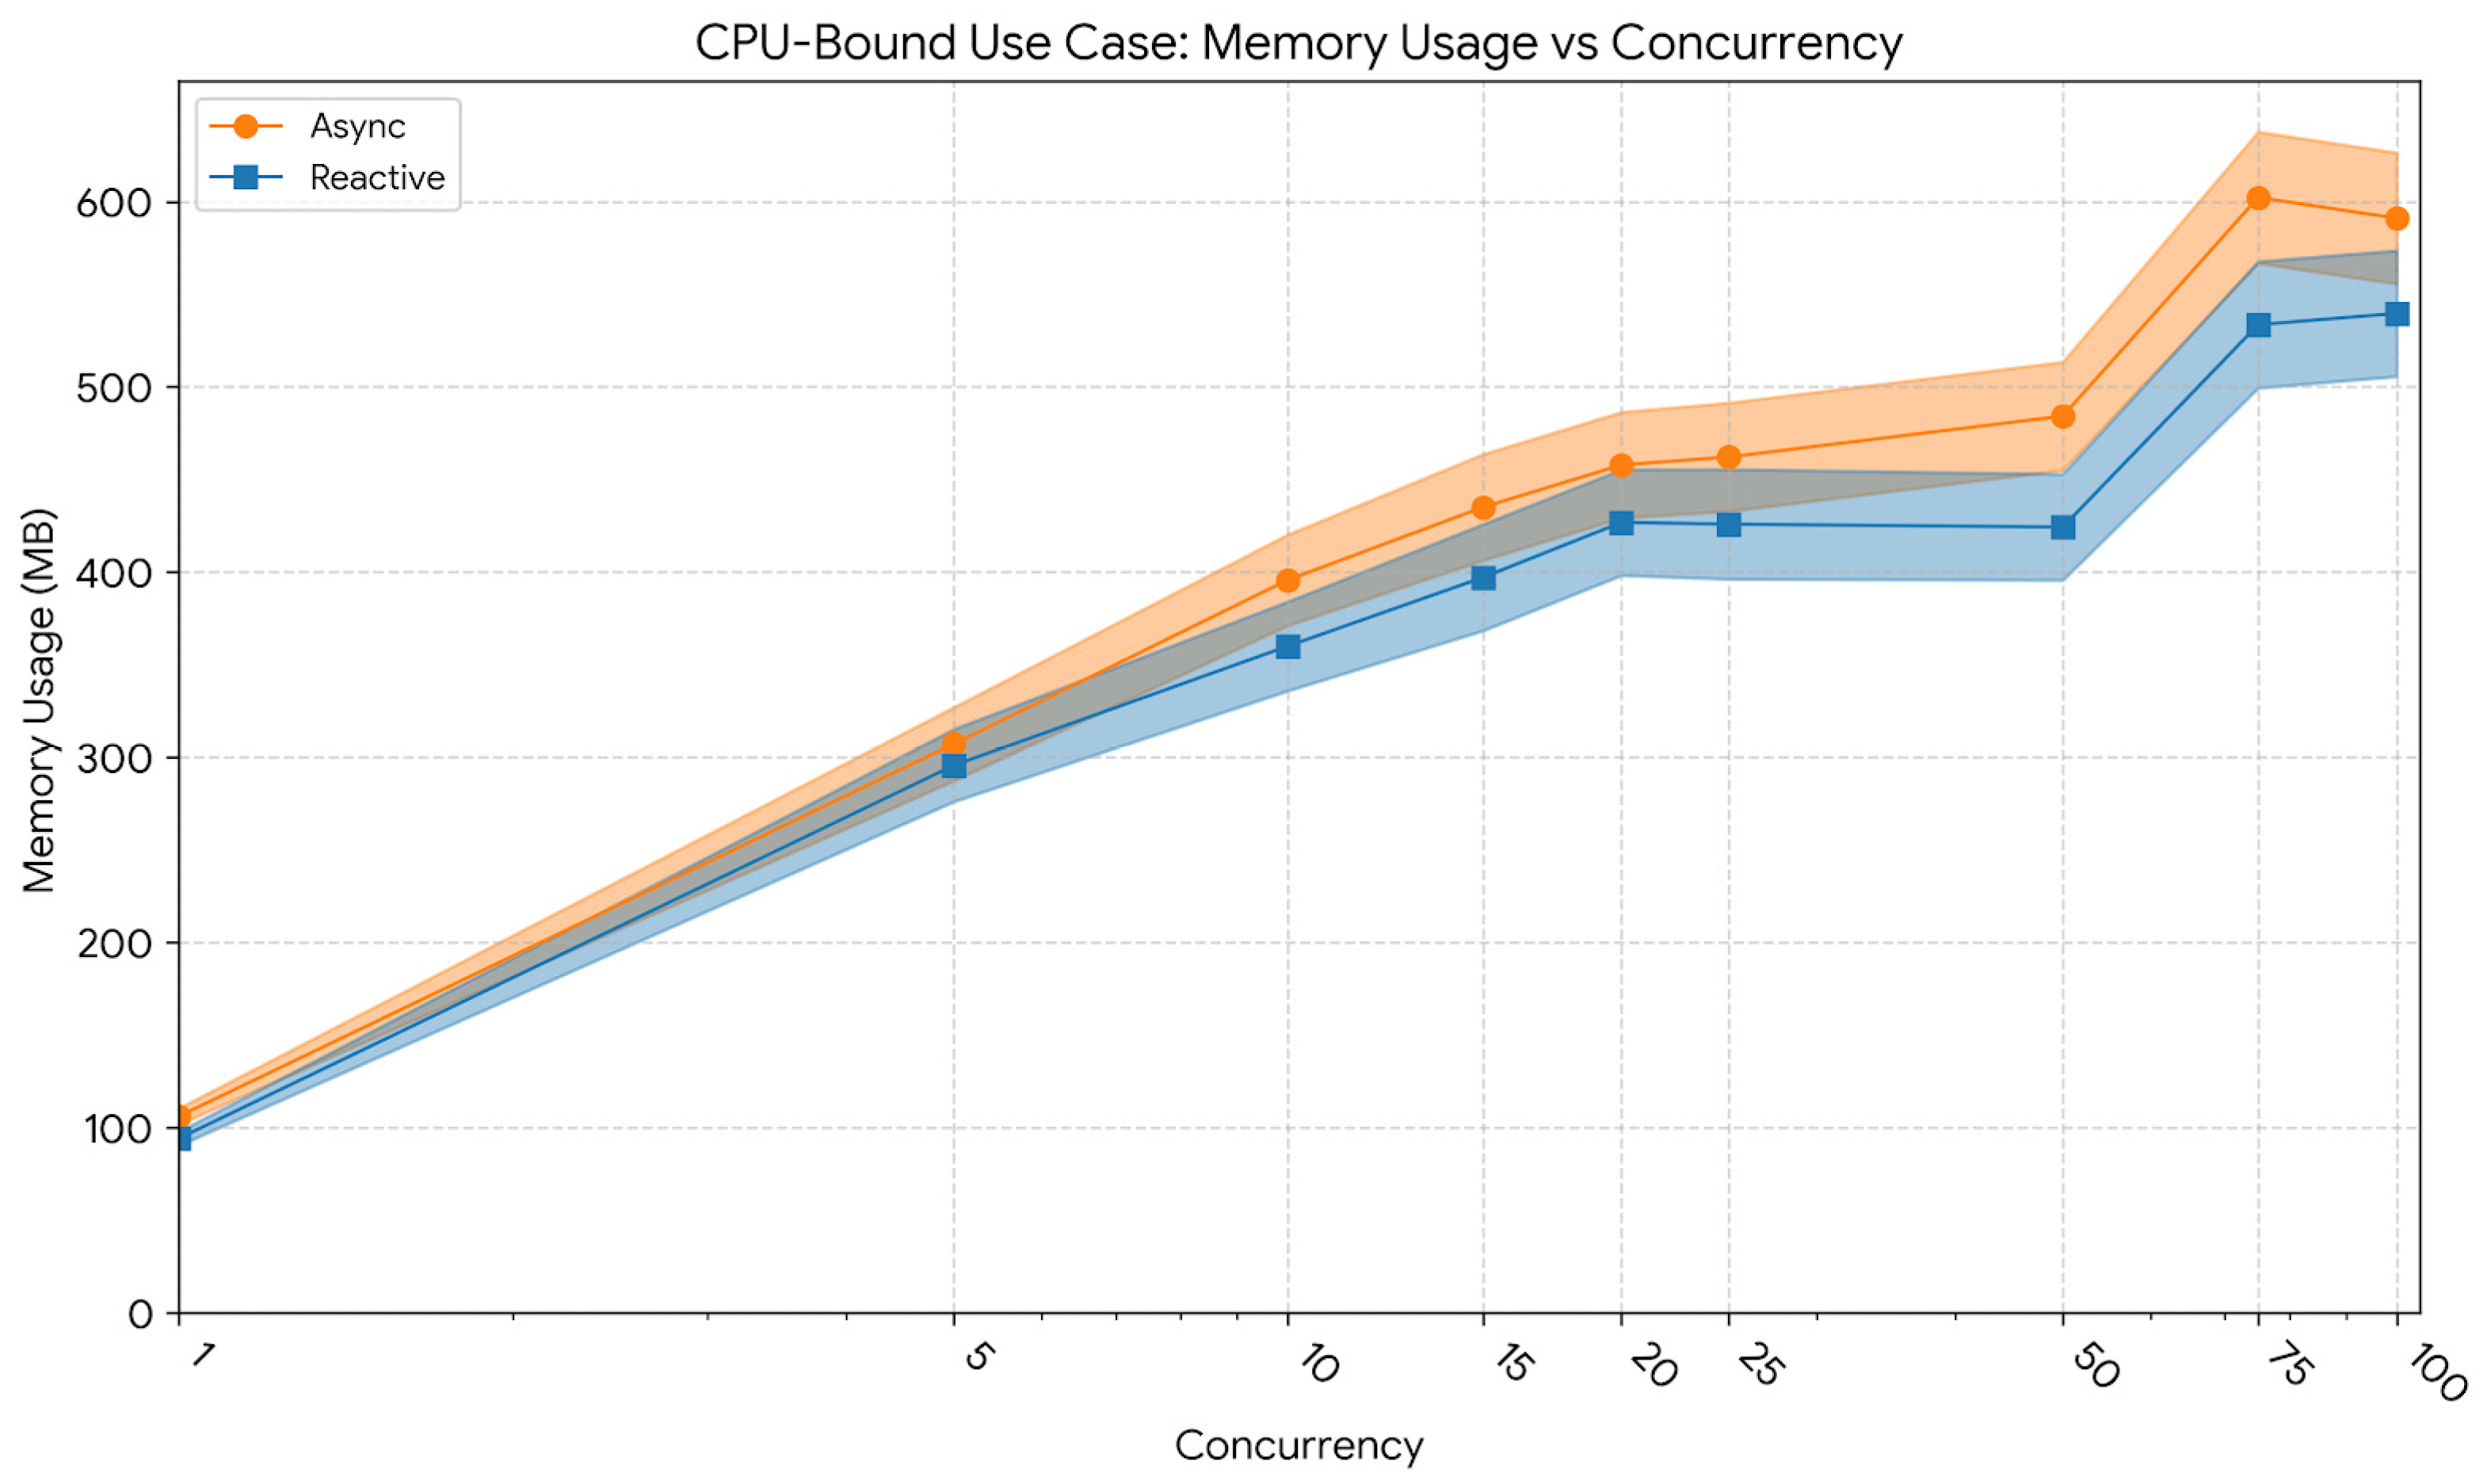
Figure 8 shows memory consumption trends for the CPU-bound workload. At low concurrency (10 users), memory usage averaged 360 MB for the reactive model and 396 MB for the asynchronous one. At 50 users, usage remained stable at approximately 424 MB for the reactive and 484 MB for the asynchronous implementation. At 100 users, memory consumption rose to 540 MB (Reactive) and 591 MB (Async). The visible variance (wide confidence intervals) across all levels reflects the aggressive allocation and garbage collection cycles typical of image processing workloads, confirming that both approaches actively utilized the heap for matrix operations.
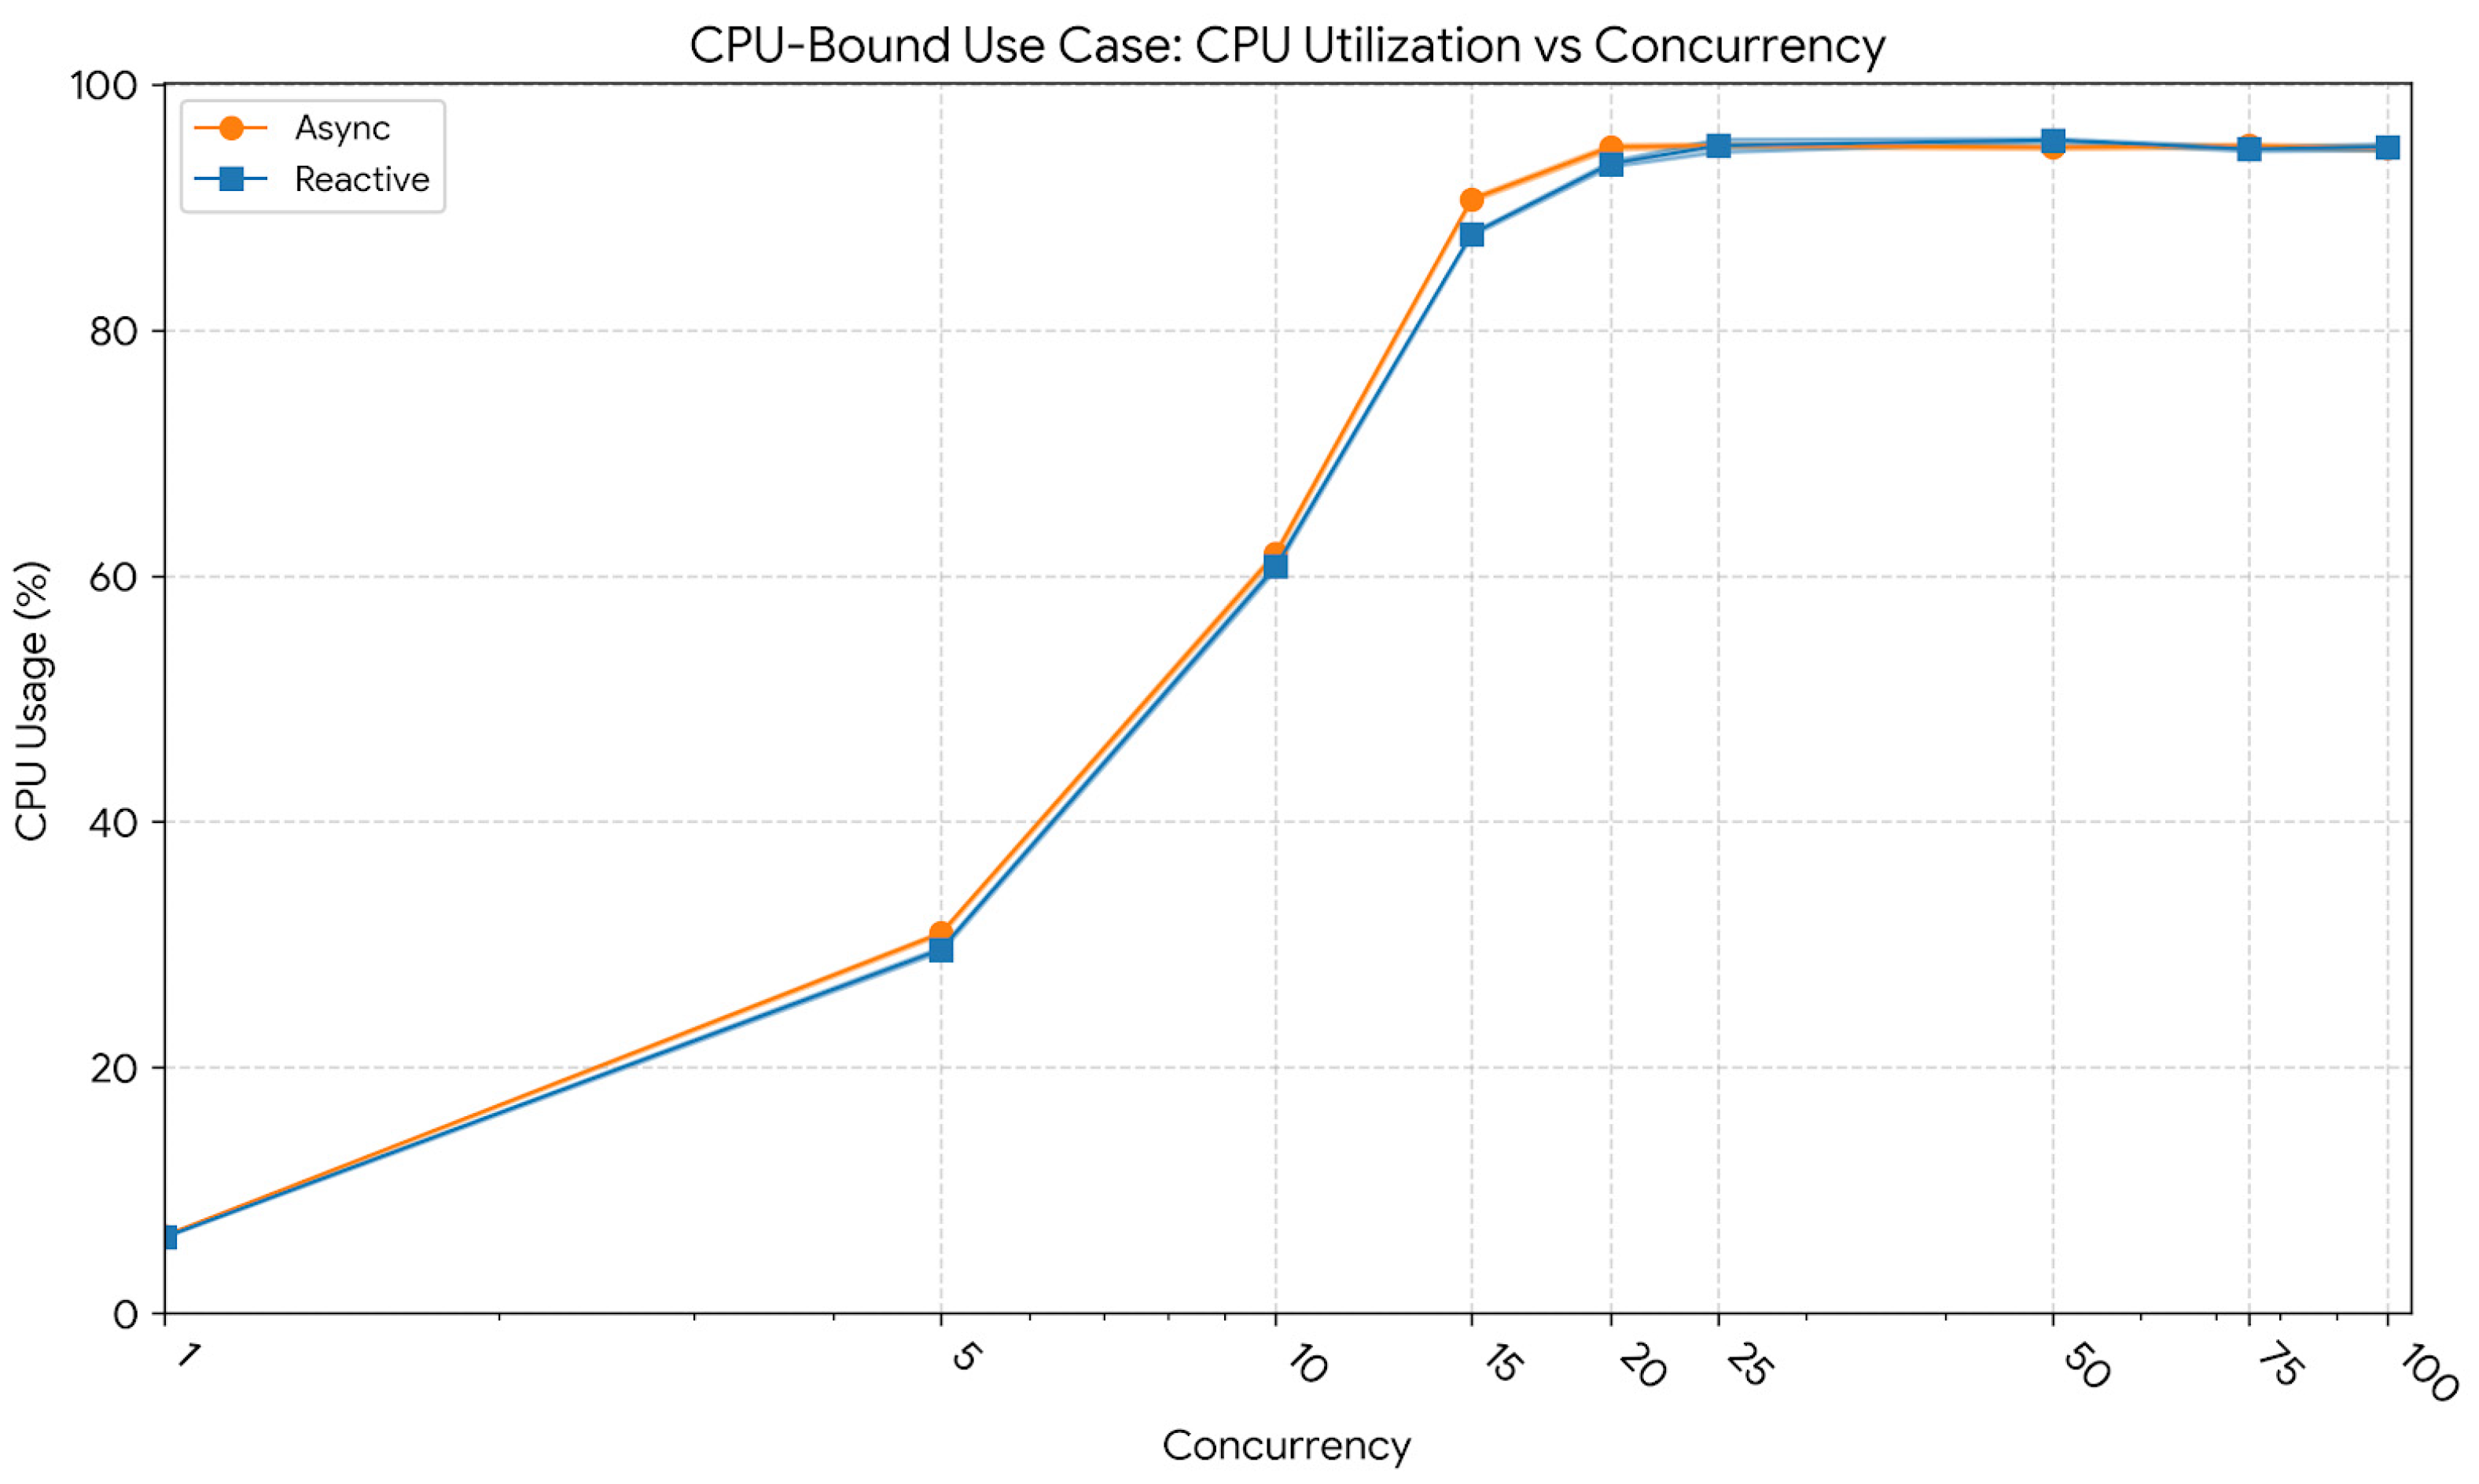
Finally,
Figure 9 reports CPU utilization trends. At 10 users, mean utilization reached 60.8% (std = 2.2) for the reactive model and 61.8% (std = 2.1) for the asynchronous one. At 50 users, CPU usage increased to 94.9% (std = 1.8) for the asynchronous and 95.5% (std = 1.9) for the reactive model. At 100 users, both remained near 95%, confirming full processor saturation, validating that computation, rather than I/O or scheduling, constituted the bottleneck once concurrency exceeded the CPU’s effective parallel capacity.
In summary, the CPU-bound workload highlighted the intrinsic limitation of both paradigms when computation dominates execution time. While the reactive implementation achieved marginally lower latency stability under high load, both models converged in throughput as CPU capacity was fully utilized. The plateau observed beyond 100 concurrent users confirmed that additional concurrency did not yield meaningful performance gains, emphasizing that in CPU-saturated contexts, horizontal scaling or offloading strategies are required to further increase throughput.
6.4. Evaluation of Blocking I/O Workloads
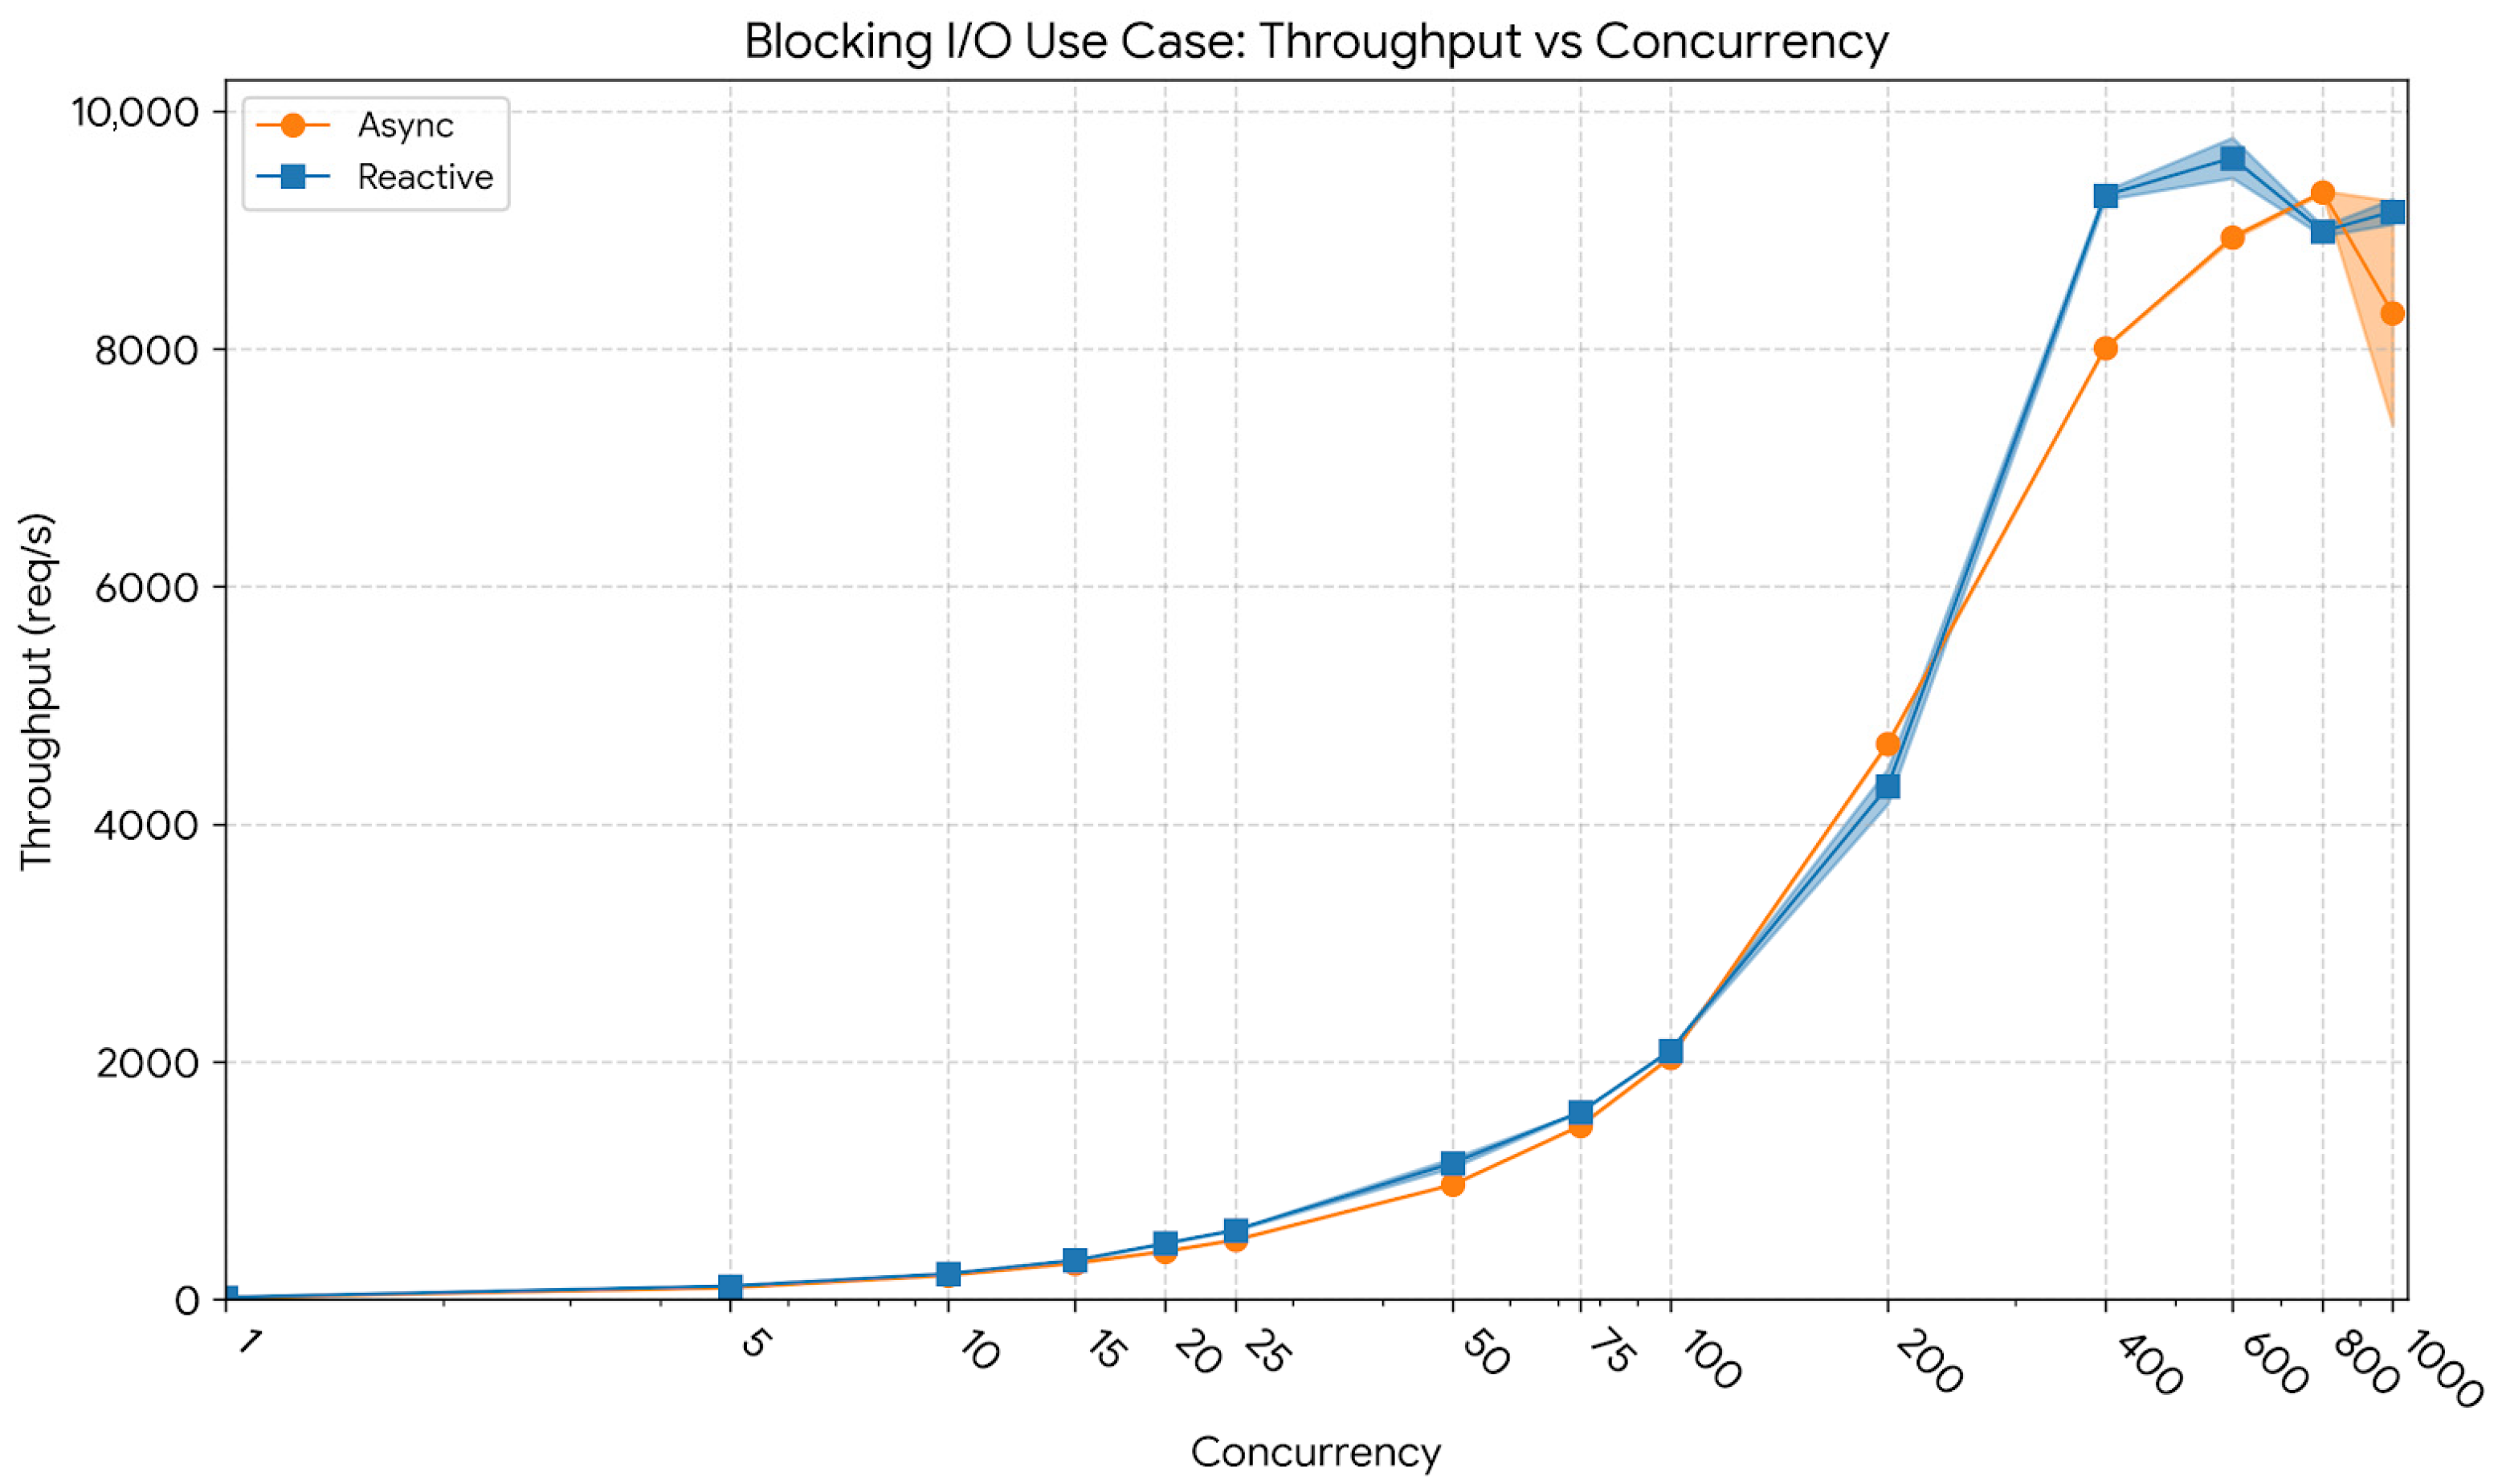
The last evaluated scenario involved a fully blocking workload designed to represent operations that occupy threads during I/O waits, preventing efficient parallel execution. This case aimed to assess how the two paradigms behave under strictly blocking conditions and whether the reactive model retains any inherent efficiency advantages. The number of concurrent users was increased from 1 up to 1000, with five repetitions per level. Beyond approximately 400–600 concurrent users, both models exhibited throughput saturation, with minimal performance gains at higher concurrency levels.
Figure 10 presents the throughput evolution under the blocking I/O workload. At a low concurrency level of 10 users, the reactive model achieved 216.49 req/s (CI95: 215.93–217.04), slightly exceeding the asynchronous model’s 203.68 req/s (CI95: 203.54–203.82). At 400 users, throughput scaled to ≈ 9293 req/s (CI95: 9216–9370) for the reactive implementation and ≈ 8011 req/s (CI95: 7934–8088) for the asynchronous model. At the peak concurrency of 1000 users, both implementations approached their scalability limits, with the reactive model sustaining ≈ 9155 req/s (CI95: 9089–9221) and the asynchronous variant ≈ 8300 req/s (CI95: 8238–8362). These results confirm that although overall scaling is constrained by blocking behavior, the reactive pipeline consistently maintained higher throughput across all concurrency levels.
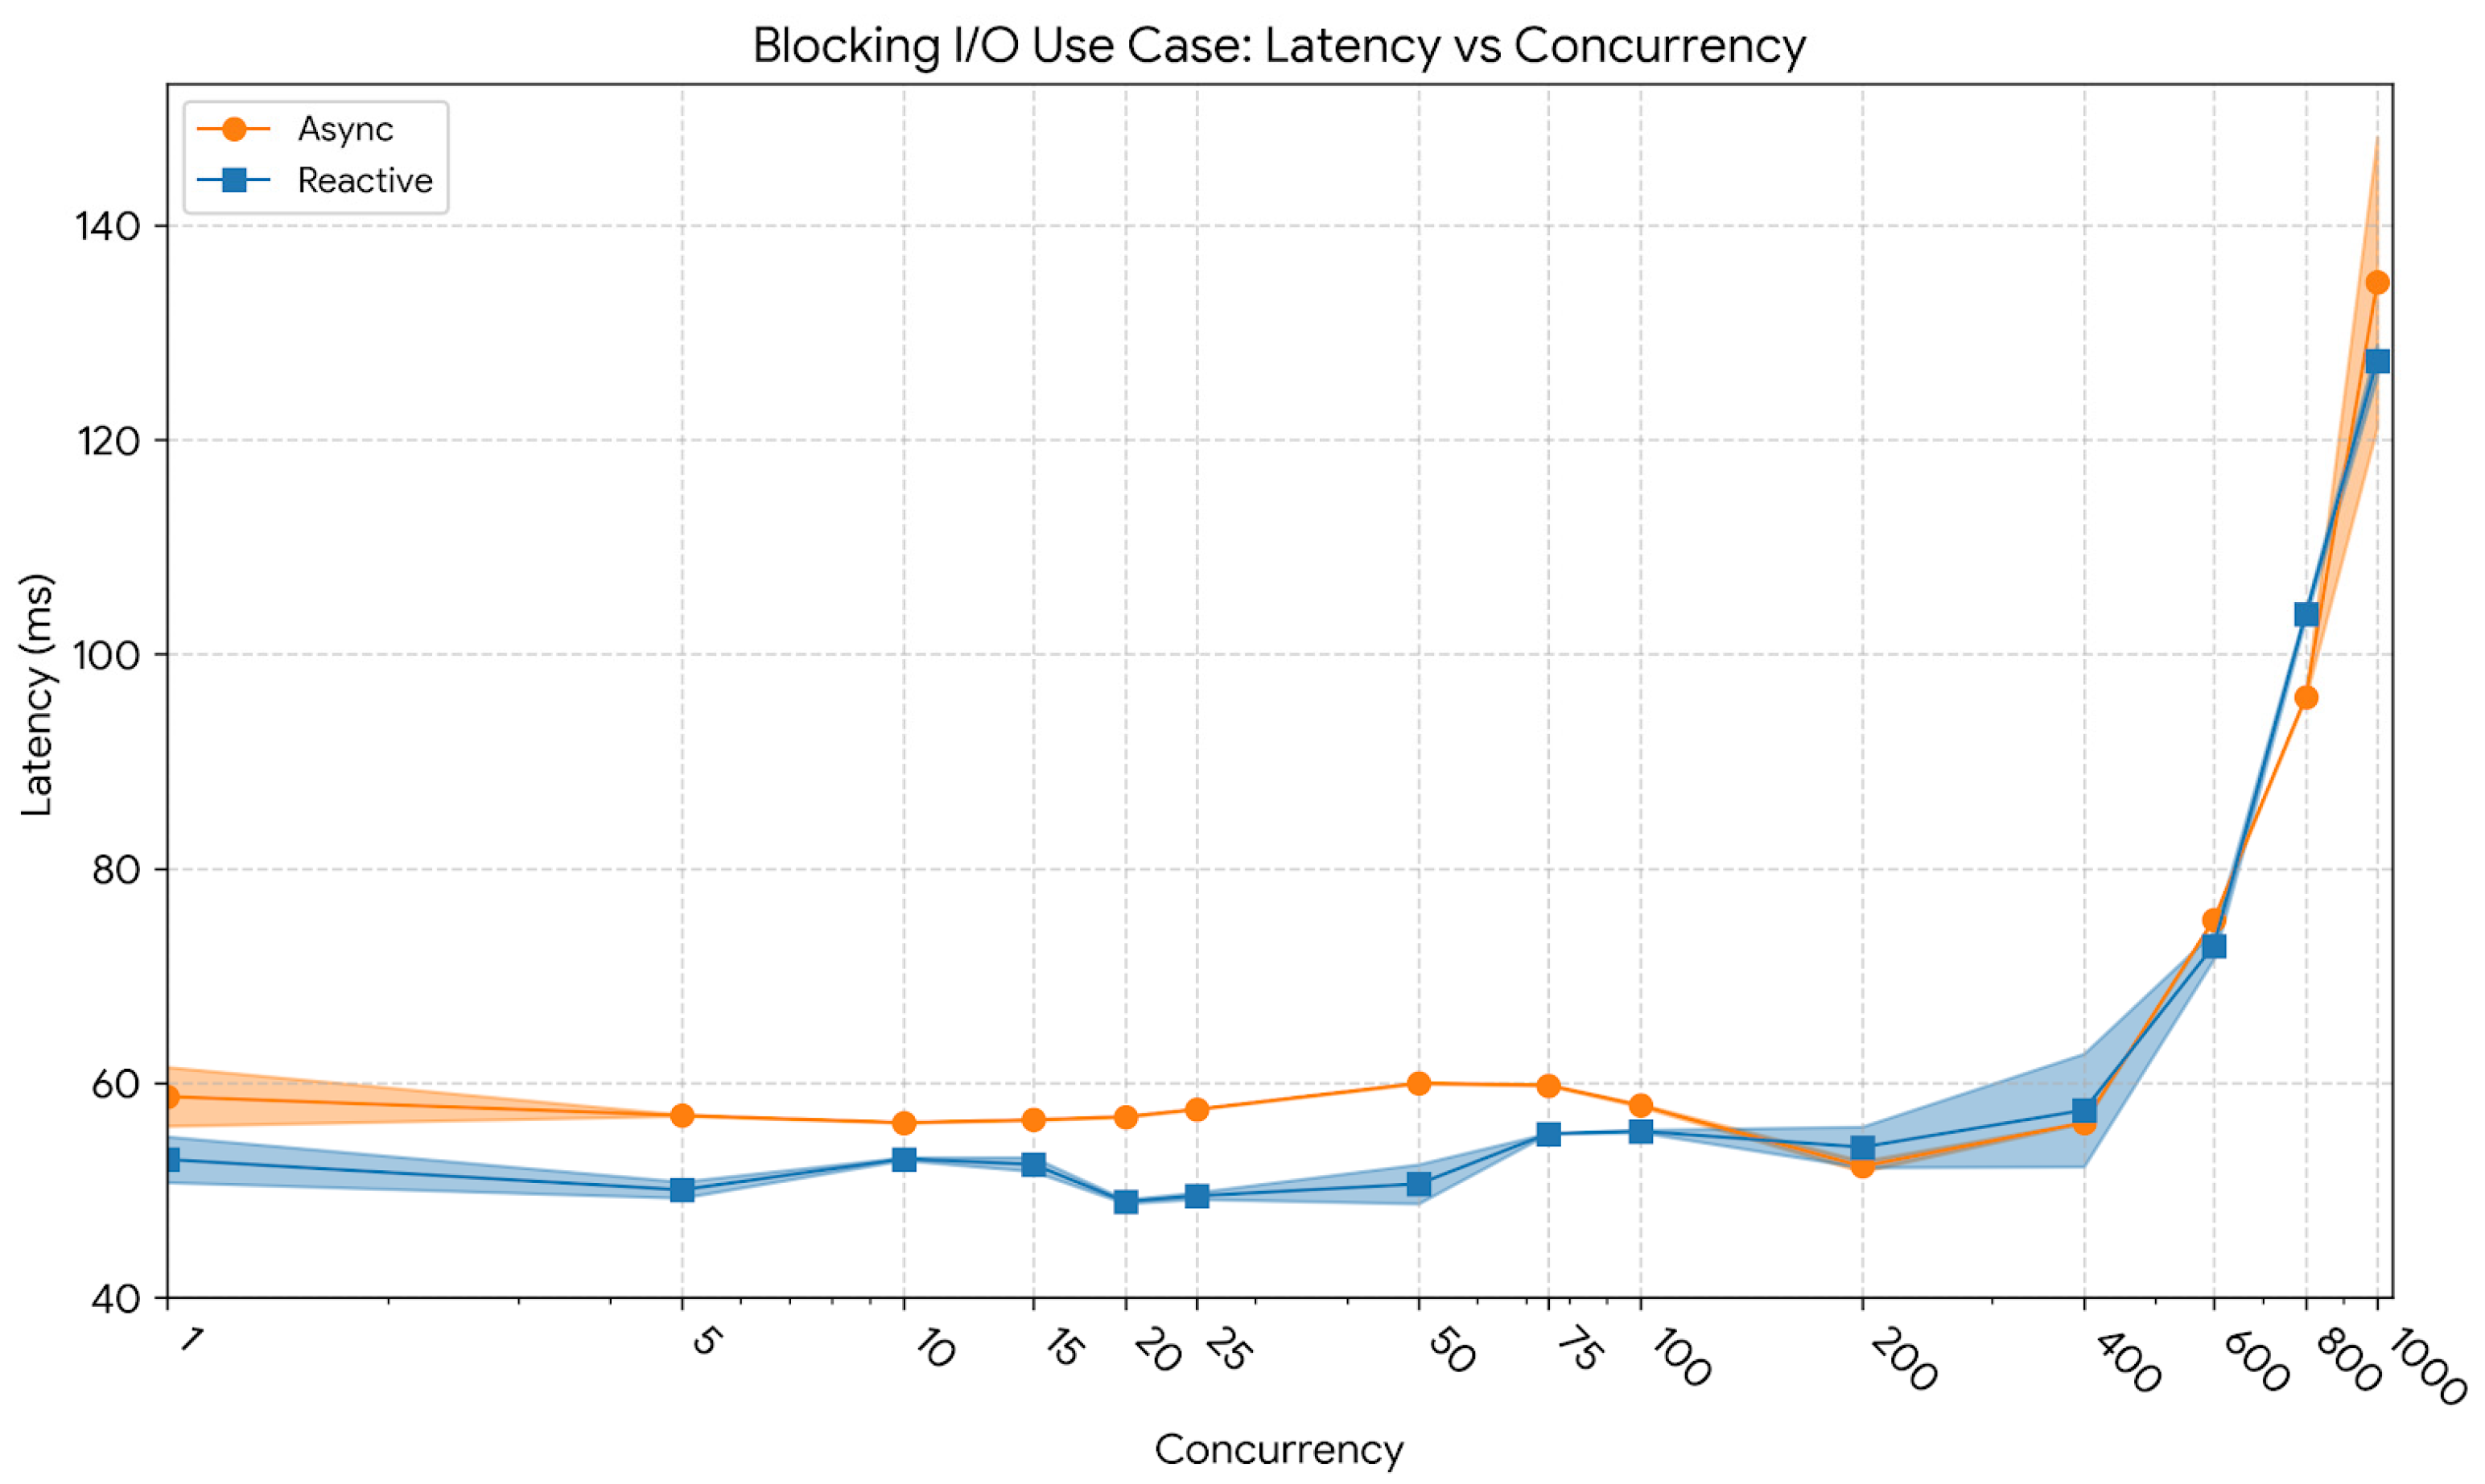
Latency variations for the blocking workload are shown in
Figure 11. At 10 users, the reactive model exhibited an average latency of 52.93 ms and a p95 latency of 59.32 ms, slightly lower than the asynchronous implementation’s 56.31 ms and 63.01 ms, respectively. At 400 users, the reactive system maintained an average latency of 57.48 ms and a p95 latency of 118.39 ms, compared to the asynchronous model’s 56.31 ms and 78.18 ms, showing that the event-driven pipeline preserved shorter response times even as thread contention intensified. At 1000 users, the reactive design reached an average latency of 127.38 ms with a p95 of ≈ 258 ms, whereas the asynchronous variant exhibited 134.67 ms and ≈ 351 ms, confirming that while both systems degraded under extreme load, the reactive architecture sustained more predictable response characteristics.
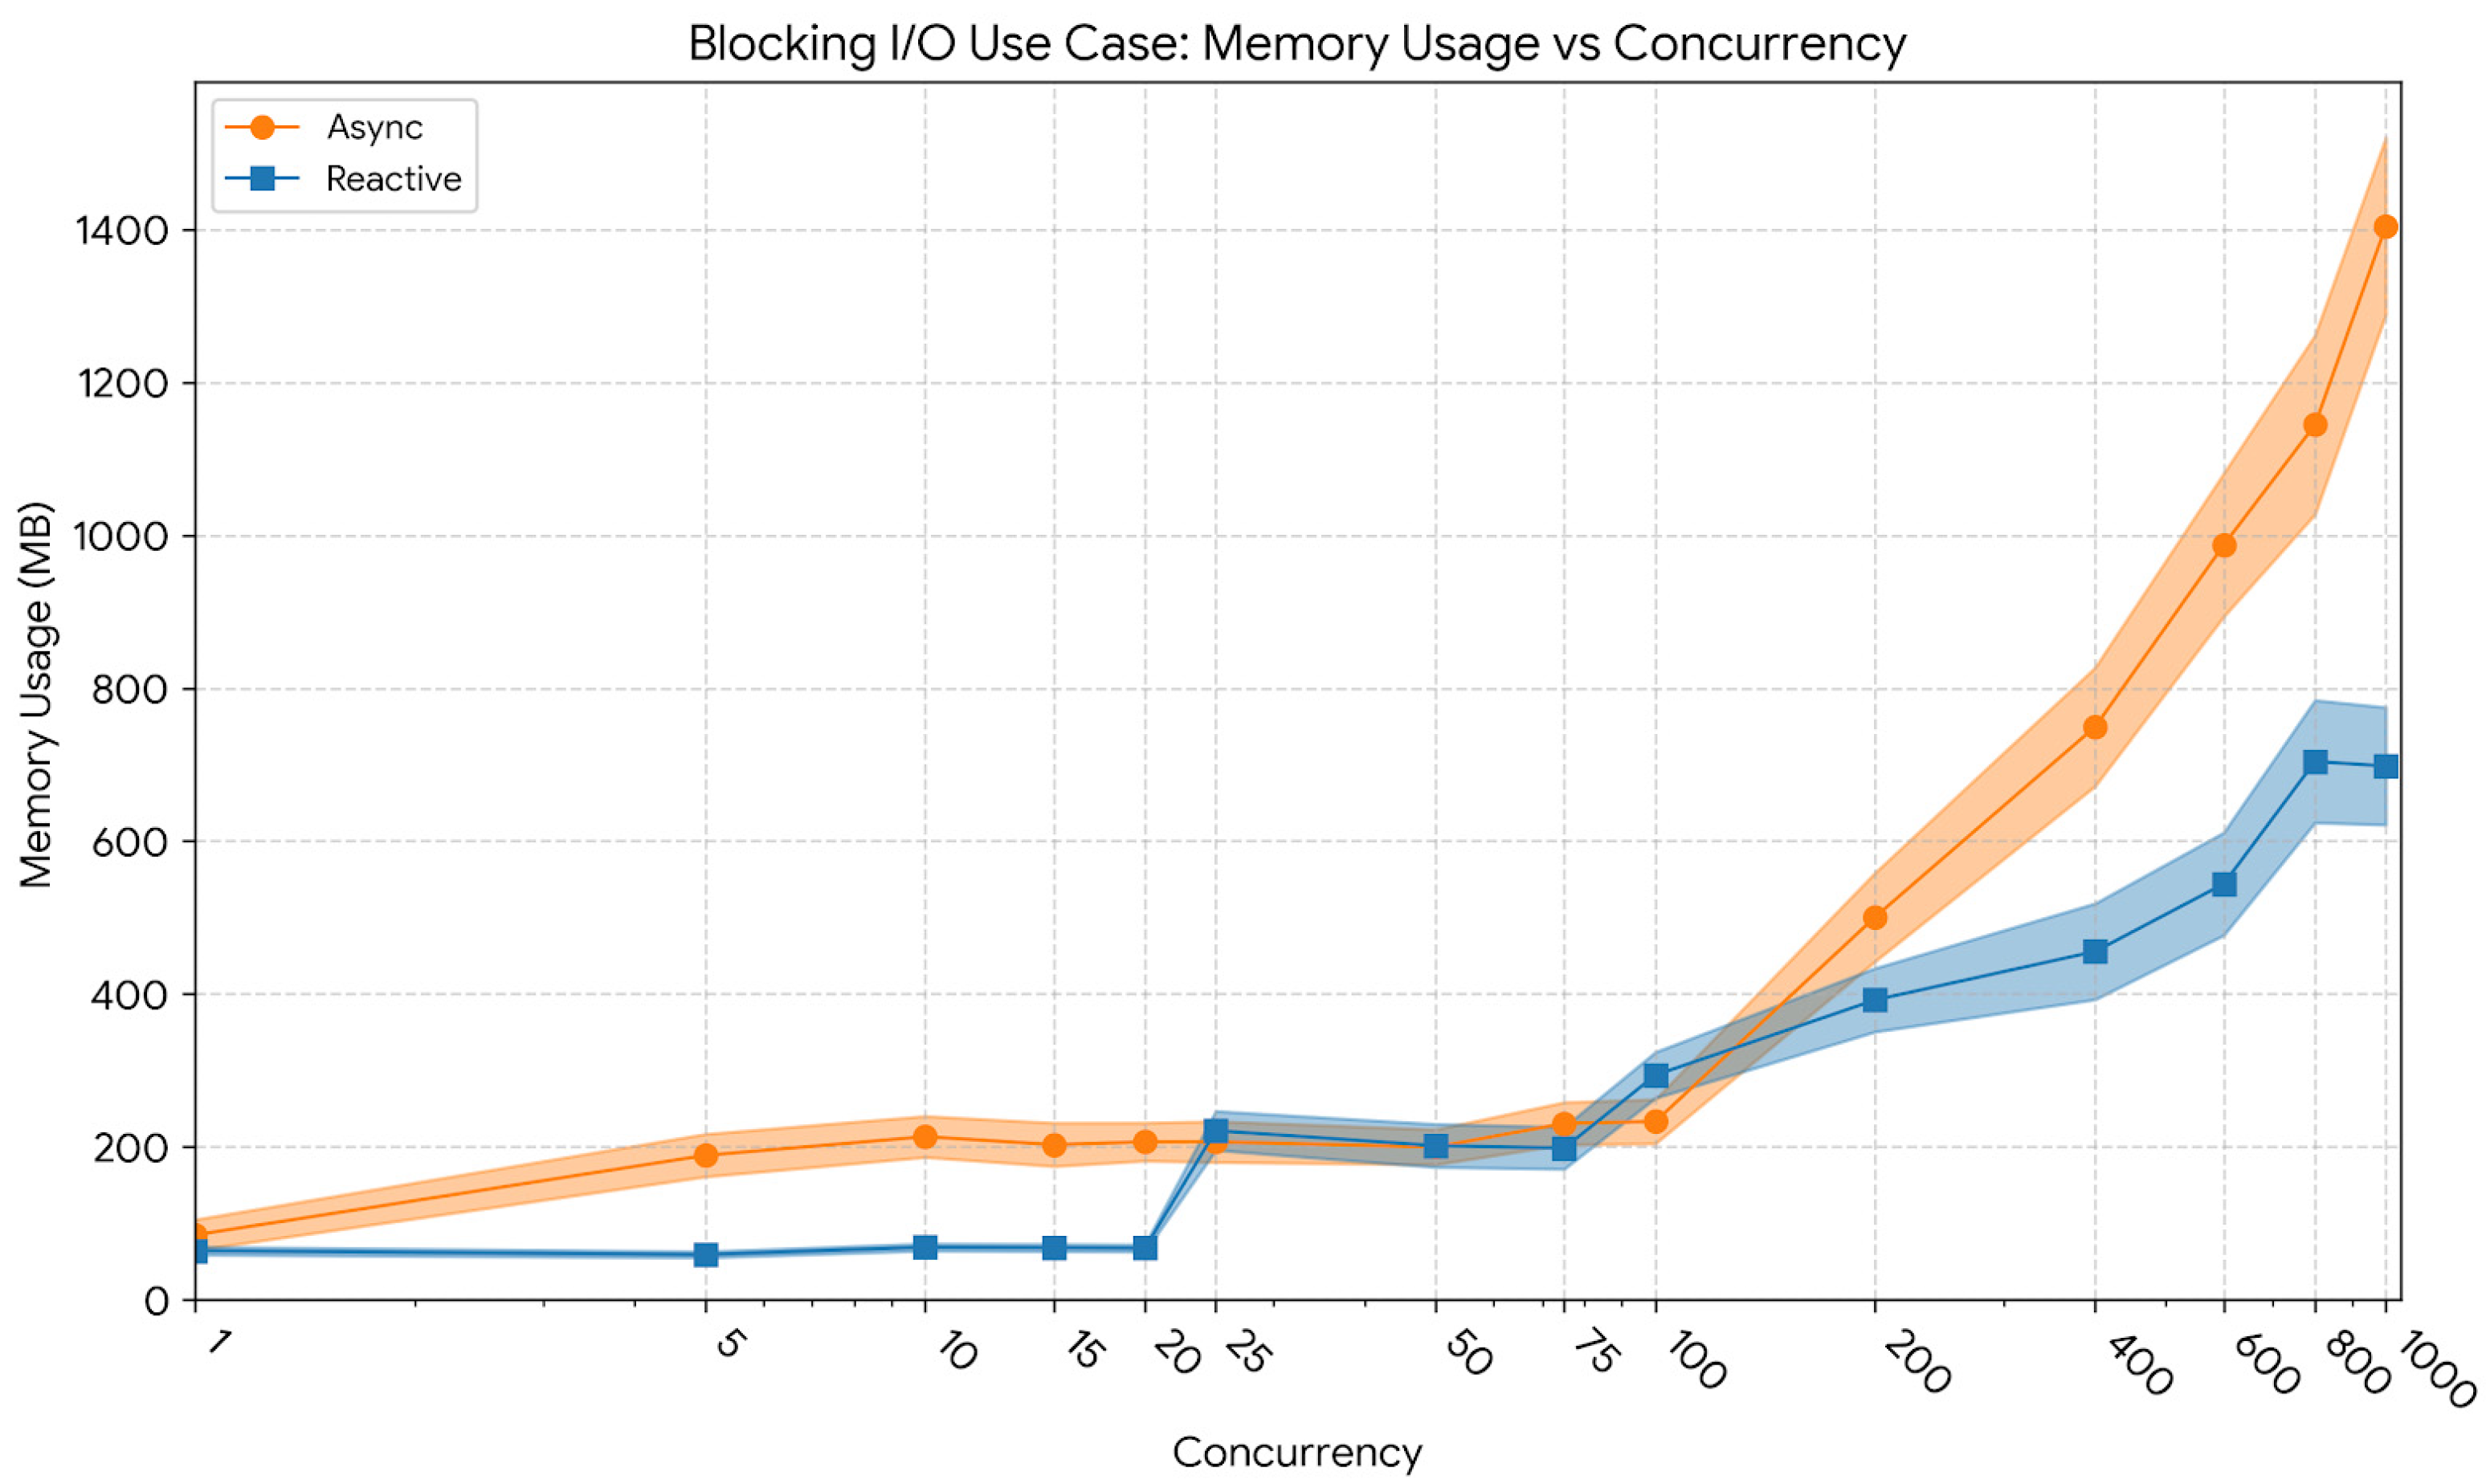
Memory usage patterns across concurrency levels are illustrated in
Figure 12. At 10 users, the reactive implementation maintained a substantially smaller footprint (≈69 MB) compared to the asynchronous model (≈213 MB). At 400 users, memory consumption increased to ≈456 MB for the reactive variant and ≈750 MB for the asynchronous one. At 1000 users, heap utilization stabilized at around 698 MB for the reactive and 1404 MB for the asynchronous model, a reduction of roughly 50% in memory overhead. This trend demonstrates that the reactive runtime manages blocking-induced thread and buffer allocations more efficiently, maintaining a lower and more stable memory profile.
Figure 13 summarizes CPU utilization behavior under blocking conditions. At 10 users, average utilization remained minimal, 2.56% (std = 0.18) for the reactive model and 4.71% (std = 0.36) for the asynchronous one. At 400 users, CPU usage reached 40.3% (std = 3.2) for the reactive implementation and 67.6% (std = 4.0) for the asynchronous variant. At the highest concurrency level of 1000 users, utilization plateaued near 63.4% for the reactive model and 67.0% for the asynchronous one, illustrating that both systems operated near their saturation point, but with the reactive model maintaining consistently lower overhead.
Overall, the experiment confirmed that when I/O remains strictly blocking, scalability is inherently constrained due to thread contention. However, the reactive model demonstrated superior CPU and memory efficiency, leading to slightly higher sustained throughput even under full blocking. The plateau observed beyond 600 concurrent users indicates that further concurrency offers negligible performance benefit, underscoring the necessity of non-blocking I/O or reactive backpressure strategies for workloads with heavy synchronization or I/O wait times.
To determine whether the observed performance ceilings were driven by the intrinsic nature of blocking tasks or by configuration constraints, we analyzed the saturation behavior under identical resource limits (1000 workers). The results reveal a fundamental architectural divergence regarding infrastructure overhead. While the throughput saturation in both models is driven by the nature of the blocking operation (the fixed delay), the memory efficiency is determined by the container architecture. The asynchronous model’s 1404 MB footprint reflects the cumulative cost of maintaining 1000 worker threads plus the significant overhead of the Servlet container managing 1000 concurrent HTTP connections. In contrast, the reactive model’s 698 MB footprint confirms that while it allocates the same 1000 worker threads for the blocking logic, the non-blocking I/O layer (Netty) manages the 1000 open network connections with negligible memory cost. This confirms that the reactive paradigm eliminates the infrastructure tax of high concurrency, even when the business logic itself is blocking.
6.5. Discussion of Results
The experiments conducted across the caching, CPU-bound, and blocking I/O scenarios reveal a consistent performance divergence that is fundamentally driven by the architectural differences between thread-per-request scheduling and event-loop processing. Across all test categories, the reactive model achieved measurable gains in resource elasticity, particularly in environments characterized by I/O wait times, yet exhibited distinct limitations when computational saturation or blocking operations prevented the event loop from progressing.
In the caching scenario, the substantial performance gap, where the reactive model achieved 75% higher throughput at 400 users, can be attributed directly to the elimination of scheduler contention. The asynchronous implementation, relying on a dedicated thread for every concurrent request, exhibited high CPU volatility under load. At 800 concurrent users, the asynchronous model showed a CPU standard deviation of 4.97%, approximately three times higher than the reactive model’s 1.56%. This indicates context-switching overhead, as the operating system scheduler was forced to constantly preempt threads waiting for network I/O. In contrast, the reactive model maintained high CPU affinity by processing requests on a fixed number of threads [
5]. This architectural efficiency explains why the reactive model could sustain 45,641 req/s with only 31.5% CPU utilization, whereas the asynchronous model saturated the CPU (52.1%) to achieve nearly half that throughput; the observed disparity represents the infrastructure tax of managing blocked threads.
However, the CPU-bound workload highlighted the cost of abstraction inherent in the reactive paradigm. While both models converged to an identical throughput ceiling (≈374 req/s) upon reaching processor saturation, the latency distribution revealed a critical weakness in the non-blocking model. At 100 concurrent users, the reactive implementation exhibited a p95 latency of 742 ms, nearly double that of the asynchronous model (468 ms). This phenomenon occurs because event-loop threads are not meant for heavy computation; CPU-bound tasks executed on them cause head-of-line blocking and increased tail latency [
5]. Unlike the preemptive thread-based model, which creates the illusion of parallelism by time-slicing CPU cycles across all tasks, the reactive runtime struggles to interleave heavy computation, resulting in higher tail latency variability once the CPU is fully saturated.
In the blocking I/O scenario, the divergence in memory consumption provides the clearest evidence of the structural overhead differences between the paradigms. Although throughput was constrained by the fixed blocking delay in both cases, the asynchronous model required 1404 MB of memory to handle 1000 concurrent users, compared to just 698 MB for the reactive model. This 50% reduction is not due to business logic efficiency but rather the difference between stack and heap allocation. The asynchronous model must allocate a dedicated stack block in native memory for every worker thread, leading to linear memory growth. Conversely, the reactive model wraps the blocking call in a Runnable scheduled on a dedicated pool, while keeping connection handling non-blocking (Netty), avoiding the per-connection thread and stack overhead typical of servlet-based concurrency [
5]. This confirms that while reactive wrappers cannot speed up blocking operations, they provide superior resilience against Out-Of-Memory (OOM) failures in high-concurrency legacy integrations.
Overall, these findings refine the understanding of when to adopt reactive architectures. The results suggest that the performance benefits of reactive programming are not universal but are strictly defined by the workload’s I/O-to-computation ratio. For I/O-heavy and caching workloads, the reactive model successfully converts waiting time into processing capacity by eliminating thread contention. However, for CPU-bound or uncontained blocking tasks, the overhead of the reactive state machine yields no benefit and may introduce latency instability. Therefore, the choice of paradigm should be dictated by the specific resource bottlenecks of the application, optimizing for thread efficiency in I/O-bound microservices, while retaining the simpler thread-per-request model for compute-intensive processing.
7. Conclusions and Further Development
Although no single benchmark can definitively settle the asynchronous–reactive debate, the results presented in this work provide concrete, data-driven insight into their performance characteristics, resource efficiency, and architectural design implications under realistic operating conditions.
7.1. Conclusions
The scientific contribution of this work lies in its integrated experimental design, which evaluates asynchronous and reactive Java architectures under a triad of realistic workload categories: caching-intensive operations, CPU-bound computation, and controlled blocking behavior, within a single, functionally equivalent system. This research constructs a unified evaluation environment that preserves API-level and architectural equivalence across paradigms while systematically varying workload characteristics. This design enables a precise measurement of how concurrency models influence throughput scaling, latency distributions, thread utilization, and memory dynamics under highly diverse operational profiles.
A second major contribution is the introduction of a formalized methodology for assessing concurrency paradigms through statistically robust experiments. The study incorporates multi-run measurements, 95% confidence intervals, percentile-based latency characterizations, and continuous monitoring via instrumented schedulers. This methodology extends the experimental rigor established in our prior research and provides a reproducible template for future work. By standardizing the evaluation framework across heterogeneous workloads, the study advances the state of empirical research in Java concurrency beyond ad hoc benchmarks.
Furthermore, the work contributes new insights into performance boundary conditions. The results demonstrate that while reactive architectures yield substantial advantages for I/O-bound caching workloads, the advantages diminish or disappear as workloads become computation-heavy or blocking-dominated. Under CPU saturation, both paradigms converge to nearly identical throughput ceilings, while improper containment of blocking operations can erode reactive scalability entirely. These findings refine the assumption that reactive programming universally improves performance, instead showing that its benefits are strongly workload-dependent.
Translating these empirical boundary conditions into architectural guidelines, the results indicate distinct optimal use cases for each paradigm. For subsystems dominated by network wait times, such as API gateways or distributed caching layers, the reactive model proves to be the superior choice. Our experiments demonstrated that this architecture achieved up to 75% higher throughput and maintained CPU affinity (1.56% variance) where the thread-per-request model suffered from significant scheduler contention. Consequently, we recommend adopting reactive frameworks for high-concurrency, I/O-intensive components to maximize hardware efficiency.
Conversely, for strictly CPU-bound microservices involving heavy data serialization or image processing, the asynchronous thread-per-request model remains preferable. In our evaluation, both paradigms hit an identical CPU wall, but the reactive model incurred a cost of abstraction evident in higher tail latencies at saturation. Given that the added complexity of reactive streams yields no performance return in these scenarios, developers should favor the simpler imperative model for compute-heavy tasks.
Finally, for legacy environments, where blocking I/O is unavoidable, the reactive paradigm offers a distinct safety advantage. While our results confirm that reactive programming cannot overcome the throughput limits of the blocking resource, the observed 50% reduction in memory footprint confirms that heap-based task queuing significantly reduces memory pressure compared to per-request thread-stack allocation. Therefore, we advise utilizing reactive wrappers for blocking operations not to improve speed, but to minimize the risk of Out-Of-Memory (OOM) failures under saturation.
Based on the analyses and performance results obtained in this extended benchmarking, an iterative refinement process remains essential to continuously optimize performance and address the limitations identified throughout the evaluation. This iterative improvement approach, similar to the refinement cycles employed in modern software development methodologies, ensures that the system evolves towards higher efficiency and stability across diverse workload profiles and deployment conditions [
52].
7.2. Further Development
Future work could expand the current evaluation along complementary directions.
Firstly, a more systematic investigation of the persistence layer is needed. The study has only considered blocking and reactive database access in a very controlled environment, so it makes sense that benchmarking be extended to cover a wide range of data stores and drivers. The comparison between relational engines like PostgreSQL, Oracle, and MySQL and NoSQL systems such as MongoDB and Cassandra will provide insight into how the underlying I/O model and the maturity of the R2DBC driver affect the end-to-end performance. In particular, this sort of examination would be very helpful for understanding the differences between the architectural gains and driver-specific optimizations, revealing the scalability potential of the reactive persistence ecosystem.
Secondly, the scope of the caching evaluation should be broadened to include multi-tier and hybrid architectures. While the current study isolated the network impact of remote caching (Redis) to benchmark concurrency models, future work should examine local-first (hybrid) allocation strategies and varying eviction policies (e.g., LFU vs. LRU). Investigating how reactive runtimes manage on-heap caching pressure versus off-heap buffers would provide critical insights for architects optimizing for latency-sensitive rather than purely throughput-oriented systems.
Thirdly, the experiments should be conducted in different execution environments to verify the results. Only CPU-based infrastructure has been used for all the measurements in the current work while cloud and edge deployments in the real world are increasingly using ARM-based servers, GPU-accelerated nodes, and lightweight edge devices. Analyzing the performance of concurrency patterns, scheduling strategies, and caching layers in these different hardware profiles under both cold-start and steady-state conditions could result in the identification of new trade-offs between throughput, energy efficiency, and latency, especially in resource-constrained or geographically distributed scenarios.
Fourthly, the study can be extended towards adaptive runtime optimization by means of machine learning instead of static configuration. Controllers driven by machine learning could, based on real-time workload metrics, could be in charge of dynamically managing the cache eviction policies, thread-pool sizing, or database connection handling. The incorporation of such feedback loops into the reactive runtimes might make it possible for the systems to be perpetually self-tuning and successfully handling fluctuating load conditions, while also operating at optimum performance levels. Additionally, future studies should incorporate parametric sensitivity analyses, specifically varying the intensity of blocking delays (e.g., ranging from 10 ms to 1 s). While the current work established the architectural baseline using a fixed delay, exploring variable blocking durations would help quantify the precise elasticity of the reactive scheduler under oscillating latency conditions.
Finally, in order to be practically relevant, these methods need to be validated eventually by using real production traces, multi-service deployments, and polyglot technology stacks to verify that the performance characteristics that have been observed are actually applicable in real-world enterprises beyond controlled experiments.
