Abstract
When the signal-to-noise ratio (SNR) falls below −10 dB, signals are considered weak. Radar systems, particularly those on small platforms like drones and satellites, often face this challenge due to limited power, resulting in low transmit power and weak signals. Additionally, ambient noises in the detection environment can further obscure the echo signal, leading to low SNR. Satellite-based radar systems are further constrained by processing capabilities and limitations in data transmission bandwidth and communication time windows. As a result, received radar signals are often transformed into a frequency spectrum and relayed to ground stations for offline processing. To address these challenges, this study proposes a novel method that treats the frequency spectrum of the echo signal as an impulse signal and interprets the frequency domain as a “pseudo-time domain”. By applying conventional time-domain waveform detection methods, such as wavelet analysis, in this “pseudo-time domain”, we can significantly enhance the success rate and accuracy of offline detection for weak echo signals. Numerical simulations show that this approach can handle SNR as low as −34 dB or even lower, which achieves notable denoising effects and improves signal quality. In cases where the SNR reaches −40 dB, the detection success rate exceeds 95% in most instances. Outdoor experiments also maintain a 90% accuracy rate even at −34 dB SNR.
1. Introduction
The deployment of radar systems on miniaturized platforms such as drones and satellites confronts a critical technical challenge: the coupling effect between power-constrained transmission systems and strong background noise in complex electromagnetic environments yields received signals with characteristically low signal-to-noise ratios (SNR dB) [1,2]. This weak signal characteristic not only substantially elevates false alarm probabilities but also fundamentally undermines the reliability of conventional detection frameworks [3,4]. In such strong noise environments, the effective identification of weak signals primarily relies on two methodological frameworks: linear and nonlinear analytical approaches. As a core linear analysis technique, time-domain, frequency-domain, and time-frequency joint analysis methods achieve feature extraction by investigating signal characteristics in the time-frequency distribution. Particularly, the time-frequency joint analysis methodology overcomes the limitations of conventional single-domain representations through the construction of time-frequency distribution maps, enabling precise characterization of signal transient features. Its principal advantage lies in a multidimensional representation capability that effectively resolves the non-stationary characteristics of complex signals.
Among time-frequency joint analysis methods, wavelet transform has emerged as a research focus due to its unique dual-domain filtering capability [5,6]. Compared with the single-domain frequency representation of the Fourier transform, wavelet decomposition achieves effective noise suppression through multiscale feature extraction while preserving temporal signal details [7,8,9]. Current research demonstrates varying performance limits: a modulus maxima detection-based wavelet reconstruction strategy enables lidar echo denoising within the 8 dB to 1 dB [10], while frequency-domain accumulation combined with temporal wavelet transform accomplishes signal recovery at SNR = dB [11]. Recent advancements include multilayer autocorrelation-based detection for weak sinusoidal signals (−18 dB to −20 dB) [12] and range-guided wavelet transform achieving echo denoising at 1.37 dB [13]. A two-step noise reduction strategy has been reported to process −19 dB weak signals [14]. Although these studies have reached a minimum SNR of dB, more effective denoising methods for lower SNR conditions remain imperative.
Recent efforts have integrated wavelet denoising with deep learning to reduce computational load and adapt to complex data environments. Representative work includes a completely unsupervised deep learning framework for high-frequency time series monitoring, demonstrating enhanced unsupervised monitoring capabilities [15,16]. And the method of combining wavelet denoising with long-term and short-term memory (LSTM) network is used to study the denoising effect in the SNR range of dB to dB [17]. Furthermore, wavelet denoising techniques have been specifically applied in hydroacoustic signal processing [18], seismic analysis [19], and target detection [20,21,22,23]. Cross-domain research documented in [24] confirms wavelet transform’s capability for defect identification under extreme noise conditions (SNR dB), suggesting potential applicability to radar signal detection. However, existing wavelet-based denoising studies predominantly focus on temporal waveform analysis. Although some exploratory attempts employ frequency-domain methods such as spectral accumulation [25] and frequency filtering [26], conventional frequency filtering only eliminates out-of-band noise, while in-band noise components persistently degrade useful signal integrity.
To address the aforementioned challenges, this paper proposes a radar weak echo signal detection method based on a pseudo-time-domain algorithm. This method constructs a two-stage processing flow comprising pure noise/signal analysis and received signal parsing through spectral data mapping into pseudo-time-domain sequences. On the satellite end, the spectral data of received signals undergoes preprocessing via frequency-domain filters to compress transmission data volume. During the ground-based offline processing stage, noise suppression and signal-to-noise ratio (SNR) enhancement are achieved through a time-domain wavelet transform algorithm in the pseudo-time-domain. Experimental results demonstrate that the pseudo-time-domain-based denoising process significantly improves the SNR of weak echo signals, enhances detection success rates and accuracy, achieves breakthroughs in detection precision under SNR conditions as low as −40 dB, and simultaneously opens new dimensions for applying deep learning to spaceborne radar signal processing.
2. Introduction to Denoising Methods
This study is entirely based on signal spectra. It defines the frequency domain as a “pseudo-time domain”, where the frequency domain features of the detected signals, including but not limited to signal spectra and power spectra, are regarded as waveforms in this pseudo-time domain. Specific structures within the pseudo-time domain waveforms, corresponding to specific frequency domain features, are identified using waveform detection methods. Therefore, the subject of this research is the frequency domain waveform of signals. After converting time-domain signals into frequency domain signals, denoising and detection of received signals can also be carried out in the “pseudo-time domain” using time-domain denoising methods.
The chosen denoising method in this paper is the Discrete Wavelet Transform (DWT) [27]. The DWT allows for multiscale analysis of signals, enabling the localization, detection, and extraction of useful signals within a specific range.
In this paper, the entire process of denoising and detecting weak return signals is illustrated in Figure 1, which involves five steps.
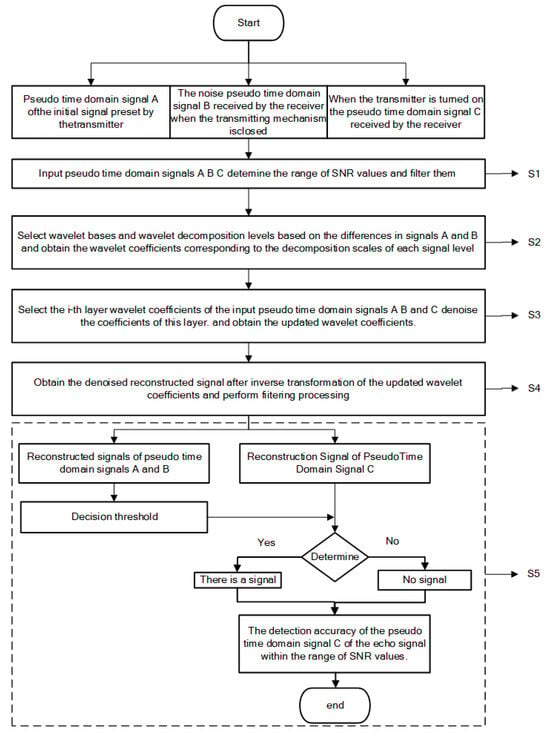
Figure 1.
Flow chart of signal denoising.
Step 1: The input pseudo-time domain signals come in three forms. Background noise, which occurs when the transmitter is off and the receiver detects noise, is the sum of spatial environmental noise, system thermal noise from the receiver, and other external interferences. This signal is in the time domain, with its corresponding frequency domain signal denoted as pseudo-time domain signal A. The reference signal is the initially preset signal from the transmitter, also in the time domain, with its frequency domain signal represented as pseudo-time domain signal B. The received signal, which may or may not contain the transmission signal, is the signal received by the receiver when the transmitter is turned on. This signal is in the time domain, with its frequency domain signal referred to as pseudo-time domain signal C. Upon inputting pseudo-time domain signals A, B, and C, the range of SNR for the signal to be detected is determined, and filtering is applied.
Step 2: Based on the differences in pseudo-time domain signals A and B, wavelet bases and wavelet decomposition levels are selected to decompose the pseudo-time domain signals. This decomposition yields wavelet coefficients corresponding to different decomposition scales in the pseudo-time domain. Traditional wavelet decomposition is performed in the time domain, but in Step 2, the decomposition is conducted in the pseudo-time domain. Methods to determine the decomposition level n include, but are not limited to, the following approaches:
n, representing the wavelet decomposition level, is an integer value determined by the receiver’s sampling rate and the signal frequency.
Step 3: Select the i-th level wavelet coefficients corresponding to the input pseudo-time domain signals A, B, and C. Denoise this level of coefficients, resulting in updated wavelet coefficients. Traditional thresholding methods include three types: hard thresholding [28], soft thresholding [29], and forced denoising [30,31,32]. In this paper, select the i-th level wavelet coefficients , , and corresponding to pseudo-time domain signals A, B, and C. Based on Equations (2)–(4), the coefficients at this level are denoised to obtain the updated wavelet coefficients , Therefore, the updated , , and are obtained. The denominator a is determined by analyzing multiple sets of background noise at this layer, which influences the detection signal accuracy. Here, denotes the global noise standard deviation, and represents the noise standard deviation of the background noise at the i-th layer. For the i-th wavelet coefficients, the layer-specific threshold is defined as .
Step 4: Perform an inverse transform on the updated wavelet coefficients to obtain the denoised reconstructed signal, followed by filtering.
Step 5: Determine the decision threshold for the reconstructed signals of pseudo-time domain signals A and B. Detect the reconstructed signal of input pseudo-time domain signal C, and determine the presence of a signal. This process yields the detection accuracy of the pseudo-time domain signal C for the SNR range in question.
3. Experimental Results and Analysis
3.1. Simulation Experiment Results and Discussion
The received signals used in this paper include Gaussian white noise with a single-frequency sine signal and Gaussian white noise without it. The expression for the received signal is as follows:
where is the single-frequency sine signal, and is the Gaussian white noise.
Parameters are set as follows: the frequency of the sine signal is Hz, the SNR is set to SNR = −24 dB. Based on the SNR, zero-mean Gaussian white noise is added to the sine signal. The sampling frequency is Hz, and the number of sampling points is .
From Figure 2, it can be observed that at a SNR of −24 dB, the sine signal is completely masked by noise in both the time domain and the pseudo-time domain. In the pseudo-time domain, the noise intensity exceeds that of the signal. The distinction between the received signal with the added sine signal and the background noise signal is almost imperceptible. Therefore, under low SNR conditions, direct signal identification is not possible, and the task of signal detection and extraction becomes highly challenging.
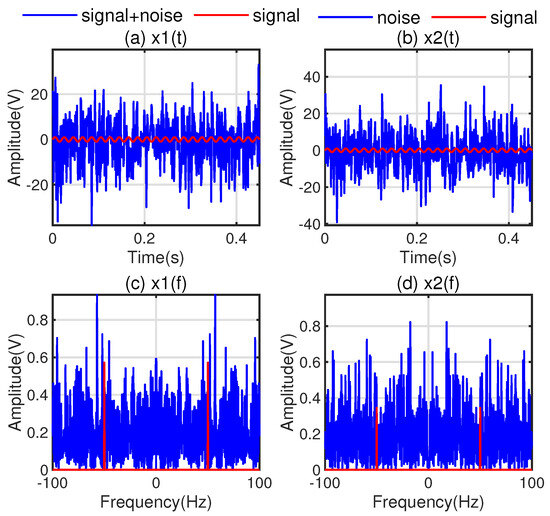
Figure 2.
Waveforms of received signals at SNR = −24 dB. (a) Time-domain waveform of signal ; (b) Time-domain waveform of signal ; (c) Pseudo-time-domain waveform of signal ; (d) Pseudo-time-domain waveform of signal .
For signals with a specific frequency, the bandwidth of the band-pass filter is set to Hz, so the frequency range of the received signal after filtering is Hz. In this study, the received signals after preprocessing are in the frequency bands of (−60, −40) Hz and Hz. The signals used in Figure 2a,c are the received signals containing the sinusoidal signal spectrum, while those in Figure 2b,d are the received signals without the sinusoidal signal spectrum. The SNR of the received signal changes from approximately −24 dB to approximately −9 dB after filtering in Figure 3a,b. The received signal after filtering is subjected to wavelet decomposition and denoising, and the reconstructed waveform after denoising is compared with the original received signal waveform. After denoising, the SNR of the received signal is significantly increased, as shown in Figure 3c,d.
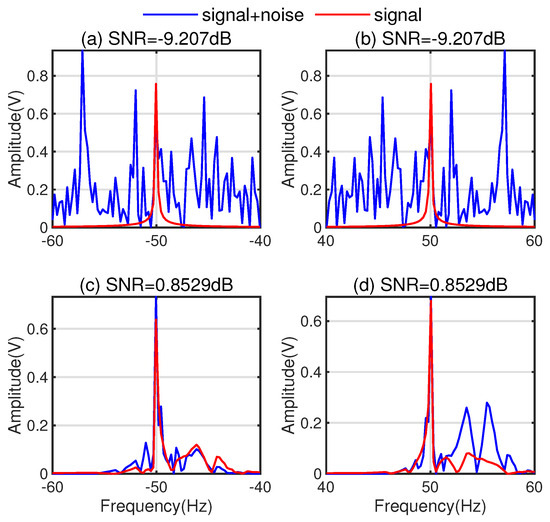
Figure 3.
Signal waveforms of received signals before and after denoising. (a,b) show the signal waveforms before wavelet denoising, while (c,d) show the signal waveforms after wavelet transformation.
A single set of data cannot adequately validate the accuracy of the method. Therefore, this paper performs denoising on 1000 sets of received signals multiple times, compares the results with the transmission conditions, and calculates the detection probability to verify the effectiveness and feasibility of the method.
The relationship between SNR and detection rate is shown in Figure 4. It can be seen that within the range of dB, the detection accuracy is . Within the range of dB, the detection rate decreases as the SNR decreases. When the SNR is dB, the detection success rate can exceed . Therefore, the simulation results can verify that the method adopted in this paper is an effective denoising method.
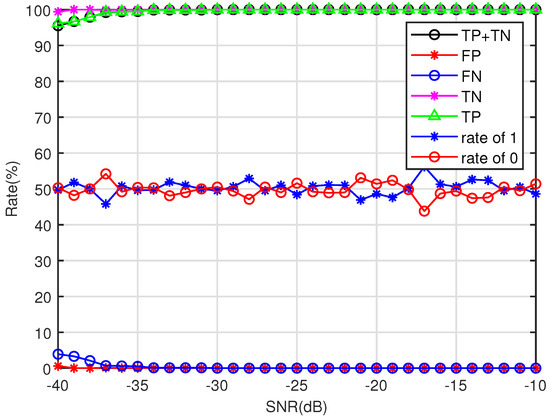
Figure 4.
Relationship between SNR and detection rate. In the figure, TP represents the probability of correctly identifying the presence of a signal. TN represents the probability of correctly identifying the absence of a signal. FP represents the false alarm probability, which is the probability of identifying the presence of a signal when there is none. FN represents the miss probability, which is the probability of identifying the absence of a signal when there is one. TP + TN represents the total probability of correctly identifying received signals.
3.2. Results and Analysis of Outdoor Experiments
At the position marked in red in the Figure 5, multiple sets of background noise signals were received by a signal reception system. The signal reception system consisted of a loop antenna, Universal Software Radio Peripheral (USRP) X410 (National Instruments, Austin, TX, USA), a computer, and other equipment. The outdoor experiment flowchart is shown in Figure 6.
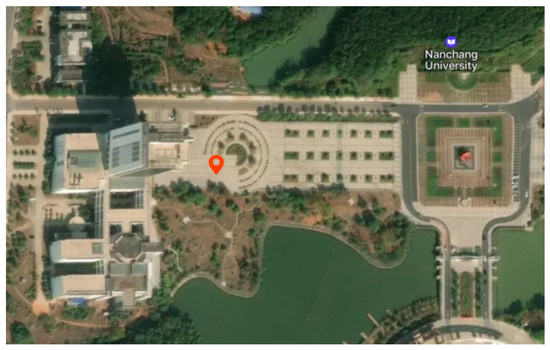
Figure 5.
Location of outdoor experiment.

Figure 6.
Flowchart of the outdoor experiment.
The open-loop experiment conducted in the outdoor environment captured all signals received by the transceiver from system startup to shutdown, as illustrated in Figure 7. The acquired time-domain waveform is partitioned into three characteristic segments: initial transient noise, stable external environmental noise, and post-shutdown system noise. Specifically, multiple stable segments from the second phase are selected as experimental background noise. The normalized time-domain waveform of the selected background noise is shown in Figure 8a, with corresponding pseudo-temporal domain representations provided in Figure 8b,c. These pseudo-temporal profiles reveal four distinct peaks from other interference sources, corresponding to spectral components at kHz and kHz.
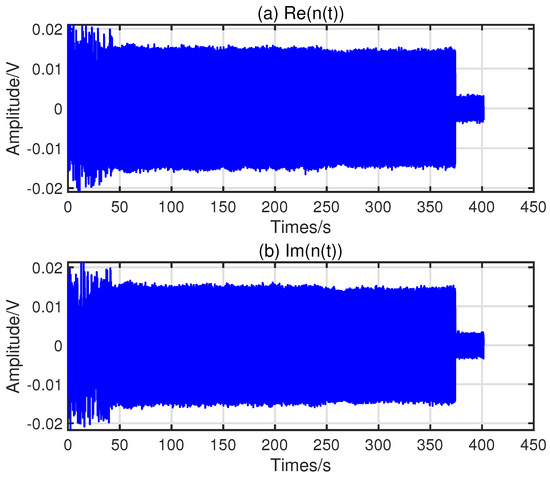
Figure 7.
Time domain diagram of received signal, (a) real part, (b) imaginary part.
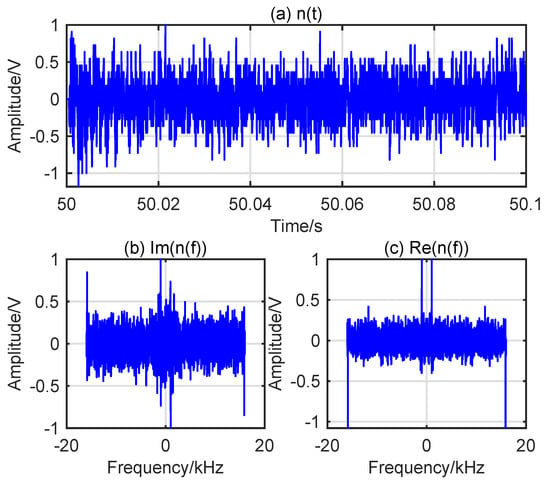
Figure 8.
The waveform diagrams of the background noise signal, where Figure (a) is the time-domain waveform, and Figure (b,c) are the pseudo-time-domain waveforms, respectively.
After adding the reference signal to the background noise to form a −30 dB received signal and normalizing it, the time-domain waveform is shown in Figure 9a, and the pseudo-time-domain waveforms are presented in Figure 9b,c. In Figure 9b, the two peaks of the red reference signal correspond to the spectral positions of the 10 kHz signal, which are completely masked by the noise. The denoising comparison of the received signal with an SNR of dB is shown in Figure 10. Figure 10a shows the pseudo-time-domain waveform of the received signal with the reference signal, and Figure 10b shows the pseudo-time-domain waveform of the received signal without the reference signal. From Figure 10a, it can be seen that the peaks at the frequency positions of the pseudo-time-domain waveform of the received signal with the reference signal are significantly larger after denoising. From Figure 10b, it can be seen that the peaks at the frequency positions of the pseudo-time-domain waveform of the received signal without the reference signal are much smaller after denoising.
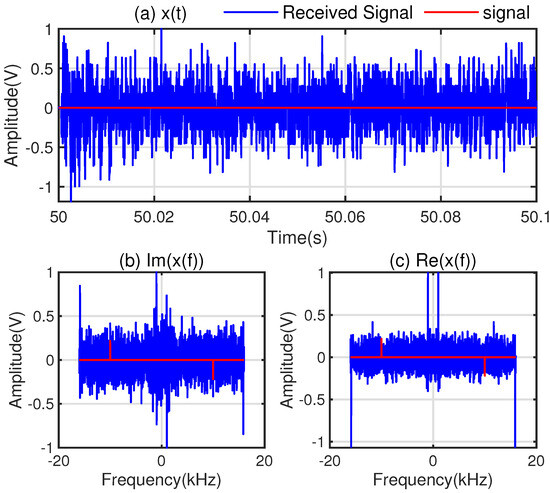
Figure 9.
The time-domain waveform and the pseudo-time-domain waveform of the received signal.
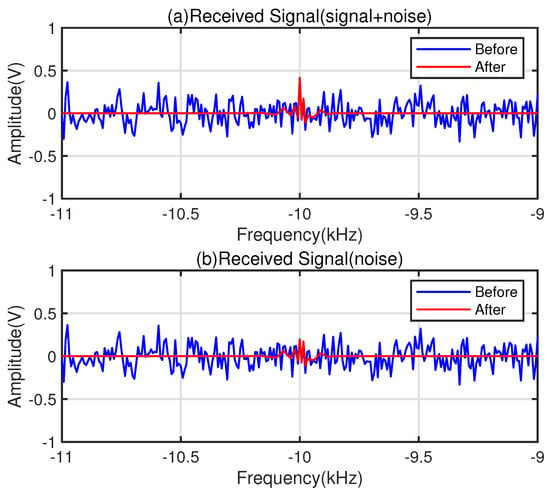
Figure 10.
Waveform diagrams before and after denoising: (a) Waveform of the noise signal before and after denoising, (b) Waveform of the received signal before and after denoising.
Through multiple experiments with 1000 sets of signals randomly added in the SNR range from dB to dB, the results obtained using the denoising method presented in this paper are shown in Figure 11. As the SNR increases, the detection accuracy gradually improves. When the SNR is greater than or equal to dB, the detection rate reaches , and it exceeds at an SNR of dB.
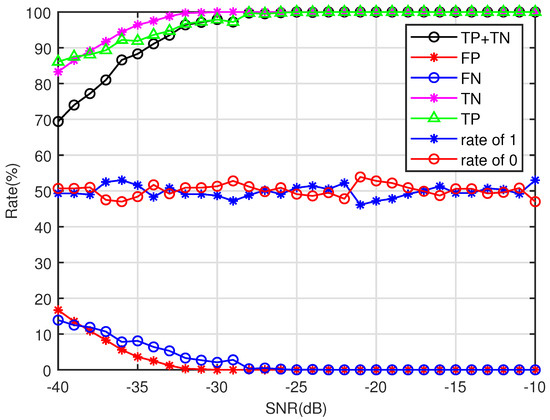
Figure 11.
Detection probability plots for 1000 groups, each with a distinct SNR.
The comparison between the SNR values that can be processed in this article and other literature is shown in Table 1. In the selection of SNR for detecting radar signals, the minimum SNR value in other literature is dB. The method proposed in this article achieves detection accuracy close to the theoretical limit in simulation experiments at dB.

Table 1.
Performance Comparison of Different Methods.
4. Conclusions
This study, based on signal spectra, defines the frequency domain as a “pseudo-time domain” and employs wavelet transform to identify specific structures within the pseudo-time domain waveforms. By applying wavelet transform in the “pseudo-time domain”, thresholds are established according to the characteristics of the transmitted signal and background noise after wavelet decomposition. This process effectively removes noise, significantly enhances the signal-to-noise ratio (SNR), and achieves a high detection success rate. Numerical simulations demonstrate that this method can handle received signals with SNR as low as dB or even lower, substantially increasing the SNR and achieving a notable denoising effect. When the SNR is dB, the maximum detection success rate can exceed . Outdoor experimental results show that the accuracy remains at even when the SNR is dB.
Therefore, this method can accurately detect weak signals with very low SNRs and is compatible with existing time-domain denoising methods. It effectively improves the weak signal detection accuracy of low-power radars installed on small platforms such as unmanned aerial vehicles and satellites, enabling the detection of signals at longer distances without altering hardware conditions.
However, it should be noted that the denoising and threshold determination in this method are based on the analysis of reference signals and background noise, which can be computationally intensive. Future work will therefore focus on incorporating deep learning techniques to reduce this computational load, while further optimizing the method to enhance its robustness in more complex environments and exploring its potential applications in other low-SNR scenarios.
5. Patents
The content of this paper has been filed for a patent, titled “A Method for Detecting Weak Return Signals Based on a Wavelet Transform Algorithm in the Pseudo-Time Domain”, with the patent number ZL202110940896.1.
Author Contributions
Methodology, K.W., K.Y. and B.B.; Validation, K.W.; Writing—original draft, K.W.; Writing—review editing, K.Y. and B.B.; Supervision, R.T. All authors have read and agreed to the published version of the manuscript.
Funding
This research was funded by National Natural Science Foundation of China (Grant No. 41974195, 41727804, 61861031).
Institutional Review Board Statement
Not appliable.
Informed Consent Statement
Not appliable.
Data Availability Statement
The original contributions presented in the study are included in the article. Further inquiries can be directed to the corresponding author.
Conflicts of Interest
The authors declare no conflicts of interest.
References
- Su, L.; Zhou, W. Weak Pulse Signal Detecting under Chaotic Noise with Wavelet Neural Network. In Proceedings of the 2021 2nd International Conference on Intelligent Computing and Human-Computer Interaction (ICHCI), Shenyang, China, 17–19 December 2021; pp. 309–313. [Google Scholar] [CrossRef]
- Li, C.; Yin, L.; Chen, D.; Tang, X. Threshold of Denoising Weak Electrical Signals in Plants from Daubechies Wavelet Transform. In Proceedings of the 2013 International Conference on Computer Sciences and Applications, San Francisco, CA, USA, 23–25 October 2013; pp. 600–603. [Google Scholar] [CrossRef]
- Tandra, R.; Sahai, A. SNR Walls for Signal Detection. IEEE J. Sel. Top. Signal Process. 2008, 2, 4–17. [Google Scholar] [CrossRef]
- Liu, S.; Sheng, W.; Wang, M.; Song, R. Study of Radar Weak Signal Detection Method Based on Duffing System. In Proceedings of the 2021 IEEE 5th Information Technology, Networking, Electronic and Automation Control Conference (ITNEC), Xi’an China, 15–17 October 2021; Volume 5, pp. 850–853. [Google Scholar] [CrossRef]
- Tondewad, P.S.; Dale, M.P. Denoising of SAR Images using Wavelet Transforms and Wiener Filter. In Proceedings of the 2023 International Conference on Emerging Smart Computing and Informatics (ESCI), Pune, India, 1–3 March 2023; pp. 1–5. [Google Scholar] [CrossRef]
- Jia, C.; Gao, M.; Dong, T. Research on bearing fault diagnosis by convolutional neural network based on wavelet time-frequency maps and parameter optimization. In Proceedings of the 2022 IEEE 4th International Conference on Civil Aviation Safety and Information Technology (ICCASIT), Dali, China, 12–14 October 2022; pp. 943–950. [Google Scholar] [CrossRef]
- Kumar, D.; Kumar, A.; Singh, R.; Sarwar, M. Detection of High Impedance Fault in Low Voltage Distribution System using Discrete Wavelet Transform. In Proceedings of the 2023 2nd International Conference for Innovation in Technology (INOCON), Bangalore, India, 3–5 March 2023; pp. 1–5. [Google Scholar] [CrossRef]
- Lin, T.T.; Li, Y.; Gao, X.; Wan, L. Random noise suppression of magnetic resonance sounding signal based on modified short-time Fourier transform. Acta Phys. Sin. 2021, 70, 163303. [Google Scholar] [CrossRef]
- Wei, C.; Chen, M.; Cheng, W.; Zhe, Z. Summary on weak signal detection methods based on Chaos theory. In Proceedings of the 2009 9th International Conference on Electronic Measurement & Instruments, Beijing, China, 16–19 August 2009; pp. 1-430–1-435. [Google Scholar] [CrossRef]
- Sun, J.; Ma, P.; Zheng, N.; Shi, J. Study on the Signal Detection Algorithm of Weak Laser Radar Target Based on Wavelet Transform. In Proceedings of the 2010 Third International Symposium on Information Processing, Qingdao, China, 15–17 October 2010; pp. 225–227. [Google Scholar] [CrossRef]
- Wei, C.Y.; Zhu, W.J. Weak Signal De-noising Method Based on Accumulation in Frequency Domain and Wavelet Transform. In Proceedings of the 2010 Third International Symposium on Information Processing, Qingdao, China, 15–17 October 2010; pp. 130–133. [Google Scholar] [CrossRef]
- Xiaozhi, F. An Inspecting Technology of Weak Sinusoidal Signal in Powerful Noise Based on Multi-layer Autocorrelation. In Proceedings of the 2013 International Conference on Mechanical and Automation Engineering, Jiujang, China, 21–23 July 2013; pp. 11–13. [Google Scholar] [CrossRef]
- Wang, X.; Ma, J.; Dong, X.; Zhong, T.; Dong, S. EFGW-UNet: A Deep-Learning-Based Approach for Weak Signal Recovery in Seismic Data. IEEE Trans. Geosci. Remote Sens. 2024, 62, 5914213. [Google Scholar] [CrossRef]
- Zhang, C.; Liu, Y. A Two-Step Denoising Strategy for Early-Stage Fault Diagnosis of Rolling Bearings. IEEE Trans. Instrum. Meas. 2020, 69, 6250–6261. [Google Scholar] [CrossRef]
- Michau, G.; Frusque, G.; Fink, O. Fully learnable deep wavelet transform for unsupervised monitoring of high-frequency time series. Proc. Natl. Acad. Sci. USA 2022, 119, e2106598119. [Google Scholar] [CrossRef] [PubMed]
- Chen, G.; Zhao, Y.; Mouthaan, K. Joint Spatial-Frequency Scattering Network for Unsupervised SAR Image Change Detection. IEEE Geosci. Remote Sens. Lett. 2025, 22, 1–5. [Google Scholar] [CrossRef]
- Abdelfattah, T.; Maher, A.; Youssef, A.; Driessen, P.F. Seamless Optimization of Wavelet Parameters for Denoising LFM Radar Signals: An AI-Based Approach. Remote Sens. 2024, 16, 4211. [Google Scholar] [CrossRef]
- Abdallah, A.; Billel, B.; Nail, A.; Abdelkerim, S. ECG Signal Denoising Based on Wavelet Transform and Genetic Algorithm. In Proceedings of the 2023 International Conference on Advances in Electronics, Control and Communication Systems (ICAECCS), Blida, Algeria, 6–7 March 2023; pp. 1–6. [Google Scholar] [CrossRef]
- Kalra, M.; Kumar, S.; Das, B. Seismic Signal Analysis Using Empirical Wavelet Transform for Moving Ground Target Detection and Classification. IEEE Sensors J. 2020, 20, 7886–7895. [Google Scholar] [CrossRef]
- Zhu, J.; Xie, Z.; Jiang, N.; Song, Y.; Han, S.; Liu, W.; Huang, X. Delay-Doppler Map Shaping through Oversampled Complementary Sets for High-Speed Target Detection. Remote Sens. 2024, 16, 2898. [Google Scholar] [CrossRef]
- Xu, Z.; Tang, B.; Ai, W.; Zhu, J. Relative Entropy Based Jamming Signal Design Against Radar Target Detection. IEEE Trans. Signal Process. 2025, 73, 1200–1215. [Google Scholar] [CrossRef]
- Yin, T.; Guo, W.; Zhu, J.; Wu, Y.; Zhang, B.; Zhou, Z. Underwater Broadband Target Detection by Filtering Scanning Azimuths Based on Features of Sub-band Peaks. IEEE Sens. J. 2025, 25, 13601–13609. [Google Scholar] [CrossRef]
- Zhu, J.; Yin, T.; Guo, W.; Zhang, B.; Zhou, Z. An underwater target azimuth trajectory enhancement approach in BTR. Appl. Acoust. 2025, 230, 110373. [Google Scholar] [CrossRef]
- Wang, D.; Peng, M.; Liu, L.; Xie, X.; Shi, Z.; Liang, Y.; Shen, J.; Wu, Q. Automatic GPR detection of grouting defects behind the tunnel shield segments based on wavelet coherence analysis combined with modified Res-RCNN. Case Stud. Constr. Mater. 2025, 22, e04245. [Google Scholar] [CrossRef]
- Shen, B.; Shi, X. A Novel Frequency Domain Narrowband Interference Suppression Algorithm Based on Noncoherent Accumulation. In Proceedings of the 2020 IEEE 3rd International Conference on Computer and Communication Engineering Technology (CCET), Beijing, China, 14–16 August 2020. [Google Scholar]
- Comminiello, D.; Scarpiniti, M.; Parisi, R.; Uncini, A. Frequency-domain Adaptive Filtering: From Real to Hypercomplex Signal Processing. In Proceedings of the ICASSP 2019—2019 IEEE International Conference on Acoustics, Speech and Signal Processing (ICASSP), Brighton, UK, 12–17 May 2019; pp. 7745–7749. [Google Scholar] [CrossRef]
- Ye, Z.; Mohamadian, H.; Ye, Y. Quantitative effects of discrete wavelet transforms and wavelet packets on aerial digital image denoising. In Proceedings of the 2009 6th International Conference on Electrical Engineering, Computing Science and Automatic Control (CCE), Selangor, Malaysia, 5–7 August 2009; pp. 1–5. [Google Scholar] [CrossRef]
- Zhang, Z.; Shimasue, K.; Toda, H.; Miyake, T. Achieving complex discrete wavelet transform by lifting scheme using Meyer wavelet. In Proceedings of the 2014 International Conference on Wavelet Analysis and Pattern Recognition, Lanzhou, China, 13–16 July 2014; pp. 170–175. [Google Scholar] [CrossRef]
- Liu, J.; Siew, W.; Soraghan, J.J.; Morris, E.A. A Novel Wavelet Selection Scheme for Partial Discharge Signal Detection under Low SNR Condition. In Proceedings of the 2018 IEEE Conference on Electrical Insulation and Dielectric Phenomena (CEIDP), Cancun, Mexico, 21–24 October 2018; pp. 498–501. [Google Scholar] [CrossRef]
- Liu, W.; Du, Y. An Improved ECG Denoising Algorithm Based on Wavelet-scale Correlation Coefficients. In Proceedings of the 2021 IEEE 15th International Conference on Anti-counterfeiting, Security, and Identification (ASID), Xiamen, China, 29–31 October 2021; pp. 53–56. [Google Scholar] [CrossRef]
- Zhuzhang, H.; Wang, J.; Hu, Y. Method for Detecting High Independence Grounding Fault Phase in Distribution Network Based on Wavelet Transform and Neural Network. In Proceedings of the 2022 4th International Conference on Electrical Engineering and Control Technologies (CEECT), Shanghai, China, 16–18 December 2022; pp. 224–229. [Google Scholar] [CrossRef]
- Immaculate Joy, S.; Venkatesh, C.; Bhargav, B. Improved EMD Algorithm for Electrocardiogram Denoising and Feature Extraction for Detection of Cardiovascular Disease. In Proceedings of the 2023 5th International Conference on Smart Systems and Inventive Technology (ICSSIT), Tirunelveli, India, 23–25 January 2023; pp. 135–139. [Google Scholar] [CrossRef]
Disclaimer/Publisher’s Note: The statements, opinions and data contained in all publications are solely those of the individual author(s) and contributor(s) and not of MDPI and/or the editor(s). MDPI and/or the editor(s) disclaim responsibility for any injury to people or property resulting from any ideas, methods, instructions or products referred to in the content. |
© 2025 by the authors. Licensee MDPI, Basel, Switzerland. This article is an open access article distributed under the terms and conditions of the Creative Commons Attribution (CC BY) license (https://creativecommons.org/licenses/by/4.0/).