Article

Feasibility Analysis of Industrial High-Temperature Heat Pumps in Greece

by
Evangelos Bellos
*,
Dimitra Gonidaki
,
Antonios Nazos
and
John K. Kaldellis
Department of Mechanical Engineering, School of Engineering, University of West Attica, 250 Thivon & Petrou Ralli, 12244 Athens, Greece
*
Author to whom correspondence should be addressed.
Appl. Sci. 2025, 15(9), 5171; https://doi.org/10.3390/app15095171
Submission received: 31 March 2025 / Revised: 30 April 2025 / Accepted: 5 May 2025 / Published: 6 May 2025
(This article belongs to the Section Applied Thermal Engineering)

Abstract

:
The high-temperature heat pump is a favorable technology for aiding the decarbonization of the industrial sector through its electrification. It can produce useful heat up to the range of 100 °C to 200 °C; however, additional steps are needed to develop reliable and highly efficient systems. The objective of this investigation is the systematic analysis of different operating cases of high-temperature heat pumps for industrial process heat production, from 100 °C up to 180 °C, exploiting waste heat from 50 °C to 100 °C. Moreover, the case of the ambient-source heat pump is studied for different process heat temperatures using an hourly-based analysis of the Greek climate conditions. The final results are evaluated based on energy, economic and environmental criteria to estimate the feasibility of industrial high-temperature heat pumps from a holistic perspective. The results indicate system sustainability for process heat temperatures up to 160 °C and for the scenarios with higher waste heat input temperatures. For the ambient-source high-temperature heat pump, the economically viable scenario was found only for the case of heat production at 100 °C due to the significant efficiency reduction at higher temperatures. Specifically, the COP was found to be up to 1.924 for the ambient-source heat pump and up to 3.285 for the waste heat source heat pump for a waste heat source at 75 °C. The levelized cost of heating was found to be in the range of 0.0562 to 0.0977 EUR/kWh for the ambient-source heat pump and in the range of 0.0377 to 0.0869 EUR/kWh for the waste heat source heat pump. Lastly, both waste heat- and ambient-source-driven heat pumps lead to CO2 emission reductions compared to the scenario based on a conventional natural gas boiler.

1. Introduction

High-temperature heat pumps (HTHP) are promising solutions for producing process heat at temperatures over 100 °C and they can be exploited in the industrial sector. The existing available systems can operate up to 150 °C [1,2], while achieving 200 °C is expected to be feasible in the near future [3,4,5]. HTHPs can exploit low-grade waste heat streams (WHS) from various industrial processes [6], or they can be driven by ambient heat sources. These systems can substitute conventional furnaces and boilers, leading to a significant reduction in CO2 emissions and also offering reduced operational costs due to their high efficiency [6]. Therefore, HTHPs constitute a sustainable solution for decarbonizing industrial processes and transitioning towards a cleaner energy future. Furthermore, they are also suitable for district heating applications [7,8]. Numerous industries can exploit HTHPs, including the petrochemical and general chemical industries, paper and pulp industry, plastics and rubber industries and textile industry.
However, HTHPs face some challenges which affect their further adoption. Firstly, there is a need to develop commercial and efficient systems capable of operating at higher temperatures up to 200 °C or more [9]. In this direction, the selection of appropriate working fluids that are both environmentally friendly and present high performance is required [6]. Moreover, advanced materials and cycle configurations have to be examined for technological objects to overcome current limitations [10]. Lastly, the economic feasibility of HTHPs depends on regulatory frameworks, electricity/gas prices and various other general parameters that vary among different countries [11].
Aiming to develop HTHPs for industrial decarbonization through electrification, significant research has been undertaken in the last few years. In the case of ultra-low waste heat streams, the use of cascade HTHPs has been suggested as a suitable solution, according to Dong and Wang [12]. Specifically, they studied various working fluids, and they identified R1234ze, R1224yd(Z), R1233zd(E) and R1336mzz(Z) as the most suitable options. Also, they stated that the cascade configuration is preferable when there is a temperature lift over 70 K. The use of transcritical HTHPs is a promising choice for heat production at high temperatures. Kong et al. [13] studied a transcritical HTHP with CO2 as the working fluid and they achieved a coefficient of performance (COP) of 2.22 at 200 °C hot air production. The incorporation of ejector devices in transcritical HTHPs has been studied by Dai et al. [14]. In addition to the ejector devices, they also used two evaporators and this configuration was concluded to outperform the simpler cycles. Another idea is a hybrid system that combines mechanical compression and an absorption heat pump to achieve high temperatures. Sun et al. [15] studied this concept and they concluded that this unit can process heat production up to 200 °C, with compression rates playing a critical role in the unit’s performance.
The application of zeotropic mixtures as working fluids in HTHPs is another very promising solution. This idea aims to exploit the glide of the mixtures during the phase change, aiming to enhance the heat transfer conditions in the heat exchangers and to minimize the exergy destruction. In this direction, Spale et al. [5] found that the application of cyclopentane/R1336mzz(Z) mixture is a suitable choice for HTHPs that produce process heat up to 200 °C. In another study, Thu et al. [1] suggested the mixture HFC32/HFO1234yf for HTHPs that produce heat up to 150 °C. The HTHP using this mixture presented a 14% higher performance compared to that operating with pure working fluids. Other interesting ideas regarding HTHPs are associated with the exploitation of the electricity surplus from the grid to upgrade heat and store it in thermal tanks for use by industry when needed [16]. The optimization of such systems can lead to a 17% decrease in the operational cost and also to a 15% reduction in CO2 emissions [16]. Last but not least, it is valuable to refer to the idea of using an HTHP based on the reverse-Brayton cycle to produce heating at high temperatures. Zuhlsdorf et al. [17] investigated a reverse-Brayton cycle HTHP with CO2 as the working fluid for process heat production up to 280 °C, giving a solution for operation in temperatures over 200 °C. Moreover, a reverse-Brayton cycle HTHP can be hybridized with solar thermal collectors, as Tzouganakis et al. [18] studied for a paper mill in Greece with process heat production at 195 °C. This idea can also be integrated with heating and a cold accumulator for integrating storage in the system [6].
The goal of this work is the systematic evaluation of different HTHPs for industrial applications in the temperature range from 100 °C to 180 °C. This range is suitable for several industries like dairy, the metal industry, food industry, paper industry, etc. Moreover, the upper limit is reasonable considering the new trends in the design of HTHPs. Detailed thermodynamic analyses of different cases are carried out with a developed model in Engineering Equation Solver [19]. Different scenarios of waste heat upgrading are studied systematically, and a case study on the use of an ambient-source heat pump is examined. The importance of this investigation lies in the comprehensive investigation of different scenarios in energy, economic and environmental terms. The comparison of the two designs, with waste heat and ambient-source exploitation, is very important as it aims to show performance enhancement by utilizing possible waste heat streams in industry. This work provides a multicriteria analysis of the studied technology by examining different driving sources. The analysis is conducted for the city of Athens in Greece, and an hourly-based dynamic analysis is performed for the case of the ambient-source heat pump. The final conclusions of the present analysis could be used in the evaluation of HTHPs for various industrial processes, as well as for different scenarios involving waste heat upgrading and ambient-source designs.

2. Materials and Methods

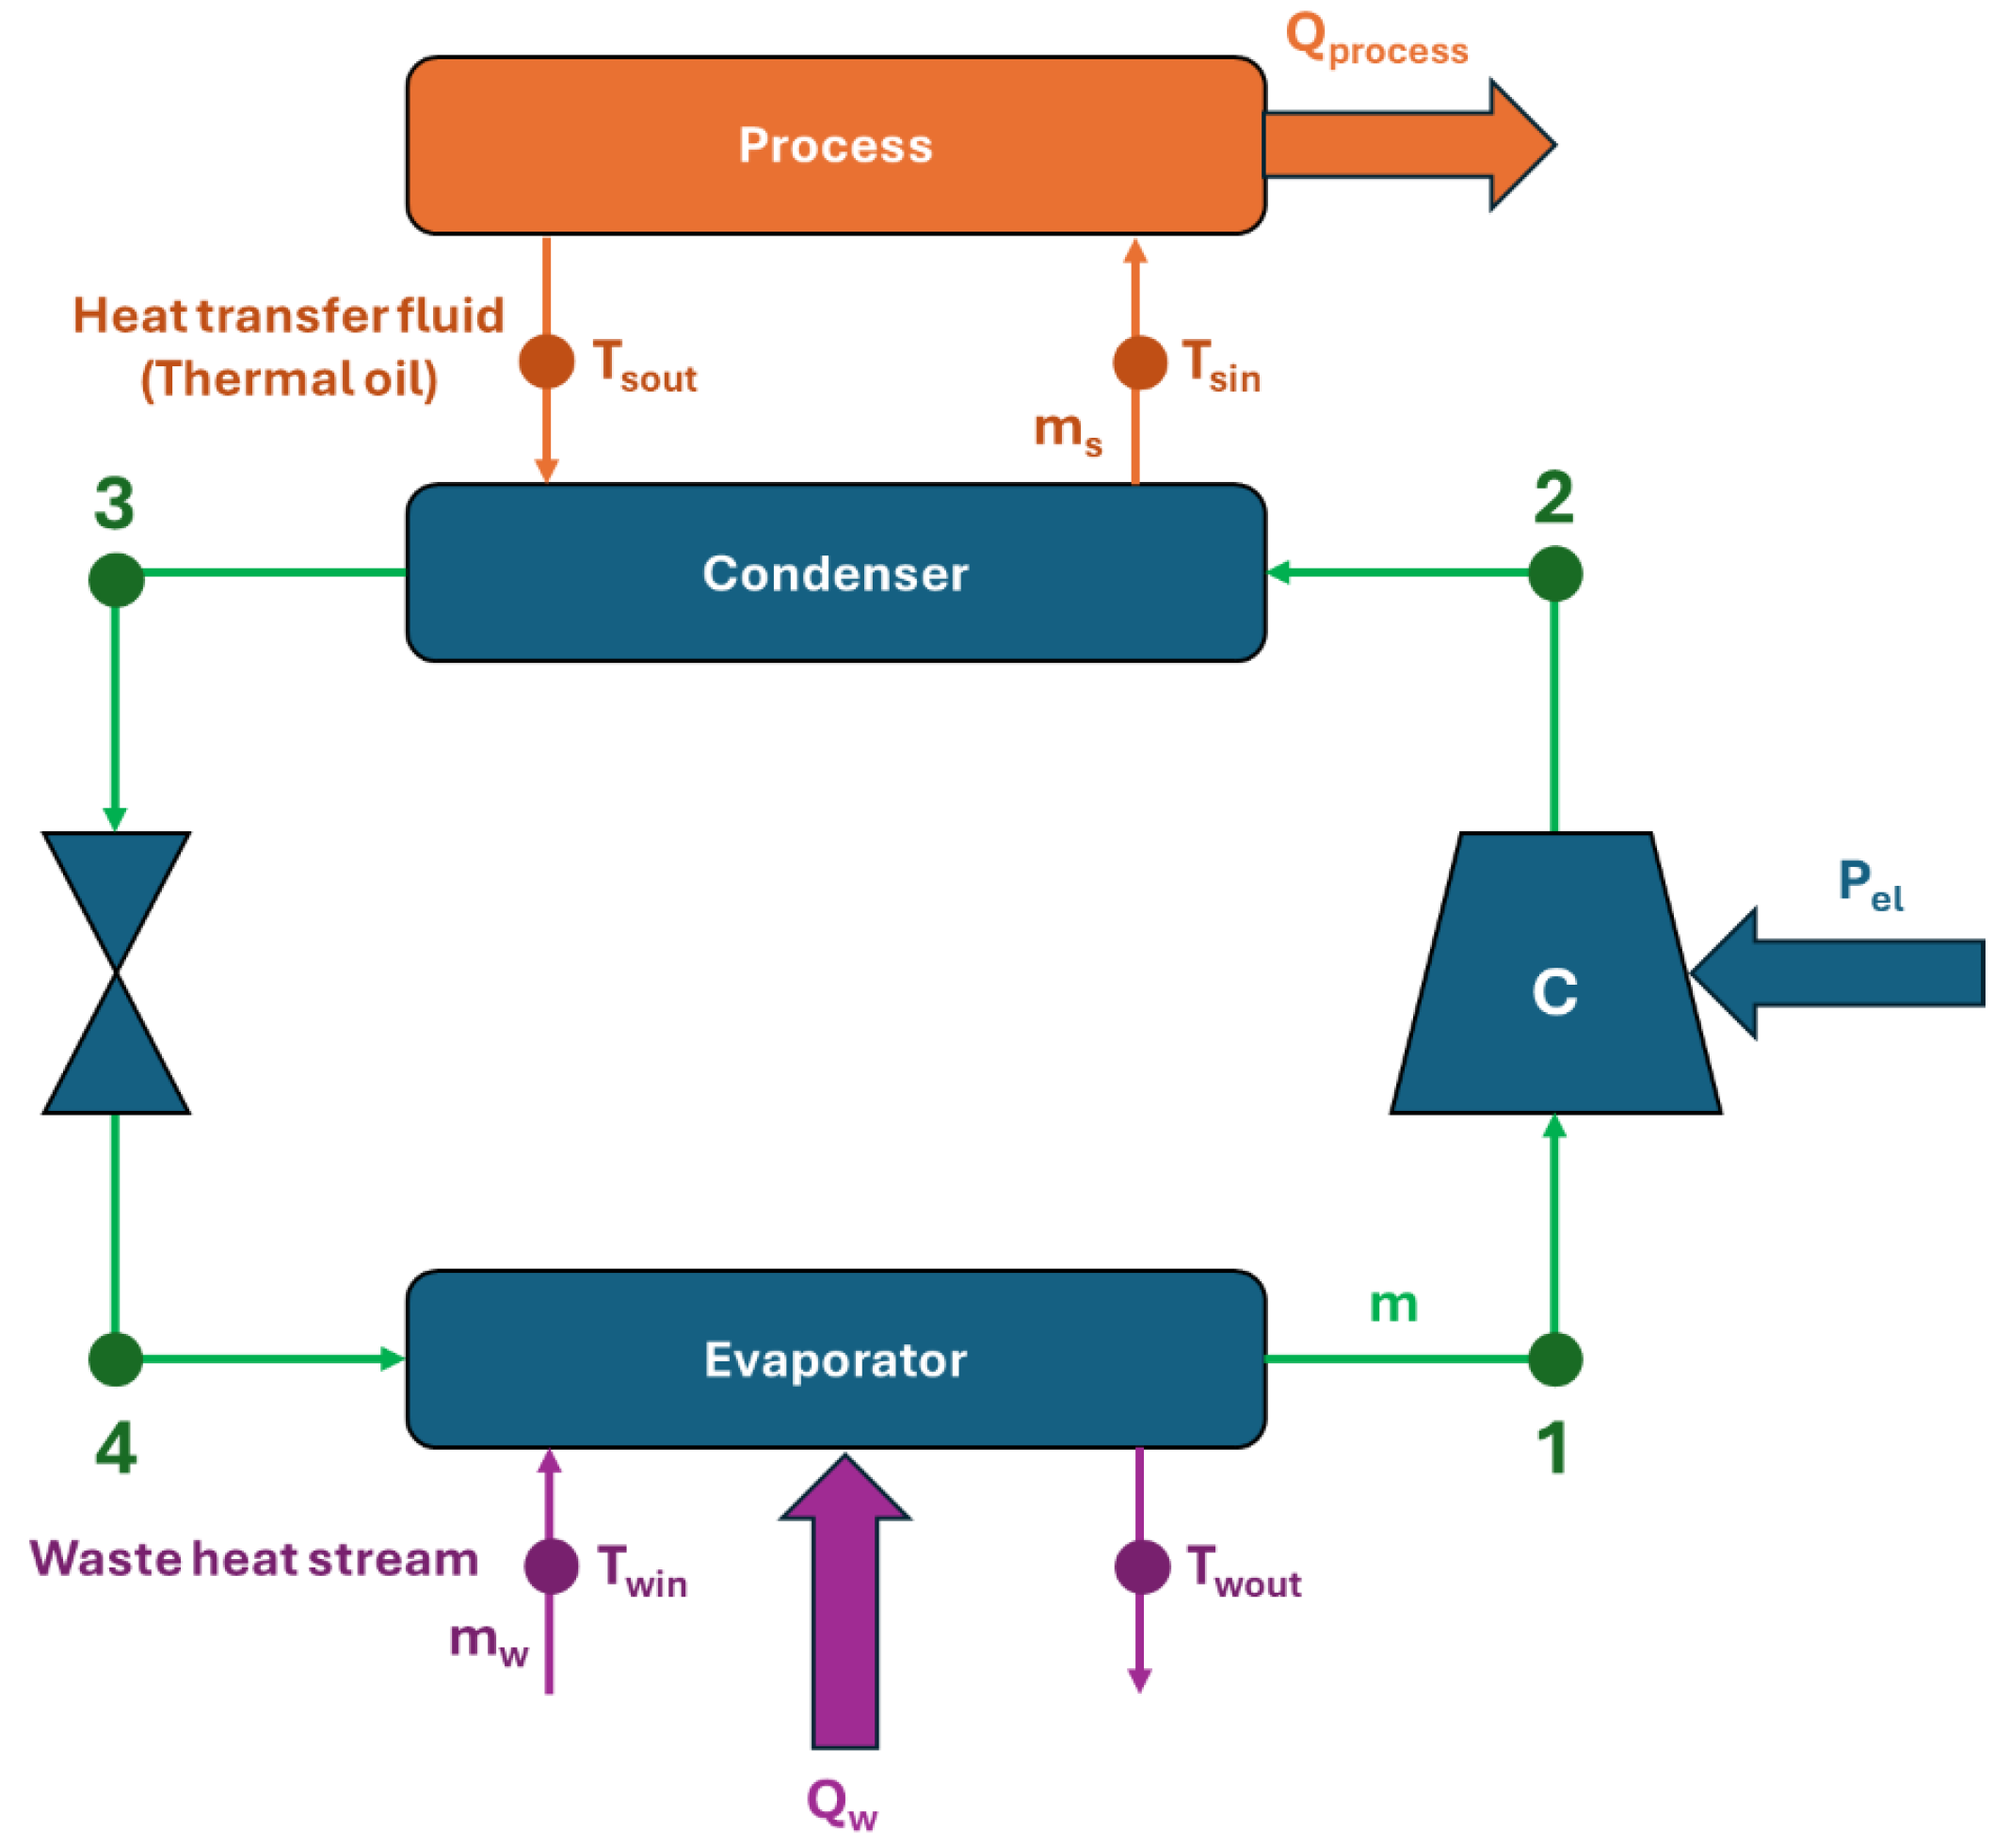
2.1. Description of the System

The examined HTHP is illustrated in Figure 1. This heat pump produces useful heat in the range of 100 °C to 180 °C which is given at a constant temperature. Specifically, the evaporator receives the heat input in the system (process 4 → 1); the compressor consumes electricity to pressurize the working fluid (process 1 → 2); the condenser produces the useful heat (process 2 → 3); and the throttling valve reduces the pressure (process 3 → 4). It is important to note that the heat is transferred with thermal oil from the condenser to the process heat. The selected thermal oil is Therminol VP-1 [20]. The examined capacity values of the heat pump range from 100 kW to 500 kW, with the nominal value being at 300 kW. The HTHP is fed by a waste heat stream of 10 kg/s mass flow rate, which is typical of flue gases, with a temperature level in the range of 50 °C to 100 °C. Additionally, the scenario of an ambient-source heat pump is studied. The pinch point in the heat exchangers is set to 5 K [21] in all cases, and the thermal oil temperature difference is 5 K. The heat exchangers in the evaporator and the condenser are assumed to be plate heat exchangers, which are commonly used for this application. The working fluid is selected to be cyclopentane (critical temperature of 238.6 °C, critical pressure of 45.71 bar), which is a typical choice for operation in HTHPs [22,23,24].

2.2. Mathematical Background

2.2.1. Heat Pump Modeling

The heat input (Qevap) in the evaporator is calculated as follows:
Q e v a p = m · h 1 h 4
where the working fluid mass flow rate is symbolized with (m) and the specific enthalpy of every state point with (h).
The heat production from the condenser (Qcond) is expressed as follows:
Q c o n d = m · h 2 h 3
It is worth stating that zero superheating in the evaporator exit and zero subcooling in the condenser exit were considered in this analysis.
The work demand in the compressor (Wcom) is calculated as follows:
W c o m = m · h 2 h 1
The compressor’s isentropic efficiency (ηis) is given below:
η i s = h 2 i s h 1 h 2 h 1
The state point (2is) has the high-pressure of the cycle and the same specific entropy as the state point (1). In this work, the isentropic efficiency was selected to be 70% [11].
The motor efficiency, including the mechanical losses of the shaft, is assumed to be 90%, which is a reasonable value, and the electricity consumption (Pel) is calculated as follows:
P e l = W c o m η m o t o r
The specific enthalpy of the fluid is the same in the inlet and the outlet of the valve because the process is assumed to be ideal:
h 4 = h 3

2.2.2. Heat Transfer Modeling and Index Definitions

The heat input in the evaporator (Qevap) from the WHS (Qw) can be expressed as follows:
Q w = Q e v a p = m w · c p , w · T w i n T w o u t
The mass flow rate of the WHS (mw) is assumed to be 10 kg/s, and the specific heat capacity at cp,w = 1.1 kJ/kgK [21].
The pinch point (PP) in the evaporator is set at 5 K, and the respective expression can be written as follows:
T w o u t = T e v a p + P P
The maximum heat input that the waste heat stream (Qw,max) can transfer to the system is estimated, assuming that it leaves the evaporator with a temperature equal to the ambient temperature:
Q w , m a x = m w · c p , w · T w i n T a m
The exergy input from the WHS (Exin) is given as follows:
E x i n = m w · c p , w · T w i n T a m m w · c p , w · T a m · ln T w i n T a m
Kelvin units have to be used in the previous expression.
In the case of the ambient source, the same equations are valid but for Twin = Tam. Moreover, in this case, it is assumed that the ambient air leaves the evaporator 5 K colder than at the inlet. Therefore, by keeping the pinch point at 5 K, the difference between the ambient air and the evaporator temperature is 10 K in the analysis. Moreover, the mass flow rate of the ambient air is variable among the different studied cases to satisfy the energy balance.
The heat rejection from the condenser (Qcond) to the thermal oil (Qprocess) is written as below:
Q p r o c e s s = Q c o n d = m s · c p , s · T s i n T s o u t
The specific heat capacity of the thermal oil is approximately c p , s 1.9 k J / k g K for the studied temperatures [20].
The thermal oil is assumed to have a temperature difference of 5 K between its inlet and outlet, specifically:
Δ T s = T s i n T s o u t = 5 K
The pinch point in the condenser is set at 5 K and the respective expression can be written as shown below:
T s i n = T c o n d P P
The pinch point in the process device is set at 5 K and the respective expression can be written as follows:
T s o u t = T p r o c e s s + P P
Moreover, it is important to state that (Qprocess) and (Tprocess) are inputs in the present modeling.
The exergy production of the system (Expr) is calculated as below:
E x p r = Q p r o c e s s · 1 T a m T p r o c e s s
Kelvin units have to be used in the previous expression.
The system COP is defined as follows:
C O P = Q p r o c e s s P e l
The life cycle cost (LCC) of every scenario is calculated below using the initial capital cost (CC), the yearly net cash flow (NCF), the discount factor (r) and the project lifetime (N):
L C C = C C + i = 1 N N C F 1 + r i
The levelized cost of energy (LCOE) regards the process heat energy and is calculated as follows:
L C O E = L C C N · E h e a t
The parameter (Eheat) is the yearly process heat production, which is estimated for operation at 8760 h.

2.3. Followed Methodology

This analysis is performed with a developed thermodynamic model which has been implemented in the Engineering Equation Solver [19]. The model includes the equations described in Section 2.2. The used tool solves all the non-linear equations together through iterations. Table 1 summarizes the input parameters of this work, while Table 2 presents the range of the parameters that are investigated parametrically in this analysis. For the capacity of the process heat, the nominal value is selected at 300 kW. For the case of the ambient source, an hourly-based model was considered to account for the yearly variation in the environmental temperature. The weather data of Athens in Greece (latitude 38°, longitude 23.7°) were considered, and they were retrieved from Ref. [25]. Figure 2 depicts the ambient temperature variation for Athens.
The system examined was compared to a conventional natural gas boiler (baseline scenario), aiming to determine economic and environmental benefits. The total boiler efficiency was set at 70% [26], the natural gas cost at 0.06 EUR/kWhth [27] and the CO2 specific emissions factor at 0.196 kgCO2/kWh [28]. The specific cost of the HTHP was set at 300 EUR/kWh [2], and the electricity cost at 0.15 EUR/kWh (a reasonable value for the Greek market [29,30]). The yearly maintenance cost of a HTHP was considered to be 2% of the capital cost, and the same value in Euros was selected as the maintenance cost in the boiler scenario. The specific CO2 emissions factor for the electricity was set at 0.252 kgCO2/kWh for Greece [31]. The economic analysis was conducted for a lifetime period of N = 25 years and for a discount factor of r = 3%. The life cycle costs of the unit with HTHP and with the boiler were calculated using the present methodology of Ref. [32], considering that the process heat is produced for 8760 h per year. Table 3 summarizes the aforementioned data.
Finally, it should be stated that the present thermodynamic model of the HTHP was developed based on fundamental energy balance equations. The validation of this study relies on the authors’ previous study [22,32], which also involves high-temperature heat pumps. In particular, the study [22] includes validation evidence derived from the existing literature [24].

3. Results and Discussion

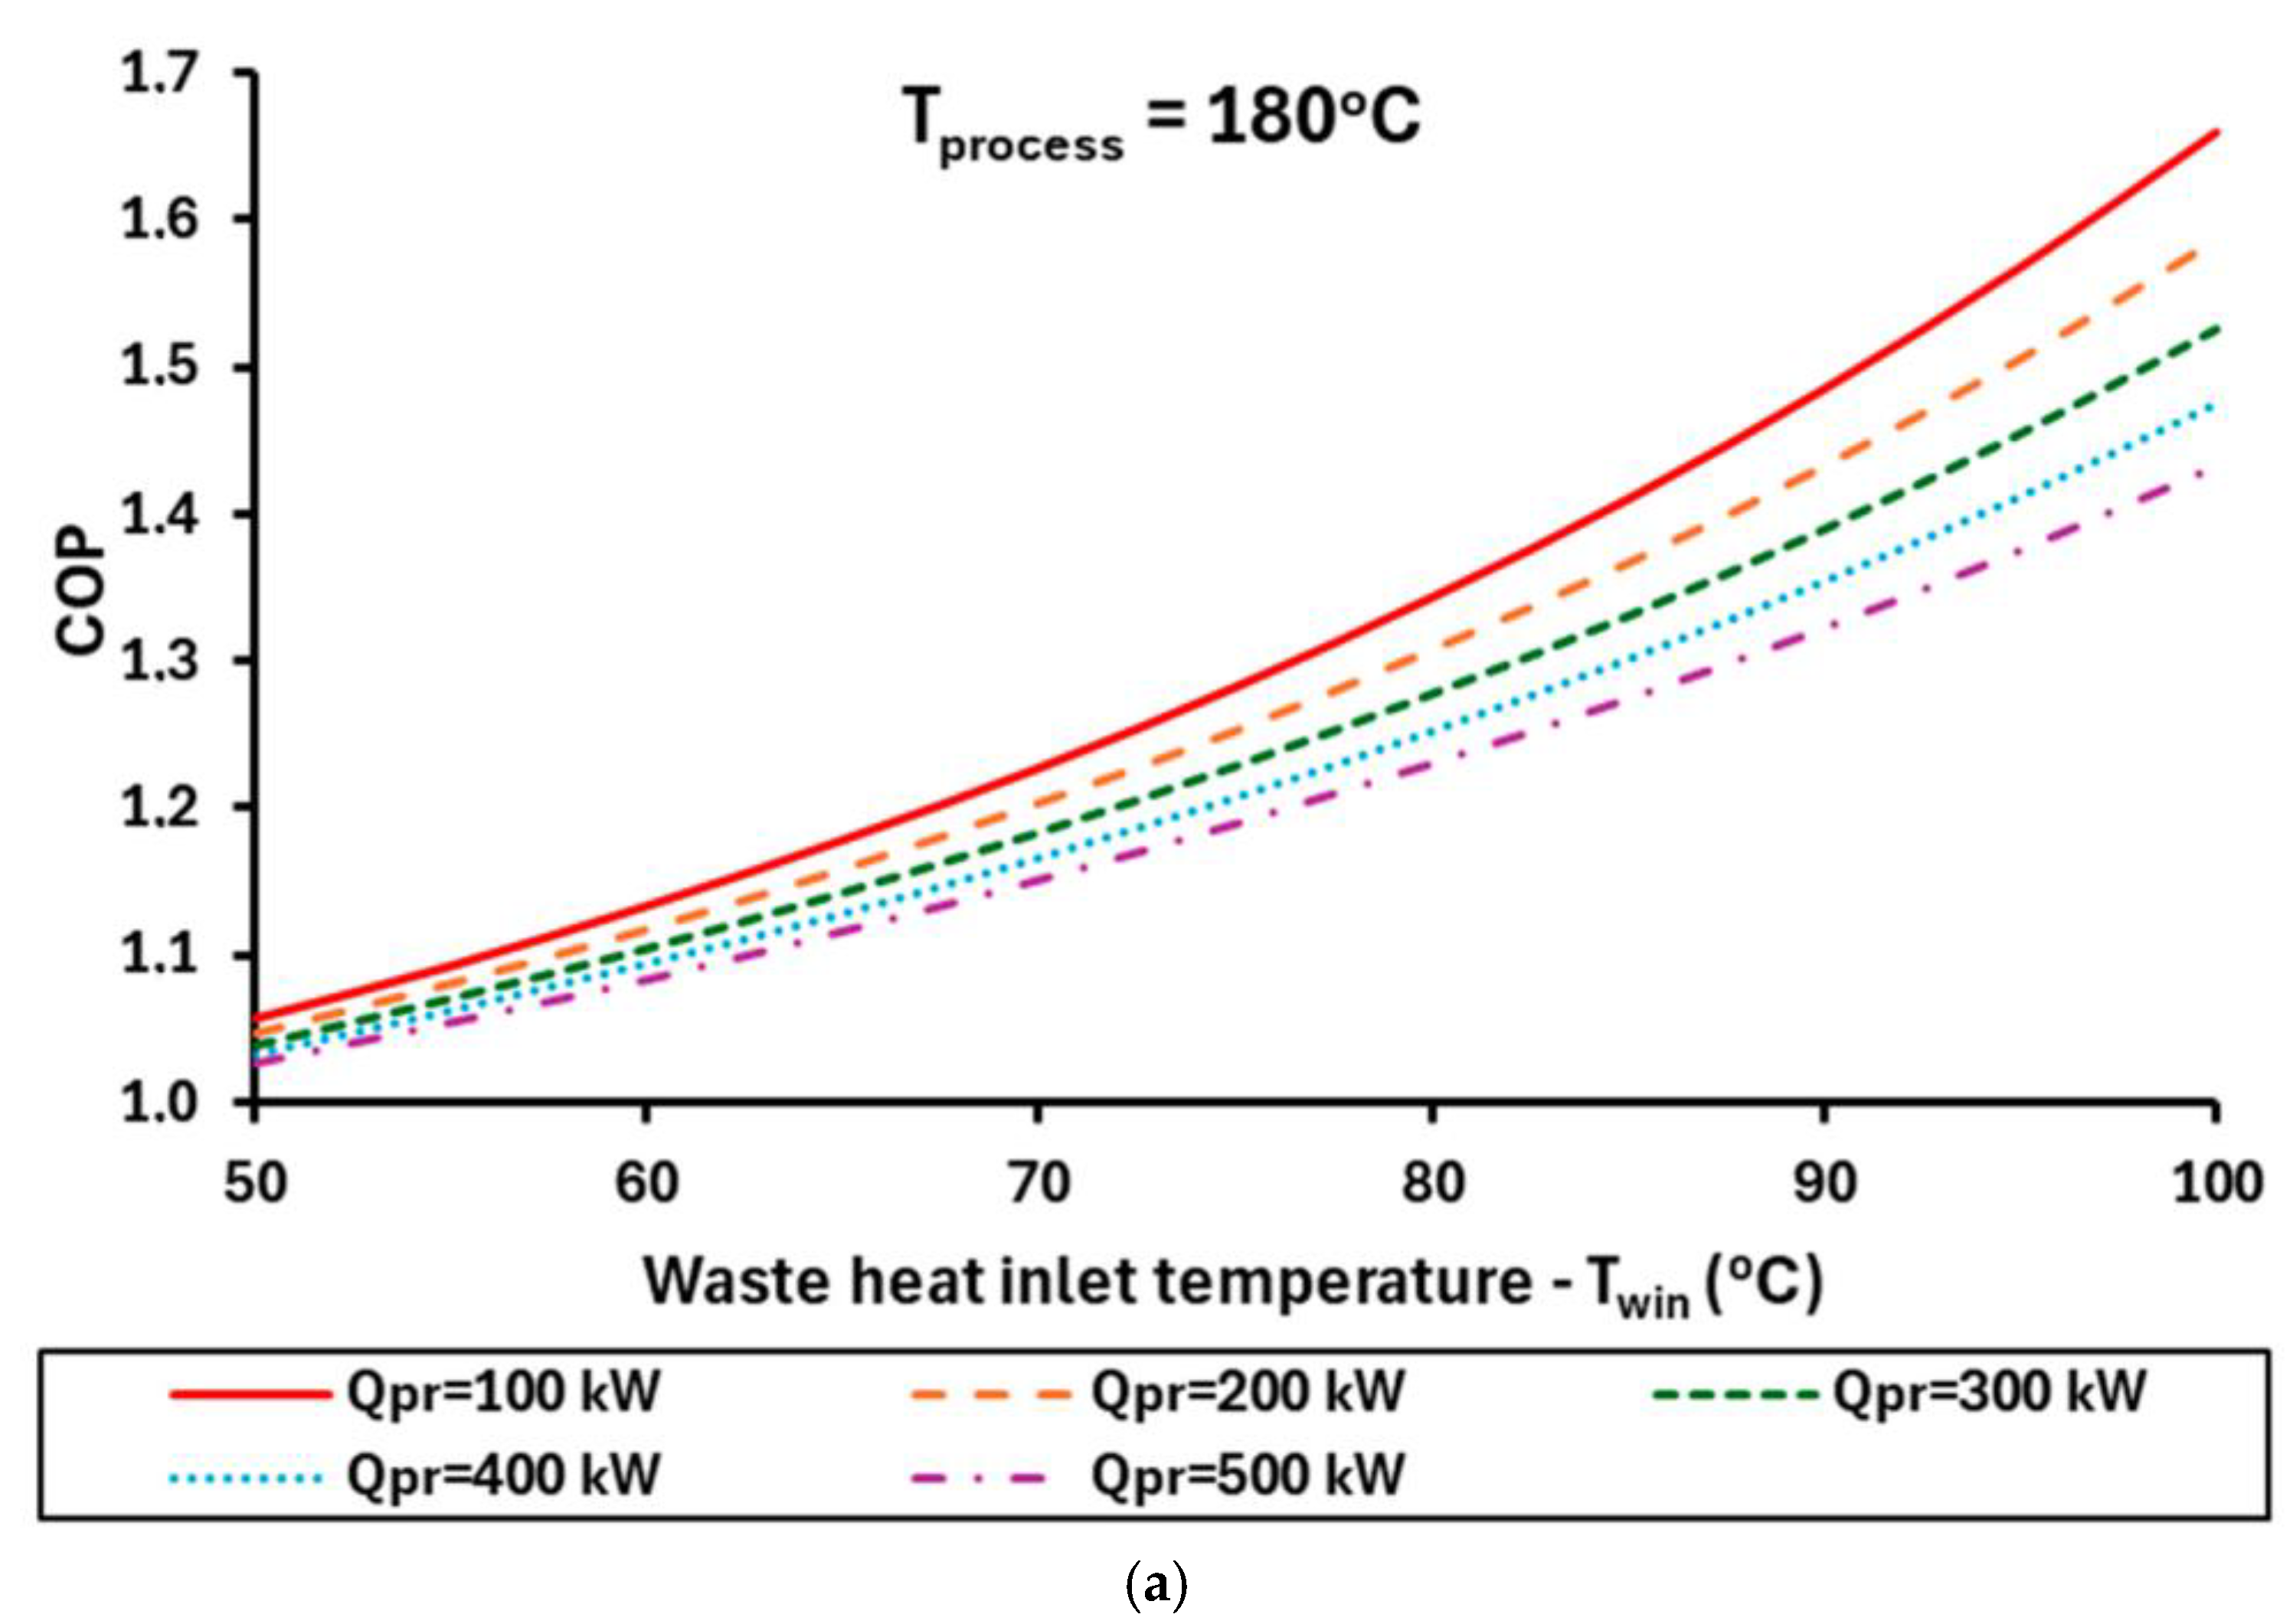
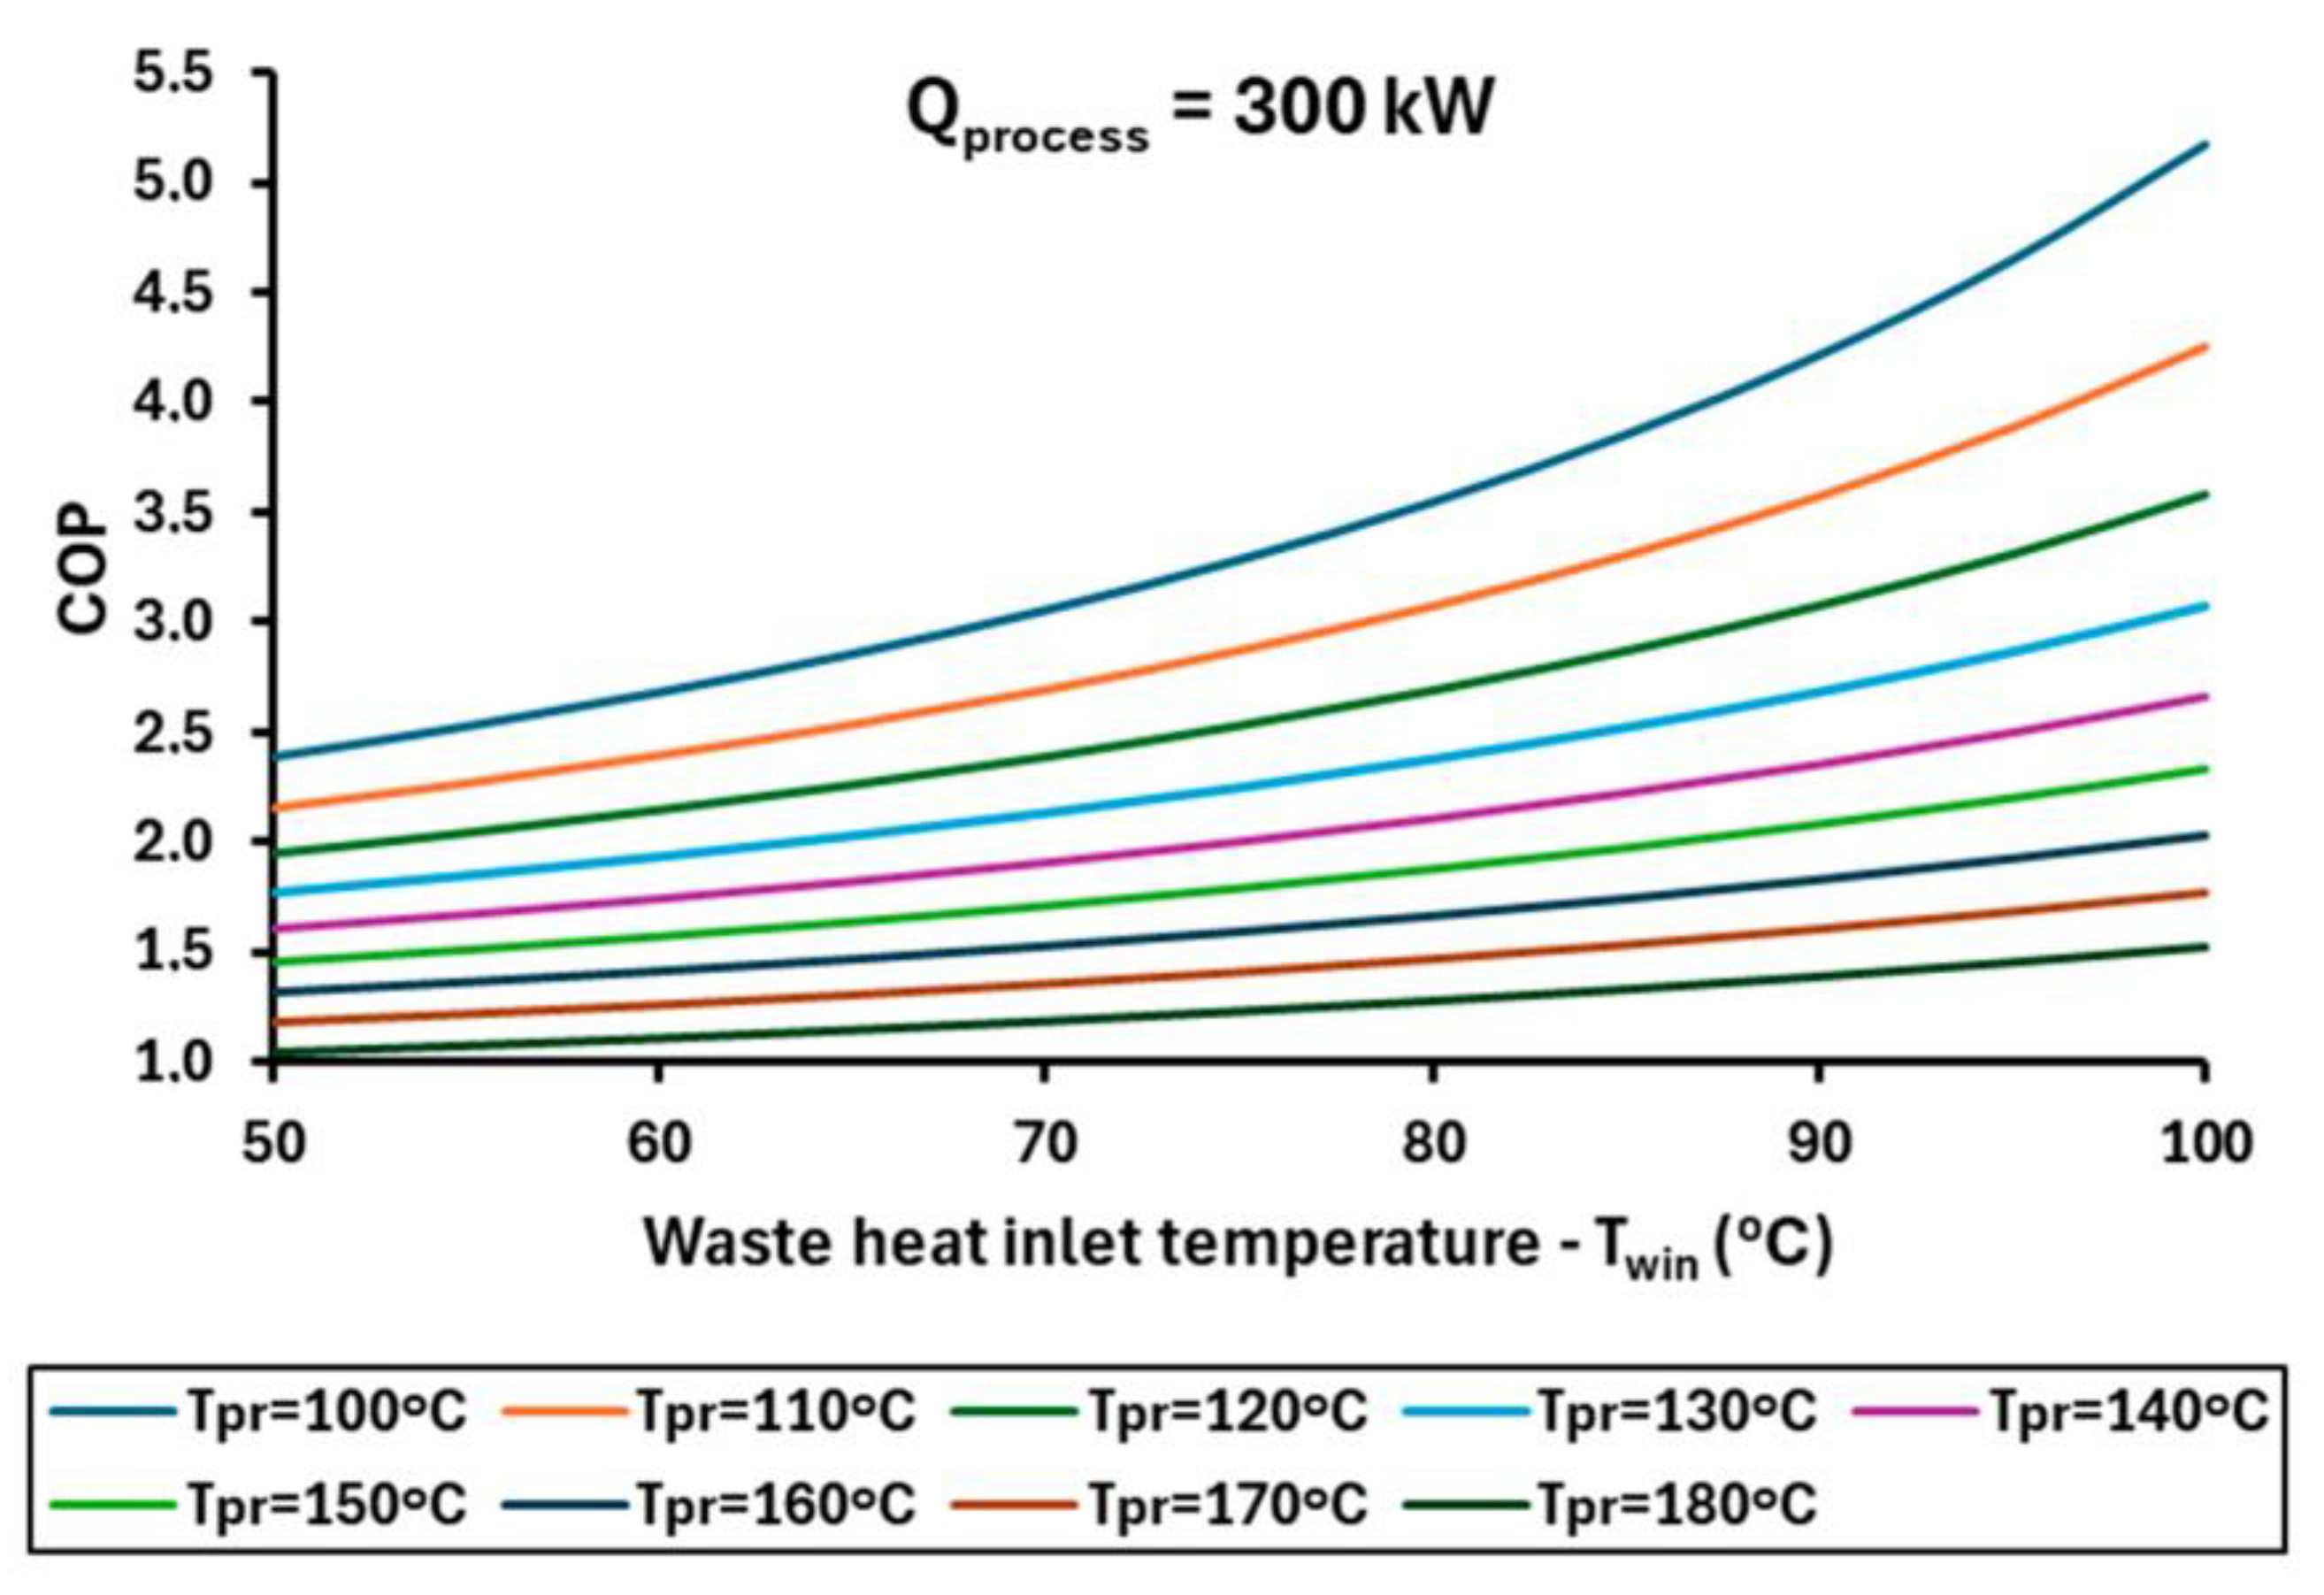
3.1. Parametric Analysis of the Waste Heat Source-Driven System

The parametric investigation of the WHS-driven HTHP is presented in this section and also useful relative results are included in tables in Appendix A. The influence of the WHS temperature and the process heat capacity are studied, as well as the process heat temperature level. Figure 3, Figure 4 and Figure 5 show the impact of the WHS temperature on the COP (Figure 3a, Figure 4a, Figure 5a) and on the exergy efficiency (subfigures (Figure 3b, Figure 4b, Figure 5b). In these figures, different curves correspond to different process heat capacities, specifically to 100, 200, 300, 400 and 500 kW. The process heat temperature is 100 °C in Figure 3, 140 °C in Figure 4, and 180 °C in Figure 5.
The results of these figures indicate that increases in the WHS temperature lead to higher COP values as the heat pump is supplied with a higher exergy input. Conversely, increases in the process heat temperature lead to smaller COP values because there is greater difficulty in producing useful heat at higher temperatures. Additionally, an increase in the process heat capacity leads to a decrease in COP, which is a reasonable outcome, since higher heat production requires HTHP to operate in more difficult conditions, and therefore, the performance is reduced. The mass flow rate of the WHS is the same in all cases. This assumption limits HTHP’s ability to produce higher heating product, leading to a lower COP. Practically, in cases of higher capacity, the WHS must be cooled further, which lowers the evaporation temperature and consequently reduces the COP. For the nominal capacity of 300 kW, the COP ranges from 2.388 to 5.175 for Tprocess = 100 °C, while for Tprocess = 140 °C, it ranges from 1.607 to 2.669, and for Tprocess = 180 °C, it ranges from 1.039 to 1.526. These results indicate that there is a significant reduction in the COP as the process temperature increases. Also, for the case with Tprocess = 180 °C, a high WHS temperature is required to achieve an acceptable COP.
Regarding the exergy efficiency, the curves are close to each other for the different capacities, while only the curve of 100 kW corresponds to significantly lower exergy efficiency, specifically for high WHS temperatures. Moreover, for the process heat temperatures of 100 °C and 140 °C, the efficiency curves are close to 45%, while for 180 °C, they drop down to 35%. These results indicate that the system can efficiently exploit the WHS and convert it into process heat; however, in high-temperature applications, HTHPs become less favorable due to reduced exergy efficiency. Furthermore, for the majority of the exergetic efficiency curves, the exergy efficiency is maximized for an intermediate WHS temperature. This is a reasonable result because while the WHS increases, there is higher exergy input and the system behaves more efficiently, but after a limit, there is no need for hotter WHS, and thus, the exergy efficiency is reduced.
For the nominal capacity of 300 kW, the exergy efficiency ranges from 41.00% to 45.65% for Tprocess = 100 °C, and the maximum value is obtained for a WHS temperature of 65 °C. For Tprocess = 140 °C, the exergy efficiency varies from 41.44% to 43.72%, and the maximum value is reached for a WHS temperature of 70 °C. For Tprocess = 180 °C, the exergy efficiency takes values from 34.25% to 36.14%, and the maximum value occurs at a WHS temperature of 90 °C.
Moreover, specific figures for the nominal capacity of 300 kW are provided. Figure 6 shows the COP and Figure 7 the exergy efficiency. As expected, the COP is higher at lower process heat temperatures and higher WHS temperatures. On the other hand, the exergy performance is maximized for a process heat production of 110 °C and a WHS temperature of 70 °C, reaching a value of 45.76%. Minor differences in the cases of 100 °C and 120 °C process heat temperature were obtained in terms of exergy efficiency. Practically, when the process heat temperature increases, the COP reduces while the exergy factor of the process heat increases. Exergy efficiency is associated with these two quantities, and their opposing trends result in the exergy efficiency being maximized at an intermediate process heat temperature. In other words, although the high process heat temperature is associated with higher exergetic output, the lower COP in these cases reduces the amount of process heat produced. This makes scenarios with high process heat temperatures less favorable in terms of exergy performance.
Lastly, for the benchmark scenario of Qprocess = 300 kW, the COP was approximated with a polynomial formula as below:
C O P = 4.840721 0.00177 · T p r o c e s s 0.0559 · Δ T l i f t + 0.000237 · Δ T l i f t 2
where the temperature lift in this scenario is defined as Δ T l i f t = T p r o c e s s T w i n . The regression is significant with R2 = 98.75%, while the mean COP deviation is 3.40%. Figure 8 shows that the obtained COP values with the regression model are very close to those initially calculated with the numerical model.

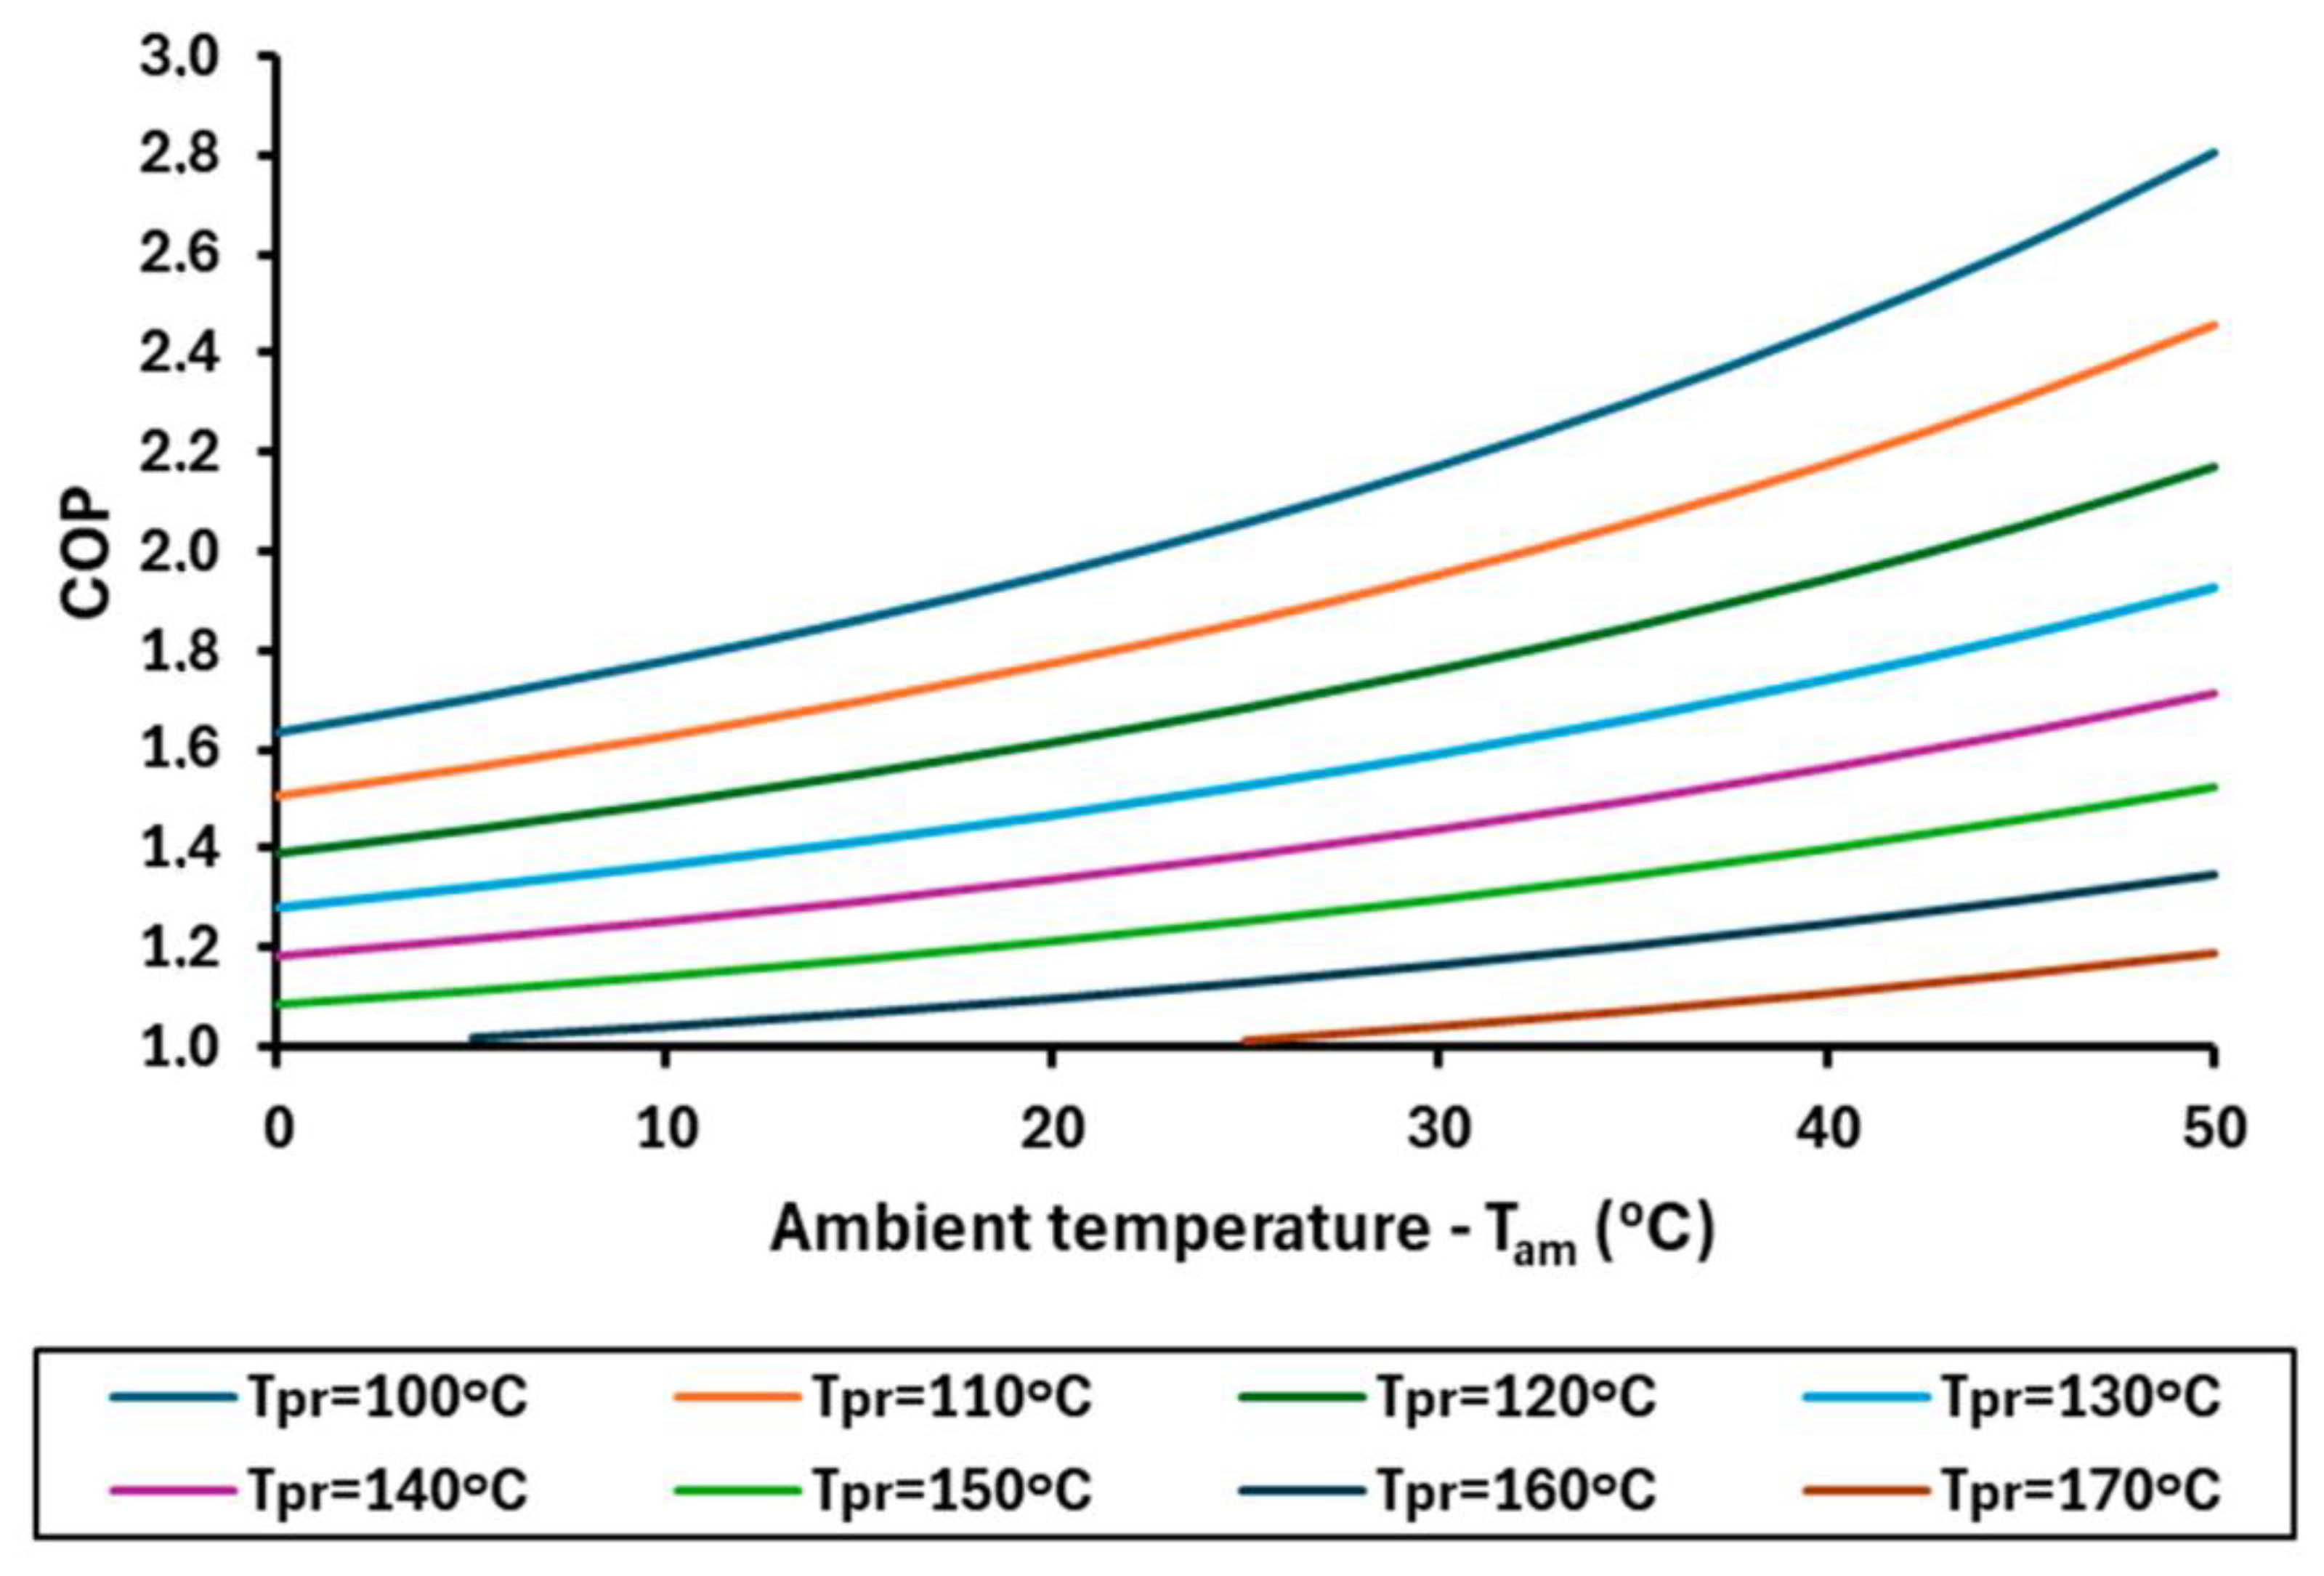
3.2. Parametric Analysis of the Ambient-Source-Driven Unit

This section discusses the application of the ambient-source HTHP. The present modeling makes the system to have the same performance for all the capacities because the ambient air source mass flow rate is variable. The fluctuation in ambient temperature causes the evaporator temperature to vary accordingly, with a steady temperature difference of 10 K between them. Figure 9 illustrates the variation in COP, and Figure 10 shows the exergy efficiency for different ambient temperatures and process heat temperatures. At high process temperatures (≥160 °C), the system cannot operate at low ambient temperatures, while for 180 °C process heat, the operation is impossible. Practically, in cases with an extremely high-temperature lift, the compressor cannot operate efficiently and there is a huge need for electricity consumption. Therefore, the operation of the system is not sustainable with COP values being lower than 1. Specifically, operation with a high-temperature lift results in high entropy generation and high superheating in the compressor exit, factors that make this design inefficient thermodynamically.
Generally, increases in the ambient temperature make the heat upgrade easier (from ambient temperature level to the process heat temperature level), resulting in increases in COP, as Figure 9 indicates. For the typical ambient temperature of 25 °C, the maximum COP was found at 2.058 for 100 °C process heat production, while the minimum value was 1.011 for 170 °C process heat production. Practically, at high process heat temperatures, the HTHP cannot operate properly, and it is not suggested as a suitable technological solution with the ambient source as the driving source. It is important to note that the COP values for the ambient source are lower compared to the case with the WHS driving. This is expected, as the WHS provides additional exergy input to the system, whereas the ambient source does not add extra exergy to the system.
Regarding the exergy efficiency that is depicted in Figure 10, the rise in the ambient-source temperature leads to lower exergy efficiency. Practically the higher ambient temperature level makes the process heat production less valuable, a critical fact that reduces the exergetic performance. For ambient temperatures up to 30 °C, the highest exergy efficiency is found for process heat production at 100 °C, while for higher ambient temperatures, the process heat production at 110 °C is the optimal case in terms of exergy efficiency.
The next step is the development of a regression model for the estimation of the ambient-source HTHP performance in different operating conditions. Therefore, for all the process heat capacities with the ambient-source heat pump, the COP was approximated with the polynomial formula below:
C O P = 4.647367 0.00281 · T p r o c e s s 0.03934 · Δ T l i f t + 0.000123 · Δ Δ l i f t 2
where the temperature lift in this scenario is defined as Δ T l i f t = T p r o c e s s T a m . The regression is significant with R2 = 99.57%, while the mean COP deviation is 1.39%. Figure 11 indicates that the obtained COP values with the regression model are very close to those initially calculated with the numerical model.
The next step is the hourly-based investigation of the air-source HTHP for the city of Athens in Greece. Figure 12 shows results for the COP for the year when the process heat production is 100, 120, 140 and 160 °C. It is crystal clear that the variation in the ambient temperature makes the unit behave differently during the year. The rise in the environmental temperature during the summer led to significant increases in the system’s COP during summer. On the other hand, the COP reaches lower values during the colder period of winter.
Lastly, Figure 13 and Figure 14 depict the yearly COP and exergy efficiency, respectively, for different process heat temperatures, from 100 °C up to 160 °C. The yearly production of process heat at higher temperatures was found to be infeasible with the ambient-source HTHP. The annual results indicate that the increase in the process heat temperatures reduces both energy and exergy performance. More specifically, the COP ranges from 1.090 to 1.924 and the exergy efficiency ranges from 35.62% to 42.04%. These findings are in accordance with the previous parametric investigation. Generally, it can be concluded that the ambient-source HTHP is not an efficient solution for process heat at high process heat temperatures.

3.3. Sustainability Analysis

The last part of the present investigation is devoted to the economic and environmental assessment of HTHPs. The results are compared with a baseline scenario of producing the process heat demand with a natural gas boiler. Comparative studies are carried out for the case of 300 kW process heat production. Three-dimensional plots are included in the present work with the aim of presenting the results briefly. Firstly, the COP is depicted in Figure 15 for different combinations of process heat temperature and WHS temperatures. It is clear that the COP takes higher values as the WHS temperature increases and the process heat temperature decreases, as stated in the previous subsections.
Figure 16 illustrates the life cycle cost (LCC) of the unit for the different design scenarios of the WHS-driven HTHP. The maximum LCC was found for Twin = 50 °C and Tprocess = 180 °C. Moreover, Figure 17 depicts the results for the levelized cost of energy (LCOE), which is also maximized at Twin = 50 °C and Tprocess = 180 °C. However, the optimal scenario from an economic point of view is the one with the minimum economic indexes, which are observed for Twin = 100 °C and Tprocess = 100 °C. At this point, it is valuable to comment that this design scenario requires HTHP because the WHS of 100 °C is a stream of finite mass flow rate and it cannot provide a process heat at a constant temperature of 100 °C. Moreover, it is worth stating that the LCC was found to vary from 1.448 MEUR to 6.728 MEUR, while the LCOE varied from 0.0220 EUR/kWh to 0.1024 EUR/kWh. The LCC of the natural gas boiler was found to be 3.954 MEUR and the LCOE was 0.0602 EUR/kWh.
Therefore, it is obvious that there are scenarios in which WHS–HTHP is beneficial economically, but in other cases, it is not the optimal choice. For the process heat production temperatures of 100, 110 and 120 °C, all the scenarios with WHS-based HTHP are economically viable. For Tprocess = 130 °C, the economically viable designs require Twin ≥ 55 °C; for Tprocess = 140 °C, the economically viable designs need Twin ≥ 65 °C; for Tprocess = 150 °C, the economically viable designs need Twin ≥ 80 °C; and for Tprocess = 160 °C, the economically viable designs need Twin ≥ 90 °C. On the other hand, all the scenarios with Tprocess = 170 and 180 °C are not economically feasible solutions.
The environmental impact of HTHP use is evaluated through the CO2 emissions, which are compared to the respective natural gas boiler scenario. Figure 18 shows that the annual CO2 emissions are higher when the WHS temperature decreases and the process heat temperature increases. The maximum calculated value is 637.4 tnCO2/year for Twin = 50 °C and Tprocess = 180 °C. This value is lower than the value for the natural gas boiler scenario, which is 735.8 tnCO2/year. Therefore, in all the scenarios involving WHS exploitation, CO2 emissions are avoided. Figure 19 depicts the CO2 emission reductions compared to the natural gas boiler scenario. Specifically, the reduction ranges from 13.38% to 82.61%. Therefore, it can be concluded that there are significant environmental benefits to the industrial process heat electrification process with the exploitation of low-grade WHS.
Table 4 includes the basic results of the sustainability analysis for the baseline scenario with natural gas boiler, for the ambient-source HTHP and for the WHS–HTHP, with the typical temperature levels of the WHS at 75 °C. It is worth comparing the ambient-source HTHP with the other systems. It is clear that the WHS–HTHP is a more viable choice compared to the ambient-source HTHP due to the higher COP of cases with WHS exploitation. Moreover, when comparing the ambient-source HTHP with the natural gas boiler, the HTHP is only an economically viable choice for process heat production at 100 °C, while for higher process heat temperatures, the natural gas boiler is a more economical option. The use of the ambient-source HTHP leads to lower yearly CO2 emissions in comparison to the natural gas boiler, but the WHS-based HTHP leads to the lowest emissions among the systems studied for all the WHS temperatures.
Practically, the results indicate that the exploitation of WHS by the HTHP is vital for achieving high performance, economic viability and a significant reduction in CO2 emissions. Increases in the WHS temperature make the results more positive for the HTHP. This technology is economically sustainable for process heat production temperatures up to 150 °C (approximately). For higher temperatures, the natural gas boiler has better economic performance. On the other hand, the design with ambient-source HTHP can give viable economic results for process heat production at 100 °C, while at higher temperatures, it fails to provide economic benefits compared to other systems.
Moreover, it is important to state that thermal storage technologies for low-grade WHS storage can be applied with the aim of storing volatile WHS streams, which makes the whole configuration a suitable solution for a constant heat production process. The ideal candidates for thermal storage are sensible thermal tanks with water as a working medium (maybe pressurized in cases with temperatures close to 100 °C), as well as phase change materials (PCM). The selection of the thermal tank volume, PCM mass and PCM phase change temperatures are variables that can be estimated by appropriate design investigations.
In the case that the present system is used in colder climates than that of Greece, the performance of the ambient-source HTHP will be lower than the reported results. Moreover, its operation will be limited to lower process heat production temperatures. Furthermore, if electricity prices increased, the financial viability of HTHP would be restricted, while in cases with lower electricity prices, HTHP technology would be a more viable solution.

4. Conclusions

Electrification of industrial processes is an important step for the decarbonization of the industrial sector. This work examines the sustainability of using high-temperature heat pumps (HTHP) for process heat production at temperature levels of 100 °C to 180 °C. The ambient-source HTHP and the waste heat source (WHS)-driven HTHP were examined and compared with the baseline scenario of using a natural gas boiler. The core of this work is a parametric thermodynamic investigation of HTHPs with cyclopentane as a working medium for different design conditions. Moreover, energy and environmental indexes are calculated, aiming to determine the overall sustainability of the studied solutions. The most critical outcomes of this analysis are as follows:
-
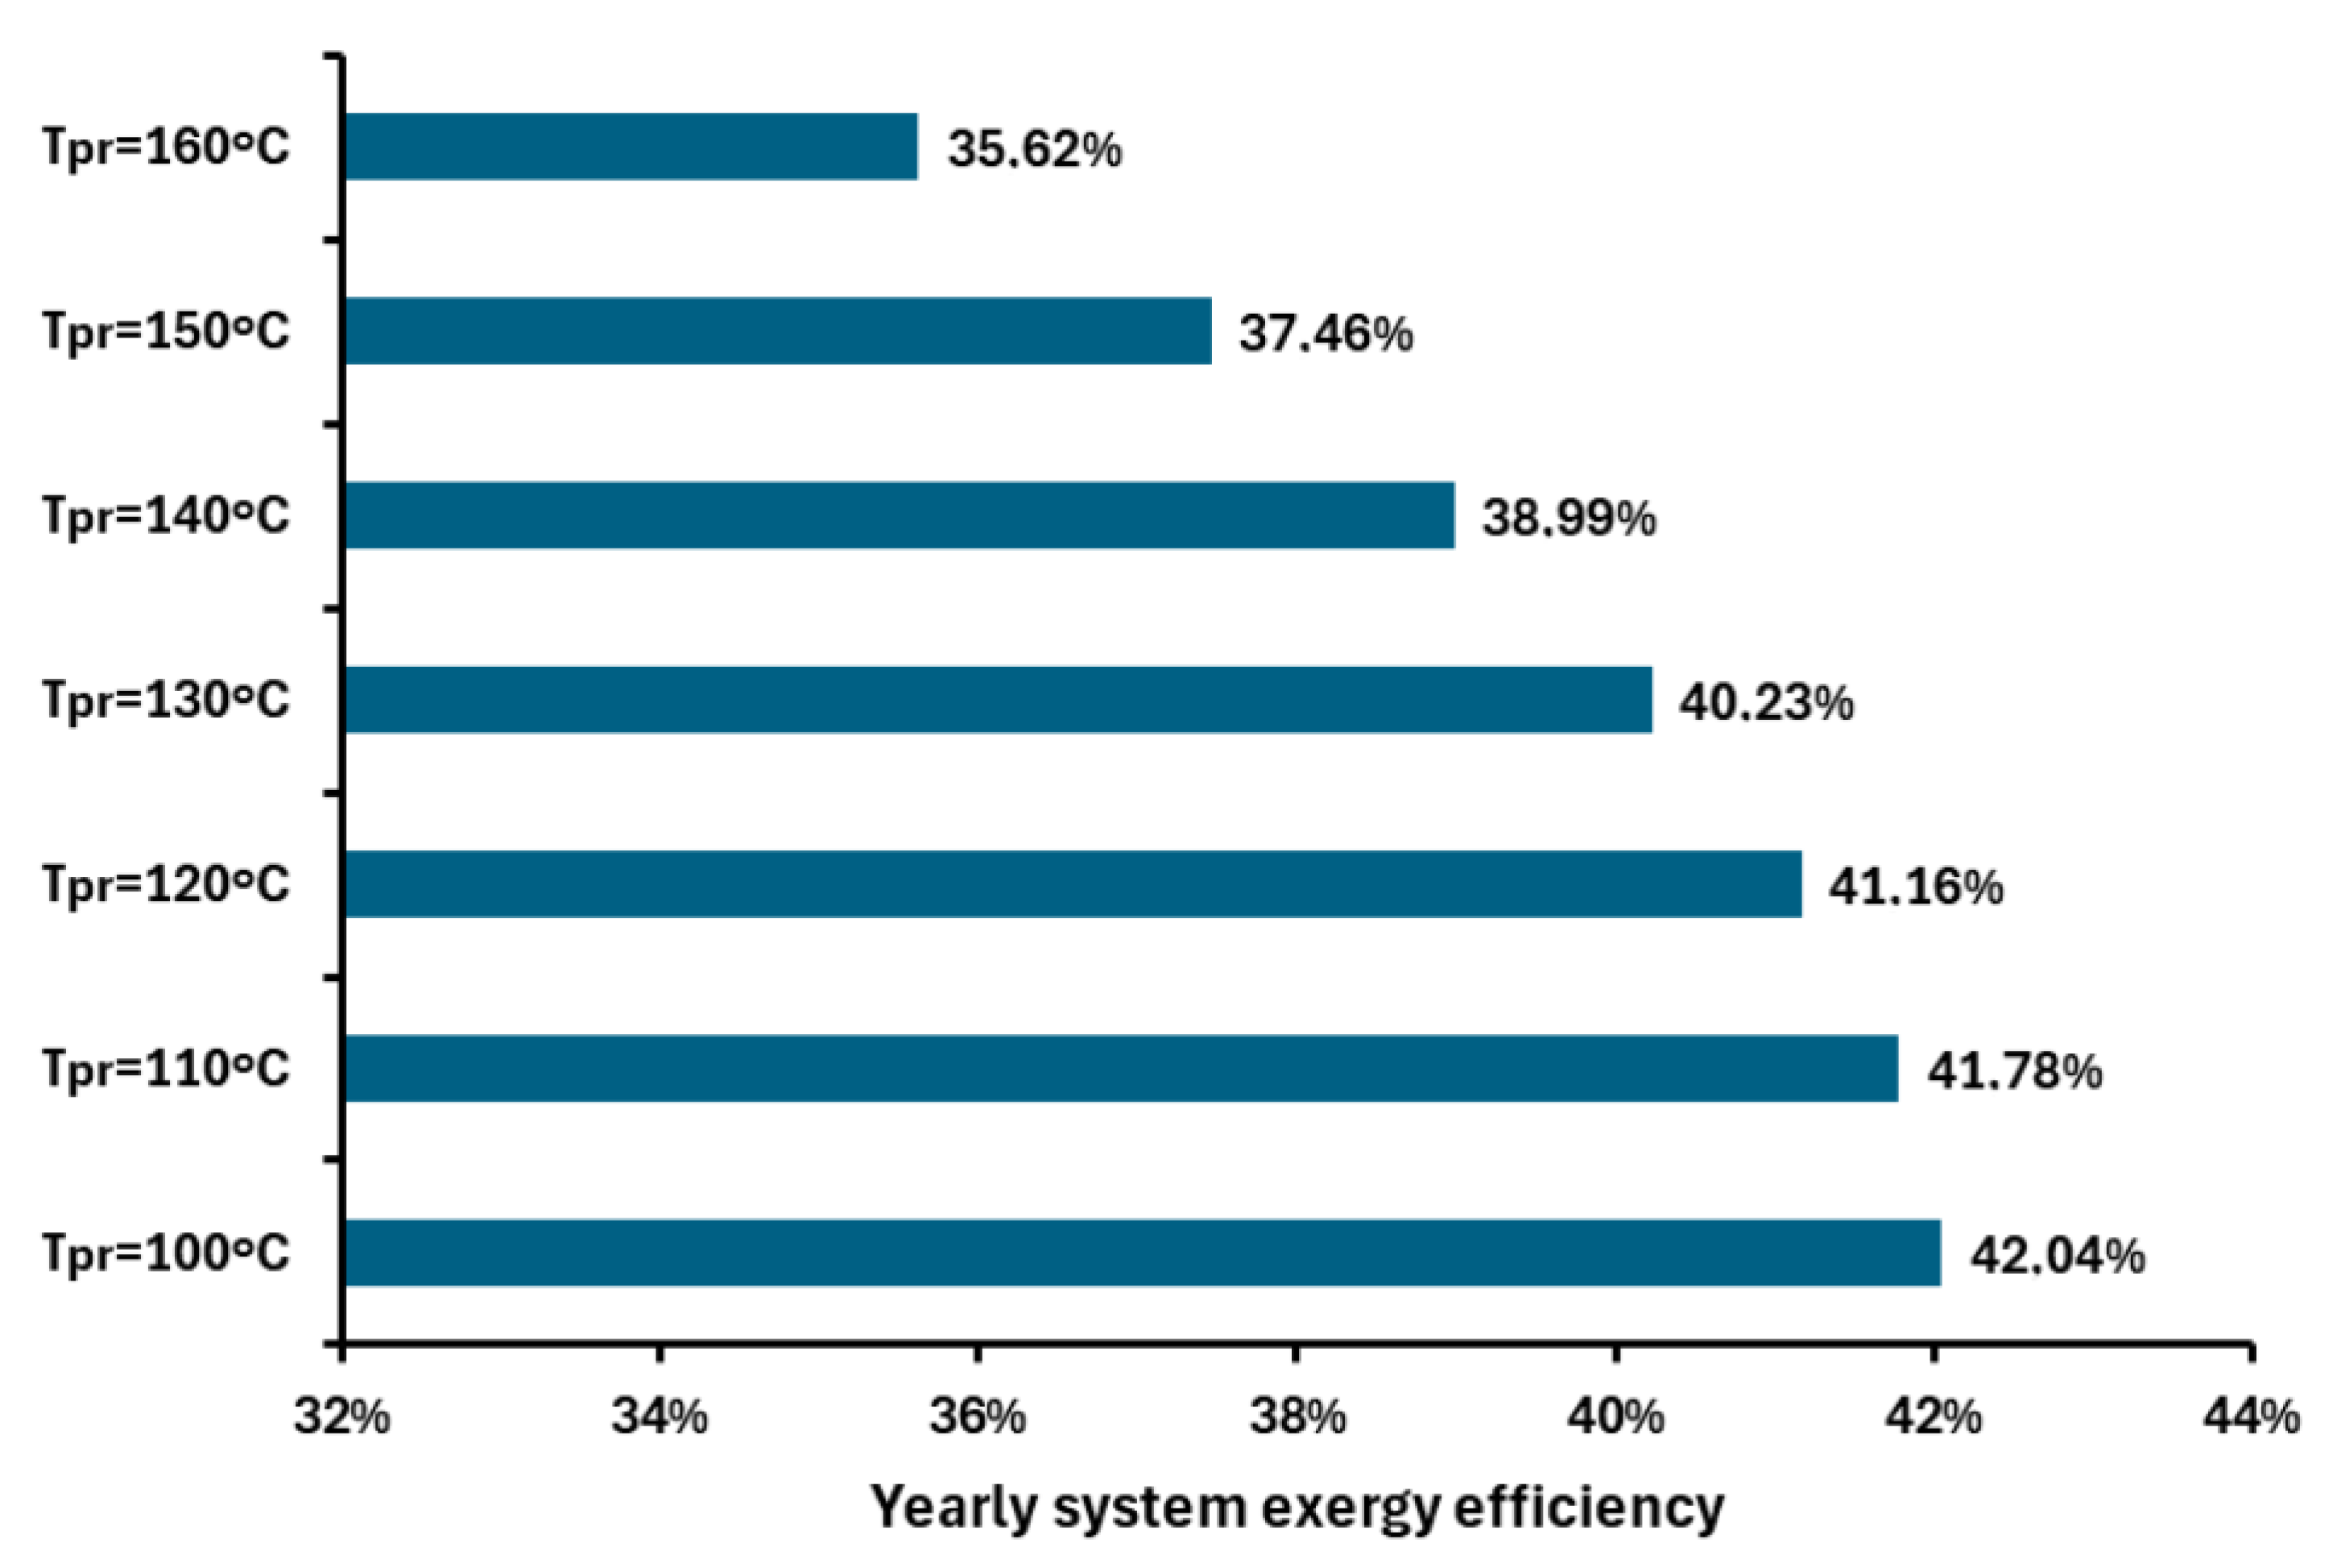
The utilization of low-grade waste heat sources is beneficial for increasing the COP of the heat pump, with this scenario outperforming the ambient-source heat pump. In terms of exergy efficiency, there is an optimal waste heat source temperature for maximizing the unit performance for every scenario.
-
It was concluded that rises in the heat temperature reduce the performance due to the difficulties that the heat pump faces in achieving a high-temperature lift. The waste heat-driven system can produce useful heat up to 180 °C, while the ambient-source system does so up to 160 °C.
-
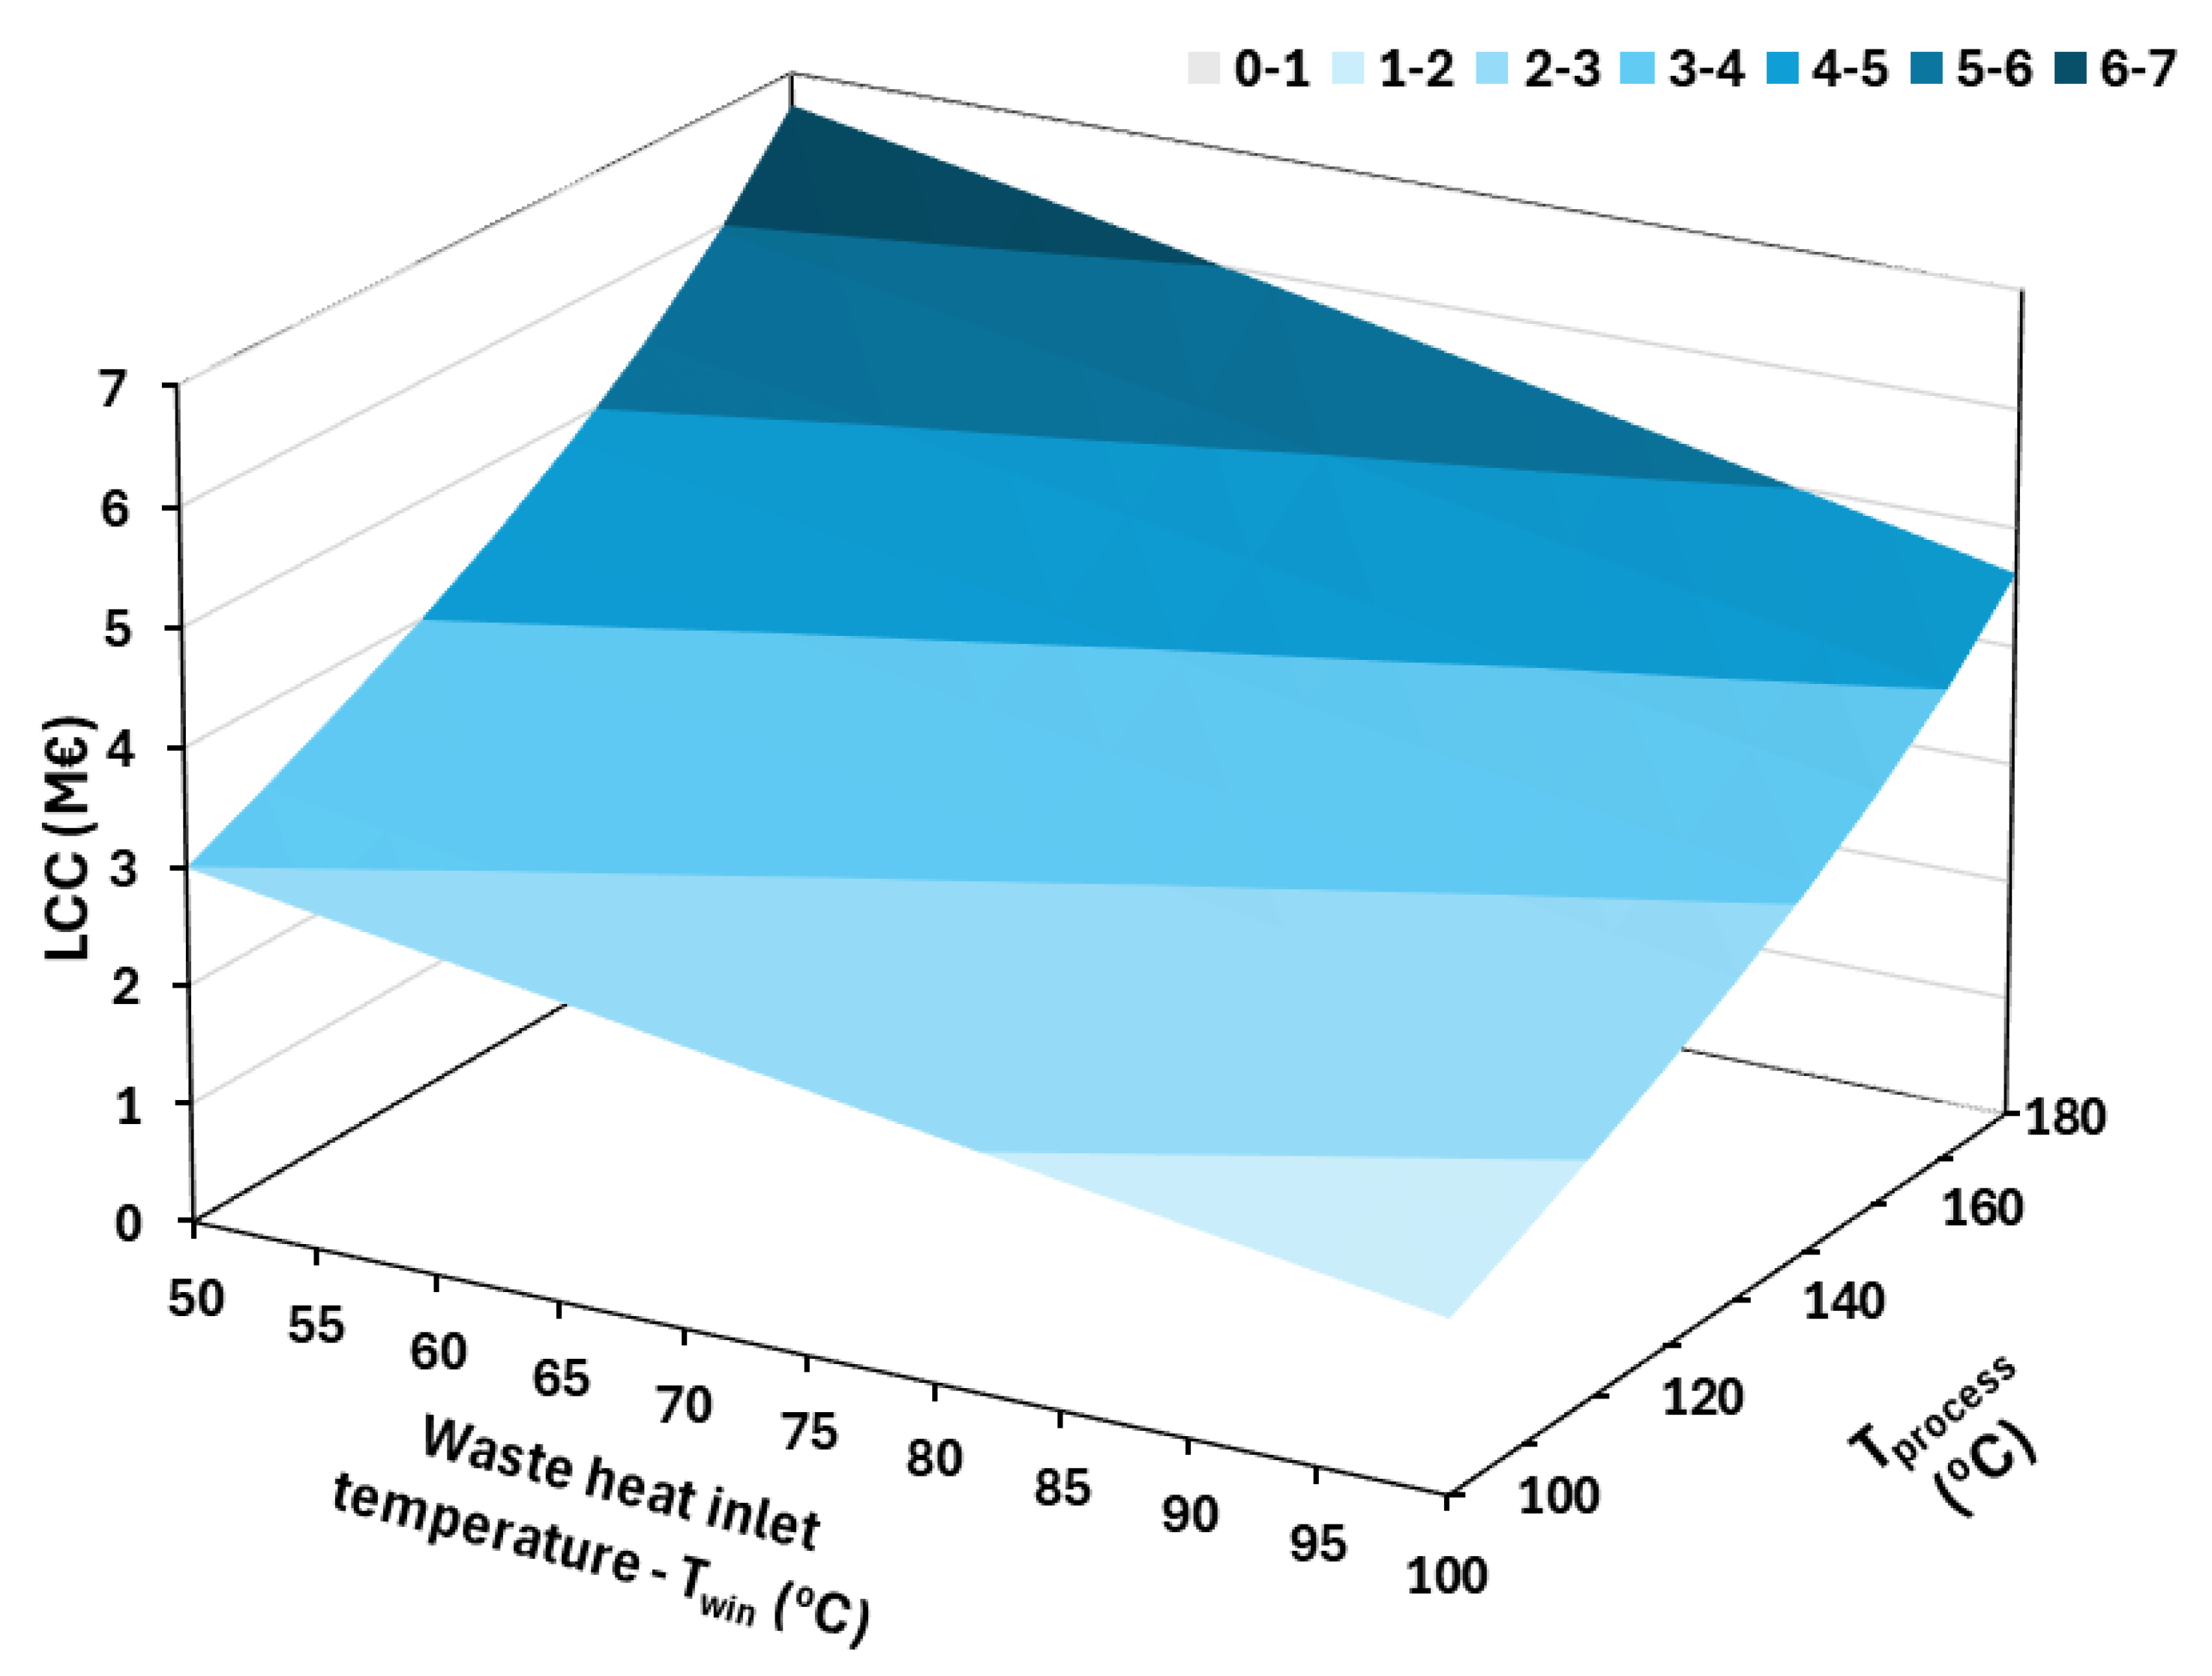
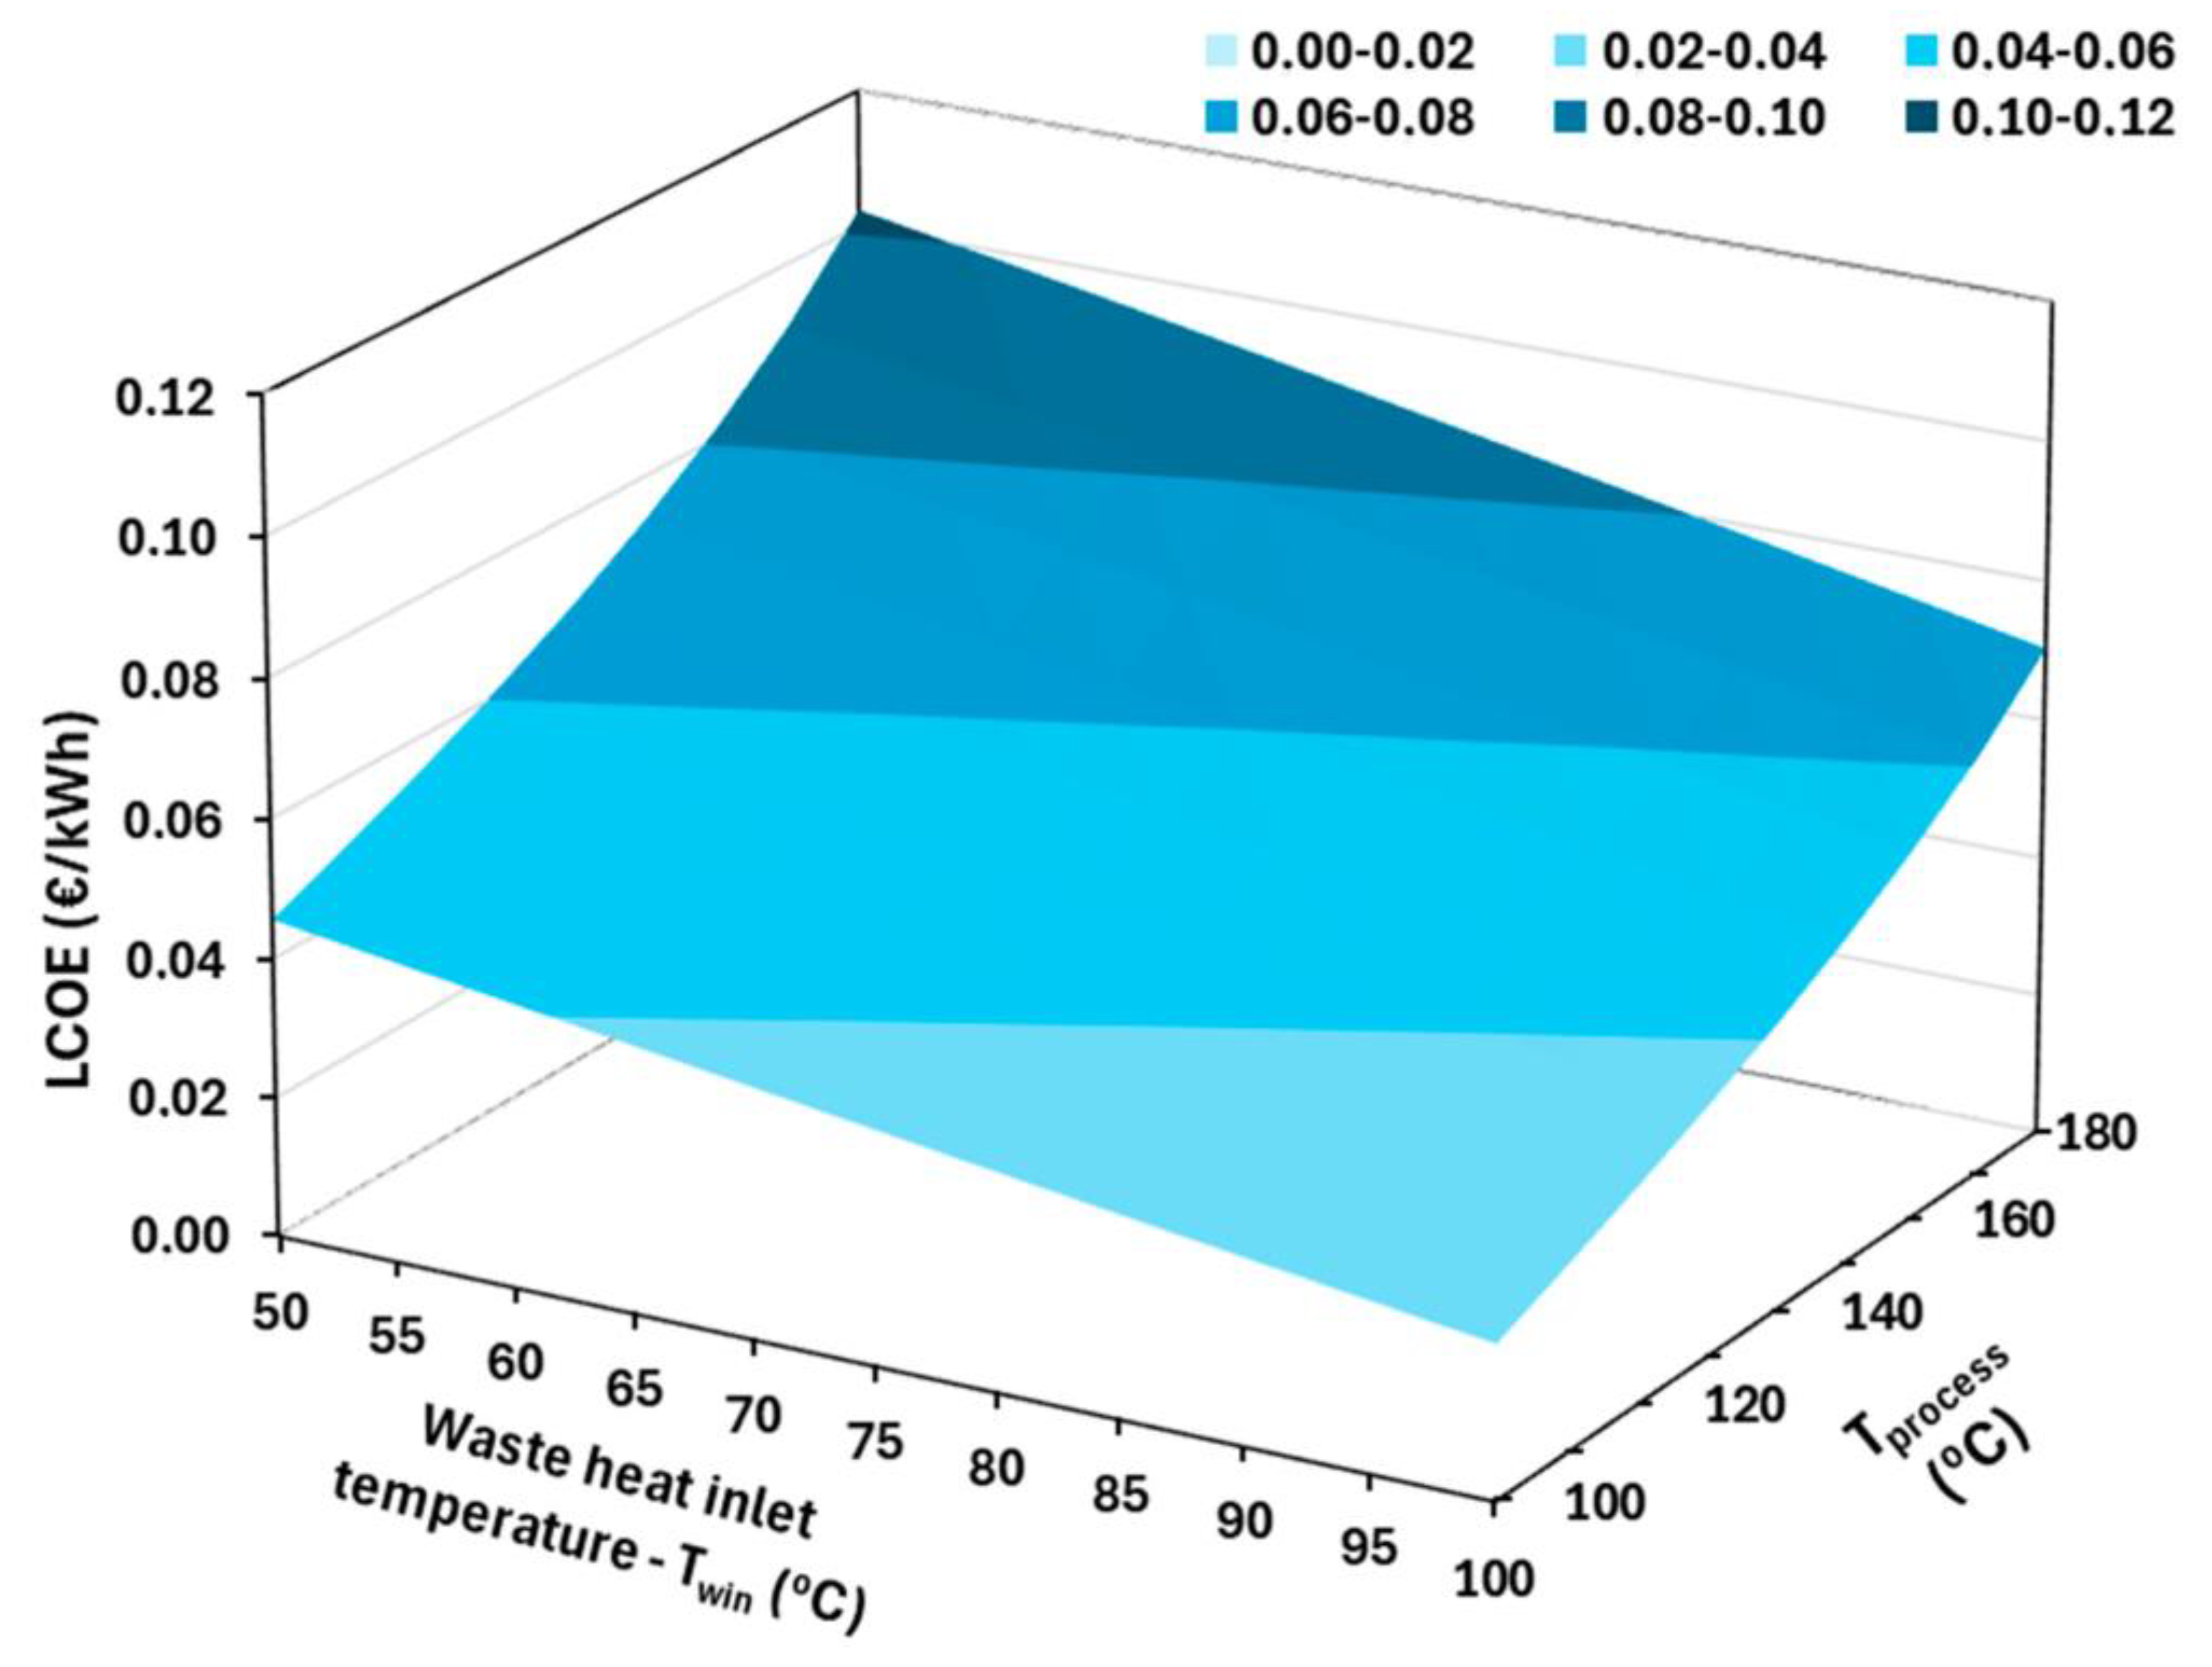
The results indicate system economic sustainability for process heat temperatures up to 160 °C and in the cases with higher waste heat input temperatures. For the ambient-source high-temperature heat pump, the economically viable scenario was found only for the case of heat production at 100 °C due to significant efficiency reductions at higher temperatures.
-
For the waste heat source-driven system, the LCOE ranged from 0.0220 EUR/kWh to 0.1024 EUR/kWh, while for the ambient source, it ranged from 0.0562 EUR/kWh to 0.0977 EUR/kWh, and for the natural gas boiler, it was found at 0.0602 EUR/kWh. Therefore, the application of heat pumps is not always an economically viable choice.
-
For the ambient-source heat pump, economic viability is only found for the cases with Tprocess = 100 °C. For the cases with the waste heat stream-driven heat pump, economic viability always exists for Tprocess = 100, 110 and 120 °C, while for Tprocess = 170 and 180 °C, the economic results are less favorable. For the intermediate cases, economic viability is achieved from a minimum waste source temperature. Specifically, for Tprocess = 130 °C, the economically viable designs need Twin ≥ 55 °C; for Tprocess = 140 °C, the economically viable designs need Twin ≥ 65 °C; for Tprocess = 150 °C, the economically viable designs need Twin ≥ 80 °C; and for Tprocess = 160 °C, the economically viable designs need Twin ≥ 90 °C.
-
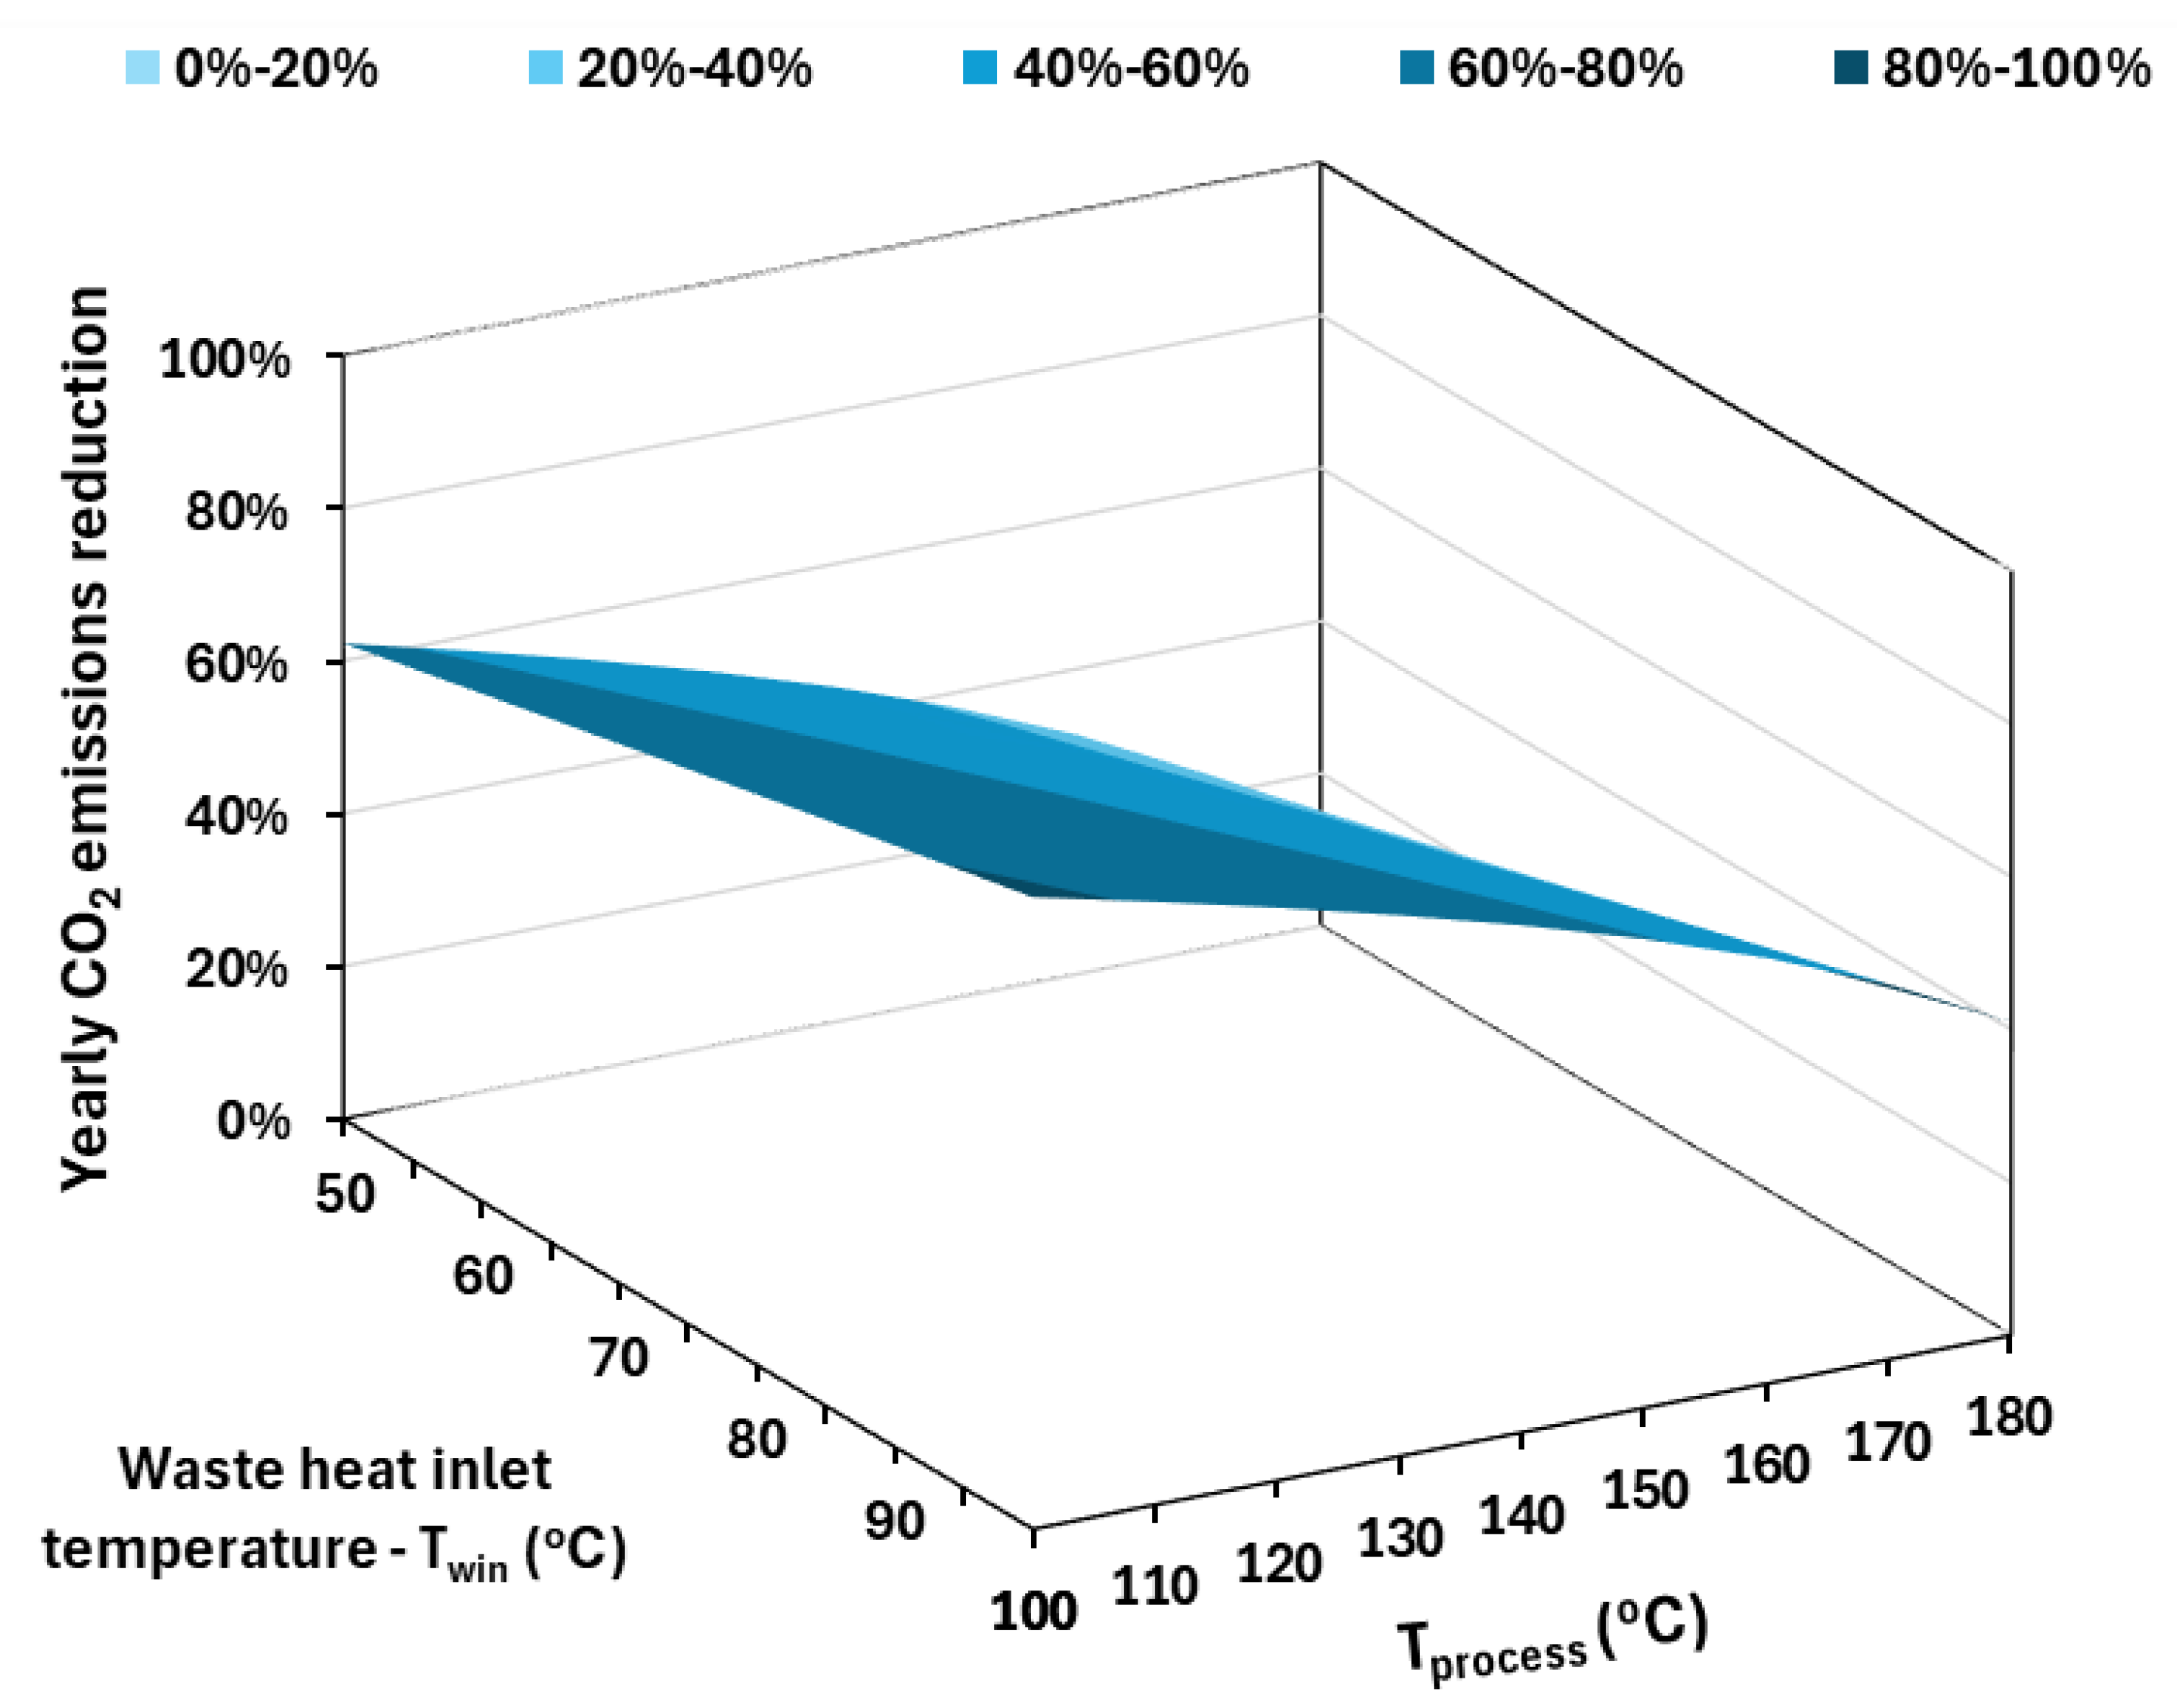
Both waste heat- and ambient-source-driven heat pumps lead to CO2 emission reductions compared to the scenario of using a conventional natural gas boiler. The CO2 emission reductions for the waste heat source-driven heat pump were found to vary from 13.38% to 82.61% compared to the natural gas boiler, while for the ambient-source heat pump, they ranged from 26.76% to 72.60% compared to the natural gas boiler.
In the future, different heat pump configurations should be examined, as well as applications of mixtures of working fluids, in order to optimize the heat transfer and minimize the exergy destruction in the heat exchanges. Moreover, storage system applications for low-grade waste heat streams should be studied with the aim of optimally managing available waste heat streams and providing high quantities of exergy input to the heat pump when there is a need for process heat production.

Author Contributions

Methodology, E.B.; Software, D.G.; Validation, E.B.; Investigation, E.B., D.G., A.N. and J.K.K.; Writing—original draft, E.B., D.G., A.N. and J.K.K.; Supervision, A.N. and J.K.K. All authors have read and agreed to the published version of the manuscript.

Funding

This research received no external funding.

Institutional Review Board Statement

Not applicable.

Informed Consent Statement

Not applicable.

Data Availability Statement

The raw data supporting the conclusions of this article will be made available by the authors on request.

Conflicts of Interest

The authors declare no conflict of interest.

Nomenclature

CCCapital cost, EUR
cpSpecific heat capacity, kJ/kgK
EEnergy, kWh
ExExergy rate, kW
hSpecific enthalpy, kJ/kg
LCCLife cycle cost, EUR
LCOELevelized cost of energy, EUR/kWh
mMass flow rate, kg/s
NLifetime of the project, years
NCFYearly net cash flow, EUR
PelElectricity, kW
PPPinch point, K
QHeat rate, kW
rDiscount factor, %
TTemperature, °C
WWork rate, kW
Greek Symbols
ΔTliftTemperature lift, K
ΔTsTemperature difference in the source heat transfer fluid, K
ηisIsentropic efficiency of the compressor
ηmotorMotor-shaft efficiency
Subscripts and Superscripts
amAmbient
BBoiler
comCompressor
condCondenser
evapEvaporator
heatProcess heat
inInlet
isIsentropic
outOutlet
prProcess
processProcess
sHeat source
wWaste heat
w,maxMaximum waste heat
Abbreviations
COPCoefficient of performance
HTHPHigh-temperature heat pump
PCMPhase change materials
WHSWaste heat stream

Appendix A. Results for the WHS-Based HTHP

The results of the parametric analysis of the WHS-driven HTHP are included in Appendix A. Specifically, Table A1 includes the results for the COP, Table A2 for the LCC, Table A3 for the LCOE and Table A4 for the CO2 yearly emissions. The results are presented for different combinations of process heat temperatures and waste heat source temperatures. Specifically, the process heat temperature is studied in a range from 100 to 180 °C, while the waste heat source temperature is studied in a range from 50 to 100 °C.
Table A1. COP values for different conditions with 300 kW process heat capacity.
Tprocess (°C)
Twin (°C)COP100110120130140150160170180
502.3882.1531.9501.7701.6071.4551.3121.1751.039
552.5272.2672.0441.8491.6731.5111.3591.2131.071
602.6832.3942.1491.9351.7451.5711.4091.2551.105
652.8582.5342.2632.0301.8241.6371.4641.3011.143
703.0572.6922.3912.1341.9101.7091.5241.3511.184
753.2852.8702.5332.2502.0061.7881.5901.4051.229
803.5483.0722.6932.3802.1111.8751.6621.4651.278
853.8553.3042.8742.5242.2291.9711.7411.5301.331
904.2163.5723.0802.6862.3592.0781.8281.6021.390
954.6493.8843.3152.8692.5052.1961.9251.6811.455
1005.1754.2523.5873.0782.6692.3272.0311.7681.526
Table A2. LCC for different conditions with 300 kW process heat capacity.
Tprocess (°C)
Twin (°C)LCC
(EUR/kWh)
100110120130140150160170180
502.9963.3103.6413.9994.3934.8395.3535.9636.728
552.8383.1493.4803.8344.2244.6645.1725.7806.531
602.6802.9893.3163.6694.0554.4914.9935.5916.333
652.5232.8303.1553.5033.8854.3154.8105.3976.127
702.3672.6712.9923.3383.7154.1384.6255.2025.919
752.2112.5132.8313.1723.5433.9604.4385.0075.707
802.0562.3562.6703.0053.3733.7824.2514.8075.492
851.9022.1992.5102.8413.2013.6044.0644.6085.279
901.7492.0432.3502.6773.0313.4253.8764.4065.060
951.5981.8892.1922.5142.8623.2473.6874.2054.839
1001.4481.7362.0352.3512.6933.0713.5014.0044.620
Table A3. COP values for different conditions with 300 kW process heat capacity.
Tprocess (°C)
Twin (°C)LCOE
(EUR/kWh)
100110120130140150160170180
500.04560.05040.05540.06090.06690.07370.08150.09080.1024
550.04320.04790.05300.05840.06430.07100.07870.08800.0994
600.04080.04550.05050.05580.06170.06840.07600.08510.0964
650.03840.04310.04800.05330.05910.06570.07320.08220.0933
700.03600.04070.04550.05080.05650.06300.07040.07920.0901
750.03370.03830.04310.04830.05390.06030.06760.07620.0869
800.03130.03590.04060.04570.05130.05760.06470.07320.0836
850.02890.03350.03820.04320.04870.05490.06190.07010.0803
900.02660.03110.03580.04070.04610.05210.05900.06710.0770
950.02430.02870.03340.03830.04360.04940.05610.06400.0737
1000.02200.02640.03100.03580.04100.04670.05330.06090.0703
Table A4. CO2 yearly emissions values for different conditions with 300 kW process heat capacity.
Tprocess (°C)
Twin (°C)CO2
(tn/kWh)
100110120130140150160170180
50277.3307.6339.6374.2412.1455.2504.8563.6637.4
55262.1292.1324.0358.2395.8438.3487.3546.0618.4
60246.8276.6308.2342.3379.5421.6470.0527.7599.3
65231.7261.3292.6326.2363.1404.6452.4509.0579.4
70216.6246.0277.0310.3346.7387.5434.6490.2559.3
75201.6230.8261.5294.3330.1370.4416.5471.4538.9
80186.7215.6245.9278.3313.7353.2398.5452.1518.2
85171.8200.4230.4262.4297.1336.0380.4432.8497.6
90157.1185.4215.0246.6280.7318.7362.3413.4476.4
95142.5170.5199.8230.8264.4301.6344.0394.0455.2
100128.0155.8184.6215.2248.1284.6326.1374.6434.0

References

  1. Thu, K.; Takezato, K.; Takata, N.; Miyazaki, T.; Higashi, Y. Performance evaluation of a heat pump system using an HFC32/HFO1234yf blend with GWP below 150 for heating applications. Appl. Therm. Eng. 2021, 182, 115952. [Google Scholar] [CrossRef]
  2. Kosmadakis, G.; Arpagaus, C.; Neofytou, P.; Bertsch, S. Techno-economic analysis of high-temperature heat pumps with low-global warming potential refrigerants for upgrading waste heat up to 150 °C. Energy Convers. Manag. 2020, 226, 113488. [Google Scholar] [CrossRef]
  3. Feng, J.; Gao, J.; Hu, B.; Wang, R.; Xu, Z. A mass-coupled hybrid absorption-compression heat pump with output temperature of 200 °C. Energy 2024, 312, 133608. [Google Scholar] [CrossRef]
  4. Huang, Y.; Li, G.; Tang, X.; Huang, K.; Zhao, W.; Zhang, J. Thermodynamic analysis of a modified cascade high temperature heat pump with zeotropic mixtures for heating production up to 200 °C. Energy Convers. Manag. 2025, 324, 119307. [Google Scholar] [CrossRef]
  5. Spale, J.; Hoess, A.J.; Bell, I.H.; Ziviani, D. Exploratory study on low-GWP working fluid mixtures for industrial high temperature heat pump with 200 °C supply temperature. Energy 2024, 308, 132677. [Google Scholar] [CrossRef]
  6. Sun, J.; Wang, Y.; Qin, Y.; Wang, G.; Liu, R.; Yang, Y. A Review of Super-High-Temperature Heat Pumps over 100 °C. Energies 2023, 16, 4591. [Google Scholar] [CrossRef]
  7. Mateu-Royo, C.; Sawalha, S.; Mota-Babiloni, A.; Navarro-Esbrí, J. High temperature heat pump integration into district heating network. Energy Convers. Manag. 2020, 210, 112719. [Google Scholar] [CrossRef]
  8. Sadeghi, M.; Petersen, T.; Yang, Z.; Zühlsdorf, B.; Madsen, K.S. Thermal and economic performance assessment of different high temperature heat pump layouts for upgrading district heating to process heating of steam production at 160 °C. Energy 2024, 313, 133832. [Google Scholar] [CrossRef]
  9. Yoo, J.; Estrada-Perez, C.E.; Choi, B.-H. Investigation of heat pump technologies for high-temperature applications above 250 °C. Appl. Energy 2025, 384, 125384. [Google Scholar] [CrossRef]
  10. Bobbo, S.; Lombardo, G.; Menegazzo, D.; Vallese, L.; Fedele, L. A Technological Update on Heat Pumps for Industrial Applications. Energies 2024, 17, 4942. [Google Scholar] [CrossRef]
  11. Bever, P.-M.; Bless, F.; Arpagaus, C.; Bertsch, S.S. High-Temperature Heat Pumps for Industrial Use. Chem. Ing. Tech. 2024, 96, 1071–1084. [Google Scholar] [CrossRef]
  12. Dong, Y.; Wang, R. When and how to use cascade high temperature heat pump—Its multi-criteria evaluation. Energy Convers. Manag. 2024, 309, 118435. [Google Scholar] [CrossRef]
  13. Kong, L.; Walmsley, T.G.; Hoang, D.K.; Schlosser, F.; Chen, Q.; Carson, J.K.; Cleland, D.J. Transcritical-transcritical cascade CO2 heat pump cycles for high-temperature heating: A numerical evaluation. Appl. Therm. Eng. 2024, 238, 122005. [Google Scholar] [CrossRef]
  14. Dai, B.; Liu, C.; Liu, S.; Wang, D.; Wang, Q.; Zou, T.; Zhou, X. Life cycle techno-enviro-economic assessment of dual-temperature evaporation transcritical CO2 high-temperature heat pump systems for industrial waste heat recovery. Appl. Therm. Eng. 2023, 219, 119570. [Google Scholar] [CrossRef]
  15. Sun, J.; Wang, Y.; Wu, K.; Ge, Z.; Yang, Y. Analysis of a New Super High Temperature Hybrid Absorption-Compression Heat Pump Cycle. Energies 2022, 15, 7515. [Google Scholar] [CrossRef]
  16. Padullés, R.; Hansen, M.L.; Andersen, M.P.; Zühlsdorf, B.; Jensen, J.K.; Elmegaard, B. Optimal operation of industrial heat pumps with stratified thermal energy storage for emissions and cost reduction using day-ahead predictions. Appl. Therm. Eng. 2025, 266, 125703. [Google Scholar] [CrossRef]
  17. Zühlsdorf, B.; Bühler, F.; Bantle, M.; Elmegaard, B. Analysis of technologies and potentials for heat pump-based process heat supply above 150 °C. Energy Convers. Manag. X 2019, 2, 100011. [Google Scholar] [CrossRef]
  18. Tzouganakis, P.; Bellos, E.; Rakopoulos, D.; Skembris, A.; Rogkas, N. Thermodynamic analysis of a solar-fed heat upgrade system using the reverse air brayton cycle. Renew. Energy 2025, 238, 121975. [Google Scholar] [CrossRef]
  19. EES: Engineering Equation Solver | F-Chart Software: Engineering Software n.d. Available online: https://fchartsoftware.com/ees/ (accessed on 15 January 2025).
  20. Therminol VP-1 Heat Transfer Fluid | Therminol | Eastman n.d. Available online: https://www.therminol.com/product/71093459 (accessed on 15 January 2025).
  21. Bellos, E. A detailed analysis of waste heat recovery organic Rankine cycle with partial evaporation and different working fluids. Appl. Therm. Eng. 2025, 263, 125410. [Google Scholar] [CrossRef]
  22. Bellos, E.; Tzivanidis, C.; Said, Z. Investigation and optimization of a solar-assisted pumped thermal energy storage system with flat plate collectors. Energy Convers. Manag. 2021, 237, 114137. [Google Scholar] [CrossRef]
  23. Steger, D.; Regensburger, C.; Eppinger, B.; Will, S.; Karl, J.; Schlücker, E. Design aspects of a reversible heat pump—Organic rankine cycle pilot plant for energy storage. Energy 2020, 208, 118216. [Google Scholar] [CrossRef]
  24. Eppinger, B.; Zigan, L.; Karl, J.; Will, S. Pumped thermal energy storage with heat pump-ORC-systems: Comparison of latent and sensible thermal storages for various fluids. Appl. Energy 2020, 280, 115940. [Google Scholar] [CrossRef]
  25. JRC Photovoltaic Geographical Information System (PVGIS)—European Commission. Available online: https://re.jrc.ec.europa.eu/pvg_tools/en/tools.html#PVP (accessed on 15 January 2025).
  26. Jarre, M.; Noussan, M.; Poggio, A. Operational analysis of natural gas combined cycle CHP plants: Energy performance and pollutant emissions. Appl. Therm. Eng. 2016, 100, 304–314. [Google Scholar] [CrossRef]
  27. Gas Reference Prices—EnExGroup. Available online: https://www.enexgroup.gr/gas-reference-prices (accessed on 15 January 2025).
  28. Greek Technical Chamber ΤΟΤΕΕ 20701-1 Technical Guidelines on Buildings’ Energy Performance 2017. Available online: https://www.kenak.gr/files/TOTEE_20701-1_2017.pdf (accessed on 15 January 2025).
  29. Capital.gr. Available online: https://www.capital.gr/epikairotita/3879562/olo-kai-akriboteri-i-energeia-gia-tin-elliniki-biomixania-fotia-stis-times-reumatos-kai-aeriou/ (accessed on 15 January 2025).
  30. Euro2dayGr. Available online: https://www.euro2day.gr/news/economy/article/2280393/pshlonei-to-energeiako-kostos-gia-thn-ellhnikh-vio.html (accessed on 15 January 2025).
  31. DAPEEP. Available online: https://www.dapeep.gr/dimosieuseis/eguiseis-proeleusis-energeiako/ (accessed on 15 January 2025).
  32. Bellos, E.; Tsimpoukis, D.; Lykas, P.; Kitsopoulou, A.; Korres, D.N.; Vrachopoulos, M.G.; Tzivanidis, C. Investigation of a High-Temperature Heat Pump for Heating Purposes. Appl. Sci. 2023, 13, 2072. [Google Scholar] [CrossRef]
Figure 1. The examined HTHP with low-grade waste heat exploitation.
Applsci 15 05171 g001
Figure 2. Ambient temperature variation during the year for Athens, Greece.
Applsci 15 05171 g002
Figure 3. System performance. (a) COP, and (b) exergy efficiency for process heat temperature at 100 °C and variable combinations of WHS temperature and process heat capacities.
Applsci 15 05171 g003aApplsci 15 05171 g003b
Figure 4. System performance. (a) COP, and (b) exergy efficiency for process heat temperature at 140 °C and variable combinations of WHS temperature and process heat capacities.
Applsci 15 05171 g004aApplsci 15 05171 g004b
Figure 5. System performance. (a) COP, and (b) exergy efficiency for process heat temperature at 180 °C and variable combinations of WHS temperature and process heat capacities.
Applsci 15 05171 g005aApplsci 15 05171 g005b
Figure 6. COP variation with the WHS temperature for different process heat temperature levels and process heat capacity at 300 kW.
Applsci 15 05171 g006
Figure 7. Exergy efficiency variation with the WHS temperature for different process heat temperature levels and process heat capacity at 300 kW.
Applsci 15 05171 g007
Figure 8. Depiction of Equation (19) accuracy for COP of the WHS-driven HTHP. (The horizontal axis illustrates the COP calculated by the code and the vertical by the approximation equation).
Applsci 15 05171 g008
Figure 9. COP variation with the ambient temperature for different process heat temperature levels.
Applsci 15 05171 g009
Figure 10. Exergy efficiency variation with the ambient temperature for different process heat temperature levels.
Applsci 15 05171 g010
Figure 11. Depiction of the Equation (20) accuracy for COP of the air source-driven HTHP. (The horizontal axis illustrates the COP calculated by the code and the vertical by the approximation equation).
Applsci 15 05171 g011
Figure 12. Yearly variation in COP with the ambient-source HTHP for different process heat temperature levels.
Applsci 15 05171 g012
Figure 13. Yearly average COP of the ambient-source HTHP for different process heat temperature levels.
Applsci 15 05171 g013
Figure 14. Yearly average exergy efficiency of the ambient-source HTHP for different process heat temperature levels.
Applsci 15 05171 g014
Figure 15. COP variation for different combinations of WHS inlet temperature and process temperature.
Applsci 15 05171 g015
Figure 16. LCC variation for different combinations of WHS inlet temperature and process temperature.
Applsci 15 05171 g016
Figure 17. LCOE variation for different combinations of WHS inlet temperature and process temperature.
Applsci 15 05171 g017
Figure 18. Yearly CO2 emissions variation for different combinations of WHS inlet temperature and process temperature.
Applsci 15 05171 g018
Figure 19. Yearly CO2 emissions reduction percentage compared to the boiler scenario variation for different combinations of WHS inlet temperature and process temperature.
Applsci 15 05171 g019
Table 1. Basic input parameters in this work.
ParameterSymbolValue
Isentropic efficiency of the compressorηis70%
Motor and shaft efficiencyηmotor90%
WHS mass flow ratemw10 kg/s
Specific heat capacity of the WHScp,w1.1 kJ/kgK
Specific heat capacity of the thermal oilcp,s1.9 kJ/kgK
Temperature difference of the thermal oilΔΤs5 K
Pinch point in the heat exchangersPP5 K
Default ambient temperatureTam25 °C
Table 2. Ranges of the variable parameters studied in this work.
ParameterSymbolRange
Process heat capacityQprocess100 to 500 kW
Process heat temperature levelTprocess100 to 180 °C
WHS inlet temperatureTwin50 to 100 °C
Table 3. Parameters for economic and environmental analysis.
ParameterValue
Gas boiler efficiency70%
Natural gas cost0.06 EUR/kWhth
CO2 specific emissions factor for the natural gas0.196 kgCO2/kWh
CO2 specific emissions factor for the electricity0.252 kgCO2/kWh
HTHP cost300 EUR/kWh
Electricity cost0.15 EUR/kWh
Maintenance cost2% of the capital cost
Lifetime period of the investment25 years
Discount factor3%
Operation time per year8760 h
Table 4. Summary of the results for the different systems.
Ambient-Source HTHP
Tprocess (°C)100110120130140150160170180
COP1.9241.7481.5931.4531.3251.2041.090--
Eel (MWh)1366150316501809198421822412--
LCC (MEUR)3.6904.0484.4304.8455.3035.8216.421--
LCOE (EUR/kWh)0.05620.06160.06740.07370.08070.08860.0977--
CO2 emissions(tn/y)344.3378.9415.7455.7500.0549.9607.8--
WHS–HTHP at the Temperature of 75 °C
COP3.2852.872.5332.252.0061.7881.591.4051.229
Eel (MWh)8009161038116813101470165318702138
LCC (MEUR)2.2112.5132.8313.1723.5433.9604.4385.0075.707
LCOE (EUR/kWh)0.03370.03830.04310.04830.05390.06030.06760.07620.0869
CO2 emissions(tn/y)201.6230.8261.5294.3330.1370.4416.5471.4538.9
Natural Gas Boiler
EB (MWh)3754
LCC (MEUR)3.954
LCOE (EUR/kWh)0.0602
CO2 emissions(tn/y)735.8
Disclaimer/Publisher’s Note: The statements, opinions and data contained in all publications are solely those of the individual author(s) and contributor(s) and not of MDPI and/or the editor(s). MDPI and/or the editor(s) disclaim responsibility for any injury to people or property resulting from any ideas, methods, instructions or products referred to in the content.

