Article

Comparison Between Longitudinal and Transverse Shaking of Culvert–Frame Combined Underground Structure

1
Department of Geotechnical Engineering, Tongji University, Shanghai 200092, China
2
Shanghai Tongji Green Building Prefabrication Construction Engineering Technology Co., Ltd., Shanghai 200092, China
3
Shanghai Tunnel Engineering & Rail Transit Design and Research Institute, Shanghai 200092, China
4
Shanghai Shentong Metro Construction Group Co., Ltd., Shanghai 200092, China
*
Author to whom correspondence should be addressed.
Appl. Sci. 2025, 15(9), 5164; https://doi.org/10.3390/app15095164
Submission received: 7 April 2025 / Revised: 30 April 2025 / Accepted: 5 May 2025 / Published: 6 May 2025

Abstract

:
Owing to the special configurations of the culvert–frame combined underground structure, discrepant responses at different portions of the structure arise when earthquakes strike in the longitudinal direction. This paper presents other experiments when shaking along the lateral direction and comparing structural dynamic responses between these two cases. Data on accelerations and culvert joint displacements were presented under a series of 1 g shaking tests, that is, five synthetic earthquake motions between white noise cases. Comparing the seismic responses of the culvert–frame structure under varying intensities of excitations gave findings that, with respect to longitudinal excitation, the acceleration responses of the model soil were increased under transverse excitations. For the model structure, the acceleration responses under longitudinal excitations were larger than those of transverse excitations. A significant difference in the displacement of the culvert joint was observed.

1. Introduction

A metro station was constructed using a combination of the traditional cut-and-cover method and the undercutting (hereafter, CCU) method [1,2,3], under the limitations of the project conditions. Many studies have been conducted on the seismic response of underground structures constructed using the cut-and-cover method, such as frame structures. These studies focus on the dynamic response patterns of structures under different seismic excitations [4,5,6,7,8,9]. However, most studies simplify the frame structures as typical extensions of single-frame cross-sections along the longitudinal direction. As for the underground structures constructed using the undercutting method, such as culverts, many studies focus on dynamic response patterns. Maleska et al. [10,11,12] conducted numerical analysis on a soil–steel composite tunnel and a soil–steel composite bridge. Considering the seismic excitations input in different directions, the behavior of soil–steel composite underground structures is summarized. Han et al. [13] investigated the dynamic responses of a buried pipeline under longitudinal and transverse non-uniform excitations. The results indicated that the dynamic response mechanisms of the pipeline are relevant to the direction of seismic excitations. Yatsumoto et al. [14] studied the seismic behavior of road box culverts using centrifuge model tests and a numerical analysis. The comparison between experimental and numerical results suggests that road box culverts have a good possibility of developing rocking rotation in the transverse excitation with great intensities.
The structural configurations would differ from each other between the cut-and-cover portion and the undercutting part. Unexpected discrepancies in seismic responses were observed for the CCU structure under the longitudinal excitation of 1 g shaking tests [15]. Previous investigations presented that the direction of ground motion significantly influences the dynamic interaction of the junction between the shaft (constructed using the cut-and-cover method) and segmental tunnel (one of the undercutting methods). Therefore, it is crucial to pay closer attention to the effects of shaking direction on the responses of underground structures constructed using CCU methods.
Model tests are an effective and widely used approach to study the seismic responses of underground structures. Several studies have focused on the seismic responses of CCU structures to transverse shaking. Saito et al. [15] conducted shaking table tests on a shaft–tunnel junction, revealing that the tunnel section near the frame experiences greater axial force under transverse shaking. Towhata et al. [16] and Kawamata et al. [17] investigated the soil–structure interaction and seismic responses of underground structures with two vertical shafts and a cut-and-cover tunnel. The earthquake motions in the shaking table tests were bidirectional (parallel and perpendicular to the axis of the tunnel, respectively). For metro station–tunnel junction structures, the interaction between tunnels and metro station frames exacerbates peak dynamic strains of the frame columns [18] and longitudinal strains of the tunnel [19], as indicated by shaking table test results with transverse input motions. Zhang et al. [20] conducted a series of shaking table tests to explore the effects of the shaft on the tunnel, revealing amplified accelerations, circumferential-joint extensions, and strains in the tunnel section near the shaft. Chen et al. [21] identified the deformation modes of metro station–tunnel junctions under transverse input motions, highlighting the connection between the metro station and the tunnel as the weakest location due to stiffness mutation. Wang et al. [22] conducted shaking table tests and a series of numerical analyses on a subway station–tunnel junction in liquefiable soil. The expansion joints between the station and the tunnel can reduce the seismic stress and deformations of the structure. But the expansion joints can lead to misalignment between the station and the tunnel. In the studies mentioned above, except for Refs. [16,17], one end of the tunnel connects to the shaft/station while the other end is considered infinitely long. These experimental conclusions do not apply to the case of the culvert–frame combined underground structure in this investigation, where two cut-and-cover frames connect to the undercutting structure at both ends. The vertical shafts in Ref. [17] connect to the bottom of the laminar container, resulting in different dynamic characteristics from the CCU underground structure discussed in this study. Additionally, the tunnels in these studies are modeled as continuous tubes, with deformations revealed by strain data, except for the shield tunnels in Refs. [20,23]. The deformations of jacked culverts mainly occur at the joints, which differ from those of continuous tubes.
Limited research has focused on the seismic responses of CCU structures to longitudinal input motions. Zhang et al. [24] conducted shaking table tests on a shaft–tunnel junction under longitudinal excitations. It is found that accelerations, strains, and joint extensions in the section of the tunnel near the shaft are amplified. The distributions of joint extensions differ between longitudinal and transverse excitations. However, the shaft–tunnel junction studied by Ref. [24] consists of only one stiff shaft connected to shield tunnels, making the results inapplicable to other CCU structures with different configurations, such as metro stations with two cut-and-cover frames connected to both ends of the jacked culverts.
This paper investigated the differing responses of a CCU structure to longitudinal and transverse excitations through shaking table tests, whose facilities are located in the Multi-functional Earthquake Lab, Jiading campus of Tongji University. The CCU structure comprised twin jacked culverts connected by two box frames at both ends. A white noise case evaluated the dynamic characteristics of the model soil ground. Data on accelerations and joint displacements were recorded during a series of synthetic earthquake motion cases. Excitations were applied in both longitudinal and transverse directions to investigate the influence of excitation direction on seismic responses.

2. Shaking Table Test
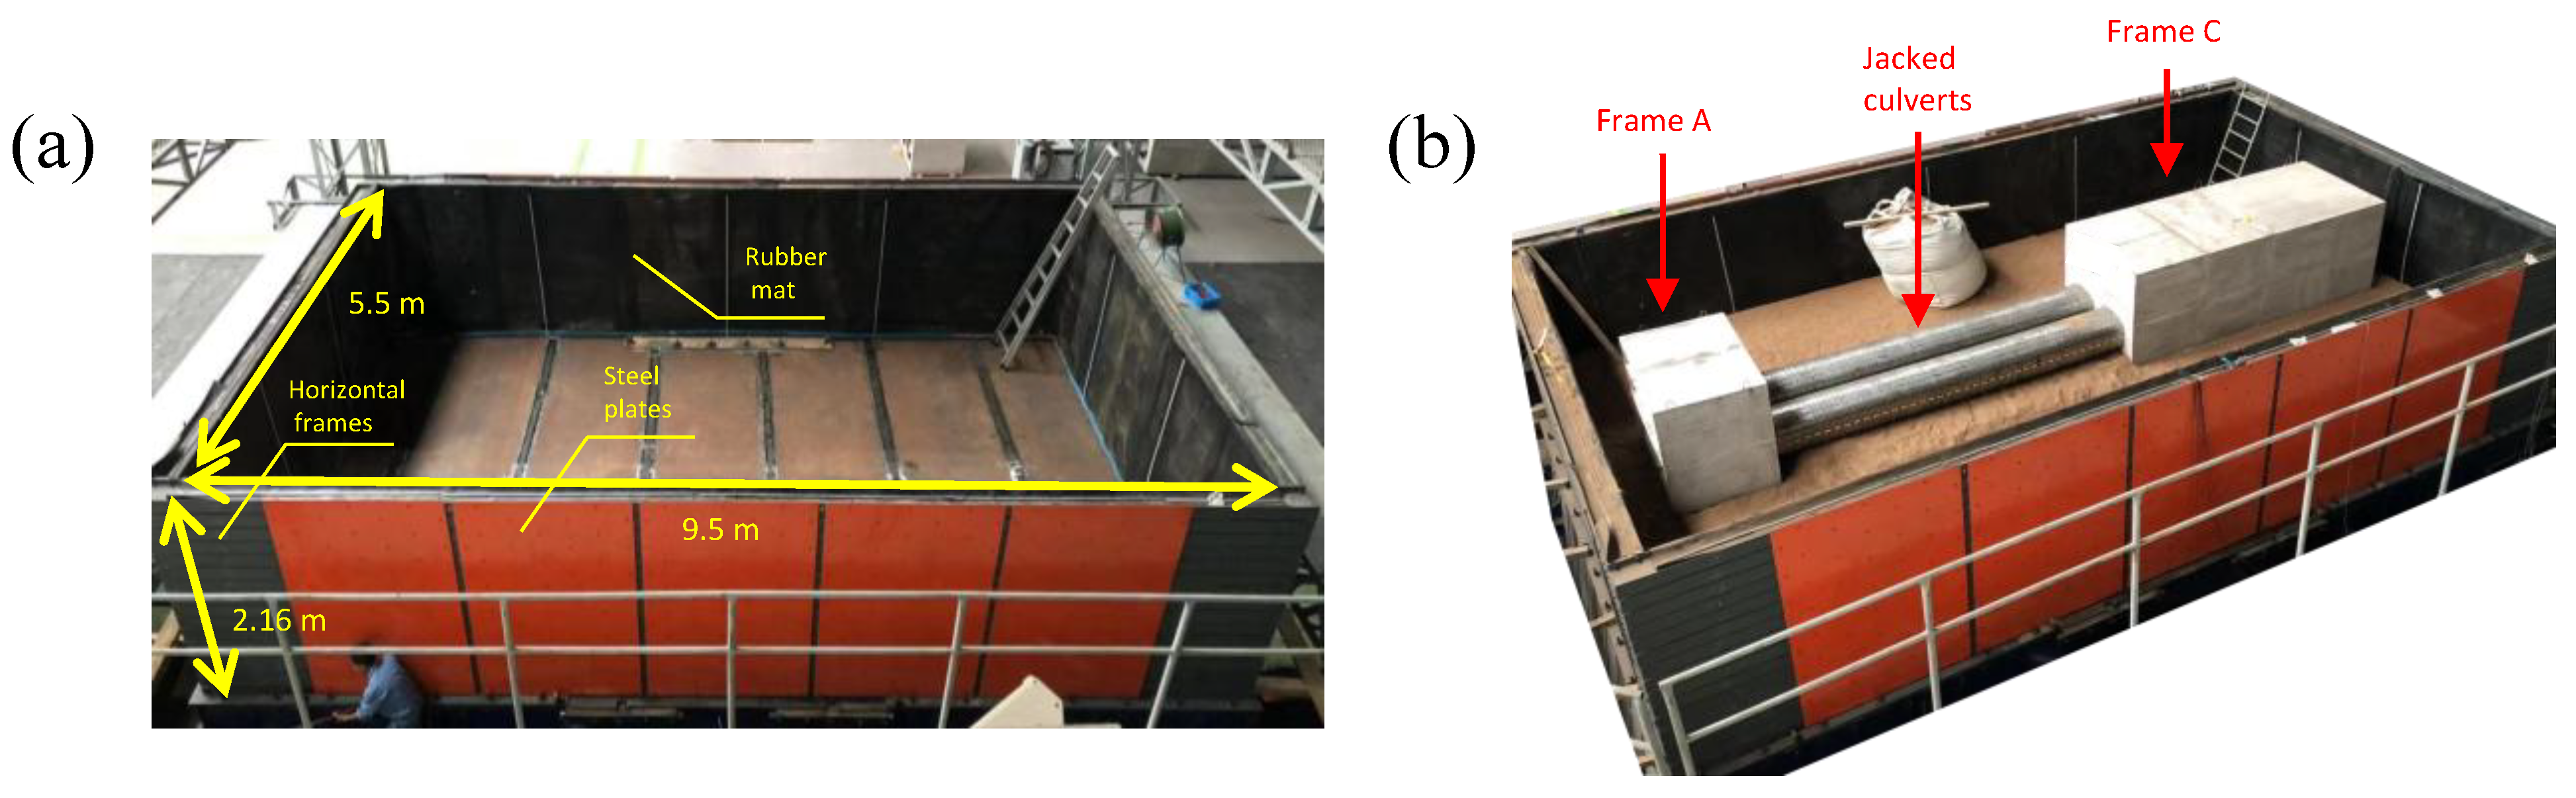
2.1. Testing System

The dimensions of the rectangular shaking table are 10 m long and 6 m wide. As the container of the model soil and model structure, the recently designed and constructed laminar box shown in Figure 1 has exterior dimensions of 10 m × 6 m × 2 m (length × width × height). The major similitude relations are listed in Table 1. Since the gravitational acceleration in both the prototype and model systems is equal to g during the shaking table test, the acceleration similitude ratio S a should be equal to 1. In this study, S G , S ρ , and S l are the primary similarity parameters. Based on the three primary variables, the other similitude ratios can be derived by applying the Vaschy–Buckingham Π theorem. The host medium is a synthetic model soil. The sawdust and sand of the model soil have a mass ratio of 1:2.5. Properties of the idealized prototype field are listed in Table 2. The main consideration in the design of the model frame is to ensure that the relative soil–structure stiffnesses of the prototype and the model remain consistent. Cross-sections of the prototype frame and the model frame are illustrated in Figure 2.

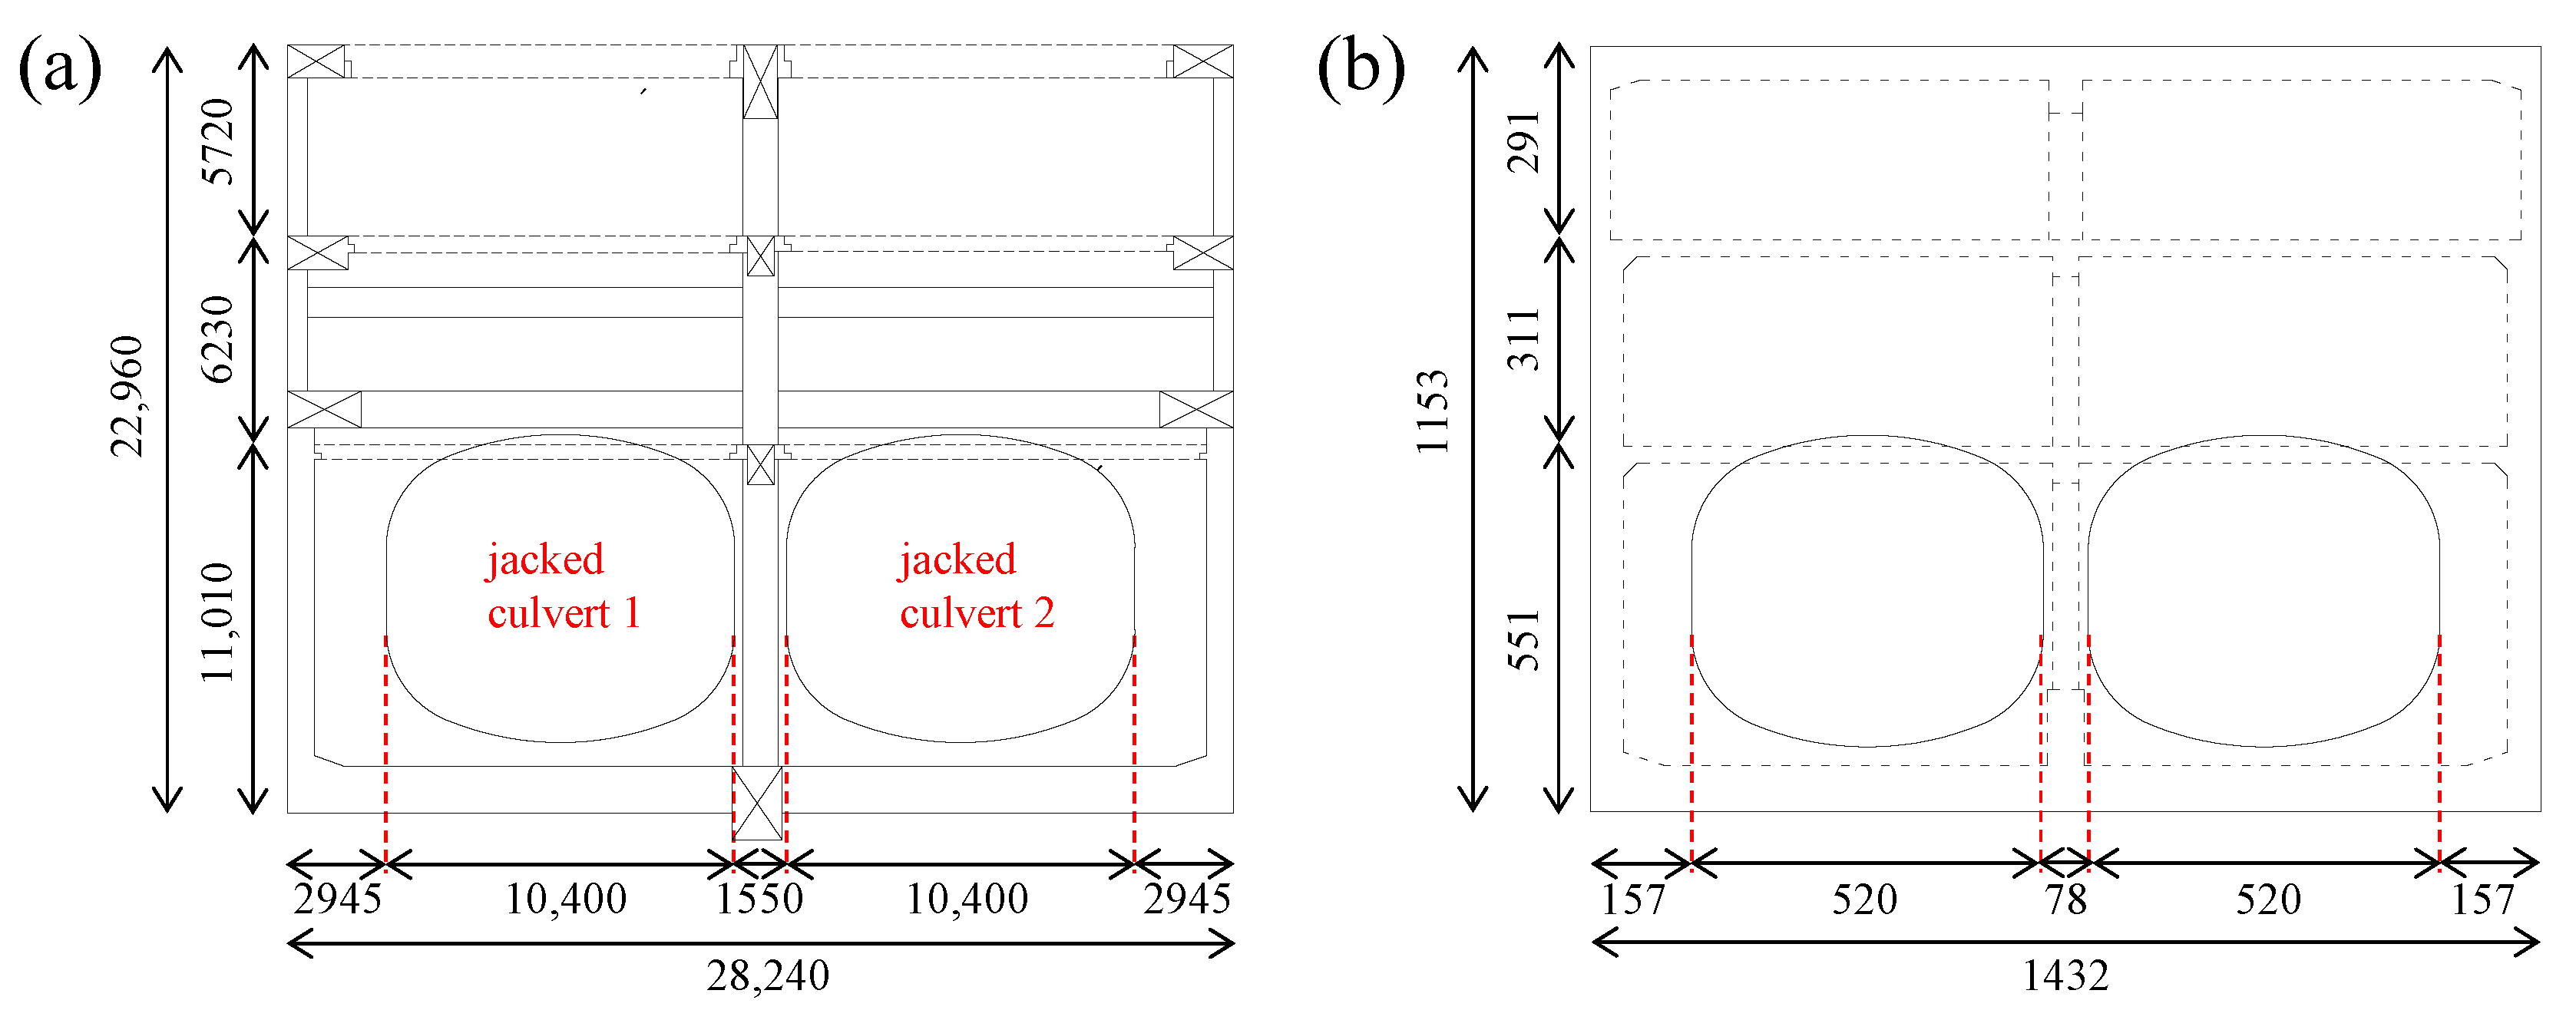
2.2. Longitudinal and Transverse Equivalent Design of the Model Structure

As shown in Figure 3, prototype culvert rings consist of exterior steel plates and T-section steel plates. T-section steel plates are melted at the inward faces of exterior steel plates in the circumferential direction and the axial direction. For each joint of the prototype jacked culvert, twenty-two size-M30 bolts are installed to connect both culvert rings.
For the convenience of processing, Q235 cold-rolled low-carbon steel sheets are utilized to model jacked culvert rings. Two adjacent culvert rings are connected by eight bolts with diameters of 3 mm. The jacked culvert ring scaled down in the similitude ratio is too small to process. In this context, the final jacked culvert is simplified by reducing the number of steel ribs on the inner faces. However, the total amount of steel in the cross-section of the jacked culvert ring is maintained to ensure compliance with the previously established similitude relations. To evaluate the dynamic similarity between the prototype and model jacked culverts, the flexibility ratio is adopted as the key assessment metric. The flexibility ratio F in the transverse direction can be calculated as follows [25]:
F = E m 1 ν l 2 R 3 6 E l I 1 + ν m
where E m and E l are the elastic modulus of soil and the jacked culvert, respectively; ν m and ν l are the Poisson’s ratios of the materials of soil and the jacked culvert, respectively; R is the radius of the jacked culvert; and I is the moment of inertia of the jacked culvert (per unit width). The similitude ratio of flexibility ratio S F should be 1 if the soil–tunnel flexibility ratio is the same in both the prototype system and the model system. According to Equation (1), S F can be expressed as follows:
S F = S E m S R 3 1 + ν m p 1 ν l m 2 S E l S I 1 + ν m m 1 ν l p 2
where ν m p and ν m m are the Poisson’s ratios of the prototype medium and the model medium, respectively; ν l p and ν l m are the Poisson’s ratios of the prototype structure and the model structure, respectively. ν m p = 0.38 , ν m m = 0.4 , ν l p = ν l m = 0.3 . The calculated similitude ratio of the flexibility ratio is 0.99. Thus, the similarity of soil–culvert relative stiffness is verified.
Since the combined metro station model will be tested by both longitudinal and transverse excitations, it is important to ensure that the jacked culvert model has a similar axial deformation mode to the prototype one. Owing to the difference in tensile stiffness between jacked culvert rings and joints, longitudinal deformations of jacked culverts occur in terms of joint extensions. In this context, the tensile stiffnesses and bending stiffness of culvert rings and joints are compared in both prototype and model structures. As shown in Table 3 and Table 4, the relative tensile stiffness ratio and the relative bending stiffness ratio of a culvert ring to a joint in prototype jacked culverts match well with those in model jacked culverts.
The relative tensile stiffness between the culvert and the frame ( R L T ) can be calculated as follows:
R L T = E f A f E A e q , c
where E f and A f are, respectively, the elastic modulus and the area of the cross-section of the frame, and E A e q , c is the equivalent tensile stiffness of the jacked culvert, which could be expressed as follows [26]:
E A e q , c = E r A r 1 + E r A r n l r k j
where l r is the longitudinal length of each culvert ring. As shown in Table 5, the relative tensile stiffness R L T in the model system is close to that in the prototype system. Thus, the model structure designed in a simplified manner is validated.

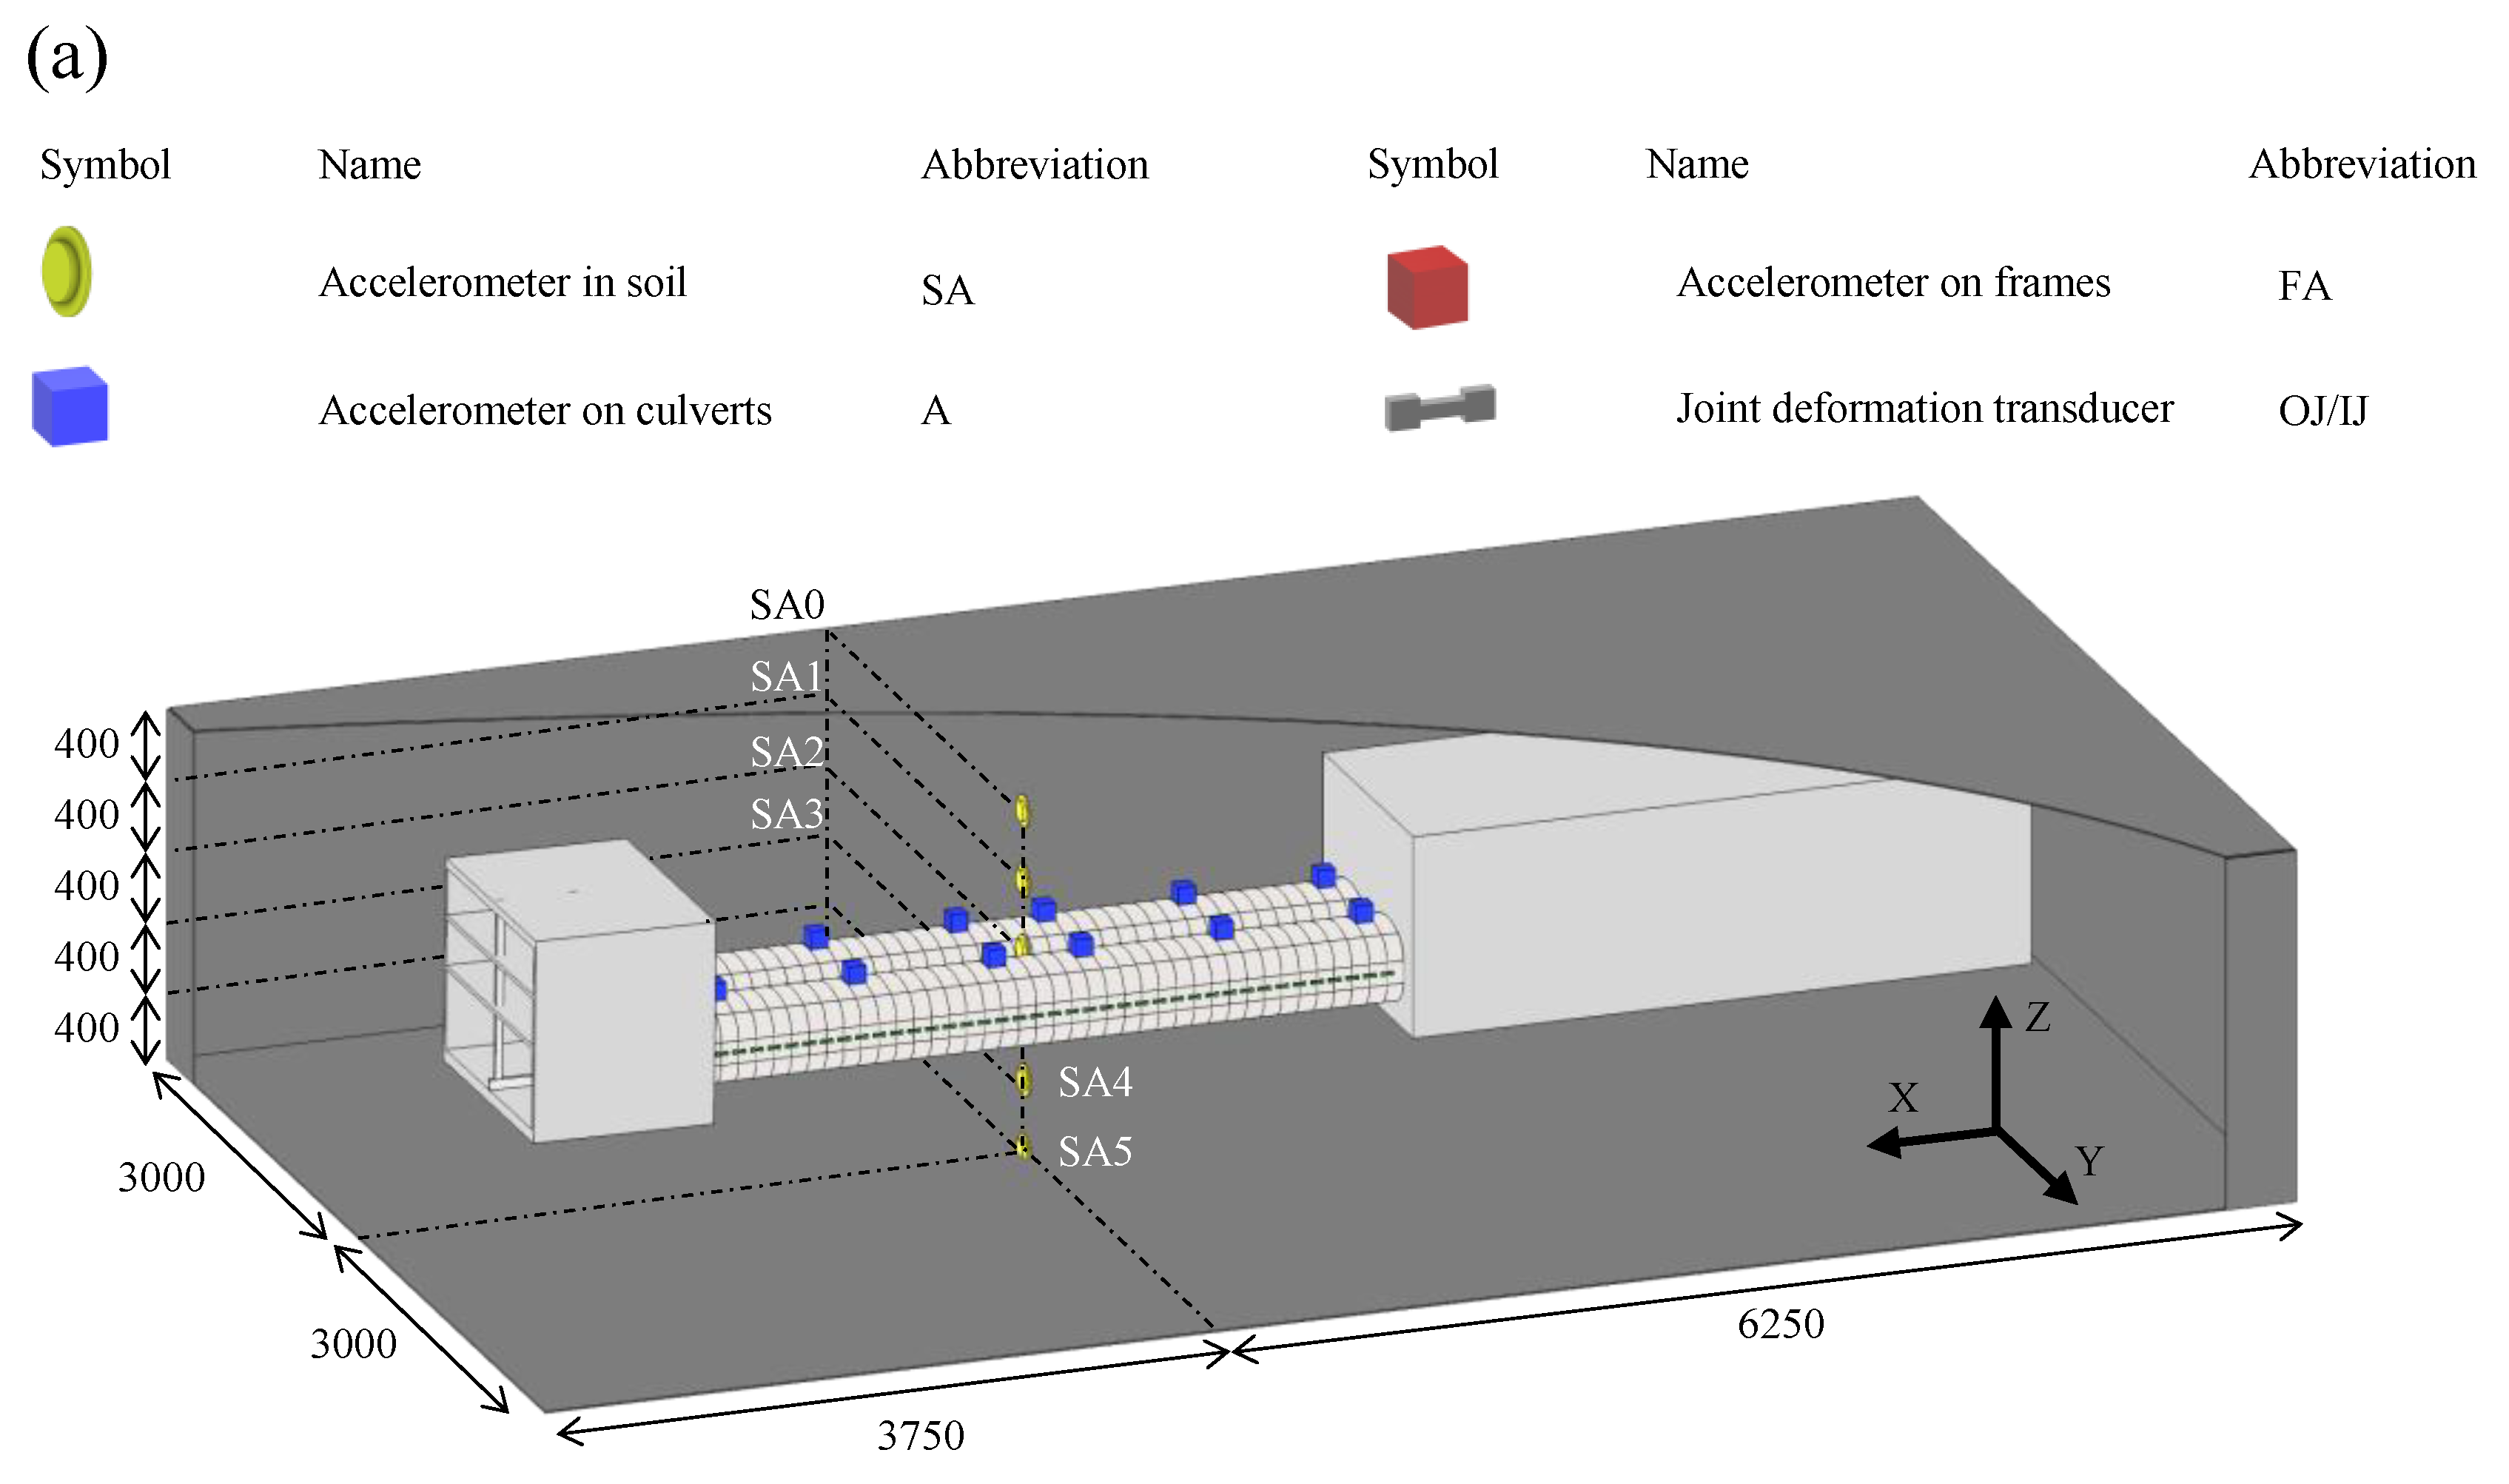
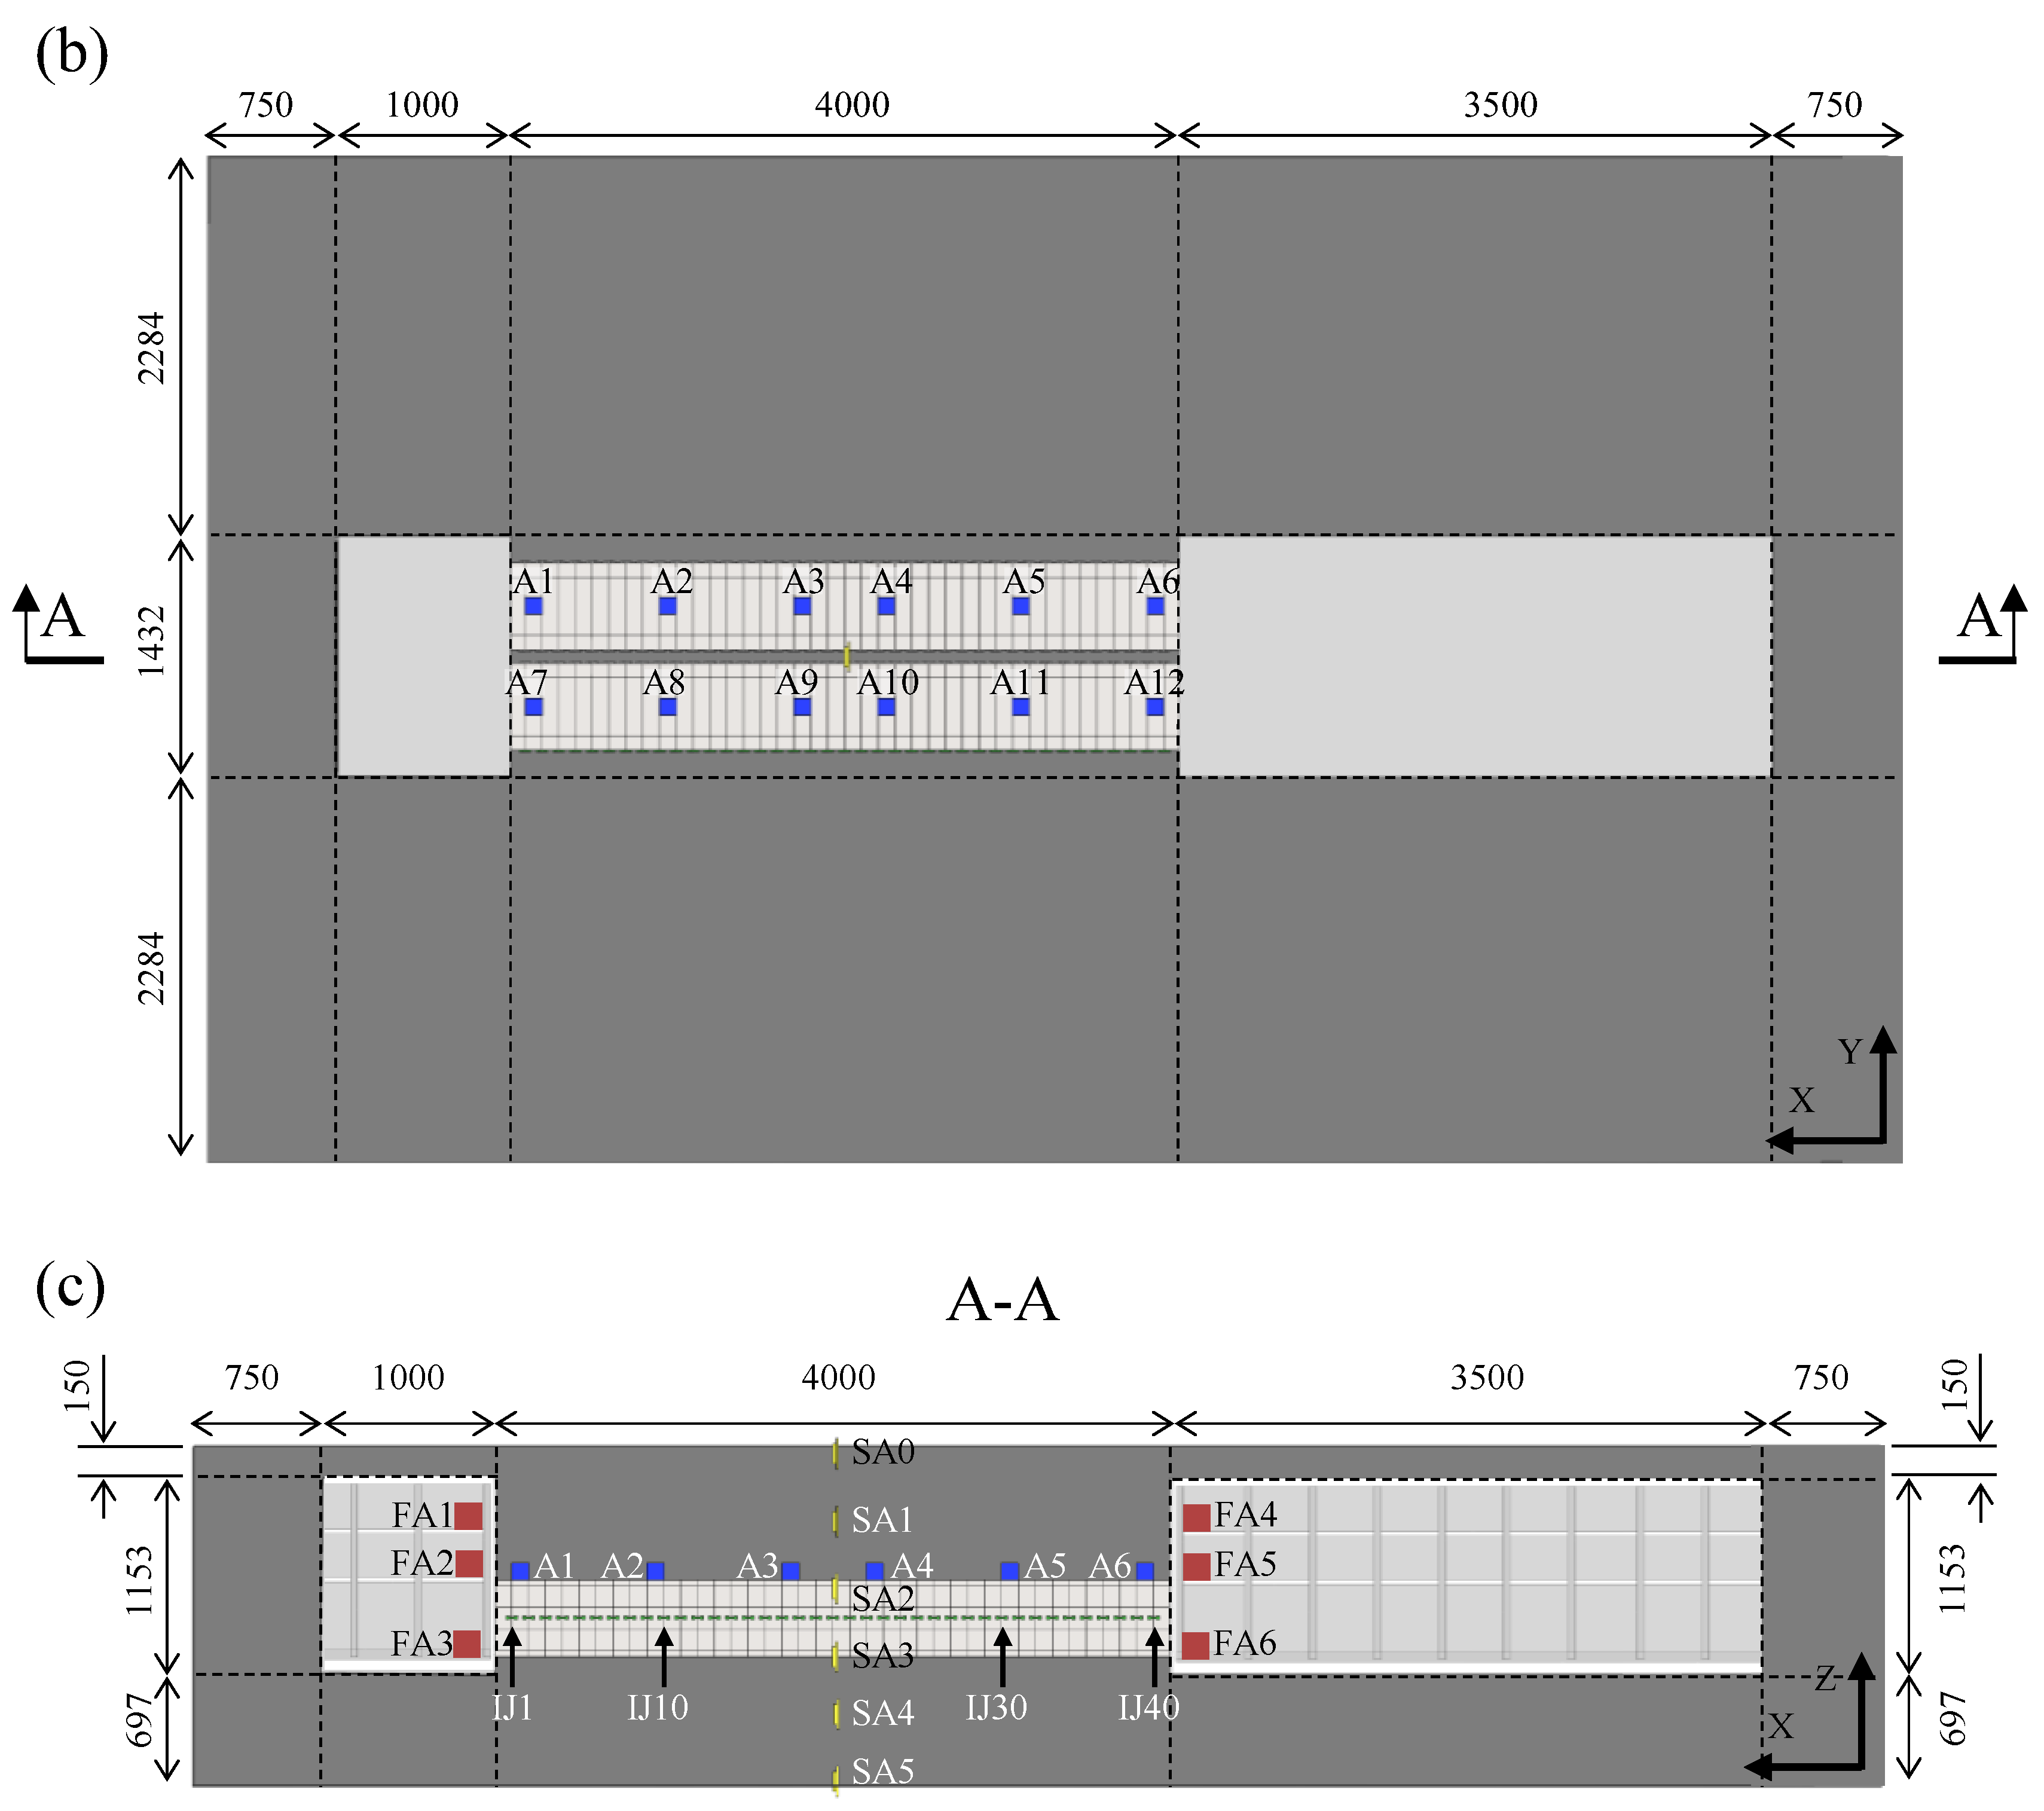
2.3. Instrumentation

As shown in Figure 4a, the culvert–frame model is placed at the central line of the model container. The two frame models named Part A and Part C are 1000 mm and 3500 mm long in the longitudinal direction, respectively. The jacked culvert model named Part B is 4000 mm long. The depth of the model soil is 2000 mm. The frame model and the culvert model are 150 mm and 740 mm beneath the ground surface of the model field, respectively. Since the input earthquake motions are along both longitudinal and transverse directions, each accelerometer introduced in the following represents two of the same accelerometers in both the longitudinal and transverse directions.
Six accelerometers (SA0–SA5) are installed between the twin jacked culverts to record the acceleration responses of the model soil. There are twelve accelerometers from A1 to A12 recording the acceleration responses of the model culverts. FA represents six accelerometers installed at every center of the bottom slab, where it meets the end wall in the model frames. FA1, FA2, and FA3 record the acceleration responses of Part A, while FA4, FA5, and FA6 record the acceleration responses of Part C. One hundred and sixty joint deformation transducers are installed to record joint deformation during tests. Every culvert joint has two joint deformation transducers installed on both sides of the middle height. Figure 4 shows the position of each transducer.

2.4. Earthquake Motions and Testing Cases

The input earthquake motions are imposed in both the longitudinal direction X and the transverse direction Y of the culvert–frame model. For a single testing case, the input earthquake motion is either in the longitudinal direction or the transverse direction. White noise (WN) and synthetic earthquake motions (SEMs) are selected as the input motions of the shaking table tests. White noise motions are adopted to investigate the dynamic characteristics of the model system. Synthetic earthquake motions are representative of the prototype construction site. The spectrum of SEMs clearly shows a peak value in T = 0.11 s, which is close to the natural vibration period of the site (T0 = 0.128 s). A series of synthetic earthquake motions with varying intensities (0.2 g, 0.4 g, 0.6 g, 0.8 g, and 1.0 g) are applied to the model for studying the nonlinearity of the model system. The accelerogram and Fourier spectrum of the synthetic earthquake motion with a peak acceleration of 0.2 g are illustrated in Figure 5. Details of each testing case are summarized in Table 6.

3. Comparisons of Soil Acceleration

SA0, SA1, SA2, SA3, SA4, and SA5 are at the same horizontal position in the model soil. Meanwhile, the six accelerometers are 400 mm apart from the adjacent ones in the vertical direction. Acceleration amplification spectra and peak acceleration amplification factors of the six accelerometers are presented to discuss the differences in the model soil between longitudinal and transverse cases.

3.1. Acceleration Amplification Spectra

Figure 6 plots the acceleration amplification spectra of SA0 during the white noise motions in the longitudinal and transverse directions. The acceleration amplification spectrum is calculated by the following equation [20]:
A X / i n p u t = F X ω F i n p u t ω
where A X / i n p u t is the acceleration amplification spectrum of the specific accelerometer X , i.e., SA1 or SA2 relative to the input earthquake motion at the frequency of ω ; F X ω and F i n p u t ω are Fourier amplitudes of the specific accelerometer X and the input earthquake motion at the frequency of ω .
The acceleration amplification spectrum of the ground surface in the uniform field with no underground structure (hereinafter called the ‘free field’) clearly shows several peaks that correspond to the field’s modes of vibration [27]. The second mode is three times the frequency of the first mode, and the third mode is five times the frequency of the first mode. Besides the model soil, however, the model system in this study contains two frame structures and twin jacked culverts, which results in a different distribution of dominant frequencies. Since the culvert–frame underground structure has different structural stiffnesses in the longitudinal and transverse directions, the acceleration amplification spectra in the two directions show significant discrepancies. SA0 was installed at the ground surface and the center of Part B. The acceleration amplification spectra of SA0 present a clear peak amplitude corresponding to the frequency of 7.8 Hz, in both the longitudinal and transverse excitation directions. At the frequency of 7.8 Hz, the amplification spectrum of the transverse case (13.4) has a larger amplitude than that of the longitudinal case (7.9). In the higher frequency range from 18 Hz to 24 Hz, the amplitude of SA0 in the transverse excitation direction is larger than that in the longitudinal excitation direction. The results show the consistency of the low-frequency components and the variety of the high-frequency components.

3.2. Peak Acceleration Amplification Factors

Figure 7 compares the peak acceleration amplification factors as a function of depth in longitudinal cases and transverse cases, for all SEM seismic excitations. Peak accelerations recorded by SA0, SA1, SA2, SA3, and SA4 are normalized by the peak acceleration of SA5. Most soil accelerometers in longitudinal cases are in good agreement with those in transverse cases in terms of the amplification factor. However, different structural stiffnesses of the culvert–frame combined structure in the longitudinal and transverse directions result in different soil–structure interactions. Owing to the different soil–structure interactions, there are some differences between seismic wave propagations in the longitudinal direction and the transverse direction. Peak acceleration amplification factors of SA0 and SA3 in transverse cases are larger than those in longitudinal cases. With the input earthquake motion intensity increasing, amplification factors in both longitudinal cases and transverse cases tend to decrease due to the soil nonlinearity.
Figure 8 demonstrates the acceleration amplification factors of SA0 in a series of SEM cases. SA0 in the transverse case exhibits a larger peak acceleration amplification factor than that in the longitudinal case with the same intensity of the input earthquake motion. The above results clearly show the influence of soil nonlinearity on peak acceleration. For a specific SEM excitation, the transverse earthquake motion results in larger acceleration responses of the model soil than the longitudinal one.

4. Comparisons of Box Frame Acceleration

Part A, Part B, and Part C differ in stiffness and quality, which leads to different seismic responses for each. Acceleration responses of the frames are discussed in the following to present the differences in structural dynamic characteristics when, respectively, conducting longitudinal excitations and transverse excitations.

4.1. Peak Acceleration Amplification Factors of Frames

Figure 9 presents peak acceleration amplification factors of accelerometers installed on frame structures relative to input earthquake motions in longitudinal (Figure 9a) and transverse cases (Figure 9b). The intensities of input earthquake motions vary from 0.2 g to 1.0 g. In longitudinal cases, peak acceleration amplification factors of Part A and Part C decrease with the increase in input earthquake motion intensity. For Part C, accelerometers on different floors have close amplification factors. The maximum differences in peak acceleration amplification factors between the three floors of Part C are between 0.03 and 0.13. In transverse cases, peak acceleration amplification factors show the same decreasing tendency as those in longitudinal cases, with input earthquake motion intensity increasing. Meanwhile, the amplification factor differences for transverse cases are significantly bigger than those for the longitudinal cases. The maximum differences in peak acceleration amplification factors between the three floors of Part C are between 0.12 and 0.34. The above results show that peak acceleration amplification factors of frame structures decrease with input earthquake motion intensity increasing for both longitudinal cases and transverse cases. Frame structures move more consistently in longitudinal cases compared with those in transverse cases.

4.2. Acceleration Fourier Spectra of Frames

Acceleration Fourier spectra of frames in the SEM-0.2g case and the SEM-1.0g case are shown in Figure 10a and Figure 10b, respectively. Red curves refer to Fourier spectra in longitudinal cases, while black curves refer to Fourier spectra in transverse cases. For both longitudinal cases and transverse cases, accelerometers with shallower burial depths have smaller Fourier spectra amplitudes in the frequency range of more than 20 Hz. Fourier spectra amplitudes in longitudinal cases are larger than those in transverse cases, especially in the frequency range from 8 Hz to 12 Hz. The results clearly show the difference in Fourier spectra of frame structures due to the directions of the input earthquake motions.

5. Comparisons of Culvert Acceleration

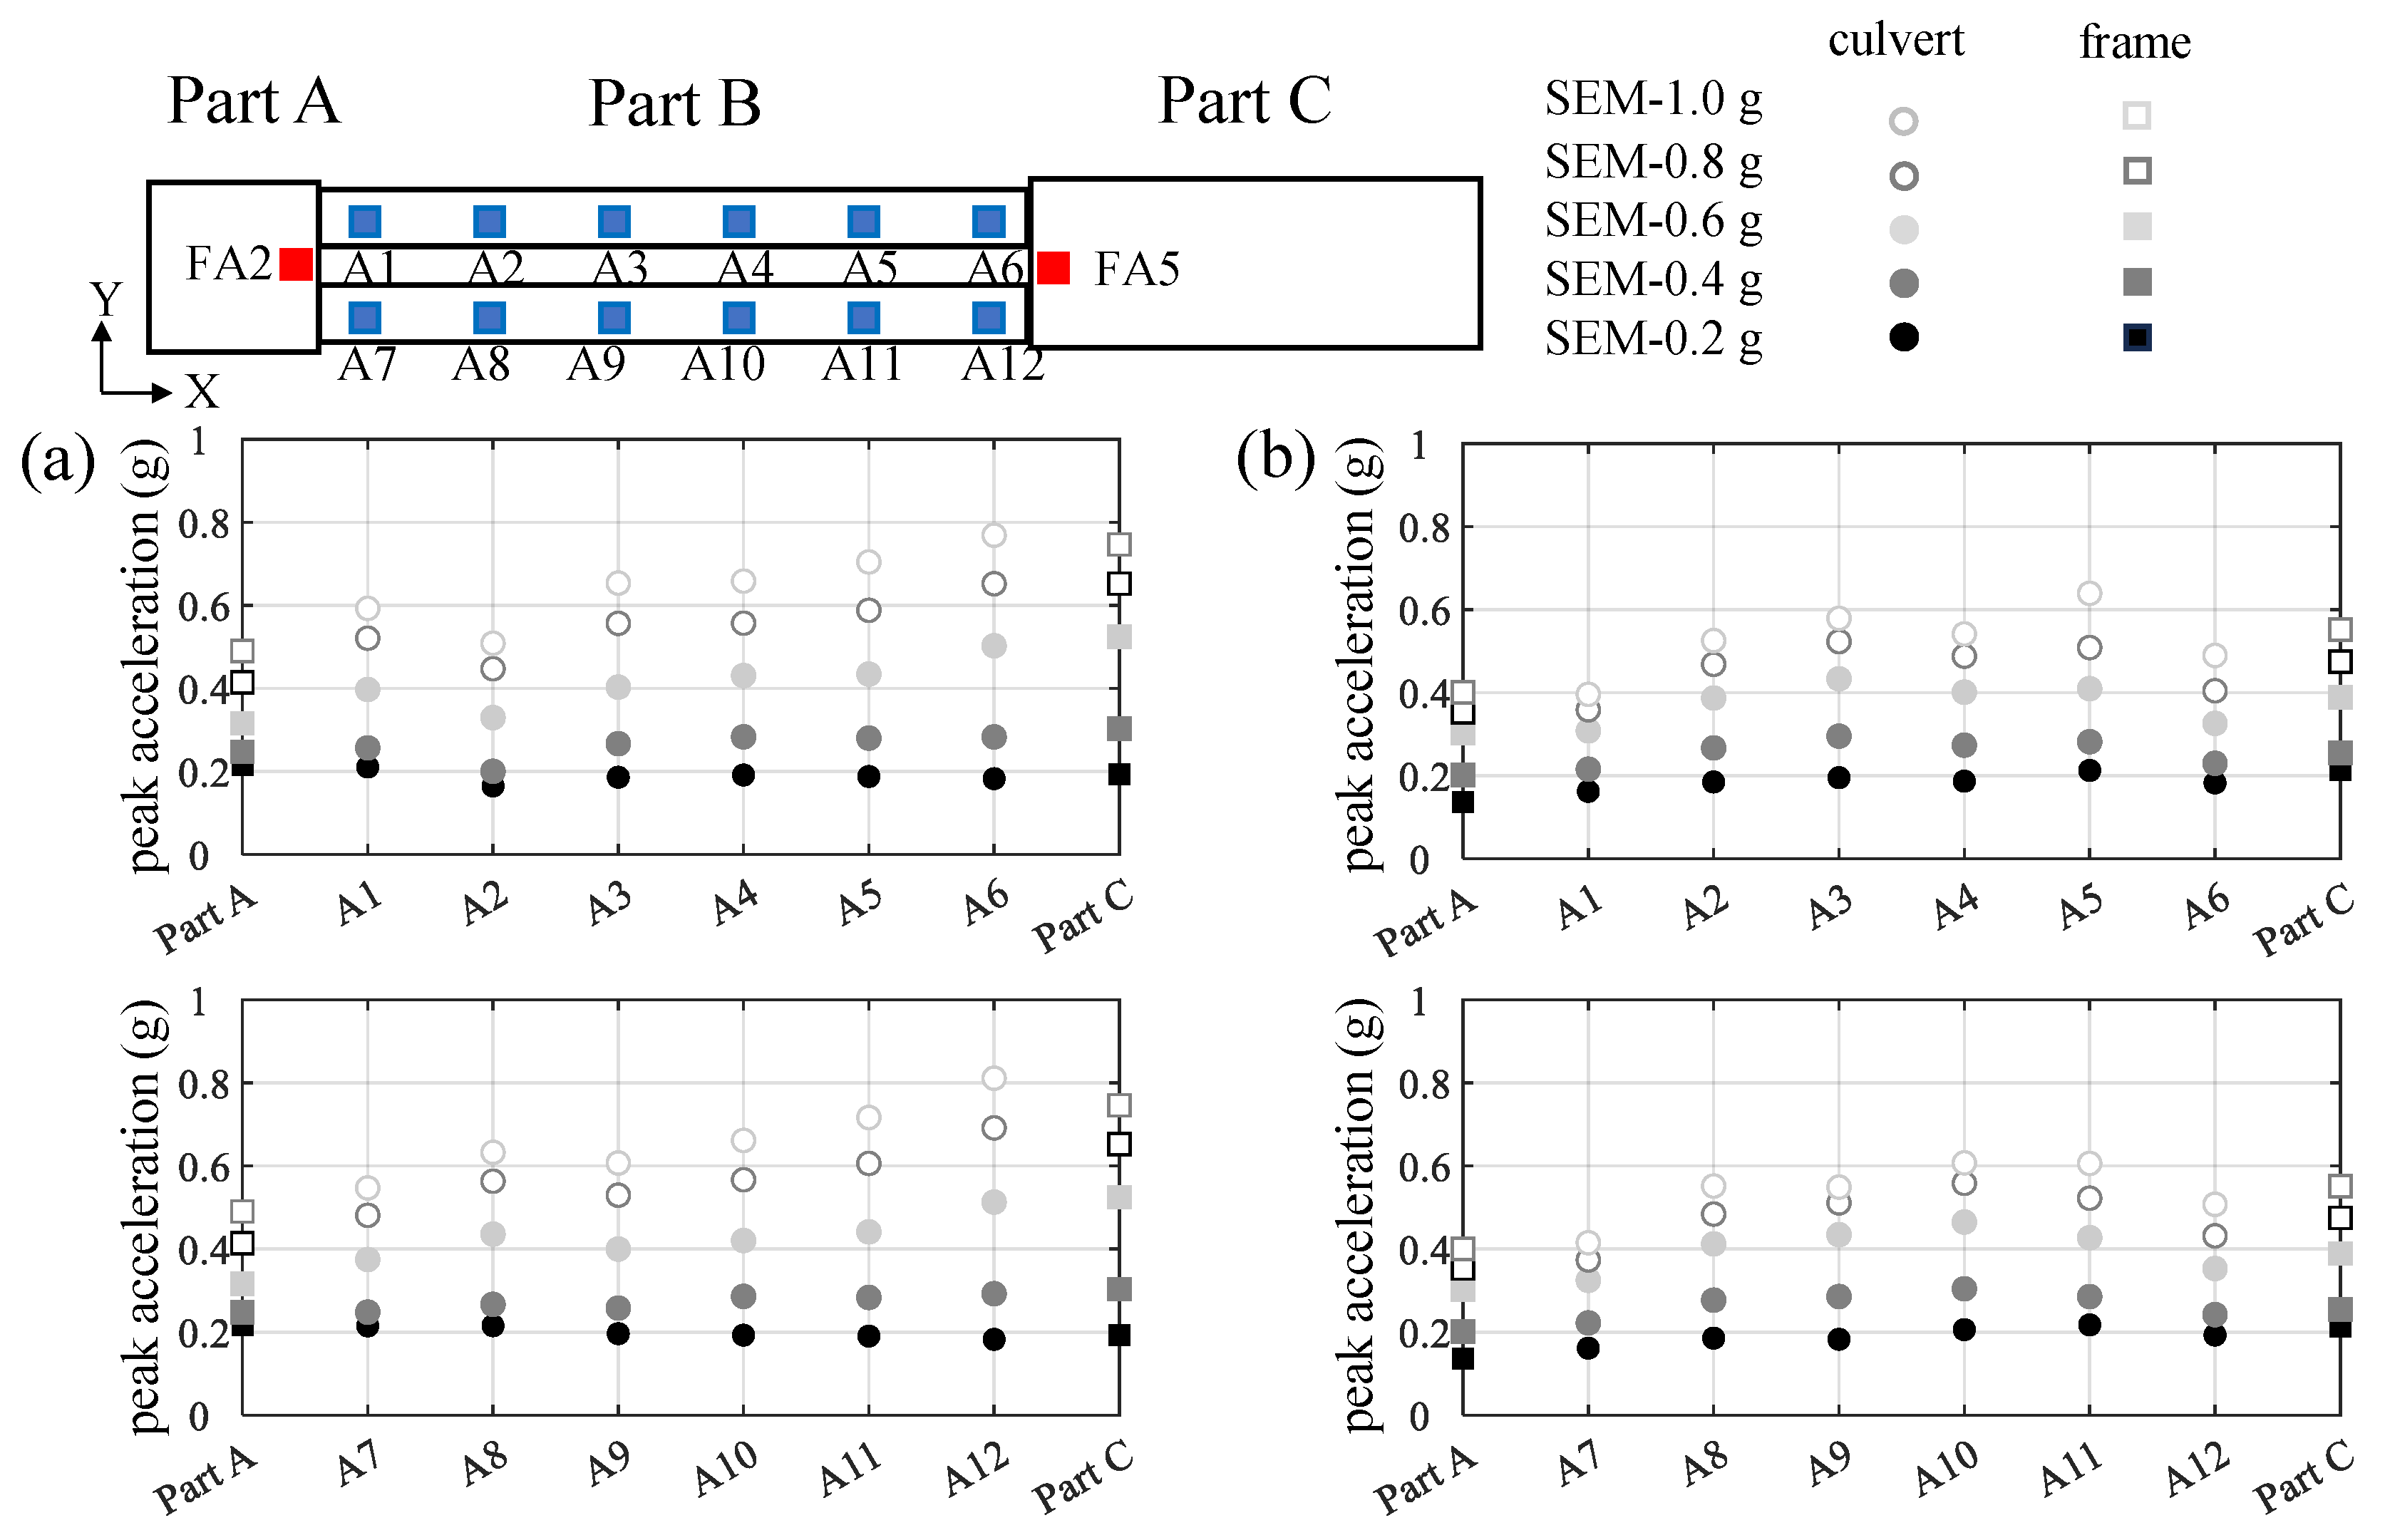
5.1. Peak Acceleration of Culverts

Peak accelerations of culverts are shown in Figure 11, where peak accelerations of accelerometers in frames with similar burial depths to culverts are also illustrated. For longitudinal earthquake motions (Figure 11a), peak accelerations of culverts increase as the distance from Part C decreases. Additionally, peak accelerations of FA5 are larger than those of FA2. Given that the peak accelerations of FA2 and FA5 are comparable to those of A1 and A6, respectively, the interaction between frames and culverts is a plausible reason for the culvert peak acceleration difference in longitudinal cases. For transverse earthquake motions (Figure 11b), the peak accelerations in the middle of the culverts are greater than those at the ends, and peak accelerations of culverts are lower overall than those in the longitudinal cases. Meanwhile, the peak acceleration differences between FA2 and FA5 in transverse cases are much smaller than those in longitudinal cases.

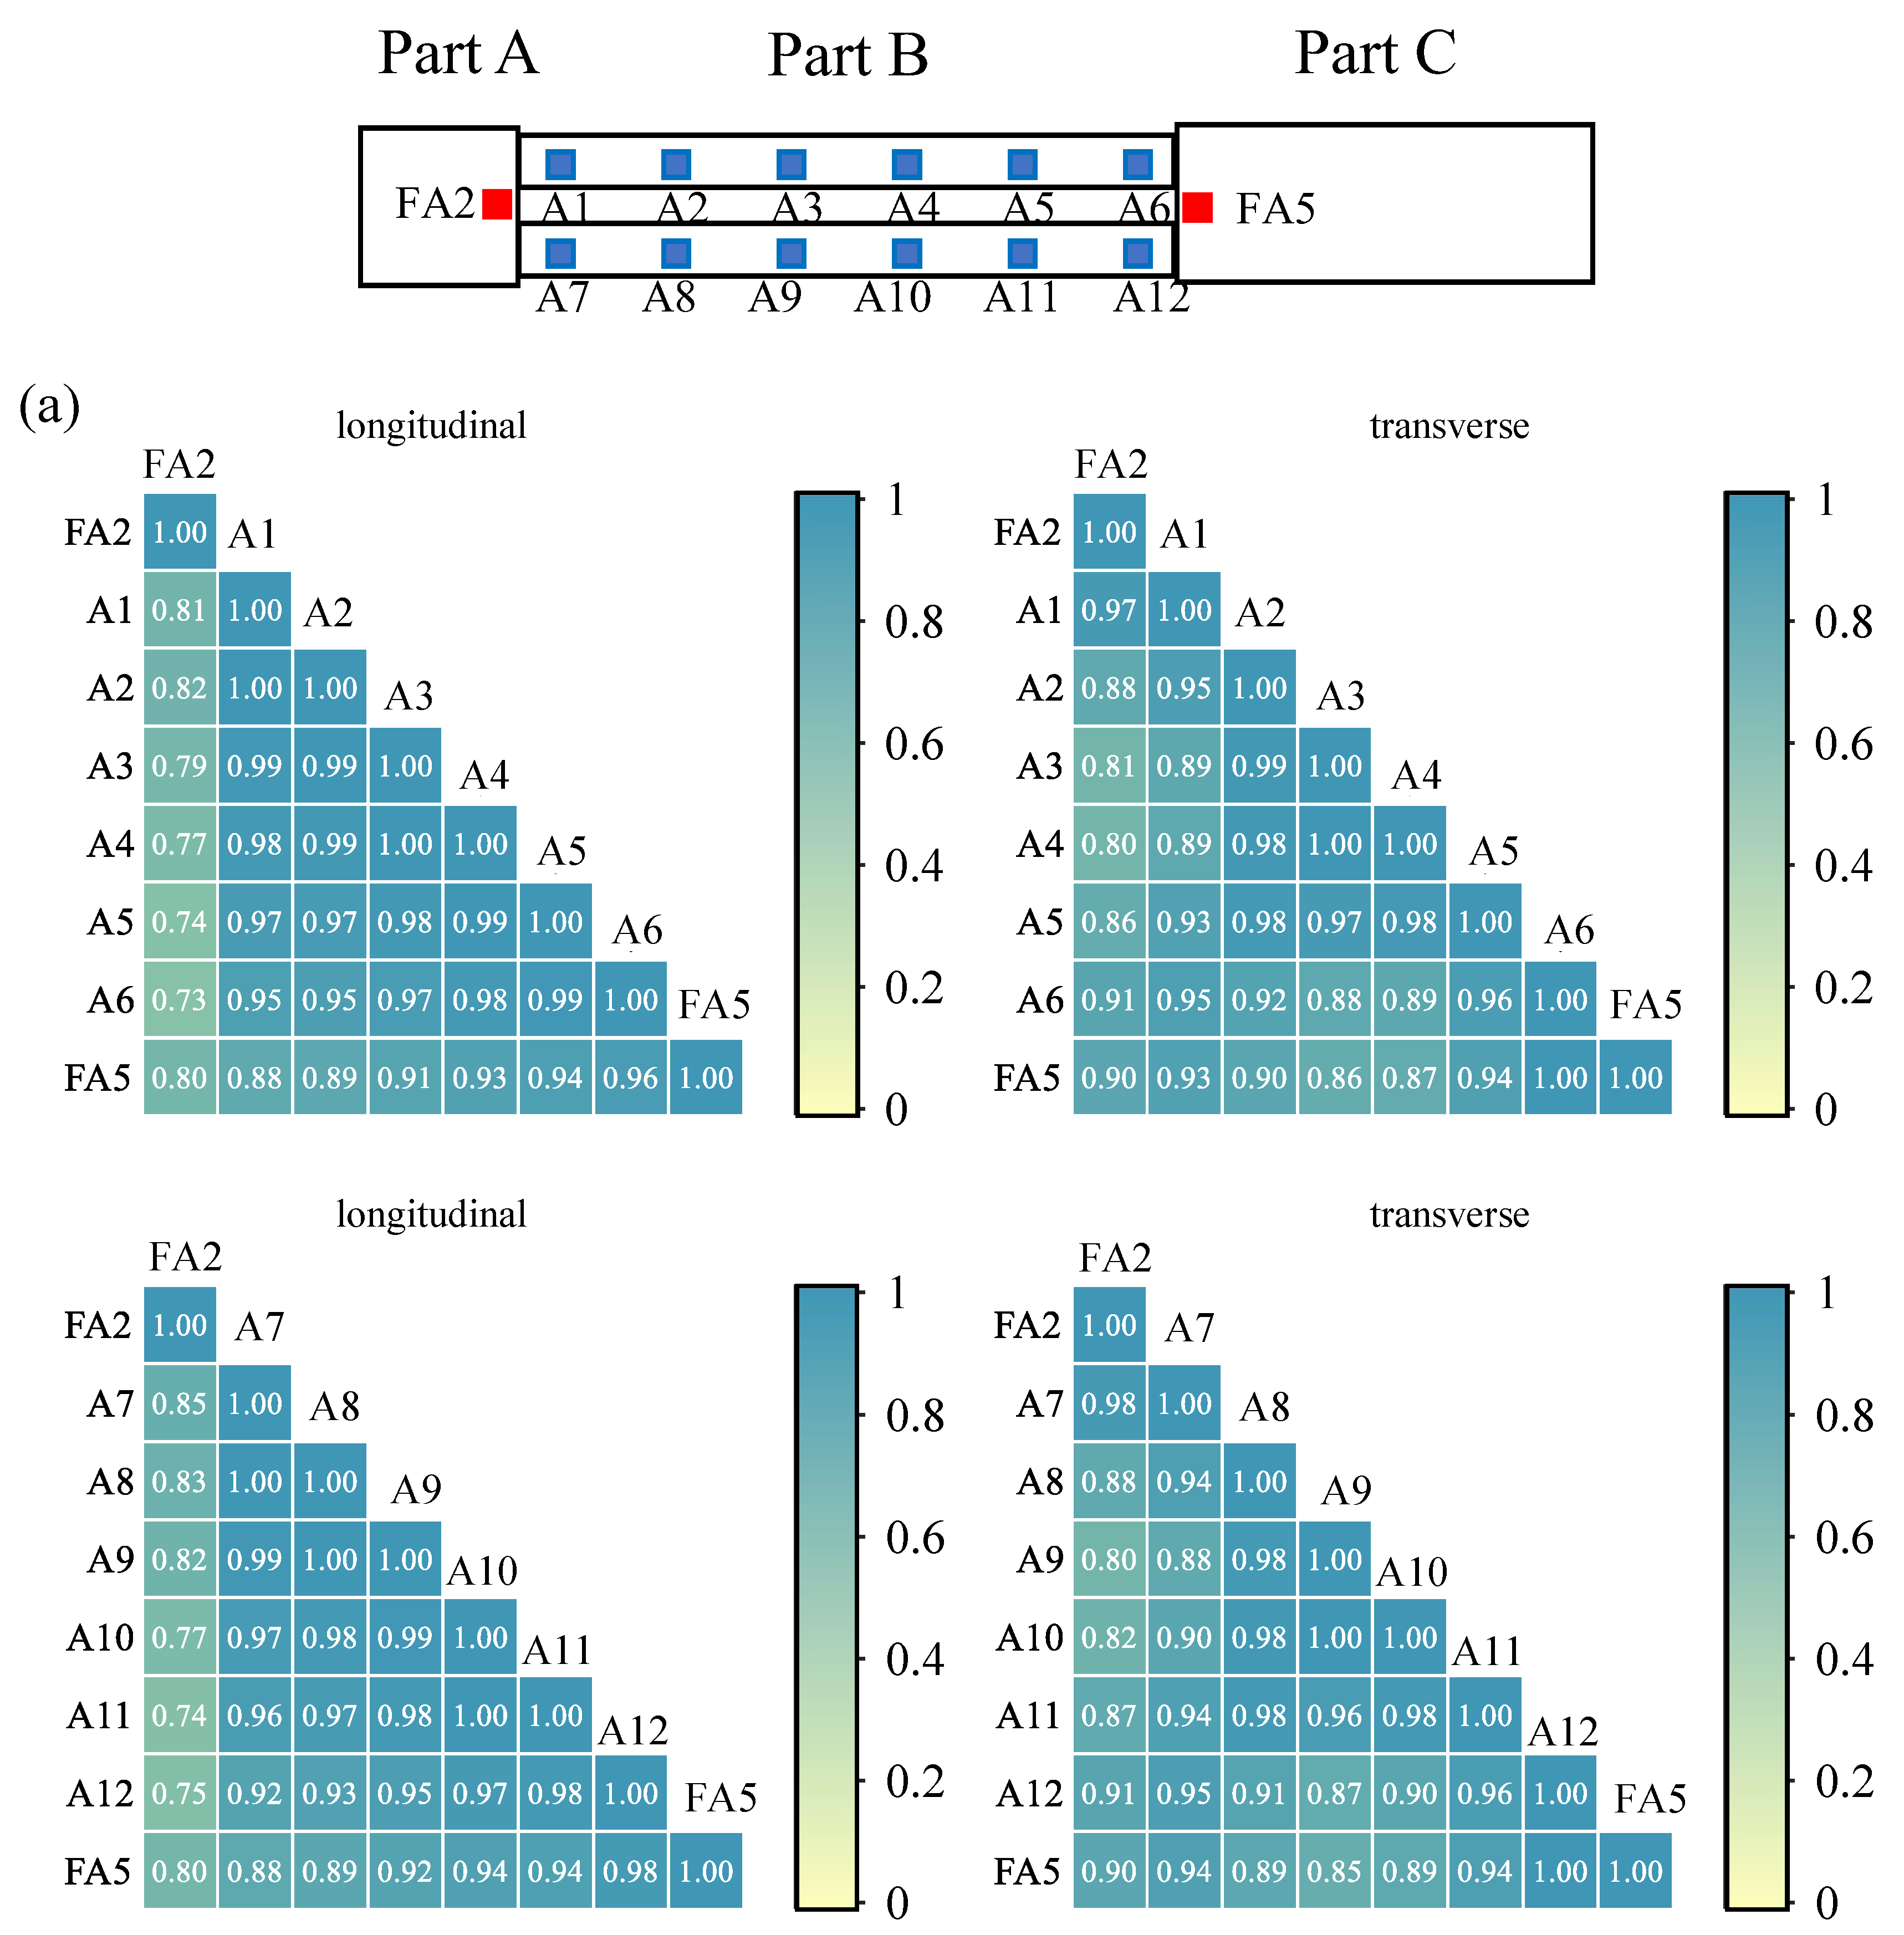
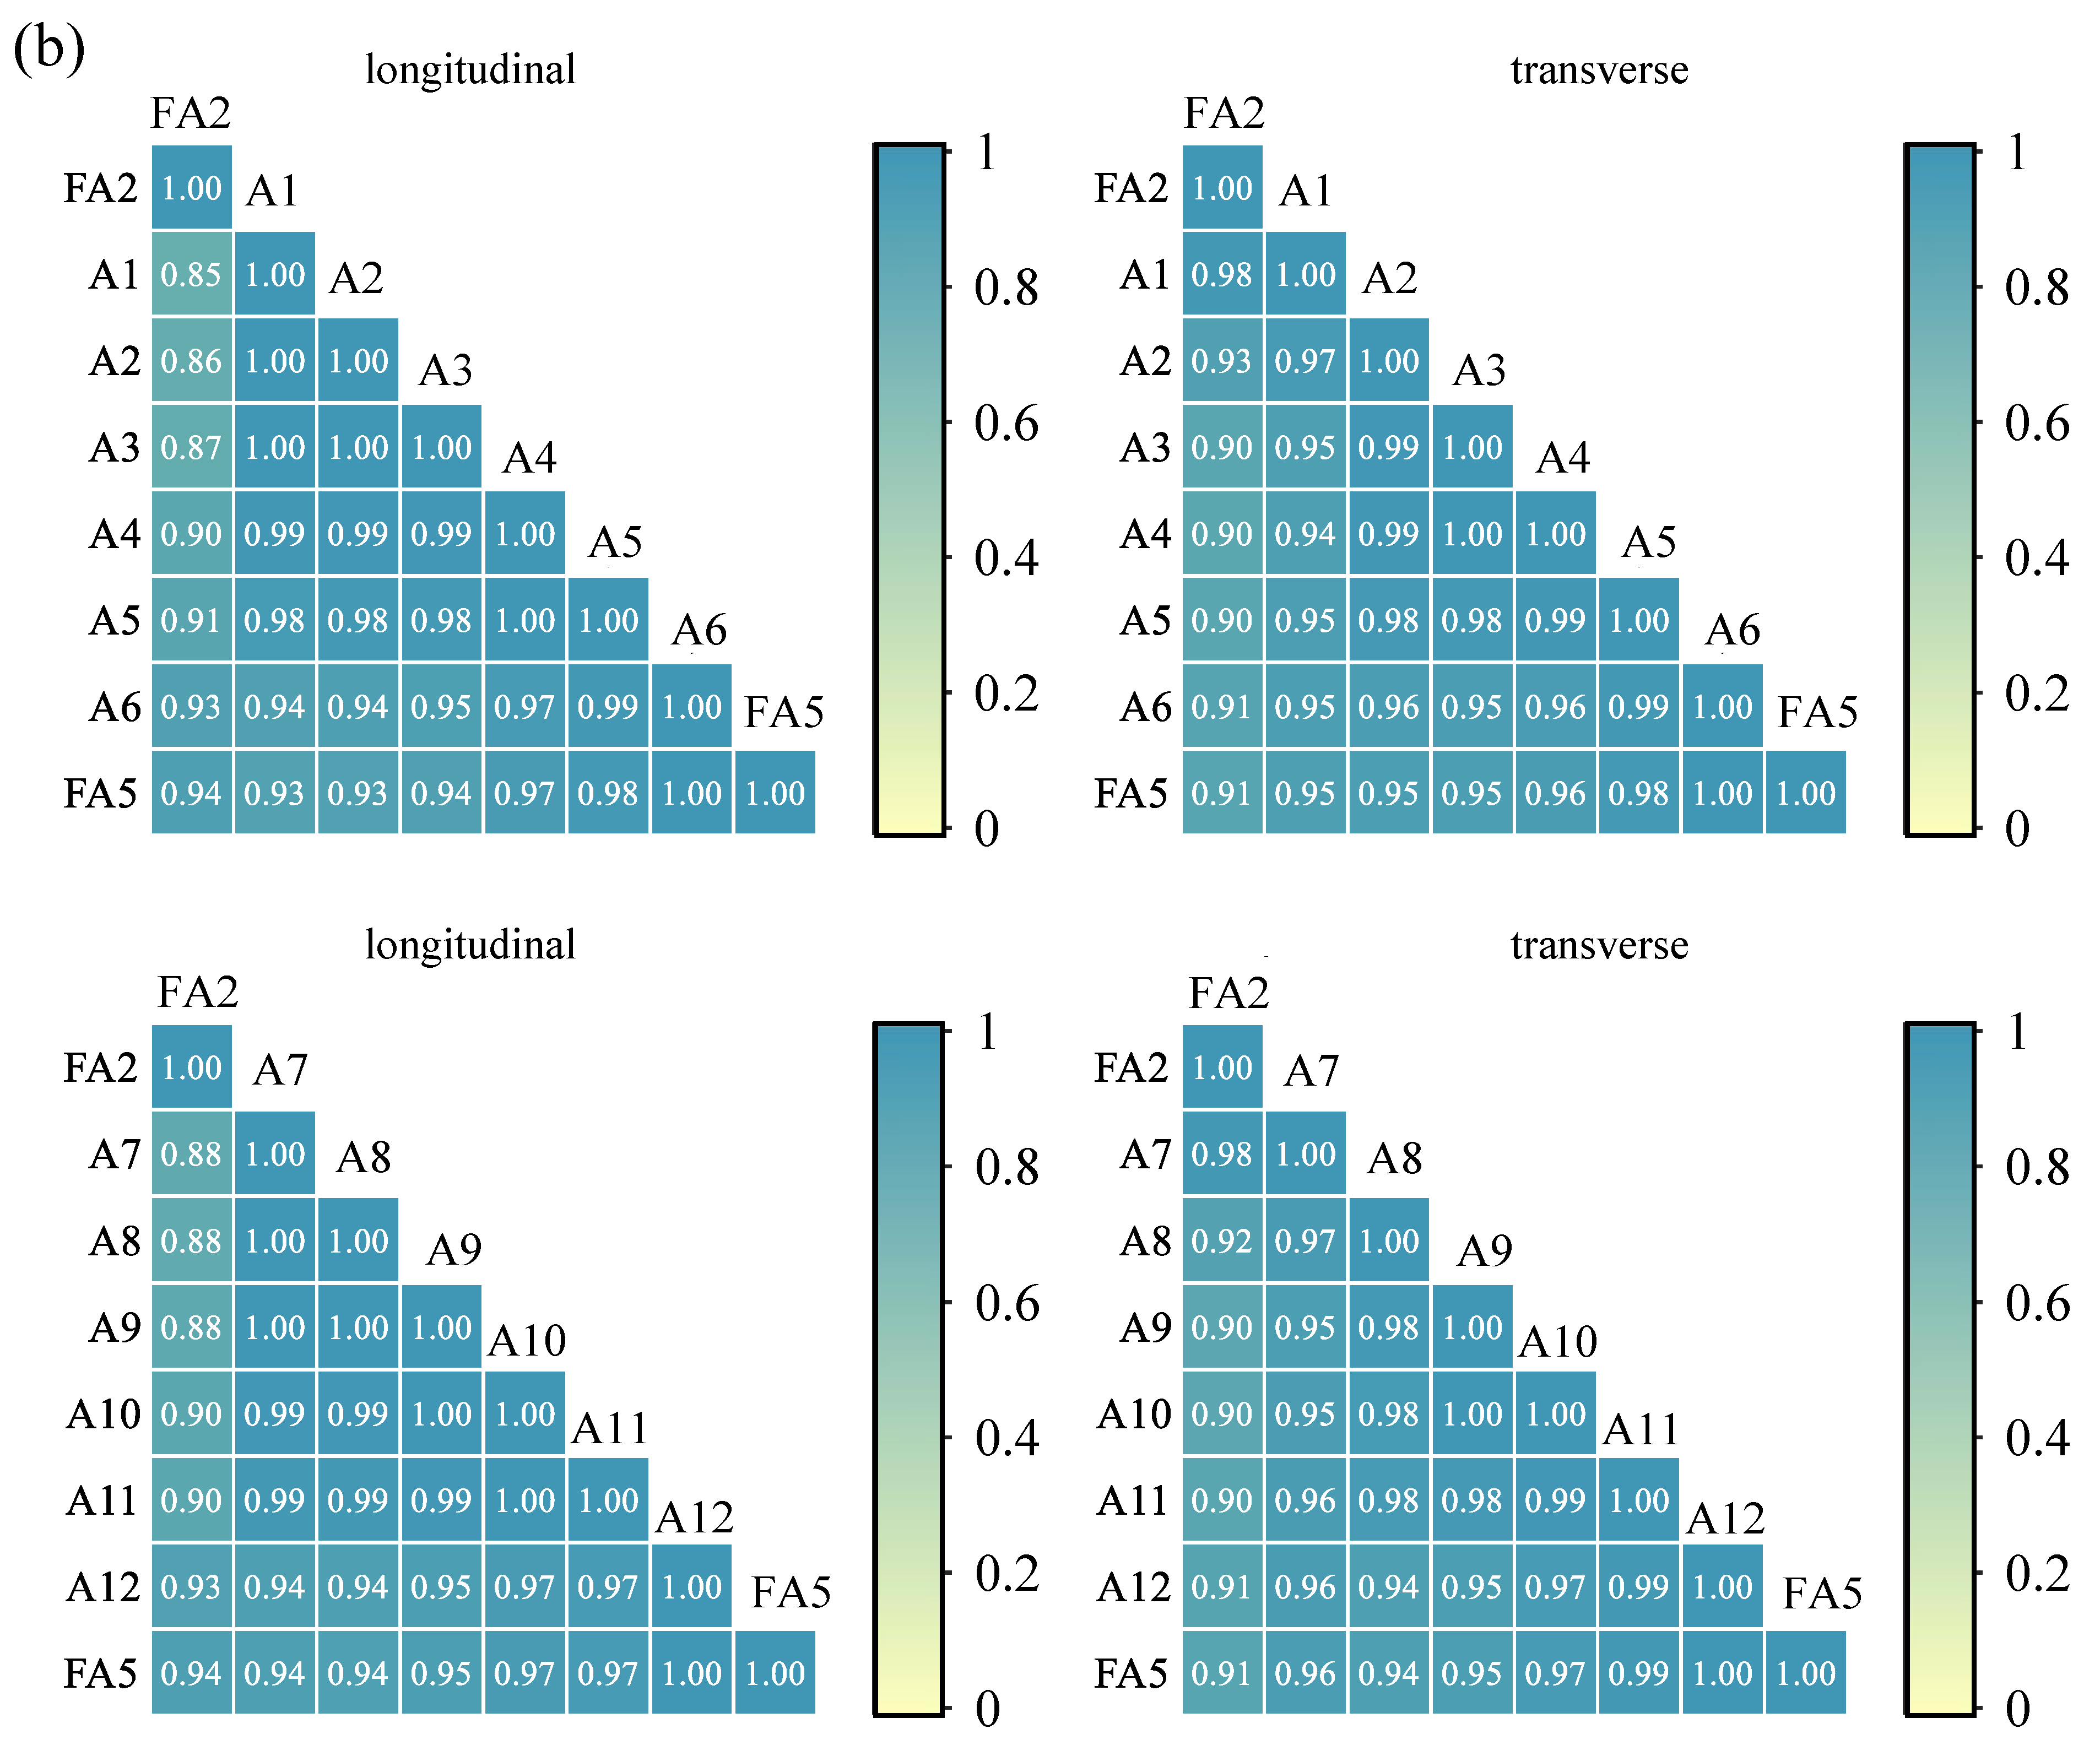
5.2. Acceleration Correlation Coefficient of Culverts

Although Figure 11 clearly demonstrates the differences in culvert acceleration responses between longitudinal cases and transverse cases, only peak accelerations are considered in the comparison. To statistically quantify the consistency of culvert acceleration responses, correlation coefficients of culvert accelerations recorded in both longitudinal cases and transverse cases are shown in Figure 12. The correlation coefficients are calculated as follows [20]:
r A m , A n = C o v A m , A n D A m D A n
where A m and A n are the accelerograms of accelerometers for analysis; r A m , A n is the correlation coefficient of A m and A n ; C o v A m , A n is the covariance of A m and A n ; D A m and D A n are the variances of A m and A n , respectively.
All the elements in the two matrices are larger than 0.72, which means that different parts of culverts have similar acceleration responses because underground structures are mainly dominated by the movements of the surrounding soil. However, noticeable differences between correlation coefficients in longitudinal cases and transverse cases could be found in the five matrices. In Figure 11a, for longitudinal cases, the elements less than 0.86 only appear in the first column, which refers to the correlation coefficients between FA2 and the other accelerometers. For transverse cases in Figure 11a, the correlation coefficients between the middle of culverts and ends of culverts are much smaller than other elements. The correlation coefficients of culvert ends and frames are larger than 0.92, meaning that culvert–frame interactions significantly influence the acceleration responses of culvert ends. Thus, the weakening of culvert–frame interactions in the middle of culverts compared with those in the ends of culverts is believed to be the reason for correlation coefficient differences in culverts. For both longitudinal and transverse cases with acceleration amplitudes of 1.0 g in Figure 11b, the acceleration correlation coefficients are smaller than those in SEM-0.2g. Accelerograms of culverts and frames tend to be consistent under earthquake motions with higher intensities.

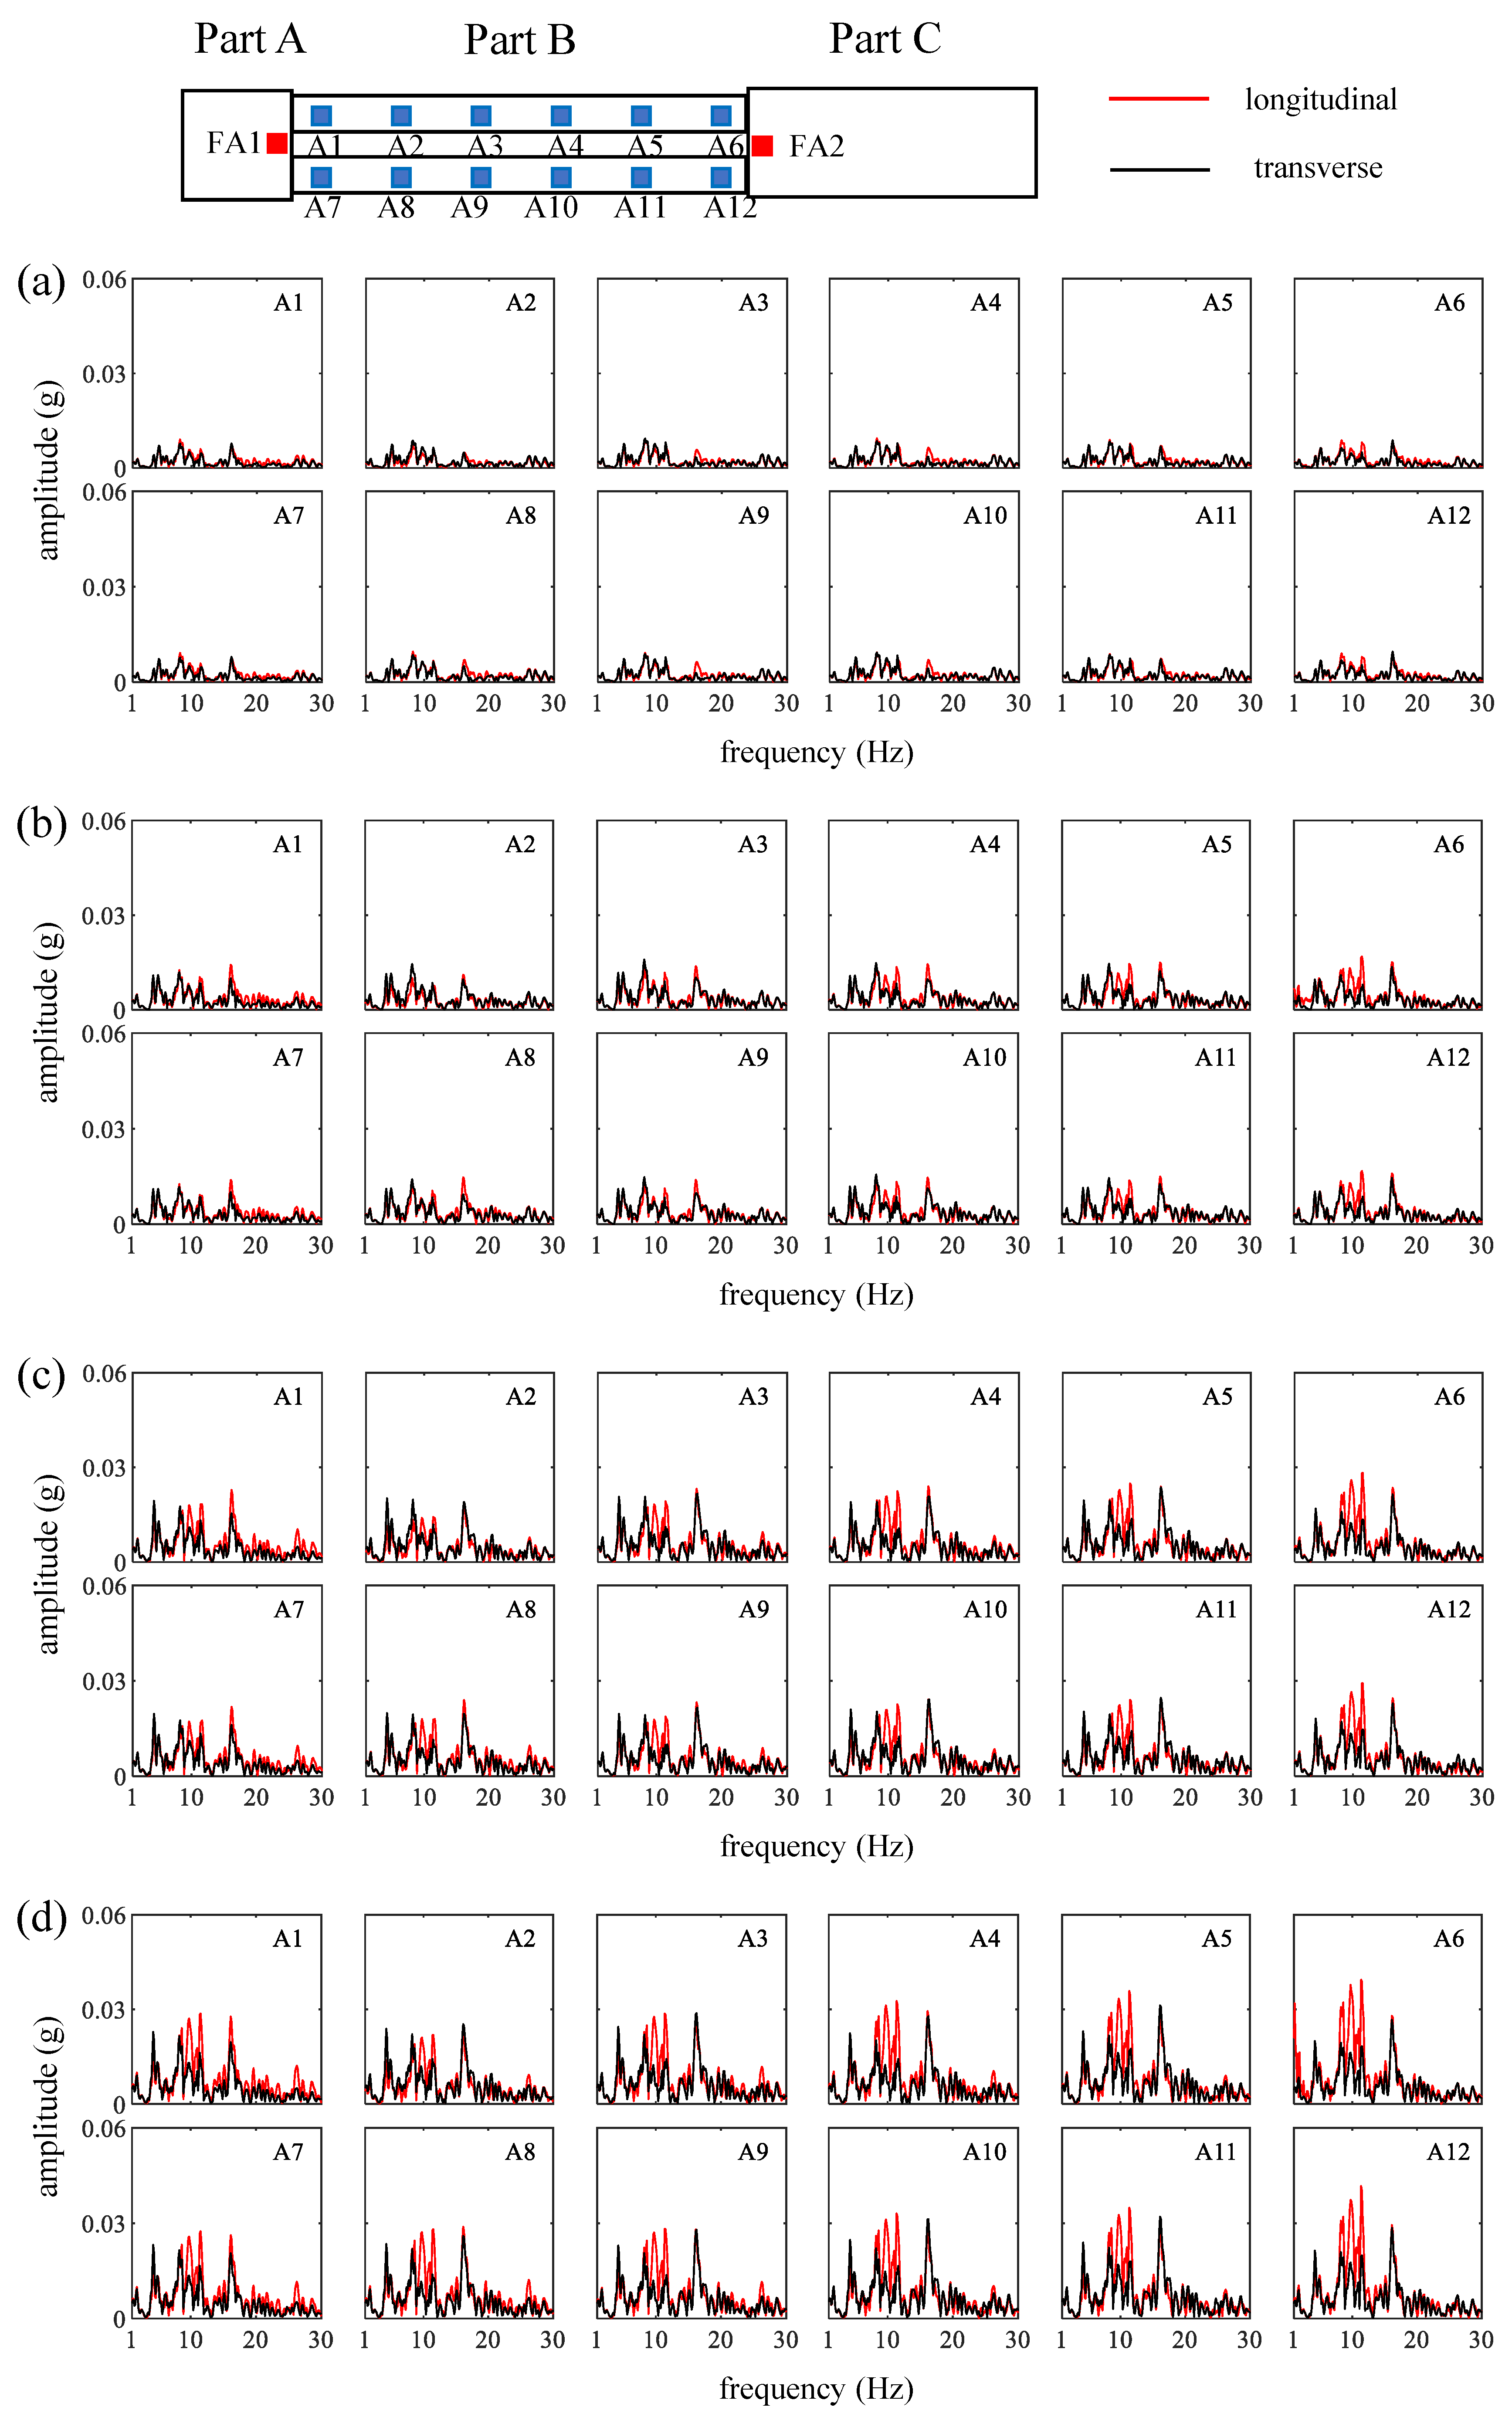
5.3. Acceleration Fourier Spectra of Culverts

The acceleration Fourier spectra of culverts are illustrated in Figure 13. For SEM-0.2g and SEM-0.4g, acceleration Fourier spectra of culverts in both longitudinal and transverse cases are similar to the Fourier spectra of the input earthquake motions. However, from A1 to A6 (or A7 to A12), the phenomenon that the spectrum amplitudes in longitudinal cases are larger from 8 Hz to 10 Hz than those in transverse cases becomes clear. For SEM-0.6g, SEM-0.8g, and SEM-1.0g, a noticeable amplification of the spectrum amplitudes from 8 Hz to 10 Hz could be observed for the longitudinal cases relative to the transverse cases. For longitudinal cases, the spectrum amplitudes at 8 Hz to 10 Hz significantly increase from A1 to A6 (or A7 to A12).

6. Culvert Joint Deformation

The above comparisons clearly show the difference in culvert acceleration responses for longitudinal cases and transverse cases. Moreover, the movements of different parts of culverts are discrepant in testing cases. In previous studies, tunnels have always been modeled by continuous tubes [14,17,18,19,28,29,30,31]. However, owing to the significant difference in the tensile stiffness between culvert rings and culvert joints, the longitudinal deformation of jacked culverts mainly manifests through deformations of culvert joints. The culvert model in this study, consisting of modeled rings and modeled bolts, makes it possible to measure the culvert joint deformations in shaking table tests. As depicted in Figure 4, 160 joint deformation transducers are installed on both sides of the twin culverts. Every culvert joint has two deformation transducers on both sides. Both tension and compression of the culvert ring could be recorded by the transducers.
Maximums of culvert joint deformations in longitudinal and transverse cases of SEM-0.2g are illustrated in Figure 14. For both longitudinal and transverse cases, the distribution of the joint deformations is spiky, meaning that several joints have much larger deformations than the surrounding ones. As depicted in Figure 14a, OJ33 in longitudinal SEM-0.2g has joint deformations of 0.0292 mm, while the average of OJ1-OJ40 at this moment is 0.0028 mm; OJ46 in transverse SEM-0.2g has joint deformations of 0.0388 mm, while the average of OJ1-OJ40 at this moment is 0.0022 mm.
However, significant differences between culvert joint deformations of longitudinal and transverse cases could be noticed. (a) The averages of culvert joint deformations in the longitudinal case are generally larger than those in the transverse case. Average joint deformations of OJ1-OJ40, IJ1-IJ40, IJ41-IJ80, and OJ41-OJ80 of the longitudinal case are, respectively, 0.0028 mm, 0.0033 mm, 0.0028 mm, and 0.0036 mm. Meanwhile, those of the longitudinal case are, respectively, 0.0013 mm, 0.0019 mm, 0.0007 mm, and 0.0022 mm. (b) For the longitudinal case, the spiky deformations have a similar probability of occurring at both the middle and ends of culverts, while the spiky deformations tend to appear at the ends of culverts for the transverse case. According to Zhang’s research [20], such joint deformations depend on the discrepant responses of the culvert part and the frame part. As depicted in Figure 9, two frames at both ends of culverts have larger differences in longitudinal cases than transverse cases, which could explain the joint deformation difference. Since the connections between culverts and frames are rigid, the discrepant responses of culverts and frames lead to joint deformation. The frame caused a greater impact on joints at the culvert end than on those at the middle of the culverts. Thus, the joints at culvert ends have greater deformations.

7. Conclusions

A series of large-scale shaking table tests were conducted to study the seismic performance of the culvert–frame combined underground structure under longitudinal and transverse earthquake excitations. Owing to the culvert–frame interaction and the soil–structure interaction, discrepant responses of the model structure and model soil under the longitudinal and transverse earthquake excitations were detected. The following conclusions are drawn.
(1)
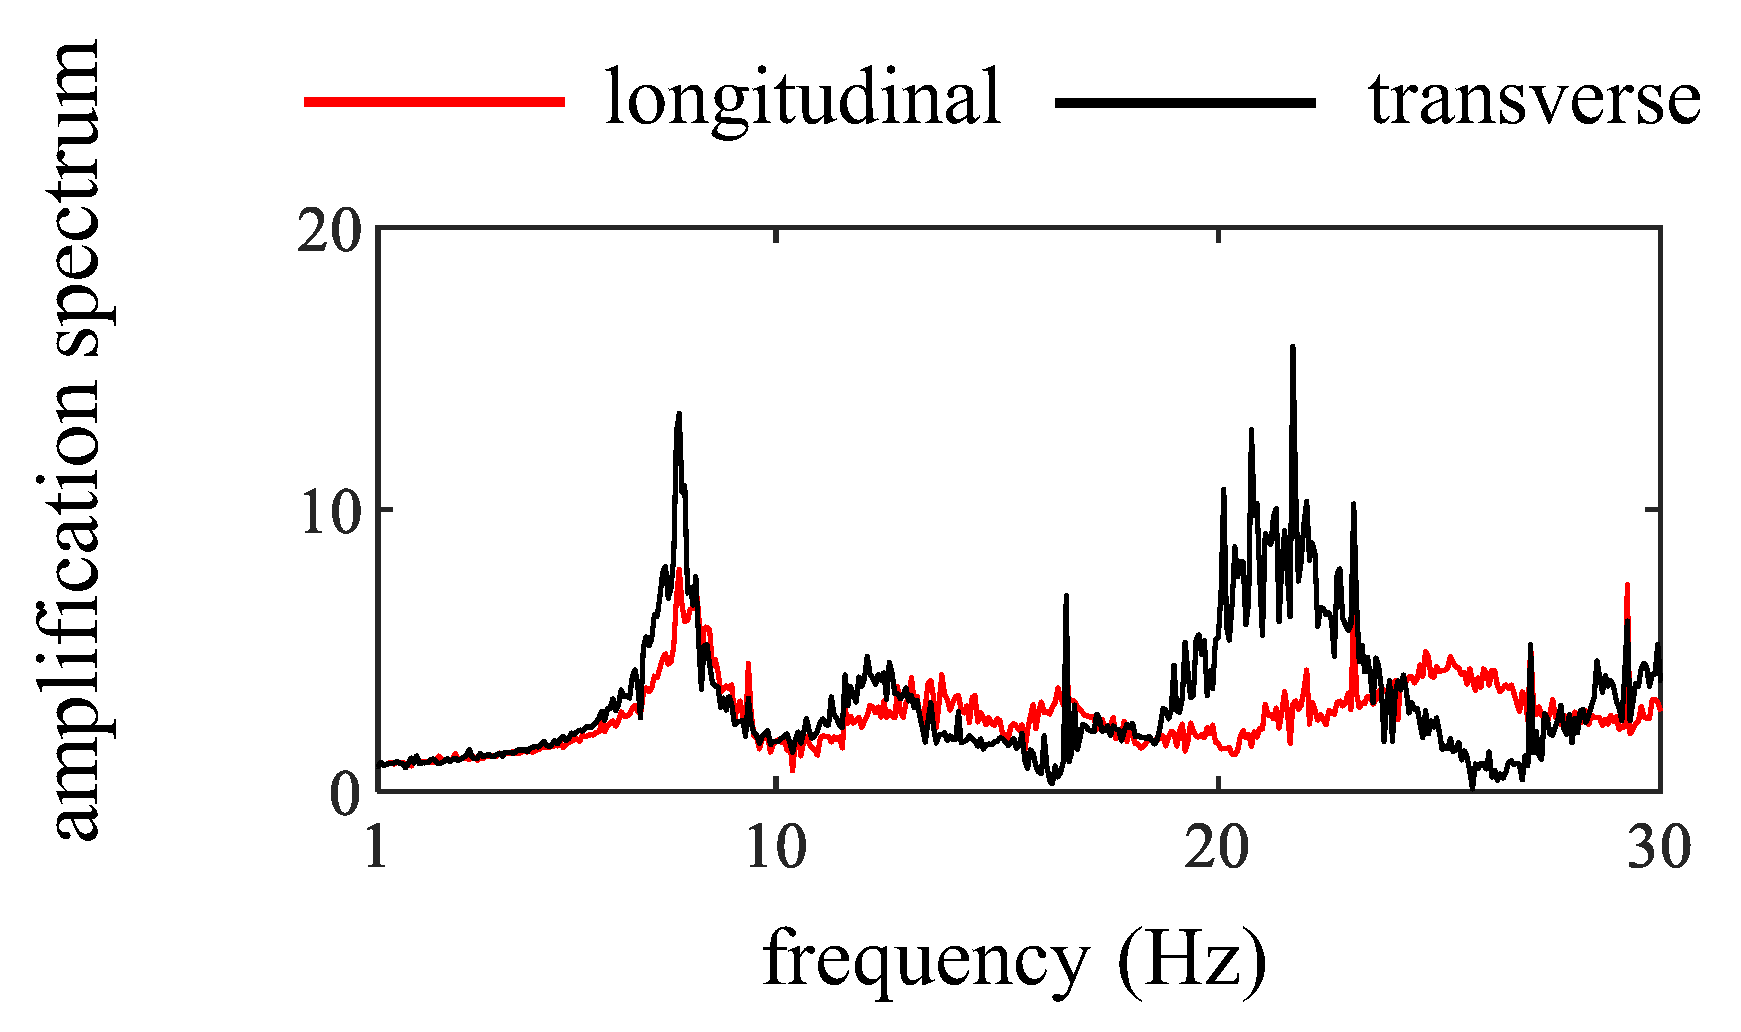
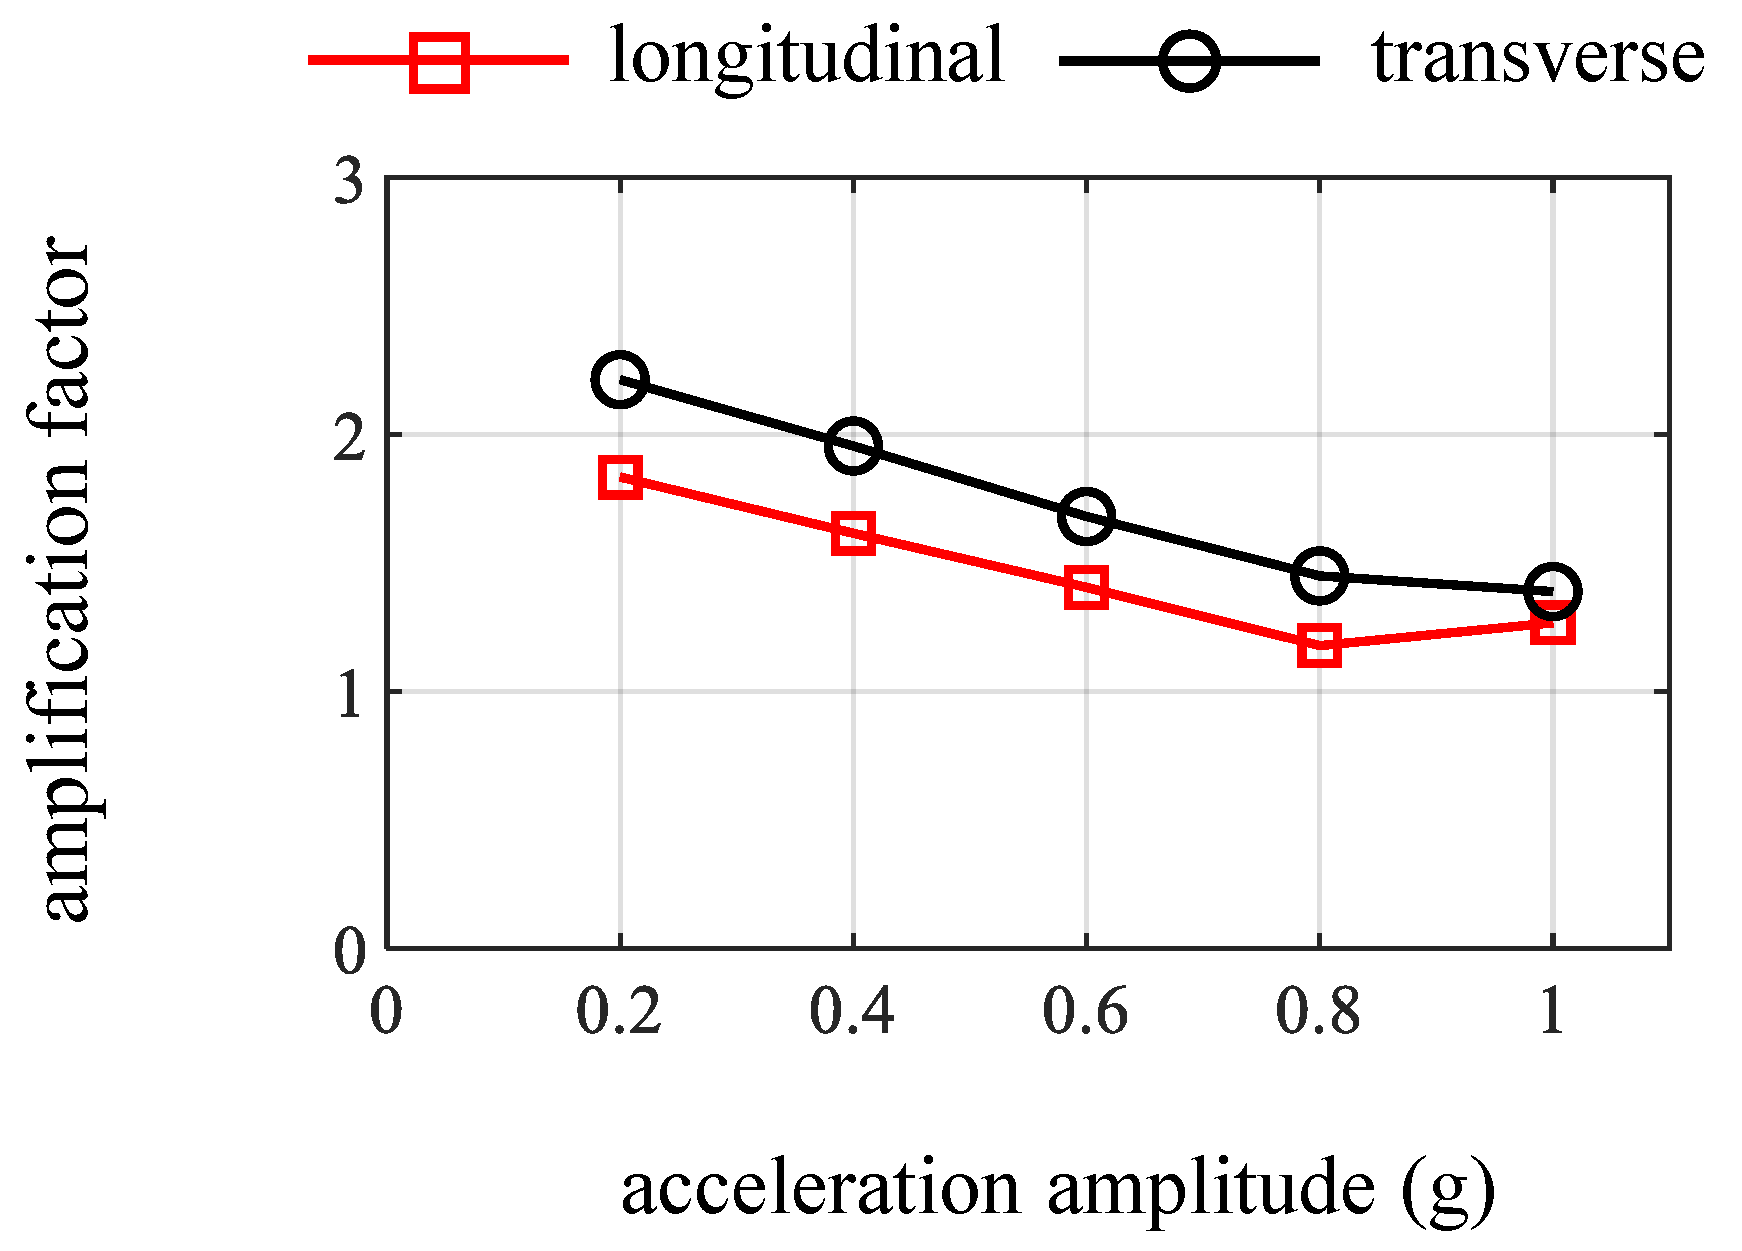
The ground surface exhibits the same dominant frequency but different amplitudes under the longitudinal and transverse excitation in the WN case. From both time and frequency domain perspectives, the acceleration responses of the model soil are greater under transverse excitations than under longitudinal excitations.
(2)
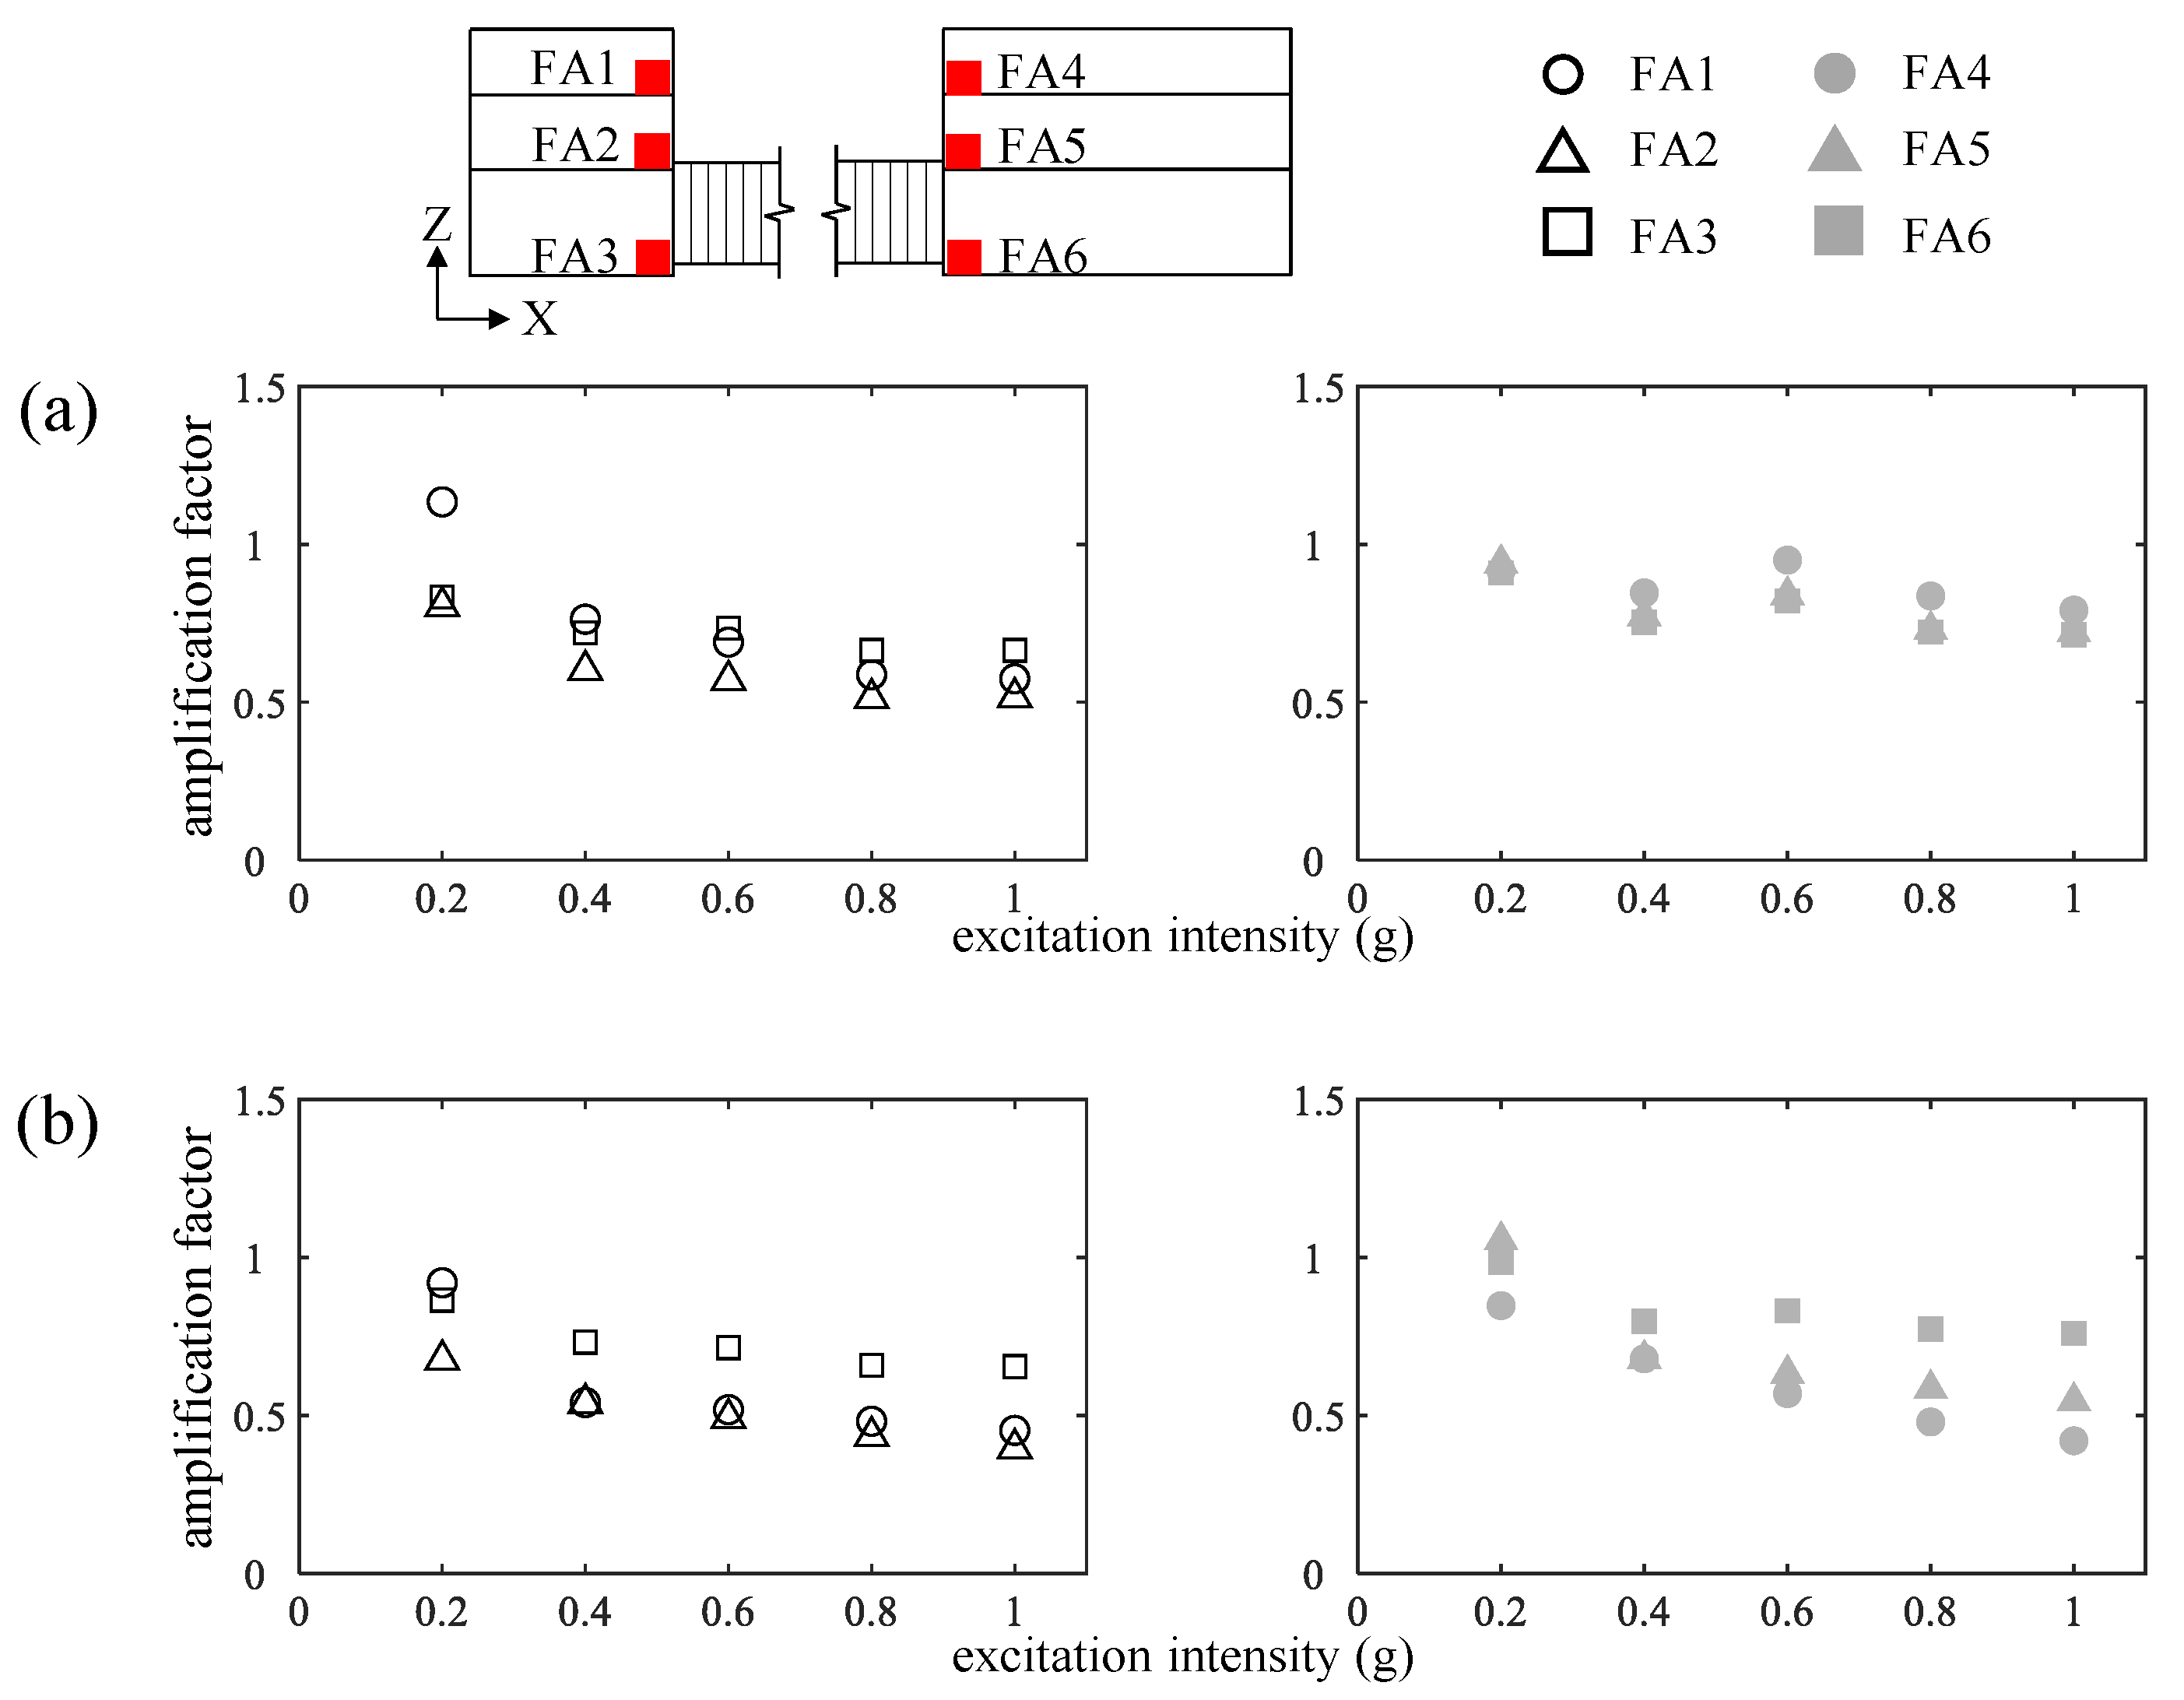
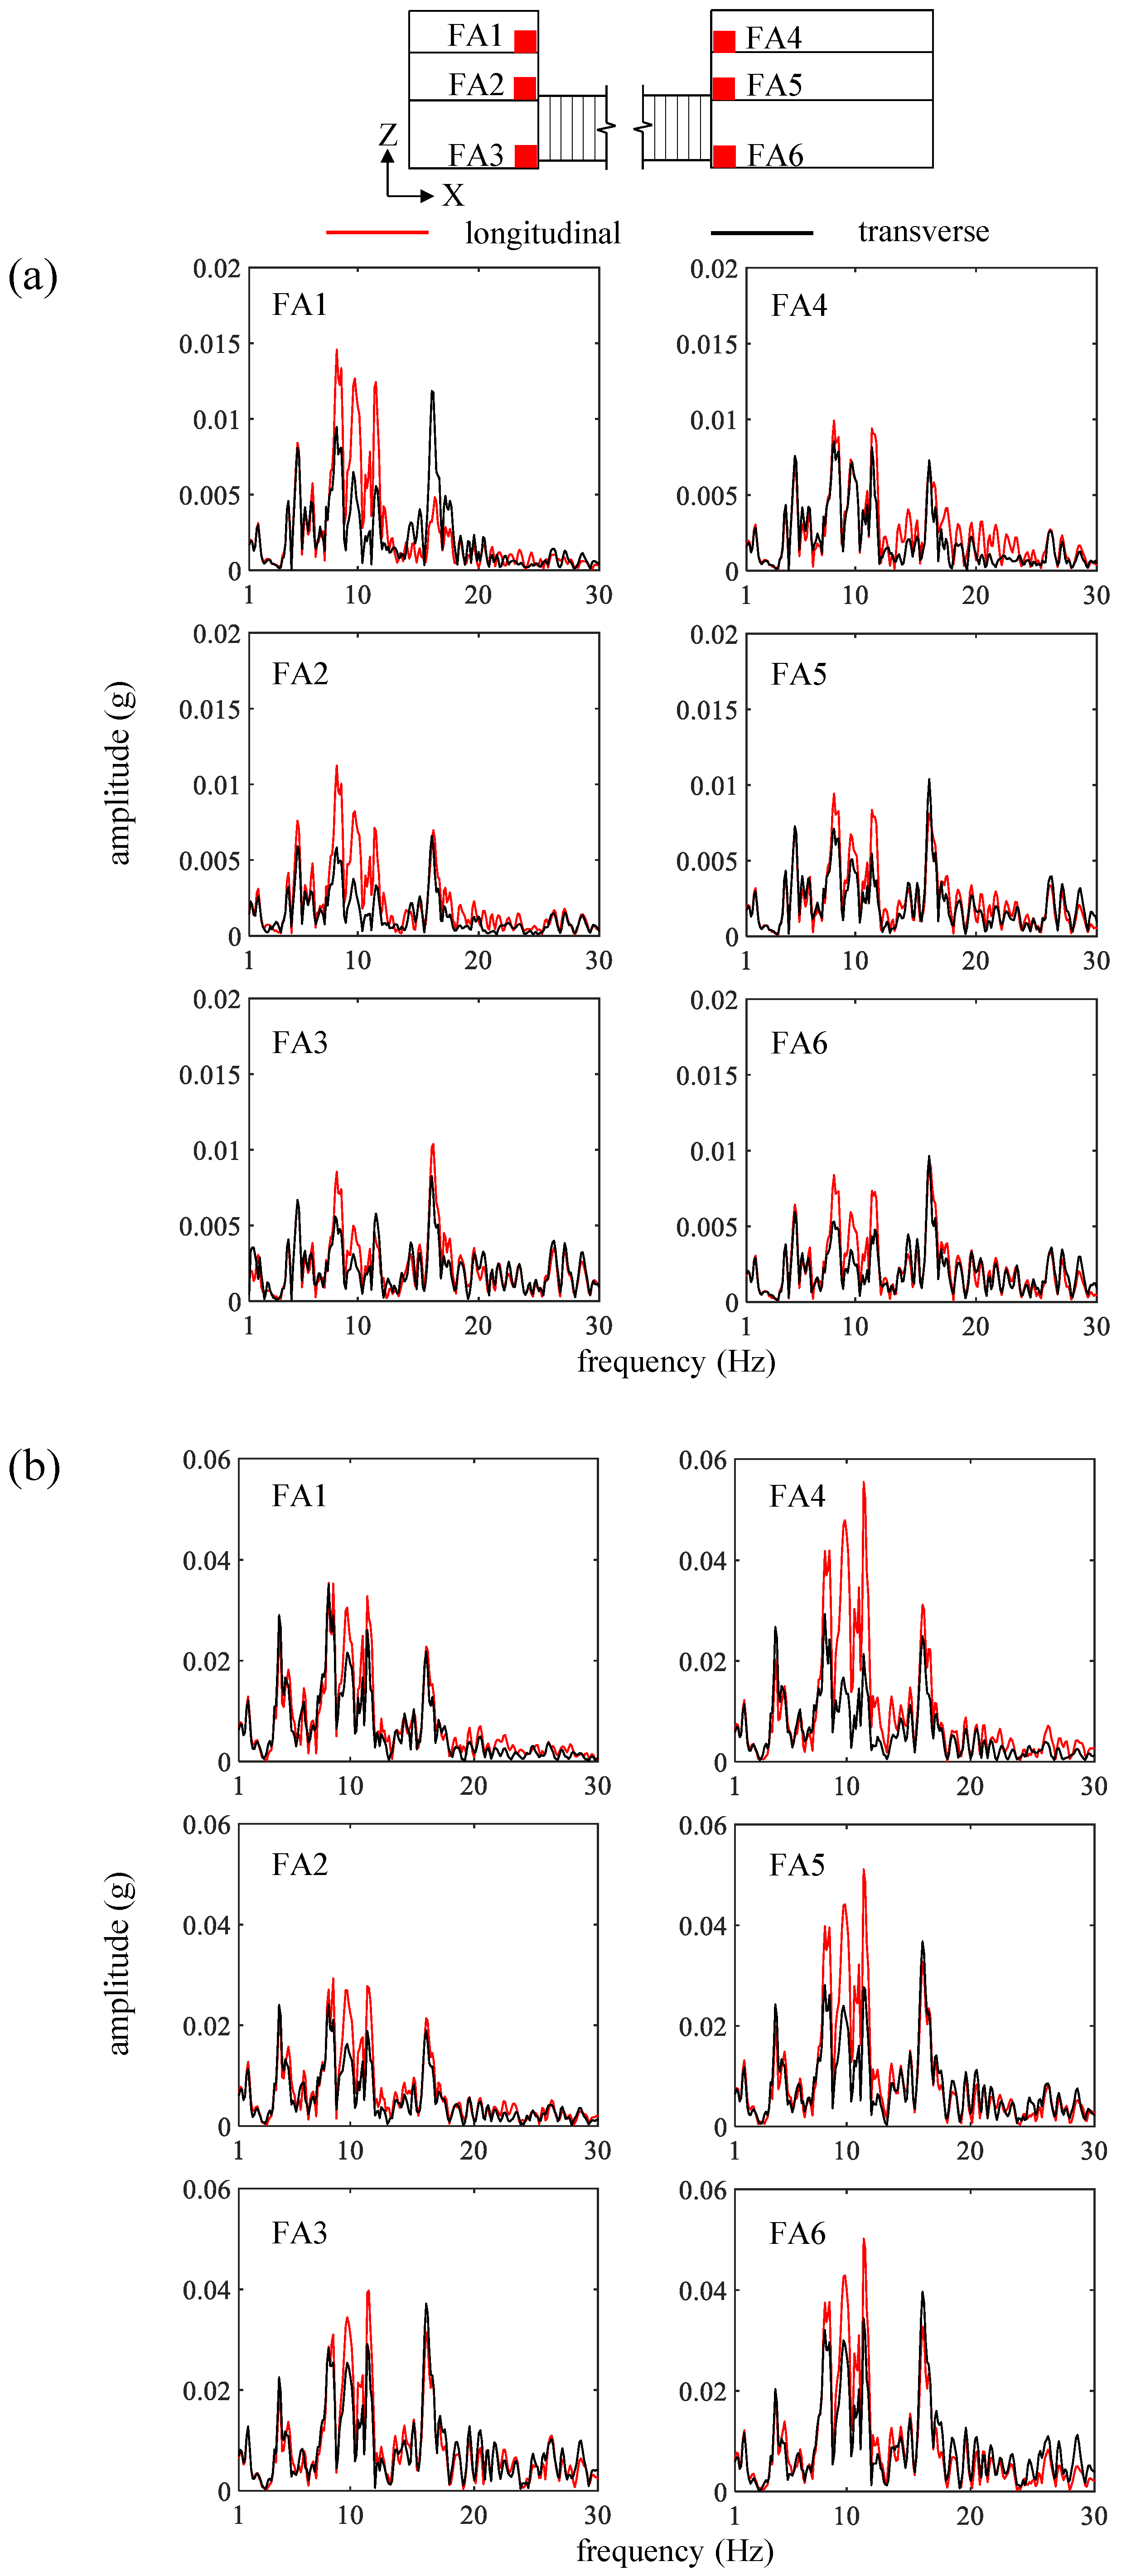
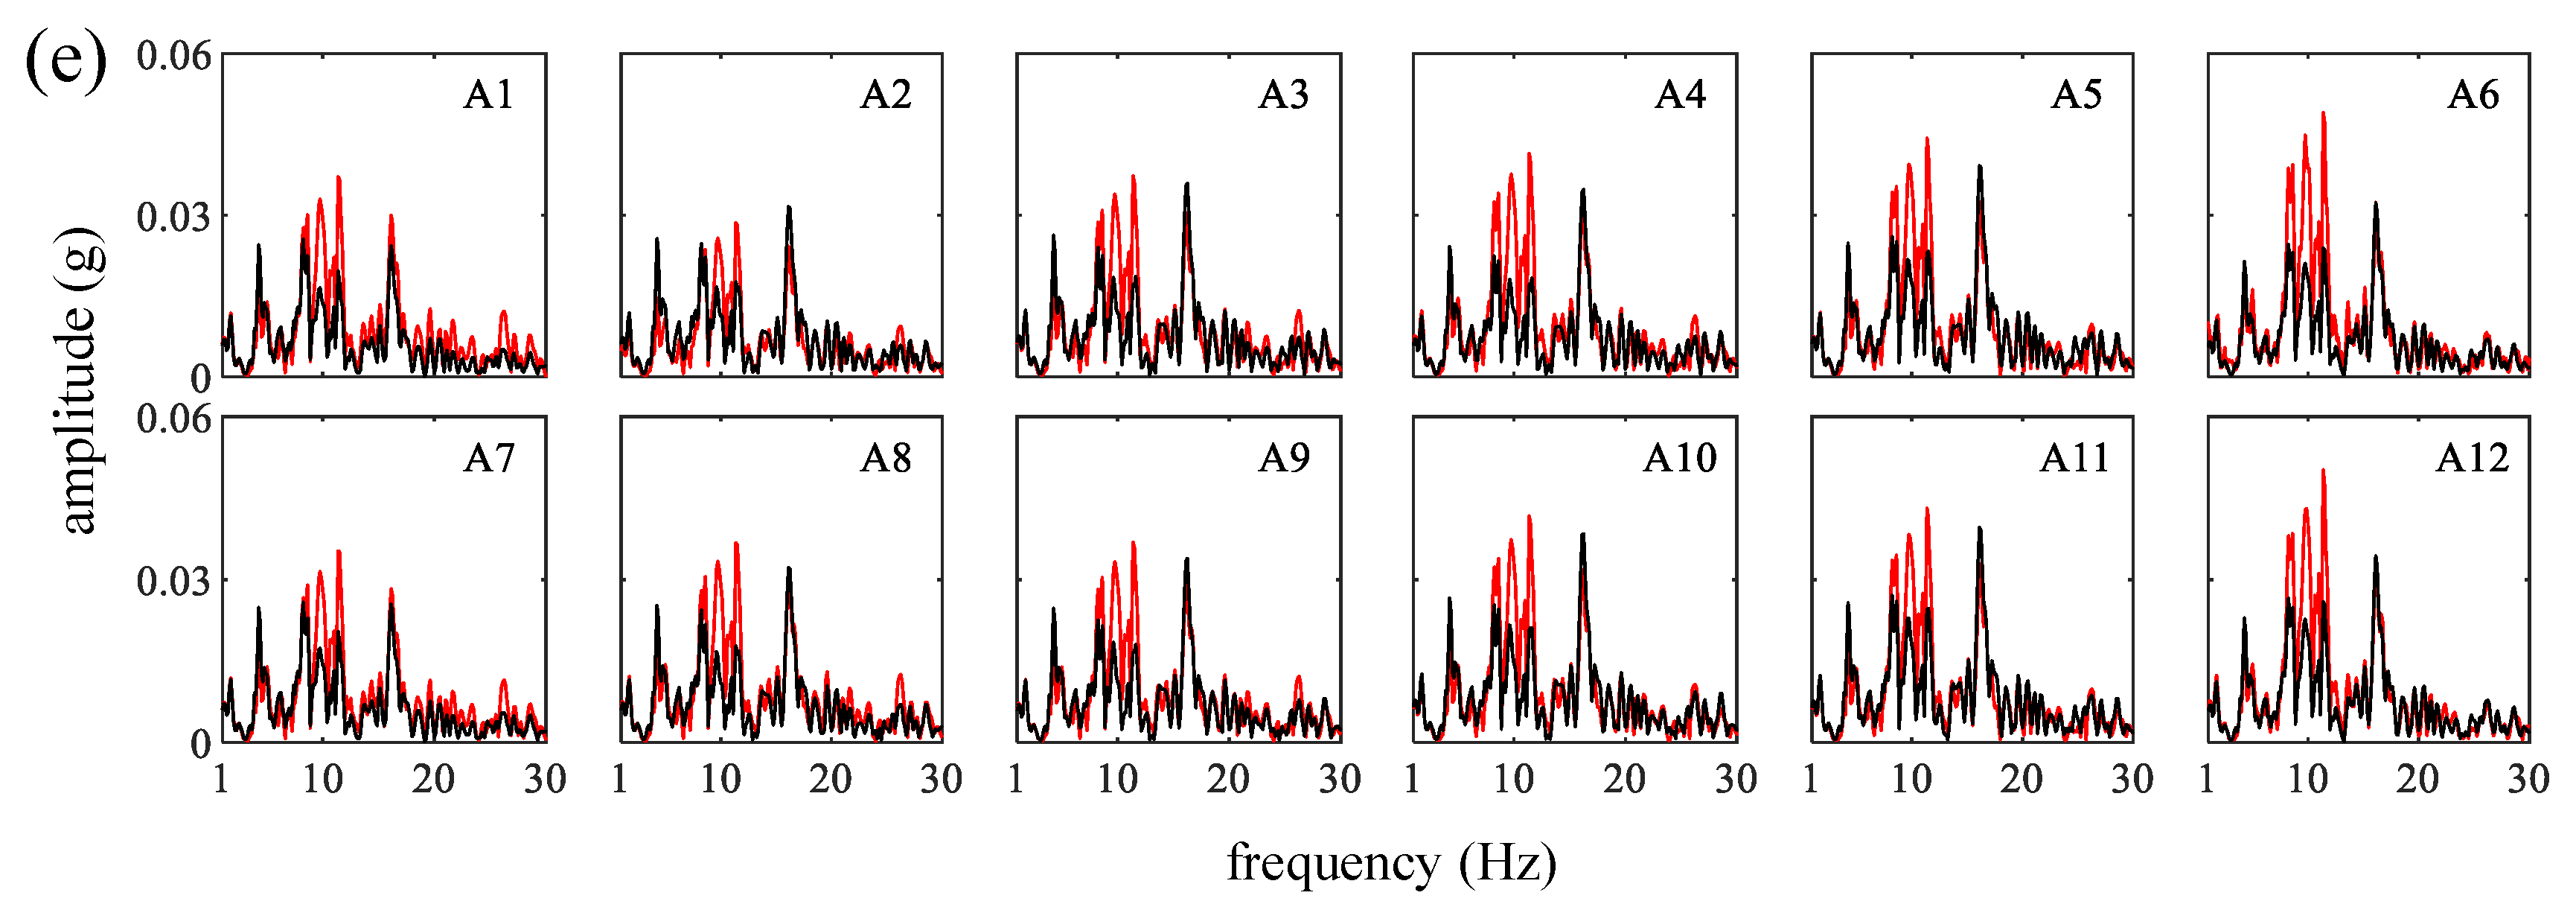
Under transverse excitations, different floors of the frames (Part A and Part B) have more consistent peak accelerations than those under longitudinal excitation. The longitudinal excitations enlarge the acceleration component in the frequency range of 8 Hz to 12 Hz compared with the transverse excitations.
(3)
The peak accelerations of culverts increase from the end near Part A to the end near Part C under longitudinal excitations. The peak accelerations in the center of the culvert are significantly greater than those at both ends under transverse excitations. Moreover, correlation coefficients of the accelerograms statistically quantify the discrepant acceleration responses in the center of the culvert under transverse excitations. The acceleration component in the frequency range of 8 Hz to 12 Hz under longitudinal excitations is greater than that under transverse excitations.
(4)
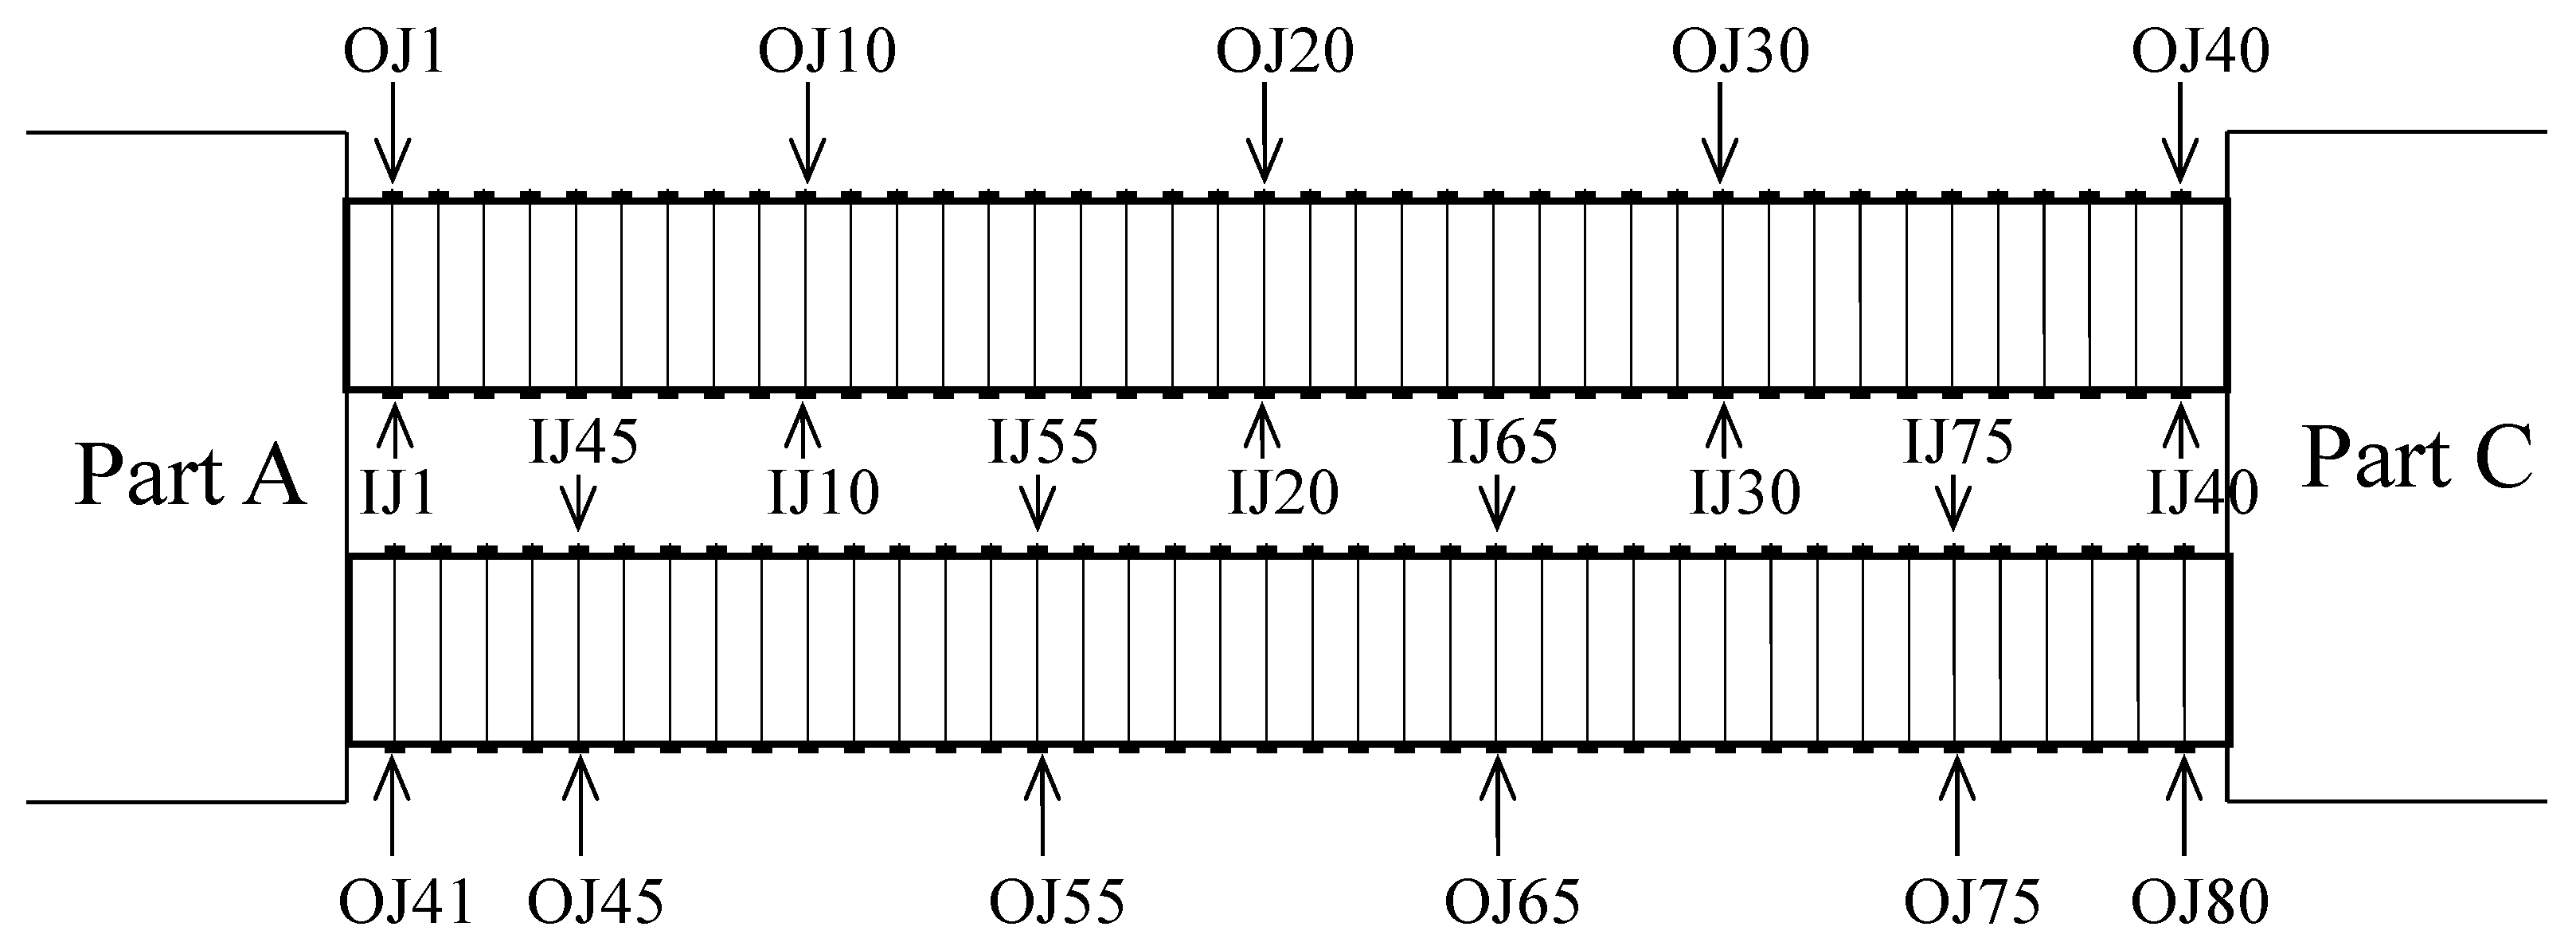
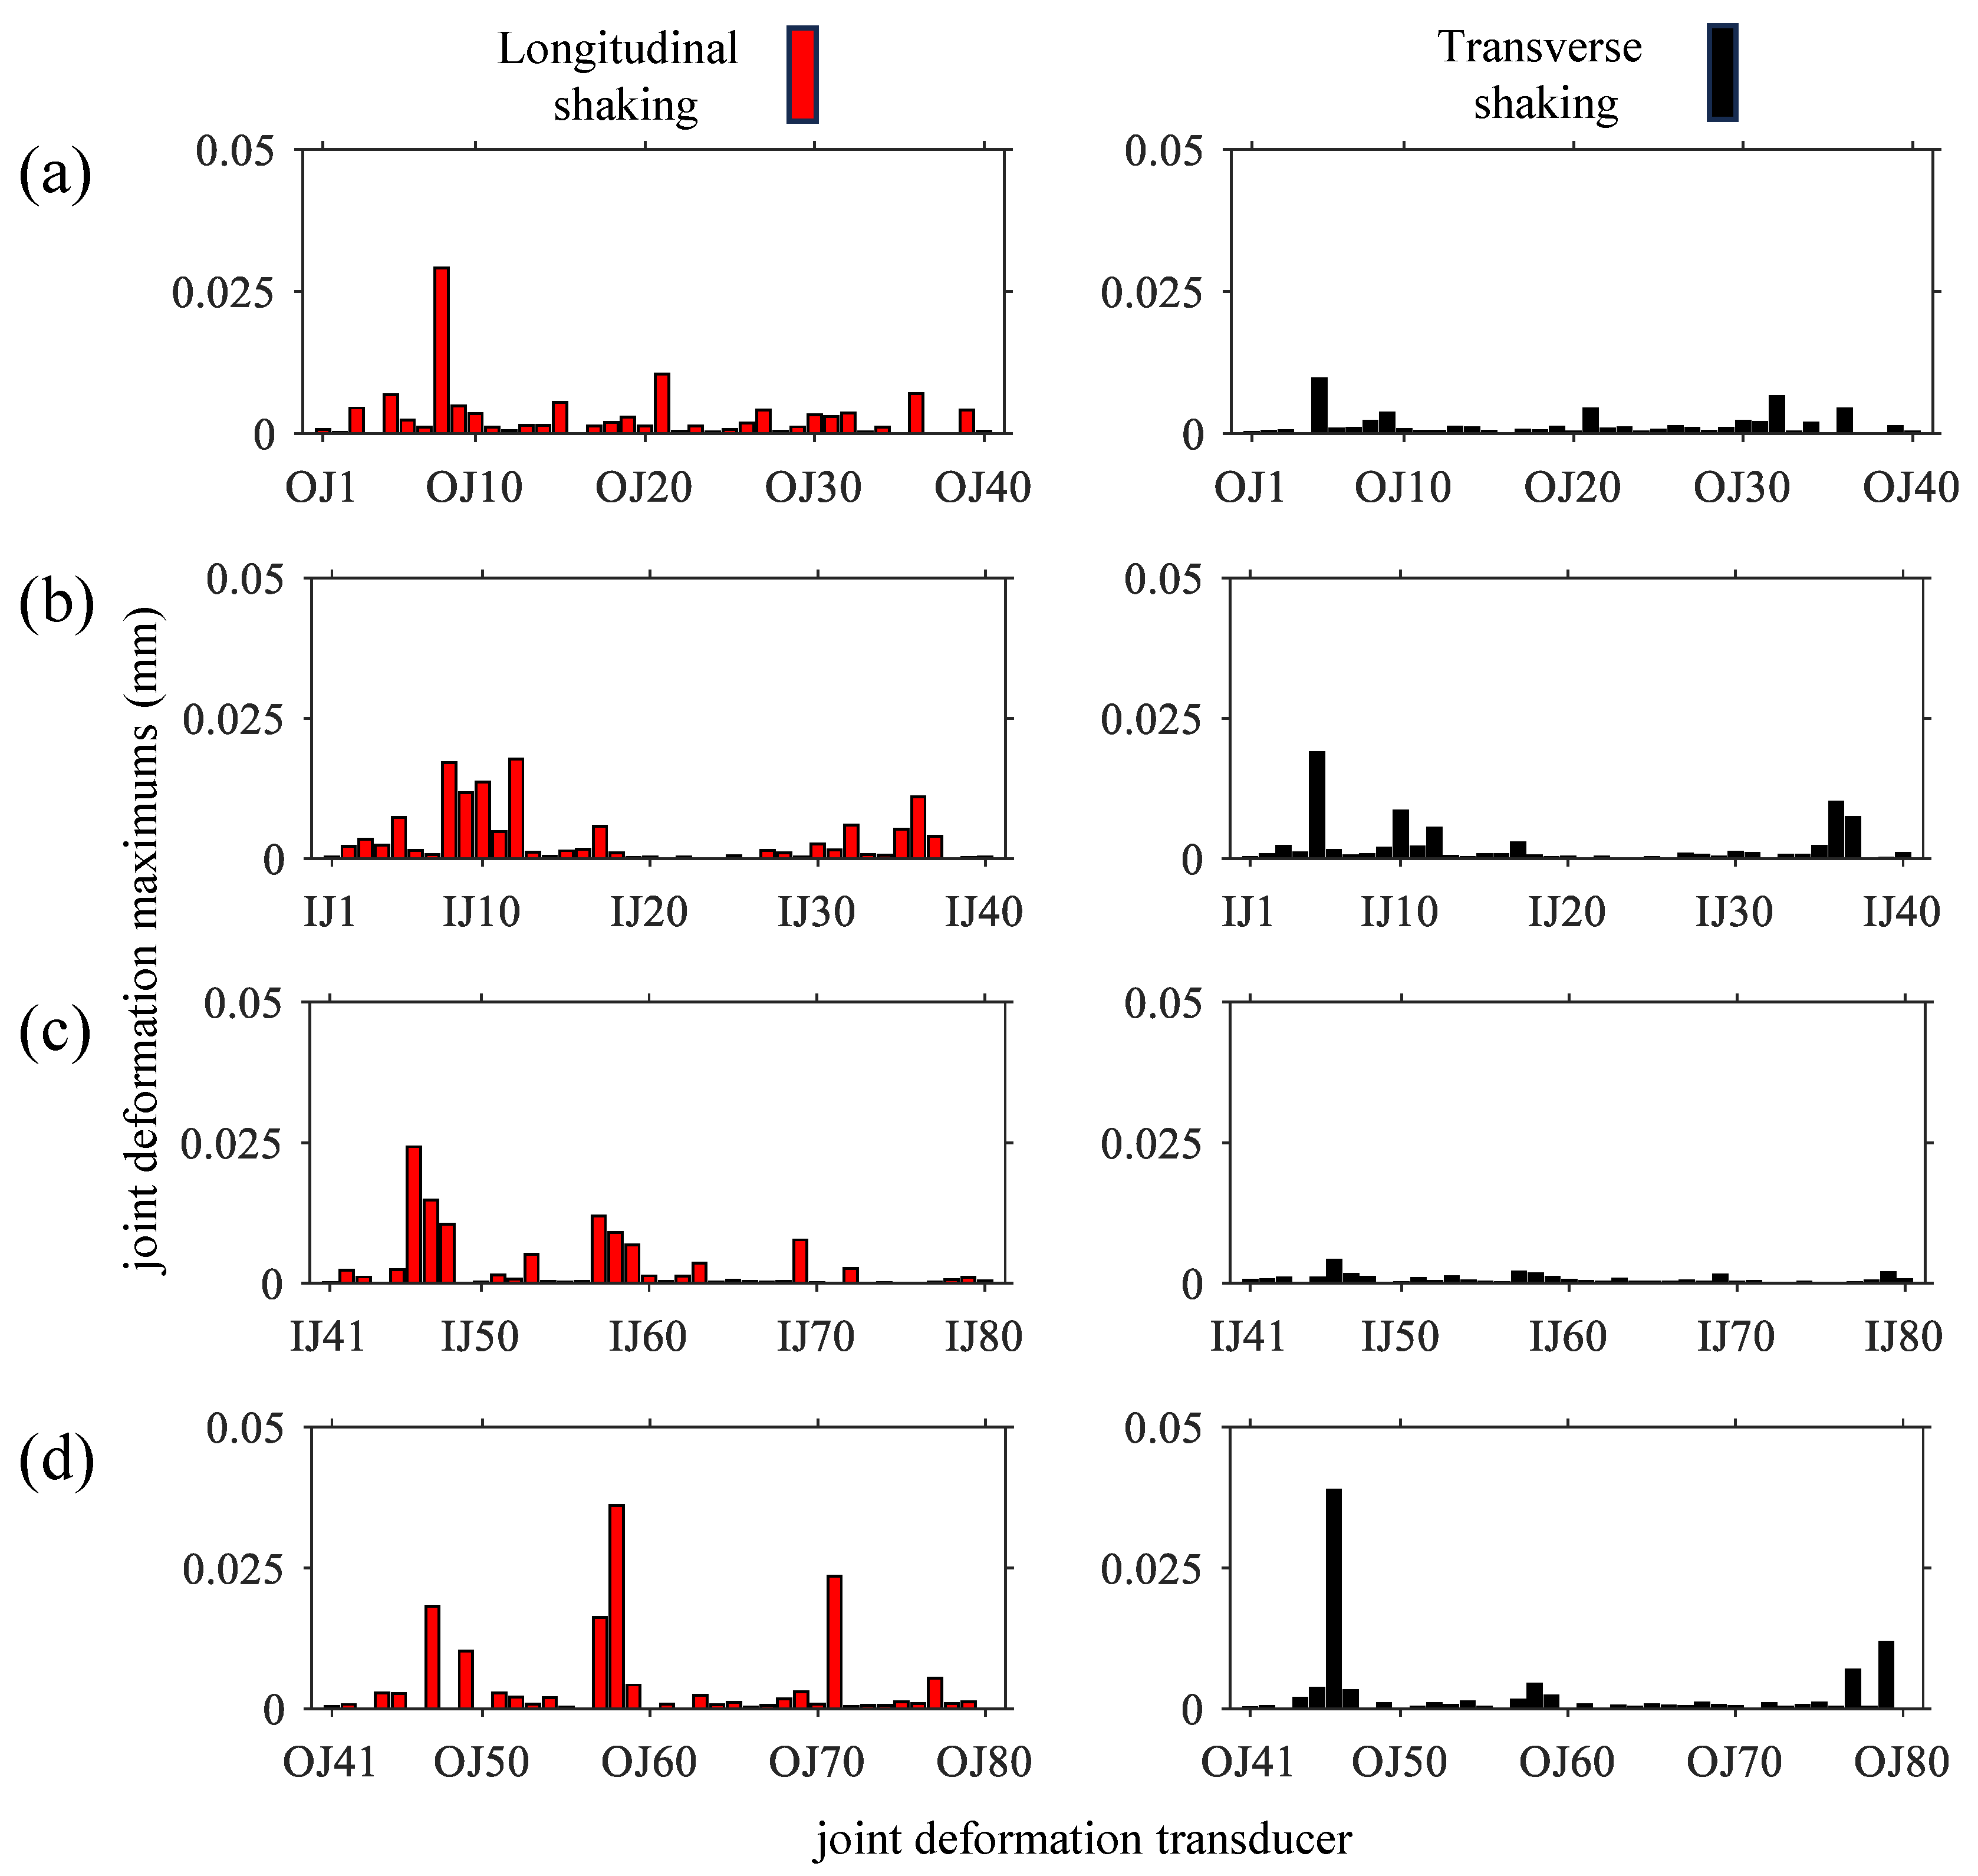
The distribution of culvert joint deformations is spiky, i.e., several culvert joints have deformations much larger than the average value. The culvert joint deformations are greater under longitudinal excitations than under transverse excitations. The spiky culvert joint deformations tend to occur at the ends of culverts under transverse excitations, while there is no significant trend of spiky deformation locations under longitudinal excitations. The joints at culvert ends have greater deformations because the frames’ restrained effect on the culverts is negatively correlated to the distance. The enhancement of the joints at culvert ends is necessary.
The discussions in this paper are mainly qualitative descriptions based on the raw data and primarily processed data. It would be expected that more quantitative and theoretical conclusions might be generated through future studies. The model culvert and model frame are connected by combining epoxy resin and carbon fiber cloth, which can be considered a rigid culvert–frame connection. Seismic performances of culvert–frame underground structures with flexible culvert–frame connections will be discussed in future work.

Author Contributions

Data curation, X.L. and W.W.; formal analysis, W.W. and X.W.; investigation, X.L. and X.W.; project administration, Y.Y.; visualization, X.L.; writing—original draft preparation, Y.Y. and X.L.; writing—review and editing, Y.Y. and X.L. All authors have read and agreed to the published version of the manuscript.

Funding

This research was funded by the Science and Technology Commission of Shanghai Municipality (No. 22DZ1203005 and No. 23DZ1202906) and Shanghai Sailing Program (23YF1440500).

Institutional Review Board Statement

Not applicable.

Informed Consent Statement

Not applicable.

Data Availability Statement

The data used to support the findings of this study are available from the corresponding author upon request.

Conflicts of Interest

Authors Yong Yuan and Xuzhao Lan were employed by Shanghai Tongji Green Building Prefabrication Construction Engineering Technology Co., Ltd. Author Weifeng Wu was employed by Shanghai Tunnel Engineering & Rail Transit Design and Research Institute. Author Xiuzhi Wang was employed by Shanghai Shentong Metro Construction Group Co., Ltd. The remaining authors declare that the research was conducted in the absence of any commercial or financial relationships that could be construed as a potential conflict of interest.

References

  1. He, J.; Liao, S.; Gong, Z.; Tang, C.; Liu, M.; Li, Y. The Design and Construction of a Large Composite Subway Station in Limited Space: An Exemplary Application of OCUE Method in Xuzhou, China. IOP Conf. Ser. Earth Environ. Sci. 2021, 703, 012024. [Google Scholar] [CrossRef]
  2. Iegupov, V.; Strizhelchik, G.; Kupreychyk, A.; Ubiyvovk, A. Geological Hazards During Construction and Operation of Shallow Subway Stations and Tunnels by the Example of the Kharkiv Metro (1968–2018). Int. J. Georesour. Environ. 2018, 4, 187–200. [Google Scholar] [CrossRef]
  3. Yang, Y.-F.; Liao, S.-M.; Liu, M.-B.; Wu, D.-P.; Pan, W.-Q.; Li, H. A New Construction Method for Metro Stations in Dense Urban Areas in Shanghai Soft Ground: Open-Cut Shafts Combined with Quasi-Rectangular Jacking Boxes. Tunn. Undergr. Space Technol. 2022, 125, 104530. [Google Scholar] [CrossRef]
  4. Zhuang, H.; Chen, G.; Hu, Z.; Qi, C. Influence of Soil Liquefaction on the Seismic Response of a Subway Station in Model Tests. Bull. Eng. Geol. Environ. 2016, 75, 1169–1182. [Google Scholar] [CrossRef]
  5. Liu, Z.; Chen, Z.; Liang, S.; Li, C. Isolation Mechanism of a Subway Station Structure with Flexible Devices at Column Ends Obtained in Shaking-Table Tests. Tunn. Undergr. Space Technol. 2020, 98, 103328. [Google Scholar] [CrossRef]
  6. Wang, J.; Yang, J.; Zhuang, H.; Ma, G.; Sun, Y. Seismic Responses of a Large Unequal-Span Underground Subway Station in Liquefiable Soil Using Shaking Table Test. J. Earthq. Eng. 2021, 26, 8446–8467. [Google Scholar] [CrossRef]
  7. Xu, C.; Zhang, Z.; Li, Y.; Du, X. Seismic Response and Failure Mechanism of Underground Frame Structures Based on Dynamic Centrifuge Tests. Earthq. Eng. Struct. Dyn. 2021, 50, 2031–2048. [Google Scholar] [CrossRef]
  8. Zhang, Z.; Yu, H.; Wang, Z.; Song, Y.; Liu, S.; Jiang, W. Shaking Table Test for Near-Valley Subway Station—Part I: Seismic Site Effects. Soil Dyn. Earthq. Eng. 2023, 172, 108064. [Google Scholar] [CrossRef]
  9. Yu, H.; Wang, Z.; Zhang, Z.; Song, Y.; Liu, S.; Jiang, W. Shaking Table Test for Near-Valley Subway Station—Part II: Seismic Response of the Station. Soil Dyn. Earthq. Eng. 2023, 172, 108065. [Google Scholar] [CrossRef]
  10. Maleska, T.; Beben, D.; Vaslestad, J.; Sergei Sukuvara, D. Application of EPS Geofoam below Soil–Steel Composite Bridge Subjected to Seismic Excitations. J. Geotech. Geoenviron. Eng. 2024, 150, 04024115. [Google Scholar] [CrossRef]
  11. Maleska, T.; Beben, D. Effect of the Soil Cover Depth on the Seismic Response in a Large-Span Thin-Walled Corrugated Steel Plate Bridge. Soil Dyn. Earthq. Eng. 2023, 166, 107744. [Google Scholar] [CrossRef]
  12. Maleska, T.; Beben, D.; Nowacka, J. Seismic Vulnerability of a Soil-Steel Composite Tunnel—Norway Tolpinrud Railway Tunnel Case Study. Tunn. Undergr. Space Technol. 2021, 110, 103808. [Google Scholar] [CrossRef]
  13. Han, J.; Guo, Z.; El Naggar, M.H.; Li, L.; Wang, X.; Du, X. Response of Buried Pipeline to Non-Uniform Longitudinal and Transverse Ground Motions. J. Earthq. Eng. 2023, 28, 799–818. [Google Scholar] [CrossRef]
  14. Yatsumoto, H.; Mitsuyoshi, Y.; Sawamura, Y.; Kimura, M. Evaluation of Seismic Behavior of Box Culvert Buried in the Ground through Centrifuge Model Tests and Numerical Analysis. Undergr. Space 2019, 4, 147–167. [Google Scholar] [CrossRef]
  15. Saito, K.; Yamane, K.; Koizumi, A. A Study on the Seismic Behavior of Shield Tunnel Including Shaft in Longitudinal Direction. J. Tunn. Eng. 2006, 16, 121–132. [Google Scholar] [CrossRef]
  16. Towhata, I.; Kawamata, Y.; Nakayama, M.; Yasuda, S. E-Defense Shaking Test on Large Model of Underground Shaft and Tunnels. In Proceedings of the Geotechnical Aspects of Underground Construction in Soft Ground, Seoul, Republic of Korea, 25–27 August 2014; Yoo, C., Park, S.W., Kim, B., Ban, H., Eds.; CRC Press-Taylor & Francis Group: Boca Raton, FL, USA, 2014; pp. 31–40. [Google Scholar]
  17. Kawamata, Y.; Nakayama, M.; Towhata, I.; Yasuda, S. Dynamic Behaviors of Underground Structures in E-Defense Shaking Experiments. Soil Dyn. Earthq. Eng. 2016, 82, 24–39. [Google Scholar] [CrossRef]
  18. Ma, X.; Wang, G.; Wu, J.; Ji, Q. Experimental Study on the Seismic Response of Subway Station in Soft Ground. J. Earthq. Tsunami 2017, 11, 1750020. [Google Scholar] [CrossRef]
  19. Zhuang, H.; Wang, X.; Miao, Y.; Yao, E.; Chen, S.; Ruan, B.; Chen, G. Seismic Responses of a Subway Station and Tunnel in a Slightly Inclined Liquefiable Ground through Shaking Table Test. Soil Dyn. Earthq. Eng. 2019, 116, 371–385. [Google Scholar] [CrossRef]
  20. Zhang, J.; Yuan, Y.; Yu, H. Shaking Table Tests on Discrepant Responses of Shaft-Tunnel Junction in Soft Soil under Transverse Excitations. Soil Dyn. Earthq. Eng. 2019, 120, 345–359. [Google Scholar] [CrossRef]
  21. Chen, Q.; Zhang, T.; Hong, N.; Huang, B. Seismic Performance of a Subway Station-Tunnel Junction Structure: A Shaking Table Investigation and Numerical Analysis. KSCE J. Civ. Eng. 2021, 25, 1653–1669. [Google Scholar] [CrossRef]
  22. Wang, X.; El Naggar, H.M.; Xu, C.; Zhong, Z.; Du, X. Seismic Response of Subway Station-Tunnel with Expansion Joint Connection in Liquefiable Soil. Tunn. Undergr. Space Technol. 2025, 159, 106477. [Google Scholar] [CrossRef]
  23. Zhang, J.; Yuan, Y.; Bao, Z.; Yu, H.; Bilotta, E. Shaking Table Tests on the Intersection of Cross Passage and Twin Tunnels. Soil Dyn. Earthq. Eng. 2019, 124, 136–150. [Google Scholar] [CrossRef]
  24. Zhang, J.; Yuan, Y.; Bao, Z.; Yu, H.; Bilotta, E. Shaking Table Tests on Shaft-Tunnel Junction under Longitudinal Excitations. Soil Dyn. Earthq. Eng. 2020, 132, 106055. [Google Scholar] [CrossRef]
  25. Wang, J.-N. Seismic Design of Tunnels A Simple State-of-the-Art Design Approach; Parsons Brinckerhoff Quade and Douglas Inc.: New York, NY, USA, 1993. [Google Scholar]
  26. Shiba, Y.; Kawashima, K.; Obinata, N.; Kano, T. An Evaluation Method of Longitudinal Stiffness of Shield Tunnel Linings for Application to Seismic Response Analyses. Doboku Gakkai Ronbunshu 1988, 1988, 319–327. [Google Scholar] [CrossRef]
  27. Kramer, S.L. Geotechnical Earthquake Engineering, 1st ed.; Pearson: Upper Saddle River, NJ, USA, 1996; ISBN 978-0-13-374943-4. [Google Scholar]
  28. Abuhajar, O.; El Naggar, H.; Newson, T. Experimental and Numerical Investigations of the Effect of Buried Box Culverts on Earthquake Excitation. Soil Dyn. Earthq. Eng. 2015, 79, 130–148. [Google Scholar] [CrossRef]
  29. Tsinidis, G.; Heron, C.; Madabhushi, G.; Pitilakis, K. Calibration of Strain Gauged Square Tunnels for Centrifuge Testing. Geotech. Geol. Eng. 2016, 34, 911–921. [Google Scholar] [CrossRef]
  30. Tsinidis, G.; Pitilakis, K.; Madabhushi, G.; Heron, C. Dynamic Response of Flexible Square Tunnels: Centrifuge Testing and Validation of Existing Design Methodologies. Géotechnique 2015, 65, 401–417. [Google Scholar] [CrossRef]
  31. Tsinidis, G.; Rovithis, E.; Pitilakis, K.; Chazelas, J.L. Seismic Response of Box-Type Tunnels in Soft Soil: Experimental and Numerical Investigation. Tunn. Undergr. Space Technol. 2016, 59, 199–214. [Google Scholar] [CrossRef]
Figure 1. (a) The laminar box and (b) the model structure in the model container.
Applsci 15 05164 g001
Figure 2. Cross-sections of the box frame (a) at the prototype scale and (b) at the model scale (unit: mm).
Applsci 15 05164 g002
Figure 3. Cross-sections of the jacked culvert (a) at the prototype scale and (b) at the model scale (unit: mm).
Applsci 15 05164 g003
Figure 4. Instrumentation layout: (a) locations of the accelerometers in the model soil; (b) the vertical view of the model system, showing dimensions and locations of the underground structure; and (c) cross-section A-A, showing the locations of FA1-6, the other accelerometers, and joint deformation transducers (unit: mm).
Applsci 15 05164 g004aApplsci 15 05164 g004b
Figure 5. (a) The accelerogram, (b) Fourier spectrum, and (c) response spectrum of SEM-0.2g.
Applsci 15 05164 g005
Figure 6. Acceleration amplification spectra of SA0 during the longitudinal and transverse white noise motions.
Applsci 15 05164 g006
Figure 7. Peak acceleration amplification factors of SA0, SA1, SA2, and SA3 during the synthetic earthquake motions.
Applsci 15 05164 g007
Figure 8. Acceleration amplification factor of SA0 with respect to the input intensity.
Applsci 15 05164 g008
Figure 9. Peak acceleration amplification factors of frame structures in (a) longitudinal cases and (b) transverse cases.
Applsci 15 05164 g009
Figure 10. Acceleration Fourier spectra of frames in (a) SEM-0.2g and (b) SEM-1.0g.
Applsci 15 05164 g010
Figure 11. Peak accelerations of culverts in (a) the longitudinal cases and (b) the transverse cases.
Applsci 15 05164 g011
Figure 12. Correlation coefficients of culvert accelerations in (a) SEM-0.2g, (b) SEM-1.0g.
Applsci 15 05164 g012aApplsci 15 05164 g012b
Figure 13. Acceleration Fourier spectra of culverts in (a) SEM-0.2g, (b) SEM-0.4g, (c) SEM-0.6g, (d) SEM-0.8g, (e) SEM-1.0g.
Applsci 15 05164 g013aApplsci 15 05164 g013b
Figure 14. Culvert joint deformations in longitudinal and transverse cases of SEM-0.2g at (a) maximums of transducers OJ1-OJ40, (b) maximums of transducers IJ1-IJ40, (c) maximums of transducers IJ41-IJ80, and (d) maximums of transducers OJ41-OJ80.
Applsci 15 05164 g014aApplsci 15 05164 g014b
Table 1. Major similitude relations.
VariablesSimilitude RelationsSimilitude Ratios
Displacement S l 1/20
Density S ρ 1/1.95
Shear modulus S G 1/39
Acceleration S a = S G S l 1 S ρ 1 1
Time S t = S l S ρ 0.5 S G 0.5 1/4.47
Table 2. Properties of prototype soil and model soil.
PropertiesDepth (m)Density (kg/m3)Shear Modulus (Mpa)
Prototype soil40180272
Model soil26942.84
Table 3. Comparison of tensile stiffness between prototype and model jacked culverts.
PrototypeModel
Tensile stiffness of each culvert ring E r A r (N) 3.57 × 10 11 7.51 × 10 8
Number of longitudinal bolts n 22 8
Tensile stiffness of each bolt k j (N) 2.38 × 10 8 1.46 × 10 6
Equivalent tensile stiffness of each joint E A e q (N) 5.24 × 10 9 1.16 × 10 7
Relative tensile stiffness68.1 64.5
Table 4. Comparison of longitudinal bending stiffness between prototype and model jacked culverts.
PrototypeModel
Bending stiffness of each culvert ring E r I r (N × m2) 4.35 × 10 12 2.47 × 10 7
Equivalent bending stiffness of each joint E I e q (N × m2) 6.80 × 10 10 3.76 × 10 5
Relative bending stiffness64.0 65.7
Table 5. Comparison of relative tensile stiffness between the culvert and the frame in model and prototype scales.
PrototypeModel
Tensile stiffness of the frame E f A f (N) 2.58 × 10 13 3.30 × 10 9
Number of longitudinal bolts n 22 8
Tensile stiffness of each bolt k j (N) 2.38 × 10 8 1.46 × 10 6
Equivalent tensile stiffness of the culvert E A e q , c (N) 1.02 × 10 10 1.17 × 10 6
Relative tensile stiffness R L T 2.53 × 10 3 2.82 × 10 3
Table 6. Input sequence of earthquake motions.
SymbolEarthquake WaveAcceleration Amplitude (g)Shaking Direction
Case 1WN-0.05gwhite noise0.05X and Y
Case 2SEM-0.2gsynthetic earthquake motion0.2X and Y
Case 3SEM-0.4gsynthetic earthquake motion0.4X and Y
Case 4SEM-0.6gsynthetic earthquake motion0.6X and Y
Case 5SEM-0.8gsynthetic earthquake motion0.8X and Y
Case 6SEM-1.0gsynthetic earthquake motion1.0X and Y
Disclaimer/Publisher’s Note: The statements, opinions and data contained in all publications are solely those of the individual author(s) and contributor(s) and not of MDPI and/or the editor(s). MDPI and/or the editor(s) disclaim responsibility for any injury to people or property resulting from any ideas, methods, instructions or products referred to in the content.

