Article

Disaster Recognition and Classification Based on Improved ResNet-50 Neural Network

School of Physics and Optoelectronics, Xiangtan University, Xiangtan 411105, China
*
Author to whom correspondence should be addressed.
Appl. Sci. 2025, 15(9), 5143; https://doi.org/10.3390/app15095143
Submission received: 31 March 2025 / Revised: 2 May 2025 / Accepted: 4 May 2025 / Published: 6 May 2025

Abstract

:
Accurate and timely disaster classification is critical for effective disaster management and emergency response. This study proposes an improved ResNet-50-based deep learning model to classify seven types of natural disasters, including earthquake, fire, flood, mudslide, avalanche, landslide, and land subsidence. The dataset was compiled from publicly available sources and partitioned into training and validation sets using an 8:2 split. Experimental results demonstrate that the proposed model achieves a classification accuracy of 87% on the validation set and outperforms the traditional VGG16 model in most evaluation metrics, including precision, recall, F1-score, AUC, specificity, and log loss. Furthermore, the model effectively mitigates the gradient vanishing problem, ensuring stable convergence and robust training performance. These findings provide a practical technical reference for multi-disaster classification tasks and contribute to enhancing the efficiency of disaster response and societal resilience.

1. Introduction

With the intensification of global climate change and the acceleration of urbanization, the frequency and severity of natural disasters have significantly increased. Events such as floods, mudslides, and landslides pose substantial threats to human lives, property, and socio-economic development [1]. In response, governments and international organizations have increasingly prioritized disaster management and emergency response, promoting research into advanced disaster recognition technologies [2]. Rapid and accurate disaster classification is critical for timely emergency decision-making. Traditional disaster classification methods primarily relied on manual observation [3]. However, traditional disaster classification methods, such as manual observations from meteorologists, emergency responders, and local residents, suffer from several limitations. These approaches are often subjective, prone to delays, heavily influenced by environmental conditions, and difficult to scale during large-scale or rapidly evolving disaster events. Furthermore, manual reporting lacks the immediacy and consistency required for real-time disaster response and decision-making [4].
With the rapid development of machine learning technologies, particularly in computer vision and pattern recognition, automated disaster recognition systems have emerged as a promising alternative. Machine learning models can extract complex features from disaster images, achieve faster and more accurate classification results, and reduce reliance on human intervention. In particular, deep learning architectures such as convolutional neural networks (CNNs) and residual networks (ResNets) enable scalable, real-time classification across diverse and complex disaster scenarios, addressing the limitations inherent in traditional methods [5]. With the development of machine learning, techniques such as support vector machines (SVMs) [6], K-nearest neighbors (KNNs) [7], and decision trees [8] have been employed. However, these approaches generally focus on single-disaster scenarios and often struggle to generalize across diverse disaster types [9,10]. Deep learning models, particularly convolutional neural networks (CNNs), have shown promise in disaster classification. Nevertheless, conventional CNN architectures face challenges such as performance degradation, slow convergence, and the gradient vanishing problem in deeper networks [11,12]. Emerging models like transformers [13,14] and YOLO architectures [15,16] have been introduced, improving disaster recognition in some contexts. However, these models typically require large datasets and intensive computational resources [17,18], making them less practical for scenarios with limited labeled disaster data.
Given these challenges, there is a pressing need to develop deep learning models that are both efficient and capable of robust feature extraction under data-scarce and complex disaster environments [19,20]. In this study, we propose an improved ResNet-50-based model for multi-disaster classification, targeting seven types of natural disasters: earthquake, fire, flood, mudslide, avalanche, landslide, and land subsidence. Leveraging its residual structure and skip connections, the model mitigates the gradient vanishing problem, enhances deep feature extraction, and improves classification performance.
The remainder of this paper is organized as follows: Section 2 describes the dataset preparation and data augmentation methods, and also outlines the model architecture and training procedure. Section 3 presents experimental results and performance comparisons. Section 4 concludes the study and discusses future research directions.

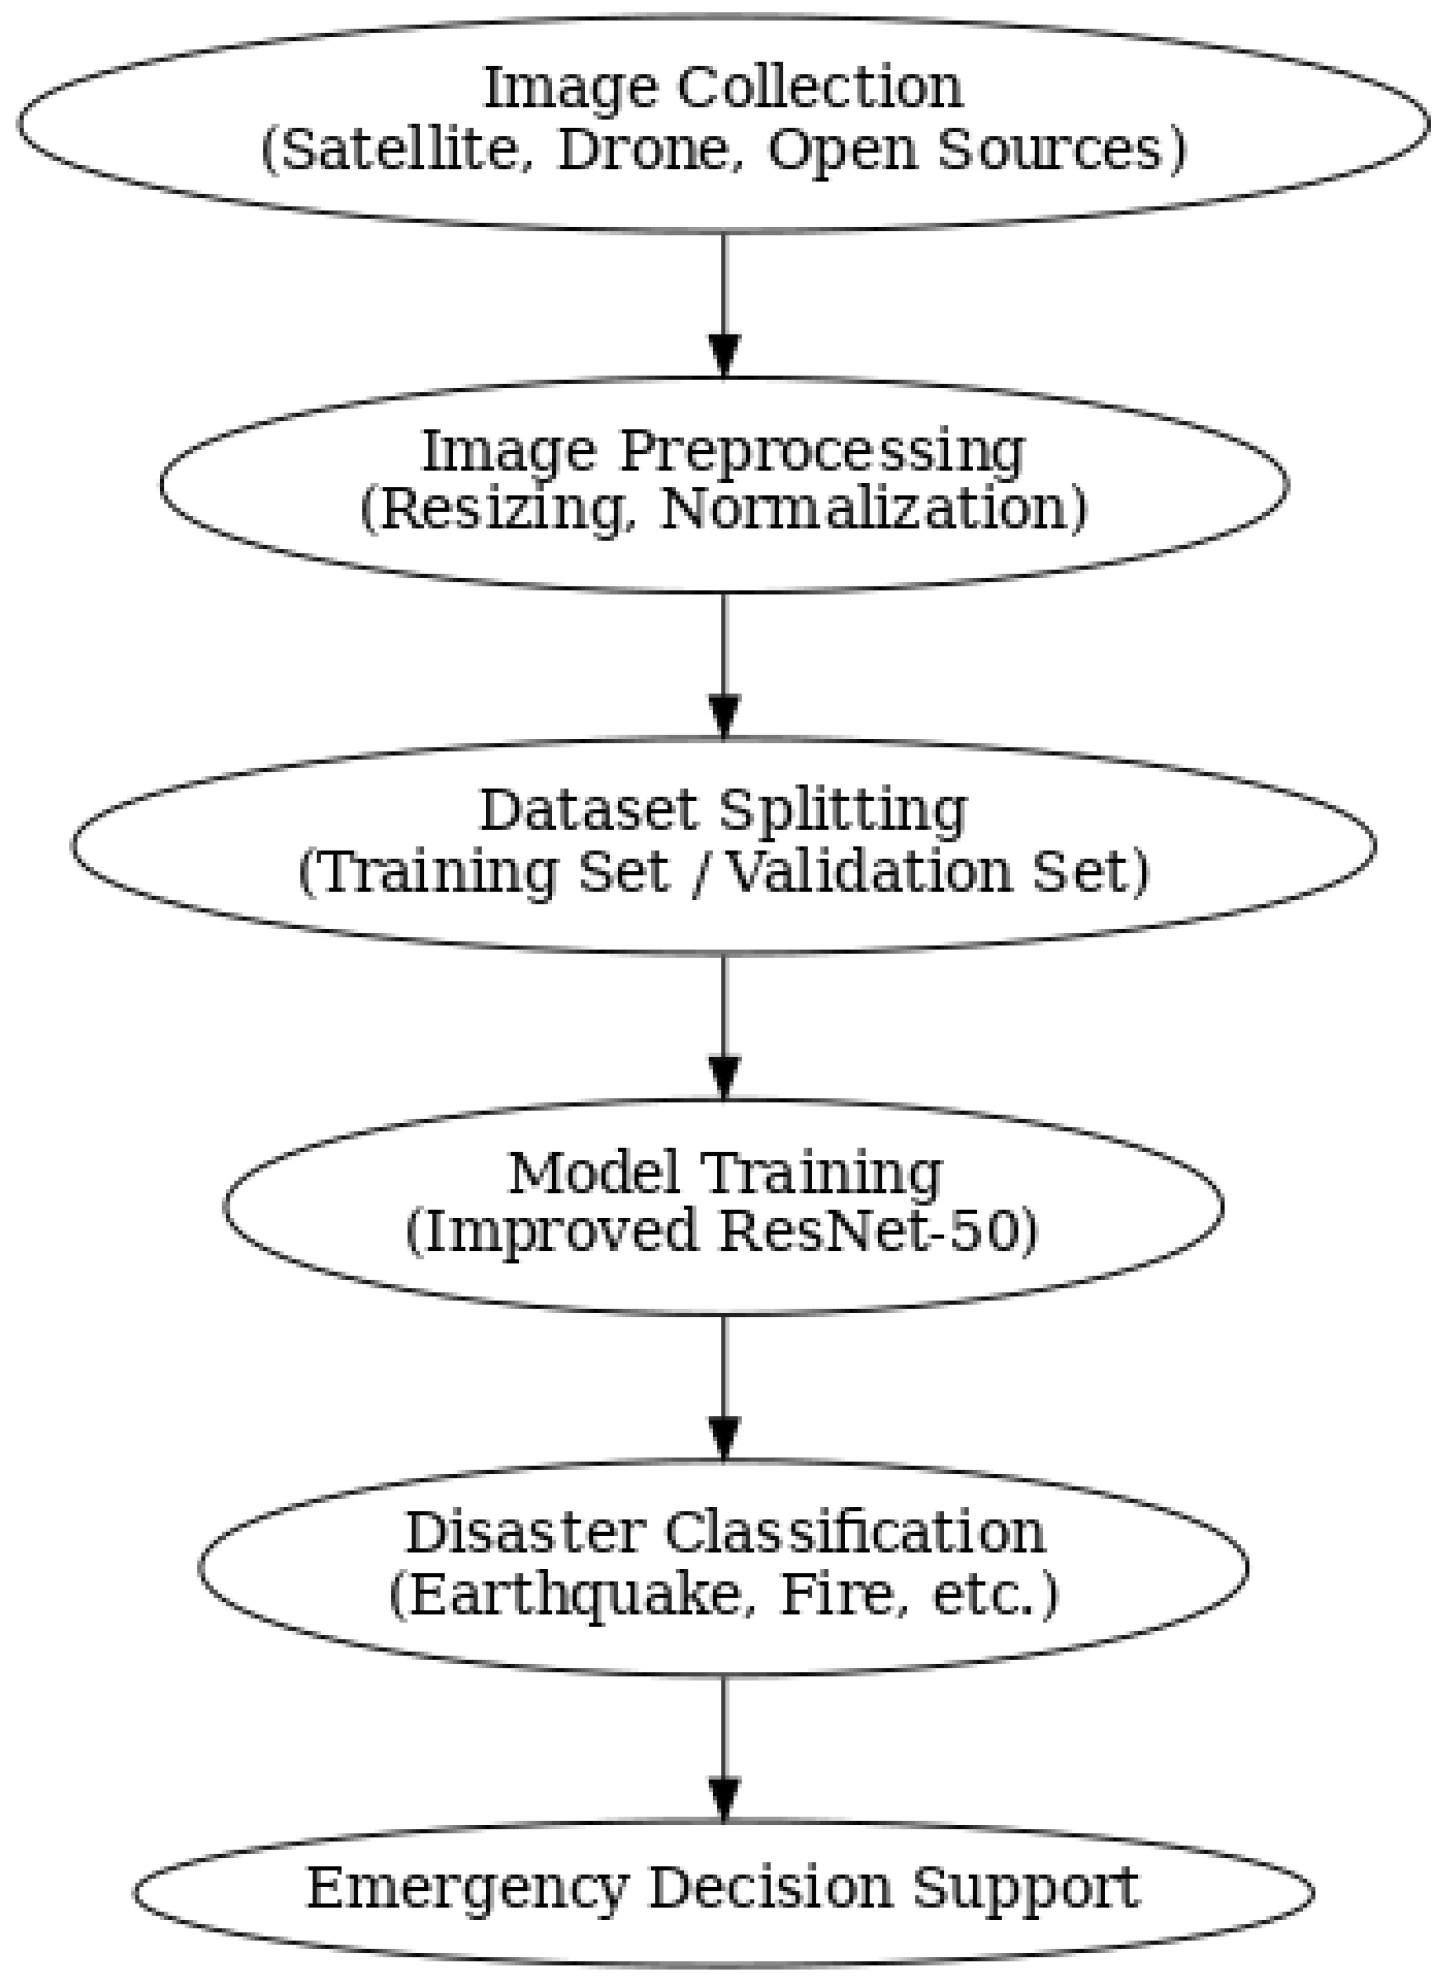
2. Materials and Methods

2.1. Dataset Preparation

In this study, an image dataset encompassing multiple types of disasters, covering seven different disaster categories—earthquakes, fires, floods, debris flows, avalanches, landslides, and ground subsidence—was collected. The dataset was compiled from various open-source databases and websites, with each disaster category containing 100 labeled images, resulting in a total of 700 images [21,22]. To ensure efficient data organization and management, a hierarchical directory structure was adopted in this experiment. All images were categorized and stored according to their respective labels, with the training and test datasets placed in separate root directories. Each disaster category was assigned a dedicated subfolder containing all corresponding images. The validation dataset followed an identical directory structure to the training set, ensuring that the mapping between category labels and images remained consistent throughout the training and validation phases.
To maintain the independence of the validation set and avoid potential data overlap, we carefully reviewed and reprocessed the dataset, selecting a broader range of disaster images that better reflect complex and diverse real-world scenarios. The final validation set contained 140 images (20 images per disaster category), and the training set contained 560 images.
To further evaluate the robustness and generalization capability of the proposed model under different data split ratios, comparative experiments were conducted using three configurations: 9:1, 8:2, and 7:3 for training and validation sets. With the model architecture, training parameters, and data distribution held constant, we compared the model’s performance under each split in terms of accuracy, precision, recall, F1-score, and other evaluation metrics.
The experimental results demonstrate that the model achieved strong classification performance across all split settings. However, the 8:2 split provided the most stable validation accuracy and the best convergence behavior in terms of loss. While the 9:1 split yielded slightly higher training accuracy, the limited validation data led to greater fluctuations in validation results. Conversely, the 7:3 split resulted in slower convergence during training, likely due to a reduction in training data. Therefore, we adopted the 8:2 split as the primary training configuration in this study and maintained it in subsequent experiments to ensure stability and consistency in performance evaluation.
To enhance the generalization ability of the model, we applied data augmentation and preprocessing to the dataset. For the training set, preprocessing techniques included random cropping, random horizontal flipping, and format conversion to increase data diversity and improve model robustness. Additionally, we performed normalization using the mean and standard deviation of ImageNet to ensure consistency with the input distribution of the pre-trained ResNet-50 model. For the test set, we applied resizing, center cropping, and tensor conversion to maintain feature consistency with the training data. Furthermore, to ensure uniformity in model input, we normalized the test set using the same standardization parameters as the training set. These preprocessing strategies help mitigate data distribution biases, enhancing the model’s adaptability and stability in disaster classification tasks [23,24].
To better illustrate the characteristics of the collected disaster images, Figure 1 presents representative feature-highlighted images from seven disaster categories, including avalanche, earthquake, fire, flood, land subsidence, landslide, and mudslide. Red boxes indicate key areas associated with the distinguishing features of each disaster type.
Furthermore, to provide a clearer understanding of the overall workflow from data acquisition to disaster classification, Figure 2 depicts a schematic flow chart. The process includes image collection from multiple sources, preprocessing steps (such as resizing and normalization), classification using the improved ResNet-50 model, and final disaster type output for emergency decision-making support.

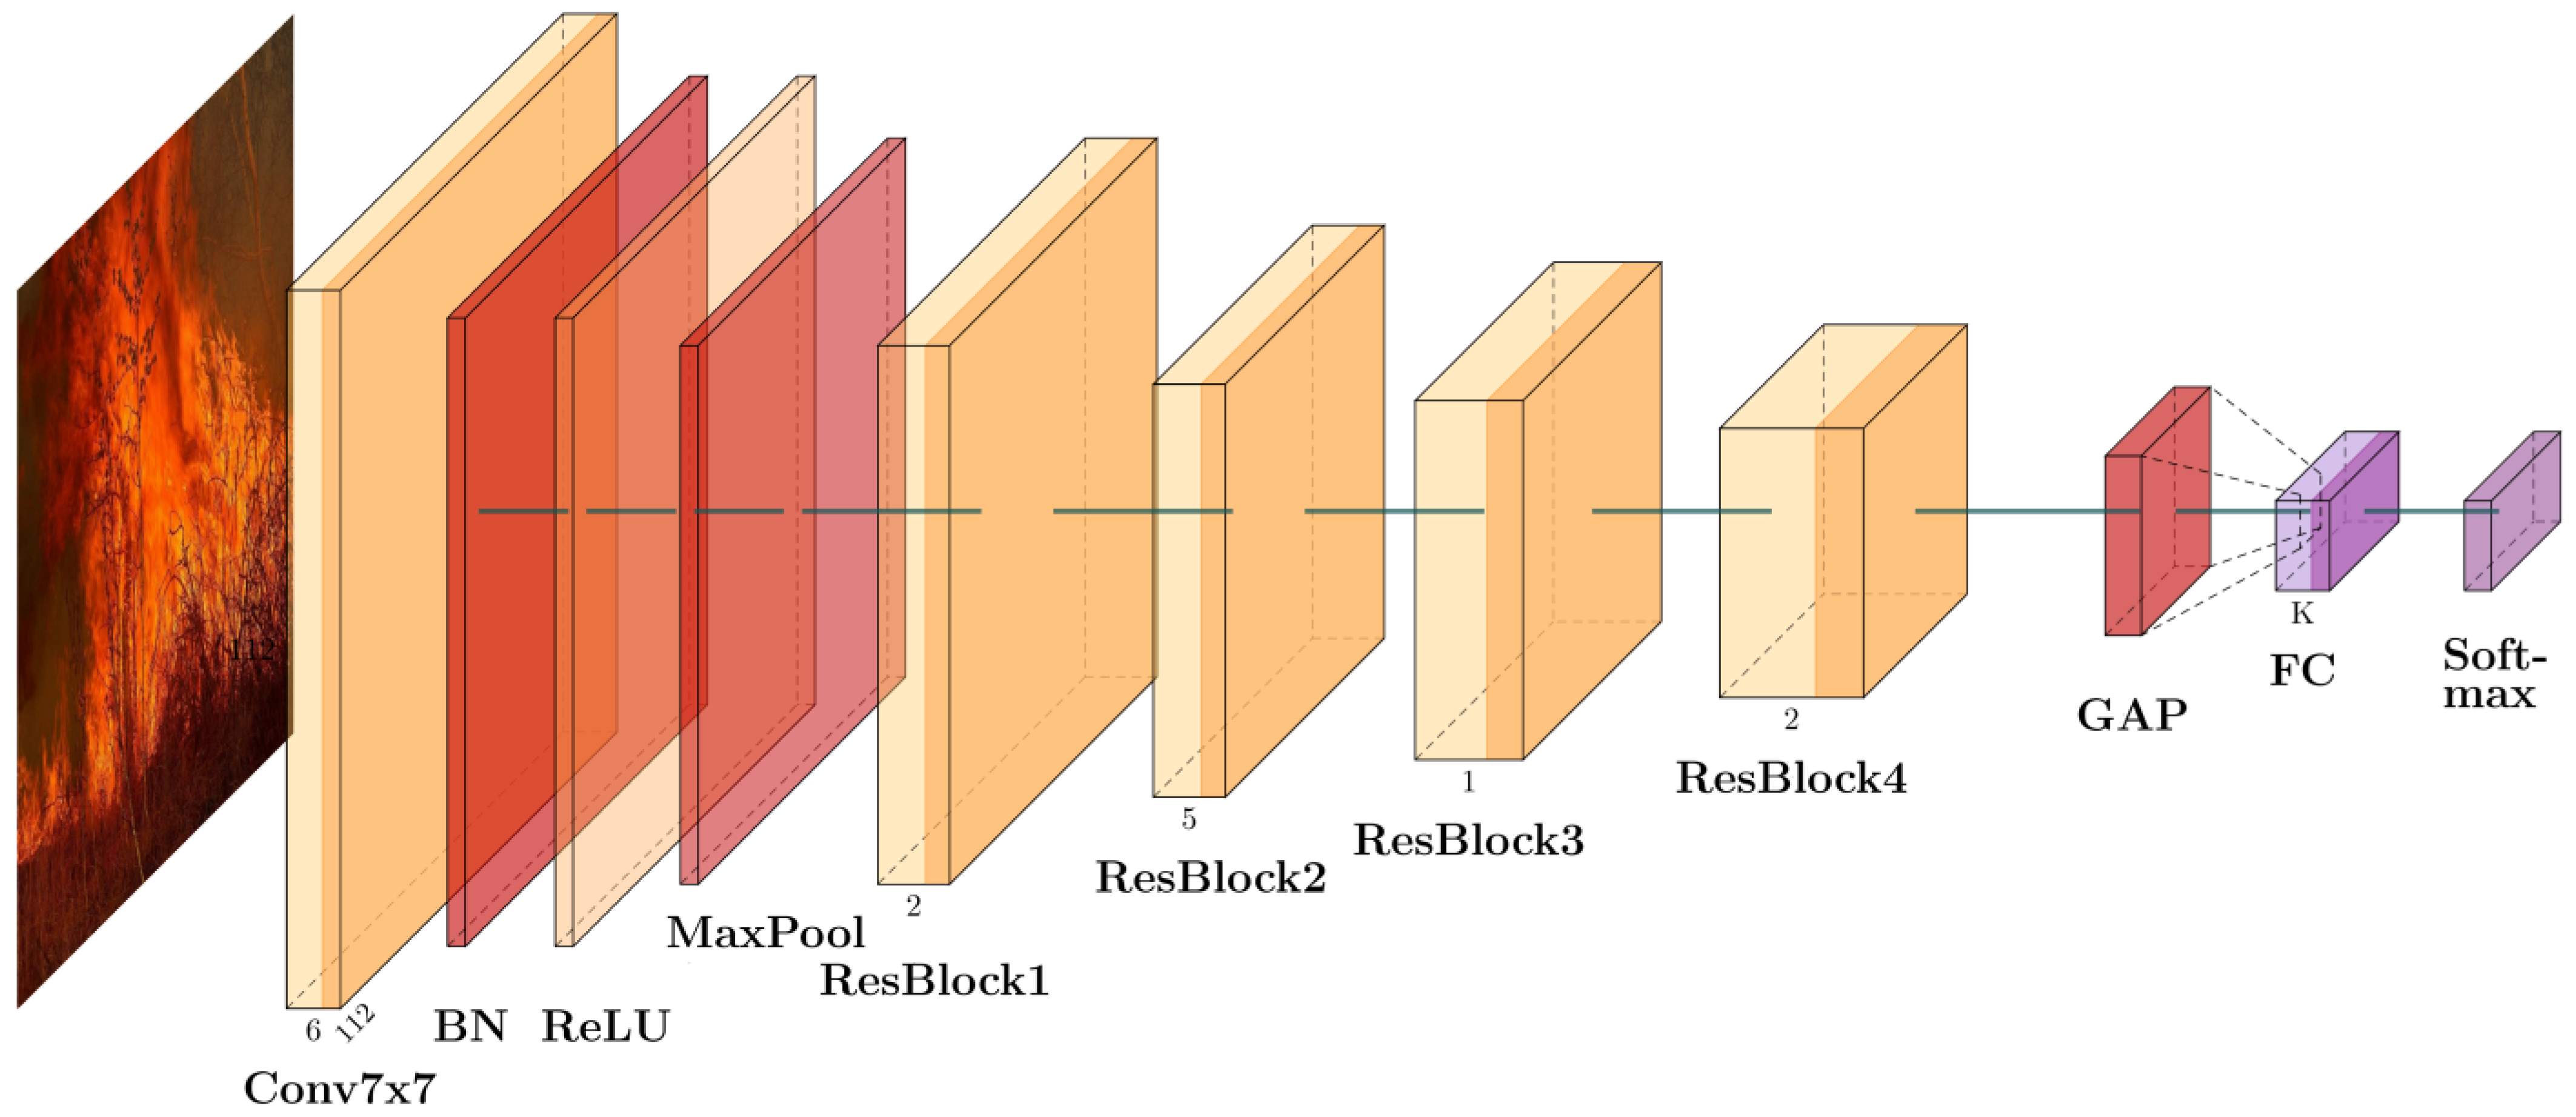
2.2. Model Architecture Design

ResNet-50 was chosen as the core model architecture, with the key features of the introduction of skip connections. These skip connections allow input signals to bypass one or more layers and be directly transmitted to subsequent layers through identity mappings, effectively alleviating the gradient vanishing problem [25]. The residual learning mechanism in ResNet enables the network to learn the difference (residual) between the input and output rather than directly learning a complete mapping function. This approach ensures that as the network depth increases, its performance does not degrade, thereby improving training efficiency and feature extraction capability. The innovation in ResNet has made training deeper networks feasible, allowing models with hundreds or even thousands of layers to effectively maintain gradient flow and achieve stable training performance.
Based on the residual learning mechanism of ResNet, this study adopts ResNet-50 as the core architecture and develops an improved ResNet-50 model for multi-disaster classification and recognition. The visualization of the improved ResNet-50 network model is shown in Figure 3. As illustrated in Figure 3, the proposed improved ResNet-50 model consists of a 7 × 7 convolutional layer, a batch normalization layer, ReLU activation function, 3 × 3 max pooling layer, four groups of residual layers, a global average pooling (GAP) layer, and a fully connected (FC) layer. In this architecture, the residual blocks utilize skip connections to directly add the input signal to the output, effectively mitigating the gradient vanishing issue in deep networks while enhancing training stability and feature extraction capability. Based on this network structure, the following sections provide a detailed explanation of the model construction and training process.

2.2.1. Construction of the Initial Convolutional Layer

First, we preprocess the input disaster images and compute the corresponding input tensor, as shown in Equation (1):
X R N × 3 × H × W
where N represents the batch size, which is the number of samples fed into the neural network during each training iteration; H denotes the image height; and W represents the image width.
Once the input tensor is obtained, the image data preprocessing is completed, ensuring that the deep learning network is well-prepared for feature extraction, gradient propagation, and optimization. Next, the 7 × 7 convolution operation is applied to the image data, with its mathematical formulation given in Equation (2).
Y = W X + b
where W represents the parameters of each convolutional kernel. In this experiment, 64 convolutional kernels of size 7 × 7 are used, with each kernel covering all 3 input channels. Therefore, the parameter matrix has the following dimensions: W R 64 × 3 × 7 × 7 . Y denotes the output feature map after the convolution operation, with dimensions given by W R 64 × 3 × 7 × 7 ; b represents the bias term, which has the following dimensions: R 64 .
For the convolutional output feature map mentioned earlier, the remaining parameters, namely, the spatial dimensions, are computed as shown in Equations (3) and (4).
H = H + 2 p k s + 1
W = W + 2 p k s + 1
By substituting the parameters, the computed results are as follows:
k = 7 , s = 2 , p = 3
H = H + 2 × 3 7 2 + 1 = H 1 2 + 1 H 2
W = W + 2 × 3 7 2 + 1 = W 1 2 + 1 W 2
From the above calculations, it can be observed that after the 7 × 7 convolution, the spatial dimensions of the disaster image feature maps are approximately reduced to half of the original size. Subsequently, we perform independent normalization on each channel of the feature maps to ensure a more stable activation distribution, thereby accelerating the convergence of the network. The normalization formula for each channel of the feature maps output by the 7 × 7 convolution is given in Equation (5).
x i ^ = x i μ B σ B 2 + ϵ · γ + β
where μ B and σ B 2 represent the mean and variance of each channel within the current batch, respectively; γ and β are learnable parameters.
After normalizing the feature maps of each channel, they are passed through the ReLU activation function. The primary role of the ReLU function is to enhance the nonlinear representation capability of the ResNet-50 model while suppressing negative activation values, thereby improving model sparsity and facilitating more effective feature learning. Following this, a 3 × 3 max pooling layer is applied to further reduce the feature map size. The purpose of this operation is to retain the strongest local responses, reduce spatial resolution, and enhance the invariance of local features. Specifically, a 3 × 3 pooling kernel with a stride of 2 is used for downsampling, as defined by Equation (6).
y i j = max m , n 0,1 , 2 x 2 i + m 2 j + n
Through calculation, it can be determined that the max pooling layer further reduces the spatial dimensions of the feature maps to half of the convolution output feature maps. Consequently, the final output feature map Z has the following dimensions: Z R N × 64 × H 4 × W 4 .

2.2.2. Residual Module Design

In the improved ResNet-50 network model, each residual block consists of three convolutional layers and one skip connection. The three convolutional layers are responsible for reducing computational complexity, extracting spatial features, and restoring the number of channels, while the skip connection primarily addresses the gradient vanishing problem, enhancing the stability and learning capability of deep network training. The following section introduces the computational process of the residual block.
The three convolutional layers consist of two 1 × 1 convolutions (dimension reduction and expansion) and one 3 × 3 spatial convolution. After computing the input tensor using Equation (1), the disaster image is first processed by the 1 × 1 dimension reduction convolution, performing the operations in Equation (7), yielding the output: X 1 R N × C m i d × H × W . Next, the feature map undergoes a 3 × 3 spatial convolution, as computed in Equation (8), producing the output: X 2 R N × C m i d × H × W . Finally, the resulting feature map is passed through a 1 × 1 expansion convolution as described in Equation (9), where a scaling factor of 4 is applied to restore the number of channels, resulting in the final output: X 3 R N × 4 C o u t × H × W .
C m i d = C o u t × w i d t h 64
X 2 = W 2 X 1 + b 2
In this experiment, a stride of s = 2 is used, and the calculated results are as follows: H = H 2 , W = W 2 .
X 3 = W 3 X 2 + b 3
The residual connection is the core structure of the ResNet network model. By utilizing cross-layer skip connections, it addresses the training challenges of deep networks. Its primary functions include preventing gradient vanishing, enhancing information flow, and improving optimization performance. The basic formulation is given in Equation (10):
Y = F X , { W i } + X
where X represents the input disaster image feature map, which is directly skipped to the final output; F X , { W i } denotes the disaster image feature map extracted by the first three convolutional layers; Y represents the final output disaster image feature map.
However, when the stride is 2, the feature map size is reduced by half, changing from an input size of H × W to an output size of H 2 + W 2 . In this case, the input X cannot be directly added to F ( X ) due to their mismatched spatial dimensions. To address this, downsampled residual connections are employed, following these steps. First, a 1 × 1 convolution is applied to adjust the input X so that its shape matches F ( X ) , enabling element-wise addition. Additionally, downsampling between stages helps reduce computational complexity while expanding the receptive field. During each stage transition, the spatial dimensions of the feature map decrease while the number of channels increases, allowing deeper network layers to process more abstract and high-level features without significantly increasing computational cost. Moreover, a larger receptive field helps capture broader contextual information, enhancing the model’s global perception capabilities.

2.2.3. Stage-Wise Residual Stacking

To progressively extract hierarchical features and enable the ResNet-50 model to capture disaster image characteristics with greater precision and comprehensiveness, we employ a stage-wise design. In the shallow stages, the model primarily focuses on fundamental features such as edges and textures, capturing fine-grained details. As the network deepens, it learns more semantic and abstract representations, such as local and global structures of various disaster types, enhancing classification accuracy. Moreover, stacking residual blocks plays a crucial role in improving the feature learning capacity of the disaster classification model. In this study, we adopt the Bottleneck structure, which not only reduces the number of parameters and enhances computational efficiency but also improves the model’s nonlinear representation capability, making it more suitable for complex disaster classification tasks. For implementation, we leverage the make_layer function in the PyTorch 2.3.0 framework to construct residual blocks across four distinct stages, as shown in Table 1. To optimize computational efficiency, we apply a stride of 2 in the first residual block of each stage for down-sampling, while keeping the stride at 1 in the subsequent blocks. This approach effectively reduces computational complexity, expands the receptive field, and balances changes in the number of channels, ensuring that the model can efficiently learn and extract disaster-related features at multiple levels.

2.2.4. Global Feature Aggregation and Classification

After stacking the residual blocks across four stages, the network ultimately produces an output feature map of size X s t a g e R N × 2048 × 7 × 7 . To further process this feature map, global feature aggregation is applied to enhance global information modeling. Specifically, through Equation (11), each 7 × 7 disaster image feature map is compressed to a 1 × 1 size, ensuring that global information is effectively aggregated while retaining the channel dimension information. As a result, the final output feature map is of size Y p o o l R N × 2048 × 1 × 1 .
y c = 1 7 × 7 i = 1 7 j = 1 7 x c i j
where y c represents the pooled output of the c -th channel; x c i j denotes the feature value at row i and column j of the c -th channel.
Since the fully connected layer can only accept one-dimensional inputs, the output obtained from Equation (11) must undergo a flattening operation. Specifically, this can be achieved using the flatten function from the Torch library, resulting in a flattened feature map of Y f l a t R N × 2048 . Next, a fully connected layer is used to map the 2048-dimensional feature vector into a 7-dimensional disaster category prediction vector, with the computation process defined in Equation (12).
Z = W f c Y f l a t + b f c
where W f c R N c l a s s e s × 2048 represents the weight matrix of the fully connected layer; b f c R N c l a s s e s denotes the bias term; Z R N × N c l a s s e s represents the unnormalized classification scores.
The classification scores computed by Equation (12) are unnormalized, requiring further processing through the Softmax function to convert the logits into a probability distribution for each class. The computation is given by Equation (13), ensuring that the normalized P i satisfies i = 1 N c l a s s e s P i = 1 .
P i = e z i j = 1 N c l a s s e s e z j
where P i represents the predicted probability of the sample belonging to class i . z i denotes the logit score of the sample for class i .
The final network output is P R N × N c l a s s e s , representing the predicted probability distribution of each sample across all classes.

2.2.5. Parameter Initialization and Training Strategy

After completing the previous model construction, we proceed with the training of the disaster classification model. For the ResNet-50 model, a proper parameter initialization strategy is essential for accelerating convergence. Therefore, the following initialization strategies were applied to optimize the training process.
For the convolutional layers, this study employs the Kaiming normal initialization method, where the convolution kernel weights are denoted as W , and each element follows Equation (14). This approach ensures that activations maintain a reasonable variance at initialization, enhancing training stability. For the fully connected layers, we initialize parameters using a zero-mean Gaussian distribution, with the distribution satisfying Equation (15) to maintain a well-balanced initialization. Furthermore, in the multi-class disaster classification task, we define a loss function (Equation (16)) to optimize model performance. For parameter updates, this study adopts the Adam algorithm (Equation (17)), which not only adapts the learning rate dynamically but also incorporates momentum, making it a widely used optimization method in deep learning network training.
W ~ N 0 , 2 1 + a 2 · f a n i n
where f a n i n represents the size of the input channels, referring to the number of elements involved in summation within the convolutional kernel; a denotes the negative slope coefficient of the ReLU activation function.
W f c ~ N 0,0.01 , b f c = 0
where bias initialization is set to 0, and standard deviation is set to 0.01.
L y , y ^ = i = 1 N c l a s s e s y i log y i ^
where N c l a s s e s represents the total number of classes; y i denotes the indicator of the true label for class i (0 or 1); y i ^ represents the predicted probability of the sample belonging to class i .
θ t + 1 = θ t m t ^ v t ^ + ϵ
where θ t represents the parameter vector at the t-th iteration; m t ^ , v t ^ are the bias-corrected estimates of the first and second moments, respectively; ϵ is a numerical stability constant, set to 10 8 in this experiment.
With the model architecture design, parameter initialization, and training strategy established in the previous sections, the model can now be fully trained and deployed to achieve classification and recognition of various disaster images. The following section will further discuss the model’s prediction performance and compare it with the traditional neural network model (VGG16).

3. Results and Discussion

Based on extensive theoretical foundations and experimental validation, this study conducted disaster image classification testing using the improved ResNet-50 model. The results from testing a large number of disaster images demonstrate that the model can effectively classify and identify different types of disaster images. Additionally, the model’s performance was analyzed using four key evaluation metrics: accuracy, precision, recall, and F1-score. We further examined the confusion matrix to assess the model’s classification performance and potential biases across different disaster categories. Moreover, by analyzing training and validation loss curves, we evaluated the model’s convergence behavior and stability [26]. Finally, a comparative discussion was conducted between the improved ResNet-50 model and the traditional VGG16 network, focusing on classification accuracy and training stability. The following sections provide a detailed analysis and discussion of the model’s evaluation and experimental results.

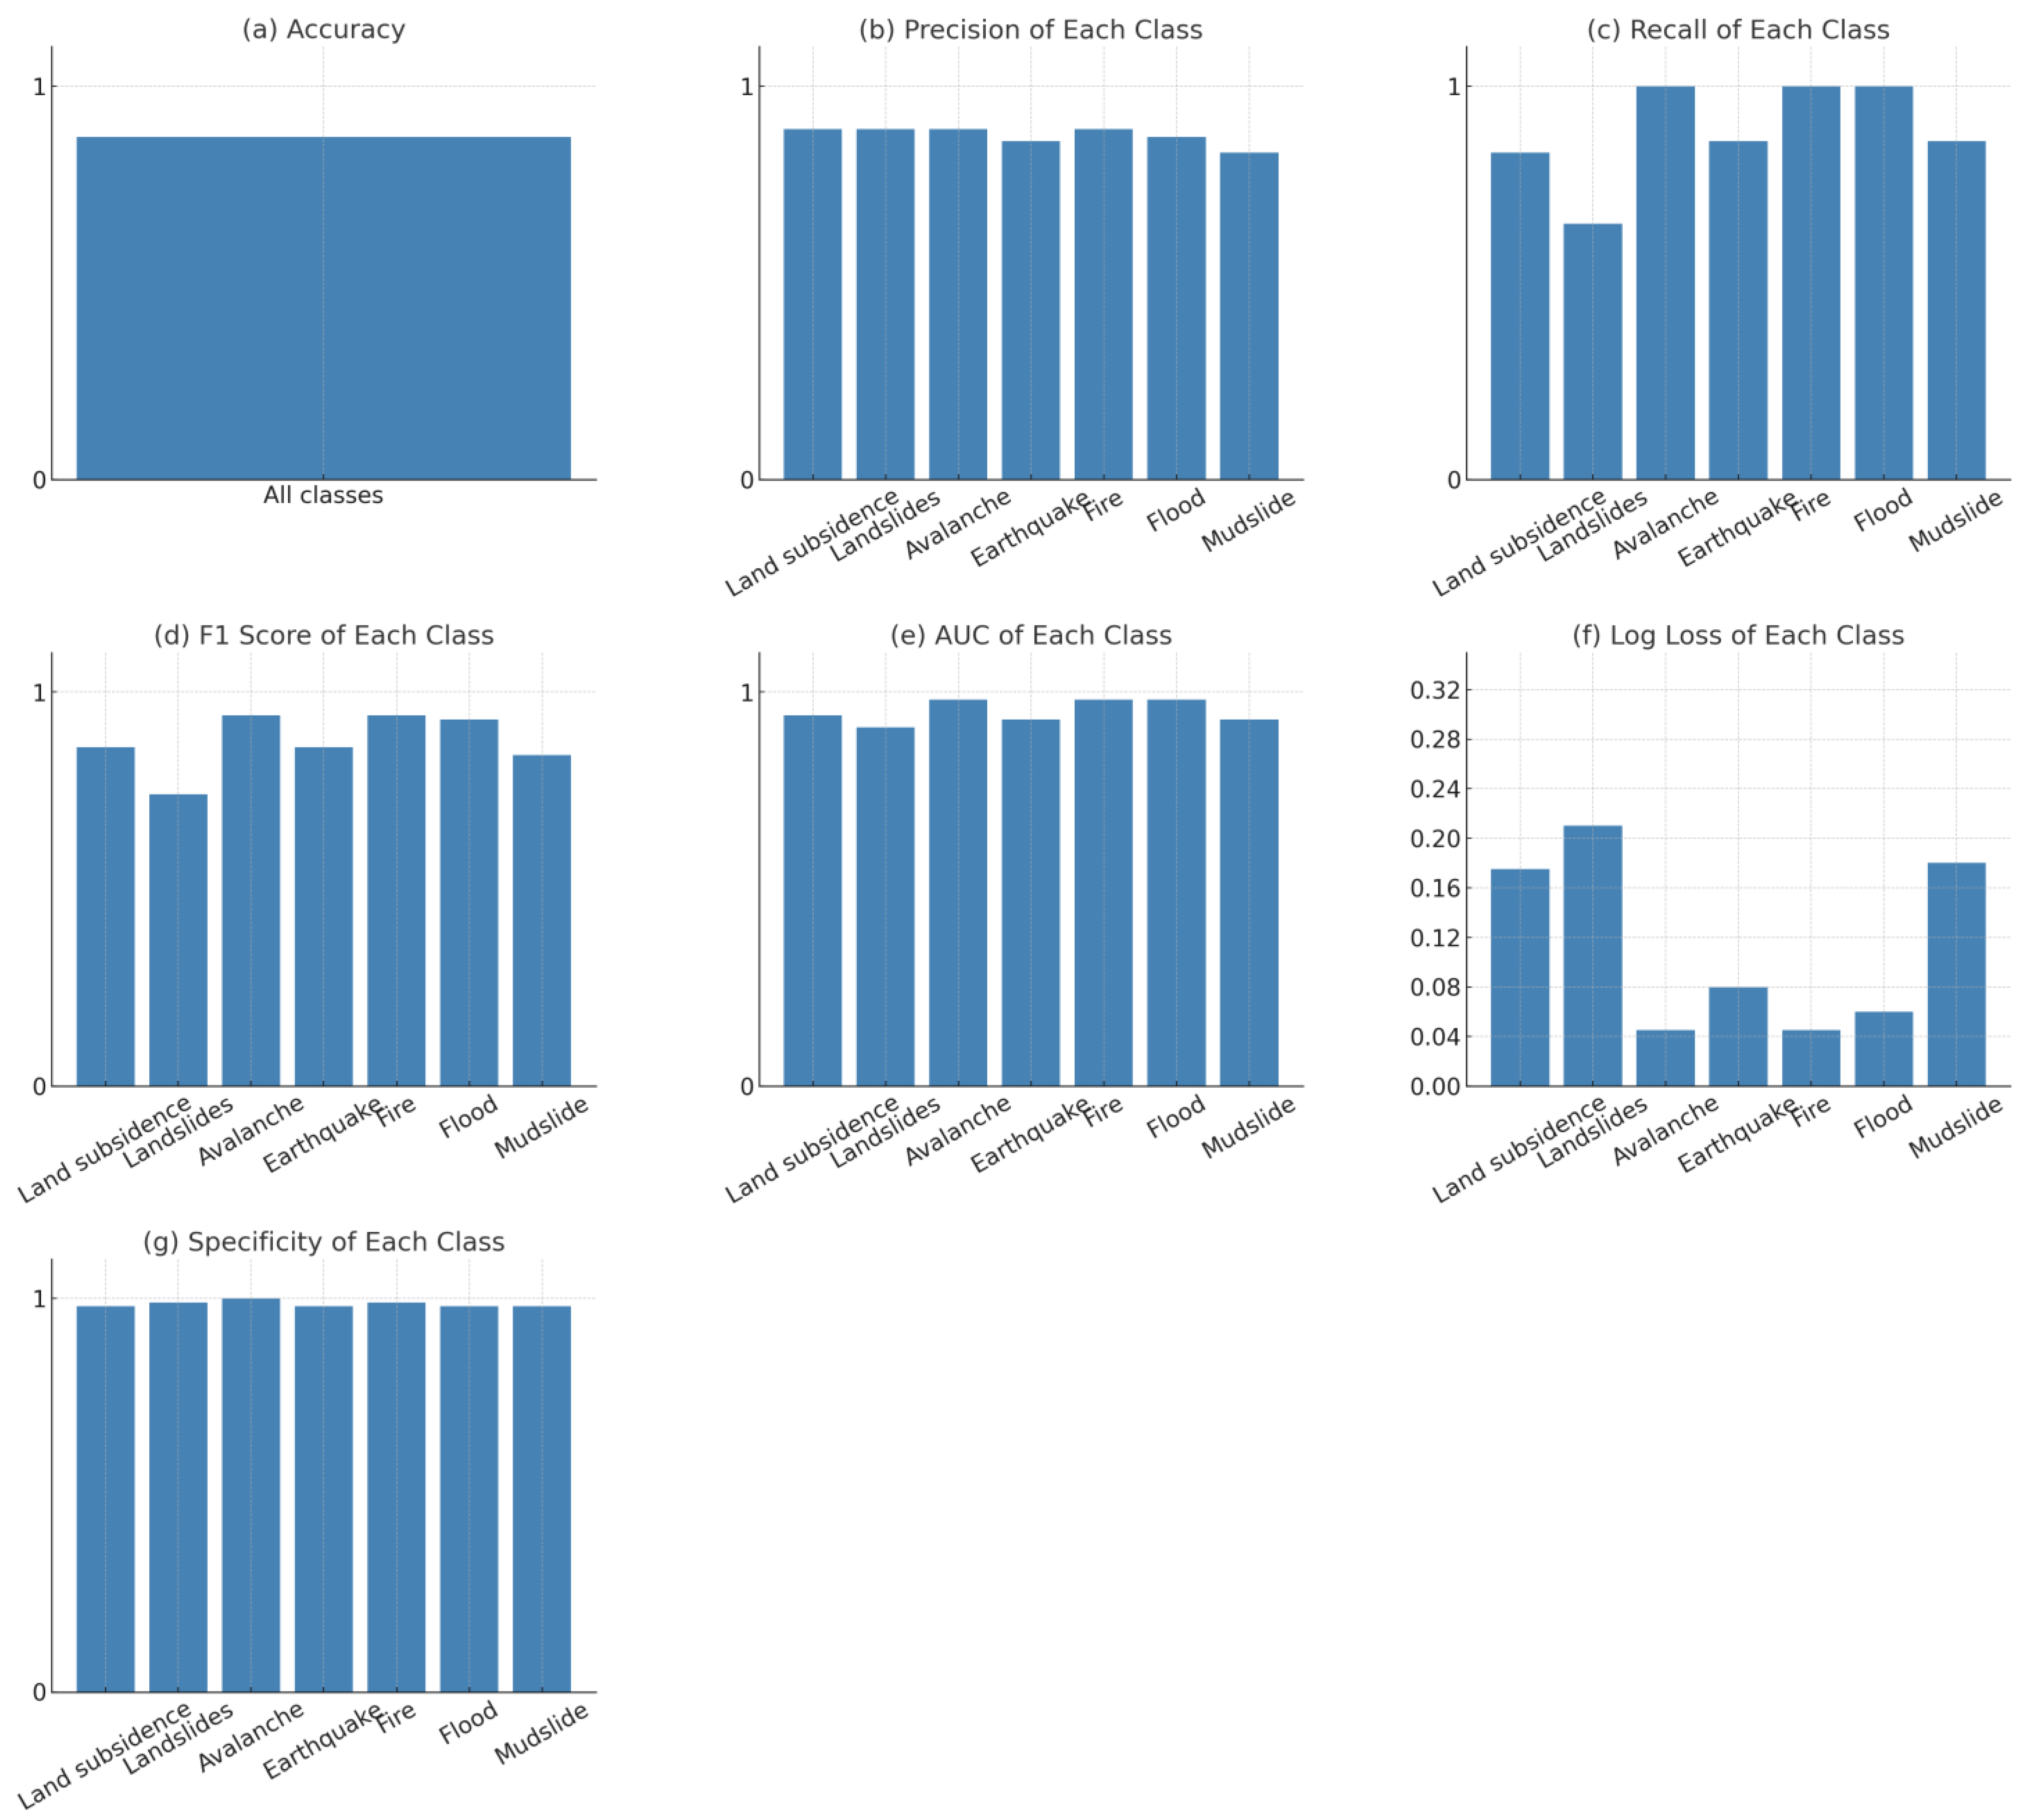
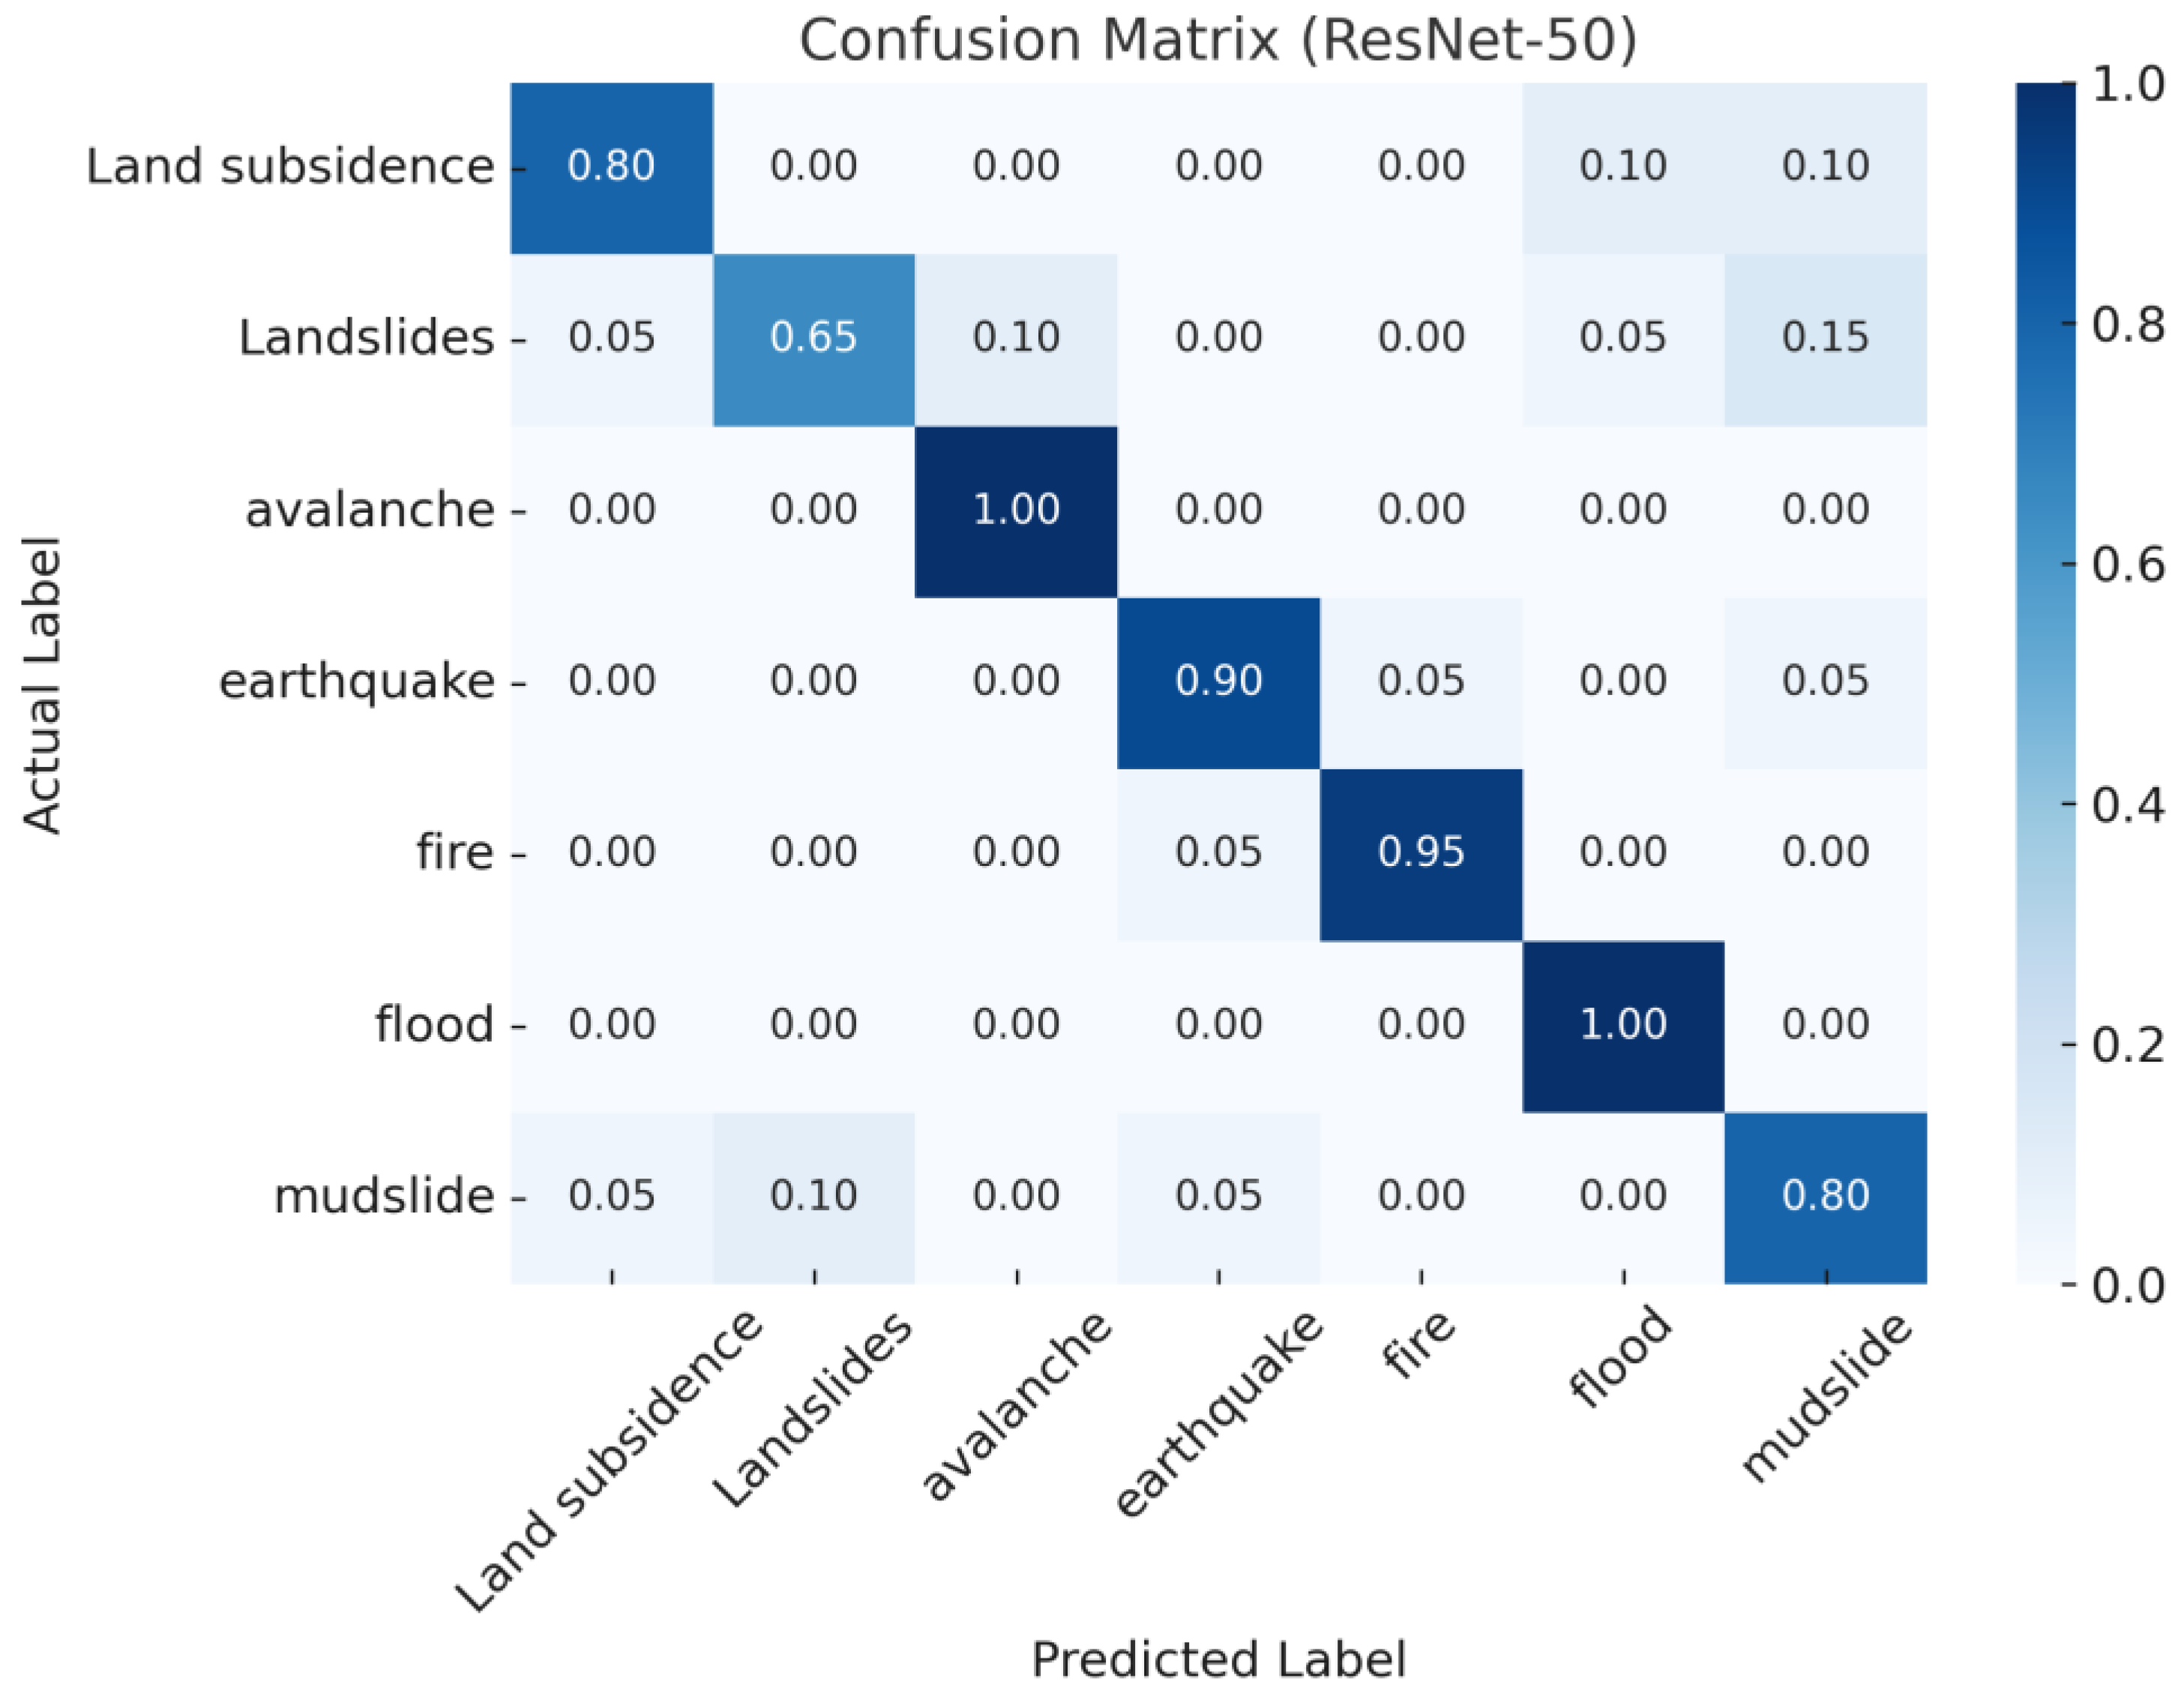
3.1. Evaluation of Model Classification Performance

For the multi-class disaster classification task, this study computed the accuracy (Equation (18)), precision (Equation (19)), recall (Equation (20)), and F1-score (Equation (21)) for each disaster category and used macro-averaging to evaluate the overall model performance. Table 2 presents the classification report of the proposed model on seven natural disaster categories in the test set. As shown in the table, the classification performance varies slightly across categories. The highest F1-score of 0.95 was achieved in the “avalanche” and “fire” categories, while the lowest F1-score (0.74) appeared in “landslides”. The overall accuracy on the test set reached 87%, indicating satisfactory classification capability.
Furthermore, to provide a more comprehensive evaluation of the model’s performance, additional metrics, including the area under the ROC curve (AUC), logarithmic loss (Log Loss), and specificity, were calculated. In the classification report, the term support refers to the number of ground truth instances used to evaluate each class. The model achieved an average AUC of 0.957, an average specificity above 0.96, and a log loss of 0.134, demonstrating its robust discrimination ability, high confidence in probabilistic outputs, and strong resilience to false positives. These metrics further confirm the effectiveness and generalization ability of the improved ResNet-50 model in multi-category disaster image classification tasks.
Here, Figure 4 further provides a visualized supplement to the quantitative results presented in Table 2. The figure depicts the distributions of precision, recall, F1-score, AUC, specificity, and log loss across the seven disaster categories. In addition, the overall classification accuracy of the model is also included in the visualization. This comprehensive depiction facilitates a clearer and more intuitive understanding of the model’s performance on each disaster type as well as its general classification capability.
A c c u r a c y = T P + T N T P + T N + F P + F N
P r e c i s i o n = T P T P + F P
R e c a l l = T P T P + F N
F 1 s c o r e = 2 × P r e c i s i o n × R e c a l l P r e c i s i o n + R e c a l l
where TP (True Positive) is the number of correctly predicted positive samples for a given class; TN (True Negative) is the number of correctly predicted negative samples (non-class samples); FP (False Positive) is the number of incorrectly predicted positive samples (non-class samples misclassified as the target class); and FN (False Negative) is the number of incorrectly predicted negative samples (target class samples misclassified as other classes).
In addition to the six evaluation metrics discussed previously, a normalized confusion matrix was constructed to further analyze the classification performance of the proposed ResNet-50-based model on the validation set. As illustrated in Figure 5, the matrix demonstrates that the majority of predictions are concentrated along the diagonal, indicating a high degree of accuracy in classifying most disaster types. Notably, the model achieved perfect classification for avalanche and flood, with a normalized value of 1.00, and high accuracy for fire (0.95) and earthquake (0.90).
However, relatively lower values were observed for landslides (0.65) and mudslides (0.80), suggesting minor confusion with other visually similar categories. These results reflect the model’s strong ability to extract discriminative features across complex disaster categories, while also highlighting areas where further improvements in fine-grained classification may be necessary. Overall, the confusion matrix validates the model’s robust and consistent performance under multi-class disaster recognition scenarios.
Figure 6 illustrates the training and validation curves of the proposed disaster classification model over 50 epochs. As shown in the accuracy curve (Figure 6a), the training accuracy rapidly increases and stabilizes above 94% within the first few epochs. The validation accuracy also rises quickly during the early training phase, eventually stabilizing around 82% despite minor fluctuations, indicating consistent generalization capability.
The loss curve (Figure 6b) further demonstrates that the training loss continuously decreases and remains at a low level throughout the process. In contrast, the validation loss shows slight oscillations but does not exhibit divergence, suggesting that no overfitting occurs. These patterns confirm that the model converges effectively and maintains a stable training process.
The integration of the residual network structure facilitates efficient feature learning and alleviates the vanishing gradient problem, enabling the model to achieve robust performance with relatively few training epochs.

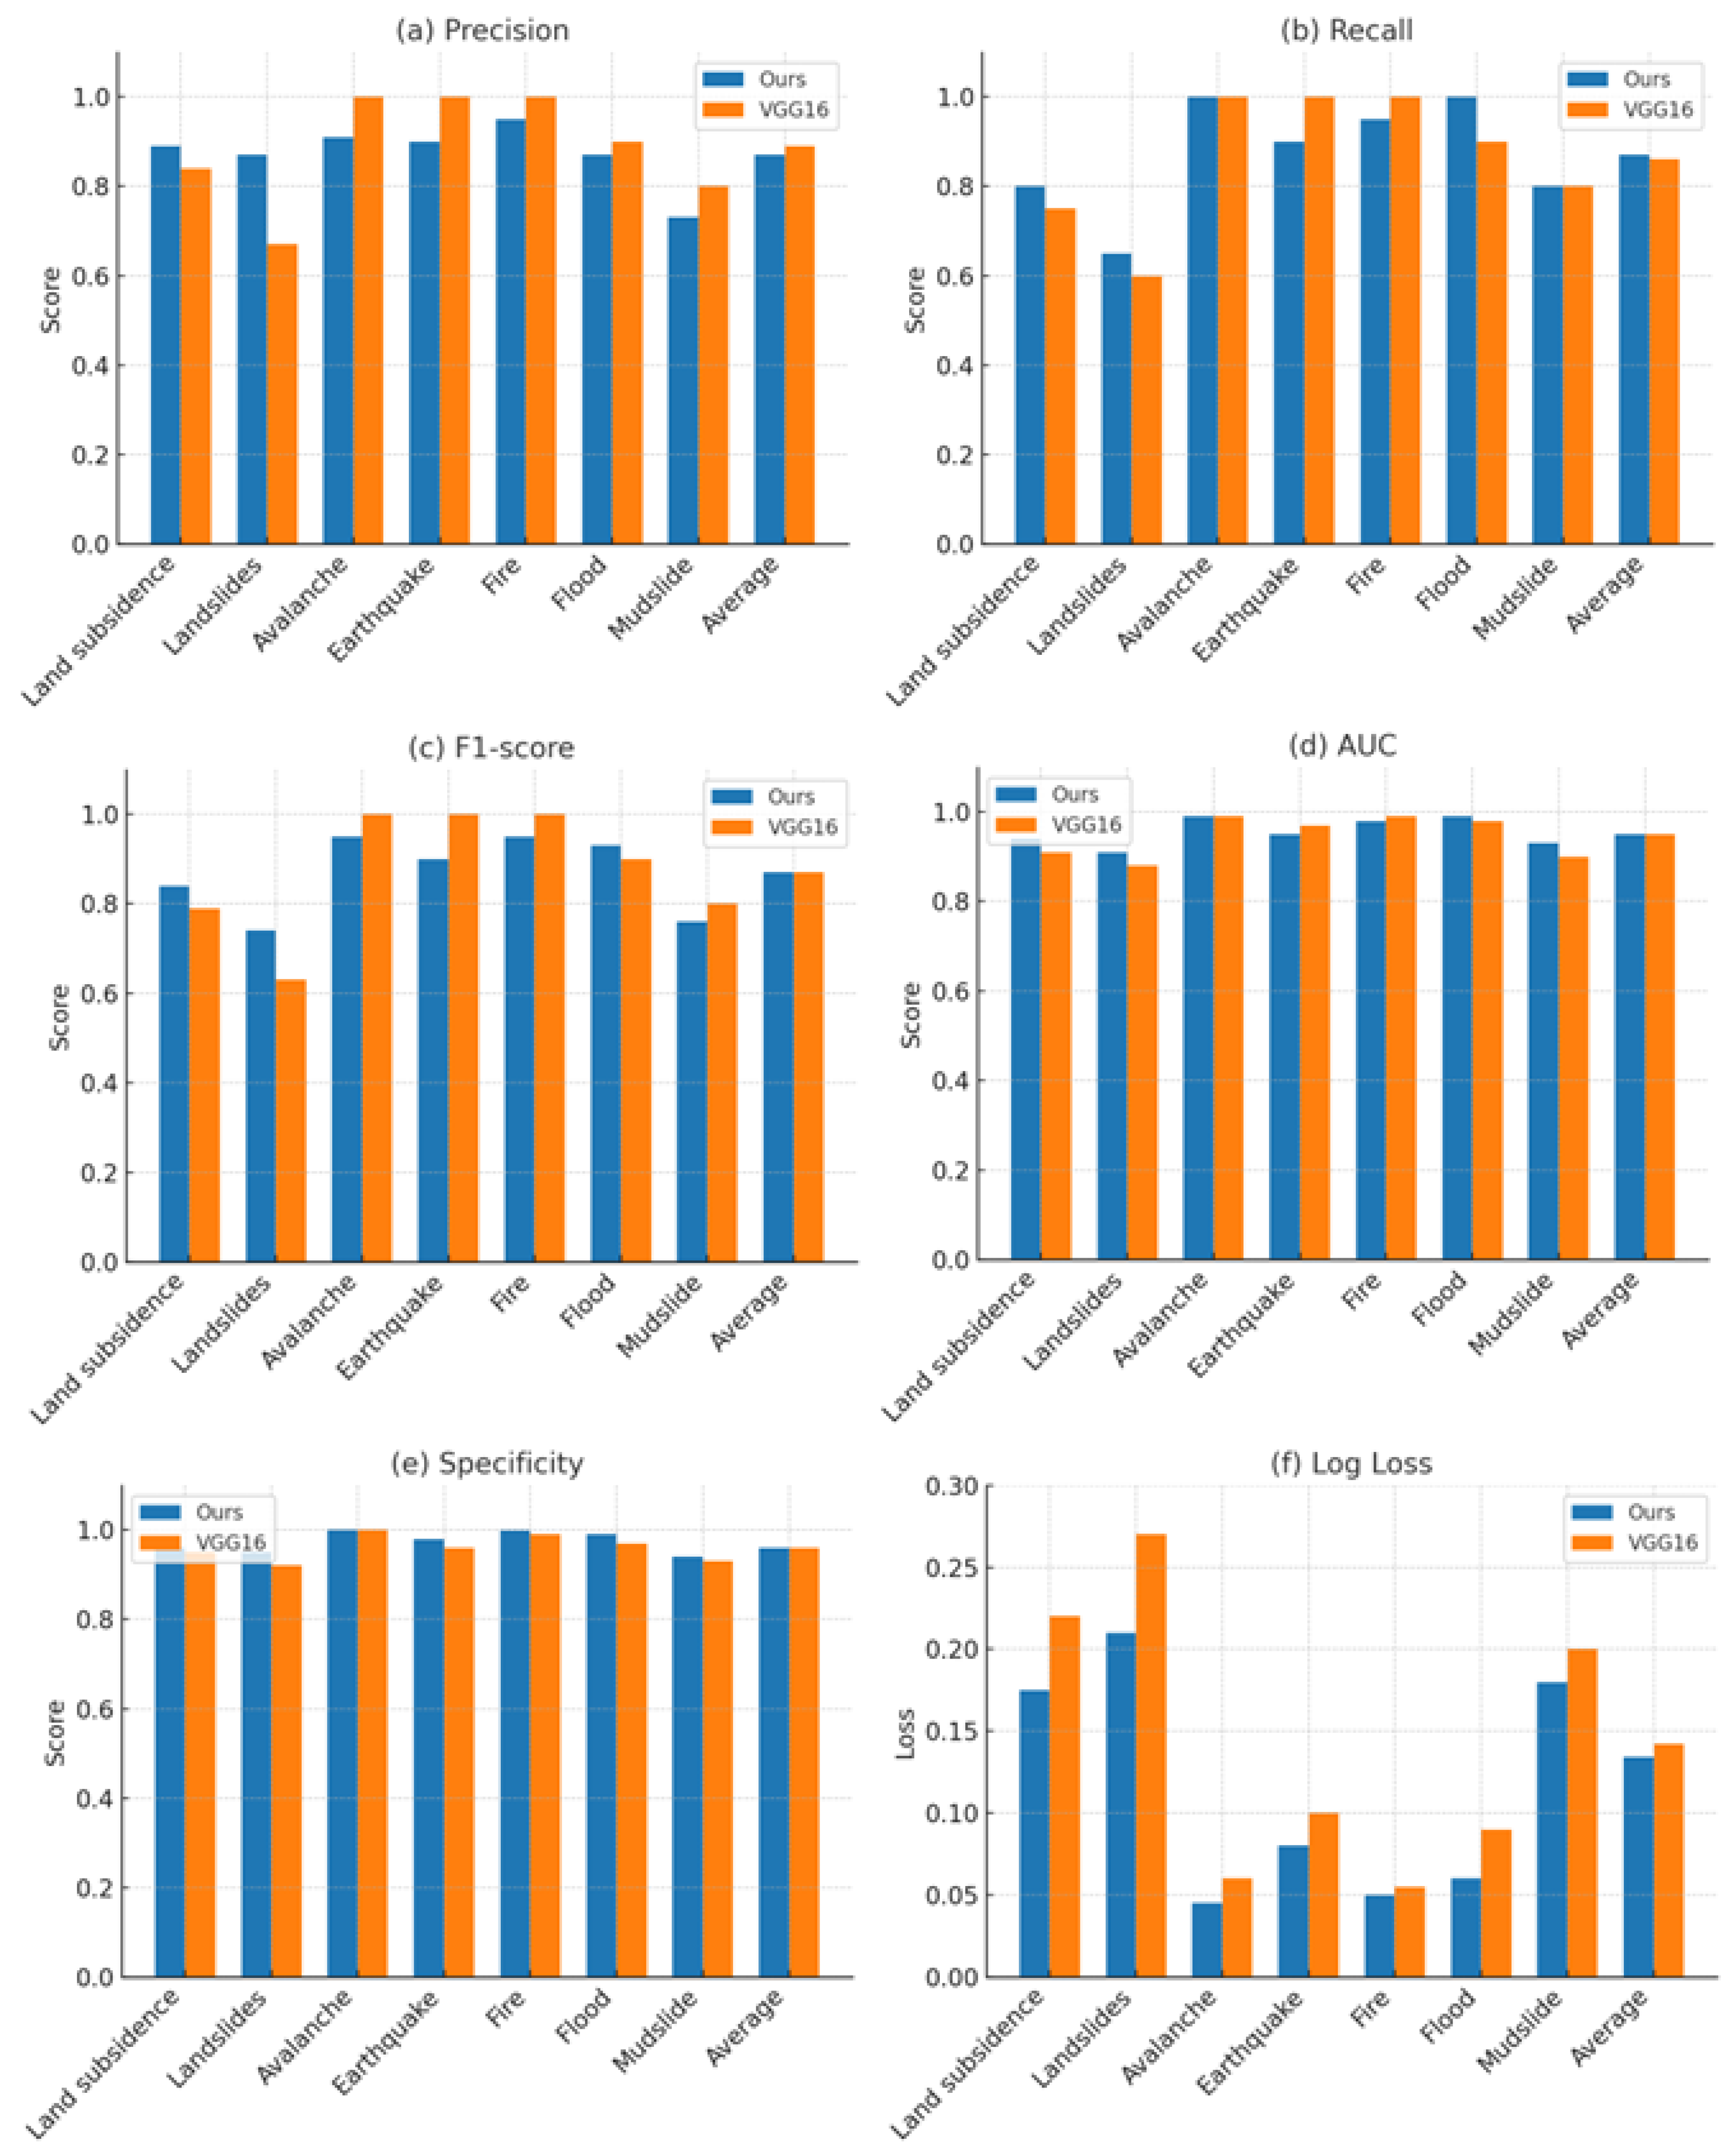
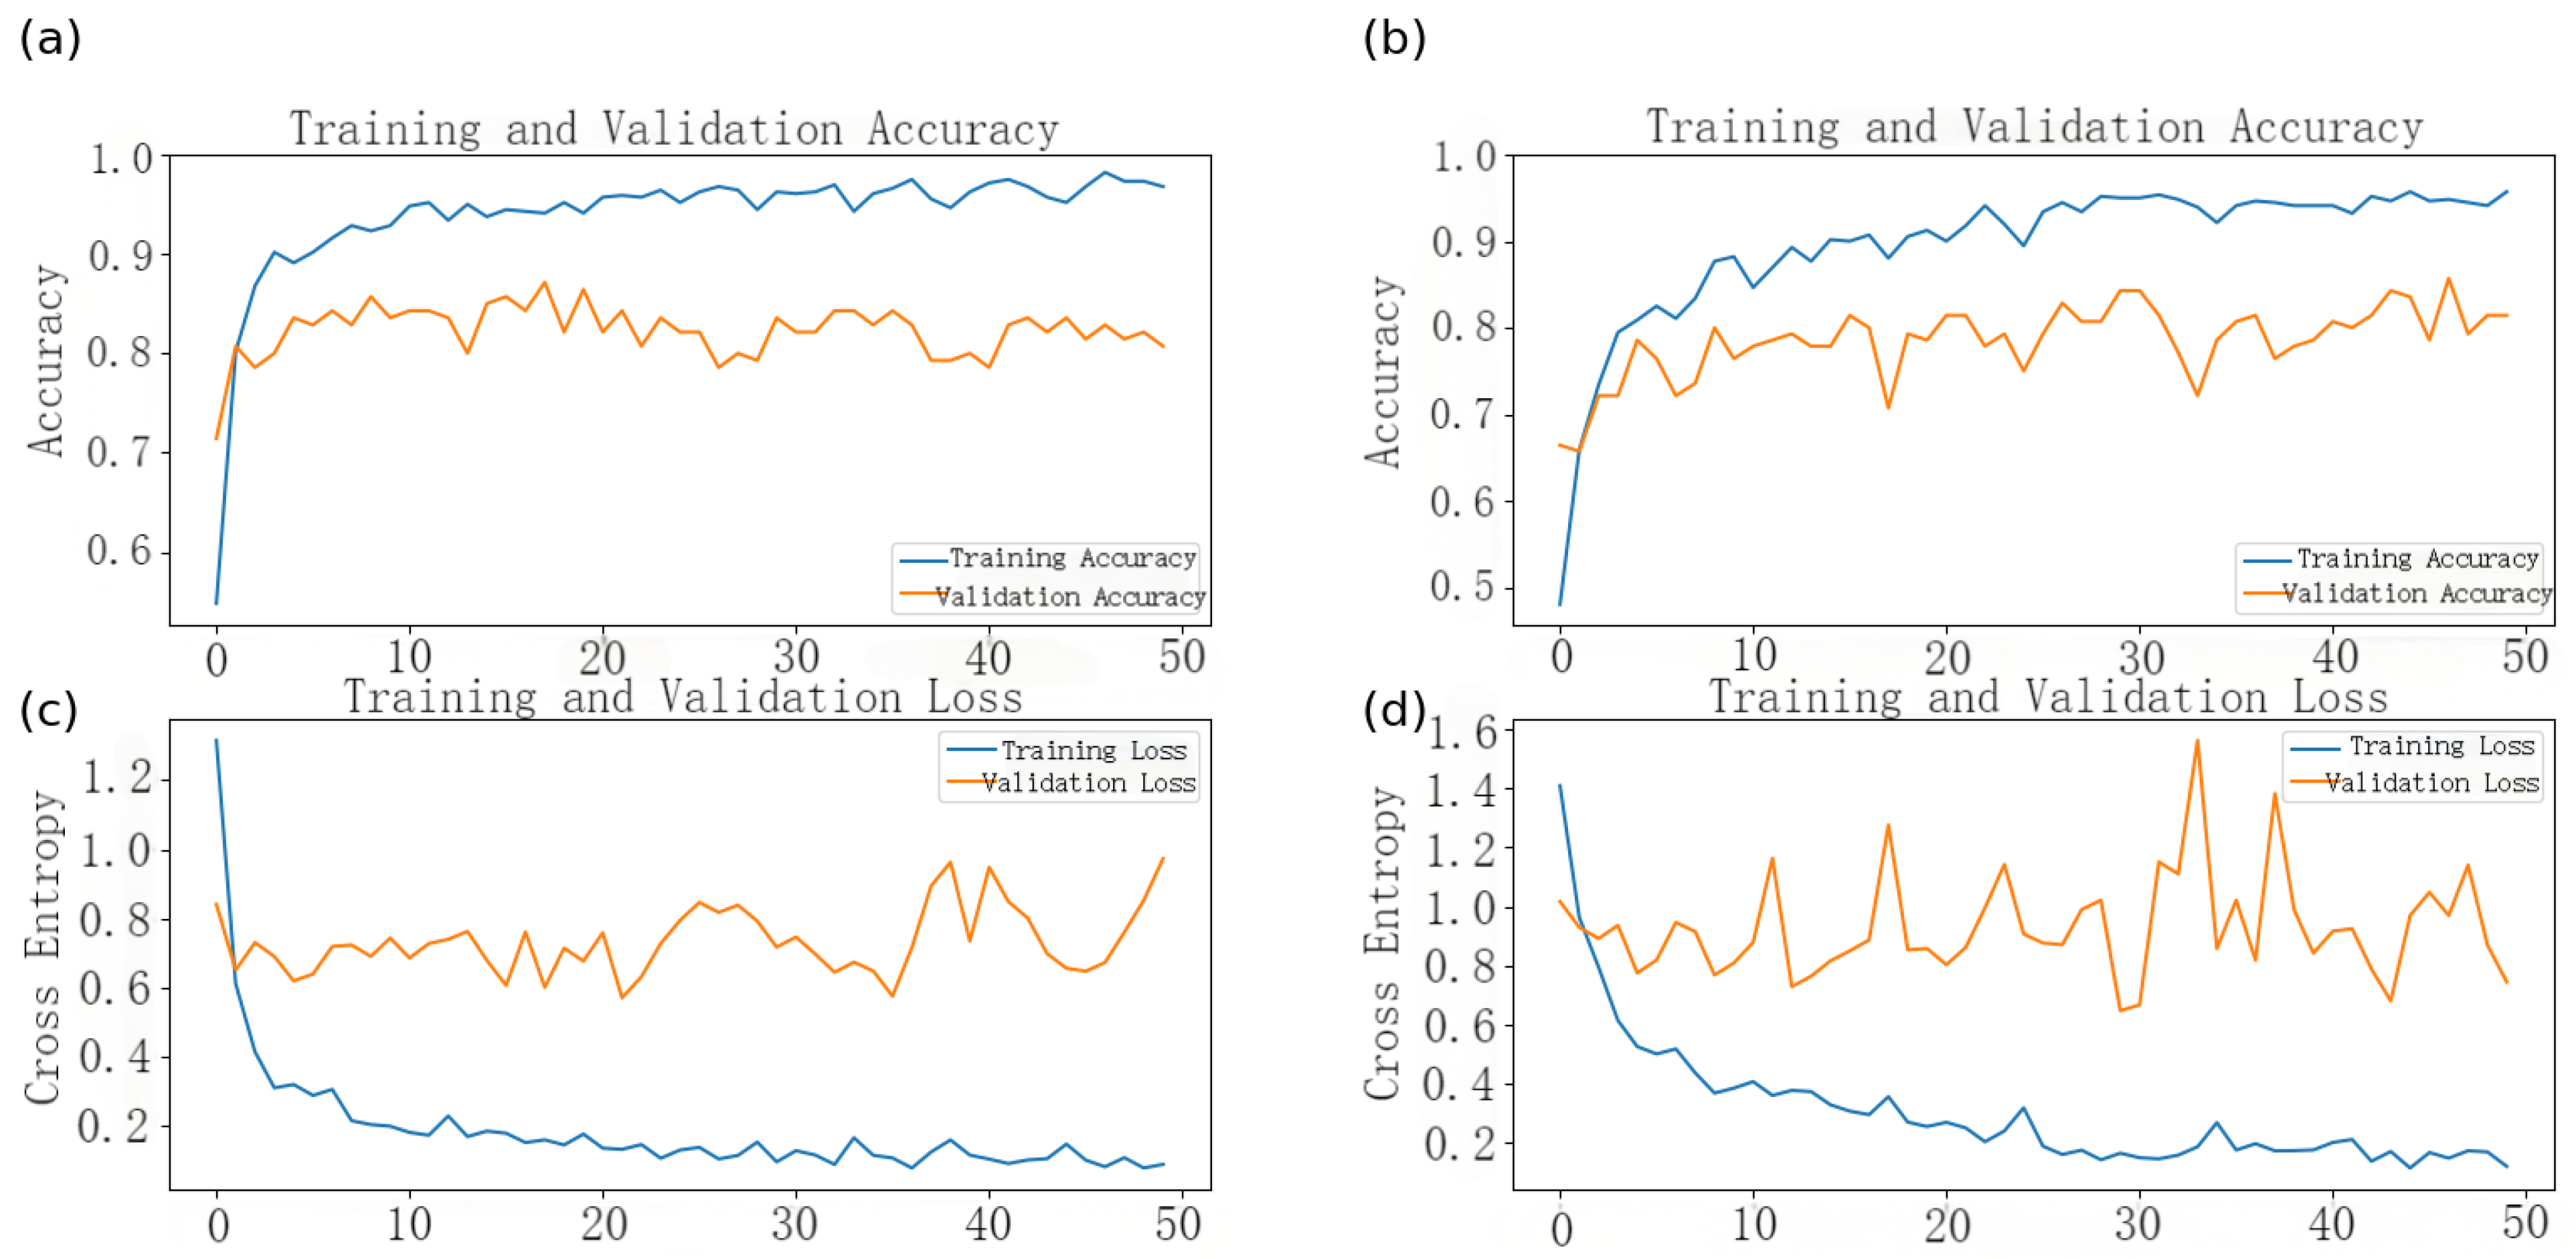
3.2. Model Performance Comparison

VGG16 is a classic deep convolutional neural network, which consists of stacked 3 × 3 convolutional layers and max pooling layers, forming a deep network that progressively extracts features from low-level to high-level representations, ultimately achieving classification through fully connected layers [27].
To comprehensively evaluate the effectiveness of the proposed ResNet-50-based model, comparative experiments were conducted against the traditional VGG16 model using the same disaster classification dataset. Figure 7 presents the performance comparison across six key evaluation metrics, including precision, recall, F1-score, AUC, specificity, and log loss. As shown, the proposed model consistently outperforms VGG16 in most metrics for the majority of disaster categories. In particular, it achieves higher average values in recall (0.87 vs. 0.86) and F1-score (0.87 vs. 0.87) and exhibits lower log loss (0.134 vs. 0.142), reflecting better prediction confidence and classification robustness. Additionally, the overall classification accuracy of both models is summarized in Table 3.
Further insight is provided by the normalized confusion matrices in Figure 8, which depict the classification performance of both models on the validation set. The ResNet-50 model demonstrates stronger diagonal dominance, especially in categories such as flood, avalanche, and fire, indicating improved capability in correctly identifying various disaster types. In contrast, the VGG16 model shows slightly higher misclassification rates in categories like landslides and mudslides. These comparative results confirm that the proposed model achieves superior generalization and discrimination ability across diverse disaster scenarios.
In addition to evaluating classification performance, this study further investigates the training dynamics and stability of both models. As shown in Figure 9, the proposed ResNet-50-based model exhibits significantly smoother and faster convergence during training. Specifically, in Figure 9a,c, the training accuracy of ResNet-50 increases rapidly and stabilizes above 94%, while the validation accuracy consistently remains around 82%, with minimal fluctuation. Simultaneously, the training loss steadily decreases and converges to a low value, and the validation loss remains relatively stable, indicating robust generalization and no signs of overfitting.
In contrast, the VGG16 model, illustrated in Figure 9b,d, shows slower convergence in the early training stages, with greater fluctuation in both accuracy and loss. Although the training loss continues to decline, the validation loss remains relatively high and oscillatory, suggesting limited learning capacity or possible underfitting. These results demonstrate that the residual connections in ResNet-50 not only alleviate the vanishing gradient problem but also promote more stable and efficient training, ultimately contributing to superior performance in disaster classification tasks.

3.3. Practical Deployment of the Disaster Classification System

To demonstrate the real-world applicability of the proposed disaster classification model, we outline a practical deployment framework that integrates images from diverse disaster scenarios and enables real-time classification support for emergency response operations.
In a practical setting, the system would receive input images from multiple sources, such as satellite imagery, drone aerial photography, ground-based surveillance cameras, and social media uploads during disaster events. These images would first undergo preprocessing procedures, including resizing, normalization, and noise reduction, to ensure compatibility with the input requirements of the model. Once preprocessed, the images are fed into the improved ResNet-50-based classification model developed in this study. The model rapidly identifies the disaster type—whether earthquake, fire, flood, mudslide, avalanche, landslide, or land subsidence—with high accuracy. The classification results can then be directly integrated into emergency command platforms, providing decision-makers with immediate insights into the nature of the ongoing disaster. Such integration supports faster resource allocation, optimized rescue planning, and better-informed public warnings. A schematic flow of the practical application system is shown in Figure 10.
This framework confirms that the proposed model is not only theoretically effective but also practically implementable in real-world disaster management systems. Future work will focus on expanding the model to support real-time processing and incorporating multi-modal data inputs (e.g., combining images with sensor data or textual reports) to further enhance classification accuracy and system robustness under complex disaster scenarios.

4. Conclusions

Experimental results show that the improved ResNet-50 model effectively handles complex disaster scenarios by accurately classifying diverse disaster images, achieving 87% accuracy across tested categories, including distinguishing similar disasters such as landslides and debris flows. The residual structure also enabled rapid convergence and improved training stability by mitigating gradient vanishing issues common in deep networks. However, despite having fewer parameters than traditional deep models, the computational demands remain high, requiring considerable computational resources and limiting real-time applications, especially on resource-constrained platforms. Moreover, the relatively limited training dataset size suggests that the model’s real-world generalization performance requires further validation. Future work should include expanding dataset diversity, exploring deeper or more advanced architectures, and adopting ensemble learning to improve model adaptability, robustness, and accuracy. Overall, this study demonstrates the effectiveness of residual networks for multi-type disaster classification, offering valuable insights and laying a solid foundation for further advancements in disaster detection technologies.

Author Contributions

Conceptualization, L.W. and B.L.; methodology, L.W.; validation, L.W.; formal analysis, L.W.; investigation, L.W. and Z.X.; resources, L.W., X.X. and B.L.; data curation, L.W. and Z.X.; writing—original draft preparation, L.W.; writing—review and editing, L.W. and B.L.; visualization, L.W.; supervision, B.L.; project administration, L.W. and B.L.; funding acquisition, L.W., X.X. and B.L. All authors have read and agreed to the published version of the manuscript.

Funding

This research is funded by the Student Innovation and Entrepreneurship Training Program of Xiangtan University S202410530097X.

Institutional Review Board Statement

Not applicable.

Informed Consent Statement

Not applicable.

Data Availability Statement

The image data used in this study are publicly available from disaster-related websites and open-source platforms such as GitHub. No new data were created during the study.

Conflicts of Interest

The authors declare no conflicts of interest.

References

  1. Intergovernmental Panel on Climate Change. Climate Change 2023: Synthesis Report. Summary for Policymakers. 2023. Available online: https://www.ipcc.ch/report/ar6/syr/downloads/report/IPCC_AR6_SYR_SPM.pdf (accessed on 1 March 2025).
  2. United Nations Development Programme. Innovation in Disaster Management: Harnessing Technology to Build Resilience; UNDP: 2024. Available online: https://www.undp.org/sites/g/files/zskgke326/files/2024-03/innovation_in_disaster_management_web_final_compressed.pdf (accessed on 1 March 2025).
  3. Zhou, L.; Wu, X.; Xu, Z.; Fujita, H. Emergency decision making for natural disasters: An overview. Int. J. Disaster Risk Reduct. 2018, 27, 567–576. [Google Scholar] [CrossRef]
  4. Su, W.; Chen, L.; Gao, X. Emergency decision making: A literature review and future directions. Sustainability 2022, 14, 10925. [Google Scholar] [CrossRef]
  5. Mustafa, A.M.; Agha, R.; Ghazalat, L.; Sha’ban, T. Natural disasters detection using explainable deep learning. Intell. Syst. Appl. 2024, 23, 200430. [Google Scholar] [CrossRef]
  6. Cervantes, J.; Garcia-Lamont, F.; Rodríguez-Mazahua, L.; Lopez, A. A comprehensive survey on support vector machine classification. Neurocomputing 2020, 408, 189–215. [Google Scholar] [CrossRef]
  7. Halder, R.K.; Uddin, M.N.; Uddin, M.A.; Aryal, S.; Khraisat, A. Enhancing K-nearest neighbor algorithm: A comprehensive review and performance analysis of modifications. J. Big Data 2024, 11, 113. [Google Scholar] [CrossRef]
  8. Mienye, I.D.; Jere, N. A survey of decision trees: Concepts, algorithms, and applications. IEEE Access 2024, 12, 86716–86727. [Google Scholar] [CrossRef]
  9. Alam, F.; Ofli, F.; Imran, M.; Meier, P. MEDIC: A multi-task learning dataset for disaster image classification. Neural Comput. Appl. 2023, 35, 2609–2632. [Google Scholar] [CrossRef]
  10. Benson, V.; Ecker, A. Assessing out-of-domain generalization for robust building damage detection. arXiv 2020, arXiv:2011.10328. [Google Scholar]
  11. Alzubaidi, L.; Zhang, J.; Humaidi, A.J.; Al-Dujaili, A.; Duan, Y.; Al-Shamma, O.; Santamaría, J.; Fadhel, M.A.; Al-Amidie, M.; Farhan, L. Review of deep learning: Concepts, CNN architectures, challenges, applications, future directions. J. Big Data 2021, 8, 53. [Google Scholar] [CrossRef]
  12. Dai, Z.; Heckel, R. Channel Normalization in Convolutional Neural Network avoids Vanishing Gradients. arXiv 2019, arXiv:1907.09539. [Google Scholar]
  13. Shianios, D.; Kolios, P.; Kyrkou, C. DiRecNetV2: A Transformer-Enhanced Network for Aerial Disaster Recognition. arXiv 2024, arXiv:2410.13663. [Google Scholar] [CrossRef]
  14. Dinani, S.T.; Caragea, D. Disaster Image Classification Using Pre-trained Transformer and Contrastive Learning Models. In Proceedings of the 2023 IEEE 10th International Conference on Data Science and Advanced Analytics (DSAA), Thessaloniki, Greece, 9–13 October 2023; pp. 1–11. [Google Scholar] [CrossRef]
  15. Terven, J.; Córdova-Esparza, D.-M.; Romero-González, J.-A. A Comprehensive Review of YOLO Architectures in Computer Vision: From YOLOv1 to YOLOv8 and YOLO-NAS. Mach. Learn. Knowl. Extr. 2023, 5, 1680–1716. [Google Scholar] [CrossRef]
  16. Khanam, R.; Hussain, M. What is YOLOv5: A deep look into the internal features of the popular object detector. arXiv 2024, arXiv:2407.20892. [Google Scholar]
  17. Khan, S.; Sohail, A.; Zahoora, U.; Qureshi, A.S. A survey of the recent architectures of deep convolutional neural networks. Artif. Intell. Rev. 2020, 53, 5455–5516. [Google Scholar] [CrossRef]
  18. IBM. What Is Deep Learning? n.d. Available online: https://www.ibm.com/think/topics/deep-learning (accessed on 26 April 2025).
  19. Zhang, Y.; Wang, J.; Liu, Y.; Rong, L.; Zheng, Q.; Song, D.; Tiwari, P.; Qin, J. A multitask learning model for multimodal sarcasm, sentiment and emotion recognition in conversations. Inf. Fusion 2023, 93, 282–301. [Google Scholar] [CrossRef]
  20. Eltehewy, R.; Abouelfarag, A.; Saleh, S.N. Efficient classification of imbalanced natural disasters data using deep learning. ISPRS Int. J. Geo-Inf. 2023, 12, 245. [Google Scholar] [CrossRef]
  21. Babula, M. Disaster Images Dataset (CNN Model). n.d. Kaggle. Available online: https://www.kaggle.com/datasets/mikolajbabula/disaster-images-dataset-cnn-model (accessed on 26 April 2025).
  22. Rosebrock, A. Detecting Natural Disasters with Keras and Deep Learning. PyImageSearch. 11 November 2019. Available online: https://pyimagesearch.com/2019/11/11/detecting-natural-disasters-with-keras-and-deep-learning/ (accessed on 26 April 2025).
  23. Shorten, C.; Khoshgoftaar, T.M. A survey on Image Data Augmentation for Deep Learning. J. Big Data 2019, 6, 60. [Google Scholar] [CrossRef]
  24. Xie, T.; Cheng, X.; Wang, X.; Liu, M.; Deng, J.; Zhou, T.; Liu, M. Cut-Thumbnail: A Novel Data Augmentation for Convolutional Neural Network. arXiv 2021, arXiv:2103.05342. [Google Scholar]
  25. He, K.; Zhang, X.; Ren, S.; Sun, J. Deep residual learning for image recognition. arXiv 2015, arXiv:1512.03385. [Google Scholar]
  26. Mahjoubi, M.A.; Lamrani, D.; Saleh, S.; Moutaouakil, W.; Ouhmida, A.; Hamida, S.; Raihani, A. Optimizing ResNet50 Performance Using Stochastic Gradient Descent on MRI Images for Alzheimer’s Disease Classification. Intell.-Based Med. 2025, 11, 100219. [Google Scholar] [CrossRef]
  27. Rathod, A.; Pariawala, V.; Surana, M.; Saxena, K. Leveraging CNNs and ensemble learning for automated disaster image classification. arXiv 2023, arXiv:2311.13531. [Google Scholar] [CrossRef]
Figure 1. Feature maps of seven disaster types.
Applsci 15 05143 g001
Figure 2. Flowchart of disaster image classification based on the improved ResNet-50 model.
Applsci 15 05143 g002
Figure 3. Visualization of the improved ResNet-50 model architecture.
Applsci 15 05143 g003
Figure 4. (a) Overall prediction accuracy for all disaster types; (b) precision for each disaster type; (c) recall for each disaster type; (d) F1-score for each disaster type; (e) AUC for each disaster type; (f) log loss for each disaster type; and (g) specificity scores for each disaster type.
Applsci 15 05143 g004
Figure 5. Confusion matrix of the disaster classification model on the validation set (normalized).
Applsci 15 05143 g005
Figure 6. (a) Accuracy curves of the training and validation sets during model training and (b) loss curves of the training and validation sets during model training.
Applsci 15 05143 g006
Figure 7. (a) Precision comparison; (b) recall comparison; (c) F1-score comparison; (d) AUC comparison; (e) specificity comparison; and (f) log loss comparison.
Applsci 15 05143 g007
Figure 8. (a) Normalized confusion matrix of the improved ResNet-50 model on the validation set and (b) normalized confusion matrix of the traditional VGG16 model on the validation set.
Applsci 15 05143 g008
Figure 9. (a) Accuracy curves of the training and validation sets for the improved ResNet-50 model during training; (b) accuracy curves of the training and validation sets for the traditional VGG16 model during training; (c) loss curves of the training and validation sets for the improved ResNet-50 model during training; and (d) loss curves of the training and validation sets for the traditional VGG16 model during training.
Applsci 15 05143 g009
Figure 10. Workflow of the disaster image classification system based on the improved ResNet-50 model.
Applsci 15 05143 g010
Table 1. Stage-wise residual blocks.
StageNumber of BottlenecksNumber of Input ChannelsNumber of Output Channels
1364256
24256512
365121024
4310242048
Table 2. Model classification report.
Disaster TypePrecisionRecallF1-ScoreAUCSpecificityLog LossSupport
Land subsidence0.890.800.840.940.960.17520
Landslides0.870.650.740.910.950.21020
Avalanche0.911.000.950.991.000.04520
Earthquake0.900.900.900.950.980.08020
Fire0.950.950.950.980.9980.05020
Flood0.871.000.930.990.990.06020
Mudslide0.730.800.760.930.940.18020
Total/Average0.870.870.870.950.960.134140
Table 3. Overall accuracy comparison between models.
ModelAccuracy
ResNet-500.87
VGG160.86
Disclaimer/Publisher’s Note: The statements, opinions and data contained in all publications are solely those of the individual author(s) and contributor(s) and not of MDPI and/or the editor(s). MDPI and/or the editor(s) disclaim responsibility for any injury to people or property resulting from any ideas, methods, instructions or products referred to in the content.

