1. Introduction
As traffic demand continues to rise, the need for multimodal transportation solutions and advancements in automated vehicle technologies has become increasingly evident. To support the development and implementation of these innovations, modeling tools play a crucial role in evaluating transportation policies, infrastructure designs, and human factors. Microscopic traffic simulation tools, such as PTV Vissim [
1], SUMO [
2], and Aimsun [
3], are widely used to assess the network-wide effects of emerging transportation technologies. However, beyond traffic flow analysis, it is essential to consider how individual road users interact with vehicles and other modes of transportation. Traditional survey-based methods provide insight into public perception, but they fail to capture real-time behavioral responses to dynamic traffic scenarios [
4]. Driving simulators address this gap by offering controlled, immersive environments where human subjects interact with virtual road conditions [
5].
While driving simulators have been extensively used to study driver behavior and advanced driver assistance systems (ADAS), their application to bicyclist and pedestrian interactions remains limited [
6]. Bicyclists and pedestrians, as vulnerable road users, experience unique interactions with motorized vehicles, making it critical to analyze their behavioral and physiological responses in dynamic traffic environments [
7,
8,
9]. However, existing simulation studies often rely on pre-programmed agents to represent bicyclists and pedestrians, limiting their ability to capture real-time human reactions. Moreover, these simulators typically lack realistic background traffic models, as most rely on simplified vehicle movements rather than the calibrated car-following and lane-changing models found in microscopic traffic simulations. The absence of adaptive traffic control mechanisms further reduces their ability to replicate complex urban environments.
To address these limitations, researchers have developed co-simulation platforms that integrate driving simulators with microscopic traffic simulation tools [
10]. These platforms allow for real-time data exchange, where microscopic simulation provides dynamic, calibrated background traffic, while the driving simulator enables human interaction with live traffic conditions. By enhancing the realism of multimodal interactions, co-simulation facilitates more accurate studies on bicycle–vehicle and pedestrian–vehicle dynamics.
An additional gap in transportation simulation research is the limited integration of physiological sensors to capture real-time human responses to traffic interactions. Many studies have emphasized the significance of physiological measures such as heart rate (HR), electrodermal activity (EDA), and brain activity (electroencephalography (EEG)) in assessing stress, cognitive workload, and emotional responses in traffic environments [
11,
12,
13]. However, these data sources are often collected separately from simulation events, leading to challenges in synchronization and interpretation. To overcome this issue, we integrated multiple physiological sensors with the simulation system to provide a fully synchronized dataset, ensuring that biometric responses are aligned with real-time simulation events [
14]. The ability to analyze physiological responses in conjunction with behavioral data offers deeper insights into the human factors involved in transportation.
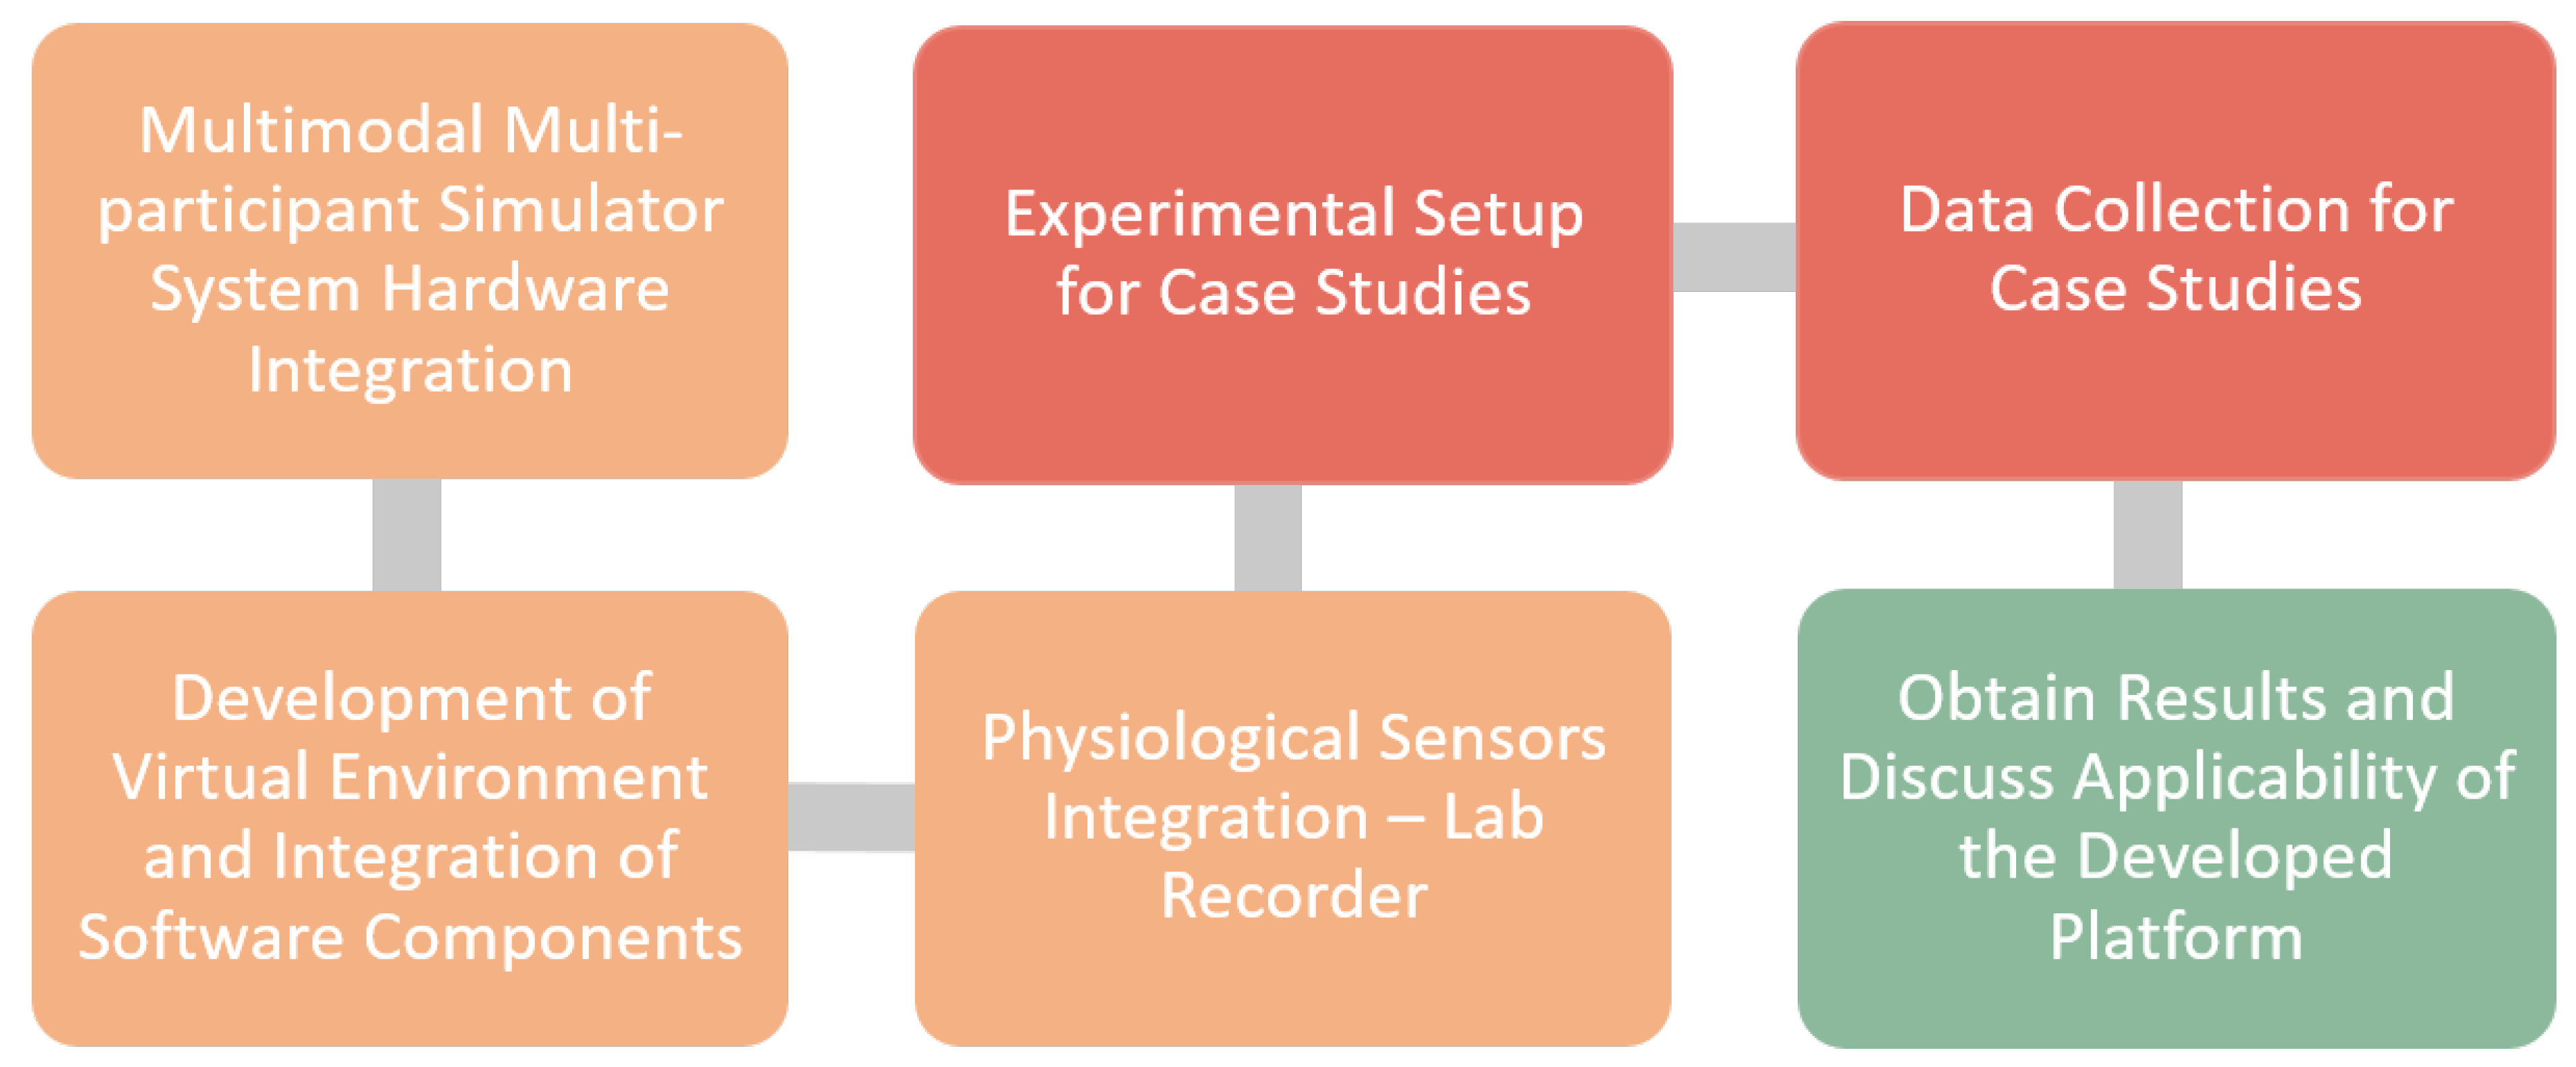
In this study, we present a multimodal and multi-participant simulation system, the Physical and Virtual Traffic Reality System, which integrates a driving simulator, a bicycle simulator, and a pedestrian simulator into a shared virtual environment. The system is designed to study real-time human interactions between different road users, overcoming the limitations of studies that rely on pre-programmed agents for bicycles and pedestrians. The simulators are synchronized through CARLA, a high-fidelity 3D driving simulation platform, which is connected to Vissim, a microscopic traffic simulation tool, ensuring that background traffic behaves realistically and adaptive control strategies can be implemented. Additionally, physiological sensors, including heart rate monitors, EDA sensors, and EEG devices, are fully integrated using Lab Streaming Layer (LSL) to achieve a unified and synchronized dataset, allowing for a holistic approach to studying road user interactions. This setup enables a wide range of research applications, from analyzing individual stress responses to evaluating traffic safety and multimodal transportation efficiency.
To demonstrate the capabilities of the proposed system, we conducted three experimental case studies involving real-time interactions between human participants and simulated traffic environments. The first focused on cyclist–vehicle interactions, capturing how bicyclists dynamically adjusted their lateral position in response to overtaking vehicles, along with associated heart rate changes. The second examined pedestrian behavior in response to vehicles approaching at different speeds (30 mph vs. 50 mph), measuring both gap acceptance decisions and physiological stress using VR and wearable sensors.
The third case study evaluated the system’s ability to replicate real-world traffic dynamics under congested urban conditions. Twenty-five participants completed identical driving tasks in both field and simulation environments along two major corridors in Pittsburgh. By comparing segment-wise speed profiles, we validated the realism of the simulated traffic, ensuring that prior interaction studies were grounded in credible conditions.
Together, these case studies highlight the system’s ability to support multimodal research through high-fidelity simulation, human-in-the-loop design, and synchronized physiological monitoring. By uniting drivers, bicyclists, and pedestrians in a shared virtual space with naturalistic controls, the platform enables rich behavioral insights for transportation safety, design, and automation research. An overview of the system architecture is shown in
Figure 1.
The rest of the paper is organized as follows.
Section 2 provides a comprehensive literature review on co-simulation frameworks and multimodal simulation studies, highlighting previous research efforts and existing gaps.
Section 3 presents the components of the proposed co-simulation system, including the software and hardware elements necessary for the integration of driving, bicycle, and pedestrian simulators.
Section 4 details the methodology used to integrate CARLA, PTV Vissim, and physiological sensors, addressing key challenges such as real-time synchronization, network design, and traffic signal coordination.
Section 5 presents the experimental case studies conducted to evaluate the system’s capabilities in modeling bicycle–vehicle and pedestrian–vehicle interactions. It also reports the results, analyzing both the behavioral and physiological responses of participants across different traffic scenarios. Finally,
Section 6 presents conclusions and future directions for enhancing co-simulation environments.
2. Literature Review
The integration of driving simulators with traffic simulation tools has gained increasing attention in transportation research as a means to improve the realism of simulation-based studies. Traditional driving simulators have often lacked realistic background traffic behavior, while microscopic traffic simulators provide detailed network-wide traffic operations but lack human interactions. To bridge this gap, researchers have explored co-simulation frameworks that integrate driving simulators with traffic modeling tools, allowing for the simultaneous study of human behavior and network-wide traffic interactions. This section discusses key advancements in co-simulation research, focusing on the methodologies used and the challenges that remain in creating scalable, multimodal simulation environments.
One of the earliest applications of co-simulation in traffic engineering did not involve driving simulators but instead focused on integrating traffic models with intelligent transportation systems (ITS). Jin and Lam (2003) developed a virtual-reality-based traffic-driving simulation system to examine driver responses to real-time ITS information [
15]. Their work highlighted the advantages of simulation-based evaluations over traditional survey-based methods, demonstrating how an integrated virtual environment can provide a more accurate assessment of traveler decision-making. This research emphasized the importance of real-time interaction with dynamic traffic conditions, setting the stage for later developments in co-simulation frameworks.
One of the first co-simulation frameworks specifically designed for driving simulators was proposed by Punzo and Ciuffo (2011) [
10]. They integrated SCANeR with AIMSUN, emphasizing the importance of synchronization and consistency between individual driver behavior models and macroscopic traffic flow dynamics. Their work laid the foundation for effective co-simulation operations, ensuring that human-driven vehicle behaviors align with network-wide traffic flow, which remains a fundamental challenge in co-simulation research today. Nguyen That and Casas (2011) extended these approaches by developing a co-simulation framework for multimodal transportation, incorporating SCANeR and AIMSUN [
16]. Their study was one of the first to ensure that autonomous vehicles interacted with pedestrians and cyclists in a realistic manner. They highlighted the limitations of pre-programmed agents, showing that real-time decision-making by human users is necessary to improve the ecological validity of simulations. Their framework also demonstrated the need for adaptive traffic management strategies to accommodate multimodal interactions effectively. More recently, Previati and Mastinu (2023) explored driving simulator integration with microscopic traffic simulators, emphasizing perceptual consistency in urban driving [
17]. Their study validated that mixed-reality simulation enhances ecological validity, particularly when introducing connected and automated vehicles (CAVs) into the experiment. Their findings reinforced the importance of reducing synchronization delays to improve user experience and simulation accuracy. A co-simulation digital twin framework using SUMO and AirSim was introduced to extend co-simulation techniques beyond traditional vehicle networks [
18]. This approach allowed for the integration of unmanned aerial vehicles (UAV) into urban traffic management, highlighting the interoperability challenges between autonomous drones and vehicle traffic. The study underscored the need for high-fidelity traffic simulation models that can support emerging urban air mobility systems. The FedCars project further advanced co-simulation by introducing an efficient scheduling framework for federated learning in connected vehicle networks [
19]. Their integration with CARLA-based co-simulation demonstrated machine learning-driven traffic control, ensuring real-time synchronization between vehicles and infrastructure. The study showcased how federated learning can enhance adaptive traffic management, making co-simulation a valuable tool for future intelligent transportation systems.
In the energy optimization domain, Hua et al. investigated route and speed co-optimization in connected vehicle networks, leveraging Vissim-based co-simulation to analyze fuel efficiency under different traffic conditions [
20]. Their research demonstrated the role of real-time data integration in improving the accuracy of energy consumption models, reinforcing the necessity of robust co-simulation frameworks for optimizing connected and automated vehicle operations.
Despite these advances, significant challenges remain in co-simulation research. Data synchronization between multiple simulation tools continues to be a major issue. Many platforms focus only on vehicle-level interactions, failing to capture multimodal dynamics such as pedestrian gap acceptance or cyclist responses to passing vehicles. Physiological responses, including stress and cognitive load, are often overlooked, despite their relevance in evaluating road user behavior. Additionally, most co-simulation platforms do not fully integrate human decision-making, relying on pre-programmed agents rather than real-time user interactions. To address these gaps, recent research has moved toward multi-participant co-simulation environments, where multiple human users interact within a shared virtual space.
Simulator research has increasingly focused on developing multi-participant simulator setups, where multiple human users can simultaneously interact in a virtual traffic environment. Lehsing et al. (2015) investigated driver–pedestrian interactions using a multiparty simulator, where a human driver in a driving simulator interacted with a real pedestrian in a pedestrian simulator [
21]. Their study demonstrated that drivers exhibited different yielding behaviors when encountering a real human pedestrian compared to a pre-programmed agent, emphasizing the importance of real-time human interactions in multimodal simulation systems. Ref. [
22] expanded on these concepts by developing a networked 3D virtual environment that supports multi-user driving simulations. Their study demonstrated that human-driven behaviors significantly influence congestion propagation, reinforcing the importance of human-in-the-loop interactions in urban traffic modeling [
22]. Hancock and De Ridder (2003) developed a linked simulation environment, where two drivers in separate simulators interacted within the same virtual world [
23]. Their study examined collision avoidance behavior, finding that mutual viewing times between drivers significantly influenced reaction strategies in high-risk scenarios. Oeltze and Schießl (2015) explored the benefits and challenges of multi-driver simulator studies, particularly in evaluating cooperative intelligent transportation systems (ITS) [
24]. Their work highlighted key issues such as data synchronization, real-time communication between drivers, and the scalability of simulation platforms, which remain major challenges in large-scale co-simulation environments. Maag et al. (2011) investigated multi-driver simulation for studying ADAS effects on individual and group behavior [
25]. Their study demonstrated that cooperative ADAS technologies, such as merging assistants and hazard warnings, influenced not only individual drivers but also the overall traffic network. Their work reinforced the necessity of multi-user simulators to analyze system-wide behavioral impacts.
Another critical limitation of many existing simulator-based studies is their reliance on pre-programmed agents that lack reactive, adaptive behavior. While this approach enables controlled experiments, it reduces ecological validity by failing to capture the dynamic interplay between road users. For example, Rossi et al. used a driving simulator to investigate overtaking behavior with static cyclist trajectories; although valuable, the study did not permit cyclist reactions to vehicle proximity, such as lateral movement or speed adjustments [
26]. Moll et al. validated overtaking maneuvers using naturalistic data but similarly relied on non-interactive cyclist groups, limiting the emergence of true vehicle–cyclist interactions [
27]. Berghoefer et al. examined driver responses to bicycle crossing designs but employed predetermined cyclist paths, reducing the fidelity of real-time interaction [
28]. Likewise, in advanced pedestrian simulation contexts, Tran and Parker developed multi-entity VR environments with autonomous vehicles and pedestrians, yet their system did not support fully interactive, mutually adaptive human agents [
29].
Moreover, studies such as those by Mollu et al. and Lee and Winston demonstrate the value of physiological measures—including eye tracking, heart rate, and self-reported workload—for understanding stress and distraction during tasks like pedestrian detection and hazard response [
30,
31]. Swan et al. also showed how sensory impairments can affect pedestrian hazard detection in simulated environments, reinforcing the need for realistic conditions when studying human behavior [
32]. Claros et al., through naturalistic observation of lateral passing behavior, further emphasized how environmental and contextual variables influence interaction outcomes, which are often lost in scripted simulations [
33].
Taken together, these limitations underscore the importance of simulation platforms that enable real-time, human-in-the-loop interaction across all transportation modes. Such frameworks offer a more accurate representation of emergent behaviors and psychological responses during critical tasks like overtaking, lane changing, and crossing decisions—providing richer insights into multimodal traffic safety and user experience.
To address these gaps, this study introduces a novel co-simulation framework that integrates a driving simulator, a bicycle simulator, and a pedestrian simulator into a unified virtual environment. Unlike previous studies that rely on pre-programmed agents, this system enables real-time human interactions between different road users. By incorporating physiological sensors into the simulation setup, this approach allows for the measurement of stress and cognitive load, offering a more comprehensive understanding of human behavior in multimodal traffic environments. Future research must focus on scaling these co-simulation frameworks to accommodate larger, more complex networks while maintaining real-time performance and human-in-the-loop interactions. Expanding multimodal co-simulation frameworks will enhance the study of traffic safety, user experience, and the development of automated vehicle systems, contributing to safer and more efficient urban mobility solutions.
3. Components of Co-Simulation Tool
This section provides an overview of the components of the co-simulation system, including the driving simulation software CARLA 0.10.0, the traffic simulation software PTV Vissim, and the hardware components of the driving and bicycle simulators. The integration of these elements is explained in the next section.
3.1. Simulator System—Software
3.1.1. Driving Simulation Tool—CARLA
CARLA is an open-source driving simulation platform developed by the Computer Vision Center at the Autonomous University of Barcelona [
34]. It is designed to provide a highly customizable and accessible environment for autonomous driving research as well as human-driven vehicle simulations. Built on Unreal Engine 4, CARLA offers advanced 3D rendering capabilities and a comprehensive library of assets, including diverse road types, buildings, traffic signs, and terrain options. This flexibility allows researchers to create and modify virtual environments that accurately replicate real-world traffic conditions.
The CARLA simulation system operates using a client–server architecture. The server manages all aspects of the simulation, including rendering the environment, computing vehicle and pedestrian movements, and managing interactions between agents. The client controls the simulation execution, making it possible to modify parameters in real-time. CARLA provides an API, available in both Python and C++, enabling users to interact with the simulation and control vehicles, pedestrians, and environmental settings.
CARLA can be installed using two different methods. The first is a pre-packaged version, which comes with predefined maps and configurations, suitable for applications that do not require custom-built environments. The second option involves building CARLA from the source. This approach allows for custom map creation using external tools such as RoadRunner, a 3D road network editor available through MATLAB’s academic licensing [
35]. RoadRunner generates two key files needed for CARLA: an FBX file containing the 3D model of the environment and an OpenDRIVE file that encodes road network information, including lane configurations, intersections, traffic signals, and control mechanisms. The OpenDRIVE format ensures compatibility with PTV Vissim, allowing traffic simulation models to be seamlessly transferred between platforms. Also, it is possible to utilize the library of CARLA’s blueprint library using Unreal Editor for placing 3D objects.
Traffic modeling in CARLA can be handled using two different methods. The first option involves CARLA’s built-in Traffic Manager, which is responsible for controlling vehicle movements, path planning, and traffic signal states. However, this module offers only basic functionality and lacks the advanced traffic control options necessary for realistic urban simulation. The second option involves customizing a buildable version of CARLA to integrate with external traffic simulation tools such as PTV Vissim and SUMO. This setup enables more sophisticated co-simulation features, ensuring that traffic conditions in CARLA accurately reflect real-world driving behaviors and infrastructure constraints.
3.1.2. Microsimulation Tool—PTV Vissim
PTV Vissim is a leading microscopic traffic simulation software widely used for modeling road transportation systems [
1]. It is commonly applied to evaluate junction geometries, transportation planning strategies, capacity analysis, traffic control systems, signal operations, and public transit studies. The software’s reputation is built on its ability to model traffic flow with high precision, using advanced car-following and lane-changing models.
Traffic modeling in PTV Vissim is based on Wiedemann’s car-following model, which categorizes driving behavior into four distinct states: free driving, approaching, following, and braking [
36]. The transition between these states is determined by speed differences and distance to the leading vehicle, taking driver behavior characteristics into account. By adjusting the model parameters, PTV Vissim can represent different driving styles, including aggressive, neutral, and cautious behaviors. The software also includes a lane-changing model, which is rule based and can be calibrated to reflect varying levels of courtesy, aggressiveness, and lane-switching frequency among drivers.
PTV Vissim supports multimodal transportation modeling, allowing the simulation of bicycles using the same car-following and lane-changing models as vehicles. It enables the designation of shared lanes or dedicated bicycle lanes, ensuring that bicycle interactions with motorized traffic are accurately represented. For pedestrian modeling, PTV Vissim incorporates a microscopic pedestrian simulation module that enables the representation of pedestrian behavior in various traffic environments. Pedestrians in PTV Vissim can be modeled as individual agents with distinct characteristics, such as walking speed, waiting behavior, and reaction time. Their movement is based on a social force model, which accounts for interactions with both other pedestrians and surrounding traffic elements. This model ensures that pedestrian movements are naturalistic, as they adapt their speed and trajectory based on proximity to other pedestrians, obstacles, and approaching vehicles.
Additionally, the software includes a range of traffic control mechanisms, from simple priority rules at intersections to real-world traffic signal controllers such as Econolite ASC/3, SCATS, SCOOT, and Siemens VA. These features make PTV Vissim particularly well suited for co-simulation applications where detailed traffic dynamics and adaptive control strategies need to be incorporated.
3.2. Simulator System—Hardware
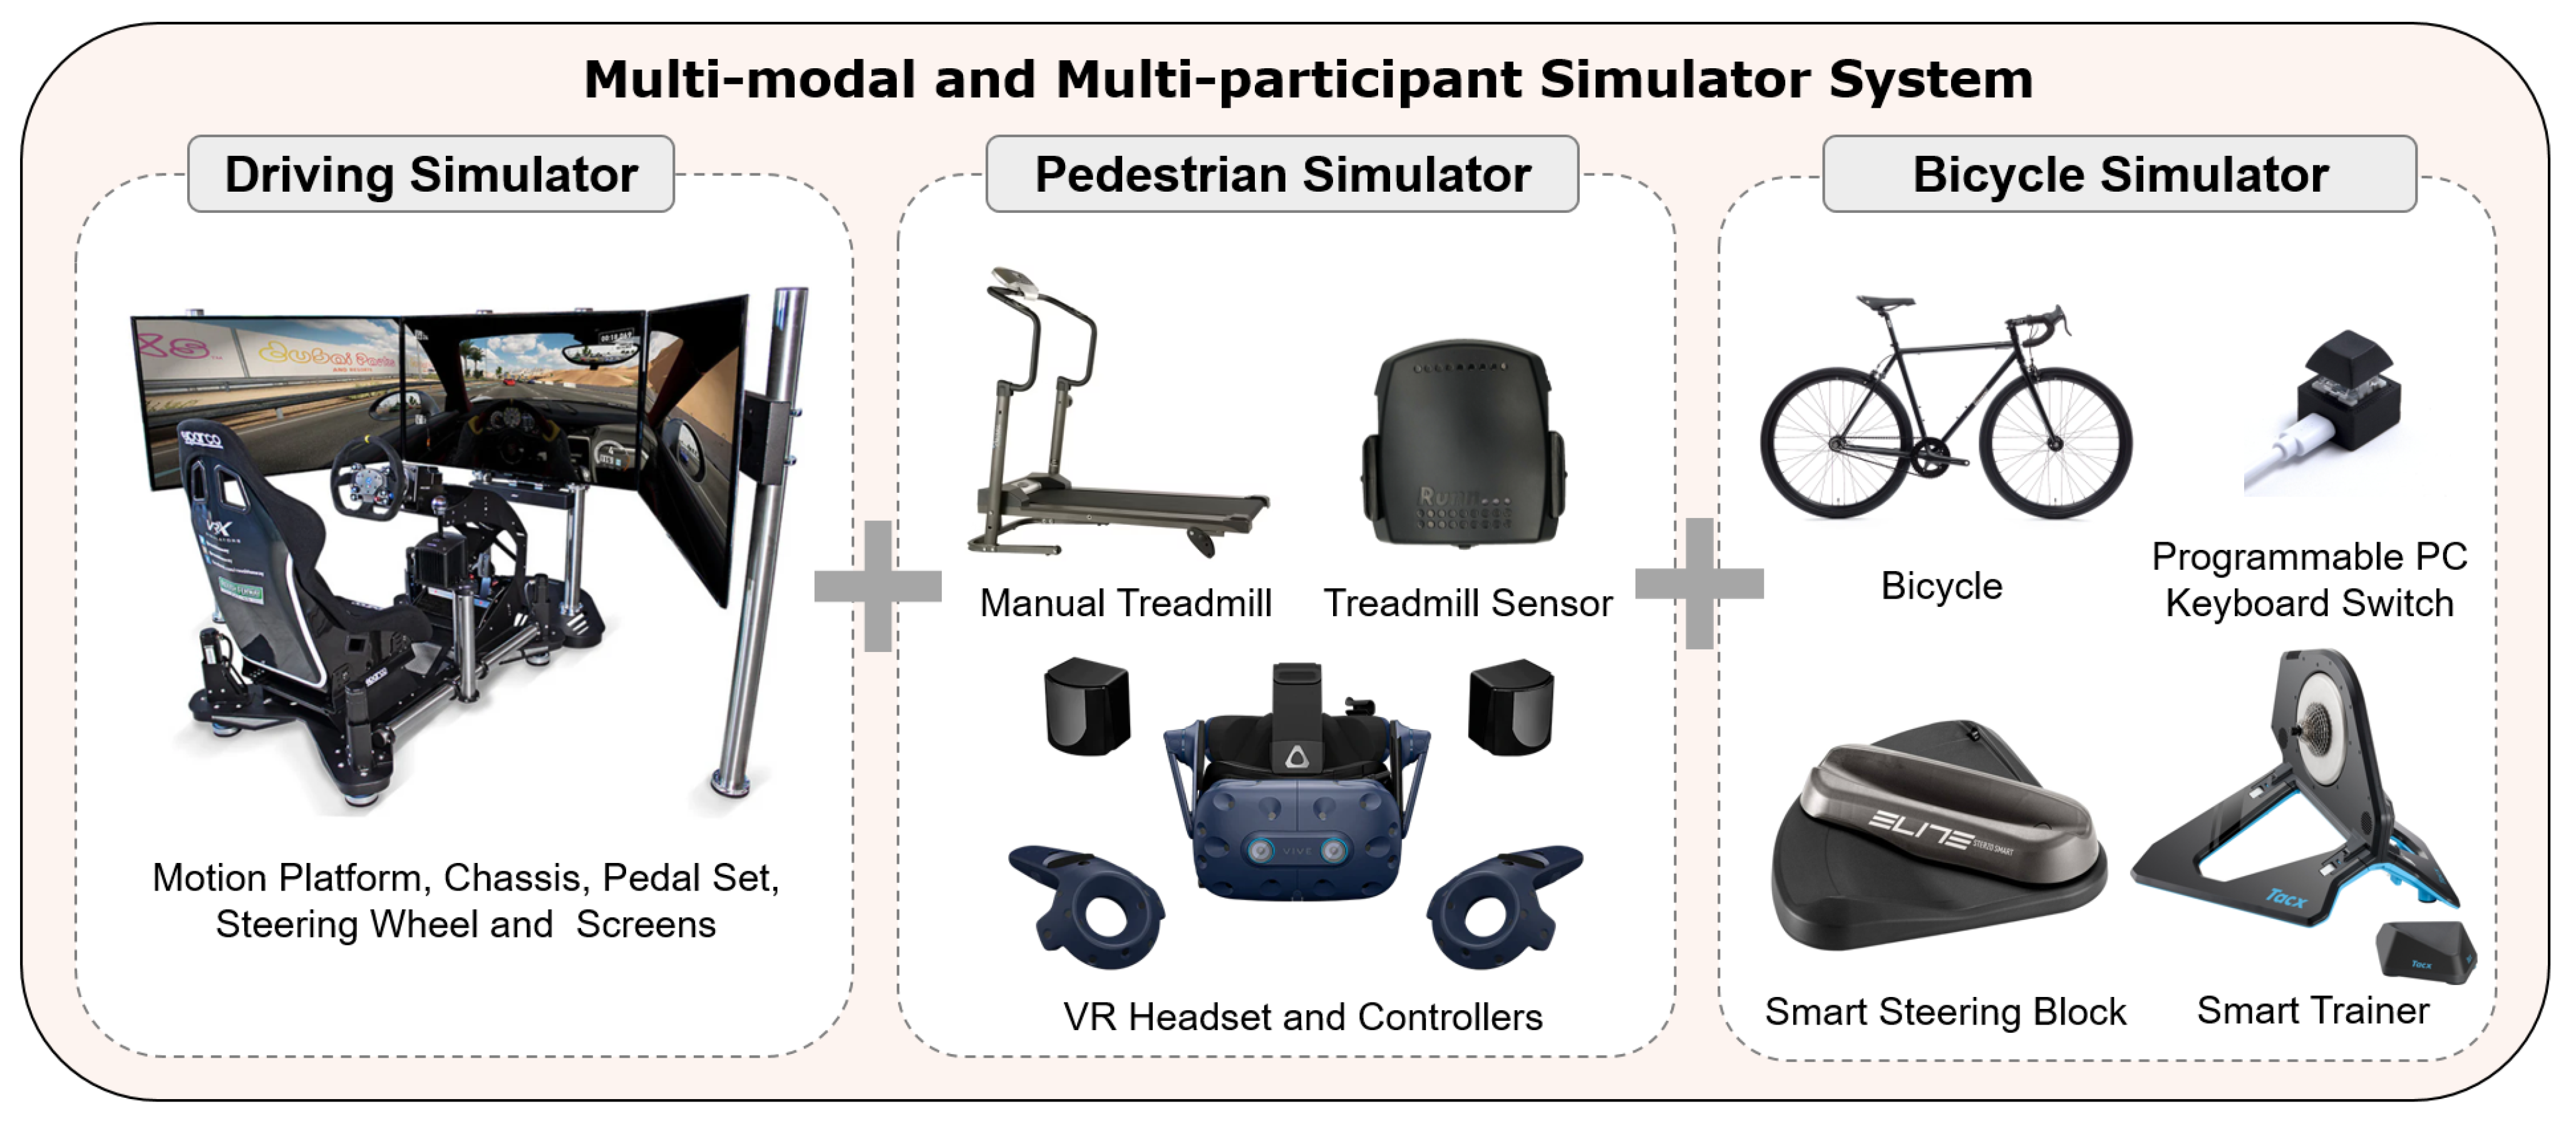
The driving simulator consists of a high-performance PC, visual display equipment, a simulator chassis, and a motion platform. The PC is equipped with 16 GB RAM, an 8 GB GPU, and an Intel i7-10700 processor, ensuring the smooth operation and real-time rendering of the driving environment. The visual system includes three 55-inch screens, providing an immersive field of view for participants. The simulator chassis features a Sparco Chrono Road seat, a Cube Controls GT Pro Momo steering wheel, and Fanatec Clubsport V3 pedals, allowing for a realistic driving experience. The chassis is mounted on a D-BOX motion platform with four 1.5-inch actuators, enabling three degrees of freedom (roll, yaw, and heave). Motion cues are synchronized with the simulation through the D-BOX Live Motion SDK, ensuring that participants experience realistic vehicle dynamics.
The bicycle simulator consists of a standard bicycle mounted on a Tacx Neo 2T smart trainer, which transmits speed and acceleration data to the simulation via Bluetooth. Steering input is captured using an Elite Sterzo smart steering block, also connected via Bluetooth. This setup ensures that bicyclists can interact naturally with the virtual environment, making precise steering and pedaling adjustments based on the simulated traffic conditions. The system is compatible with the pycycling Python package 3.9. which facilitates communication between smart cycling equipment and the simulation software.
The pedestrian simulator consists of a manual treadmill, a VIVE Pro virtual reality (VR) headset, and a speed sensor to measure treadmill belt speed. The treadmill allows participants to walk in place while navigating through the virtual environment, ensuring a natural walking experience. The VIVE Pro headset provides an immersive VR experience, allowing pedestrians to perceive vehicles and road infrastructure in three dimensions. The speed sensor continuously monitors the treadmill belt speed and transmits real-time walking speed data to the simulation, ensuring accurate movement synchronization between the pedestrian’s physical actions and their virtual representation. This setup allows for naturalistic pedestrian behavior in the simulation, enabling precise measurements of gap acceptance, crossing decisions, and physiological responses to approaching vehicles.
An overview of the simulator hardware setup is presented in
Figure 2. By integrating these three simulator components within a shared virtual environment, the system enables realistic multimodal interactions between drivers, bicyclists, and pedestrians. The combination of motion-based driving simulation, smart cycling equipment, and VR-enhanced pedestrian simulation provides a highly flexible and scalable platform for studying human behavior in complex traffic scenarios.
4. Integration of Co-Simulation Components
This section describes the integration of the co-simulation system, detailing the challenges and solutions involved in synchronizing the driving simulation software CARLA, the microscopic traffic simulation software PTV Vissim, and the various hardware components of the driving, bicycle, and pedestrian simulators. Key integration challenges include network consistency, real-time synchronization, communication between systems, and hardware compatibility. The following subsections provide an in-depth explanation of the methodology used to address these challenges.
4.1. Design Challenges and Solutions of PTV Vissim—CARLA Integration
As previously identified by Ciuffo and Puzzo [
10], a co-simulation framework integrating traffic simulation and driving simulation software must overcome four primary challenges: (i) creating consistent road networks in both platforms, (ii) ensuring real-time simulation, (iii) matching the calculation frequencies of both software programs, and (iv) synchronizing traffic flow and traffic control applications. Each of these challenges is addressed in the following subsections.
4.1.1. Network Design in PTV Vissim and Map Design in CARLA
CARLA supports custom map creation, which is essential for ensuring consistency with PTV Vissim’s road network. The OpenDRIVE format is the standard used for defining road networks, including lane configurations, intersections, and traffic control elements. However, PTV Vissim does not natively support exporting networks in OpenDRIVE format.
To resolve this, the PTV Vissim network file (.inpx) is first converted to OpenDRIVE format using the NETCONVERT tool from the open-source microscopic traffic simulation software SUMO. This process removes all traffic signals and traffic signs, preserving only the road geometry. The OpenDRIVE file is then imported into RoadRunner, a 3D road network editor licensed by MATLAB, where additional elements such as terrain, sidewalks, pedestrian crossings, traffic signs, and traffic lights are incorporated.
CARLA maps require the coordinate origin to be defined at the map center. To ensure accurate positioning, the coordinate systems of the PTV Vissim network and the CARLA map must be aligned. This requires relocating the network model in PTV Vissim and adjusting the coordinate origins in RoadRunner. Any discrepancies in coordinate alignment would result in synchronization errors between the platforms. After alignment, the OpenDRIVE and FBX files generated in RoadRunner are imported into CARLA, creating a fully integrated environment compatible with PTV Vissim. The map creation workflow is summarized in
Figure 3.
4.1.2. Real-Time Simulation and Synchronization of Calculation Frequencies
PTV Vissim provides a built-in add-on module called the Driving Simulator Interface, which facilitates real-time data exchange with external driving simulation software. This module allows PTV Vissim to visualize and simulate vehicles controlled by the driving simulator. To establish communication, the Driving Simulator Interface must be activated in PTV Vissim’s network settings, and the driving simulation software must be connected to the provided DrivingSimulator.dll file.
CARLA operates on a different update frequency by default, requiring synchronization with PTV Vissim to ensure a seamless simulation experience. In this study, CARLA’s run_synchronization.py script was modified so that both platforms operate on a shared simulation timestep of 0.05 s, enabling real-time coordination between the vehicle movements, traffic signals, and user inputs. This ensures that both systems progress frame-by-frame in a lockstep execution model, maintaining strict temporal consistency across the co-simulation loop.
While this synchronous approach is essential for maintaining temporal consistency across the simulation platforms, it may lead to a reduction in the frame rate (FPS) under certain conditions. This is a common characteristic of synchronous simulation environments, where the rendering of each frame depends on all components completing their updates. Factors such as detailed 3D environments or increased vehicle counts can lengthen the simulation steps, affecting the runtime performance. Therefore, achieving optimal performance requires carefully balancing the background traffic volume, scene complexity, and hardware capabilities to ensure both realism and responsiveness.
4.1.3. Synchronization of Traffic Flow
Traffic flow synchronization between CARLA and PTV Vissim is achieved through the DrivingSimulator.dll file, which facilitates bidirectional communication. This functionality, originally written in C++, is accessed via Python using the ctypes library, enabling seamless integration with the CARLA API. The synchronization process ensures that vehicles and their speeds, positions, and lane placements in PTV Vissim are accurately reflected in CARLA’s 3D environment.
4.1.4. Developed Traffic Signal Synchronization Module
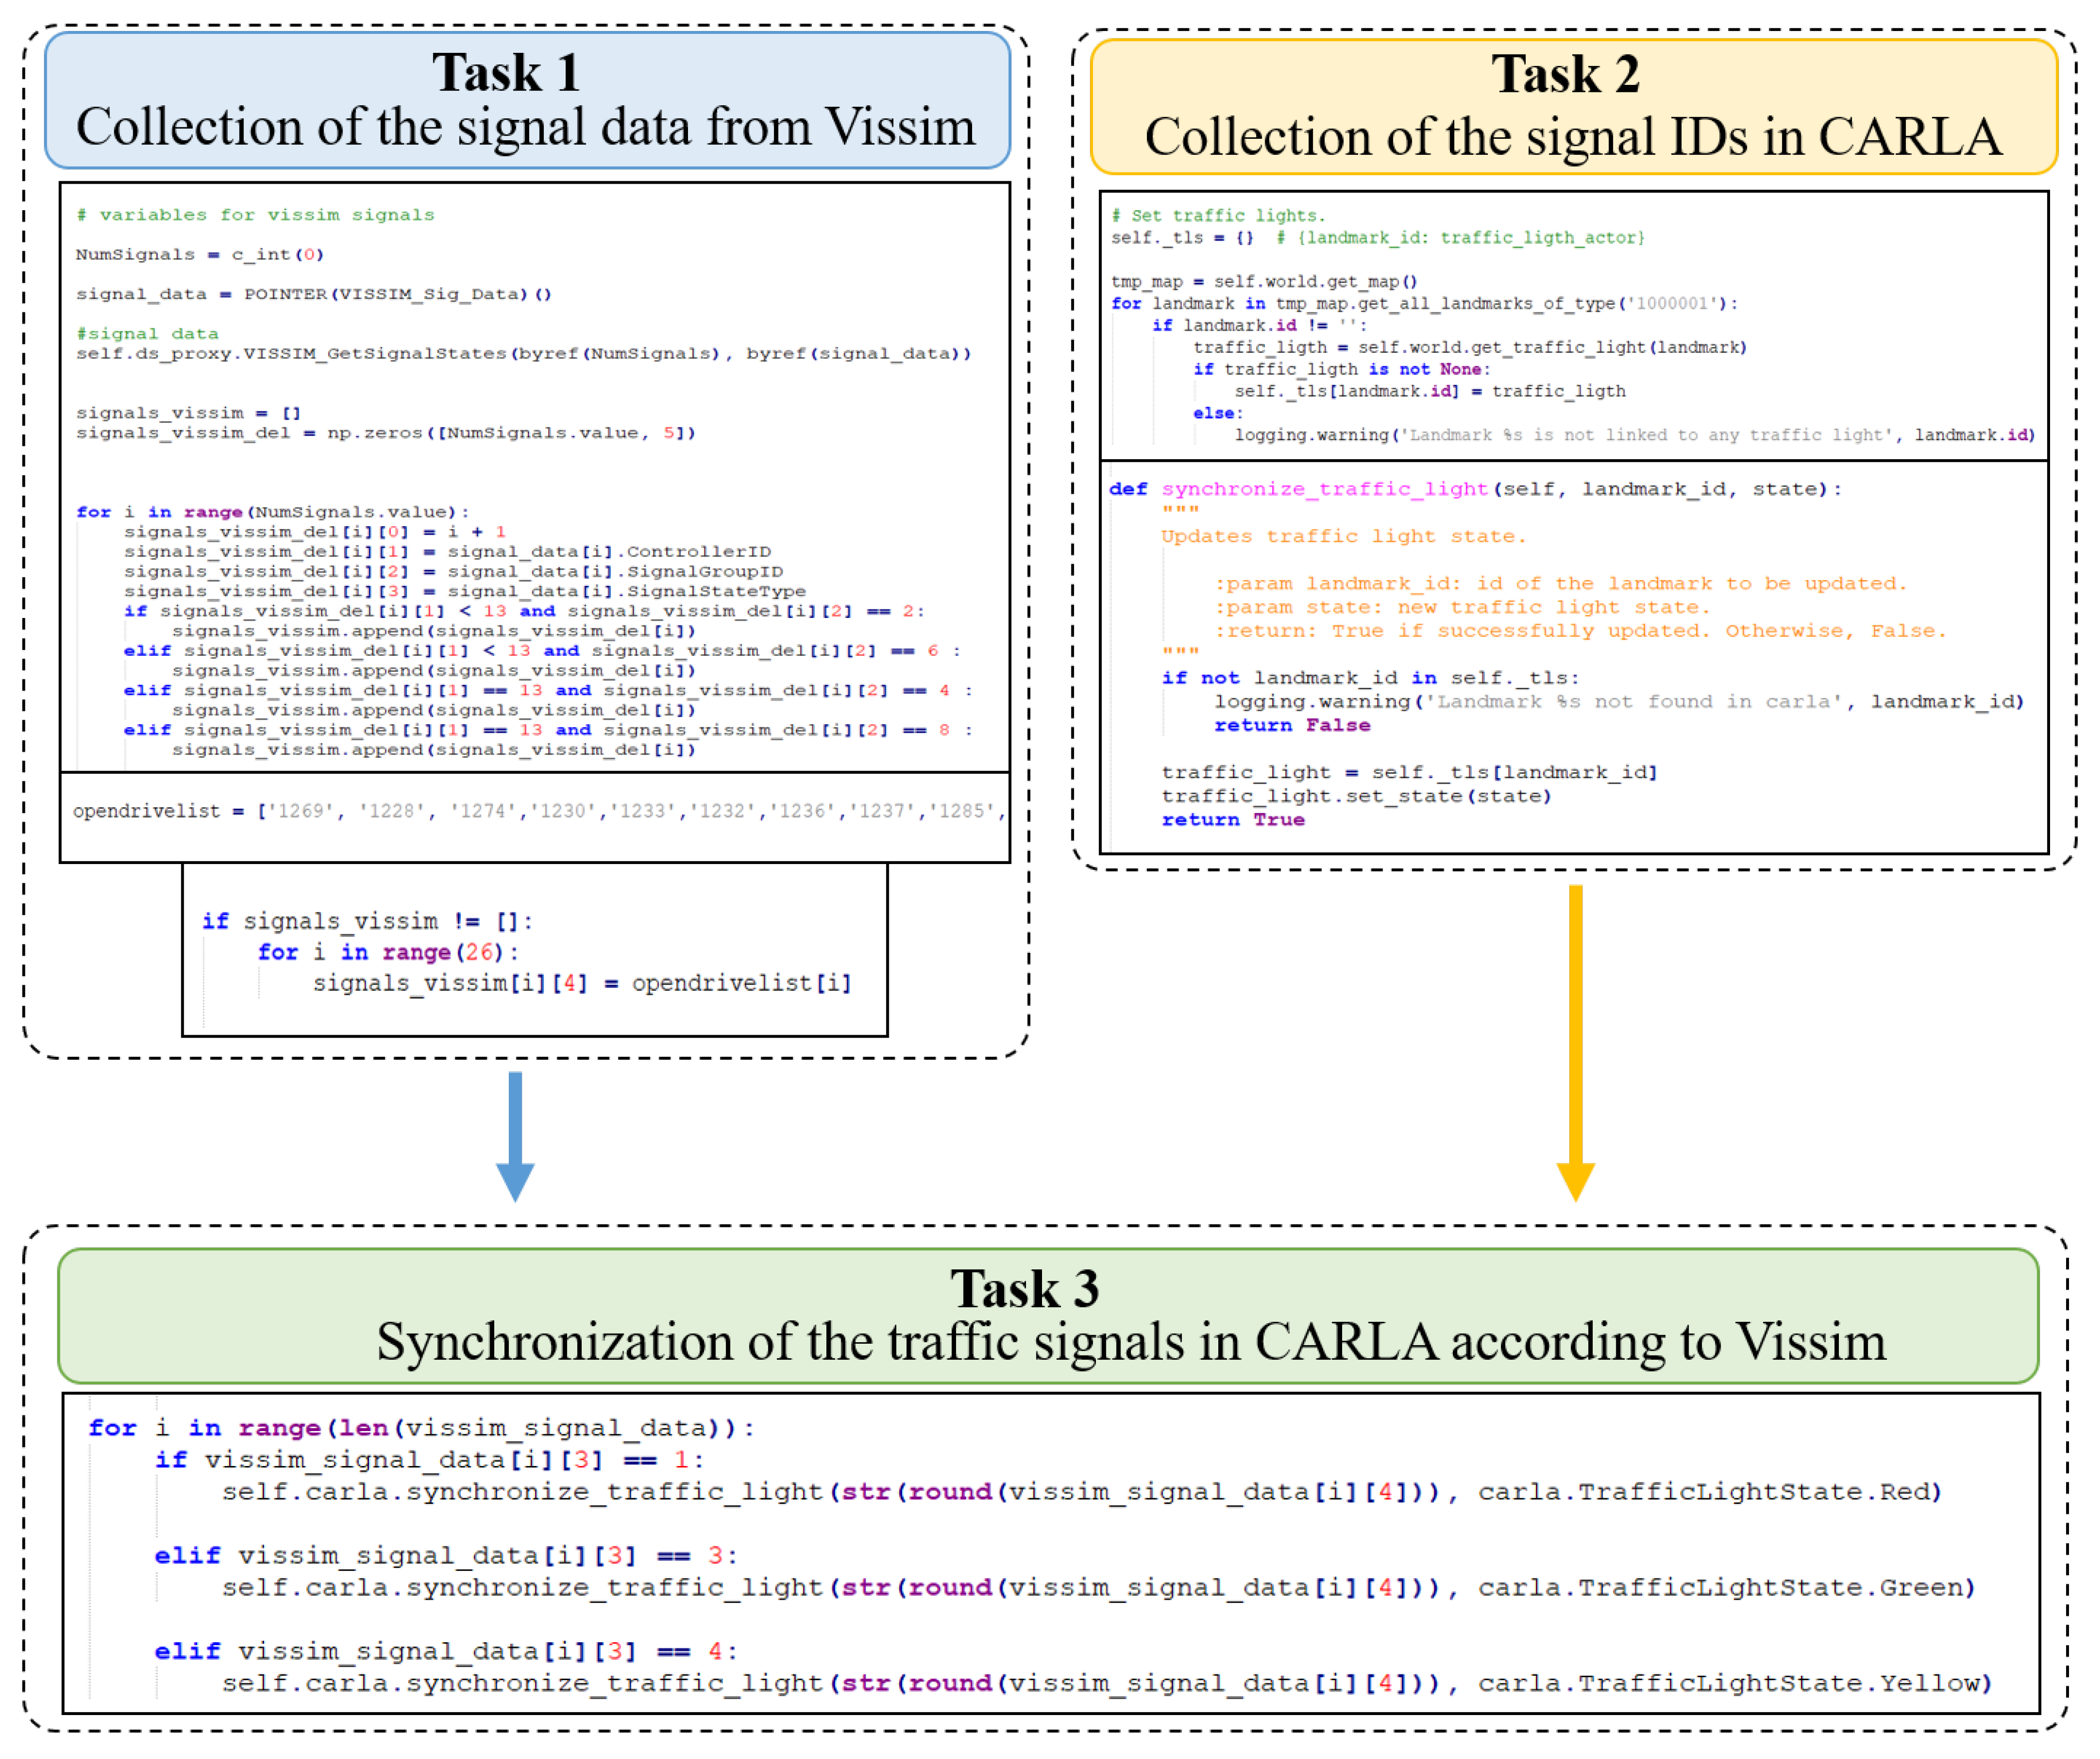
To fully integrate CARLA and PTV Vissim, a traffic signal synchronization module was developed in Python. This module retrieves signal states from PTV Vissim and applies them to the corresponding signals in CARLA. The synchronization process is distributed across three key scripts: vissim_simulation.py for PTV Vissim operations, carla_simulation.py for CARLA operations, and run_synchronization.py to coordinate the synchronization between the two systems.
The module first extracts traffic signal data from PTV Vissim (Task 1 in
Figure 4), storing information such as controller IDs, signal group IDs, and signal states. These data are then cross-referenced with traffic signal IDs assigned by CARLA (Task 2 in
Figure 4), ensuring proper alignment between the two simulations. Once the traffic signal states are updated in CARLA (Task 3 in
Figure 4), they dynamically reflect the real-time changes in PTV Vissim, allowing for an accurate representation of signalized intersections and adaptive control strategies.
4.2. Design Challenges and Solutions of CARLA—Simulator System Hardware Integration
The integration of CARLA with external simulation hardware presents multiple challenges, particularly in establishing seamless real-time communication between different simulator components while ensuring high-fidelity synchronization. CARLA, as an open-source driving simulation platform, is primarily designed for software-based vehicle control and visualization, lacking built-in support for physical driving, bicycle, and pedestrian simulators. This limitation necessitates the development of custom modules to enable connectivity between CARLA and various hardware components.
A key challenge in this integration is achieving low-latency data transmission between CARLA and external simulators. The system requires precise synchronization between the driving simulator’s steering wheel, pedals, and motion platform, the bicycle simulator’s smart trainer and steering block, and the pedestrian simulator’s VR headset and treadmill. Any delay or inconsistency in data transmission could disrupt the immersive experience and impact the validity of behavioral studies. To address this, middleware solutions are implemented to facilitate real-time data exchange, ensuring that user inputs and feedback mechanisms remain responsive.
CARLA also lacks native support for haptic feedback systems, which are essential for enhancing realism in driving simulations. To provide a more immersive experience, a haptic feedback module was developed using the D-BOX motion platform, enabling the simulation of vehicle dynamics, including acceleration, braking, and road surface conditions. This integration requires the continuous extraction of motion parameters such as speed, yaw, and roll from CARLA, which are then processed and transmitted to the motion platform in real-time.
Additionally, CARLA does not include built-in support for physiological sensor integration, which is crucial for understanding human responses in transportation studies. To capture real-time biometric data such as heart rate variability (HRV), electrodermal activity (EDA), and cognitive load measurements, a robust synchronization mechanism is necessary. The Lab Streaming Layer (LSL) framework was employed to ensure that physiological sensor data are time-aligned with simulation events, allowing for comprehensive analysis of human stress, cognitive load, and emotional responses under different traffic conditions.
This section details the technical solutions developed to address these challenges, including modifications to CARLA’s API for hardware integration, real-time motion synchronization strategies, and physiological data collection methods. The subsequent subsections discuss the specific implementations for driving, bicycle, and pedestrian simulator integration, as well as the developed haptic feedback and physiological sensor synchronization modules.
4.2.1. Driving Simulator Hardware Integration
CARLA does not natively support hardware integration for driving equipment such as steering wheels and pedals. The default CARLA manual provides limited guidance on establishing such connections. To address this, modifications were made to the manualcontrolsteeringwheel.py script in CARLA’s Python API, allowing the simulator to recognize and utilize external control devices.
The driving equipment used in this study consists of a Cube Controls GT Pro Momo steering wheel and Fanatec Clubsport V3 pedals, each connected via separate USB ports. The pygame library was used to identify the USB port rankings and configure the button mappings in INI files. These mappings were then imported into CARLA’s manual control script, allowing for independent but synchronized use of the steering wheel and pedals.
4.2.2. Developed Haptic Feedback Module
The D-BOX motion platform provides three degrees of freedom (roll, yaw, and heave) to enhance the driving experience. However, CARLA does not natively support D-BOX hardware. To integrate the motion platform, the D-BOX Live Motion SDK was used, requiring a C++ implementation within Microsoft Visual Studio 2019. The motion platform receives real-time data from CARLA, including speed, acceleration, yaw, and roll angles. These values are continuously updated in text files during the simulation rather than being stored afterward, reducing computational load. The developed executable software ensures that the motion platform responds dynamically to driver inputs.
4.2.3. Bicycle Simulator Hardware Integration
Before integration, the bicycle simulator components must first be connected to the PC via Bluetooth. Unlike standard cycling applications, this study required direct data communication with the CARLA simulation. The pycycling Python package was used to establish a connection between the Tacx Neo 2T smart trainer and Elite Sterzo smart steering block, allowing the real-time transmission of speed and steering angle data to CARLA. The synchronization module then transmits these data to PTV Vissim, ensuring the controlled bicycle is represented accurately in both simulation environments.
4.2.4. Pedestrian Simulator Hardware Integration
The pedestrian simulator consists of a manual treadmill, a VIVE Pro VR headset, and a treadmill speed sensor. The treadmill provides a natural walking experience, while the VR headset allows participants to navigate immersive traffic environments. The treadmill speed sensor continuously monitors belt movement, translating it into real-time pedestrian motion in CARLA. A VR controller is used to determine walking direction, and a safety harness ensures participant stability. This setup allows pedestrians to interact naturally with traffic, enabling precise measurement of gap acceptance and physiological responses.
4.3. Design Challenges and Solutions of CARLA—Physiological Sensors Integration
The integration of physiological sensors with CARLA is essential for studying human factors in transportation research, particularly for assessing driver, cyclist, and pedestrian responses to traffic interactions. One of the main challenges in this integration is ensuring precise synchronization between sensor data and simulation events. To address this, we employed the Lab Streaming Layer (LSL), an open-source framework designed for real-time data acquisition and synchronization.
LSL provides a standardized protocol for streaming, recording, and processing physiological signals from multiple sensors simultaneously. It allows for the seamless integration of various biosensors while maintaining precise temporal alignment with external data sources, such as simulation events in CARLA. LSL ensures that all recorded signals share a common global timestamp, facilitating accurate analysis of physiological responses to specific traffic scenarios.
To collect and manage sensor data, we used LabRecorder, an LSL-compatible software tool that records streams from multiple sensors into a synchronized dataset. LabRecorder enables real-time visualization of incoming physiological signals while ensuring that all data streams are properly timestamped and stored in a structured format. By integrating CARLA with LSL, simulation events, vehicle trajectories, and physiological responses can be recorded within a single synchronized dataset, allowing for a comprehensive analysis of human reactions to different driving conditions.
Our setup was tested with multiple physiological sensors, demonstrating the flexibility of this integration. The Emotiv Epoc is a wireless EEG headset designed for measuring brain activity. It provides 14-channel EEG data and is commonly used in cognitive workload and neurophysiological studies related to driving and pedestrian behavior. By integrating Emotiv Epoc with CARLA through LSL, it is possible to capture real-time changes in brain activity during traffic interactions, enabling a deeper understanding of cognitive stress and attention levels.
The Bitalino EDA sensor is used for measuring electrodermal activity (EDA), which reflects physiological arousal and emotional responses. This sensor provides valuable insights into how individuals react to different traffic scenarios, such as close vehicle interactions, sudden braking events, or high-speed passing maneuvers. The integration of Bitalino with CARLA through LSL allows for a continuous and time-synchronized recording of EDA signals, enabling researchers to assess emotional responses under controlled experimental conditions.
The Polar H10 is a chest strap heart rate monitor capable of providing high-precision heart rate variability (HRV) data. Heart rate changes are widely used as indicators of stress, anxiety, and cognitive load in driving studies. The integration of the Polar H10 with CARLA enables the measurement of physiological stress responses during various driving and pedestrian scenarios. By recording heart rate data alongside simulation events, researchers can analyze how traffic conditions, vehicle proximity, and environmental factors influence physiological states.
The combination of these sensors with LSL and CARLA creates a fully synchronized data collection framework that can accommodate a wide range of human factors research applications. This integration allows researchers to investigate physiological and cognitive responses in real-time, providing deeper insights into human behavior in complex traffic environments. The flexibility of the system also allows for additional sensors to be incorporated, enabling further expansion into areas such as eye-tracking, muscle activity, and respiration monitoring. Through this approach, the developed setup offers a comprehensive and adaptable platform for studying multimodal interactions in transportation research.
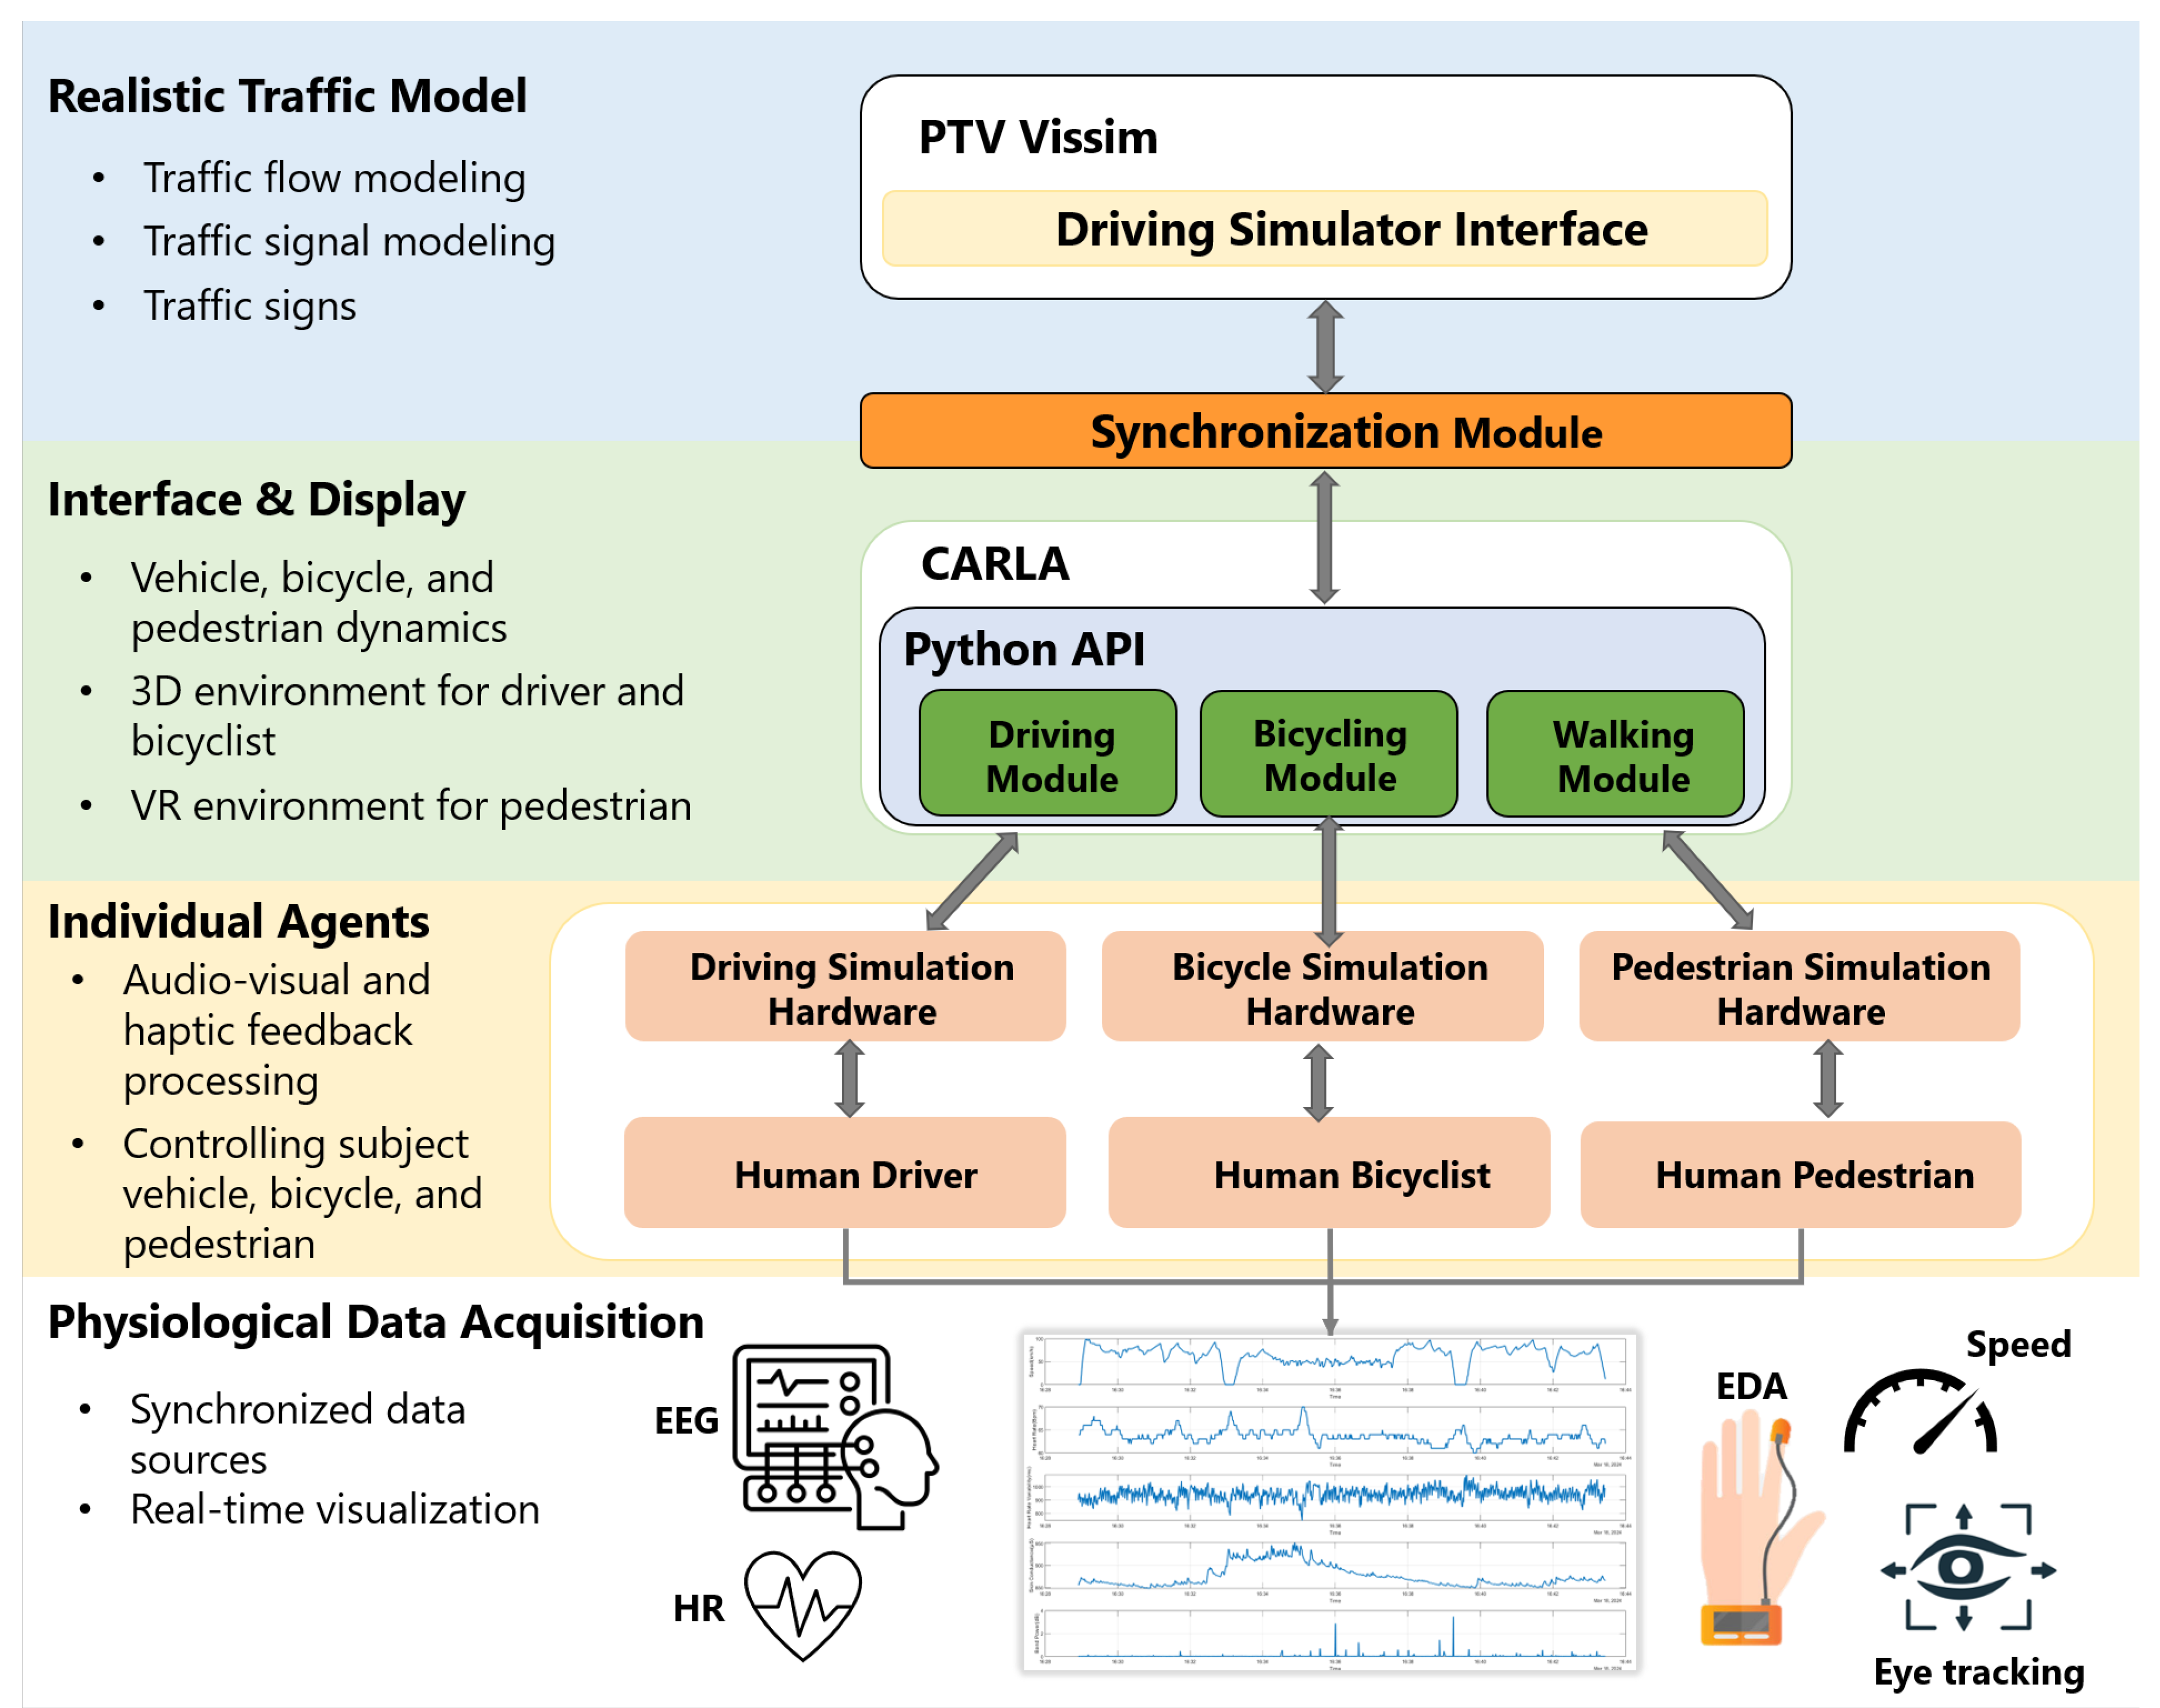
4.4. Co-Simulation Time Coordination and Unified Data Logging
A key innovation of the developed multimodal simulation system is its ability to maintain real-time coordination across multiple independent components—PTV Vissim for background traffic, CARLA for high-fidelity 3D simulation, human-operated driving, bicycle, and pedestrian simulators, and physiological sensors—ensuring consistent simulation timing and unified data output.
To achieve this, all simulation subsystems operate on a shared fixed timestep of 0.05 s. CARLA’s simulation loop is modified via the run_synchronization.py script to match Vissim’s update frequency, creating a lockstep execution pattern where simulation steps only proceed after all modules complete their operations. This design prevents drift between platforms and ensures accurate, time-aligned interactions between human participants and dynamic traffic environments.
Each simulation step follows a structured pipeline:
Traffic Update: PTV Vissim advances background traffic conditions, including vehicle movements and signal phase changes.
State Synchronization: The current vehicle and signal states are transmitted to CARLA via the DrivingSimulator.dll interface using Python bindings (ctypes).
Human-Agent Update: CARLA uses these inputs to update the virtual environment and synchronize agent locations and animations with the driving, bicycle, and pedestrian simulators.
Sensor Polling and Input: Control inputs from the hardware simulators (e.g., steering, speed, walking) are captured and transmitted back to CARLA.
Physiological Data Acquisition: Simultaneously, physiological sensors stream data into the system through Lab Streaming Layer (LSL), maintaining precise alignment using shared global timestamps.
The coordination of these steps ensures that all agents—both human and simulated—respond in real-time to evolving traffic scenarios. The temporal synchronization guarantees that physiological signals such as heart rate, electrodermal activity, and EEG data can be directly mapped to behavioral events such as braking, lane changes, or pedestrian crossing decisions.
All behavioral and physiological data streams are logged into a unified dataset. LabRecorder aggregates the LSL-based streams into time-synchronized files, while behavioral data from CARLA and Vissim are exported with corresponding timestamps. This design enables post-processing tools to analyze multimodal responses across agents and modalities with high temporal precision.
The connections and data flow among all simulation components are illustrated in
Figure 5. This tightly coordinated framework not only supports high-fidelity analysis of human factors in traffic simulation but also provides a scalable foundation for integrating new modalities, sensor types, or simulation platforms. The same architecture can be adapted for use with SUMO, enabling researchers to deploy a fully open-source multimodal co-simulation system while retaining physiological data synchronization capabilities.
5. Case Studies
5.1. Case Study I
Overtaking maneuvers are widely studied phenomena in transportation research, primarily focusing on driver behavior when passing bicyclists. These studies provide valuable insights into how human drivers interact with cyclists, which can later be used to model automated vehicle behavior in mixed-traffic environments. However, most previous research has relied on automated or pre-programmed bicyclists that do not dynamically react to the behavior of passing drivers. This simplification limits the ecological validity of the findings, as real-world bicyclists may adjust their position based on the approaching vehicle.
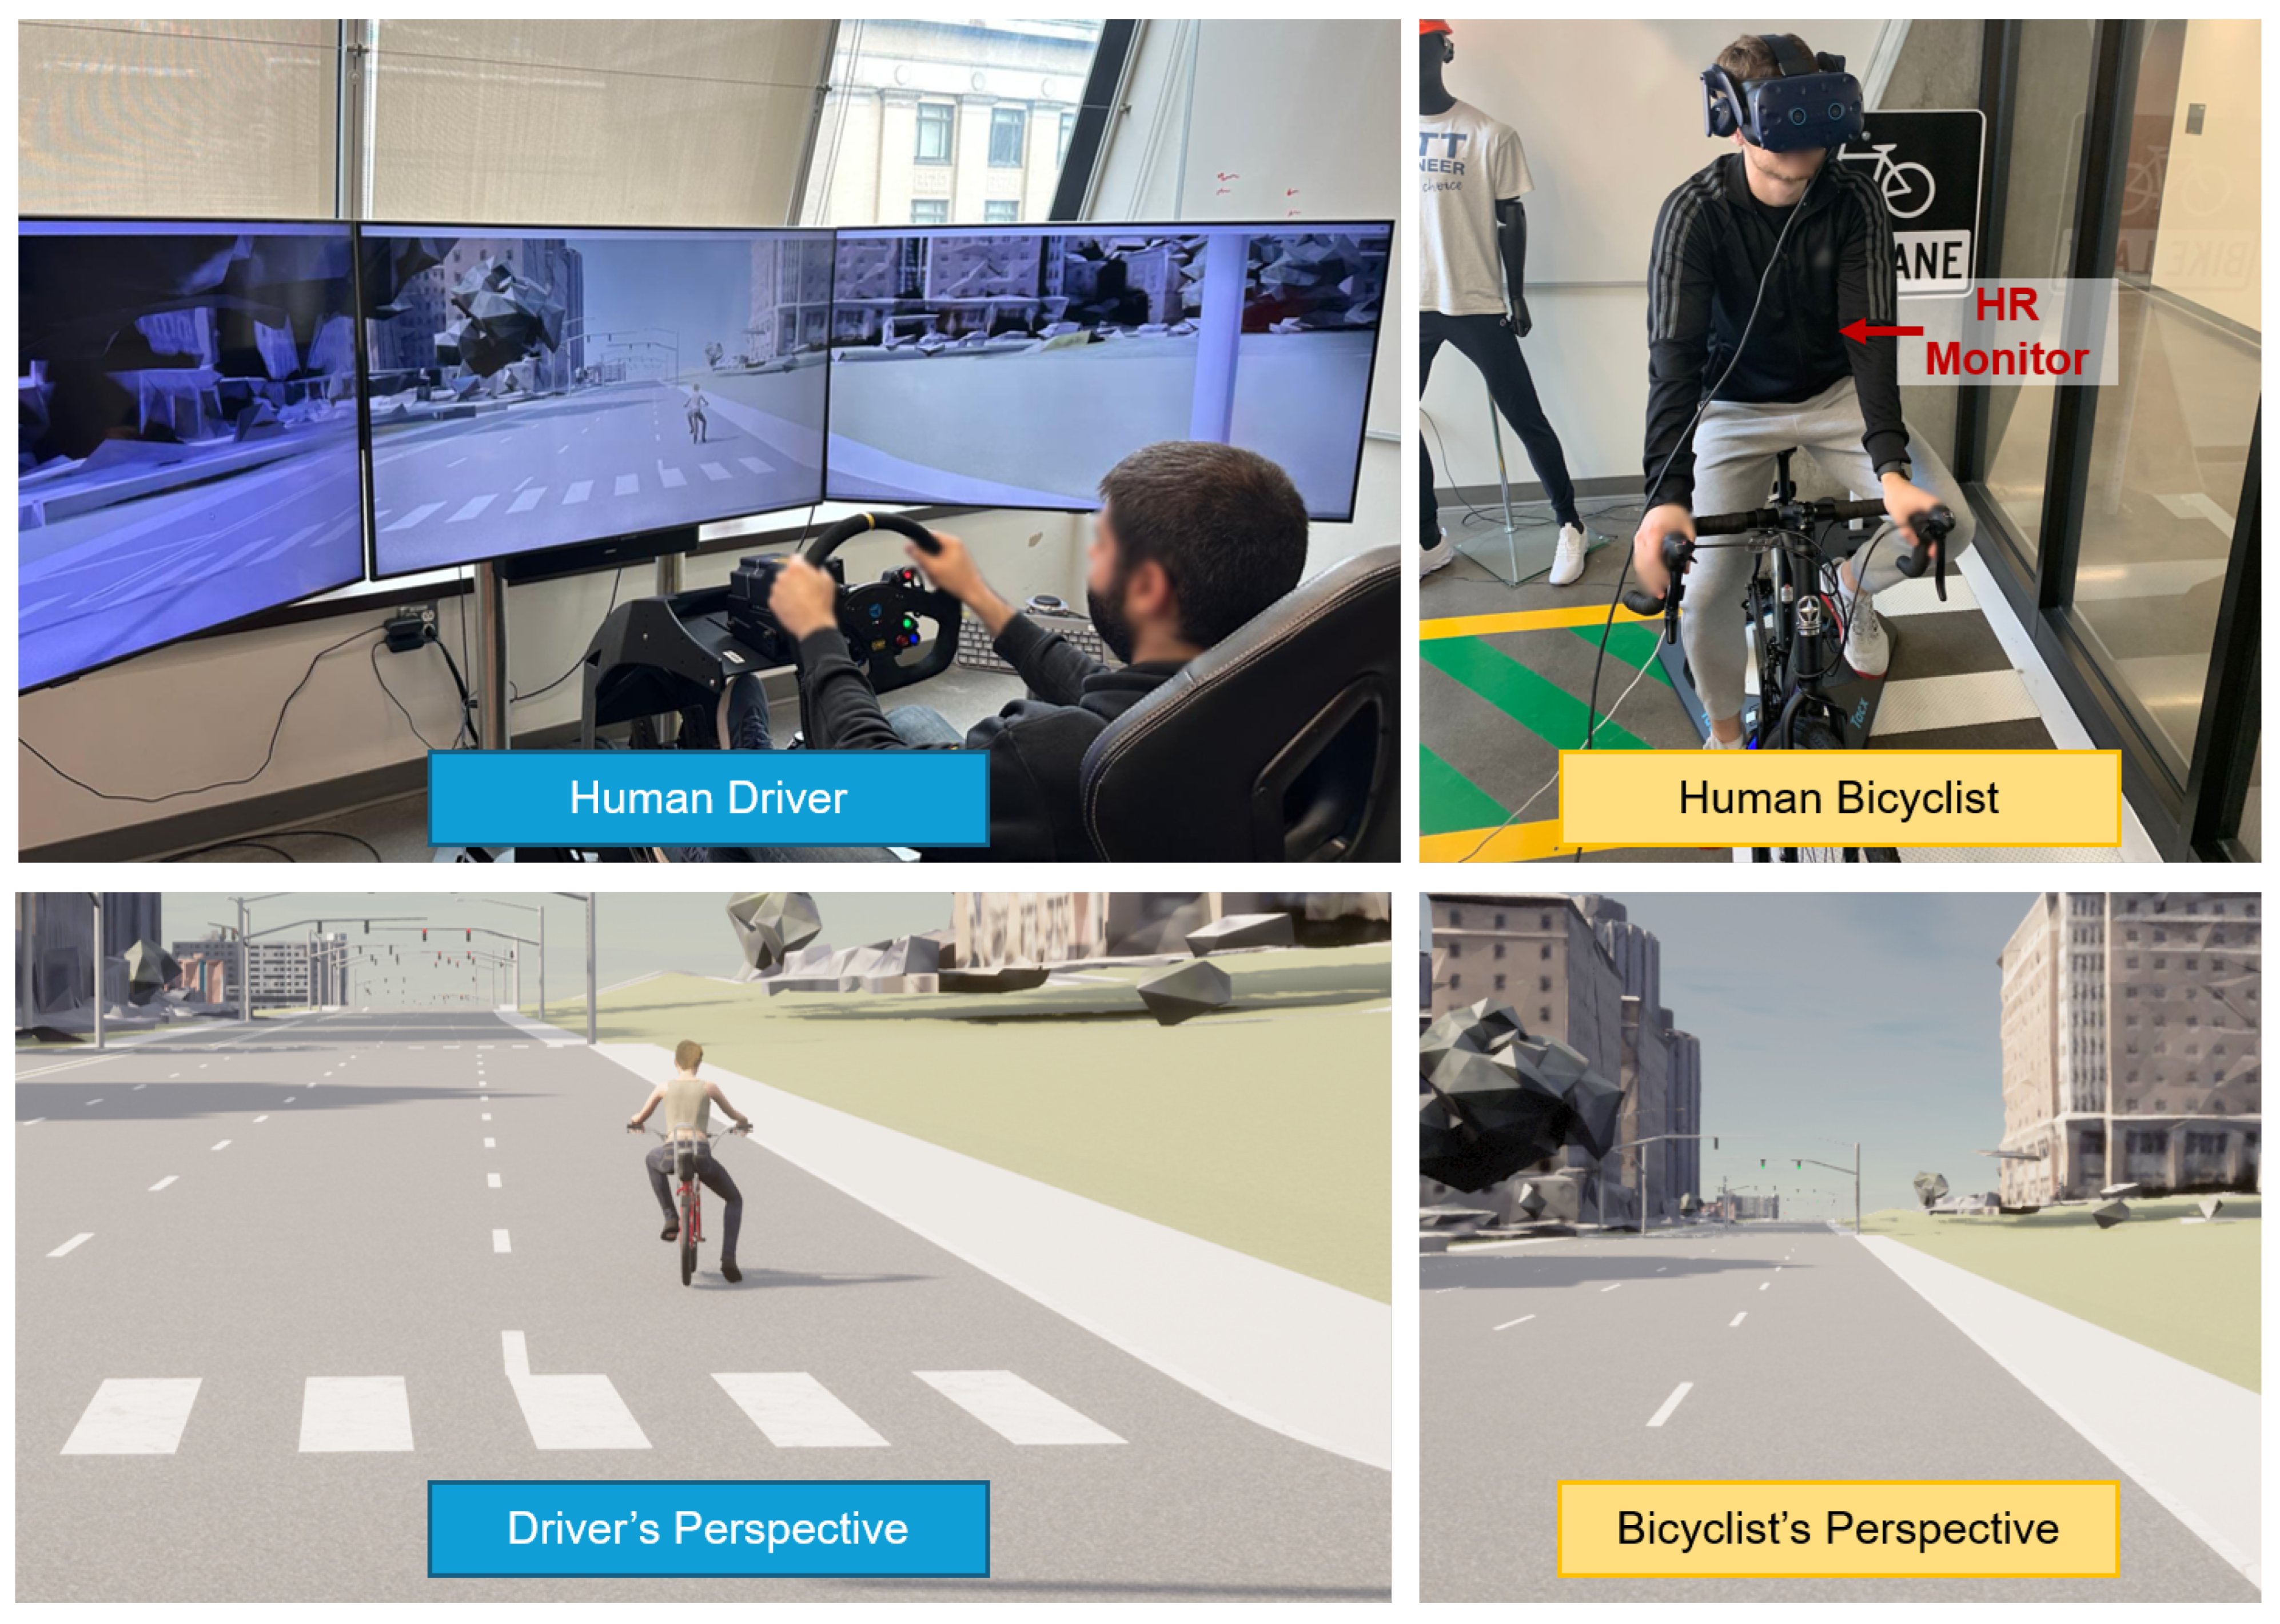
Our study addresses this gap by examining how a bicyclist’s lateral positioning within a dedicated bicycle lane changes when a vehicle passes. Unlike traditional overtaking scenarios where a driver must merge into another lane, our setup involved a vehicle passing a cyclist within an adjacent lane. Despite the presence of a designated bicycle lane, we observed that cyclists adjusted their position in response to the vehicle’s approach, suggesting a natural defensive maneuver. This behavior highlights the interactive nature of driver-bicyclist encounters, which is often overlooked in simulations where cyclists are modeled as static agents.
To further investigate this interaction, we analyzed both the behavioral and physiological responses of bicyclists to passing vehicles. Specifically, we examined how bicyclists adjusted their lane position when approached by a vehicle and whether the event triggered measurable physiological responses. By studying these real-time adjustments, we aim to provide a more accurate representation of bicyclist behavior, which is essential for improving cycling safety, refining bicycle–vehicle interaction models, and informing infrastructure design. It is worth mentioning that the heart rate was used as a primary physiological measure, as it is widely recognized in transportation and human factors research as a reliable, non-invasive indicator of acute stress and heightened arousal during safety-critical events.
5.1.1. Participants
Twenty-five participants were recruited for the experiments, with ages ranging from 20 to 31 years. All participants had prior experience in cycling and driving, ensuring familiarity with real-world road interactions. The selection process aimed to include a diverse group while maintaining consistency in skill levels, allowing for a reliable analysis of bicyclist responses to vehicle interactions.
5.1.2. Experimental Procedure
The experiment was conducted in a controlled virtual environment where a human driver passed a bicyclist riding in a designated bicycle lane. At the beginning of each trial, the driver started approximately 100 m behind the bicyclist to ensure that the bicyclist was unaware of the approaching vehicle until it entered their peripheral vision. This setup was designed to replicate real-world scenarios where bicyclists experience unexpected vehicle interactions.
Once within proximity, the driver continued to approach and eventually passed the bicyclist while maintaining a consistent speed and lateral position. To ensure experimental consistency, the same driver was used across all trials, while the bicyclists varied. Each participant experienced only one passing event per trial to capture an unbiased physiological and behavioral response without the influence of repeated exposure.
To demonstrate the flexible design of our simulator setup, we incorporated two different visualization methods for participants. The bicyclist experienced the virtual environment using a VR headset (VIVE Pro), providing a fully immersive perspective of the passing event. Meanwhile, the driver used the standard simulator setup with three 55-inch TV screens, ensuring a realistic but conventional driving experience. The perspectives and experimental setup are illustrated in
Figure 6.
Data were collected from two primary sources:
Position and speed data of both the driver and the bicyclist, recorded at a frequency of 0.1 s. This provided detailed insights into movement dynamics, including lateral positioning and vehicle–bicycle proximity during the passing event.
Bicyclist heart rate measurements, recorded every 1 s, capturing physiological responses to vehicle proximity.
To analyze how bicyclists responded to passing vehicles, we identified a key reference point in each trial, referred to as the critical moment. This was defined as the time at which the vehicle reached its closest lateral distance to the bicyclist, referred to as the critical distance. The critical distance represents the minimum separation between the vehicle and the cyclist during the passing event.
As shown in
Figure 7, the critical moment anchors the analysis, enabling us to examine both the behavioral and physiological responses before and after this key point. Specifically, we computed the following:
Average lateral position of the bicyclist during the 5 s before and after the critical moment to determine whether participants adjusted their positioning in response to the vehicle. The lateral position was measured relative to the bicycle lane, with the left edge of the lane defined as 0 m and the right edge as 2 m. This provided a standardized reference for assessing lane adjustments.
Average heart rate during the 5 s before and after the critical moment to assess potential stress responses.
By structuring the analysis around this critical moment, we aimed to quantify how bicyclists dynamically adapted to passing vehicles, offering valuable insights into defensive cycling behaviors and potential physiological stress reactions.
5.1.3. Bicyclist—Driver Interaction Hypotheses
In this study, we tested two hypotheses regarding bicyclist behavior and physiological response during a passing event.
Hypothesis 1: Effect of the Driver’s Presence on Bicyclist’s Lateral Position.
The null hypothesis assumes that the presence of a passing vehicle does not influence the bicyclist’s positioning within the bicycle lane. This is based on the premise that a dedicated bicycle lane provides a sense of separation and security, allowing cyclists to maintain a consistent lateral position regardless of external traffic conditions. However, in real-world scenarios, bicyclists tend to adjust their position in response to nearby vehicles, especially when they perceive the vehicle as being too close. This natural tendency to create a greater safety margin supports the alternative hypothesis, suggesting that a passing vehicle may cause the bicyclist to subtly shift within the lane.
Hypothesis 2: Effect of the Driver’s Presence on Bicyclist’s Heart Rate.
Null Hypothesis (H02): The bicyclist’s heart rate does not change in response to the passing driver.
Alternative Hypothesis (H12): The bicyclist’s heart rate increases in response to the passing driver.
The null hypothesis assumes that since the bicycle lane is a designated space for cyclists, the driver’s passing action should not induce a significant physiological stress response. However, in real traffic environments, a vehicle passing at close proximity could trigger a stress response, leading to an increased heart rate. This can be attributed to perceived risk, unexpected movement, or subconscious fear of potential collision, even when the bicyclist is within a dedicated lane. The alternative hypothesis suggests that bicyclists exhibit a measurable physiological reaction when a vehicle passes closely, supporting the notion that proximity to motorized traffic can influence stress levels.
By testing these hypotheses, our study aims to determine whether the presence of a human-driven vehicle influences bicyclist positioning and heart rate, even in the presence of a dedicated bicycle lane. These findings contribute to a better understanding of bicycle–vehicle interactions, which is critical for improving cycling safety, infrastructure design, and the realism of bicycle behavior models in traffic simulations.
5.1.4. Results Analysis
The analysis focused on three key measures to evaluate bicyclist responses to passing vehicles: critical distance, lane position change, and heart rate change. Critical distance was defined as the closest lateral distance between the passing vehicle and the bicyclist, providing an indicator of perceived safety. Lane position change was assessed by comparing the average lateral position of the bicyclist within the dedicated 2-meter-wide bicycle lane during the 5 s before and after the critical moment. In this lane, a position of 0 m represents the left edge, and 2 m represents the right edge, with the center of the lane at 1 m. Heart rate change was calculated as the difference in average heart rate during the same periods to evaluate potential physiological stress responses.
The results showed that the mean critical distance across participants was 2.30 m, with a standard deviation of 0.12 m, suggesting some variability in individual safety perception. While some participants tolerated closer proximity, others exhibited more conservative distancing. A paired t-test comparing the average lateral position before and after the critical moment revealed a statistically significant shift (t = −21.07, p < 0.00001), indicating that bicyclists adjusted their position in response to the passing vehicle. On average, the lane position shifted from 0.94 m before the passing event to 1.14 m after, reflecting a subtle but consistent movement toward the right side of the lane—a defensive behavior likely intended to increase perceived safety.
Similarly, a paired t-test conducted on heart rate data revealed a significant increase (t = −26.94, p < 0.00001), with the average heart rate rising from 69.45 bpm before the passing event to 72.75 bpm afterward. This finding indicates a clear physiological response to the proximity of the vehicle, suggesting heightened alertness or stress during the interaction.
A summary of all quantitative results, including means, standard deviations, and statistical test outcomes, is presented in
Table 1. These results support the hypothesis that bicyclists dynamically adjust both their physical positioning and physiological state in response to motor vehicle interactions. The combination of behavioral and physiological data emphasizes the importance of including real human behavior in simulation-based traffic safety research.
5.2. Case Study II
Pedestrian gap acceptance is a widely studied phenomenon in transportation research, primarily focusing on how pedestrians assess the safety of crossing opportunities when faced with approaching vehicles. These studies provide valuable insights into risk perception, reaction time, and decision-making, which are crucial for modeling pedestrian behavior in traffic simulations and automated vehicle systems. However, most previous research has focused solely on observable crossing decisions, neglecting the physiological responses that may indicate subconscious stress or heightened awareness in response to approaching vehicles.
In this study, we aimed to investigate both the behavioral and physiological responses of pedestrians to vehicles approaching at different speeds. Additionally, we sought to assess whether our multimodal simulation system provides a visually accurate 3D environment for pedestrian safety studies. Since pedestrians rely heavily on visual cues to judge vehicle speed and distance, testing their ability to distinguish between different approach speeds in the virtual environment serves as an indirect validation of the system’s effectiveness in replicating real-world crossing scenarios.
By examining how pedestrians perceive and react to vehicles traveling at 30 mph and 50 mph, we aimed to determine whether increased vehicle speed leads to more conservative gap acceptance decisions and higher physiological stress levels. Similar to Case Study 1, heart rate was used to capture potential stress responses during these interactions, providing an additional layer of insight beyond observable behavior. The findings of this study contribute to a better understanding of pedestrian risk perception while also demonstrating the potential of simulation-based approaches for pedestrian safety research.
5.2.1. Participants
Twenty-five participants were recruited for the experiment, with ages ranging from 20 to 30 years. All participants had prior experience as pedestrians in urban traffic environments, ensuring familiarity with real-world gap acceptance decisions.
5.2.2. Experimental Procedure
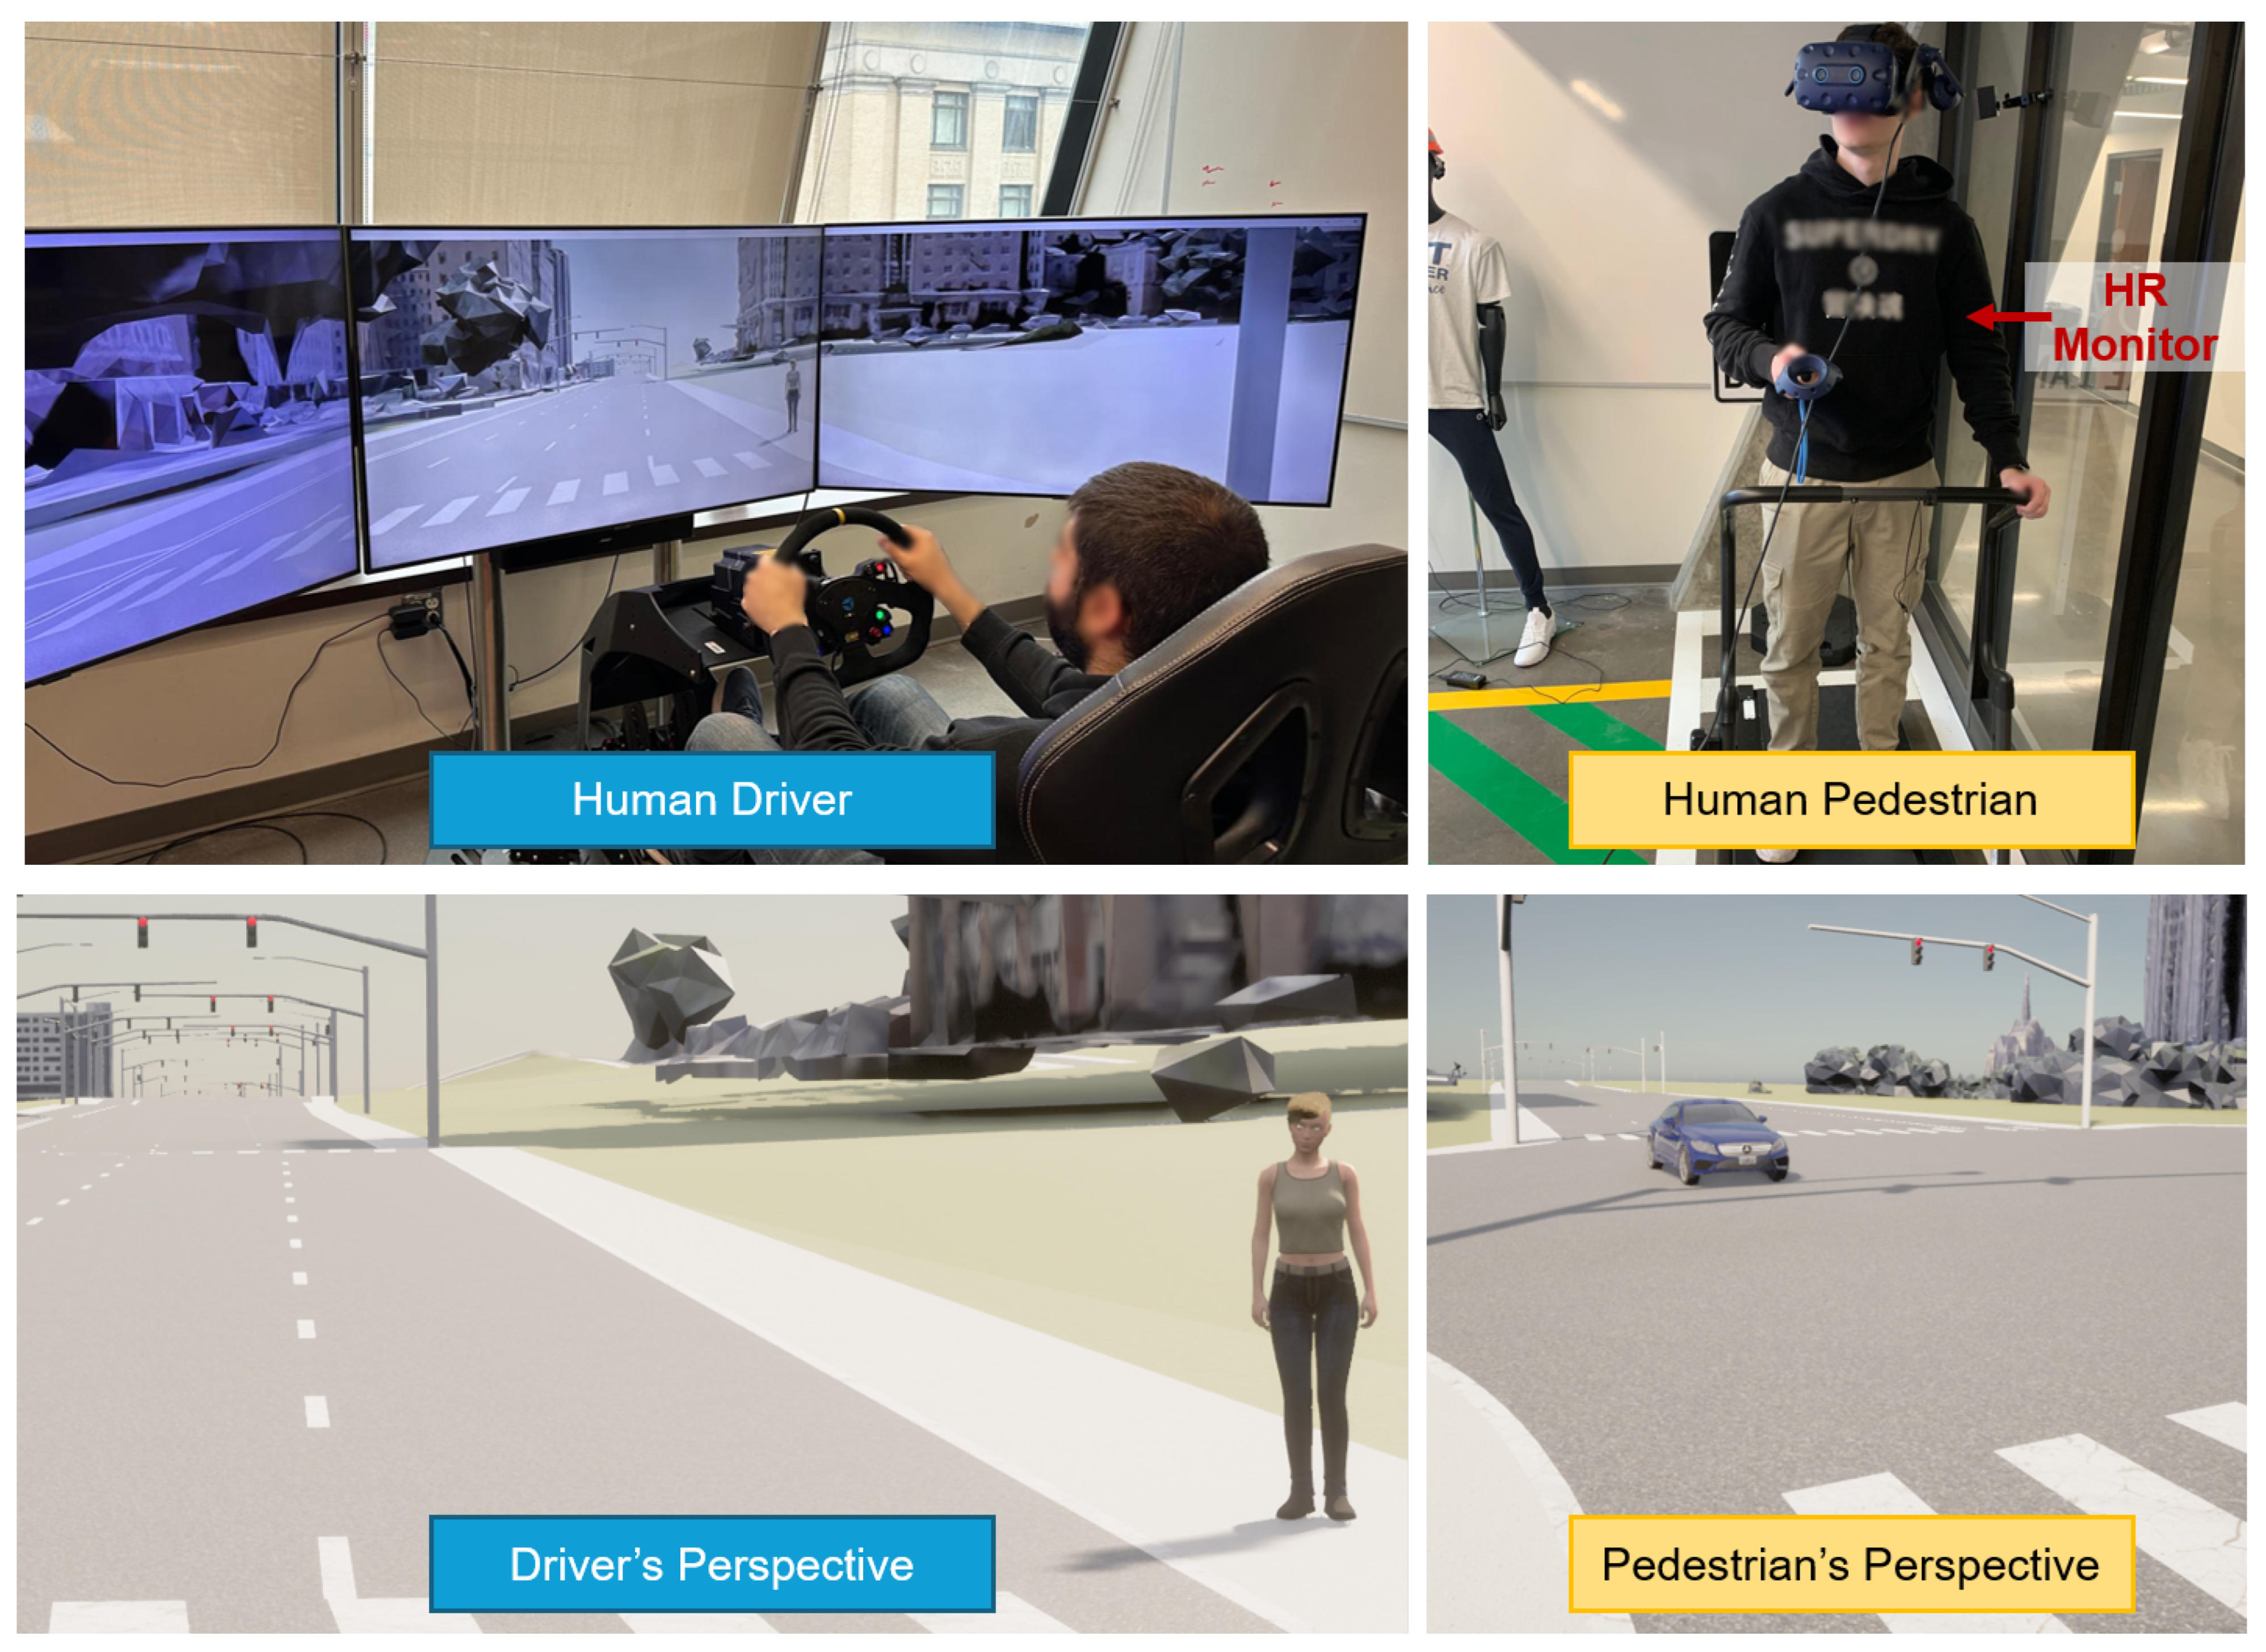
The experiment was conducted in a controlled virtual environment, where a pedestrian wearing a VR headset observed an approaching vehicle driven by a human participant using a regular driving simulator setup with three TV screens. This setup, shown in
Figure 8, was designed to assess whether pedestrians could visually perceive speed differences within the virtual environment, thereby validating the realism of the simulation for pedestrian safety studies.
At the start of each trial, the driver was positioned at a sufficient distance to ensure that the pedestrian could visually track the vehicle’s approach from the moment it entered their field of vision. The scenario was set on a three-lane road, with the pedestrian standing at the edge of the rightmost lane. The pedestrian remained stationary at the roadside throughout the experiment and was instructed to monitor the approaching vehicle and determine the moment they perceived it as unsafe to cross. Participants recorded this decision using a controller, allowing for an objective assessment of gap acceptance behavior.
Each participant completed two trials, one in which the vehicle approached at 30 mph and another at 50 mph. In both trials, the vehicle traveled in the rightmost lane of a three-lane road. The order of these trials was randomized to prevent order effects, ensuring that participants were not influenced by a fixed speed progression from slow to fast.
The study measured both behavioral and physiological responses to approaching vehicles. Data were collected from two primary sources:
Position and speed data of the vehicle and pedestrian, recorded at a frequency of 0.1 s.
Pedestrian heart rate measurements, recorded every 1 s, capturing physiological responses to vehicle proximity.
A key reference point, referred to as the critical moment, was defined as the time at which the vehicle reached its minimum distance from the pedestrian, known as the critical distance. This critical distance represents the closest point of approach between the vehicle and the pedestrian.
To assess how pedestrians responded to vehicle speed, we computed the following:
Gap acceptance, measured as the timestamp when the pedestrian recorded that it was unsafe to cross.
Average heart rate during the 5 s before and after the critical moment to assess potential stress responses.
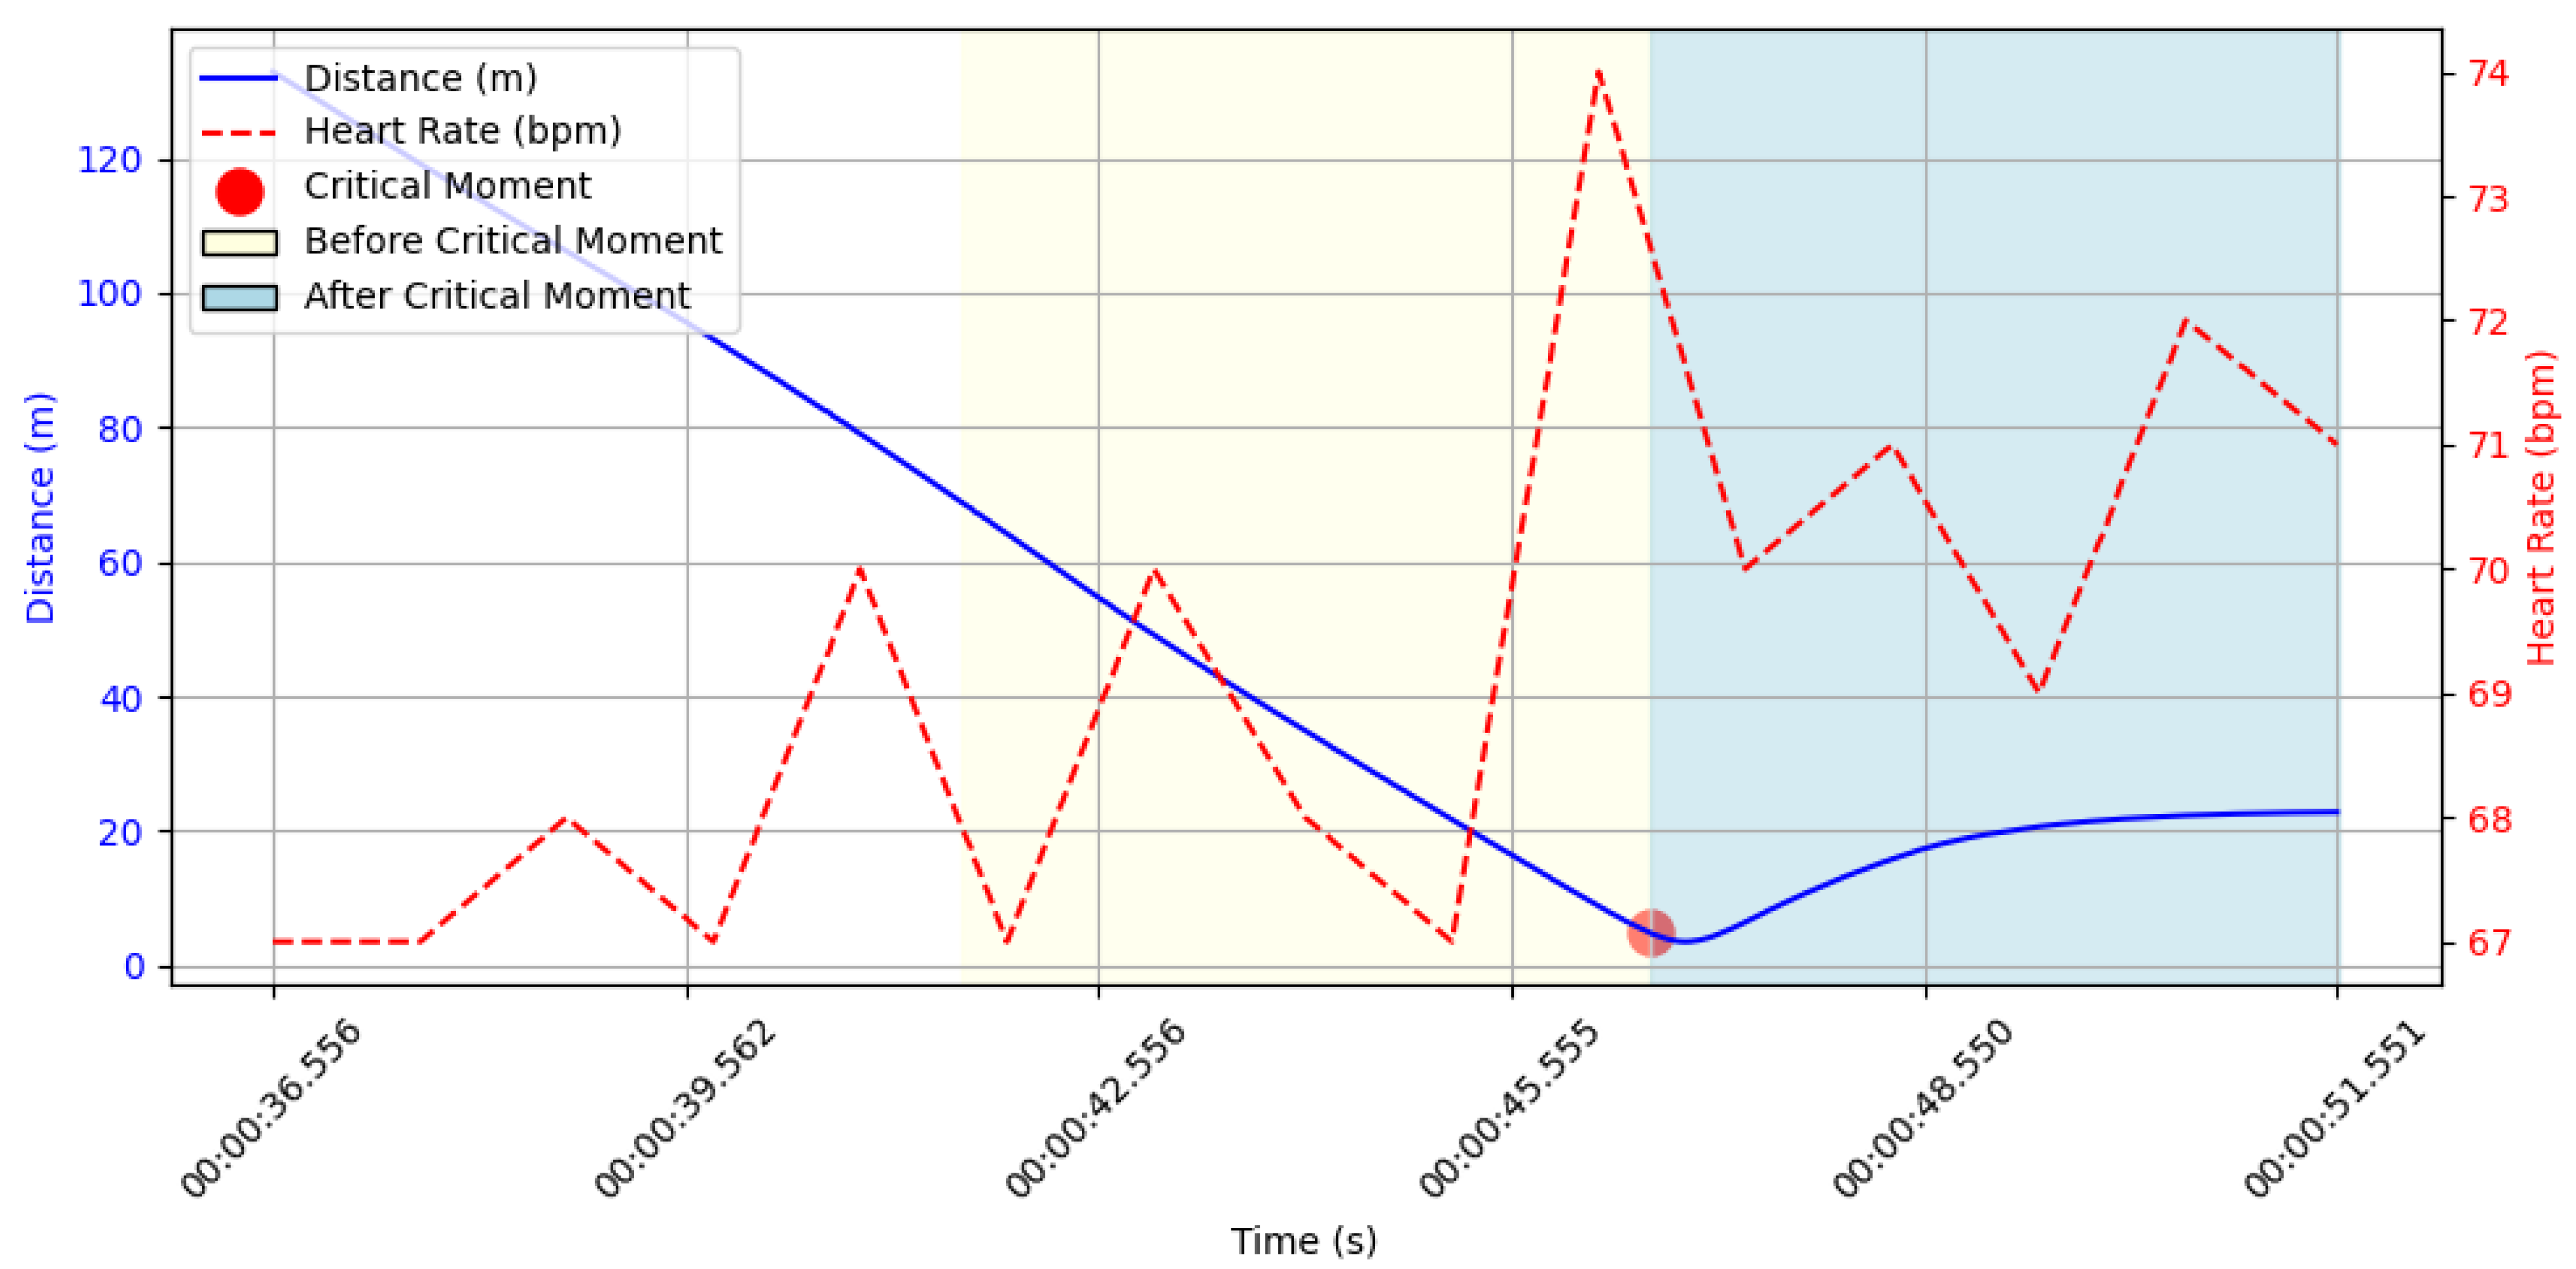
Figure 9 illustrates the relationship between the heart rate and the distance between the driver and the pedestrian, highlighting the critical moment used for analysis. By structuring the analysis around the critical moment, we aimed to quantify how pedestrians mentally and physiologically adapted to different vehicle speeds while also evaluating whether the simulation system provides a valid representation of the visual cues necessary for pedestrian safety research.
5.2.3. Pedestrian—Driver Interaction Hypotheses
In this study, we tested two hypotheses regarding pedestrian behavior and physiological response to approaching vehicles.
Hypothesis 1: Effect of Vehicle Speed on Pedestrian Gap Acceptance.
The null hypothesis assumes that pedestrians make crossing decisions independent of vehicle speed, meaning they accept gaps of similar size whether the vehicle is traveling at 30 mph or 50 mph. However, in real-world scenarios, pedestrians often base their crossing decisions on perceived risk and available reaction time. Faster vehicles provide shorter time windows for crossing, potentially leading to more cautious decisions and longer accepted gaps. The alternative hypothesis suggests that higher speeds increase perceived danger, making pedestrians less likely to accept small gaps and more inclined to wait for larger gaps before crossing.
Hypothesis 2: Effect of Vehicle Speed on Pedestrian Heart Rate.
Null Hypothesis (H02): Vehicle speed does not influence pedestrian heart rate during the trial.
Alternative Hypothesis (H12): Higher vehicle speeds cause an increase in pedestrian heart rate, indicating a physiological stress response.
The null hypothesis assumes that vehicle speed does not induce significant physiological stress in pedestrians and that their heart rate remains stable regardless of approaching vehicle speed. However, research on risk perception suggests that higher speeds may be subconsciously interpreted as more dangerous, leading to increased physiological arousal. The alternative hypothesis proposes that faster vehicles generate a stronger stress response, which can be captured through elevated heart rate levels before and after the critical moment.
By testing these hypotheses, our study aims to determine whether vehicle speed significantly influences pedestrian gap acceptance and stress responses while validating the ability of our simulation system to provide an accurate and immersive 3D environment for pedestrian safety research. This ensures that future studies can reliably use the setup to assess real-world pedestrian decision-making under different traffic conditions.
5.2.4. Results Analysis
The analysis focused on two primary measures to evaluate pedestrian responses to approaching vehicles: gap acceptance and heart rate change. Gap acceptance was defined as the moment when the pedestrian perceived it was unsafe to cross, recorded through a controller input. This measure serves as an indicator of perceived risk in relation to vehicle speed. Heart rate change was assessed by comparing the average heart rate of pedestrians during the 5 s before and after the critical moment, defined as the point at which the vehicle reached its minimum distance from the pedestrian. Paired t-tests were conducted to determine statistical significance, with as the threshold.
The results showed that the mean gap acceptance time was 3.18 s (SD = 0.19) for the 30 mph trials and 3.70 s (SD = 0.20) for the 50 mph trials. A paired t-test revealed a statistically significant difference between these conditions , indicating that pedestrians accepted significantly larger gaps when faced with faster-approaching vehicles. This supports the first hypothesis that higher vehicle speeds result in more conservative gap acceptance behavior, reflecting an increased perception of risk.
Similarly, heart rate analysis revealed a significant increase in both conditions. For the 30 mph trials, heart rate rose from the pre-event average to a post-event average with a mean increase of 1.91 bpm, which was statistically significant . For the 50 mph condition, the heart rate increase was even more pronounced, with an average change of 3.54 bpm . These results support the second hypothesis, indicating that faster vehicle speeds trigger stronger physiological stress responses in pedestrians.
Together, these findings demonstrate that pedestrians not only adjust their behavioral responses (by accepting larger gaps) but also exhibit measurable physiological reactions (through elevated heart rate) in response to approaching vehicles at higher speeds.
Table 2 summarizes the mean values, standard deviations, and statistical test results for both gap acceptance and heart rate change. The consistent and statistically significant effects across both behavioral and physiological measures validate the capability of our simulation system to generate realistic scenarios for pedestrian safety research.
5.3. Comparative Analysis of Bicyclist and Pedestrian Safety Perceptions
In addition to the individual analyses, we conducted a comparative assessment of safety perceptions across both case studies. Bicyclists and pedestrians exhibited comparable physiological stress responses to vehicle interactions, with heart rate increases of 3.30 bpm and 3.54 bpm, respectively. This suggests that perceived risk was consistently high, regardless of mode or task.
Although the behavioral responses appeared different, this variation was expected due to the distinct nature of the scenarios. Bicyclists, already in motion, were able to react by shifting laterally within the bike lane. Pedestrians, in contrast, remained stationary and responded by withholding crossing, their only available behavioral option. Thus, while the form of response differed, both groups demonstrated clear sensitivity to traffic conditions within the constraints of the respective designs.
This comparison underscores the value of a multimodal simulation framework that accommodates different types of interaction—continuous spatial adjustments for moving agents and discrete decision-making for stationary ones—while still enabling a unified analysis of perceived safety and stress.
These findings align with several key insights from the literature. Cobb et al. (2021) [
37] found that changes in lane conditions and surrounding traffic dynamics can elevate stress responses, evidenced by increased peaks in galvanic skin response (GSR) signals. Guo et al. (2023) [
38] reported that while average heart rate may not significantly change with surrounding traffic, the frequency of heart rate fluctuations increases, indicating heightened physiological sensitivity. Kadali et al. (2015) [
39] demonstrated that higher vehicle speeds lead to shorter durations of accepted gaps, highlighting the influence of speed on risk-taking behavior. Finally, although Paschalidis et al. (2018) [
40] focused on drivers rather than pedestrians, their study revealed that stressful gap acceptance scenarios trigger elevated heart rate and electrodermal activity levels, supporting the link between decision-making under risk and physiological stress responses.
Together, these findings provide further support for our observed trends and emphasize the relevance of our multimodal experimental framework for capturing real-time safety perceptions across different traffic interaction contexts.
5.4. Case Study III
To evaluate whether our simulation system can realistically replicate urban traffic conditions, we conducted a validation case study comparing driver behavior in field and simulation environments. Realistic traffic flow is essential for supporting multimodal experiments, where pedestrians, bicyclists, and drivers respond to surrounding vehicles in context-sensitive ways. To assess simulation fidelity, we examined both absolute validity—whether simulated speeds closely match observed speeds on a segment-by-segment basis—and relative validity, which evaluates the consistency of trends across segments by measuring the correlation between field and simulated mean speeds.
This study focused on a major urban corridor in Pittsburgh— Forbes Avenue—and used a calibrated Vissim model integrated with CARLA to simulate realistic driving conditions. The model was calibrated for the AM peak period (7:00–10:00 AM) using local demand data and signal timing plans as detailed in [
41]. Segment-level mean speeds were then compared between real-world and simulated driving to assess the system’s fidelity.
5.4.1. Participants
A total of 25 licensed drivers participated in both the field and simulation trials. Each participant completed two driving sessions—one conducted in real traffic and the other in the driving simulator—covering the same predefined route. This route consisted of 10 segments on Forbes Avenue. The within-subject design enabled a direct comparison of individual driving behavior across environments.
5.4.2. Experimental Procedure
The experiment followed a two-phase design: a field driving session and a simulation-based replication. Both sessions were conducted during the morning peak to ensure consistency in traffic conditions.
In the field phase, participants drove naturally through the selected segments while the vehicle speed was continuously recorded using high-resolution GPS sensors. Segment-level mean speeds were calculated based on travel time between signalized intersections.
In the simulation phase, participants repeated the same task using a high-fidelity driving simulator that integrates a calibrated Vissim model with CARLA’s 3D visualization. The simulator replicated the exact route geometry, traffic control logic, and background traffic. Vehicle speeds were recorded at the same segment level as in the field trial, enabling direct comparison.
This setup allowed us to assess how well the simulation replicates real-world traffic dynamics, thereby validating the system for use in multimodal interaction studies where traffic realism is essential.
5.4.3. Driving Experience Hypothesis
To evaluate whether the simulation accurately replicates real-world driving behavior, we tested the following hypothesis:
Hypothesis 1: Effect of Simulation Environment on Driver Mean Speed.
Null Hypothesis (H03): Segment-wise mean vehicle speeds differ significantly between the simulation and the field environment.
Alternative Hypothesis (H13): There is no significant difference between the segment-wise mean vehicle speeds in the simulation and the field environment.
To evaluate the similarity between field and simulation results, we employed several statistical techniques. T-tests were conducted to compare the mean speed values for each segment, while Kolmogorov–Smirnov (K–S) tests were used to assess whether the overall distribution of speeds differed between the two environments. Wilcoxon signed-rank tests provided a non-parametric alternative for comparing paired speed samples without assuming normality. Additionally, ANOVA was applied to evaluate segment-level variance across field and simulation runs. To complement these classical tests, Bayesian analysis was used to estimate the probability that simulated speeds exceeded field speeds, offering a probabilistic and interpretable measure of agreement. Finally, relative validity was assessed by computing the Pearson correlation coefficient (r) between field and simulated segment-level mean speeds, providing a quantitative measure of the strength of the linear relationship across segments.
5.4.4. Results Analysis
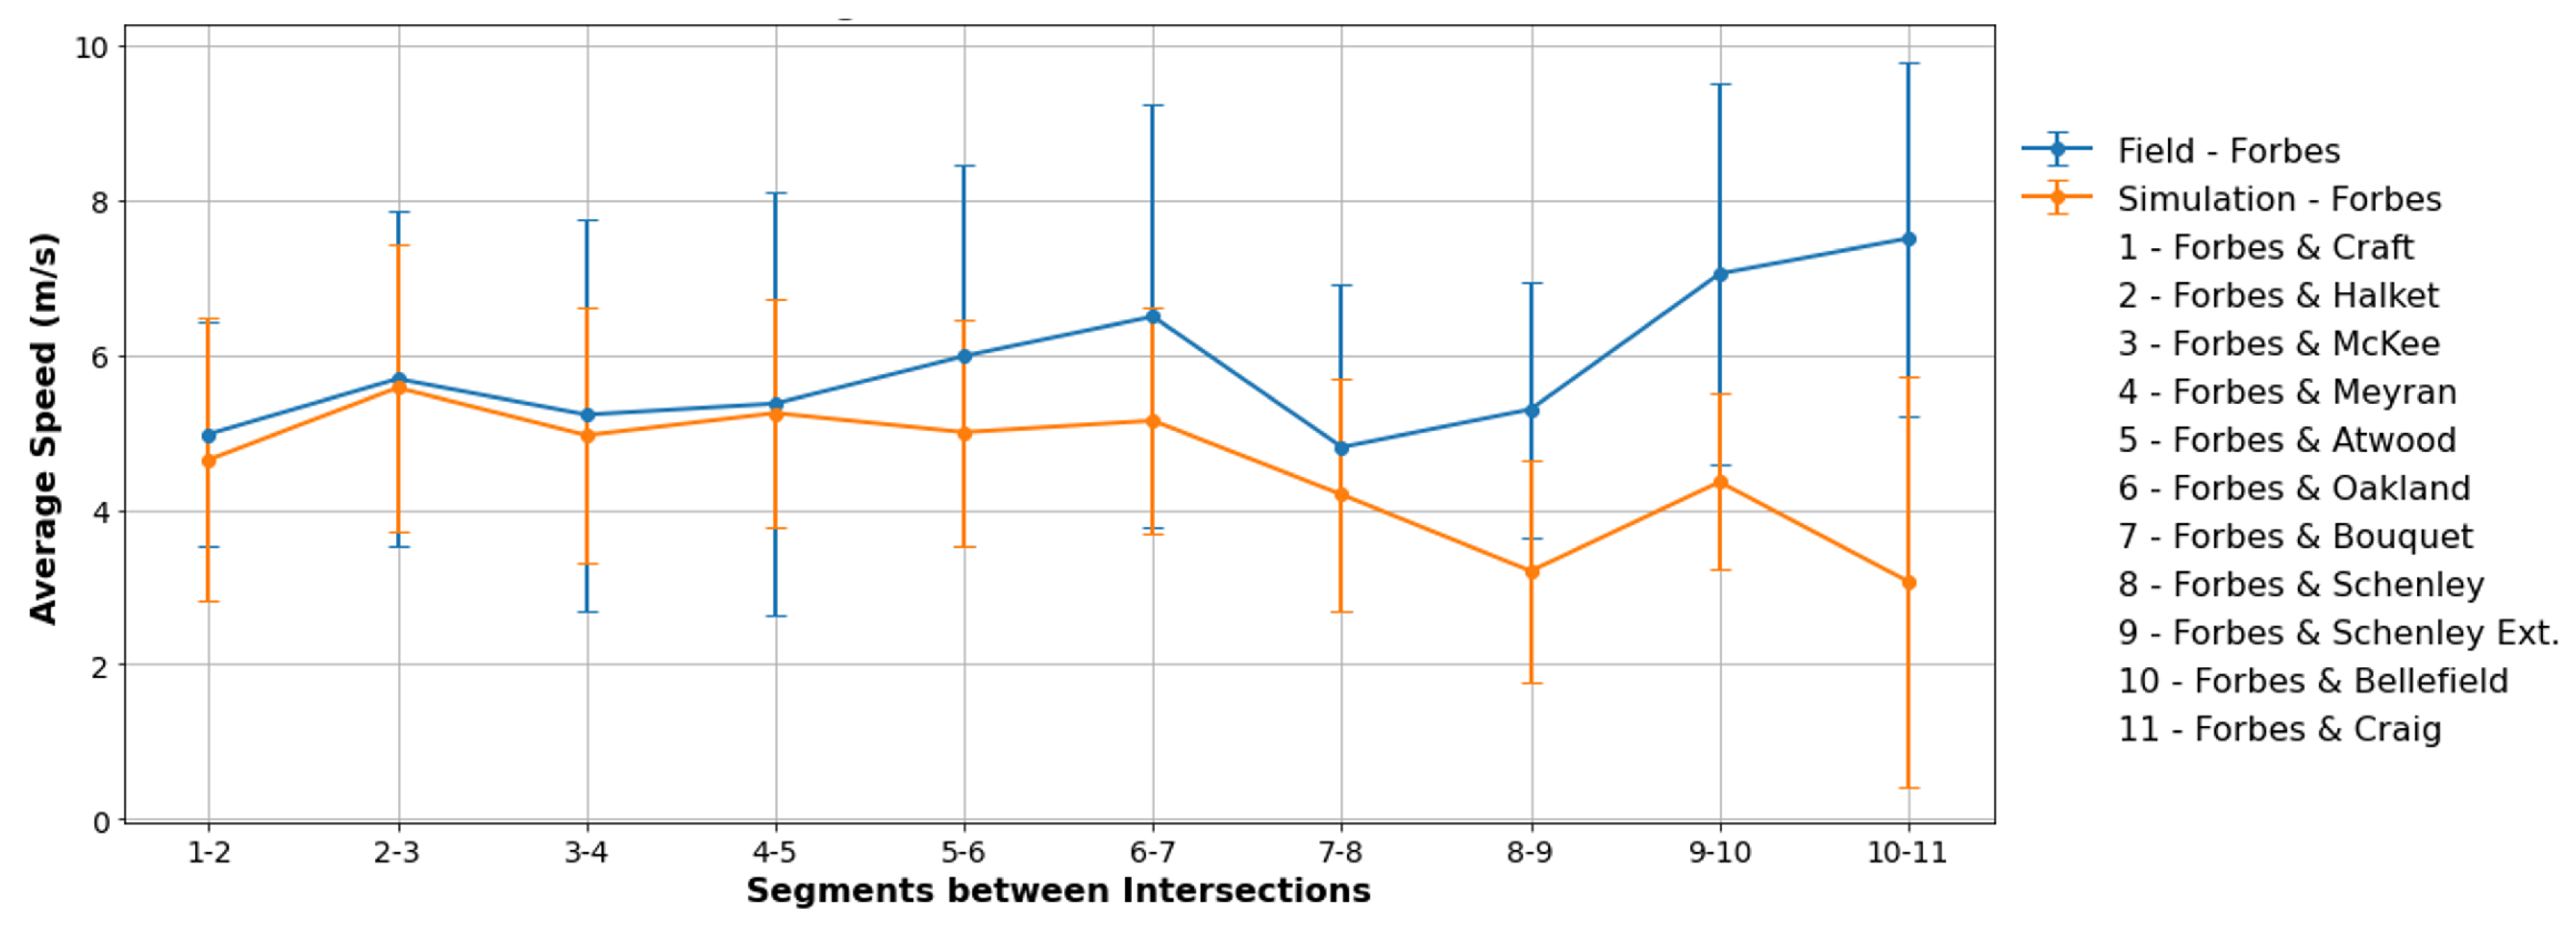
The average speeds and standard deviations of the collected speeds in the field and simulation are presented in
Figure 10. For absolute validity, the hypothesis posited that the simulator system cannot fully reflect real-world conditions.
In
Table 3 and
Table 4, the statistical test results are presented for the segments from Forbes Avenue. Absolute validity was established for 7 out of 10 segments, demonstrating highly accurate performance. Bayesian analysis provided additional evidence of similarity. Relative validity was established for Forbes Avenue (
). It is worth noting that all the applied tests produced consistent results. This shows that the simulation system provides unbiased and reliable estimates of speed rates compared to real-world data.
6. Conclusions
This study developed a novel multimodal co-simulation system that enables real-time interaction between drivers, cyclists, and pedestrians in a shared 3D virtual environment. A key innovation is the integration of CARLA with PTV Vissim via real-time data exchange and physiological sensors using Lab Streaming Layer (LSL), allowing synchronized analysis of behavioral and physiological responses under dynamic traffic conditions.
Three case studies were conducted to demonstrate the capabilities of the system. In the first, bicyclists shifted their lateral position significantly (0.94 m to 1.14 m, ) and showed an increased heart rate (69.45 to 72.75 bpm, ) during overtaking events. In the second, pedestrians exposed to vehicles traveling at 50 mph versus 30 mph accepted longer gaps (3.70 s vs. 3.18 s, ) and exhibited stronger heart rate responses (3.54 bpm vs. 1.91 bpm, ), indicating elevated stress. The third case study demonstrated that the system can realistically reproduce real-world traffic conditions, with strong alignment observed between simulated and real-world mean speeds.
By presenting the technical details and experimental applications of this multimodal simulation system, this study provides a foundational resource for researchers interested in human-centered traffic simulation. The system’s flexibility allows for a wide range of applications, including studying the impact of automated vehicles, evaluating the effectiveness of infrastructure changes, and understanding real-time decision-making processes of different road users. The developed simulation framework offers a scalable and adaptable platform for transportation safety research. By enabling real human interactions in a synchronized virtual environment, the system bridges the gap between traditional driving simulation studies and real-world traffic dynamics, supporting the development of safer and more efficient mobility systems. Future research can expand on this work by exploring additional variables such as environmental conditions, driver intentions, and interactions involving multiple agents. Interdisciplinary collaborations involving medical and psychological experts could also enhance the interpretation of physiological data, enabling deeper insights into stress, cognition, and human behavior in complex traffic scenarios.


