


Research on Quality Prediction for Thermal Printing Using a Particle Swarm Optimization with Back Propagation (PSO-BP) Neural Network


Abstract
1. Introduction
1.1. Traditional Printing Quality
1.2. The Quality Prediction of Printing with BP Neural Networks and PSO
1.3. The Optimal Parameters of Printing Quality Using Machine Learning
1.4. The Purpose of This Research
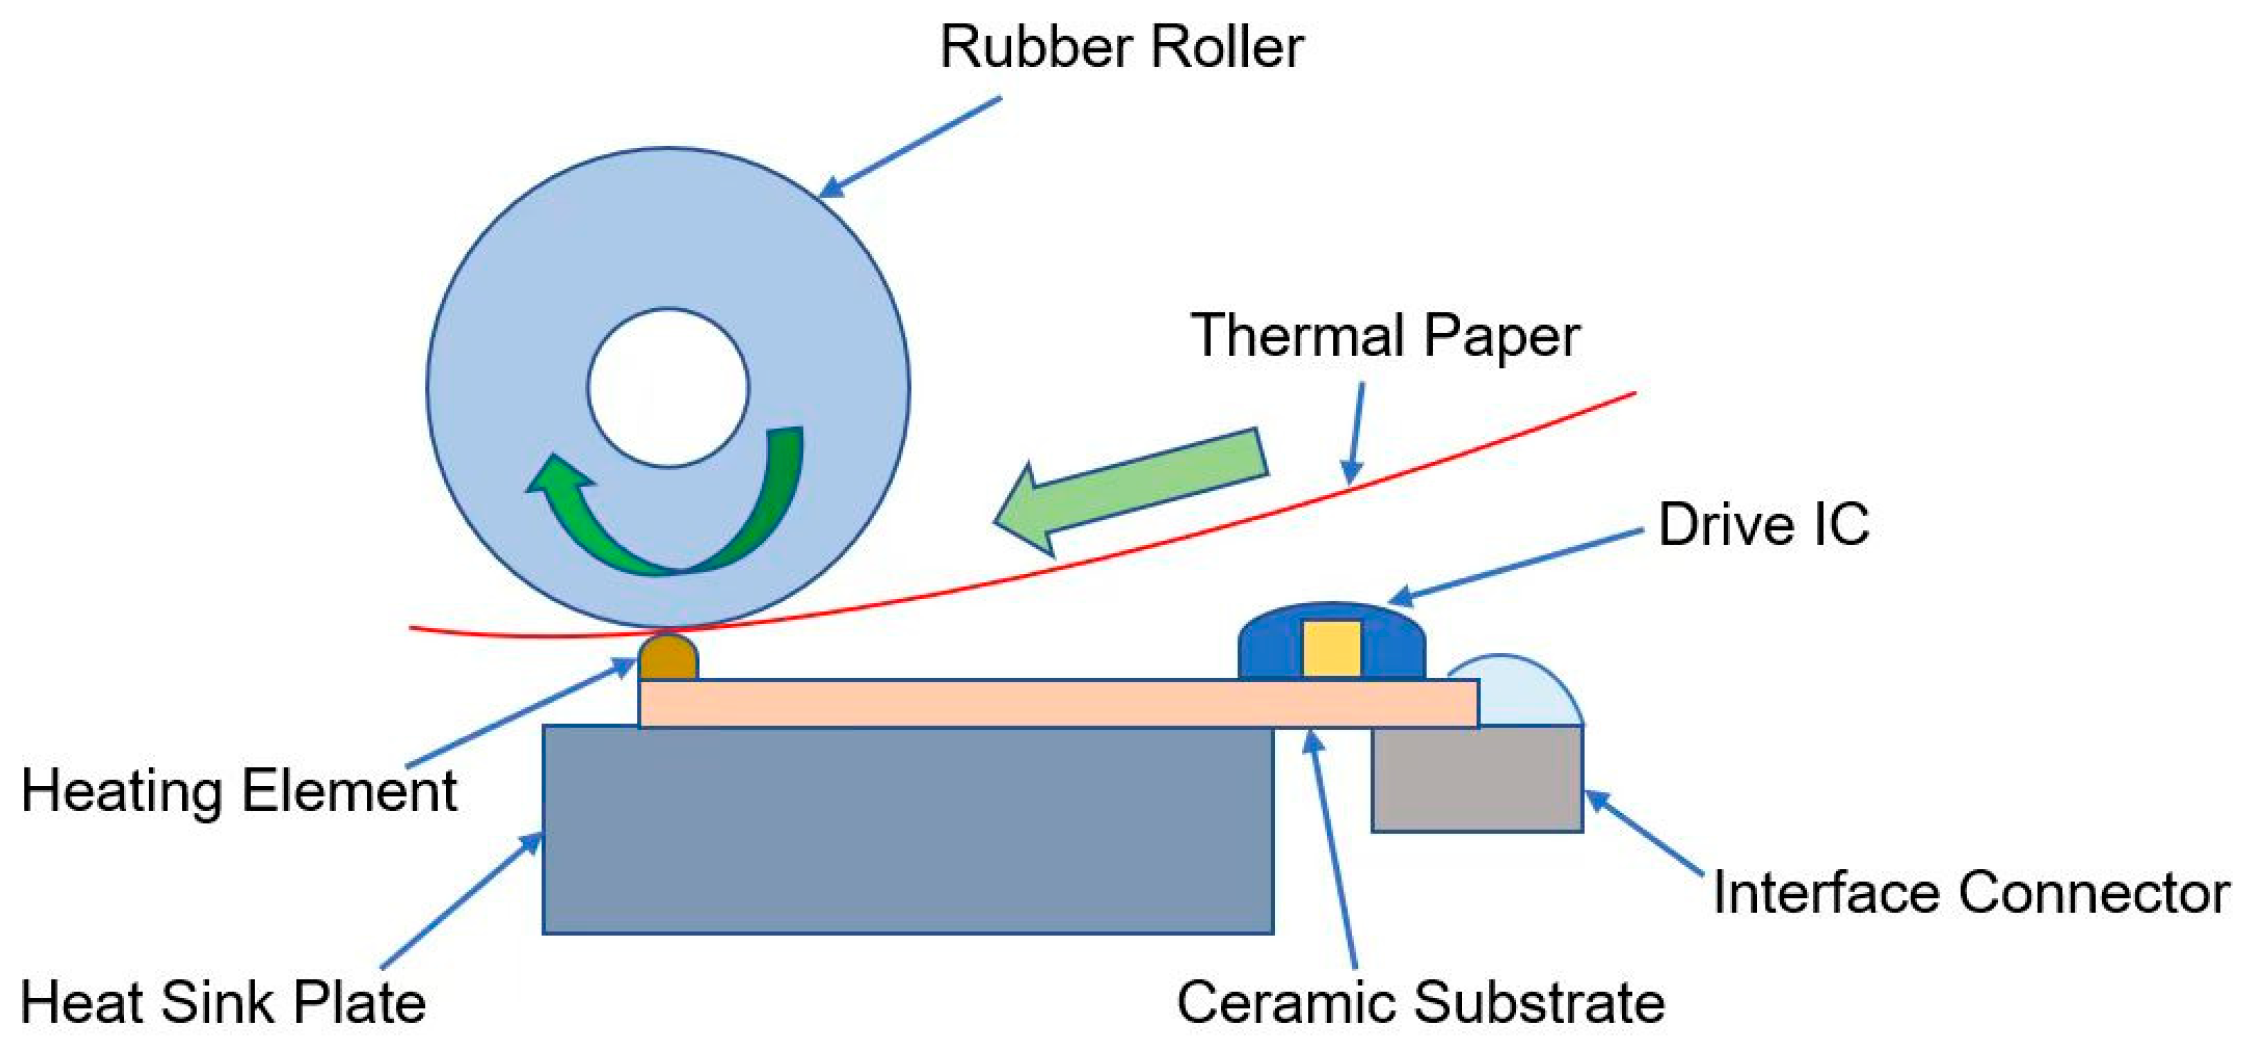
2. The Principle of Printing and Key Parameters
3. Methodology
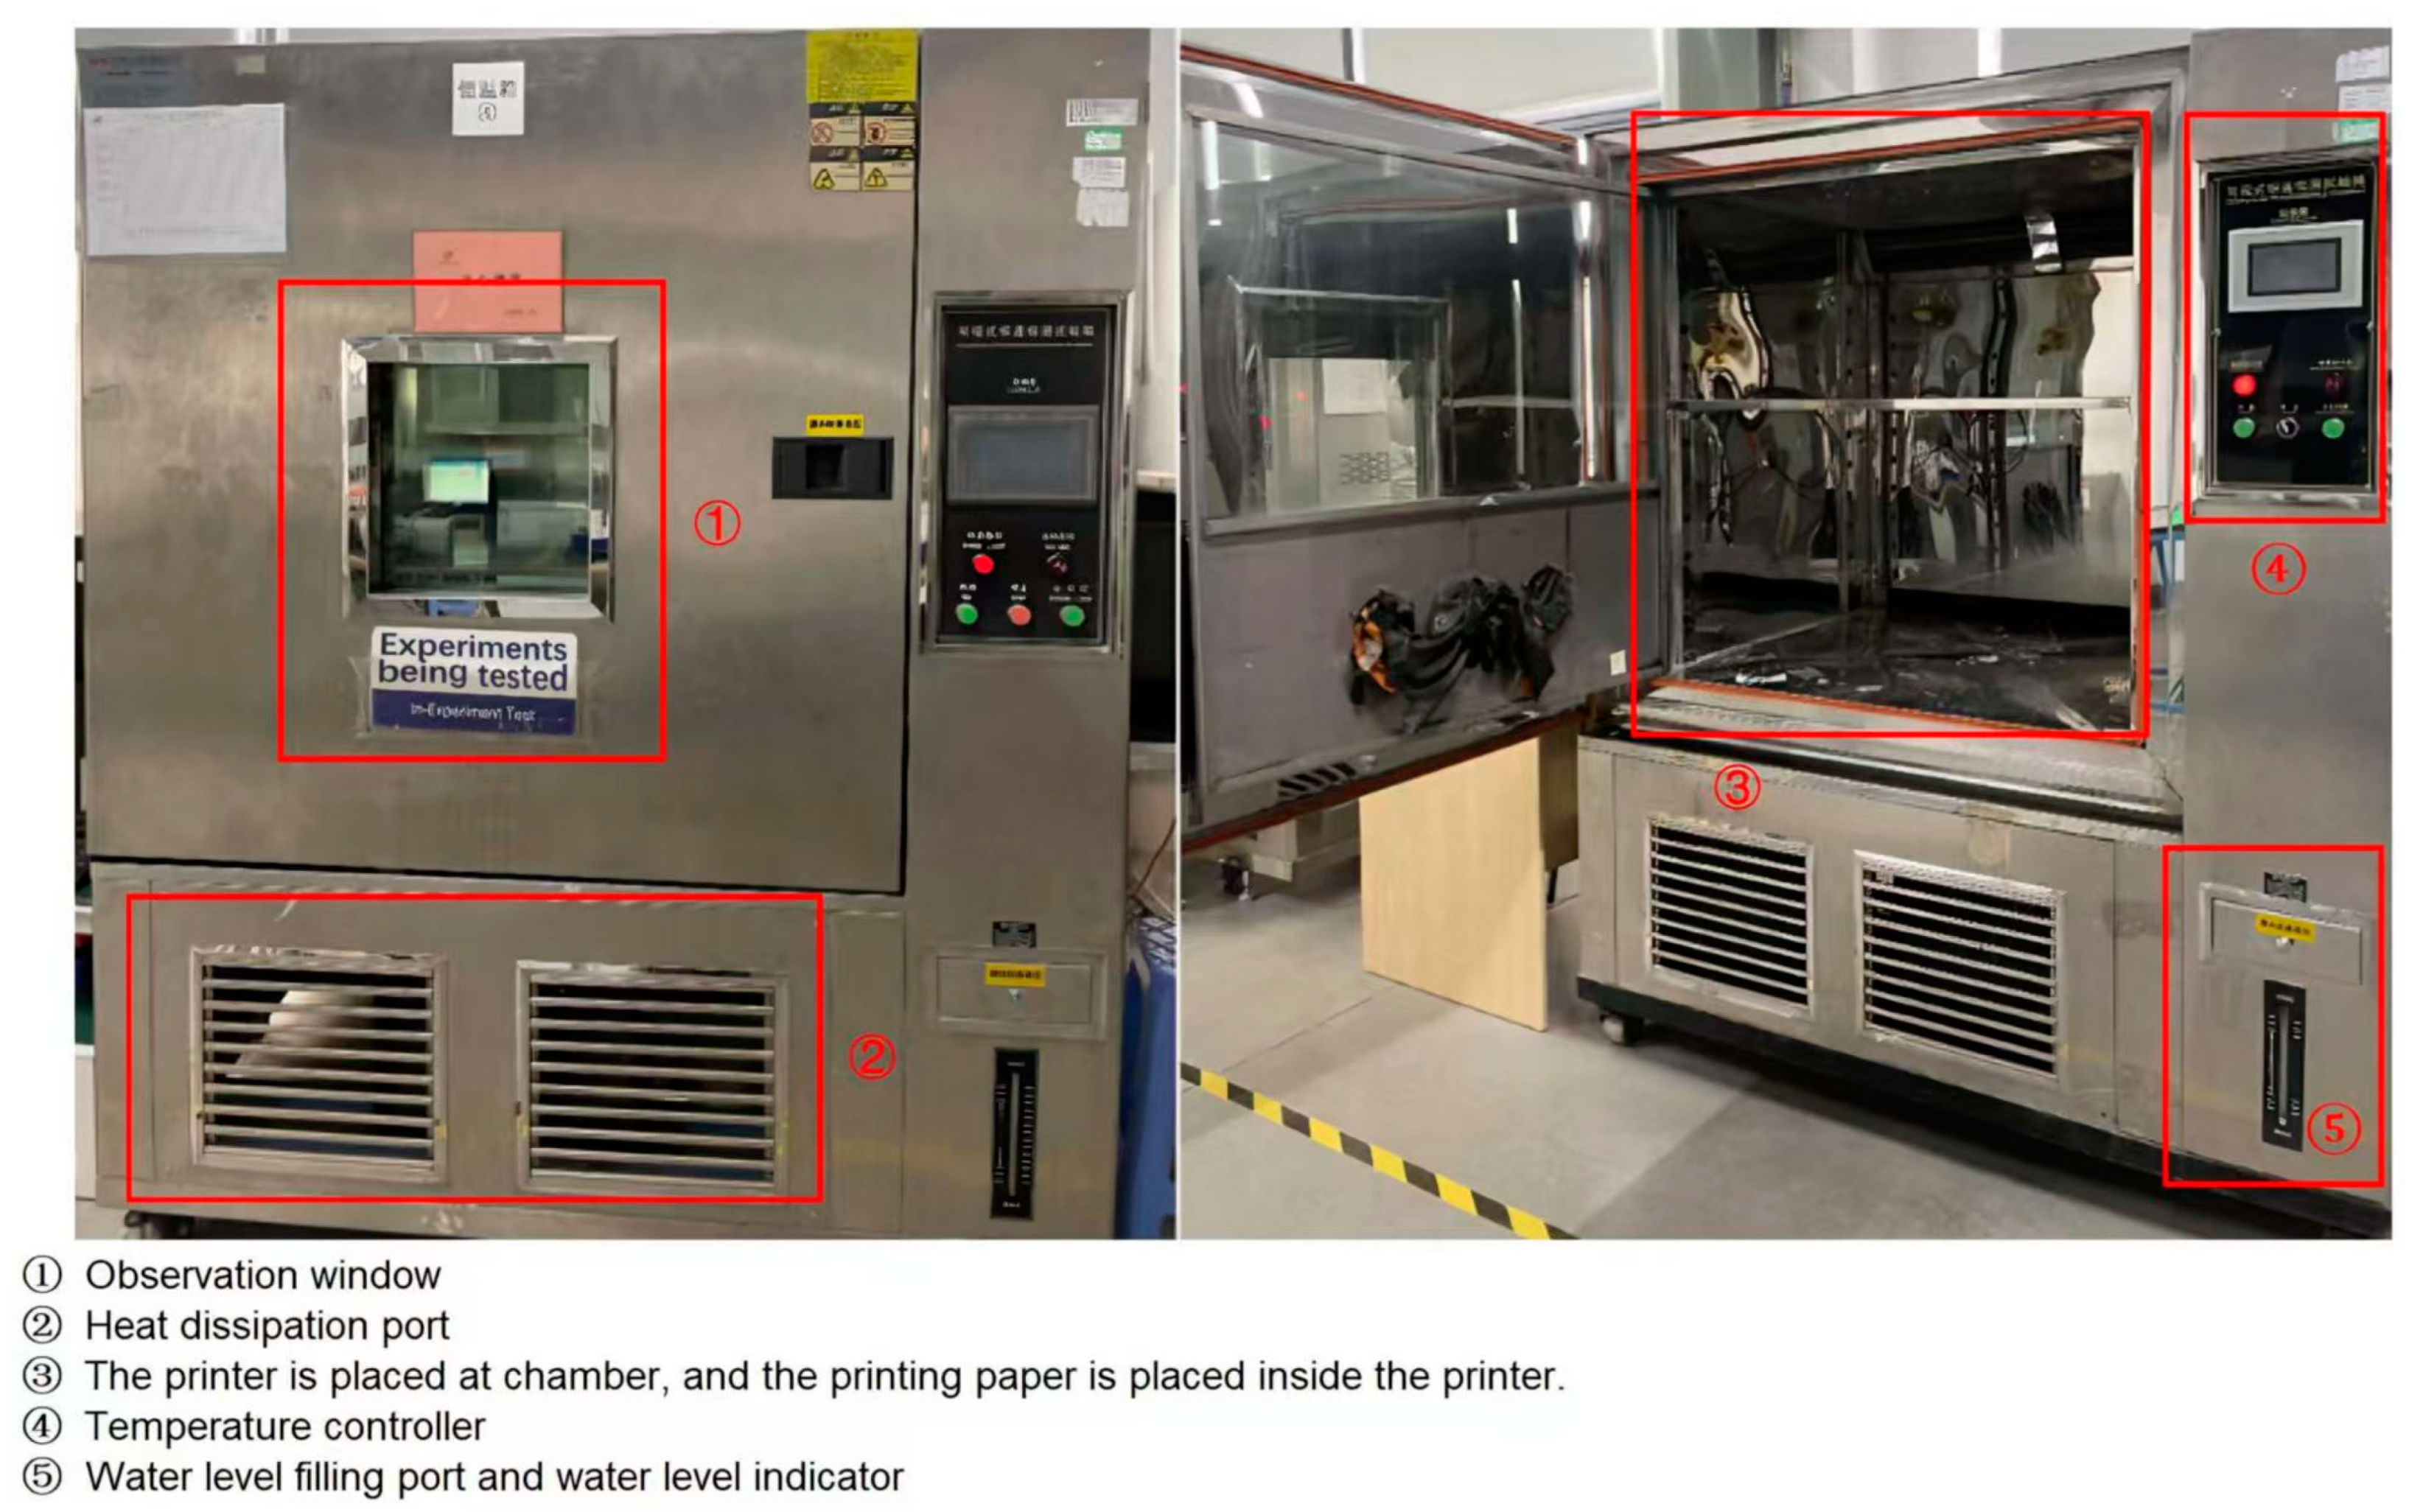
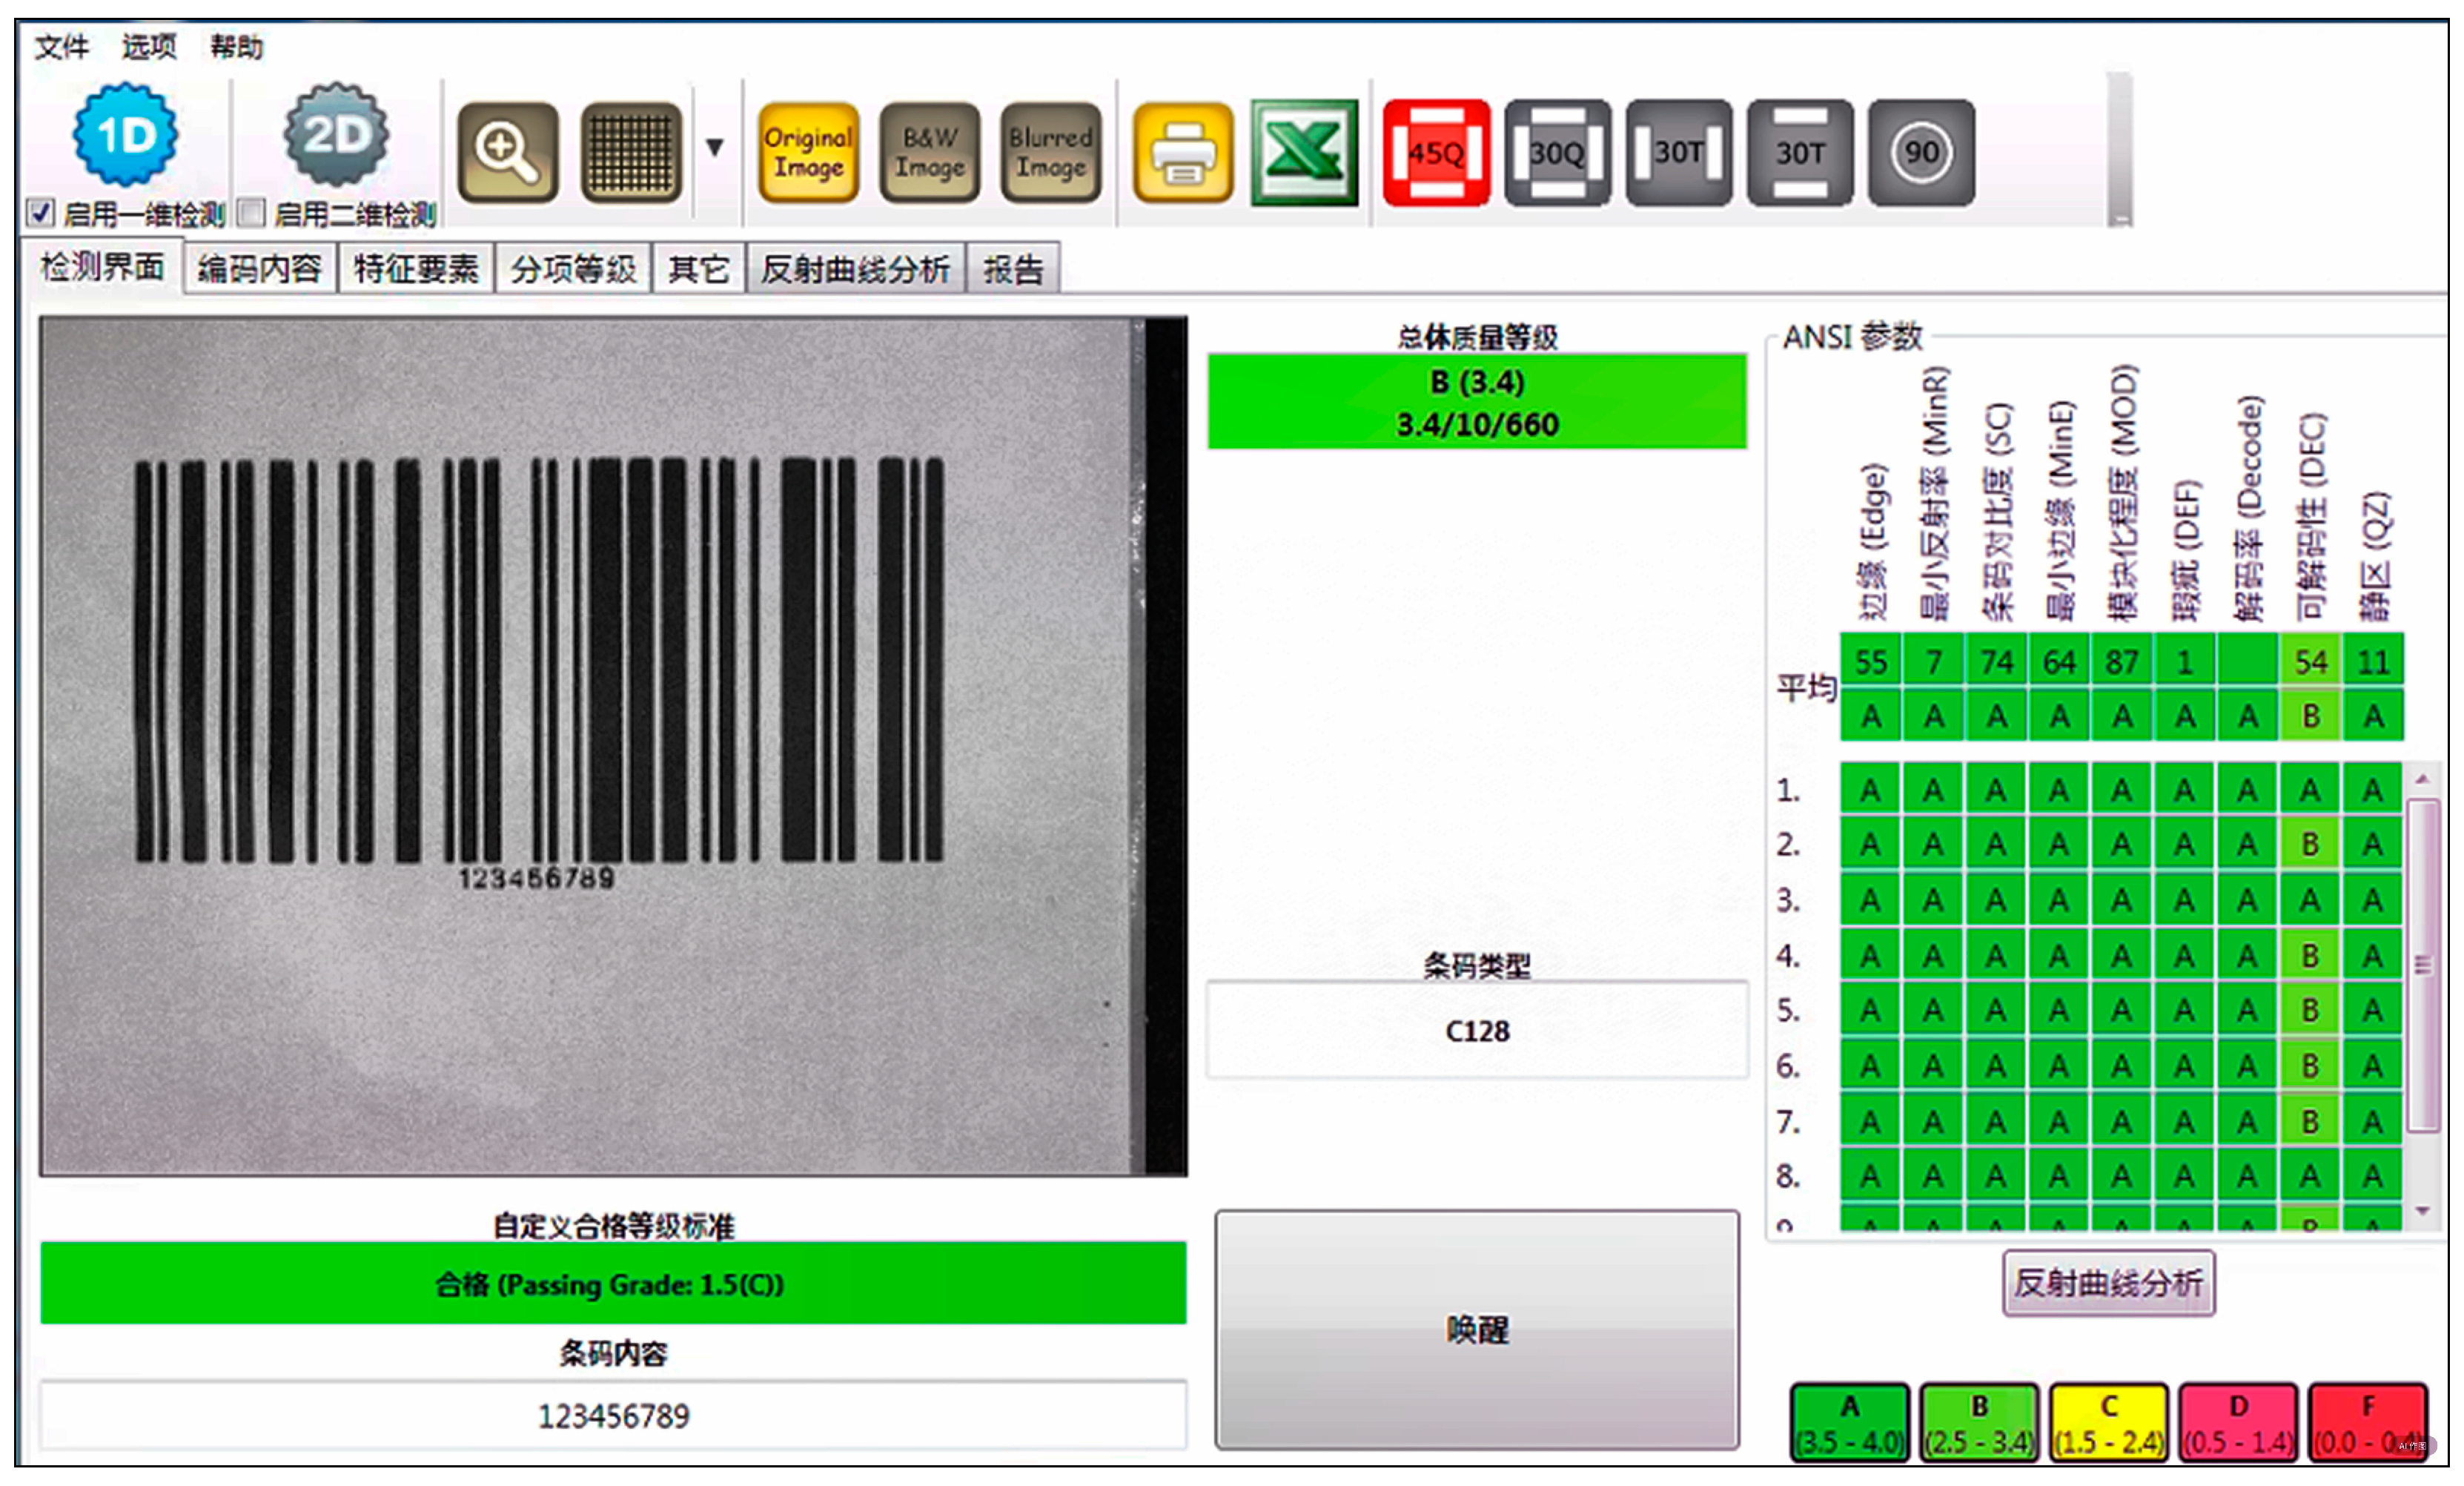
3.1. The Experimental Technique
3.2. Experimental Samples
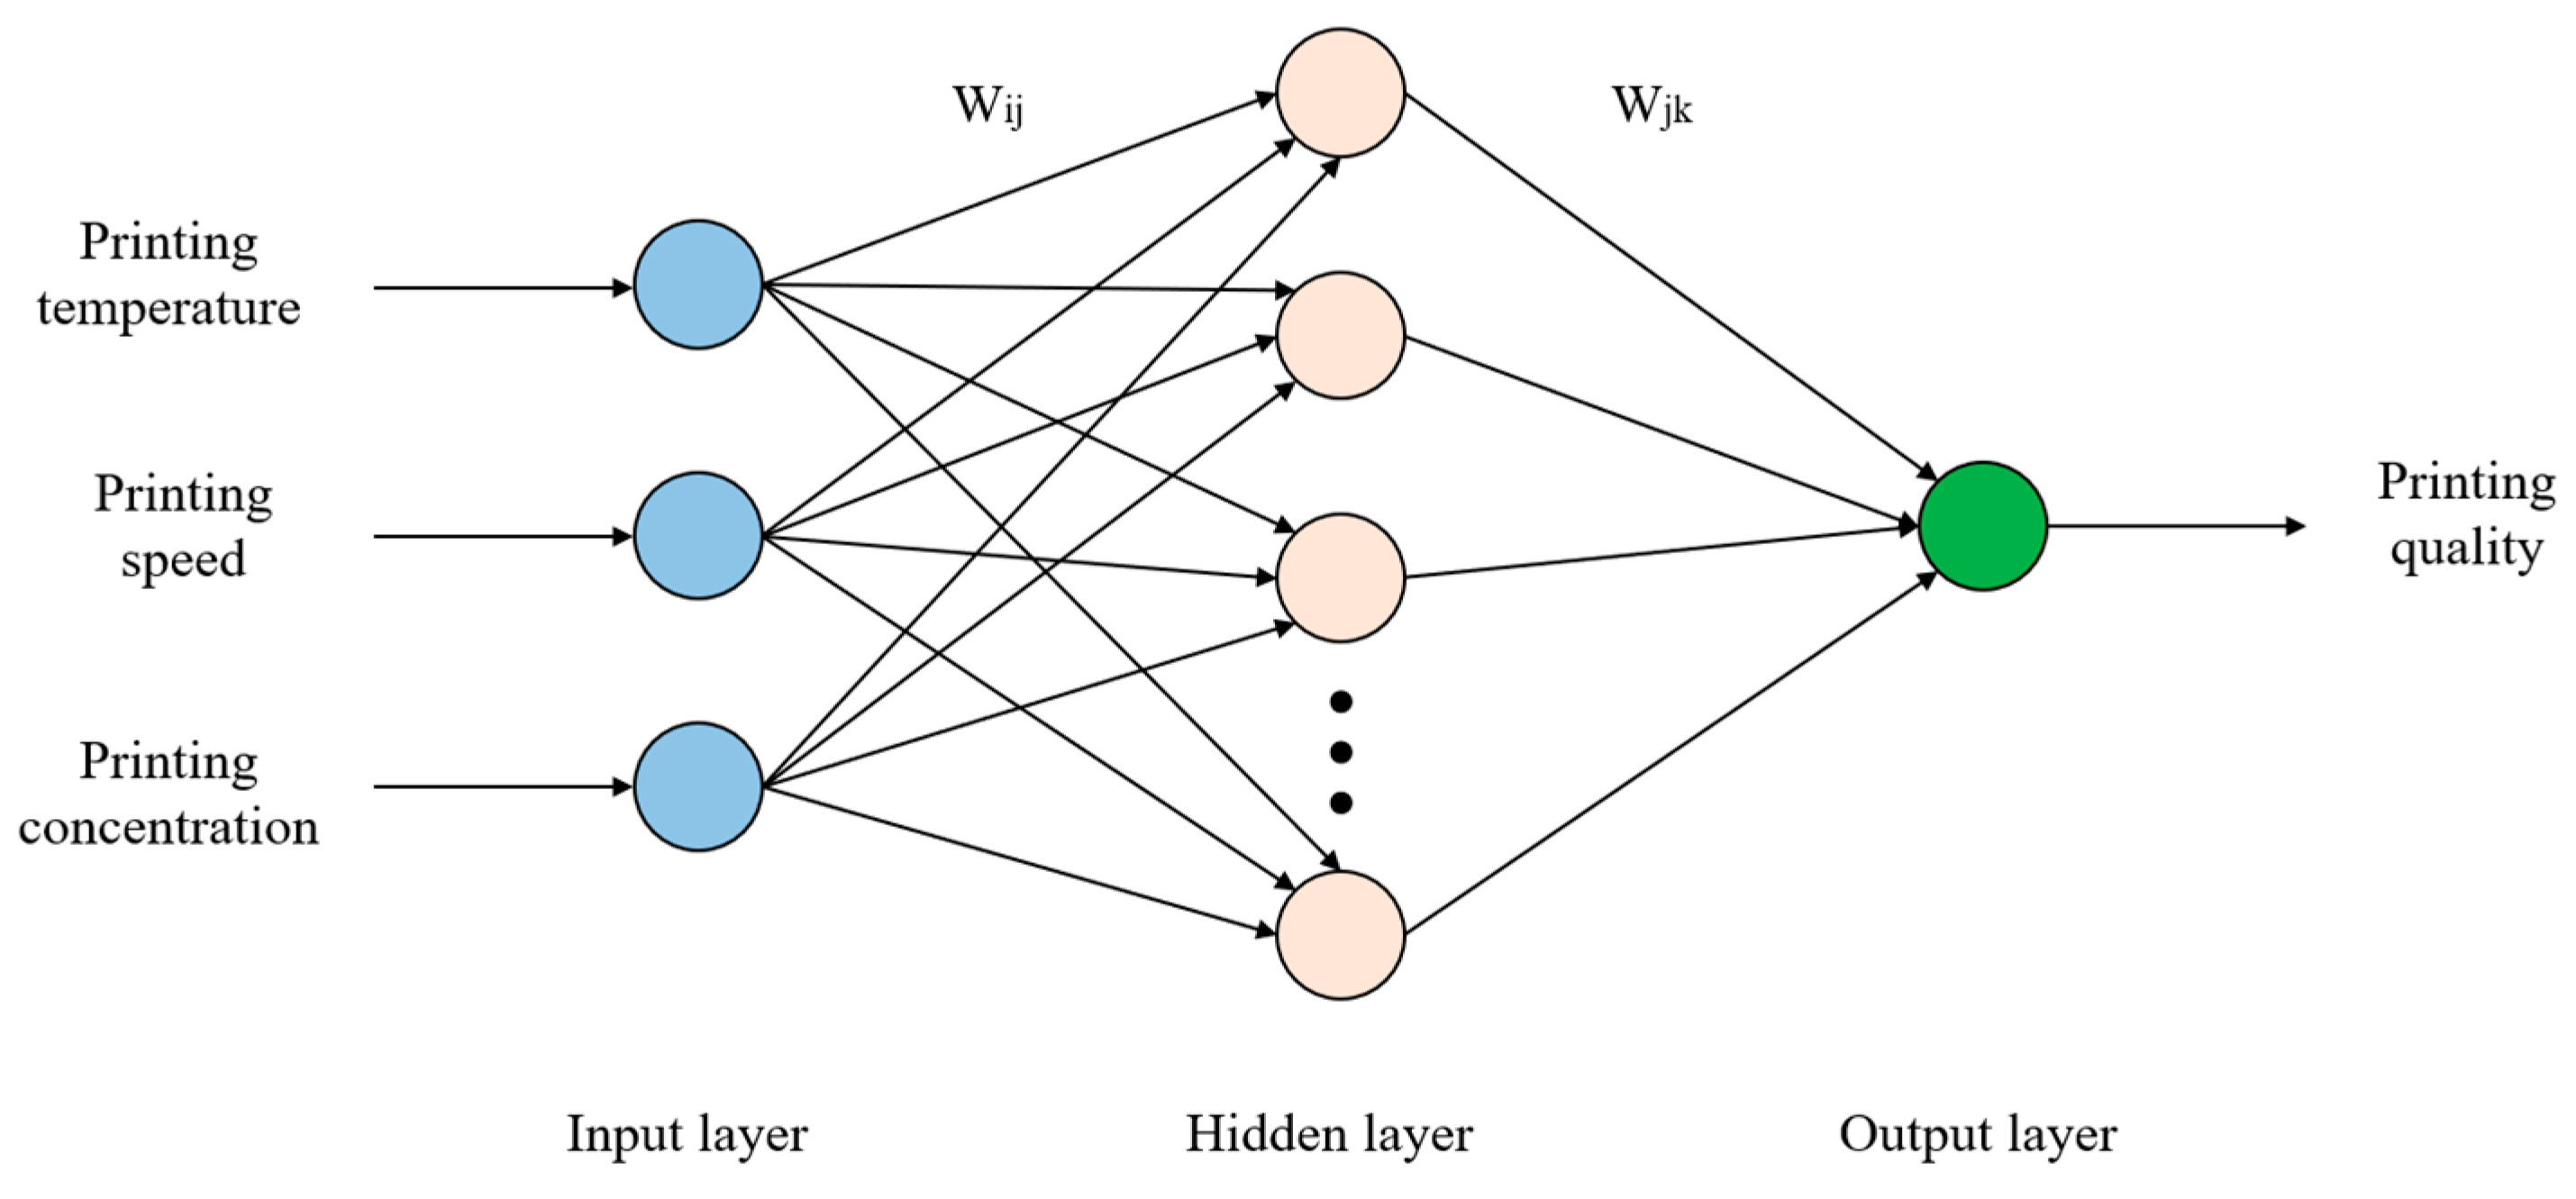
3.3. Modeling of the BP Neural Network
- (1)
- Data reading and preprocessing.
- (2)
- Conversion of data into a PyTorch tensor and creation of a data loader.
- (3)
- Definition and initialization of neural network models.
- (4)
- Specification of the loss function and optimizer.
- (5)
- Model training.
- (6)
- Model evaluation.
- (7)
- Prediction of new data and RMSE calculation.
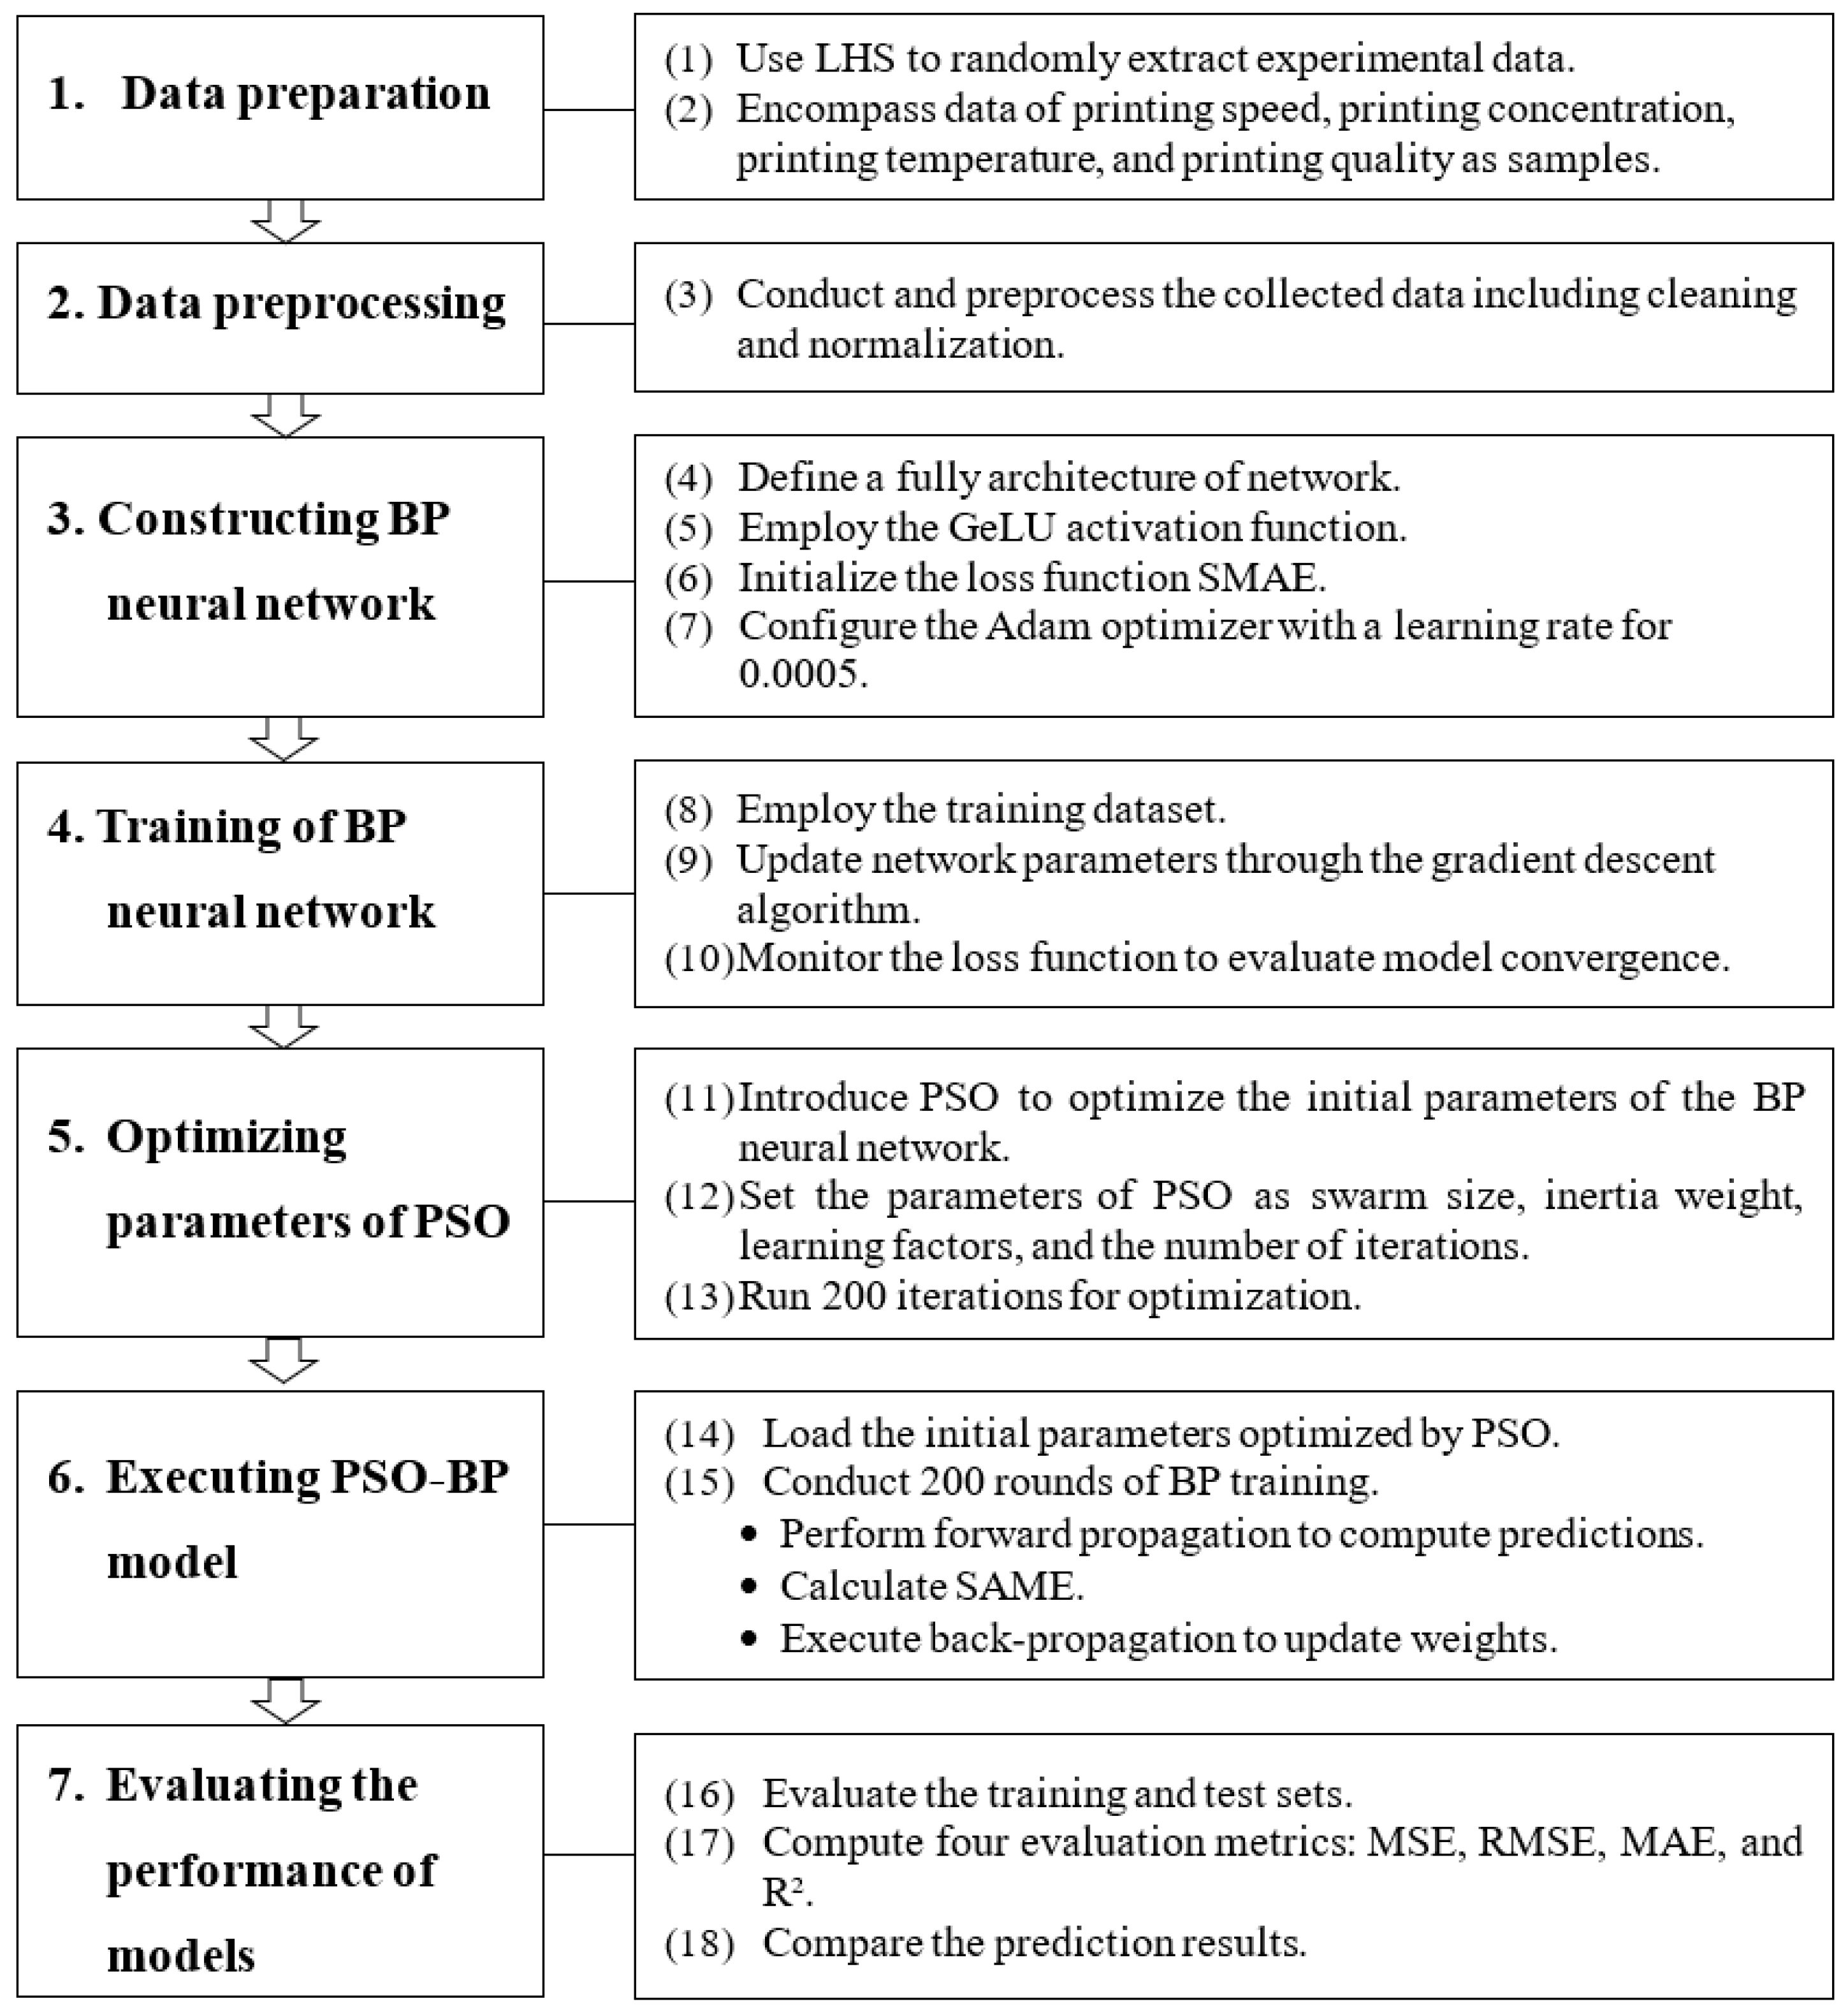
3.4. Optimization of the PSO-BP Model
- (1)
- Data preparation: Split the dataset into training and testing sets and normalize the samples.
- (2)
- Network architecture setup: Determine the number of layers and nodes in the hidden layers of the BP neural network.
- (3)
- PSO optimization of initial parameters: Use the MSE regression loss function as the fitness function for the PSO algorithm to iteratively update and obtain the initial weights and biases for the neurons in each layer of the BP neural network.
- (4)
- Training the BP neural network: Input the training set into the BP neural network for training while calculating the fitness value and historical best position for each particle.
- (5)
- Parameter updating and model output: Incorporate the parameters optimized by the PSO algorithm into the neural network, apply the gradient descent algorithm to update the network parameters, and ultimately produce the optimal network model.
4. Results
4.1. The Framework of the BP Neural Network
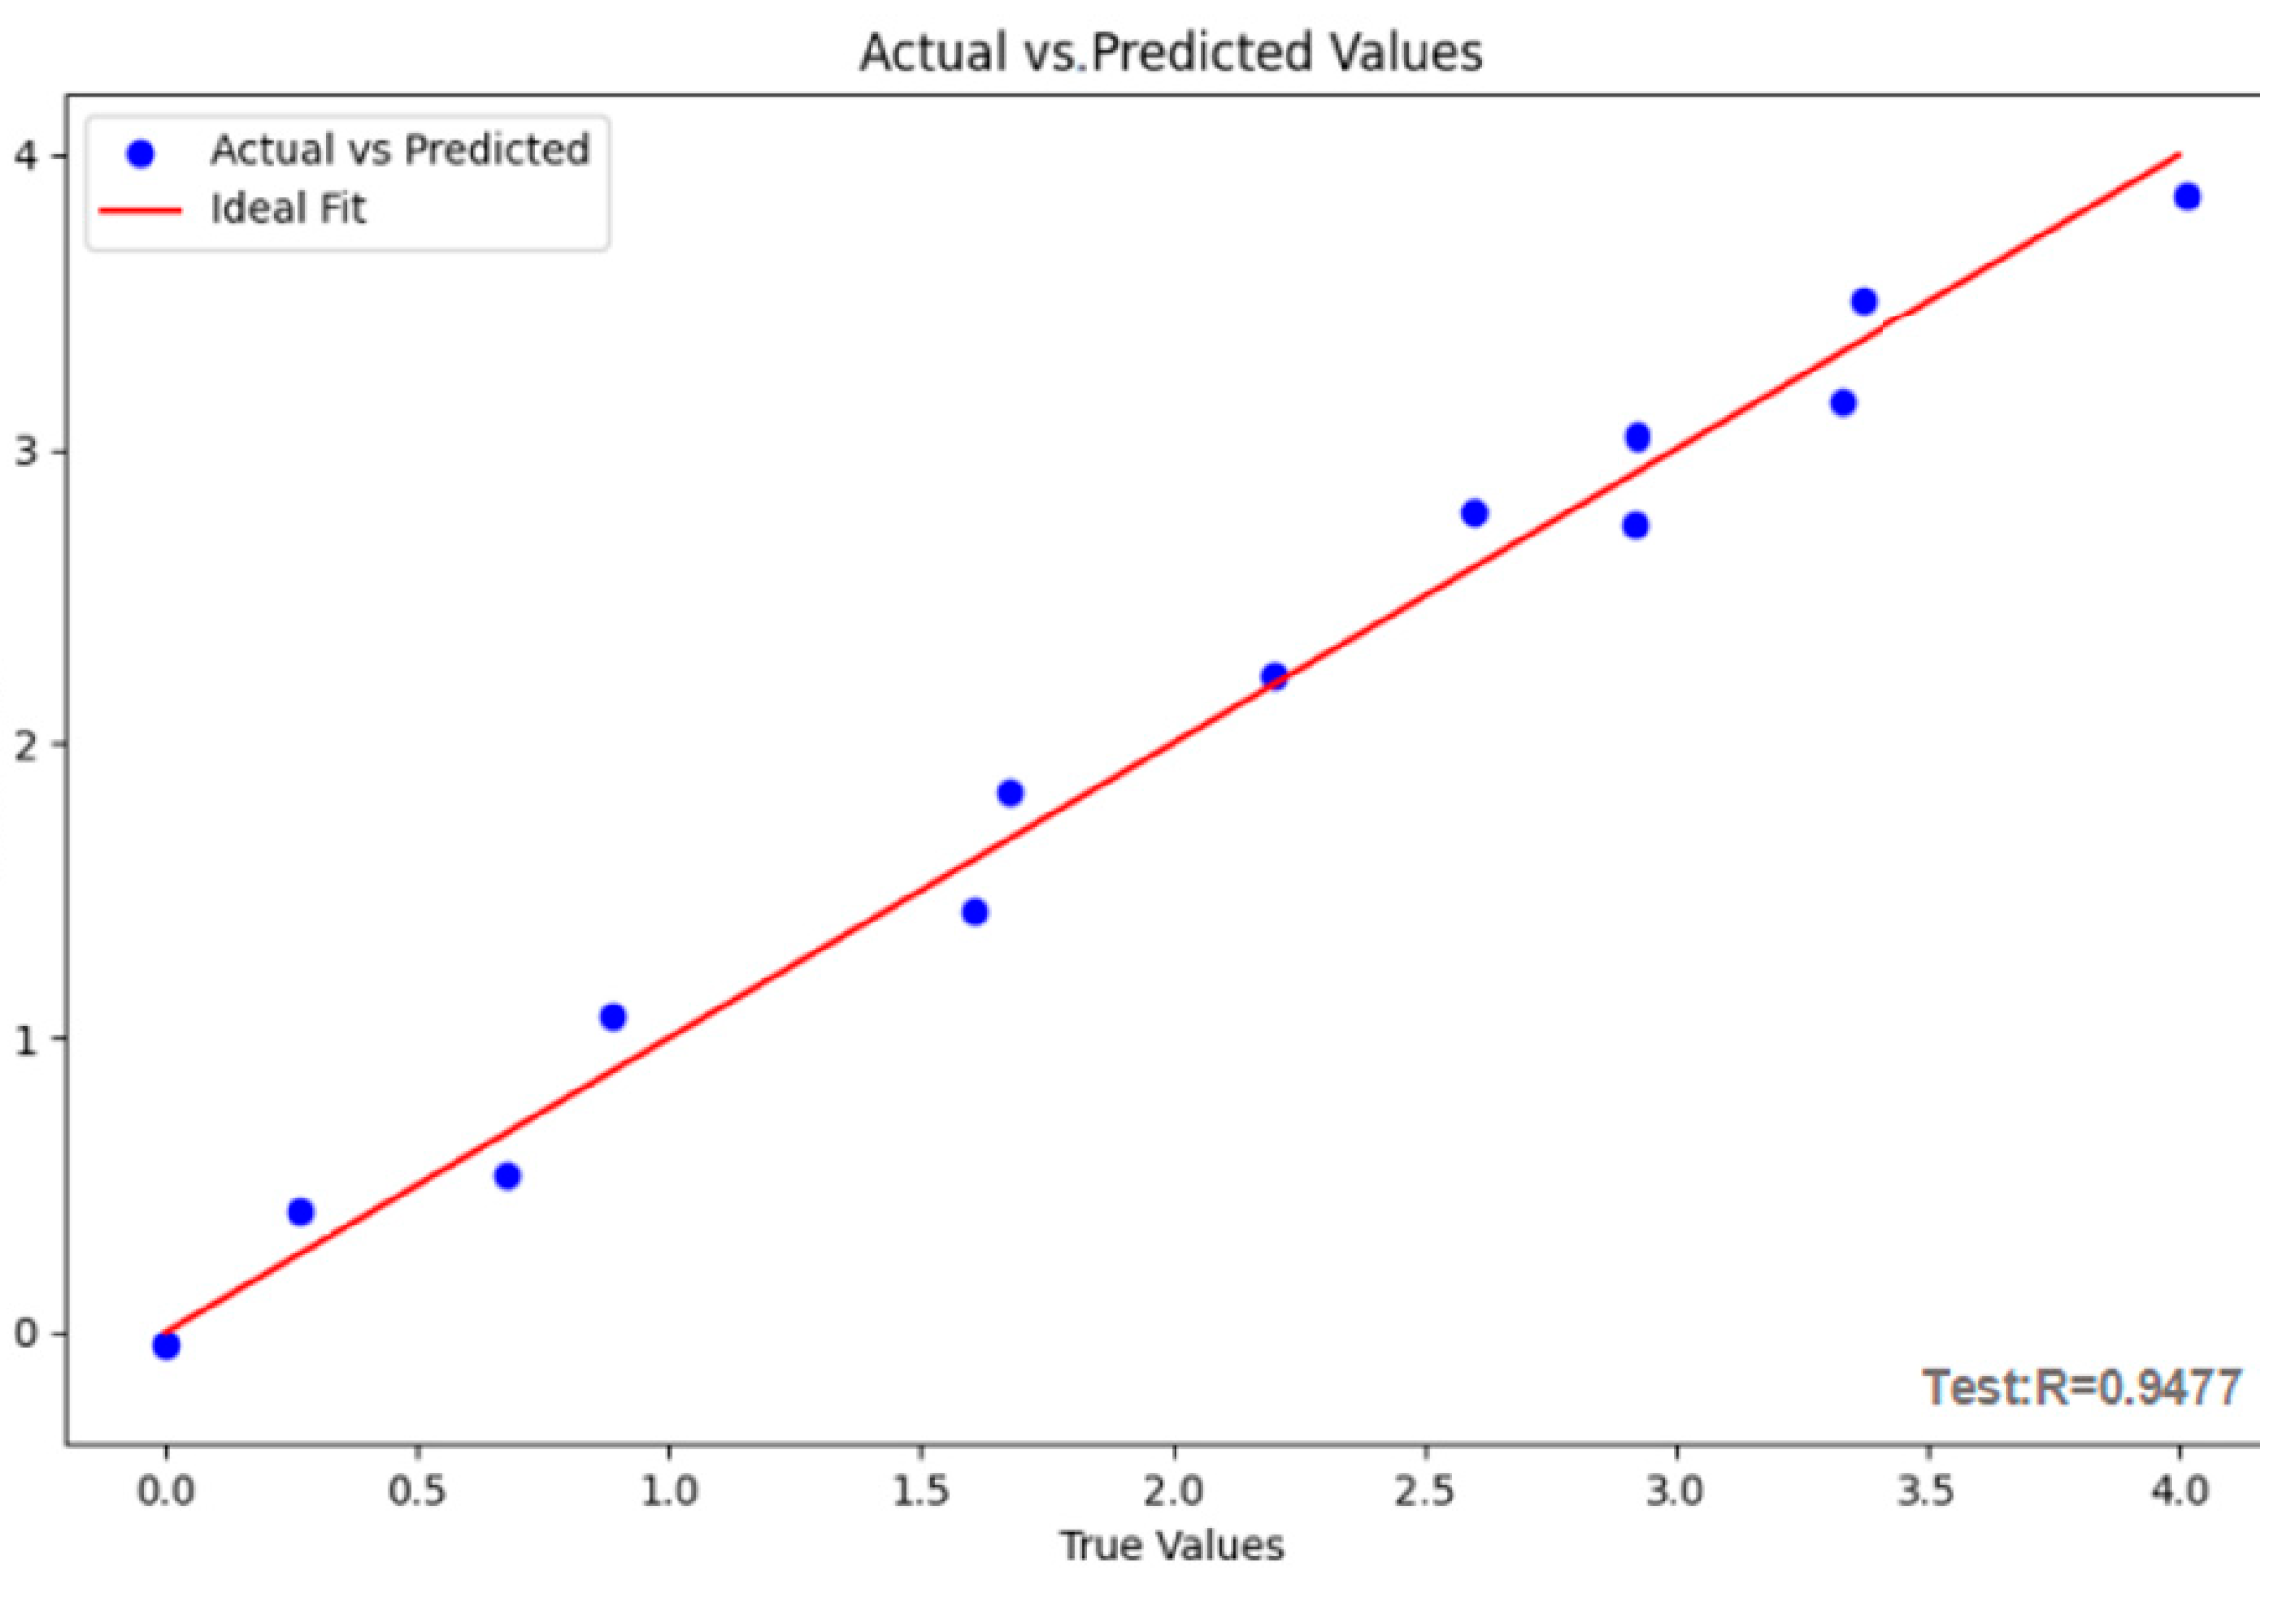
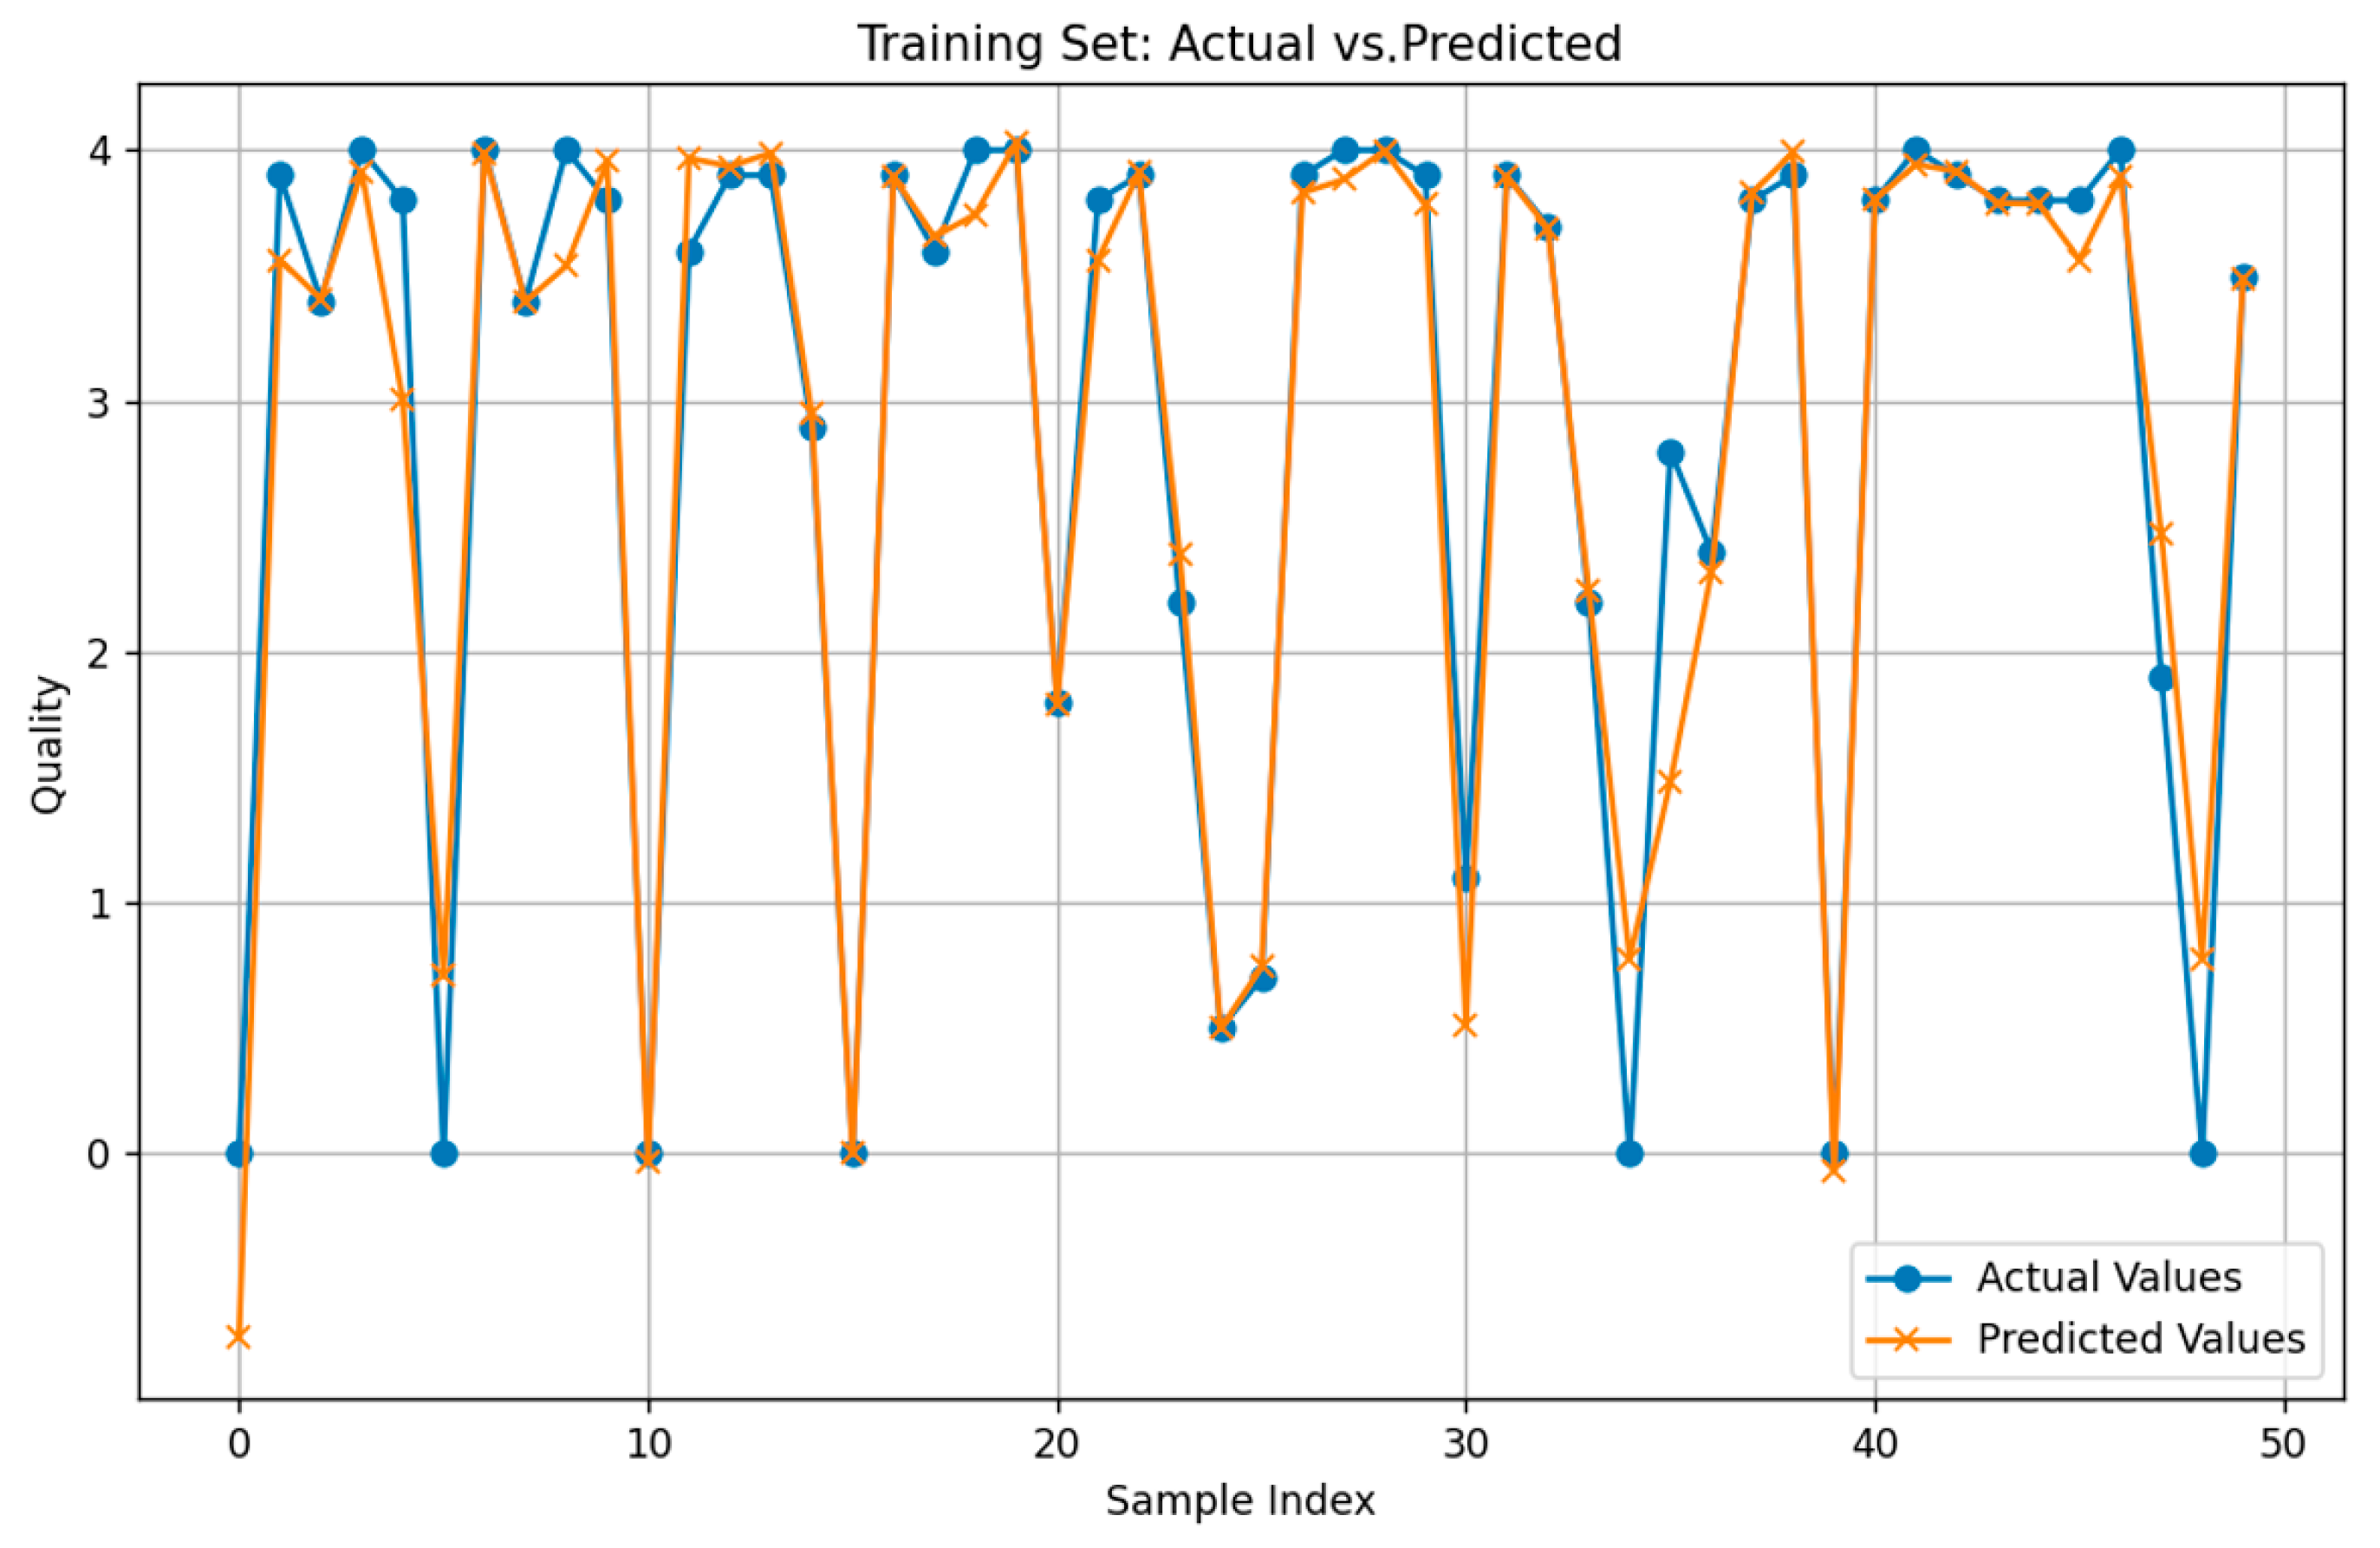
4.2. Training and Prediction of the PSO-BP Model
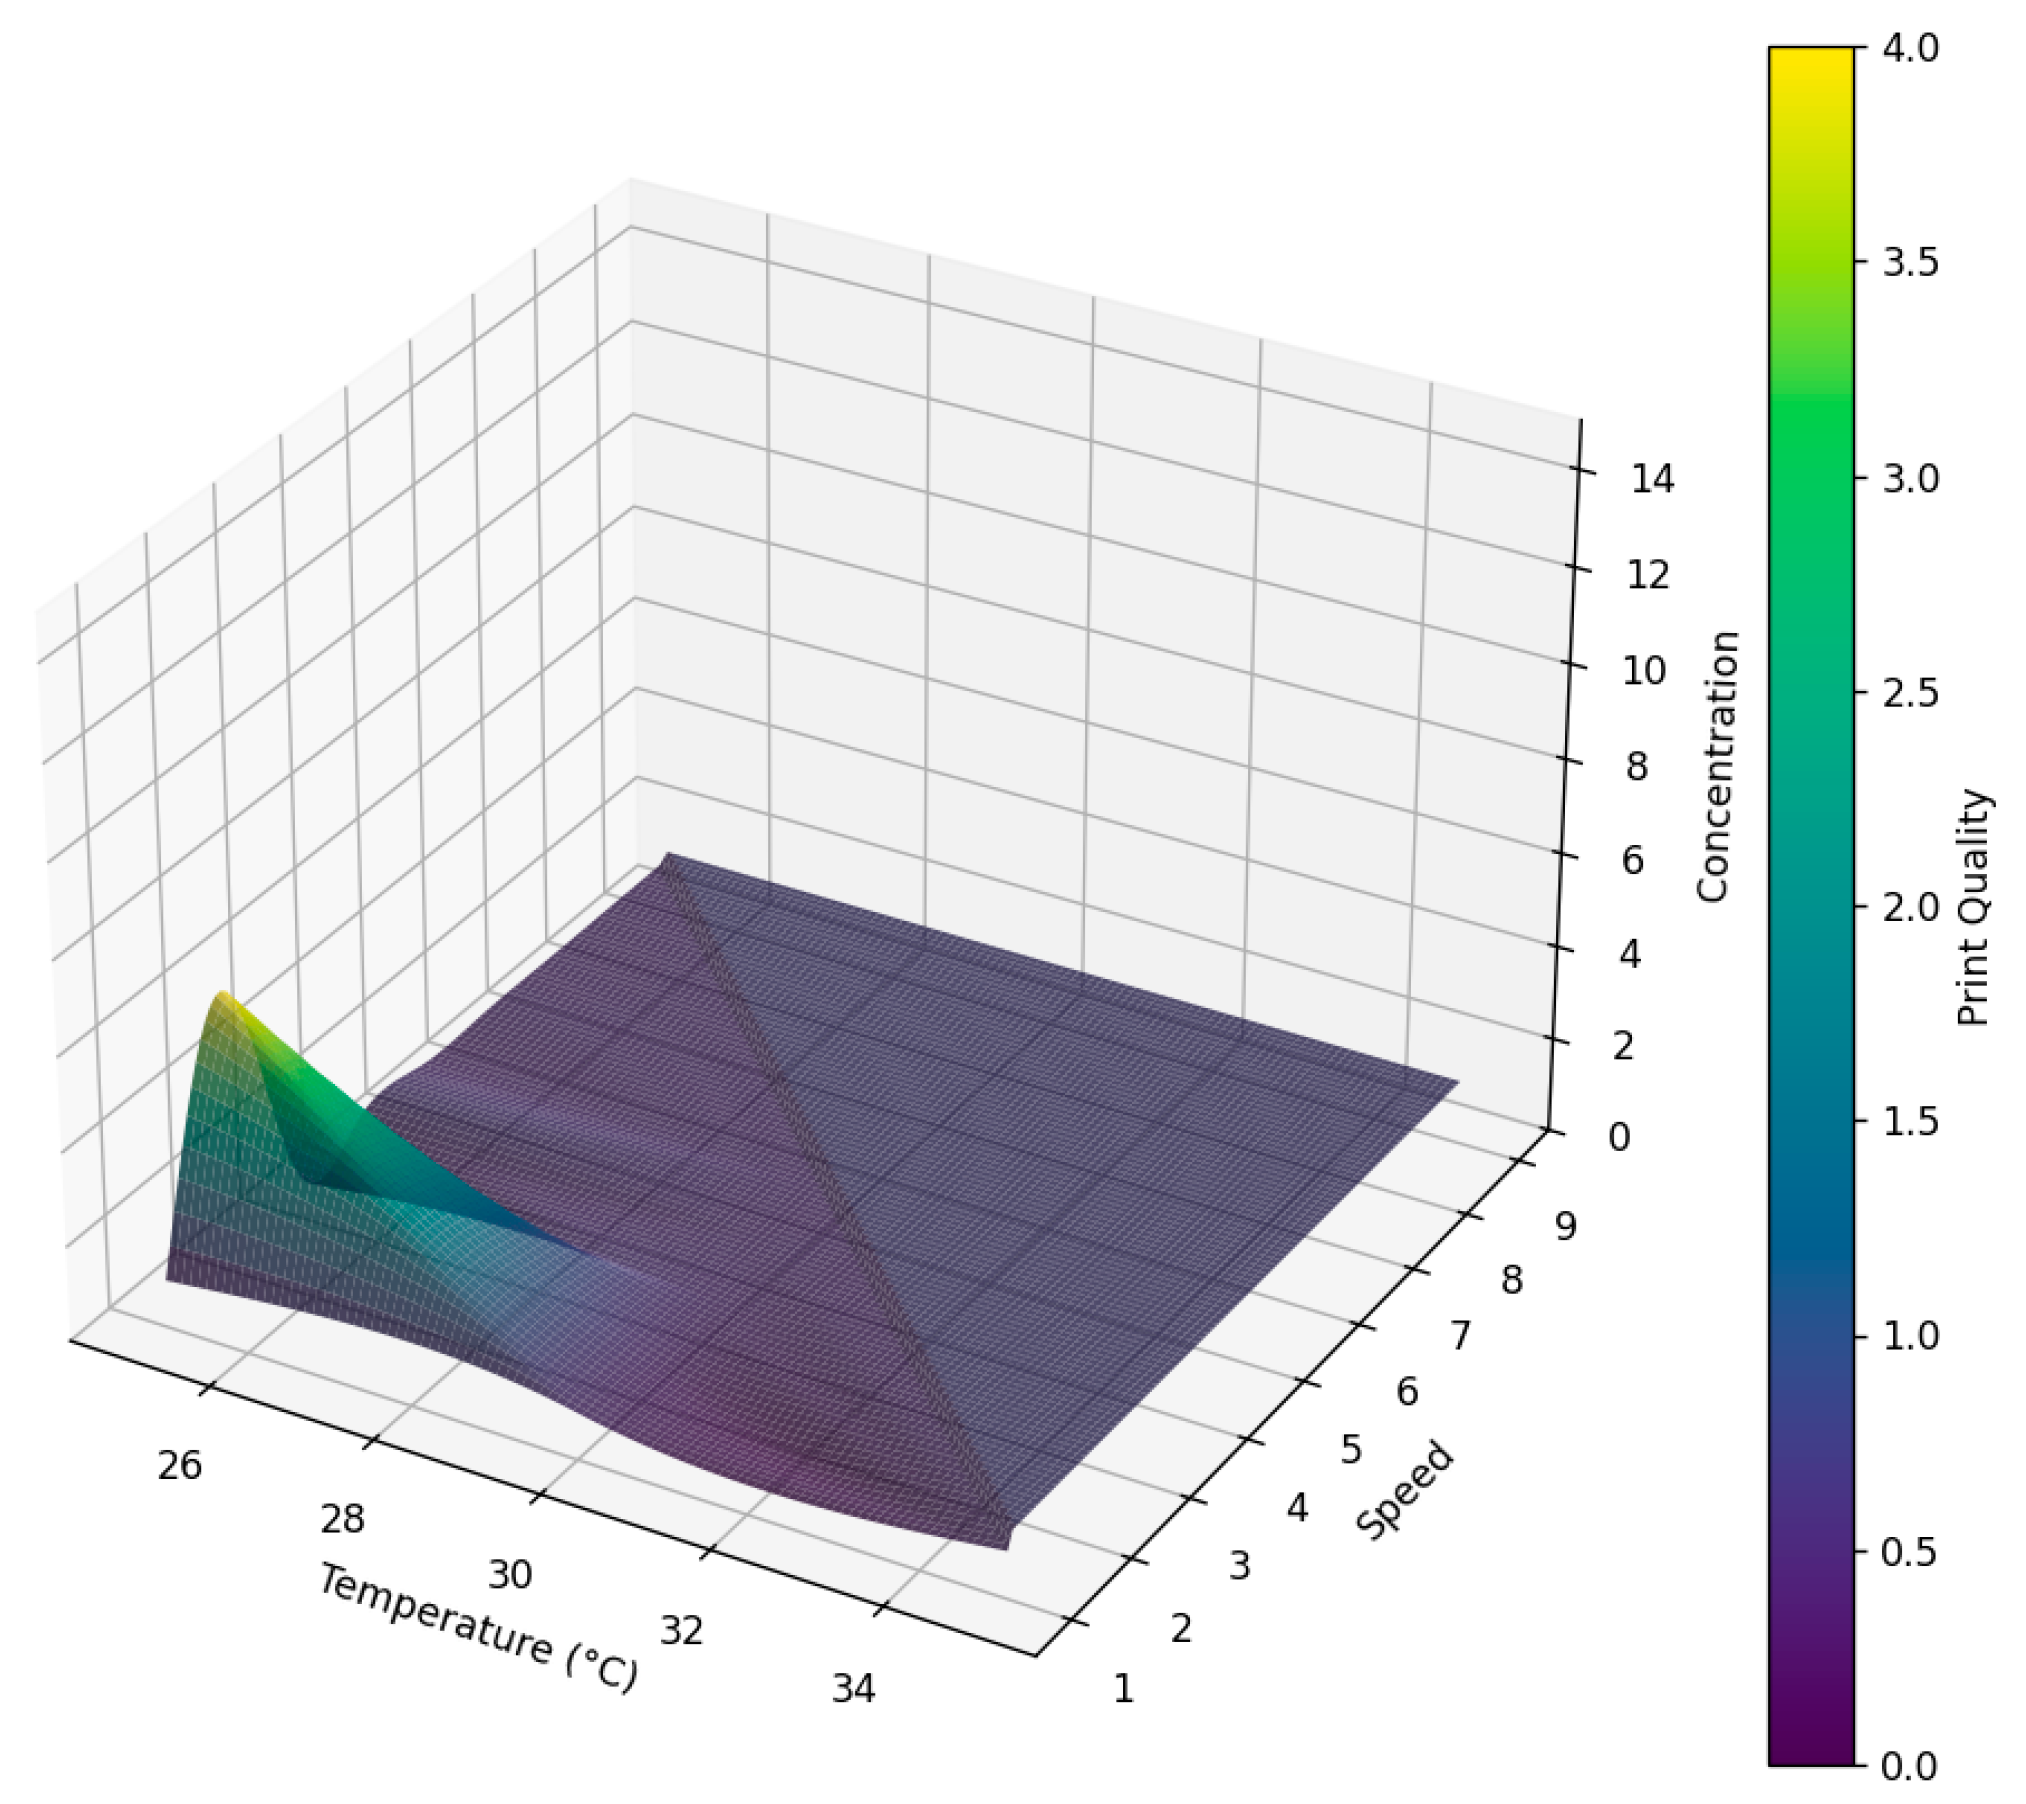
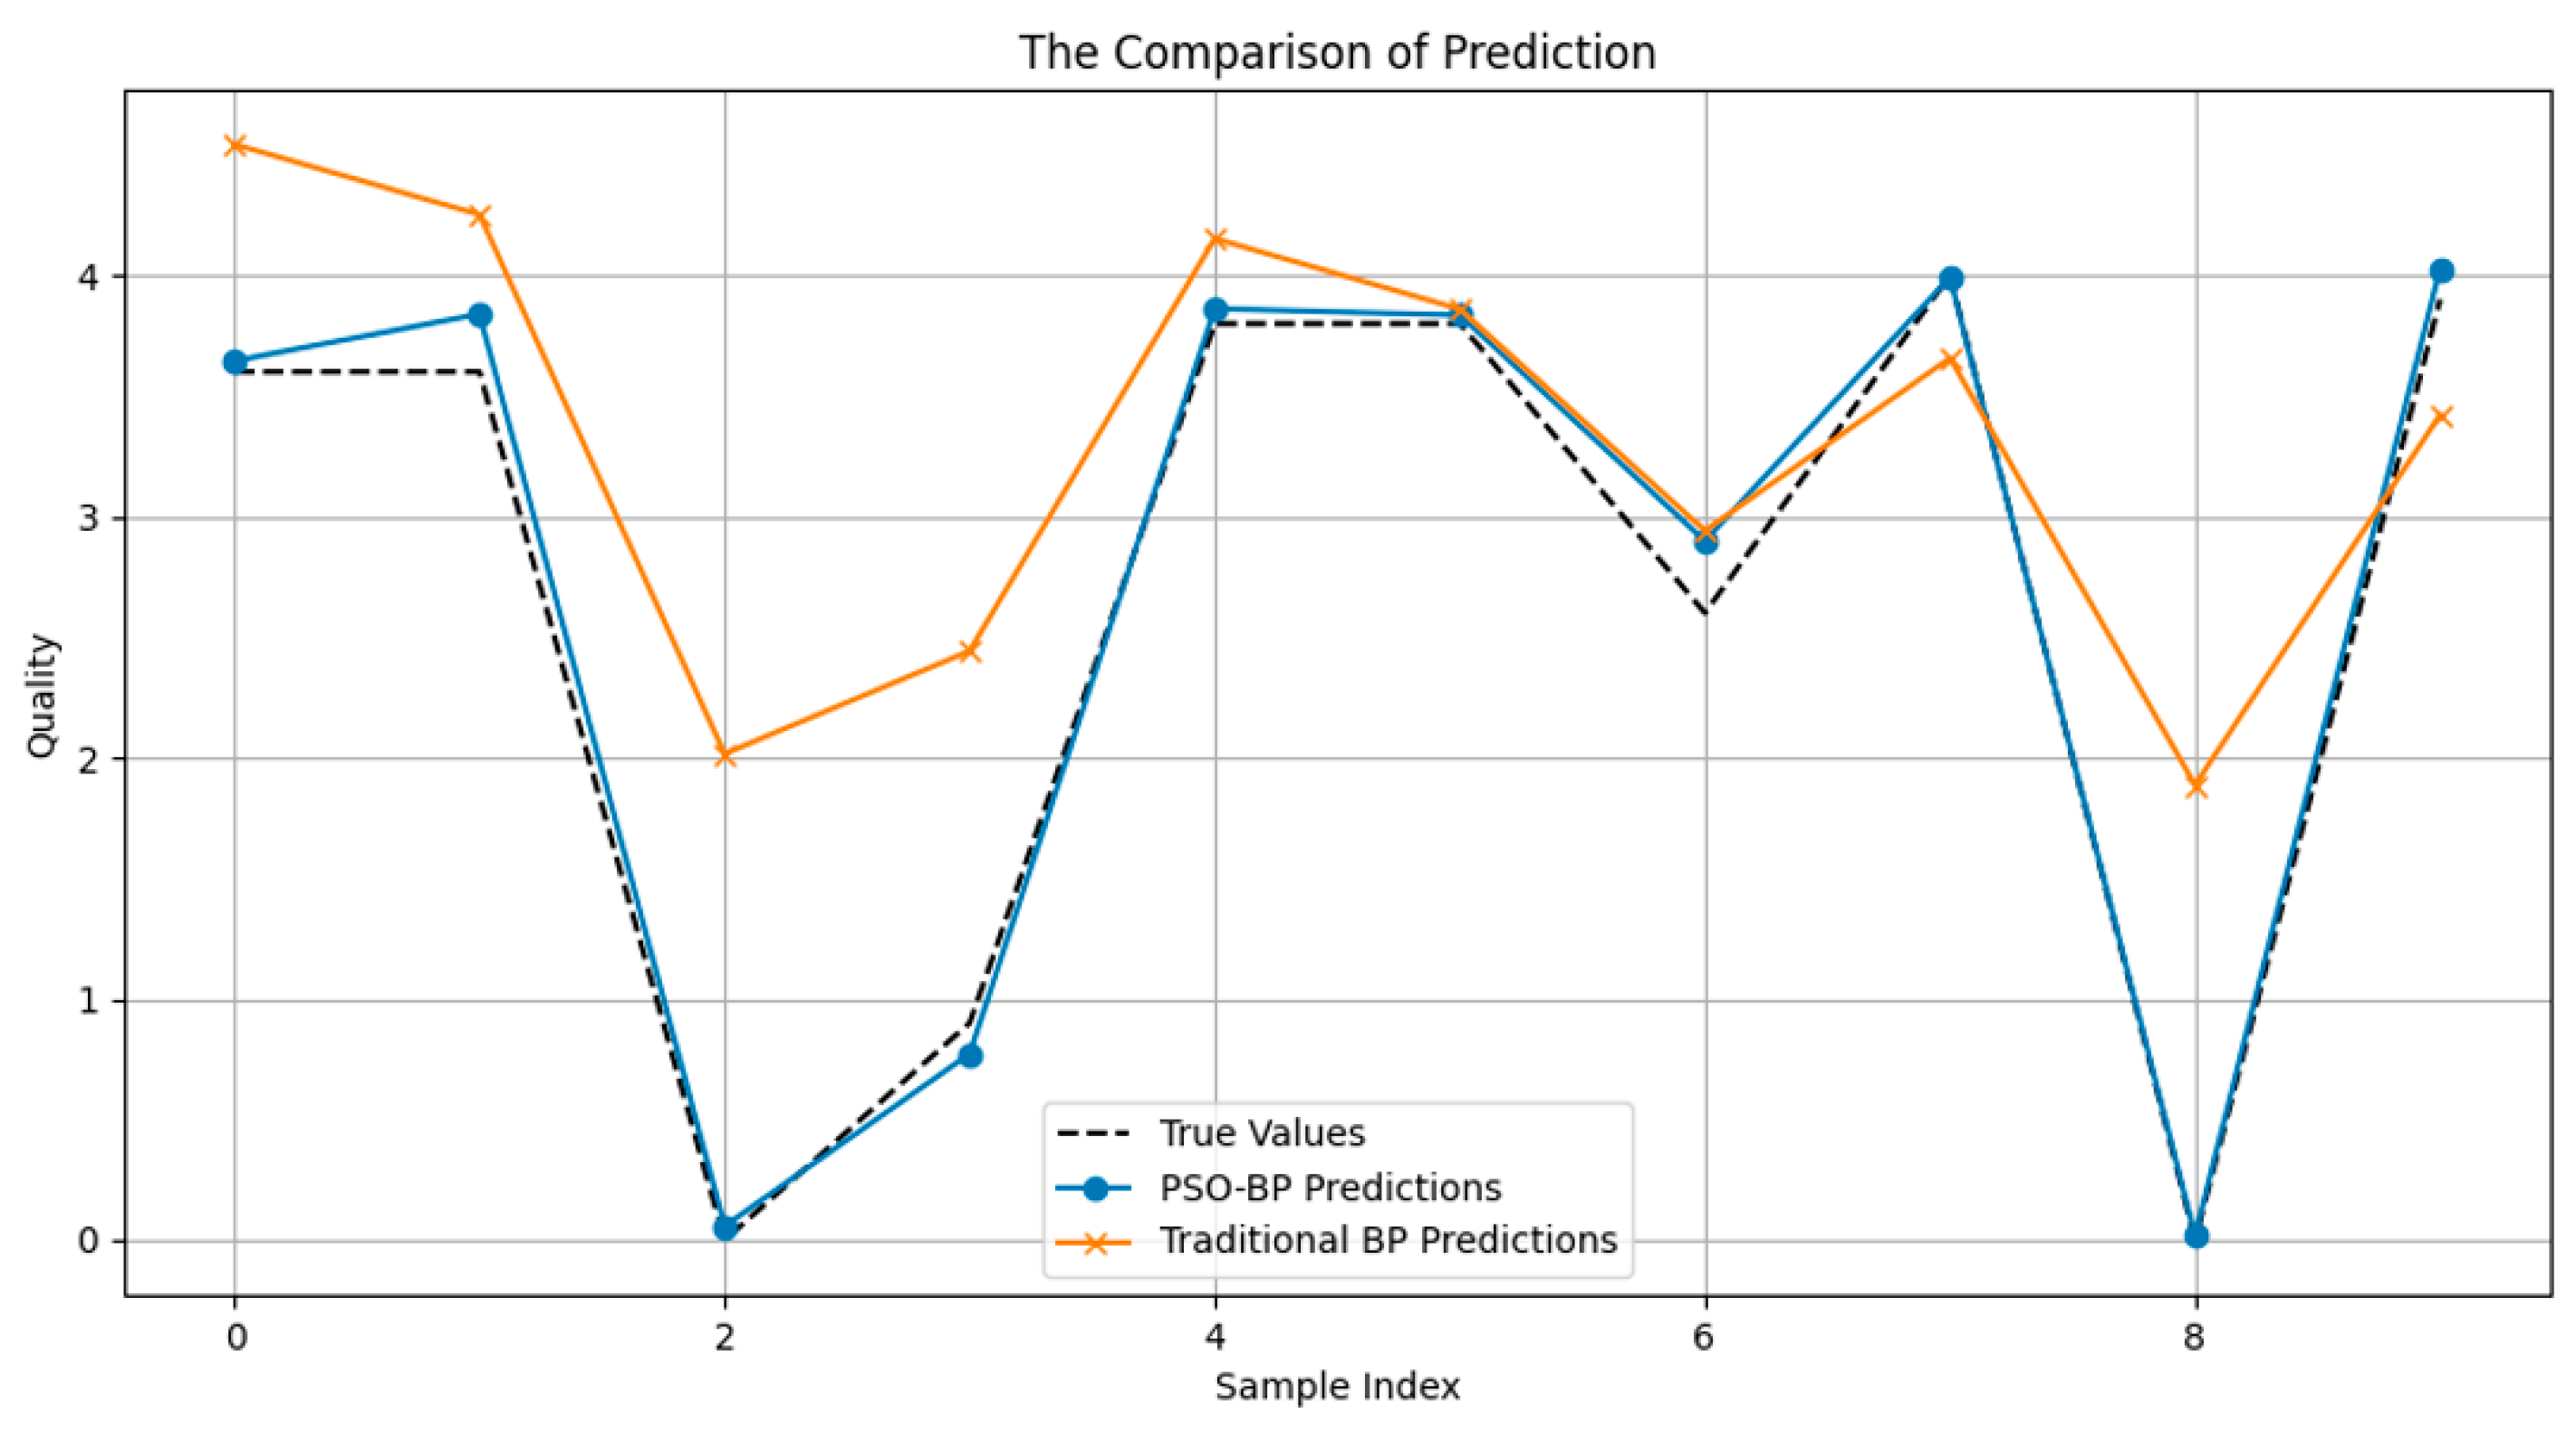
4.3. The Optimization of Models with Prediction
4.4. Summary
- (1)
- Rapid debugging and optimization settings.
- (2)
- Real-time observation and feedback.
- (3)
- Quality control and assessment.
- (4)
- Dynamic Parameter Optimization.
5. Conclusions
Author Contributions
Funding
Institutional Review Board Statement
Informed Consent Statement
Data Availability Statement
Conflicts of Interest
References
- Xu, J.; Ma, Y.; Han, Z.; Wang, Q.; Ma, T. Thermal design of printed circuit heat exchanger used for lead-bismuth fast reactor. Appl. Therm. Eng. 2023, 226, 120343. [Google Scholar] [CrossRef]
- Jiao, X.; Ren, G.; Law, C.L.; Li, L.; Cao, W.; Luo, Z.; Pan, L.; Duan, X.; Chen, J.; Liu, W. Novel strategy for optimizing of corn starch-based ink food 3D printing process: Printability prediction based on BP-ANN model. Int. J. Biol. Macromol. 2024, 276, 133921. [Google Scholar] [CrossRef] [PubMed]
- Bian, Y.; Zhong, Z.; Fu, C. Research of on-line printing quality detection based on mathematical morphology. Packag. J. 2013, 5, 35–39. [Google Scholar] [CrossRef]
- Sun, H.W.; Huang, Y.C.; Tang, T.H.; Shen, J.; Gu, L.J.; Wang, J.S. A prediction model for the replication quality of nanoimprinting patterns based on BP neural network. Microsyst. Technol. 2025. [Google Scholar] [CrossRef]
- Wei, X.J.; Zou, N.; Li, Z. PolyJet 3D printing: Predicting color by multilayer perceptron neural network. Ann. 3D Print. Med. 2022, 5, 100049. [Google Scholar] [CrossRef]
- Bao, Y.; Li, L.; Chen, J.; Weiwei Cao Liu, W.; Ren, G.; Luo, Z.; Pan, L.; Duan, X. Prediction of 3D printability and rheological properties of different pineapple gel formulations based on LF-NMR. Food Chem. X 2024, 24, 101906. [Google Scholar] [CrossRef] [PubMed]
- Jun, J. A train F-TR lock anti-lifting detection method based on improved BP neural network Journal of Measurements in Engineering. J. Meas. Eng. 2024, 12, 149–161. [Google Scholar]
- Miao, H.T.; Zhang, L.Z. The color characteristic model based on optimized BP neural network. In Advanced Graphic Communications, Packaging Technology and Materials; Springer: Singapore, 2016; Volume 369, pp. 55–63. [Google Scholar]
- Wu, X.; Wang, S. Prediction of ink flow for 3D bioprinting of tubular tissue based on a back propagation neural network. J. Comput. Methods Sci. Eng. 2023, 23, 3071–3080. [Google Scholar] [CrossRef]
- Li, Y.; Ding, F.; Tian, W. Optimization of 3D printing parameters on deformation by BP neural network algorithm. Metals 2022, 12, 1559. [Google Scholar] [CrossRef]
- Lin, Z.; Fan, Y.; Tan, J.; Li, Z.; Yang, P.; Wang, H.; Duan, W. Tool wear prediction based on XGBoost feature selection combined with PSO-BP network. Sci. Rep. 2025, 15, 3096. [Google Scholar] [CrossRef]
- Liu, Y.; Fan, L.; Wang, L. Urban virtual environment landscape design and system based on PSO-BP neural network. Sci. Rep. 2024, 14, 13747. [Google Scholar] [CrossRef] [PubMed]
- Liu, L.; Yang, D.; Chen, R.J.; Li, K.; Zhou, X. Research on quality prediction of POI based on KPCA-GA-BP neural network. J. Telecommun. Sci. 2023, 39, 108–116. [Google Scholar]
- Wei, H.; Tang, L.; Qin, H.; Wang, H.; Chen, C.; Li, Y.; Wang, C. Optimizing FDM 3D printing parameters for improved tensile strength using the Takagi–Sugeno fuzzy neural network. Mater. Today Commun. 2024, 38, 108268. [Google Scholar] [CrossRef]
- Mahmood, M.A.; Visan, A.I.; Ristoscu, C.; Mihailescu, I.N. Artificial neural network algorithms for 3D printing. Materials 2020, 14, 163. [Google Scholar] [CrossRef]
- Janmanee, P.; Ratchapakdee, P. Comparison of artificial neural network and response surface methodology in predicting the tensile strength and optimization of 3D printed objects. Eng. Appl. Sci. Res. 2024, 51, 704–715. [Google Scholar]
- Djurović, S.; Lazarević, D.; Ćirković, B.; Mišić, M.; Ivković, M.; Stojčetović, B.; Petković, M.; Ašonja, A. Modeling and prediction of surface roughness in hybrid manufacturing–milling after FDM using artificial neural networks. Appl. Sci. 2024, 14, 5980. [Google Scholar] [CrossRef]
- Bauer, M.; Augenstein, C.; Schäfer, M.; Theile, O. Artificial Intelligence in Laser Powder Bed Fusion Procedures–Neural Networks for Live-Detection and Forecasting of Printing Failures. Procedia CIRP 2022, 107, 1367–1372. [Google Scholar] [CrossRef]
- Phillip, L. Predicting the Failure of a Thermal Print-Head Resistor. Ph.D. Thesis, University of Portsmouth, Portsmouth, UK, 2019. [Google Scholar]
- Rafieyan, S.; Ansari, E.; Vasheghani-Farahani, E. A practical machine learning approach for predicting the quality of 3D (bio)printed scaffolds. Biofabrication 2024, 16, 045014. [Google Scholar] [CrossRef]
- Olowe, M.; Ogunsanya, M.; Best; Hanif, Y.; Bajaj, S.; Vakkalagadda, V.; Fatoki, O.; Desai, S. Spectral features analysis for print quality prediction in additive manufacturing: An acoustics-based approach. Sensors 2024, 24, 4864. [Google Scholar] [CrossRef]
- Liu, B.; Chen, Y.; Xie, J.; Chen, B. Industrial printing image defect detection using multi-edge feature fusion algorithm. Complexity 2021, 2021, 036466. [Google Scholar] [CrossRef]
- Bai, W.G.; Qiu, C.L.; Zhang, J. Research on evaluation and detection method of print quality based on the CCD information. Appl. Mech. Mater. 2013, 303–306, 543–549. [Google Scholar] [CrossRef]
- Karina, Z.; Hoeppener, S. Schubert, Inkjet printing and 3D printing strategies for biosensing, analytical, and diagnostic applications. Adv. Mater. 2022, 34, 2105015. [Google Scholar]
- Nguyen, Q.T.; Mai, A.; Chagas, L.; Nadège, R.B. Microscopic printing analysis and application for classification of source printer. Comput. Secur. 2021, 108, 102320. [Google Scholar] [CrossRef]
- Ratnavel, R.; Viswanath, S.; Subramanian, J.; Selvaraj, V.K.; Prahasam, V.; Siddharth, S. Predicting the optimal input parameters for the desired print quality using machine learning. Micromachines 2022, 13, 2231. [Google Scholar] [CrossRef] [PubMed]
- Qin, Y.; Kang, R.; Sun, J.S. A fast self-calibration method of line laser sensors for on-machine measurement of honeycomb cores. Opt. Lasers Eng. 2022, 152, 106981. [Google Scholar] [CrossRef]
- Jie, L.; Cai, Z.Q.; Yao, B. Error compensation and accuracy analysis of laser measurement system based on laser-beam calibration. Optik 2020, 200, 163272. [Google Scholar]
- Yang, L.X.; Zhou, W.M. Study on precision of PS/ABS composite powders formed parts based on selective laser sintering. China Plast. Ind. 2017, 45, 35–38. [Google Scholar]
- Bo, F.X.; He, B.; Zong, X.M. Experimental study on selective laser sintering of coated sand. Laser Optoelectron. Prog. 2017, 54, 247–253. [Google Scholar]
- Brion, D.A.J.; Pattinson, S.W. Quantitative and real-time control of 3D printing material flow through deep learning. Adv. Intell. Syst. 2022, 4, 2200153. [Google Scholar] [CrossRef]


| Level of Numeric Symbol | Grade of Letter |
|---|---|
| [3.5–4.0) | A |
| [2.5–3.5) | B |
| [1.5–2.5) | C |
| [0.5–1.5) | D |
| Less than 0.5 | E |
| No. Sample | Printing Temperature (°C) | Printing Speed (Index) | Printing Concentration (Index) | Printing Quality (Index) |
|---|---|---|---|---|
| 1 | 25 | 1 | 1 | 0.1 |
| 2 | 25 | 1 | 2 | 0.2 |
| 3 | 25 | 1 | 3 | 0.7 |
| 4 | 25 | 1 | 4 | 2.2 |
| 5 | 25 | 1 | 5 | 2.7 |
| 6 | 25 | 1 | 6 | 2.9 |
| 7 | 25 | 1 | 7 | 3.5 |
| 8 | 25 | 1 | 8 | 3.7 |
| 9 | 25 | 1 | 9 | 3.8 |
| 10 | 25 | 1 | 10 | 3.9 |
| 11 | 25 | 1 | 11 | 3.9 |
| 12 | 25 | 1 | 12 | 4 |
| 13 | 25 | 1 | 13 | 4 |
| 14 | 25 | 1 | 14 | 3.9 |
| 15 | 25 | 1 | 15 | 3.9 |
| 16 | −25 | 1 | 1 | 0 |
| 17 | −25 | 1 | 2 | 0 |
| 18 | −25 | 1 | 3 | 0 |
| 19 | −25 | 1 | 4 | 0 |
| 20 | −25 | 1 | 5 | 2.2 |
| 21 | −25 | 1 | 6 | 2.3 |
| 22 | −25 | 1 | 7 | 3.1 |
| 23 | −25 | 1 | 8 | 3.2 |
| 24 | −25 | 1 | 9 | 3.3 |
| 25 | −25 | 1 | 10 | 3.7 |
| 26 | −25 | 1 | 11 | 3.7 |
| 27 | −25 | 1 | 12 | 3.8 |
| 28 | −25 | 1 | 13 | 3.8 |
| 29 | −25 | 1 | 14 | 3.7 |
| 30 | −25 | 1 | 15 | 3.7 |
| Parameters | Value |
|---|---|
| Number of input layer nodes | 3 |
| Number of nodes in the 1st hidden layer | 6 |
| Number of nodes in the 2nd hidden layer | 3 |
| Number of output layer nodes | 1 |
| Activation function | GeLU |
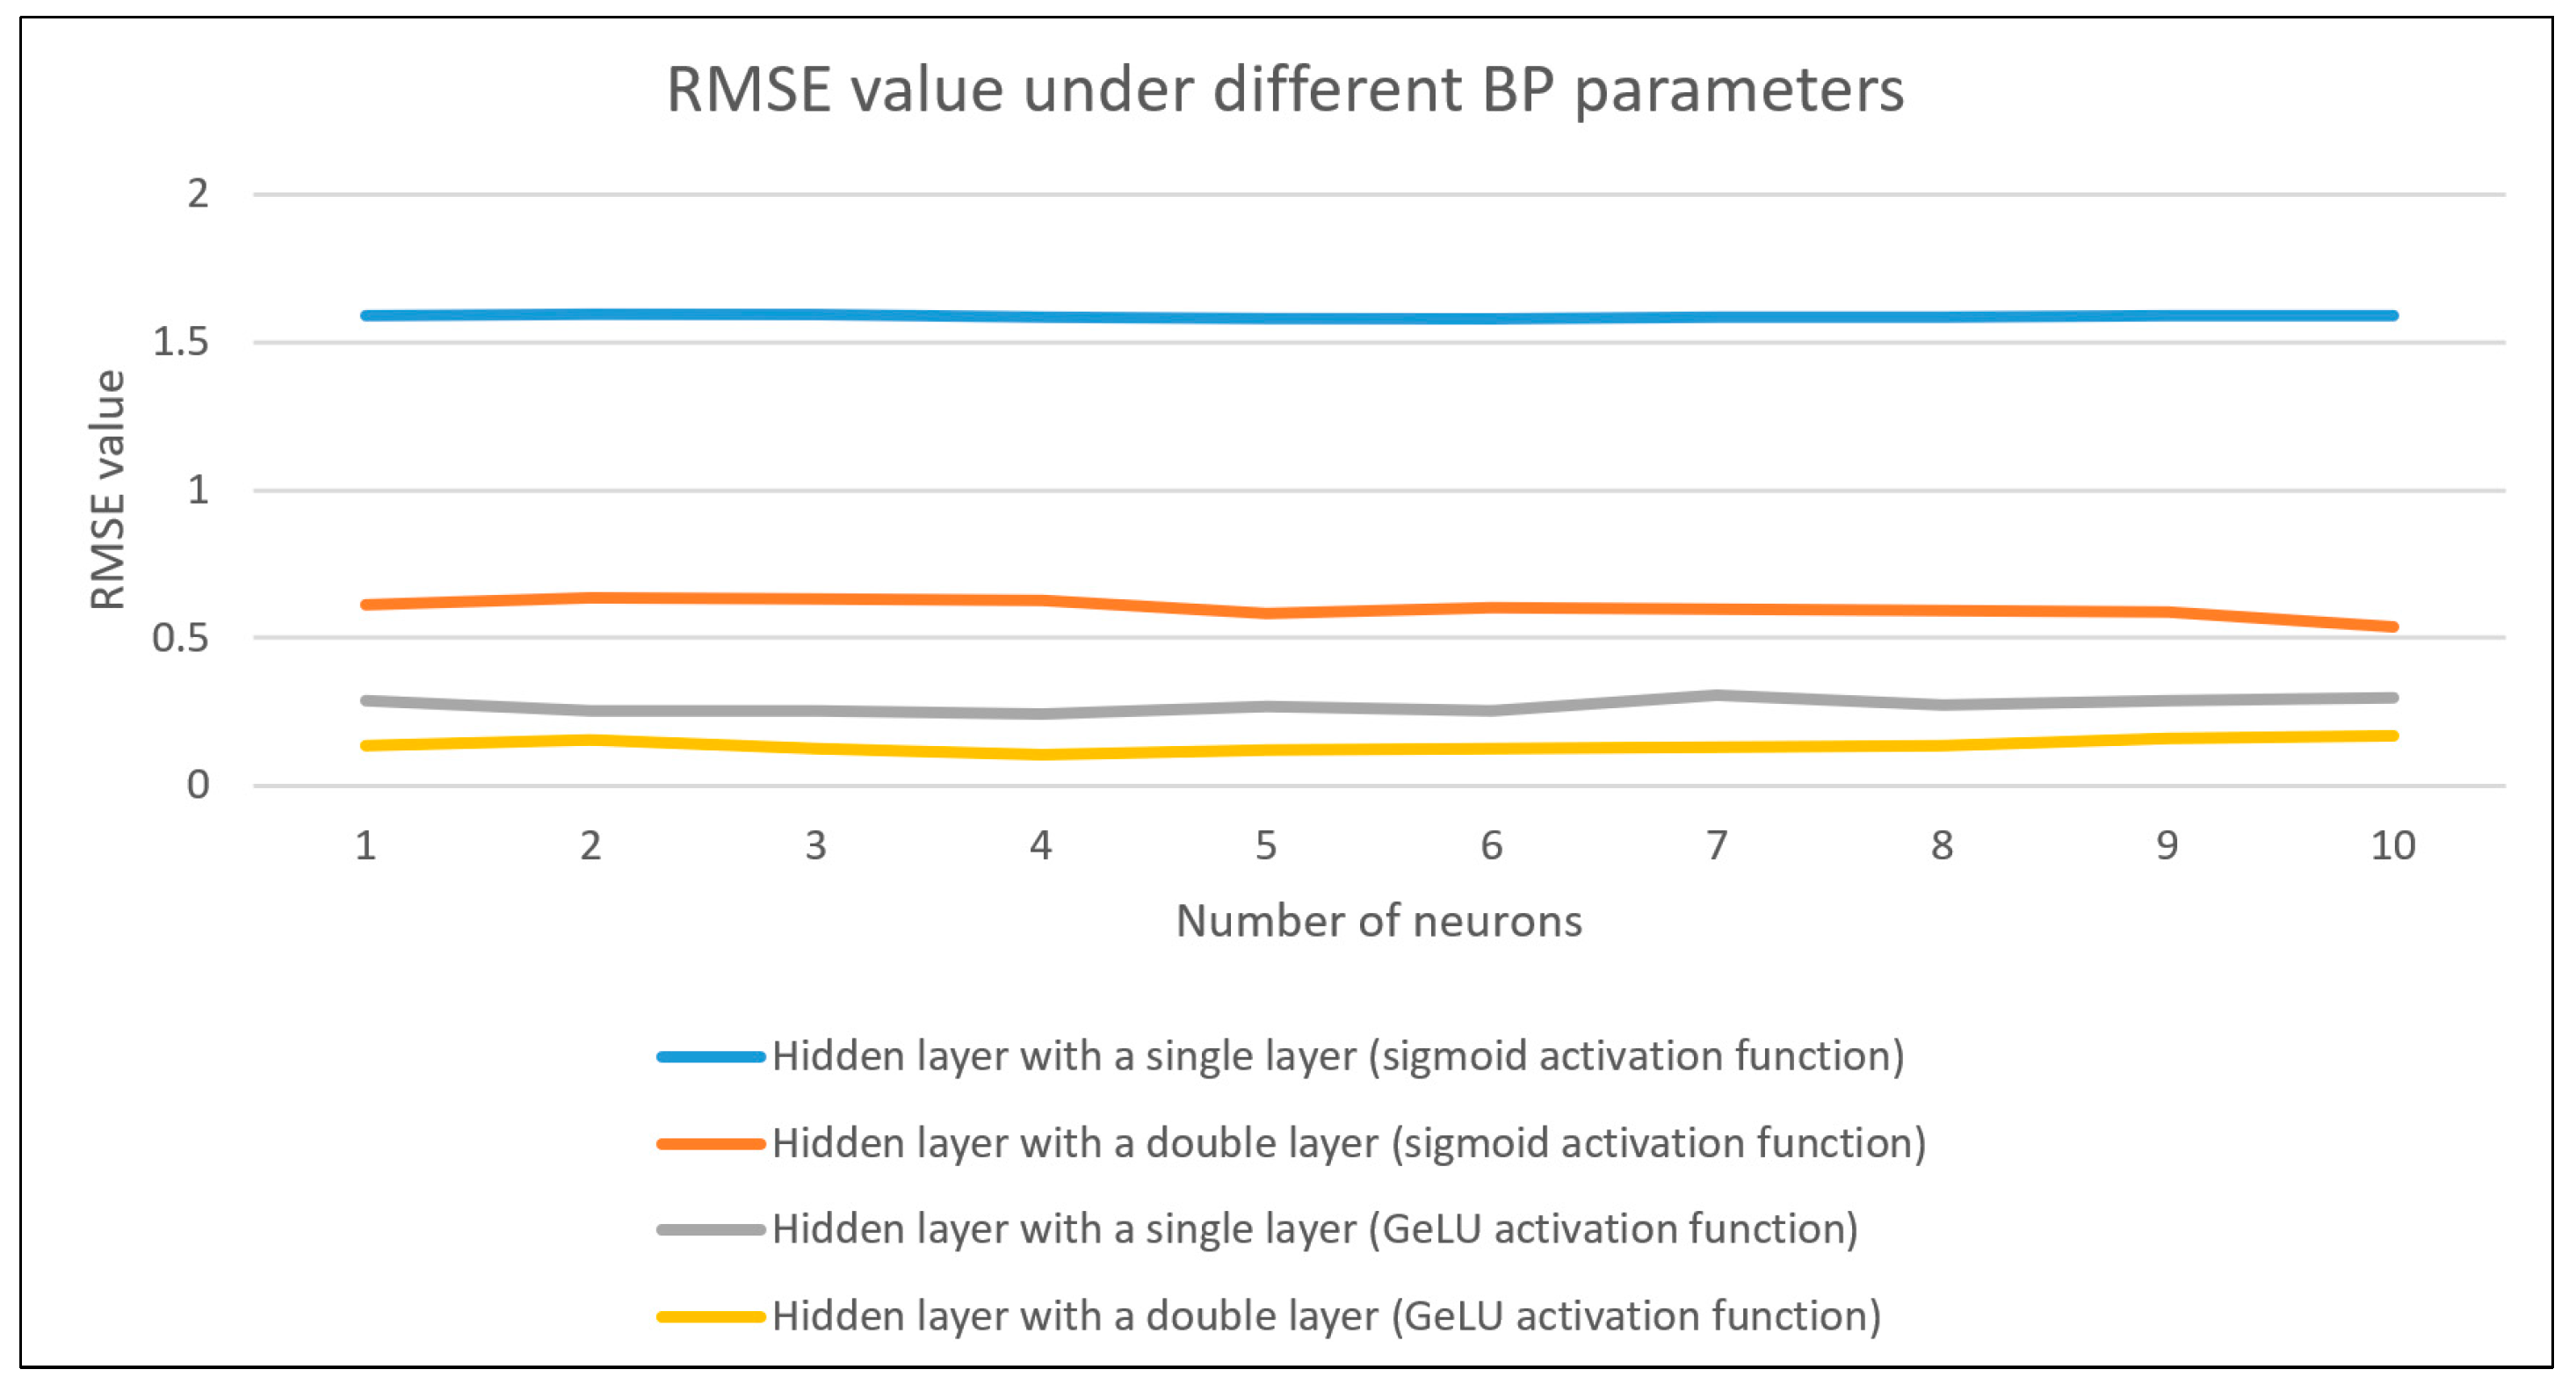
| Number of Neurons | 1 | 2 | 3 | 4 | 5 | 6 | 7 | 8 | 9 | 10 |
|---|---|---|---|---|---|---|---|---|---|---|
| RMSE | 1.5728 | 1.5673 | 1.596 | 1.5695 | 1.5728 | 1.5831 | 1.5834 | 1.5794 | 1.6098 | 1.583 |
| 1.617 | 1.5868 | 1.6071 | 1.5928 | 1.5799 | 1.5757 | 1.5799 | 1.5743 | 1.578 | 1.5924 | |
| 1.5549 | 1.5843 | 1.6055 | 1.5667 | 1.5727 | 1.5825 | 1.5866 | 1.5832 | 1.5791 | 1.5891 | |
| 1.6043 | 1.6135 | 1.5849 | 1.5976 | 1.5903 | 1.575 | 1.5752 | 1.6022 | 1.5948 | 1.5971 | |
| 1.5998 | 1.6235 | 1.59 | 1.5992 | 1.5945 | 1.5816 | 1.5947 | 1.5800 | 1.5807 | 1.593 | |
| Average | 1.5898 | 1.5951 | 1.5967 | 1.5852 | 1.582 | 1.5796 | 1.584 | 1.5838 | 1.5885 | 1.5909 |
| Number of Neurons | 1 | 2 | 3 | 4 | 5 | 6 | 7 | 8 | 9 | 10 |
|---|---|---|---|---|---|---|---|---|---|---|
| RMSE | 0.5944 | 0.6968 | 0.5893 | 0.5772 | 0.5773 | 0.6113 | 0.5953 | 0.5991 | 0.634 | 0.548 |
| 0.6342 | 0.659 | 0.6292 | 0.6898 | 0.5481 | 0.6293 | 0.6028 | 0.6308 | 0.5627 | 0.5267 | |
| 0.6457 | 0.601 | 0.6278 | 0.6334 | 0.5303 | 0.5732 | 0.5823 | 0.5299 | 0.5512 | 0.5843 | |
| 0.5713 | 0.5977 | 0.6674 | 0.5405 | 0.6267 | 0.5727 | 0.6125 | 0.6486 | 0.561 | 0.5179 | |
| 0.6161 | 0.614 | 0.6357 | 0.6880 | 0.6232 | 0.6226 | 0.5951 | 0.5532 | 0.6433 | 0.5081 | |
| Average | 0.6123 | 0.6337 | 0.6299 | 0.6258 | 0.5811 | 0.6018 | 0.5976 | 0.5923 | 0.5904 | 0.5370 |
| Number of Neurons | 1 | 2 | 3 | 4 | 5 | 6 | 7 | 8 | 9 | 10 |
|---|---|---|---|---|---|---|---|---|---|---|
| RMSE | 0.2789 | 0.2467 | 0.2157 | 0.2601 | 0.3174 | 0.2413 | 0.3102 | 0.2974 | 0.2246 | 0.3401 |
| 0.3147 | 0.2501 | 0.236 | 0.2089 | 0.2054 | 0.2817 | 0.3354 | 0.2573 | 0.3413 | 0.3017 | |
| 0.2284 | 0.2011 | 0.2744 | 0.2422 | 0.2622 | 0.205 | 0.3212 | 0.3011 | 0.2987 | 0.2988 | |
| 0.3056 | 0.269 | 0.2563 | 0.2563 | 0.2543 | 0.2652 | 0.2687 | 0.2411 | 0.2655 | 0.2341 | |
| 0.3121 | 0.3003 | 0.2822 | 0.2516 | 0.2931 | 0.2733 | 0.2914 | 0.2831 | 0.3199 | 0.2561 | |
| Average | 0.2879 | 0.2534 | 0.2529 | 0.2438 | 0.2665 | 0.2533 | 0.3054 | 0.276 | 0.29 | 0.2992 |
| Number of Neurons | 1 | 2 | 3 | 4 | 5 | 6 | 7 | 8 | 9 | 10 |
|---|---|---|---|---|---|---|---|---|---|---|
| RMSE | 0.1512 | 0.2119 | 0.1166 | 0.1211 | 0.1214 | 0.1321 | 0.1124 | 0.1311 | 0.1543 | 0.1917 |
| 0.1193 | 0.1792 | 0.1022 | 0.0981 | 0.1143 | 0.1298 | 0.1346 | 0.1456 | 0.1672 | 0.1876 | |
| 0.1283 | 0.1273 | 0.1232 | 0.0966 | 0.1052 | 0.1143 | 0.1532 | 0.1515 | 0.1811 | 0.1654 | |
| 0.1537 | 0.1345 | 0.1561 | 0.1073 | 0.1543 | 0.1515 | 0.1321 | 0.1321 | 0.1765 | 0.1346 | |
| 0.1394 | 0.1294 | 0.1313 | 0.0954 | 0.1176 | 0.0991 | 0.1264 | 0.1129 | 0.1298 | 0.1576 | |
| Average | 0.1384 | 0.1565 | 0.1259 | 0.1037 | 0.1226 | 0.1254 | 0.1317 | 0.1346 | 0.1618 | 0.1674 |
| Evaluation Index | Value |
|---|---|
| MAE | 0.1108 |
| RMSE | 0.145 |
| MSE | 0.021 |
| R2 | 0.9916 |
Disclaimer/Publisher’s Note: The statements, opinions and data contained in all publications are solely those of the individual author(s) and contributor(s) and not of MDPI and/or the editor(s). MDPI and/or the editor(s) disclaim responsibility for any injury to people or property resulting from any ideas, methods, instructions or products referred to in the content. |
© 2025 by the authors. Licensee MDPI, Basel, Switzerland. This article is an open access article distributed under the terms and conditions of the Creative Commons Attribution (CC BY) license (https://creativecommons.org/licenses/by/4.0/).
Share and Cite
Ho, C.-L.; Wu, Z.; Chang, T.-C.; Qi, S. Research on Quality Prediction for Thermal Printing Using a Particle Swarm Optimization with Back Propagation (PSO-BP) Neural Network. Appl. Sci. 2025, 15, 5116. https://doi.org/10.3390/app15095116
Ho C-L, Wu Z, Chang T-C, Qi S. Research on Quality Prediction for Thermal Printing Using a Particle Swarm Optimization with Back Propagation (PSO-BP) Neural Network. Applied Sciences. 2025; 15(9):5116. https://doi.org/10.3390/app15095116
Chicago/Turabian StyleHo, Chun-Ling, Zhiyun Wu, Tung-Chiung Chang, and Shenjun Qi. 2025. "Research on Quality Prediction for Thermal Printing Using a Particle Swarm Optimization with Back Propagation (PSO-BP) Neural Network" Applied Sciences 15, no. 9: 5116. https://doi.org/10.3390/app15095116
APA StyleHo, C.-L., Wu, Z., Chang, T.-C., & Qi, S. (2025). Research on Quality Prediction for Thermal Printing Using a Particle Swarm Optimization with Back Propagation (PSO-BP) Neural Network. Applied Sciences, 15(9), 5116. https://doi.org/10.3390/app15095116