Article

The Microstructures of Tetradesmus obliquus Biofilms Formed Under Different Nutrient Supplies

1
School of Energy and Environmental Engineering, University of Science and Technology Beijing, Beijing 100083, China
2
Beijing Engineering Research Center of Energy Saving and Environmental Protection, Beijing 100083, China
3
Beijing Key Laboratory for Energy Saving and Emission Reduction of Metallurgical Industry, Beijing 100083, China
*
Author to whom correspondence should be addressed.
Appl. Sci. 2025, 15(9), 5104; https://doi.org/10.3390/app15095104
Submission received: 10 March 2025 / Revised: 30 April 2025 / Accepted: 1 May 2025 / Published: 4 May 2025

Abstract

:
The microstructures of microalgae biofilms affect biofilms’ growth, which is critical in developing efficient microalgae biofilm-based culture systems. Herein, the microstructures of Tetradesmus obliquus biofilms cultured under different nutrients were in situ observed with confocal laser scanning microscopes. The surface structures and internal pore structures for these biofilms were determined quantitatively. The results indicated that the surfaces of these biofilms were all wrinkled with many folds in micrometres. The biofilms cultured under BG11, BG11+glycerine, BG11+urea, and BG11+NH4Cl nutrients had small pores with diameters of 15~30 μm, whereas the biofilms formed under BG11+NaHCO3 and BG11+NaNO3 presented many large pores with diameters of 50~150 μm. The mechanism of forming different microstructures of these nutrients was interpreted by analyzing cell surface properties. We found that the cells cultured under BG11+NaHCO3 and BG11+NaNO3 had more hydrophobic surface groups. The high cell–cell interactions between hydrophobic cells made cells tend to aggregate together and form biofilms with more inner pores, which may be conducive to cell growth and biofilm development. The study offers new insights into understanding the microstructural characteristics of microalgae biofilms cultured under different nutrients, providing important guidance for the development of biofilm-based culture systems.

1. Introduction

Microalgae can use light, CO2, and nutrients to produce valuable organics via photosynthesis, such as lipid, protein, xanthophylls, and astaxanthin [1,2,3]. Due to their fast growth rate, low nutrient requirements, and high content of valuable biocompounds, microalgae have been considered one of the promising biological resources to produce biofuels and other biological products [4,5,6,7]. Presently, microalgae are generally cultured in either a suspended system or a biofilm-based system. In a suspended system, microalgae are cultured suspendedly in large amounts of water containing nutrients [8]. In a biofilm-based culture system, microalgae aggregate together and form biofilms on substrates [9]. Previous studies suggested that, compared with suspended systems, biofilm-based systems had the advantages of high biomass productivity, low water consumption, and easy harvesting, thus attracting much interest in biotechnology and environmental engineering [10,11,12]. Therefore, it is important to develop efficient microalgae biofilm-based culture systems for promoting the microalgae industry.
In the biofilm-based culture systems, microalgal cells are first inoculated onto substrates that are submerged in or floated on aqueous culture media; then, the cells grow and form biofilms by adhering to substrates and sticking to each other. Generally, due to the cell–cell interactions and the influence of culture conditions (i.e., hydrodynamics, substrates, temperature, gas, and nutrient supplies), the formed microalgae biofilms always possessed complex three−dimensional (3D) microstructures [13,14,15,16]. The microstructure of microalgae biofilms influences the transport of light, gases, and nutrients within the biofilm, directly affecting cellular photosynthetic activity and lipid accumulation [17], which in turn impacts lipid productivity. Additionally, these microstructures also influence the rheological properties, apparent wettability, and overall life cycle of the biofilm, which critically affects microalgae biomass harvesting costs and the economic viability of microalgae−based biodiesel technologies [15,18,19,20]. Therefore, it is essential to understand the microstructures of microalgae biofilms at different culture conditions to develop more efficient and sustainable microalgae biofilm-based culture systems.
Recently, some researchers have studied the microstructures of microalgae biofilms under certain conditions. Fanesi et al. [21] found that, at low shear stress, Chlorella vulgaris formed heterogeneous and loose biofilms, while, at high shear stress, cells formed thick and compact biofilms. Wang et al. [22] reported that the biofilms of Chlorella sp. cultured at lower light intensities (20 and 50 μmol·m−2·s−1) were more porous; in contrast, under higher light intensities (100, 200, and 400 µmol·m−2·s−1), the biofilms presented no visible voids and were more compact. Yuan et al. [18] found that Tetradesmus obliquus cultured under white light formed biofilms with many inner voids and high surface roughness; while, under red and blue lights, these cells formed homogeneous and compact biofilms with low porosity. Zhang et al. [23] reported that microalgae cultured on different agar substrates formed different biofilm microstructures by varying their cell surface properties and cell–cell interactions. The cells with low surface energy formed heterogeneous biofilms with many voids; whereas, cells with high surface energy formed flat biofilms with low porosity.
The above results suggested that microalgae biofilms would present diverse 3D microstructures at different shear stress, lighting conditions, or substrates, which may be due to the external hydrodynamic conditions, cell surface properties, and cell–cell interaction. It should be noted that, except for the above culture conditions, the nutrient supplies and circulations (e.g., nutrients types and concentrations [24,25,26], CO2 supplementation [26,27], discharge of O2 [28]) may also affect the growth and biomass of microalgae biofilms by influencing their photosynthesis or cell–cell interactions. However, to date, few studies have been conducted on the microstructures of microalgae biofilms cultured at different nutrient supplies.
To address this gap, we explored the microstructures of Tetradesmus obliquus microalgae biofilms formed under different nutrient supplies in this work. This species of green algae is known for its ability to form biofilms and shows promise for biofuel production [29,30]. First, the T. obliquus cells were biofilm−cultured under six different nutrient supplies. Then, these biofilms were in situ observed with confocal laser scanning microscopes. The surface structures and internal pore structures for these biofilms were determined quantitatively. Finally, the mechanism of forming different biofilm microstructures at different nutrient supplies was interpreted by measuring cell surface properties with Fourier transform infrared spectroscopy (FTIR) and X−ray photoelectron spectroscopy (XPS). The study provides new insights into the microstructures of microalgae biofilms cultured under varying nutrient conditions, offering valuable guidance for the design of biofilm-based culture systems to enhance the microalgae industry.

2. Materials and Methods

2.1. Microalgae Biofilm Culture

The microalgae T. obliquus (FACHB–276) was used in this work. Before biofilm culture, the T. obliquus with an inoculation concentration of OD680 = 0.860 was pre−cultured in 500 mL flasks containing 100 mL BG 11 culture medium (pH = 7.1) at 25 ± 1 °C. Detailed information on the BG11 culture medium was shown in the supporting information (Supplementary Materials Tables S1 and S2). The culture was maintained under continuous aeration with ambient air and exposed to a light intensity of 100 μmol photons m⁻2 s⁻1 for six days in a shaking incubator. After that, the obtained cell suspensions were vacuum filtered onto filter membranes (diameter: 50 mm, pore size: 2 μm) to form primary biofilms with an inoculum density of 4.0 ± 0.1 g m−2.
Then, these biofilms were placed into bioreactors (polymethyl methacrylate chamber: 200 × 196 × 76 mm) to maintain microalgae growth. As shown in Figure 1, these biofilms were put onto a layer of medical gauze, which was attached to a perforated plate. Under the perforated plate, the liquid culture medium was cycled by a peristaltic pump. The culture medium was renewed every three days to ensure that cells received sufficient nutrients. The compressed air enriched with 1% CO2 (v/v) was first purified with a filter, then humidified with deionized water, and finally introduced into the bioreactor with a constant flow rate of 0.1 VVM (volume of air per volume of culture per minute). The white light−emitting diodes (JK−W300200, J&K Photoelectric Technology, Shanghai, China) with a light intensity of 100 μmol photons m−2 s−1 were fixed at the top of the bioreactor and used as the light source. These bioreactors were placed into an incubator, where the temperature was controlled at 25 ± 1 °C.
In this work, to explore the microstructures of microalgae biofilms formed under different nutrients, the T. obliquus biofilms were cultured with six kinds of nutrient supplies, i.e., pure BG11 culture medium, BG11 media with an additional 30 mM glycerine (named as BG11+glycerine), BG11 with an additional 30 mM NaHCO3 (i.e., BG11+NaHCO3), BG11 with an additional 15 mM urea (i.e., BG11+urea), BG11 with an additional 15 mM NH4Cl (i.e., BG11+NH4Cl), and BG11 with an additional 15 mM NaNO3 (i.e., BG11+NaNO3). During the experiment, the T. obliquus cells were biofilm−cultured in the bioreactors for 7 days under different nutrient supplies. To obtain reliable results, we carried out three runs of experiments for microalgae culture at each nutrient supply.

2.2. Characterization of Biofilm Microstructures

The microstructures of microalgae biofilms were observed in situ using a confocal laser microscope (LSM780, Zeiss, Jena, Germany) with a 10 × objective via scanning an area of 850 × 850 μm2 on biofilms. To present the surface structures of biofilms, we generated the 3D images of biofilms using Zen software (Zen 2.3, Carl Zeiss Microscopy GmbH, Jena, Germany). Furthermore, we reconstructed the above 3D images of biofilms by using MATLAB software (Matlab 7.0, MathWorks, Natick, MA, USA) to show the surface structure of biofilm more clearly.
Based on these 3D images, we further determined biofilm’s surface roughness and porosity quantitatively, which are two important parameters in biofilm structure characterization and directly affect the biofilm wettability as well as the transport of light and nutrients in biofilms. Particularly, the surface roughness was evaluated by determining the distributions for the grey values of images [29]. Generally, the higher the grey values of pixels, the higher the surface heights. Therefore, the surface roughness was evaluated by determining the arithmetic mean deviation for the grey values of images using Equation (1) [30]:
R = 1 n 1 n | v v 0 |
where the R is the surface roughness. The n is the number of calculated pixels. The v is the grey value of the pixel. The v0 is the mean grey value of pixels, and the details on the determination of v0 are shown in Supplementary Materials (see Figure S1).
The biofilm porosity was determined by calculating the pixel ratio of pores in the images according to Equation (2):
P = t p T × 100 %
where the P is biofilm porosity. The T is the number of total pixels in an image. The tp is the pixel number of pores in an image. Note that, in the determination, the pixels with grey values lower than a “critical grey value” were considered as pores (i.e., pores are darkest in the images with low grey values) and the pixels with grey values higher than this “critical grey value” were considered as cells. The details on determining this “critical grey value” for an image are shown in Supplementary Materials (see Figure S2).
In this work, the observation and characterization of the biofilm microstructures were conducted for three runs. In each run, three biofilm samples were randomly selected and observed. At least five random fields of view were obtained for each sample. The biofilm images shown in this work were the representative images obtained in the measurements. The surface roughness and biofilm porosity are shown in mean ± standard deviation. Meanwhile, a one−way ANOVA was performed to study the statistical differences in biofilm roughness and porosity, and the p−values < 0.05 were statistically significant.

2.3. Measurements of the Microalgae Cell Properties

Previous studies suggested that the cell morphology and cell surface properties affected the cell–cell interactions in a biofilm, thereby the biofilm microstructures [23,31]. Therefore, we characterized the cell morphology and surface compositions to explore the mechanism of forming different biofilm structures at different nutrient supplies. Specifically, the morphology of cells was observed using a microscope (BX61, OLYMPUS, Tokyo, Japan). The cell size (including length and width) was determined based on the morphology images obtained using Image J software (Image J 1.52, National Institutes of Health, Bethesda, MD, USA). The cell size measurements were carried out three times, and the results are shown in mean ± standard deviation.
Furthermore, the surface compositions of microalgae cells cultured under six kinds of nutrients were characterized using FTIR (INVENIO−R, Bruker, Munich, Germany) and XPS with an Al monochromator (Escalab 250Xi, Thermo Fisher Scientific, Waltham, MA, USA. hν = 1486.6 eV). Before the FTIR and XPS measurements, the microalgae biofilms cultured under different nutrient supplies were harvested from the filter membrane with pure water, then dried to a constant weight at 70 °C, and the dried and clumped microalgae samples were ground into powder carefully using a laboratory mortar and pestle. In the FTIR and XPS measurements, three biofilm samples were characterized in the experiments. Particularly, in the XPS measurements, the functional composition of the cell surface was calculated by analyzing the decomposition of XPS peaks using Avantage software (V5.967, Thermo Fisher Scientific).

3. Results

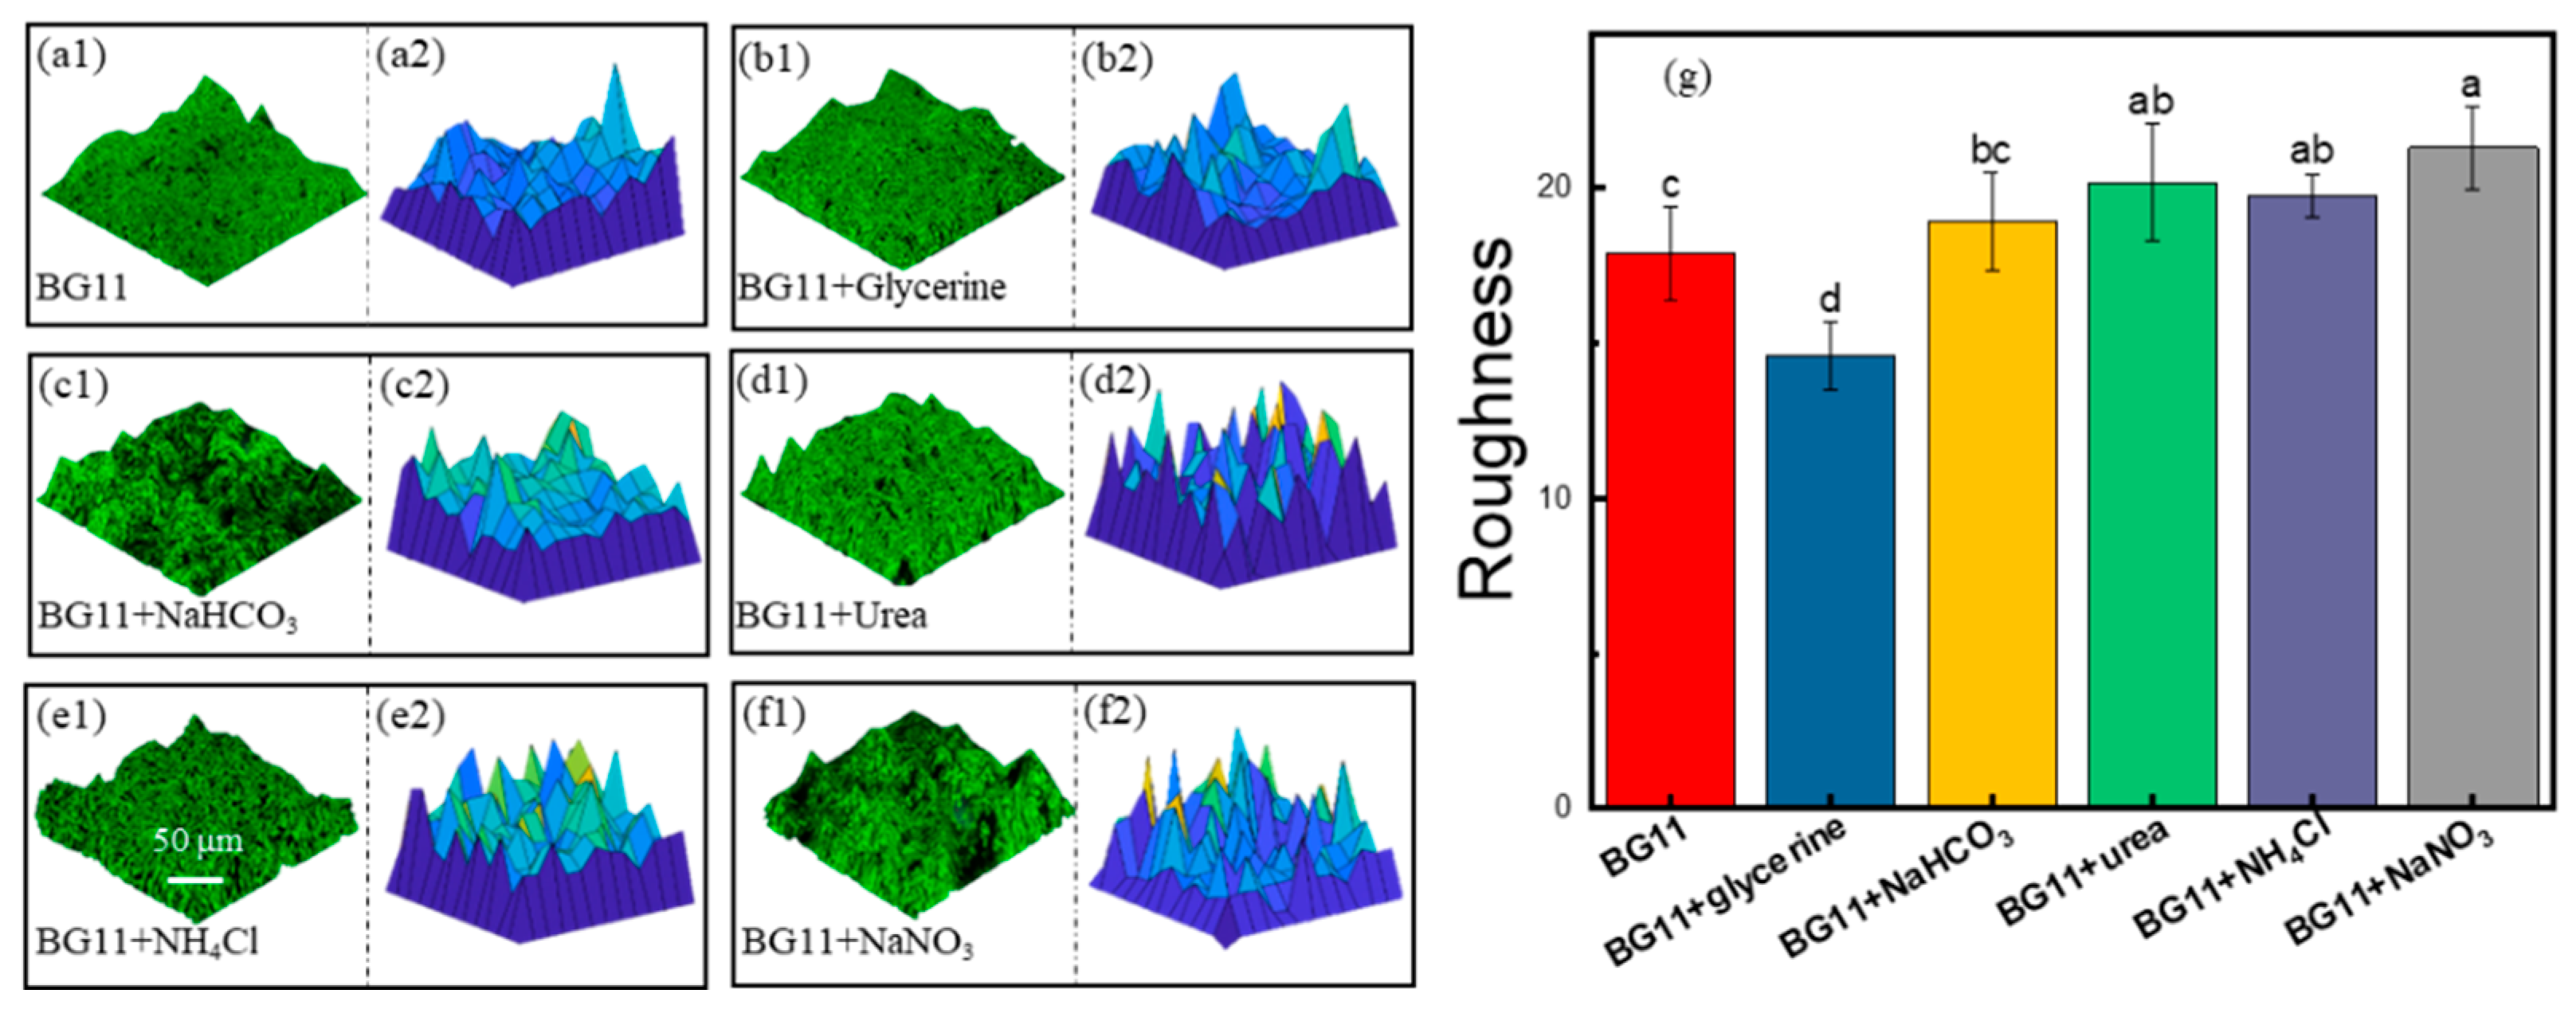
3.1. The Surface Microstructure of Microalgae Biofilms

To understand the surface microstructure of biofilms, we generated the 3D images of these biofilms by Zen software based on the observation photos. Particularly, Figure 2(a1) depicts the surface characteristics of the biofilm cultured with the BG11 medium. The results indicated that the biofilm surface was wrinkled with many folds in micrometres, which agreed well with the findings shown in our previous study (the surface roughness of microalgae biofilm was characterized by the profilometric measurement) [18]. Similarly, the surfaces of biofilms cultured under BG11+glycerine, BG11+NaHCO3, BG11+urea, BG11+NH4Cl, and BG11+NaNO3 were all wrinkled, as shown in Figure 2(b1–f1). To present the biofilm surface characteristics more clearly, we reconstructed these biofilm images using MATLAB software based on the above 3D images, as shown in Figure 2(a2–f2). The images indicated that the surfaces of these biofilms were uneven, with many ups and downs. The above results revealed that, under these different nutrient supplies, the surfaces of all biofilms were not flat.
Furthermore, to quantitatively characterize the surface microstructure, we determined the surface roughness of these biofilms. As shown in Figure 2g, we found that the surface roughness of the biofilm cultured with BG11 medium was 17.9 ± 1.5, which further suggested that the biofilm surface was wrinkled. This may be because the nutrient media was supplied by circulation with a pump in this work, which was conducive to promoting cell growth, thus the surface roughness of biofilm. Moreover, Figure 2g indicated that the surface roughness of biofilms cultured with BG11+glycerine, BG11+NaHCO3, BG11+urea, BG11+NH4Cl, and BG11+NaNO3 media were 14.6 ± 1.1, 18.9 ± 1.6, 20.2 ± 1.9, 19.7 ± 0.7, and 21.3 ± 1.4, respectively. These values ranged narrowly between 14.6 and 21.3. Such limited fluctuations suggest that adding additional nutrients (i.e., glycerine, NaHCO3, urea, NH4Cl, NaNO3) in the BG11 medium did not substantially alter the overall surface topography of biofilms.

3.2. The Pore Structure Characteristics of Microalgae Biofilms

The pore structure of biofilms influences the light transmission and gas supply in biofilms, thereby the biofilm growth and development. Figure 3a–f shows the representative confocal laser scanning images of the biofilms formed under these different nutrient supplies, which were the z−projections of z−stack containing 20 individual scans. The results suggested that the pore structures for these six biofilms were significantly different. Particularly, Figure 3a indicates that there were some small pores with diameters of 15~30 μm in the biofilm formed under the BG11 medium. Similarly, the biofilms, formed under BG11+glycerine, BG11+urea, and BG11+NH4Cl (see Figure 3b,d,e), also presented small pores. Whereas, as shown in Figure 3c,f, the biofilms cultured under BG11+NaHCO3 and BG11+NaNO3 had many large pores with diameters of 50~150 μm. The results suggested that adding additional nutrients in the BG11 medium may affect the pore structure characteristics of biofilms.
Furthermore, we determined the biofilm porosity for quantitatively characterizing the biofilm pore structure. As shown in Figure 3g, the porosity of biofilm formed under the BG11 medium was 7.4 ± 0.2%, remaining at a low level. The results suggested that the biofilm cultured with the BG11 medium was dense and uniform in structure. The porosities for the biofilm formed under BG11+glycerine, BG11+urea, and BG11+NH4Cl were 13.3 ± 2.7%, 10.6 ± 1.3%, and 16.2 ± 1.3%, respectively, a little higher than the porosity of biofilm under the BG11 medium. Notably, the biofilm formed under BG11+NaHCO3 and BG11+NaNO3 presented a high porosity of 29.4 ± 1.7% and 21.1 ± 0.9%, respectively, indicating that the biofilms were loose and more porous in structure. The above results revealed that adding extra nutrients in the BG11 medium would increase the biofilm porosity, and the biofilms cultured under BG11+NaHCO3 nutrients possessed the highest porosity.

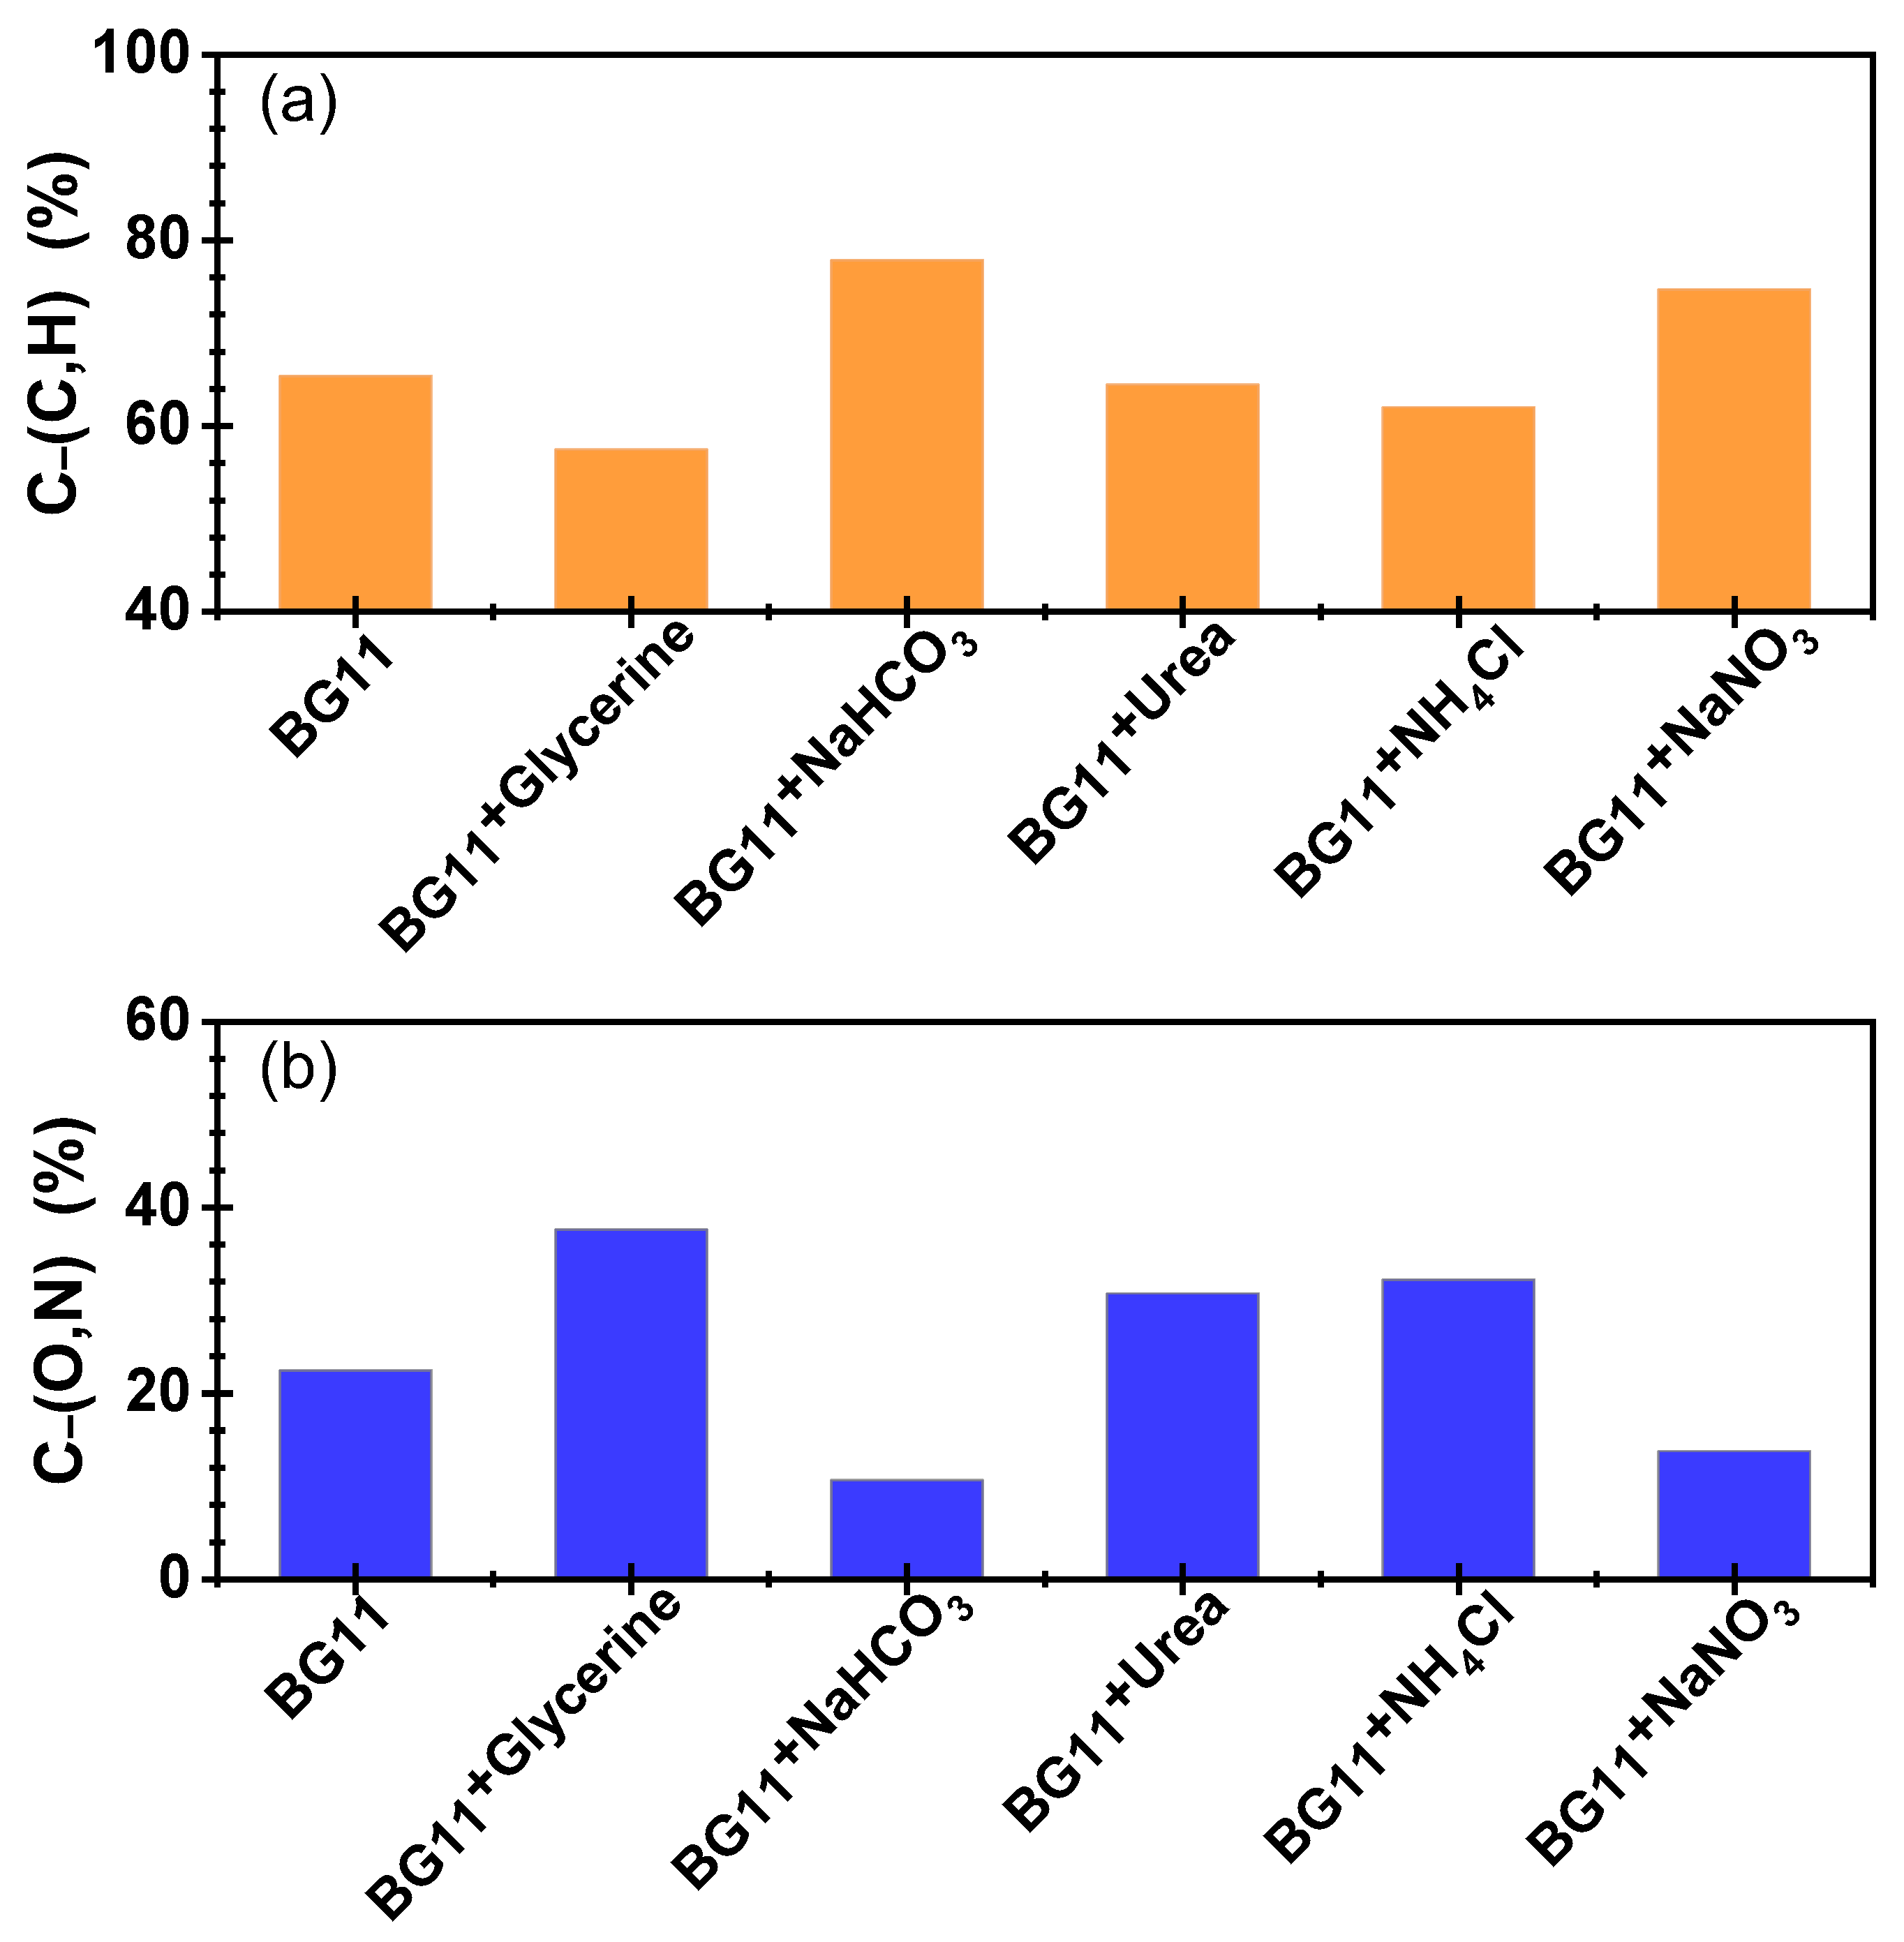
3.3. Surface Properties of Microalgae Cells Cultured with Different Nutrients
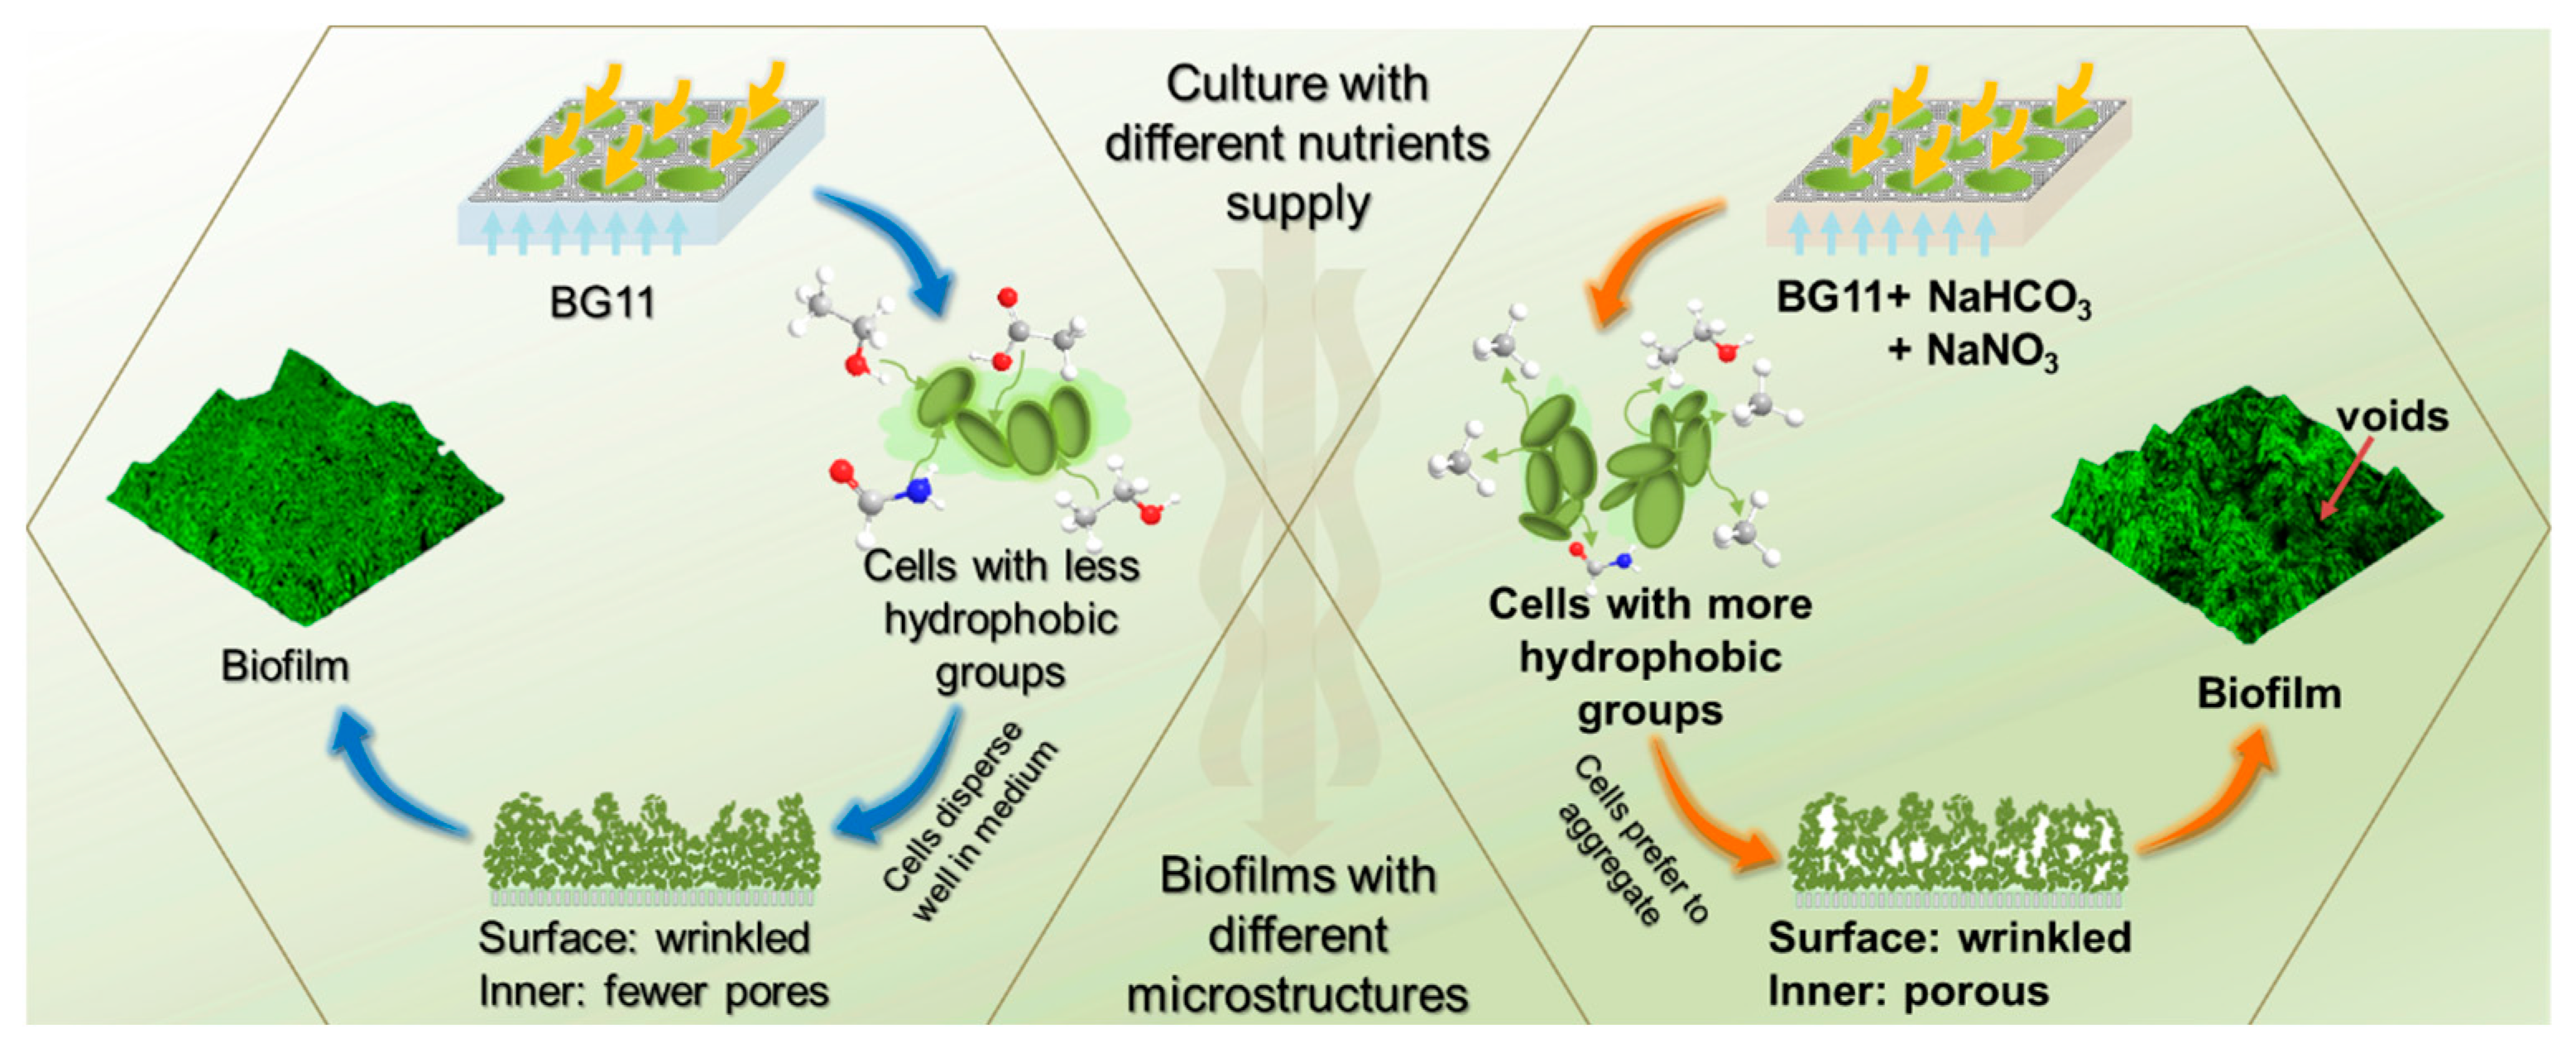
The results of surface characteristics and pore structure for the biofilms suggested that the surfaces of biofilms cultured under these different nutrients were all wrinkled with many folds, and no significant difference existed in the surface roughness of these biofilms, while the porosities for these biofilms were different. To understand the mechanism of forming biofilms with different porosities under these nutrient supplies, we further characterized the cell properties, including the cell morphology and surface compositions. Figure S3 indicates that under these nutrient conditions, all cells displayed a spindle−like morphology, ranging from 7 to 9 μm in length and 4 to 5 μm in width, with no observable surface spines or appendages. The results suggested that there was no difference in the cell’s shape and size. That is to say, the different porosities for these biofilms may not be due to the cell morphology.
Furthermore, we characterized the cell surface compositions by using FTIR and XPS. Figure 4 shows the FTIR peak spectra for these cells cultured under different nutrients. We found that two new peaks (1280 and 835 cm−1) appeared on the cell surfaces cultured under BG11+NaHCO3. Generally, the peak at 1280 cm−1 is associated with the C−O−C stretching band of the ethers or esters. However, because the extracellular polymers of algae typically contain polysaccharides, proteins, and lipids, and generally lack ether compounds, we assign this peak to the O=C−OR group (C−O−C stretching vibration). Additionally, the 835 cm⁻1 peak can also be attributed to the C−H bending vibration. Since both the O=C−OR and C−H groups are hydrophobic, the results suggested that the cells cultured with BG11+NaHCO3 medium exhibit a higher abundance of hydrophobic groups compared to those cultured in BG11 medium. Moreover, a new peak (826 cm−1) appeared on the surface of cells cultured under BG11+NaNO3 medium, which was also related to the hydrophobic C−H group. In addition, the results indicated that the peak at 3274 cm−1 for the cells cultured under BG11+NaNO3 was weaker than those cultured with BG11 medium. Generally, the peak at 3274 cm−1 is related to the hydrophilic –NHR group (caused by N−H stretching vibration). Therefore, these results suggested that the cells cultured with BG11+NaNO3 medium had more hydrophobic groups and less hydrophilic groups than those cultured with the BG11 medium.
The above FTIR results indicated that the cells cultured with BG11+NaHCO3 and BG11+NaNO3 media possessed more hydrophobic groups (i.e., C−H group and O=C−OR group) than those cultured with BG11 medium. To quantitatively characterize the hydrophobic groups on the cell surface, we further measured cell surface compositions using XPS. Figure S4 shows the XPS survey spectra for these microalgae cells. Figures S5 and S6 depict the carbon peaks (C 1s) and oxygen peaks (O 1s) obtained from Figure S4. Table S3 shows the contents of the specific functional groups in the C 1s and O 1s on the cell’s surface. Notably, Figure 5 presents the contents of functional groups of C−(C, H) and C−(O, N) on microalgae cell surfaces. Figure 5a indicates that the contents of C−(C, H) on the surface of cells cultured with BG11, BG11+NaHCO3, and BG11+NaNO3 media were about 65%, 79%, and 75%, respectively. Figure 5b shows that the contents of C−(O, N) on the surface of cells cultured with BG11, BG11+NaHCO3, and BG11+NaNO3 media were about 22%, 11%, and 14%, respectively. Generally, the C−(C, H) is hydrophobic, and the C−(O, N) is hydrophilic [32,33,34]. The results suggested that the cells cultured with BG11+NaHCO3 and BG11+NaNO3 media possessed higher contents of hydrophobic groups and lower contents of hydrophilic groups, which further revealed that the cells cultured with BG11+NaHCO3 and BG11+NaNO3 media were more hydrophobic than those cultured with the BG11 medium.

4. Discussion

The results of this study indicate that the microalgae biofilms cultured under some nutrients (i.e., BG11, BG11+glycerine, BG11+urea, and BG11+NH4Cl media) possessed wrinkled surfaces and fewer inner pores, whereas the microalgae biofilms cultured with BG11+NaHCO3 and BG11+NaNO3 media had many internal pores. As shown in Figure 6, the cells cultured with BG11, BG11+glycerine, BG11+urea, and BG11+NH4Cl media possessed a lower amount of C–(C, H) and a higher amount of C–(O, N), compared with the cells cultured under BG11+NaHCO3 and BG11+NaNO3 media. Generally, the C–(C, H) groups are hydrophobic, and the C–(O, N) groups are hydrophilic [34]. The results revealed that the cells cultured with BG11, BG11+glycerine, BG11+urea, and BG11+NH4Cl media were less hydrophobic (or more hydrophilic), which made these cells disperse well in the liquid media of biofilms. Based on our previous studies, the interactions between hydrophilic cells were relatively weak [18]. Therefore, the formed biofilms were homogeneous inside and possessed fewer inner pores.
Furthermore, we found that the cells cultured with BG11+NaHCO3 and BG11+NaNO3 media had a higher amount of C–(C, H) and a lower amount of C–(O, N), which revealed that these cells were more hydrophobic than those cultured under BG11, BG11+glycerine, BG11+urea, and BG11+ NH4Cl media. Our previous studies [23] indicated that the hydrophobic cells possessed high cell–cell interactions in water−based cultured media. As shown in Figure 6, it can be expected that the cells with high cell–cell interactions would tend to aggregate together, which may induce the formation of cell agglomerations. Due to the differences in cell viabilities at different locations of biofilms, these cell agglomerations may be intermittently distributed in biofilms, which would induce biofilms to possess many inner pores.
The above results and analysis revealed that the cells cultured under different nutrients possessed different surface compositions. When the surface had more hydrophobic groups (e.g., C–(C, H), O=C−OR) and less hydrophilic groups (e.g., C–(O, N), –NHR), the cells would tend to aggregate together due to the high cell–cell interactions, and form biofilms with more internal pores. Similarly, Yuan et al. [18] demonstrated that biofilms cultured under white light exhibited higher porosity due to hydrophobic cell surfaces, whereas homogeneous biofilms under red/blue light correlated with hydrophilic cell surfaces. This parallels our observation that nutrient supplements like NaHCO₃/NaNO₃ increase cell hydrophobicity and biofilm porosity, suggesting the role of surface properties of cells in biofilm structural modulation. In addition, Wang et al. [22] found that low light intensity promoted porous biofilms to enhance nutrient/light transport, while high light intensity triggered compact structures to mitigate photodamage. Our study reveals that nutrient types may also drive structural adaptations of biofilms. Future studies need to be conducted to understand the relationship between the physiology of microalgae cells and the microstructure of biofilms cultured under different nutrients.
In addition, it should be noted that the inner pores and microstructure of biofilms would affect the transport phenomena of light, gas (e.g., CO2, O2), and nutrients in biofilms [35], and thus the growth of microalgae cells and their lipid productivity, which is a key factor in microalgae−based biofuel technology. For example, our previous studies found that the microstructures of biofilms formed under different light conditions (white, blue, green, and red lights, and the photoperiods of 5:5 s, 30:30 min, and 12:12 h, all at the same light intensity) were different, and the biofilms with high porosity presented high biomass [18]. However, it should be noted that nutrient supply plays an important role in regulating cellular metabolic pathways, which directly affects not only the growth rate of microalgal cells but also the cell surface properties and formation of biofilms. Different nutrient conditions, such as carbon, nitrogen, phosphorus, or trace minerals, can lead to variations in cell surface properties, biofilm porosity, and biomass productivity. Therefore, a further study should be conducted to deeply understand the effects of biofilm microstructures formed under different nutrients on biofilm growth. Moreover, the findings are based on controlled laboratory conditions with fixed light intensity, temperature, and CO₂ supplementation. Variations in these parameters may influence biofilm microstructure. Additionally, the study focused solely on T. obliquus; generalization to other microalgal species requires further validation. These limitations highlight the need for future investigations to explore broader environmental interactions and species−specific responses.

5. Conclusions

In summary, we studied the microstructures of biofilms formed under six different nutrient supplies (i.e., BG11, BG11+glycerine, BG11+NaHCO3, BG11+urea, BG11+NH4Cl, and BG11+NaNO3) in this work. The results indicated that these biofilm surfaces were all wrinkled with many folds, and roughness narrowly ranged from 15 to 21. However, the internal pore structures for these six biofilms were different. The biofilms cultured under BG11, BG11+glycerine, BG11+urea, and BG11+NH4Cl possessed small pores (biofilm porosity ranging from 10~16%), whereas the biofilms formed under BG11+NaHCO3 and BG11+NaNO3 presented many large pores with diameters of 50~150 μm (biofilm porosity ~29%). By characterizing cell surface compositions with FTIR and XPS, we found that the cells cultured under BG11+NaHCO3 and BG11+NaNO3 had more hydrophobic surface groups (e.g., C–(C, H), O=C−OR) and less hydrophilic groups (e.g., C–(O, N), –NHR), which made cells tend to aggregate together due to the high cell–cell interactions, and form the biofilms with more inner pores. This work would provide new insights in understanding the microstructures of microalgae biofilms cultured at different nutrient supplies and would have significant implications for selecting the optimal nutrient supplies in biofilm-based microalgae culture systems. Future studies should focus on elucidating the relationship between nutrient−induced biofilm microstructure and biomass productivity in biofilm culture systems.

Supplementary Materials

The following supporting information can be downloaded at: https://www.mdpi.com/article/10.3390/app15095104/s1, E−supplementary data of this work can be found in the online version of the paper. Figure S1. The method to determine the mean grey value of pixels (i.e., v0). Figure S2. The steps to determine the “critical grey value” for an image. Figure S3. The length and width for the cells cultured under BG11 (a), BG11+glycerine (b), BG11+NaHCO3 (c), BG11+urea (d), BG11+NH4Cl (e), and BG11+NaNO3 (f) media. Figure S4. The XPS survey spectrum for microalgae biofilms cultured under (a) BG11, (b) BG11+glycerine, (c) BG11+NaHCO3, (d) BG11+urea, (e) BG11+NH4Cl, and (f) BG11+NaNO3 media. Figure S5. The C 1s peaks for cells cultured under BG11 (a), BG11+glycerine (b), BG11+NaHCO3 (c), BG11+urea (d), BG11+NH4Cl (e), and BG11+NaNO3 (f) media. Figure S6. The O 1s peaks for cells cultured under BG11 (a), BG11+glycerine (b), BG11+NaHCO3 (c), BG11+urea (d), BG11+NH4Cl (e), and BG11+NaNO3 (f) media. Table S1. The components of BG11 medium. Table S2. The composition of A5 solution for BG11. Table S3. The components of individual functional groups in C 1s and O 1s.

Author Contributions

H.Z., methodology, formal analysis, data curation, writing—original draft. G.C., methodology, data analysis. Z.S.; investigation, data analysis. X.Z. (Xinru Zhang), investigation, writing—review and editing, conceptualization, funding acquisition. Z.J., investigation, writing—review and editing. X.Z. (Xinxin Zhang), conceptualization, supervision. All authors have read and agreed to the published version of the manuscript.

Funding

This research was funded by the National Science Foundation of China (No. 51706019) and the Fundamental Research Funds for the Central Universities (No. FRF−BD−20−09A).

Institutional Review Board Statement

Not applicable.

Informed Consent Statement

Not applicable.

Data Availability Statement

Data are contained within the article.

Conflicts of Interest

None of the authors declare a conflict of interest.

References

  1. Gifuni, I.; Pollio, A.; Safi, C.; Marzocchella, A.; Olivieri, G. Current Bottlenecks and Challenges of the Microalgal Biorefinery. Trends Biotechnol. 2019, 37, 242–252. [Google Scholar] [CrossRef]
  2. Lam, G.P.; Vermue, M.H.; Eppink, M.H.M.; Wijffels, R.H.; van den Berg, C. Multi−Product Microalgae Biorefineries: From Concept Towards Reality. Trends Biotechnol. 2018, 36, 216–227. [Google Scholar] [CrossRef] [PubMed]
  3. Koruyucu, A.; Peest, T.; Korzin, E.; Gröninger, L.; Patricia; Brück, T.; Weuster−Botz, D. Cell Disruption and Hydrolysis of Microchloropsis salina Biomass as a Feedstock for Fermentation. Appl. Sci. 2024, 14, 9667. [Google Scholar] [CrossRef]
  4. Sharma, R.; Mishra, A.; Pant, D.; Malaviya, P. Recent advances in microalgae−based remediation of industrial and non−industrial wastewaters with simultaneous recovery of value−added products. Bioresour. Technol. 2022, 344, 126129. [Google Scholar] [CrossRef]
  5. Mofijur, M.; Rahman, S.M.A.; Nguyen, L.N.; Mahlia, T.M.I.; Nghiem, L.D. Selection of microalgae strains for sustainable production of aviation biofuel. Bioresour. Technol. 2022, 345, 126408. [Google Scholar] [CrossRef] [PubMed]
  6. Veerabadhran, M.; Gnanasekaran, D.; Wei, J.; Yang, F. Anaerobic digestion of microalgal biomass for bioenergy production, removal of nutrients and microcystin: Current status. J. Appl. Microbiol. 2021, 131, 1639–1651. [Google Scholar] [CrossRef]
  7. Katsimichas, A.; Katsouli, M.; Spantidos, N.; Giannakourou, M.C.; Taoukis, P. Effect of High−Pressure Homogenization on the Functional and Emulsifying Properties of Proteins Recovered from Auxenochlorella pyrenoidosa. Appl. Sci. 2024, 15, 131. [Google Scholar] [CrossRef]
  8. Chen, Z.J.; Zhang, X.R.; Jiang, Z.Y.; Chen, X.H.; He, H.Z.; Zhang, X.X. Light/dark cycle of microalgae cells in raceway ponds: Effects of paddlewheel rotational speeds and baffles installation. Bioresour. Technol. 2016, 219, 387–391. [Google Scholar] [CrossRef]
  9. Wang, J.H.; Zhuang, L.L.; Xu, X.Q.; Deantes−Espinosa, V.M.; Wang, X.X.; Hu, H.Y. Microalgal attachment and attached systems for biomass production and wastewater treatment. Renew. Sustain. Energy Rev. 2018, 92, 331–342. [Google Scholar] [CrossRef]
  10. Huang, Y.; Xiong, W.; Liao, Q.; Fu, Q.; Xia, A.; Zhu, X.; Sun, Y. Comparison of Chlorella vulgaris biomass productivity cultivated in biofilm and suspension from the aspect of light transmission and microalgae affinity to carbon dioxide. Bioresour. Technol. 2016, 222, 367–373. [Google Scholar] [CrossRef]
  11. Wang, J.; Liu, J.; Liu, T. The difference in effective light penetration may explain the superiority in photosynthetic efficiency of attached cultivation over the conventional open pond for microalgae. Biotechnol. Biofuels 2015, 8, 49. [Google Scholar] [CrossRef] [PubMed]
  12. Gross, M.; Jarboe, D.; Wen, Z.Y. biofilm-based algal cultivation systems. Appl. Microbiol. Biotechnol. 2015, 99, 5781–5789. [Google Scholar] [CrossRef]
  13. Abinandan, S.; Subashchandrabose, S.R.; Venkateswarlu, K.; Megharaj, M. Microalgae−bacteria biofilms: A sustainable synergistic approach in remediation of acid mine drainage. Appl. Microbiol. Biotechnol. 2018, 102, 1131–1144. [Google Scholar] [CrossRef]
  14. Ye, Y.; Huang, Y.; Xia, A.; Fu, Q.; Liao, Q.; Zeng, W.; Zheng, Y.; Zhu, X. Optimizing culture conditions for heterotrophic−assisted photoautotrophic biofilm growth of Chlorella vulgaris to simultaneously improve microalgae biomass and lipid productivity. Bioresour. Technol. 2018, 270, 80–87. [Google Scholar] [CrossRef] [PubMed]
  15. Tong, C.Y.; Derek, C.J.C. A Methodological Review on the Characterization of Microalgal Biofilm and Its Extracellular Polymeric Substances. J. Appl. Microbiol. 2022, 132, 3490–3514. [Google Scholar] [CrossRef]
  16. Karimi, Z.; Laughinghouse, H.D.; Davis, V.A.; Blersch, D.M. Substrate properties as controlling parameters in attached algal cultivation. Appl. Microbiol. Biotechnol. 2021, 105, 1823–1835. [Google Scholar] [CrossRef]
  17. Polizzi, B.; Bernard, O.; Ribot, M. A time−space model for the growth of microalgae biofilms for biofuel production. J. Theor. Biol. 2017, 432, 55–79. [Google Scholar] [CrossRef] [PubMed]
  18. Yuan, H.; Wang, Y.; Lai, Z.; Zhang, X.; Jiang, Z.; Zhang, X. Analyzing microalgal biofilm structures formed under different light conditions by evaluating cell–cell interactions. J. Colloid Interface Sci. 2021, 583, 563–570. [Google Scholar] [CrossRef]
  19. Fanesi, A.; Paule, A.; Bernard, O.; Briandet, R.; Lopes, F. The architecture of monospecific microalgae biofilms. Microorganisms 2019, 7, 352. [Google Scholar] [CrossRef]
  20. Wilking, J.N.; Zaburdaev, V.; De Volder, M.; Losick, R.; Brenner, M.P.; Weitz, D.A. Liquid transport facilitated by channels in Bacillus subtilis biofilms. Proc. Natl. Acad. Sci. USA 2013, 110, 848–852. [Google Scholar] [CrossRef]
  21. Fanesi, A.; Lavayssiere, M.; Breton, C.; Bernard, O.; Briandet, R.; Lopes, F. Shear stress affects the architecture and cohesion of Chlorella vulgaris biofilms. Sci. Rep. 2021, 11, 4002. [Google Scholar] [CrossRef] [PubMed]
  22. Wang, Y.; Jiang, Z.; Lai, Z.; Yuan, H.; Zhang, X.; Jia, Y.; Zhang, X. The self−adaption capability of microalgal biofilm under different light intensities: Photosynthetic parameters and biofilm microstructures. Algal Res. 2021, 58, 102383. [Google Scholar] [CrossRef]
  23. Zhang, X.; Yuan, H.; Wang, Y.; Guan, L.; Zeng, Z.; Jiang, Z.; Zhang, X. Cell Surface Energy Affects the Structure of Microalgal Biofilm. Langmuir 2020, 36, 3057–3063. [Google Scholar] [CrossRef]
  24. Cheng, P.; Wang, J.; Liu, T. Effects of nitrogen source and nitrogen supply model on the growth and hydrocarbon accumulation of immobilized biofilm cultivation of B. braunii. Bioresour. Technol. 2014, 166, 527–533. [Google Scholar] [CrossRef]
  25. Cheng, P.; Wang, Y.; Osei−Wusu, D.; Wang, Y.; Liu, T. Development of nitrogen supply strategy for Scenedesmus rubescens attached cultivation toward growth and lipid accumulation. Bioprocess Biosyst. Eng. 2018, 41, 435–442. [Google Scholar] [CrossRef]
  26. Wu, X.; Cen, Q.; Addy, M.; Zheng, H.; Luo, S.; Liu, Y.; Cheng, Y.; Zhou, W.; Chen, P.; Ruan, R. A novel algal biofilm photobioreactor for efficient hog manure wastewater utilization and treatment. Bioresour. Technol. 2019, 292, 121925. [Google Scholar] [CrossRef] [PubMed]
  27. Blanken, W.; Schaap, S.; Theobald, S.; Rinzema, A.; Wijffels, R.H.; Janssen, M. Optimizing carbon dioxide utilization for microalgae biofilm cultivation. Biotechnol. Bioeng. 2017, 114, 769–776. [Google Scholar] [CrossRef]
  28. Zheng, Y.; Huang, Y.; Liao, Q.; Fu, Q.; Xia, A.; Zhu, X. Impact of the accumulation and adhesion of released oxygen during Scenedesmus obliquus photosynthesis on biofilm formation and growth. Bioresour. Technol. 2017, 244 Pt. 1, 198–205. [Google Scholar] [CrossRef]
  29. Asgharnejad, H.; Sarrafzadeh, M.-H.; Abhar−Shegofteh, O.; Khorshidi Nazloo, E.; Oh, H.-M. Biomass quantification and 3−D topography reconstruction of microalgal biofilms using digital image processing. Algal Res. 2021, 55, 102243. [Google Scholar] [CrossRef]
  30. Heydorn, A.; Nielsen, A.T.; Hentzer, M.; Sternberg, C.; Givskov, M.; Ersbøll, B.K.; Molin, S. Quantification of biofilm structures by the novel computer program COMSTAT. Microbiology 2000, 146, 2395–2407. [Google Scholar] [CrossRef]
  31. Ozkan, A.; Berberoglu, H. Physico−chemical surface properties of microalgae. Colloids Surf. B Biointerfaces 2013, 112, 287–293. [Google Scholar] [CrossRef] [PubMed]
  32. Hamadi, F.; Latrache, H.; Zahir, H.; Elghmari, A.; Timinouni, M.; Ellouali, M. The relation between Escherichia coli surface functional groups’ composition and their physicochemical properties. Braz. J. Microbiol. 2008, 39, 10–15. [Google Scholar] [CrossRef] [PubMed]
  33. Van der Mei, H.; Busscher, H. The use of X−ray photoelectron spectroscopy for the study of oral streptococcal cell surfaces. Adv. Dent. Res. 1997, 11, 388–394. [Google Scholar] [CrossRef]
  34. Boonaert, C.J.; Rouxhet, P.G. Surface of lactic acid bacteria: Relationships between chemical composition and physicochemical properties. Appl. Environ. Microbiol. 2000, 66, 2548–2554. [Google Scholar] [CrossRef] [PubMed]
  35. Li, T.; Podola, B.; Melkonian, M. Investigating dynamic processes in a porous substrate biofilm photobioreactor—A modeling approach. Algal Res. 2016, 13, 30–40. [Google Scholar] [CrossRef]
Figure 1. Experimental setup for culturing microalgae biofilms under different nutrient supplies.
Applsci 15 05104 g001
Figure 2. The biofilm images generated by Zen software (a1f1) and reconstructed by MATLAB software (a2f2). (g) The determined surface roughness of these biofilms. The lowercase letters of “a, b, c, d” in (g) represent different significance groups. Groups with the same letter are not significantly different from each other, while groups with different letters are significantly different.
Applsci 15 05104 g002
Figure 3. The z−projection images (af) for the biofilms cultured under different nutrient supplies (BG11, BG11+glycerine, BG11+NaHCO3, BG11+urea, BG11+NH4Cl, and BG11+NaNO3). (g) The determined biofilm porosity. The lowercase letters of “a, b, c, d” in (g) represent different significance groups.
Applsci 15 05104 g003
Figure 4. The FTIR spectra for the surfaces of microalgae cells cultured with different nutrient supplies (BG11, BG11+glycerine, BG11+NaHCO3, BG11+urea, BG11+NH4Cl, and BG11+NaNO3).
Applsci 15 05104 g004
Figure 5. The contents of functional groups C–(C, H) (a) and C–(O, N) (b) on the surfaces of cells cultured at different nutrient supplies (BG11, BG11+glycerine, BG11+NaHCO3, BG11+urea, BG11+NH4Cl, and BG11+NaNO3).
Applsci 15 05104 g005
Figure 6. Schematic showing the mechanism in forming different biofilm microstructures under different nutrients.
Applsci 15 05104 g006
Disclaimer/Publisher’s Note: The statements, opinions and data contained in all publications are solely those of the individual author(s) and contributor(s) and not of MDPI and/or the editor(s). MDPI and/or the editor(s) disclaim responsibility for any injury to people or property resulting from any ideas, methods, instructions or products referred to in the content.

