Article

Assessment of Photogrammetric Performance Test on Large Areas by Using a Rolling Shutter Camera Equipped in a Multi-Rotor UAV

by
Alba Nely Arévalo-Verjel
1,*,
José Luis Lerma
1,
Juan Pedro Carbonell-Rivera
2,
Juan F. Prieto
3 and
José Fernández
4
1
Grupo de Investigación en Fotogrametría y Láser Escáner (GIFLE), Departamento de Ingeniería Cartográfica, Geodesia y Fotogrametría, Universitat Politècnica de València, Camino de Vera s/n, 46022 Valencia, Spain
2
Integrated Remote Sensing Studio, Department of Forest Resources Management, Faculty of Forestry, University of British Columbia, Vancouver Campus, Vancouver, BC V6T 1Z4, Canada
3
Grupo de Investigación en Geovisualización, Espacios Singulares y Patrimonio (GESyP), Universidad Politécnica de Madrid, Ctra. Valencia km 7, 28031 Madrid, Spain
4
Institute of Geosciences (IGEO), CSIC-UCM, Calle del Doctor Severo Ochoa, 7, Ciudad Universitaria, 28040 Madrid, Spain
*
Author to whom correspondence should be addressed.
Appl. Sci. 2025, 15(9), 5035; https://doi.org/10.3390/app15095035
Submission received: 17 March 2025 / Revised: 29 April 2025 / Accepted: 29 April 2025 / Published: 1 May 2025
(This article belongs to the Special Issue Technical Advances in UAV Photogrammetry and Remote Sensing)

Abstract

:
The generation of digital aerial photogrammetry products using unmanned aerial vehicle-digital aerial photogrammetry (UAV-DAP) has become an essential task due to the increasing use of UAVs in the world of geomatics, thanks to their low cost and spatial resolution. Therefore, it is relevant to explore the performance of new digital cameras equipped in UAVs using electronic rolling shutters instead of ideal mechanical or global shutter cameras to achieve accurate and reliable photogrammetric products, if possible, while minimizing workload, especially for their application in projects that require a high level of detail. In this paper, we analyse performance using oblique images along the perimeter (3D perimeter) on a flat area, i.e., with slopes of less than 3%. The area was photogrammetrically surveyed with a DJI (Dà-Jiāng Innovations) Inspire 2 multirotor UAV equipped with a Zenmuse X5S rolling shutter camera. The photogrammetric survey was accompanied by a Global Navigation Satellite System (GNSS) survey, in which dual frequency receivers were used to determine the ground control points (GCPs) and checkpoints (CPs). The study analysed different scenarios, including the combination of forward and transversal strips and oblique images. After examining the ideal scenario with the least root mean square error (RMSE), six different combinations were analysed to find the best location for the GCPs. The most significant results indicate that the optimal calibration of the camera is obtained in scenarios including oblique images, which outperform the rest of the scenarios for achieving the lowest RMSE (2.5x the GSD in Z and 3.0x the GSD in XYZ) with optimum GCPs layout; with non-ideal GCPs layout, unacceptable errors can be achieved (11.4x the GSD in XYZ), even with ideal block geometry. The UAV-DAP rolling shutter effect can only be minimised in the scenario that uses oblique images and GCPs at the edges of the overlapping zones and the perimeter.

1. Introduction

UAV-based digital aerial photogrammetry (UAV-DAP) has become common worldwide due to its easy operation, time saved in data capture, low cost of data acquisition, and high spatial and temporal resolution compared to other photogrammetric techniques [1]. This technique uses SfM (Structure from Motion) algorithms that have been extensively tested and included in user-friendly programmes [2]. SfM is based on the sequential acquisition of 2D images to reconstruct 3D scene geometry [3]. When a point is visible in two or more images, correspondences are sought between the observations of this point in the different images. These represent the projection of the same 3D point in different images. Collinearity equations are solved by this technique without the addition of GCPs, considering that these equations can be solved in an arbitrary coordinate system. Therefore, flight conditions, overlapping images, different flight heights, or camera angles can modify processing and results [4].
UAV-DAP is used in various areas of geomatics, such as mapping or land surveying. This technique is more economical and straightforward in comparison with airborne laser scanning (ALS) [5] and superior to surveying methods in terms of data acquisition and time-saving in fieldwork [6,7]. UAV-DAP can reach places that are difficult to access and terrains with a significant variation in slope, as the flight height can be changed to achieve greater spatial resolution [8,9]. Another of the main advantages of using UAV-DAP is that by simply equipping it with a RGB (Red, Green, Blue) camera, it is possible to obtain photogrammetric products such as 3D point clouds, digital elevation models (DEMs), digital terrain models (DTMs) [10], orthomosaics, and 3D restitutions. In this sense, DTMs are one of the most essential resources for generating derived maps such as contours [11], hydrological analyses [12,13,14,15,16], visual basins [17], landslides [18,19,20], subsidence analysis [21,22], and longitudinal profiles [23]. Also, with multispectral cameras, it is possible to classify species of trees and shrubs in forests [24,25]. Due to the inherent relevance of UAV-DAP-derived products, obtaining high accuracy in some critical works is of great significance.
UAVs can be classified as fixed-wing or multirotor, depending on their structure. Fixed-wing UAVs have more extended flight autonomy (over one hour with a single battery [26]) and require high flight altitudes and flight speeds due to aerodynamics, and usually, lower spatial resolution deliverables are obtained and can cover a greater area, but this equipment is costly, and some problems might arise in case of emergency situations. Multirotor UAVs usually yield higher spatial resolution due to lower altitude and slower speed, can be easily operated in narrow areas, and are less expensive, but at the cost of reduced flight time, as most of these devices have a battery duration of 15 to 30 min [27]. This is a limiting factor for covering large areas, and optimal flight planning is required to cover these areas with the lowest possible battery consumption without compromising the photogrammetric outputs’ resolution.
Several aspects must be considered when planning flights, influencing the accuracy of the products obtained from UAV measurement:
  • Flight planning parameters, including: (1) flight height: this determines the spatial resolution of the registered images and the number of images per unit area [28]; the greater the height, the lower the spatial resolution, but the larger the area that can be covered. When detailed models are required, low flight heights are recommended [29]; (2) speed: high speed may capture blurry images and affect the UAV’s stability and manoeuvrability; (3) Ground Sample distance (GSD): this indicates the size represented by a pixel on the terrain [30] and is directly related to height, as the GSD is higher at greater heights, leading to lower spatial resolution; and (4) overlap: this is the partial superposition between two photographs in a frontal and lateral way. Increasing the percentage of overlapping provides better accuracy and optimises the object’s shape. Photogrammetric software, such as PIX4D [31] and Agisoft Metashape [32], suggests that images be acquired with a forward overlap > 75% and lateral overlap equal to 60%. However, when an overlap of 90% is exceeded, the stereoscopic vision is lost in the photogrammetric reconstruction [28], increasing the processing time.
  • Georeferencing involves aligning spatial data or images with a specific geographic location using a coordinate reference system. This can be achieved through two main methods: direct and indirect georeferencing.
    Direct georeferencing is performed using a UAV equipped with an RTK (Real-Time Kinematic) system, which relies on a Global Navigation Satellite System (GNSS). In this method, the camera shutter is synchronised with the GNSS receiver, allowing each image to be geotagged at the moment of capture.
    Alternatively, the indirect method incorporates Ground Control Points (GCPs) for georeferencing and Checkpoints (CPs) for quality control [8]. Both GCPs and CPs can be measured using GNSS receivers or total stations. When high-precision instruments are used, this approach significantly reduces systematic errors in the final output. It is crucial to place GCPs and CPs at different locations, as the 3D model is optimised to the GCPs, resulting in minimal residual errors at those specific points [28].
    To ensure optimal accuracy, a topographic survey should be conducted, with GCPs and CPs strategically distributed throughout the study area;
  • There is the adoption of cameras equipped with mechanical rolling shutters or global shutters, which are ideal for photogrammetry, instead of electronic rolling shutters [33,34]. In UAV applications, electronic shutters are widely used due to their higher burst shooting speeds, which enable rapid image capture in fast-moving scenarios, and their lack of mechanical wear ensures durability and reliability in high-vibration environments. These characteristics make electronic shutters particularly suitable for tasks such as video recording, documentation, and non-metric surveys. Despite their advantages, electronic shutters can suffer from rolling shutter distortion, causing skewing or artifacts during fast UAV movements or when capturing fast-moving objects [35]. Most cameras equipped on low-to-mid-range UAVs have a rotating shutter (this type of shutter currently occupies the UAV camera market). This makes them more affordable because they have a lower cost compared to UAVs with a mechanical shutter.
    The disadvantage of this type of shutter is that, when taking images, the image sensor is exposed line by line, which can introduce additional distortions in the image space, as the UAV navigates at a relatively high speed during aerial acquisitions. This implies that the electronic shutters have a small delay between the top and bottom of the image.
    Since version 2.1, Pix4Dmapper Pro has implemented a rotating shutter correction model that corrects for this offset. It must be corrected when the vertical offset is greater than 2 pixels. Other photogrammetric software also has this type of correction, such as Agisoft metashape and MicMac [34].
    The correction model takes into account the movement of the camera positions. These different camera positions for each row are approximated by applying a linear interpolation between the two camera positions at the beginning and at the end of the image reading. They work best on quadcopter-type UAVs;
  • Another aspect is including oblique images along the perimeter. These images can play a dual role: first, aiding in the accurate calibration of the camera (e.g., when combined with orthogonal images [29,36]), and second, enhancing accuracy results. Using oblique images with a zigzag flight pattern five-camera UAV (five directions of photography: vertical, forward, left, right, and backwards, according to a certain angle) in an urban area with buildings resulted in a 30% improvement in precision compared to traditional flights [37]. The angle of the camera inclination may affect the results when oblique images are incorporated [38]. Oblique images with an angle of 30° are used to minimise the systematic error and the doming effect for 1 to 2 magnitudes without using GCPs. Table 1 presents several studies conducted in flat areas using nadir, nadir, and oblique images where presented values of horizontal RMSE between 1 and 3 times (x) the GSD (mean and median of 1.7x) and a vertical RMSE between 1 and 4.5x the GSD (mean of 2.3x and median of 2.0x) have been reported; the last three columns represent the accuracy achieved related to GSD.
Remarkably, very few studies currently verify whether oblique perimeter images in corridor flight improve the precision of photogrammetric models on flat areas using cameras equipped with electronic rolling shutters. For this reason, the authors assess the effects of using oblique images on flat terrains, as this is offered by some flight planning software such as Drone Deploy mobile version 5.48.0 [46]. This software recently incorporated a “crosshatch mode” in flight planning, which joins oblique images as a grid over the whole block, combining this image with a 3D perimeter to [46] improve the edges. Therefore, this paper presents the independent work behind the results presented in [45] for flat areas, using nadiral images and analysing up to four flight scenarios, despite it being the same working area. The project planning is new and incorporates oblique images and additional GCPs/CPs, data acquisition with nadiral and oblique images, and complementary GCPs-CPs observations, and the photogrammetric block is processed as a single project for 0.8 km2, instead of four 20 ha photogrammetric subblocks eventually integrated into one larger one summing 0.8 km2.
Considering the aspects mentioned above, this study aims to evaluate the impact of employing a camera equipped with an electronic rolling shutter with different flight strategies by modifying key parameters in flight planning, such as including transverse strips with different flight heights or oblique perimeter imagery. The following scenarios were studied: (A) forward strips (commonly used); (B) forward strips combined with a strip along the whole perimeter of the block with the camera at 65° (oblique images); (C) forward strips combined with cross strips on the edges of each block at different heights; and (D) forward strips plus cross strips on the edges plus a strip around the whole perimeter with the camera at 65°. In addition, six configurations were made to select the best location for the GCPs and ultimately ensure the generation of reliable photogrammetric products.

2. Materials and Methods

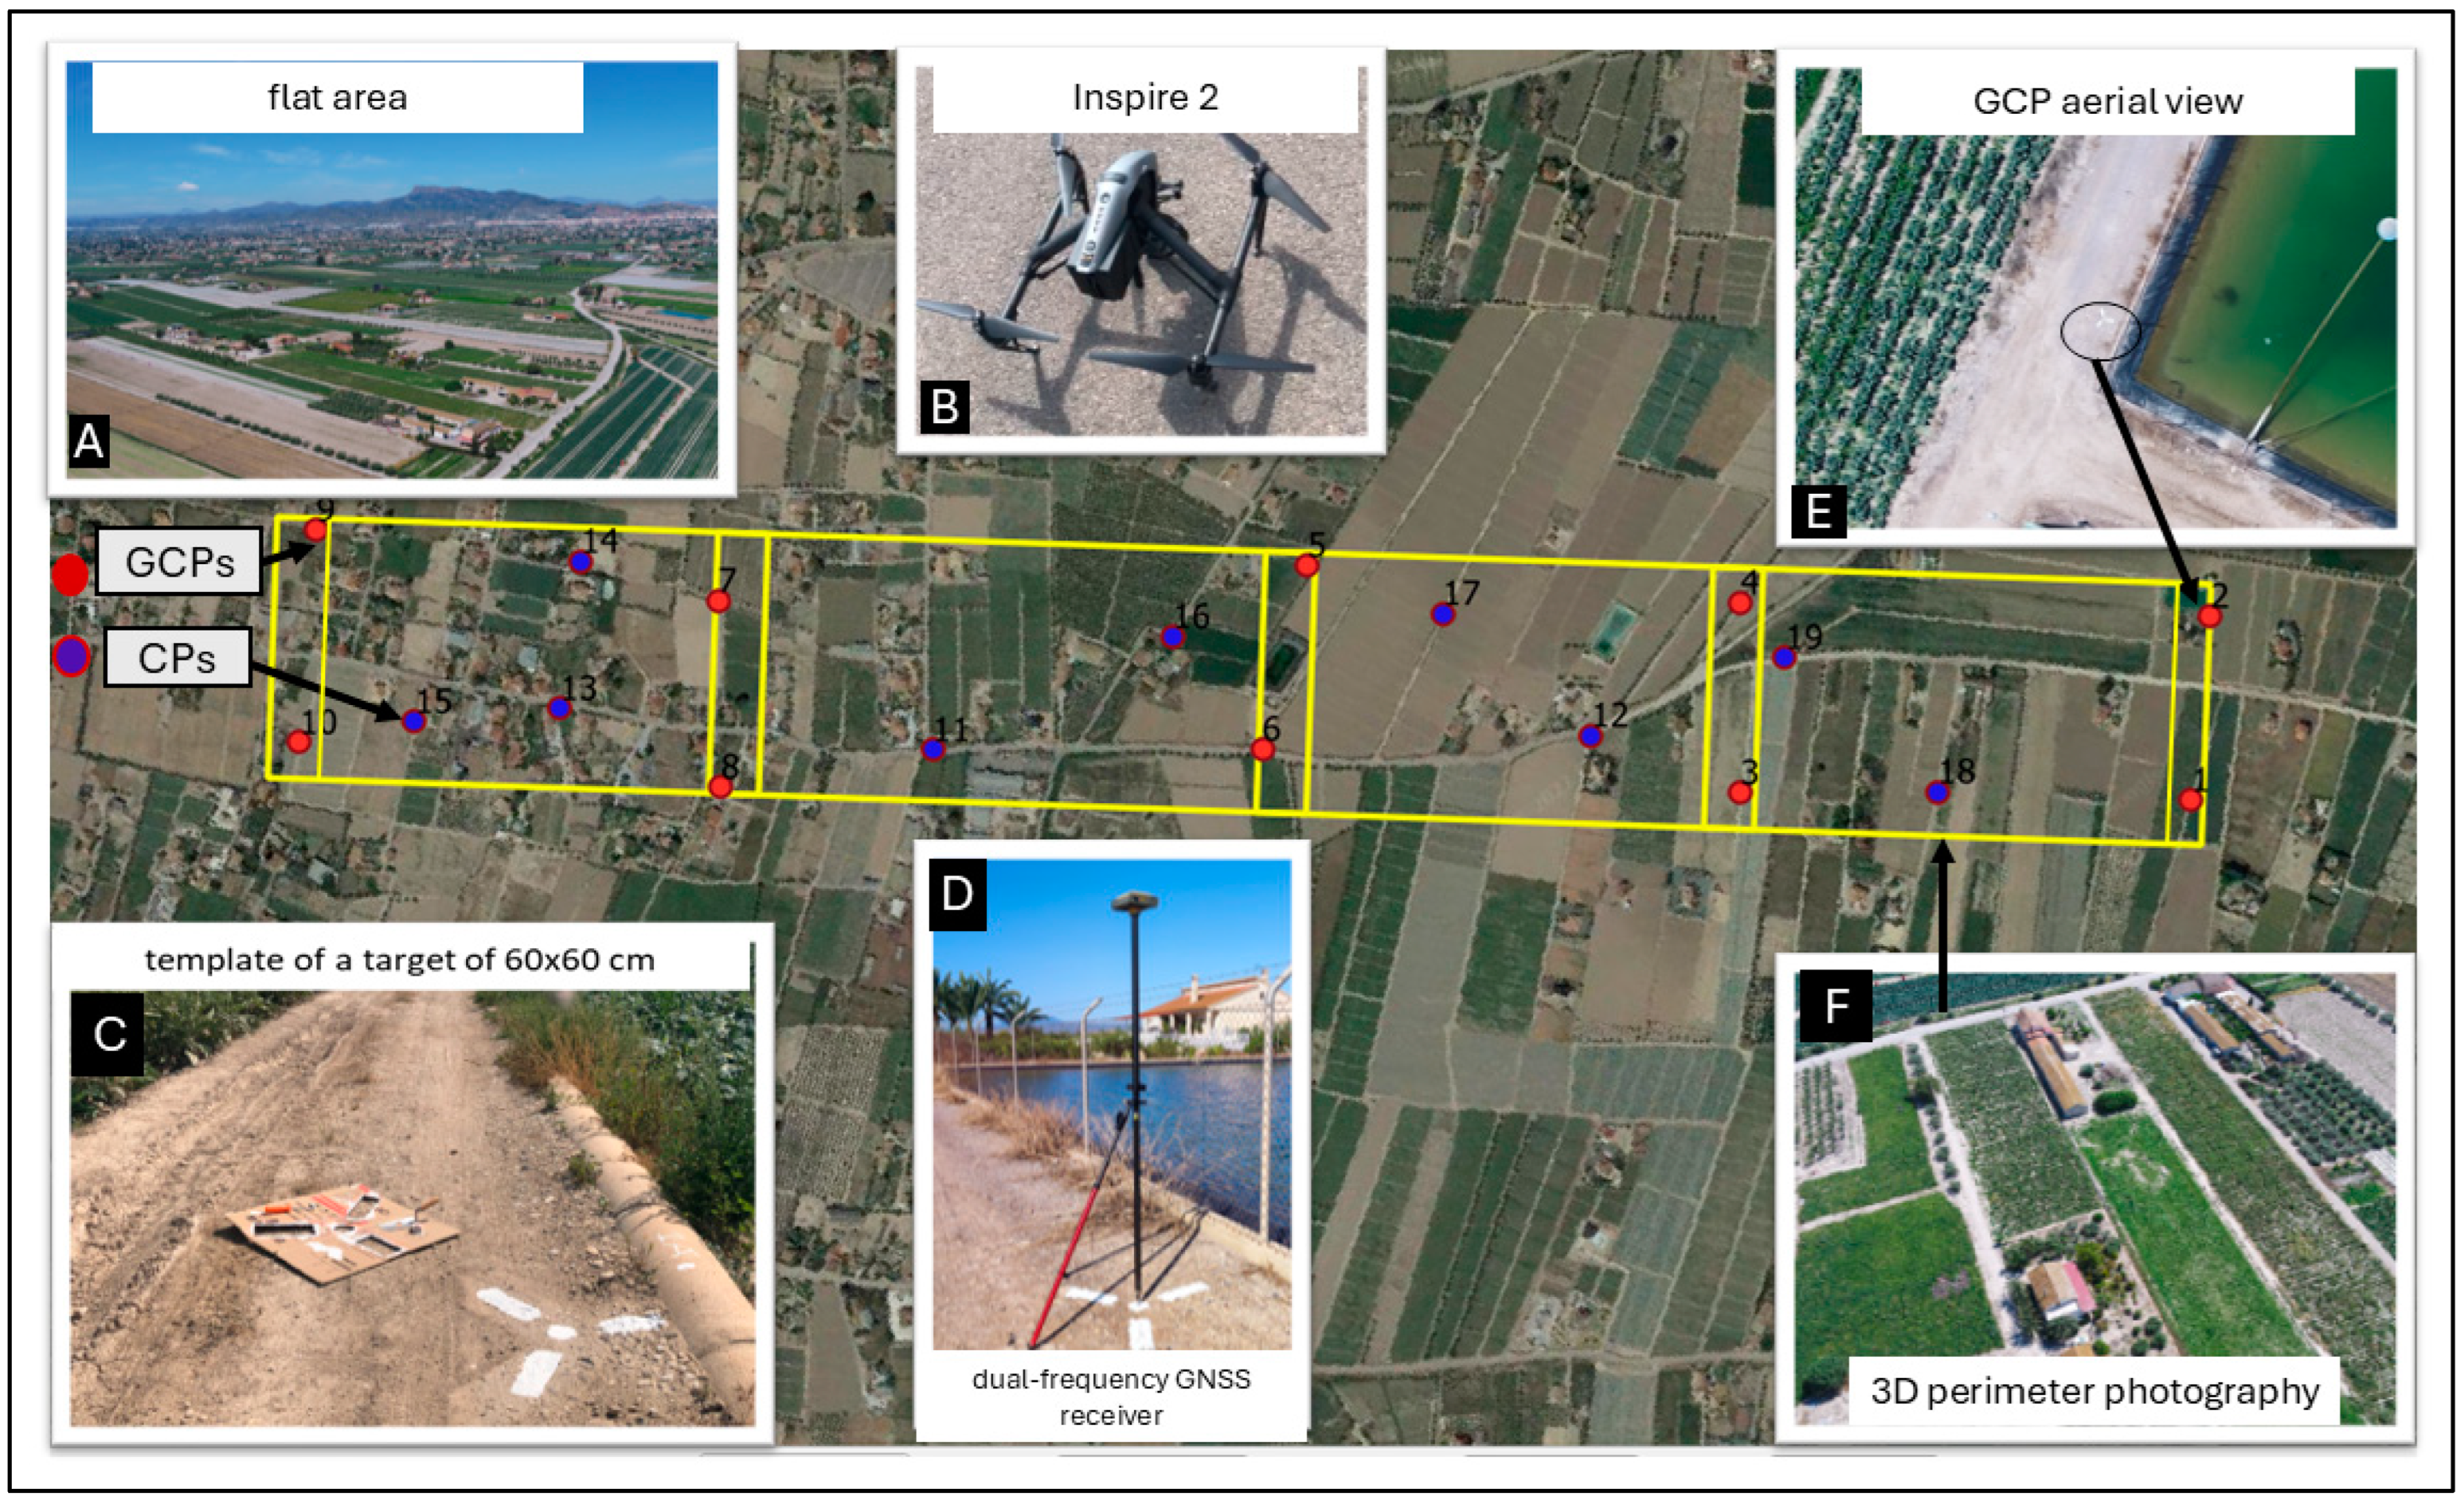
The study zone is located in Lorca (Murcia, Spain) (Figure 1),with the geographic coordinates 37°39′5.4″ N, 1°39′38.8″ W, and an average altitude of 298 m above sea level. The photogrammetric survey was projected for an area of 0.8 km2 and was carried out on 15 May 2022, in the hours around midday to avoid shadows. The weather conditions were characterised by a mean temperature of 22 °C, clear skies, an average wind speed of 1.1 km/h, and an average relative humidity of 42% [47]. The study area is flat and has a less than 3% gradient, as shown in Figure 1. For this research, the photogrammetric software used was PIX4Dmapper version 4.9.0 for image processing. Additionally, the DroneDeploy application was used for flight scheduling. The following is a description of the stages that constitute the data collection and data processing campaigns.

2.1. GNSS Campaign

On May 16 and 17, 2022, a GNSS data collection campaign was carried out, consecutively to the UAV campaign. The primary aim of this campaign was to obtain the coordinates of the GCPs and CPs using the GNSS geodetic positioning technique. The georeferencing of these points follows the methodology described by [45,49,50]. The GCPs were located on the edges of the block, and the CPs were distributed in the central part as in Arévalo-Verjel et al’s study. [45]. Prior flights, GCPs, and CPs were marked with a 60 × 60 cm template using reflective white paint (Figure 2C,E). The centre was marked with a survey nail, which will be reused in future campaigns. The observations were made using Topcon Hiper dual frequency GNSS receivers (GPS (Global Positioning System) + GLONASS (Global’naya Navigatsionnaya Sputnikovaya Sistema), having a nominal precision of 3 mm + 0.1 ppm horizontally and 3.5 mm + 0.4 ppm vertically in post-processing static (PPS) GNSS relative mode. The antenna was mounted on a tripod, and centred and levelled on the mark on the point (Figure 2D). A total of ten GCPs and nine CPs were measured. The observation time at each point was 15–20 min per session, with a double session observation at each exchanging receiver between both sessions in order to avoid any bias associated with antennas or receivers. The observation method used was the relative static method by carrier phase differences. The choice of this GNSS observation method, although much more laborious both in the field and in the laboratory than RTK methods, allowed us to obtain a level of precision one order greater than that of the points to be compared. Special care was taken to ensure that the GCPs were on the edges of each block and that the CPs were distributed in the central part. The meteorological conditions during the GNSS campaign were as follows: the average temperature was 22 °C, with no precipitation on either day. The average wind speed was 1.5 km/h, and the average relative humidity was 48%.

GNSS Processing

To ensure greater precision in the results, precise geodetic models of antenna calibrations and ionosphere correction were downloaded from the CODE (Centre for Orbit Determination in Europe). In addition, precise ephemerides from the IGS (International GNSS Service) for the GPS and GLONASS constellations were used, as these two constellations were the ones used by the receivers in the campaign. With these GNSS data recorded in the field, data were also processed adding 22 continuous stations in the southeast of the Iberian Peninsula belonging to the regional networks in the Murcia Region (REGAM and ME-RISTEMUM) and ERGNSS-IGN (National Geographic Institute), with 24-h of observation forming 30 vectors during fifteen days. This was performed to tie the local measurements to a stable regional reference framework. This group of reference stations includes the continuous stations ALHA, LRCA, and MAZA. These three CORS (Continuous Operating Reference Station) are between 3.8 km and 31.3 km from our area. The choice of three permanent stations allows us to have greater repeatability of the solutions in case one of them malfunctions in future campaigns. Of course, in the adjustment of the network, the different weighting of the baselines based on the distances and the variances in the determinations of the baselines were taken into account.
The final adjustment of the network was loosely constrained, taking into account the regional velocity field developed previously in the study by Fernandez et al. [49].
The GNSS vectors were processed with the Leica Infinity (V3) software [51], using absolute antenna calibration models and VMF (Vienna Mapping Functions) [52]. The coordinates of the points on the network in the ETRS 89 geodetic system were adjusted with the Geolab PX5 software [50,53].

2.2. Image Acquisition

To avoid the inclusion of errors due to weather conditions, the UAV and GNSS field campaigns were conducted under optimal conditions. In the case of GNSS observations, atmospheric conditions, such as ionospheric and tropospheric disturbances, can introduce errors in satellite signal propagation, affecting positional accuracy [54]. To minimise these errors, data acquisition was performed under clear skies and stable atmospheric conditions. For UAV photogrammetry campaigns, weather factors like wind, the presence of clouds, or rain play crucial roles [55]. Adequate lighting is essential for capturing high-quality images; poor lighting conditions, such as overcast skies or low sun angles, can result in shadows and low-contrast images that hinder photogrammetric analysis. Wind can also significantly impact UAV operations; strong winds can destabilise the UAV, making it difficult to maintain a consistent flight path and potentially leading to blurred or misaligned images. Additionally, rain can adversely affect UAV flights in several ways: it can obscure camera lenses, causing blurry images; can compromise the UAV’s electronic systems through moisture infiltration; and can create reflective surfaces on the ground that distort the data. These weather factors collectively influence the overall quality and accuracy of the data collected during UAV photogrammetry missions, making it necessary to choose optimal weather conditions for conducting these surveys.
The images were acquired using a DJI (Dà-Jiāng Innovations Science and Technology Co., Ltd. Shenzhen, China) Inspire 2 multirotor UAV (Figure 2B) equipped with a Zenmuse X5S camera. This camera features a 4/3 sensor with dimensions of 17.3 × 13 mm and a resolution of 5280 × 3956 pixels, resulting in a pixel size of approximately 3.28 × 3.28 μm. The X5S is equipped with an electronic rolling shutter with speeds ranging from 8 s to 1/8000 s. The flight was planned using the DroneDeploy application [46], which divided the area into four blocks of 0.2 km2 to optimise battery use. In addition, the 3D perimeter was activated in all the blocks in the flight plan. The DroneDeploy app offers an option to capture images with an angle of 65° (Figure 2F). The flight was conducted in a visual line of sight (VLOS) scenario using different flight heights with a maximum of 120 m, as specified by Spanish regulation [56], and a flight speed of 14.5 m·s−1.
The recommendations of specific studies [57,58,59,60] were followed for the flight planning, adding cross strips on the edges of each block.
Table 2 contains the parameters used in the configuration of the blocks, including the forward and side overlap, height flight, area of each block, GSD, and number of images. Therefore, it can be seen that the forward overlap was programmed at 80% and the lateral overlap at 60%, following the recommendations of the Pix4D photogrammetric software. The cross strips were shared in the adjacent blocks with a height of 110 m to combine the images with different heights.

2.3. Photogrammetric Processing

The images were processed using the PIX4Dmapper software version 4.9.0 (Pix4D S.A, Prilly, Switzerland). The hardware has the following specifications: CPU: Intel(R) Core (TM) i7-4770 @ 3.40GHz, RAM: 16GB, GPU: NVIDIA GeForce GTX 1650, operating system Windows 10 Pro, 64-bit.
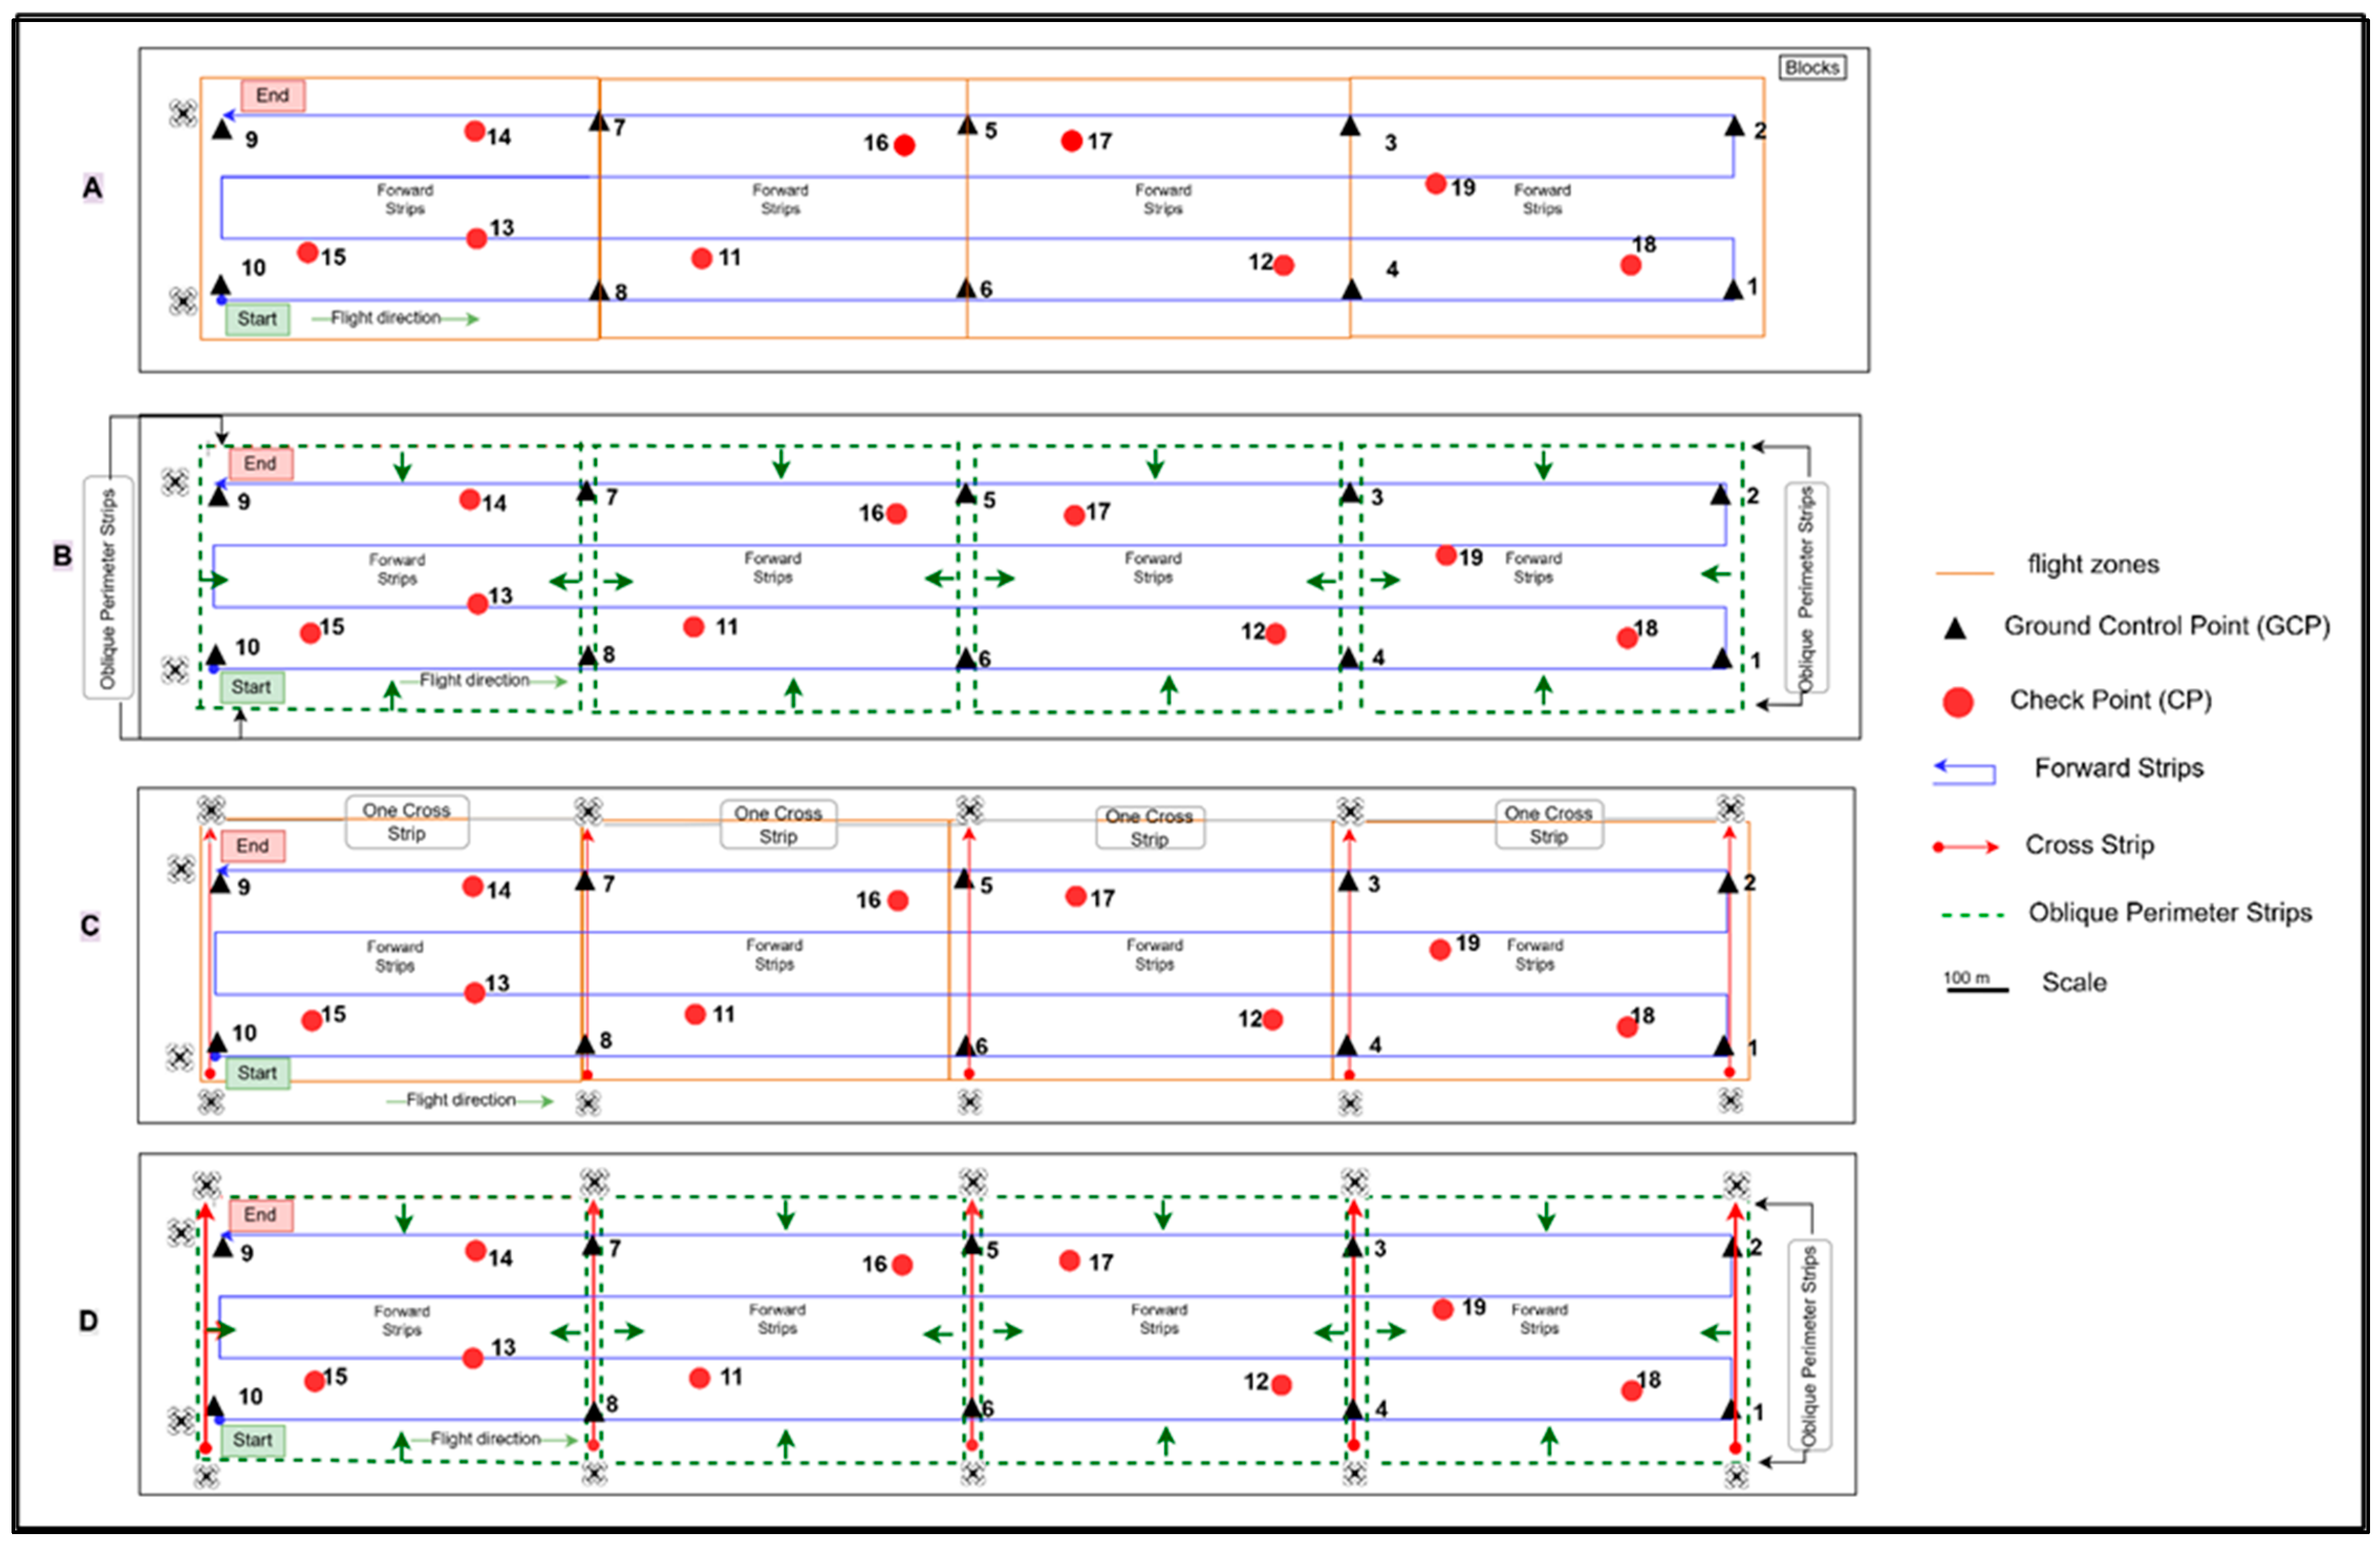
The images corresponding to each scenario were processed in a single project configured as follows in Figure 3:
SCENARIO A: This comprised forward strips (hf) at a height of 120 m, using corridor flight, used in most flight application software (Figure 3A);
SCENARIO B: This comprised forward strips combined with oblique perimeter images in each block (Figure 3B);
SCENARIO C: This comprised forward strips combined with cross strips on the edges of each block at the height of 110 m (hc, cross-flight height) (Figure 3C), as proposed by the authors of [58,59];
SCENARIO D: This comprised forward strips combined with oblique perimeter images and a cross strip on the edges of each block — Scenarios B + C (Figure 3D).
The parameters used in the adjustment were similar to those used in [60,61];
  • Key image scale: this was adjusted in total (as recommended in [31] because it establishes the full-scale image and gives better results), making it possible to define the size of the image where the key points were extracted in the initial comparison with the images [62];
  • Matching image pairs: the aerial grid or corridor optimised the coincidence of pairs for the flight paths on the aerial grid;
  • Targeted number key points: these were automatic, allowing the automatic selection of the key points to be extracted;
  • Calibration: to evaluate the influence of rolling shutter compensation, calibration was performed both with the compensation enabled and using the “Fast readout” mode, which does not apply it;
  • Rematch: this was automatic, allowing more coincidences to be added and improving the reconstruction quality [31].
Camera outer orientation was performed after the internal orientation in order to calculate the coordinates and determine the position of the cameras concerning the reference system of terrestrial coordinates [34]. This process was carried out through indirect georeferencing using GCPs.
The GCPs were used to improve the orientation of the images and to transform the coordinates of the block into absolute coordinates. The CPs were used to assess the geometric accuracy. The internal calibration parameters of the cameras were reviewed to verify if an improvement in accuracy was achieved by adding oblique images to the model.

2.4. Camera Calibration Parameters

Photogrammetric calibration is an important process for metric reconstruction in UAV flights because it guarantees the precision and quality of the images in short-range photogrammetric measurements [63]. The strips at different heights aid in the correct calibration of the camera [37]. This calibration uses image functions to determine the parameters’ values for the camera’s internal orientation. Pix4Dmapper takes the metadata of each image to obtain the camera’s internal parameters, which define the geometry of the camera’s lens and sensor. The correlation between these parameters describes how closely they are related [31]. Optimally, these parameters should be independent, especially when characterising the interior orientation of a new camera. However, the correlation between these parameters helps detect problems occurring in the project. The self-calibration process is based on self-consistency functions over several views of a 3D scene [34].
The following parameters were considered during the autocalibration process carried out by PIX4Dmapper [31]:
  • f: Calibrated principal or focal distance (in pixels);
  • R1, R2, R3: Radial distortion coefficients (dimensionless), generally shallow values;
  • cx, cy: Principal point coordinates, that is, coordinates of lens optical axis interception with the sensor plane (in pixels);
  • T1, T2: Lens tangential distortion coefficients generally have a lesser degree of magnitude than radial distortion (dimensionless).
Pix4Dmapper uses the initial camera calibration to adjust internal parameters such as focal length, principal point, and radial and tangential distortions, and external parameters such as camera position and orientation. A calibration model must be within 5% of the optimised value [31]. These parameters were calculated separately for each studied scenario, in order to analyse the incidence of the oblique perimeter images in the process of camera self-calibration. Once these parameters are obtained, indirect georeferencing is applied by adding the GCPs to the project.
Worth noticing is that a substantial improvement in the photogrammetric adjustment would have been achieved by employing 10 internal parameters (10-parameter camera model with 2 affine factors) instead of the 8-parameter model used herein, and an even better improvement would have been achieved by applying the two-step approach presented in [64], depending on the block geometry. In addition, as stated previously, to mitigate potential distortions caused by the rolling shutter effect during image acquisition, Pix4D’s rolling shutter correction algorithm was tested. This algorithm models the camera’s motion during image capture, assuming constant translational and rotational velocity [35].

2.5. Accuracy of the Results

To calculate the a priori horizontal error of a block with 10 GCPs at the edges of Scenario A, Equation (1) proposed by [58] (p. 265) can be used. This equation was conceived for aerial photographs measured with analytical stereoplotters and precision stereocomparators with 8 GCPs at the edges of the block.
The accuracy of the results using UAV-DAP depends on the images’ side lap and end lap, the distribution of the GCPs, and the distribution of the block.
σ B , L   m e a n = 0.83 + 0.05 n s   · σ M , L
where
  • σ B , L   m e a n is the estimated horizontal accuracy of the block (L = XY);
  • n s is the number of forward strips in the block, and
  • σ M , L is the accuracy in a single model (estimated horizontal accuracy of a single model), and is the parameter described in Equation (2):
σ M , L = ± 6 μ ·   m b
where 6 μ = 0.0006 , and m b is the denominator of the photo scale.
m b = h c
where   h is the flying height above ground and c is the focal length.
The a priori vertical error of a block with 10 GCPs at the edges of Scenario A can be calculated with Equation (4).
σ z = ± 6 % · h
where σ z   i s   t h e height error.
Equation (1) can be rewritten for digital photogrammetry with digital sensors as follows in Equation (5):
σ B , L   m e a n = μ x y   ·   σ M , L
where μ x y denotes the weight coefficients depending on the layout of the GCP and the image network after flight planning.
For the calculation of the vertical accuracy a priori, we can use the following Equation (6):
σ B Z = μ Z   ·   σ Z
where μ z denotes the vertical weight coefficients.
The root mean square error (RMSE) Equation (7) is calculated from the differences between the coordinates of the points measured on the ground with GNSS equipment and the coordinates obtained in the photogrammetric adjustment [65].
R M S E = i = 1 n e i 2 n
where e i is the difference of each point for the given direction (original position—computed position).

3. Results

3.1. Results of the Point Coordinate Processing in the Field with GNSS Receivers

Table 3 shows the coordinates and the standard deviations obtained from the GCPs and CPs, in addition to the coordinates of the three continuous stations closest to the study zone. All available stations in the Region of Murcia were processed, including those of the IGN in Alicante, Almería, Albacete, and Cartagena. Information from 15 days of observations in 24 h periods was used for 300 h of observation. The external network utilised is composed of 17 permanent stations.

3.2. Results of the Photogrammetric Flight

The following elements were processed to cover the study area: 868 photographs for Scenario A, where the GCPs were marked on a minimum of 3 and a maximum of 8 photos; 1105 photos for Scenario B, where the GCPs were marked on a minimum of 3 and a maximum of 12 photos; 968 photos for Scenario C where the GCPs were marked on a minimum of 3 and a maximum of 8 photos; and 1205 photos for Scenario D where the GCPs were marked on a minimum of 3 and a maximum of 13 photos.
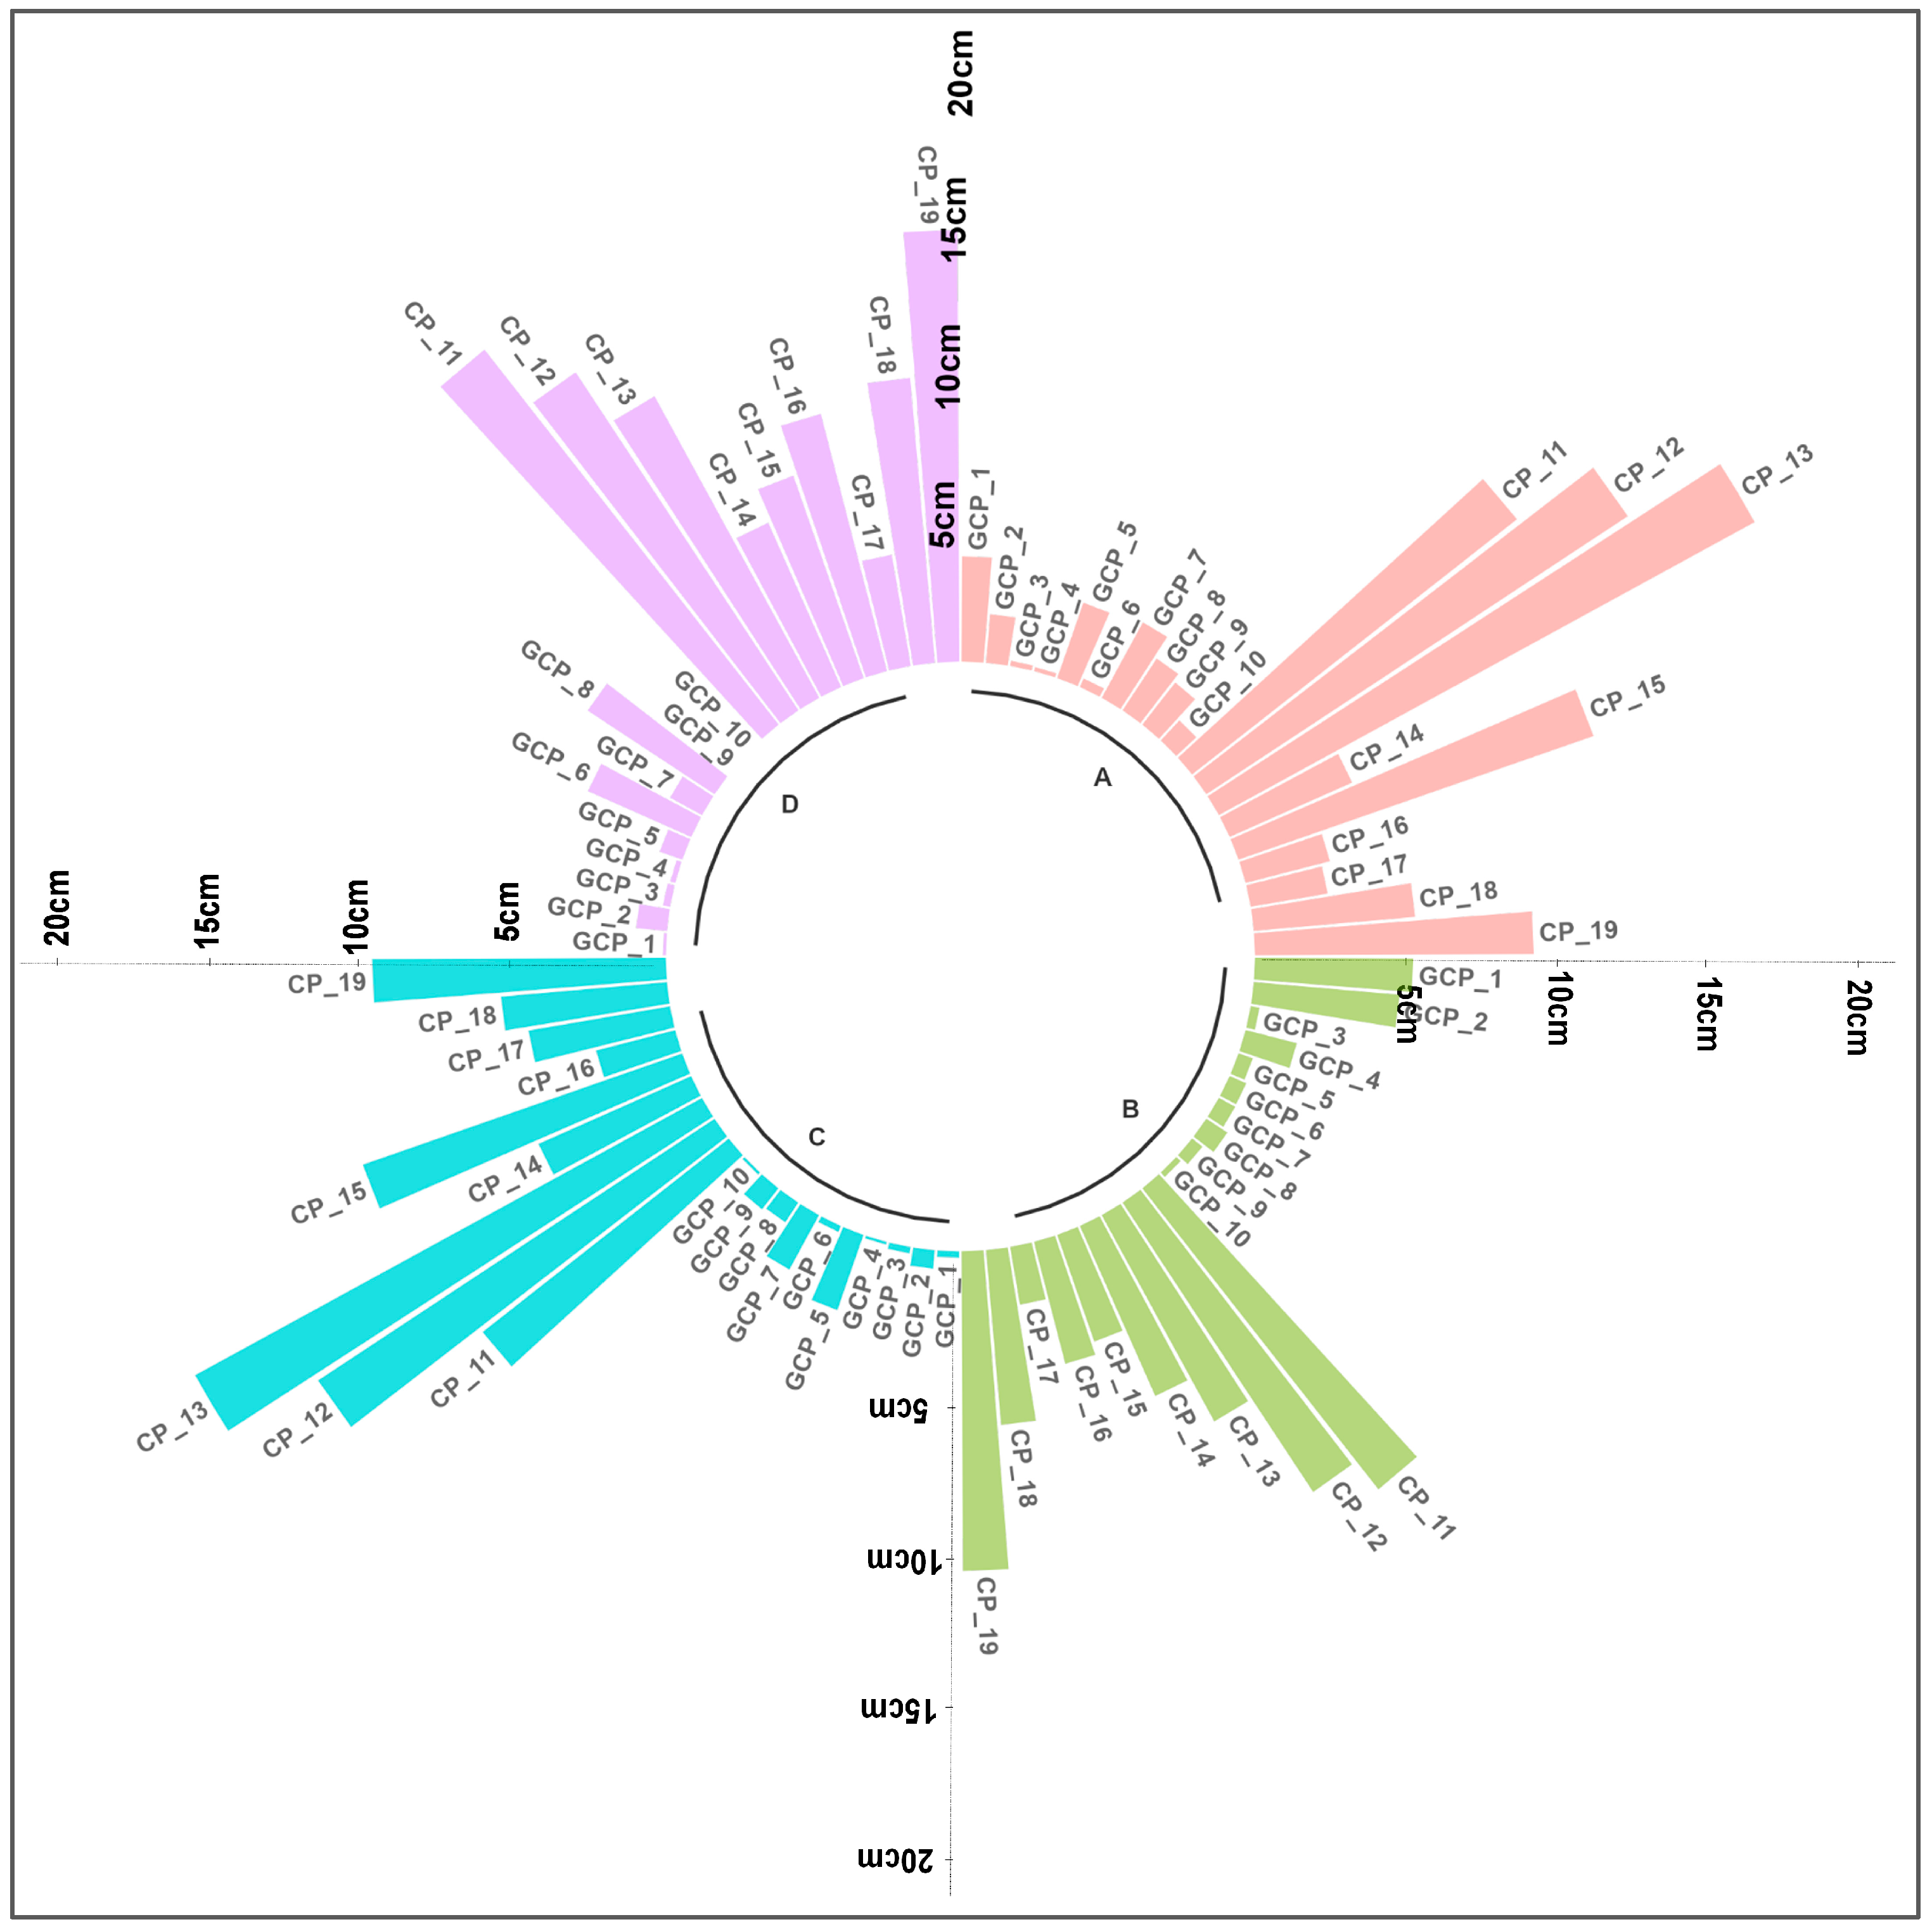
The results of the single error for the GCPs and the CPs for each point in the four scenarios are shown in Figure 4.
The RMSE was calculated using Equation (7), through which the difference between the most accurately measured points (GNSS) and the coordinates of these same points obtained from photogrammetric adjustment was calculated.
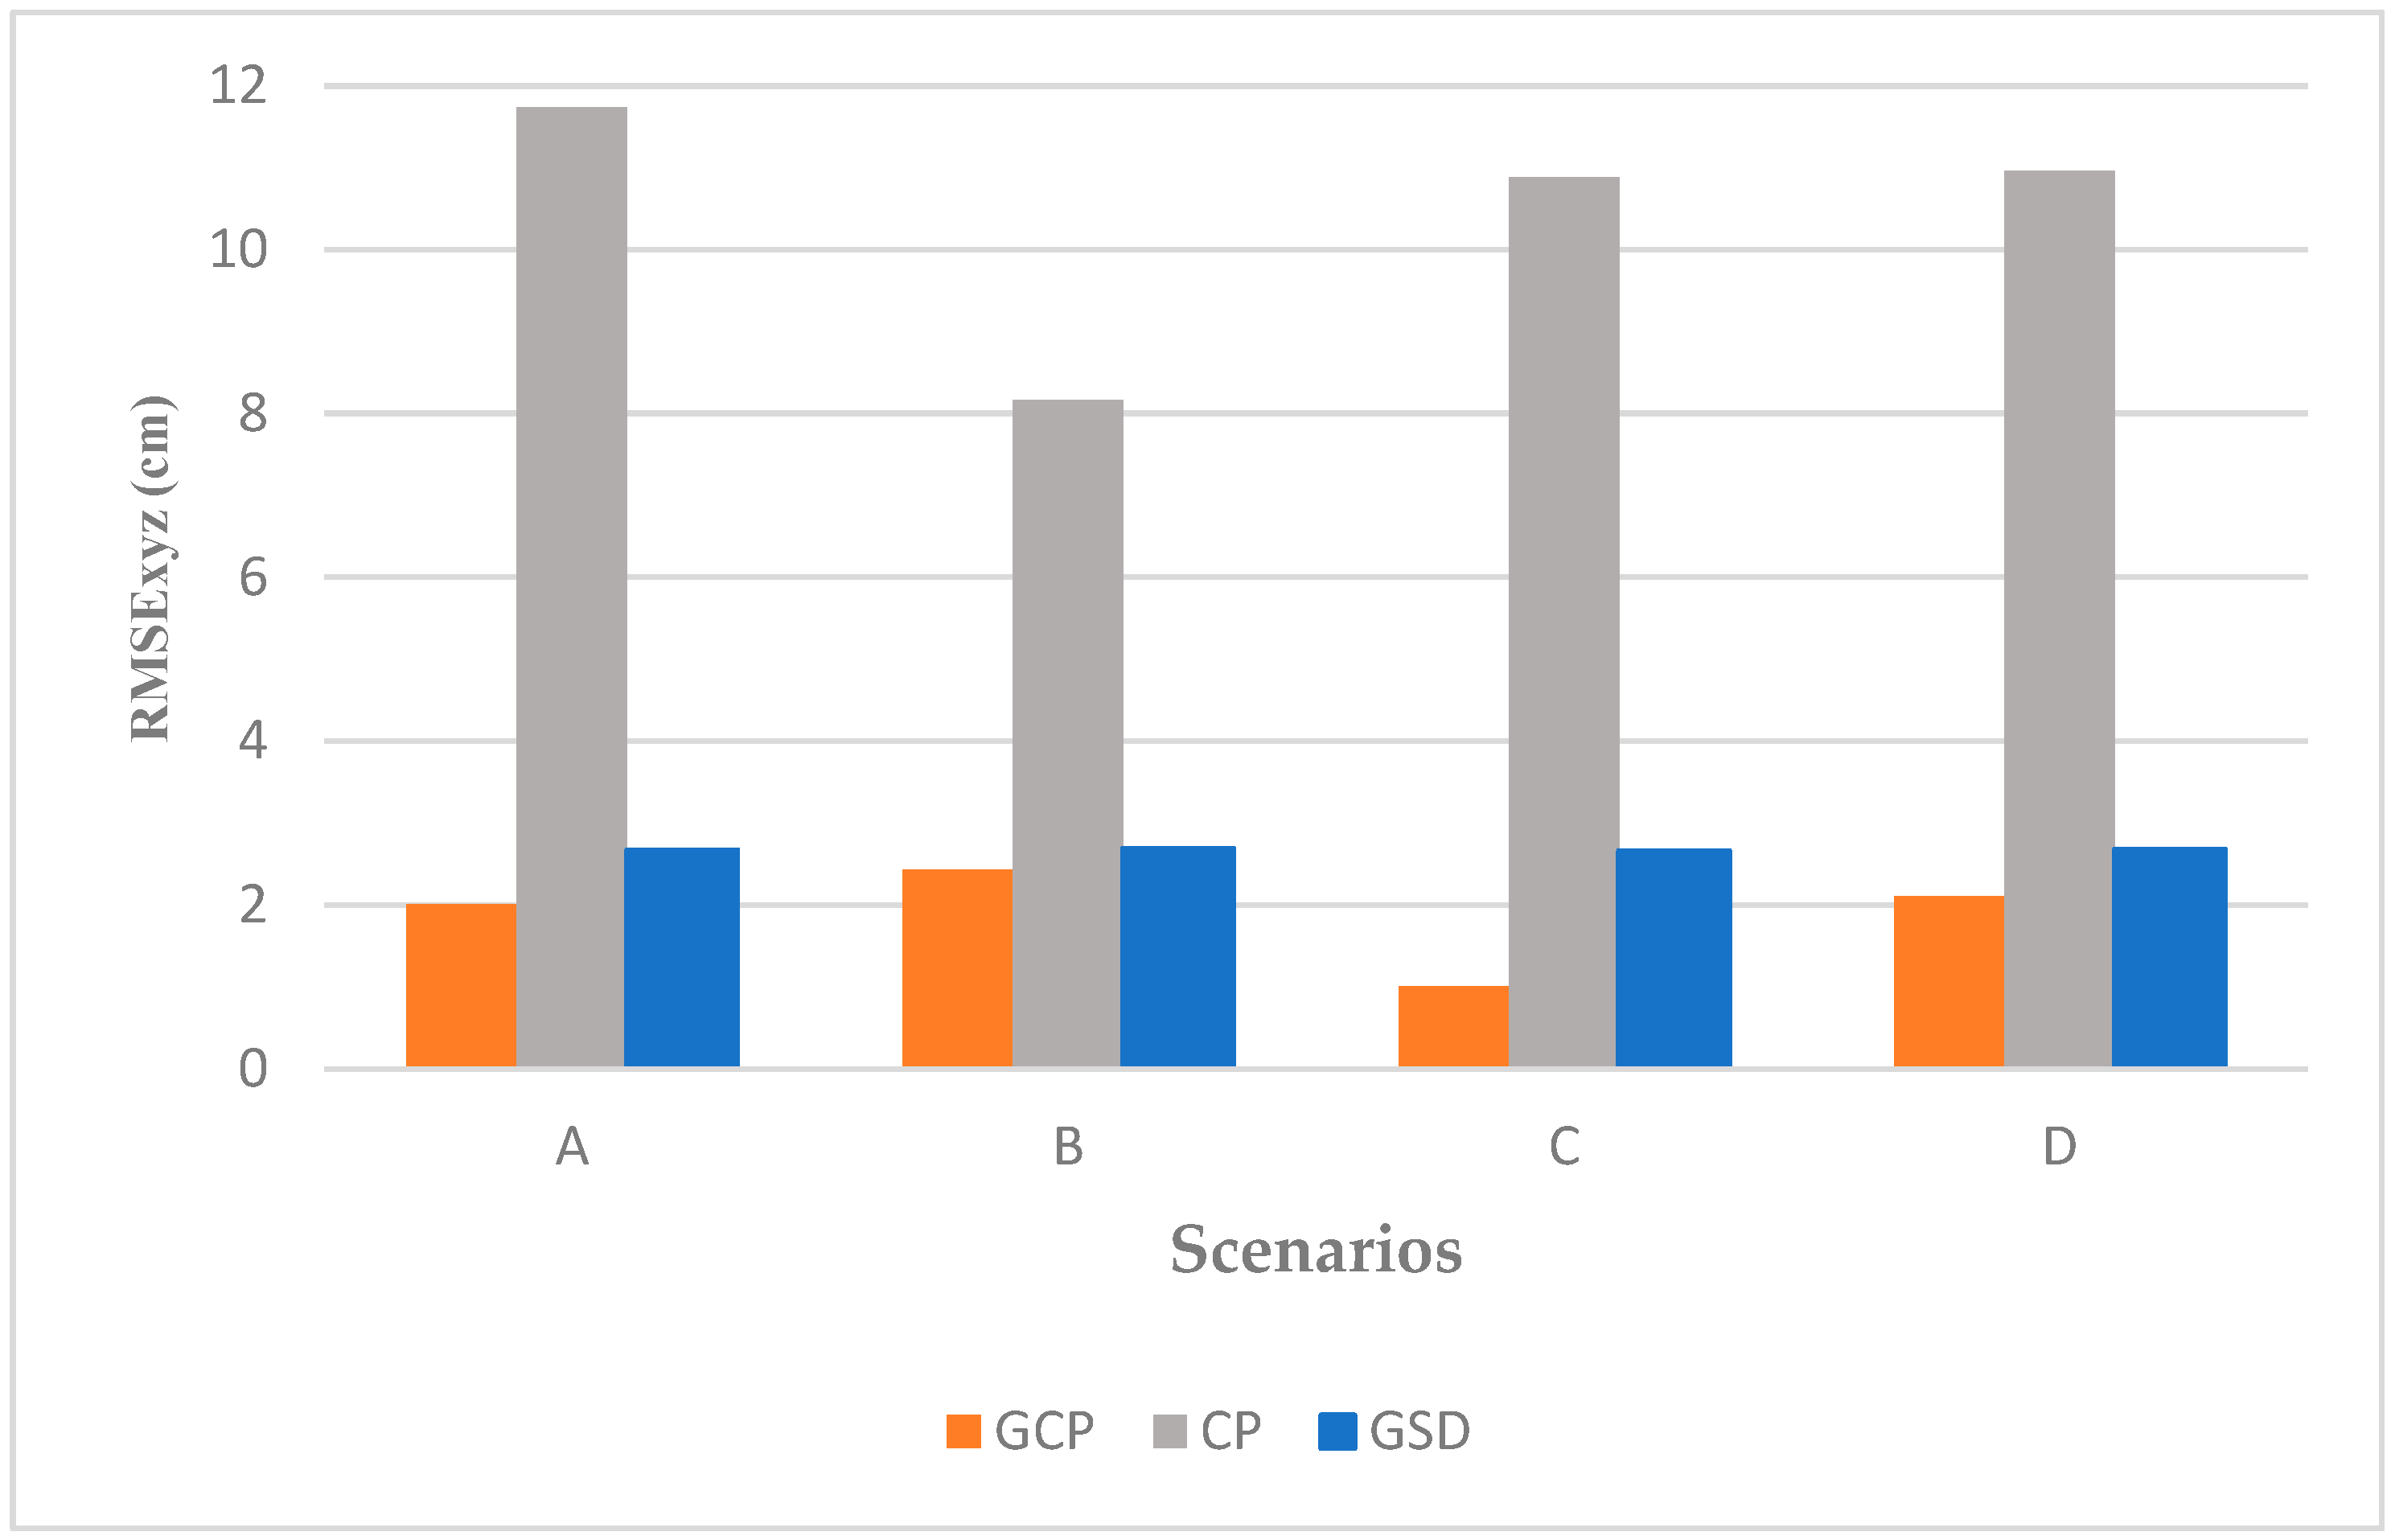
After obtaining the RMSE of the GCPs and CPs separately, as in Figure 4, the RMSE was calculated for each scenario. The results are shown in Figure 5. The maximum and minimum RMSE for the GCPs were found in Scenarios B and C with the values of 2.43 cm and 1.01 cm, respectively, and for the CPs in Scenarios A and B with the values of 11.73 cm and 8.16 cm. The GSD value was the same for all of the scenarios because all the flights were scheduled at the same altitude.
In order to evaluate the effectiveness of the rolling shutter correction model, calibration processes were performed with both compensations enabled and disabled. Table 4 presents the RMSE values for the X, Y, and Z coordinates of the CPs across the four scenarios analysed. The results demonstrate the effectiveness of the rolling shutter correction model implemented in Pix4Dmapper. A comparison of the RMSE values across the scenarios reveals a substantial reduction in error when the rolling shutter correction is applied. For instance, in Scenario A, the RMSE decreased from 40 cm to 1.7 cm in the X direction and from 49 cm to 10.7 cm in the Z direction. Similar improvements were observed in the remaining scenarios.
The single error results for the GCPs and CPs for each point in the four scenarios after applying the rolling shutter compensation are shown in Figure 4.

3.3. Internal Camera Parameters

The camera’s internal parameters define the geometries of the camera’s lens and sensor. These parameters allow users to correct distortion and to obtain more precise information about the geometry of the captured images. Table 5 shows the results of the camera’s internal parameters’ optimisation according to the camera model for the four scenarios. The relative difference between the initial and optimised internal camera parameters obtained for each scenario is as follows: 3.56% for Scenario A, 0.34% for Scenario B, 3.3% for Scenario C, and 0.16% for Scenario D. For the Perspective Lens, it is calculated as the percentage difference between the initial and optimised focal length. This is the first parameter that the Pix4Dmapper software calculates during camera optimisation. If the difference between the estimated value and the initial value of the focal length exceeds 5%, it is considered an indicator of optimisation error, as it could result in an inaccurate geometric reconstruction. This may result in a curved or deformed model, negatively affecting the accuracy of the final project.
The uncertainties (σ) of the camera’s internal parameters are calculated from the covariance matrix derived from the photogrammetry optimisation process. The software relies on the quantity and quality of the images and the available 3D points (or control points) to adjust the photogrammetric model.

3.4. Calculating the a Priori Accuracy Parameters for the Block

The RMSE was calculated separately for the GCPs and CPs to evaluate the results’ horizontal and vertical accuracy. Table 6 shows the values obtained in processing the four scenarios, the GSD, and the reprojection error.
Equation (1) was applied to determine the estimation of the a priori horizontal error of the block; as the block size increases, the number of GCP at the edges should increase. Six strips were made for each block to cover the studied area. For the a priori vertical error, Equation (3) was used with the focal length equalling 15 mm.
To determine the best a priori accuracy calculation equation for photogrammetry with digital sensors, Equations (5) and (6) values for μ x y and μ z were obtained for the four proposed scenarios, as shown in Table 7. These values can be compared in Scenarios A and C, as suggested by the authors [45].

3.5. Configuration of the GCP

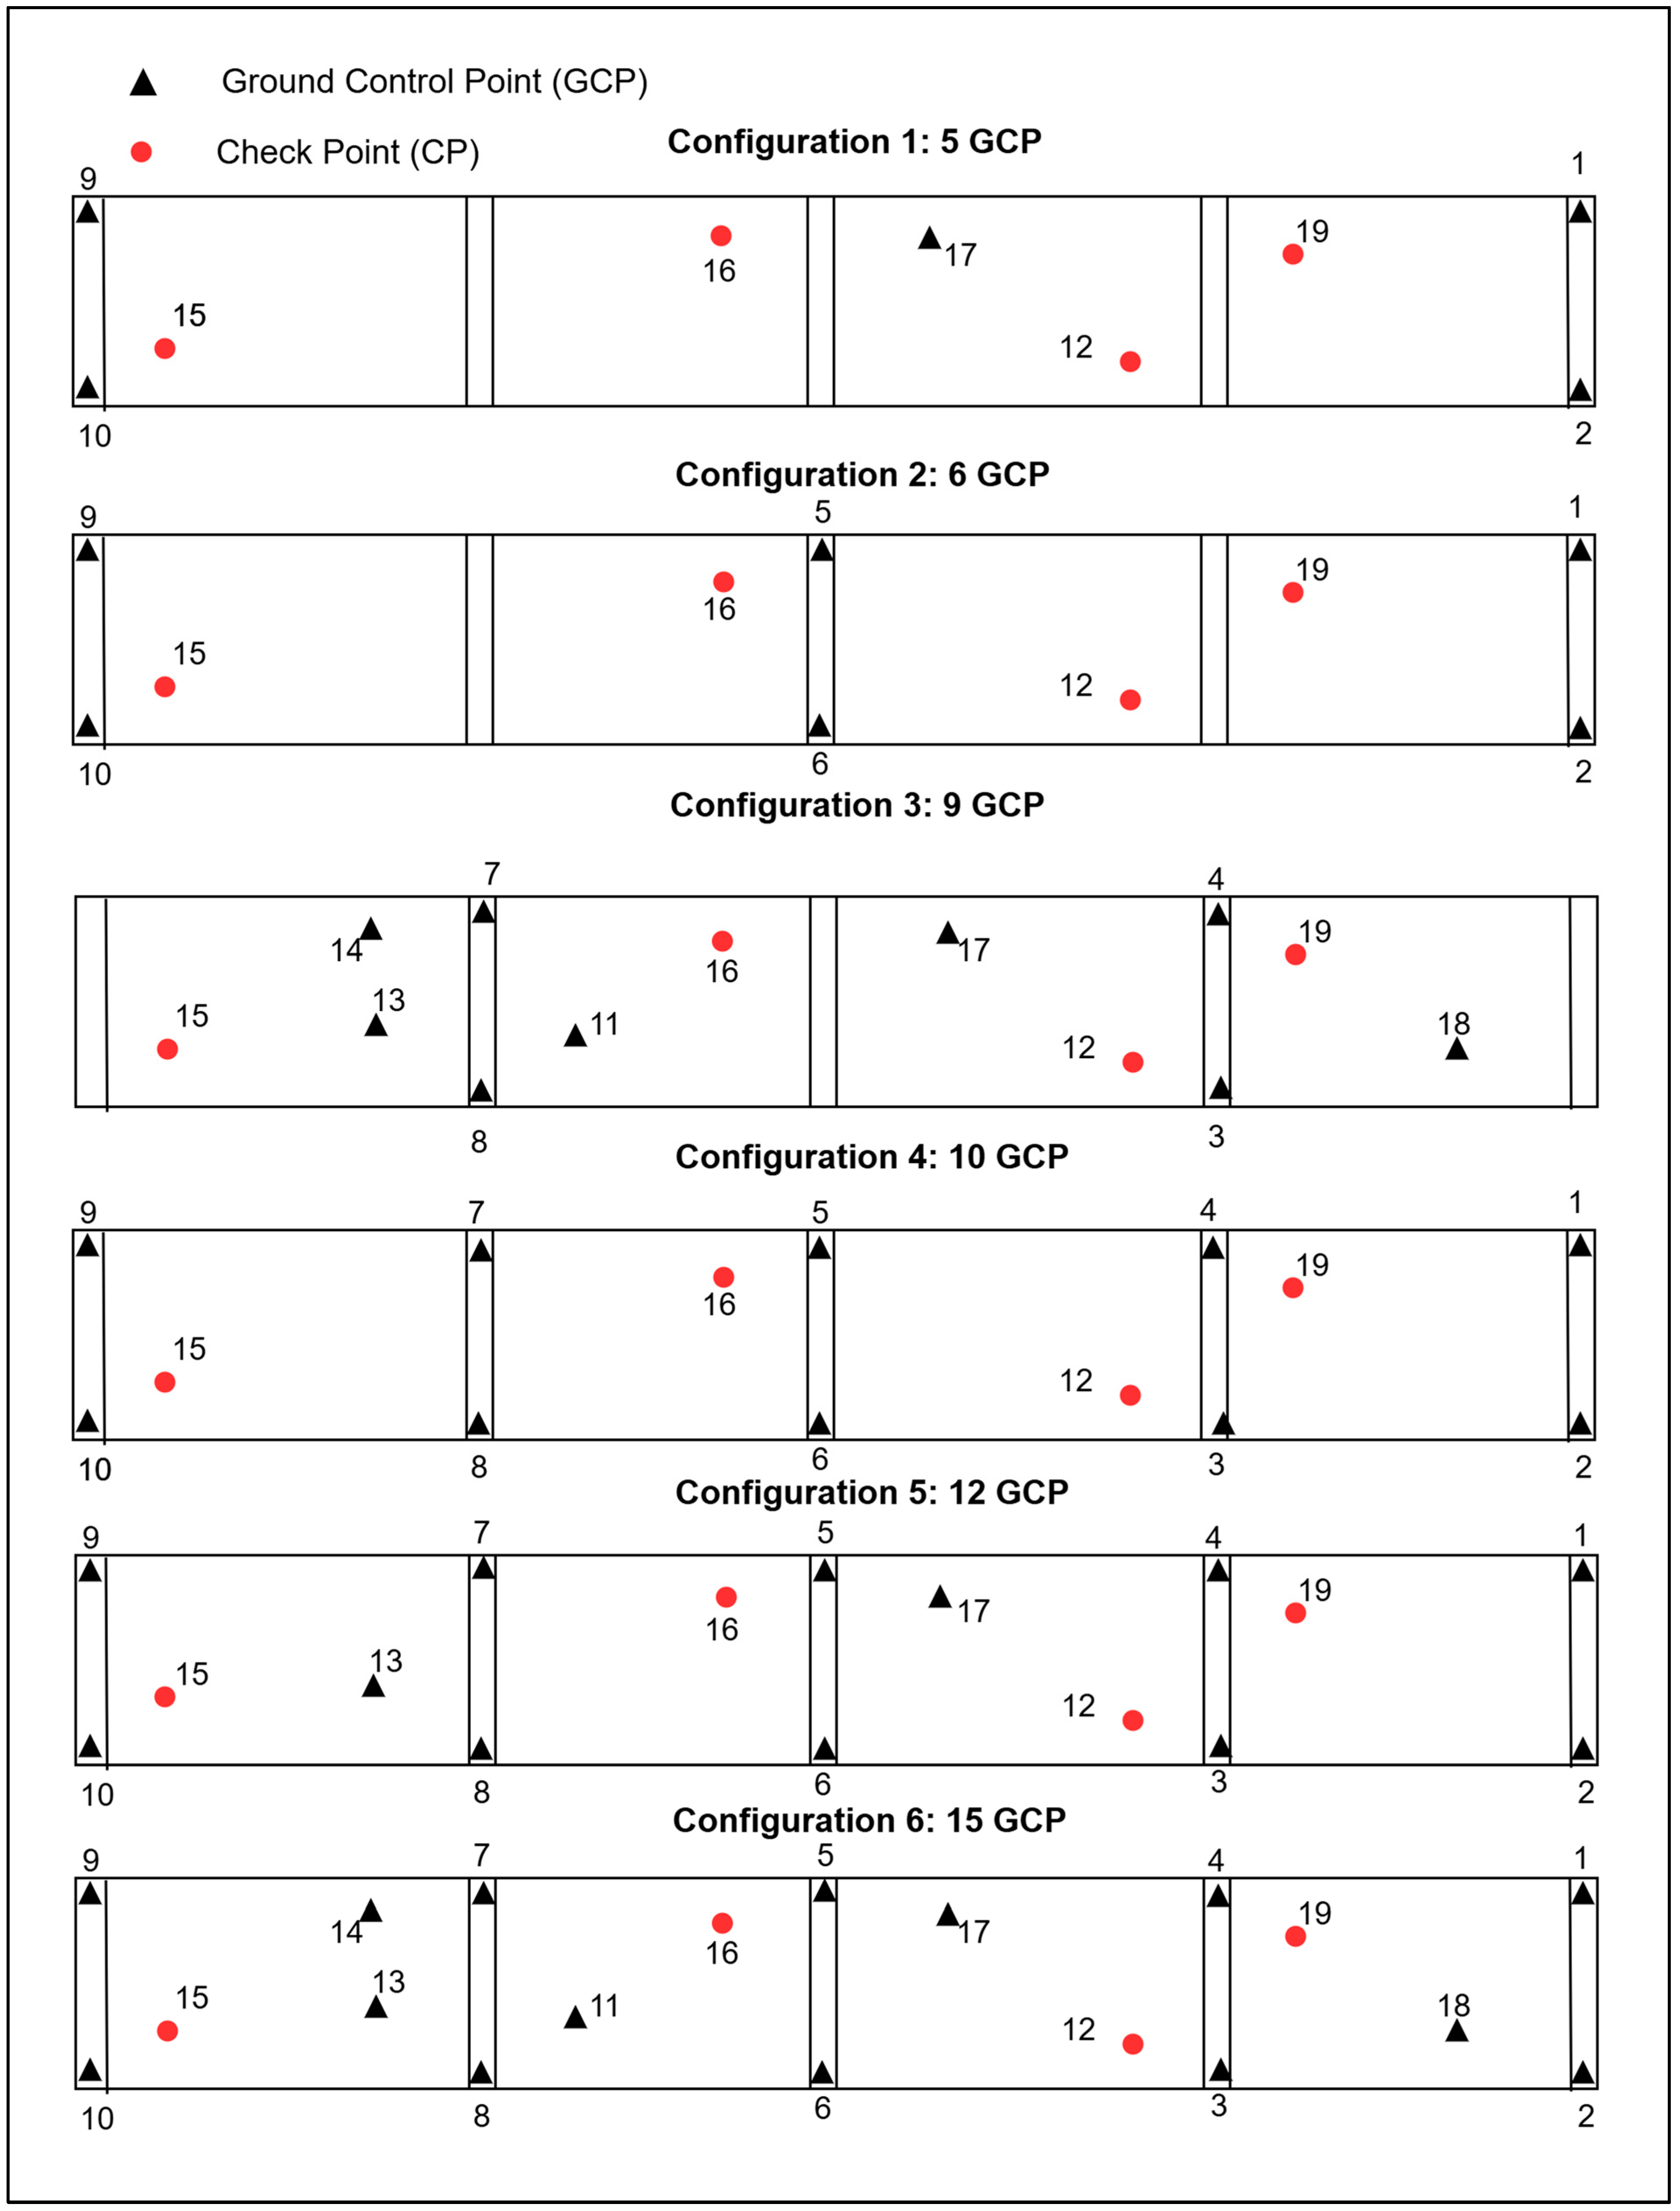
Scenario B was selected to analyse the optimal number and most suitable placement of ground control points (GCPs) within the block, aiming to achieve the lowest mean errors ( μ x y z ) in the check points (CPs). An analysis was conducted by varying the number of GCPs while keeping four CPs fixed, in order to determine the most efficient configuration and to produce photogrammetric outputs with the lowest RMSE. Six different configurations were assessed, and a total of 19 GNSS points were surveyed in the field. Figure 6 illustrates the spatial distribution of the GCPs and CPs across the study area.
The distribution and number of CPs, specifically points 12, 15, 16, and 19, remained constant across all six configurations, in order to ensure objective and comparable results during the evaluation process.
In Configuration 1, GCPs were assigned to points 1, 2, 9, and 10, located at the corners of the block, along with point 17 positioned at the centre. Configuration 2 included points 1, 2, 5, 6, 9, and 10 as GCPs, covering the four corners and two points along the central edges of the block. For Configuration 3, points 3, 4, 7, 8, 11, 13, 14, 17, and 18 were used as GCPs. In Configuration 4, GCPs were assigned to points 1 through 10, all located along the perimeter of the block. Configuration 5 included the same ten perimeter points, along with points 13 and 17. Finally, Configuration 6 comprised a total of 15 points distributed across the block as GCPs.
Figure 7 displays the root mean square error values in the horizontal plane (RMSExy), in elevation (RMSEz), and in three dimensions (RMSExyz) for the check points (CPs) corresponding to each configuration. The results obtained were as follows:
  • Configuration 1: 19.8 cm, 24 cm, and 31 cm; Configuration 2: 36 cm, 20 cm, and 41 cm; Configuration 3: 21 cm, 26 cm, and 33 cm; Configuration 4: 4 cm, 9.7 cm, and 10.4 cm;
  • Configuration 5: 3.9 cm, 9.7 cm, and 10.4 cm; Configuration 6: 3.9 cm, 9.7 cm, and 10.4 cm. Configurations 1 and 3 exhibited the highest RMSE values. In contrast, Configurations 4, 5, and 6 yielded the best results, with low and nearly identical error values. In Configuration 3, all of the GCPs were positioned along the block’s edges, within the standard overlap zone used for the georeferencing of each flight.

4. Discussion

This research determined the accuracy values of photogrammetric flights employing a rolling shutter camera for different flight scenarios, despite it being well-known that rolling shutter cameras are not recommended for UAV-DAP namely at high speed [33,34]. The steps were as follows: (1) analysis of the combinations of forward strips and cross strips at different flight heights and perimeter with oblique images (Section 3.2); (2) defining the appropriate number of GCPs (Section 3.5); and (3) establishing the best location of GCPs in projects on corridors (Section 3.5). To perform an in-depth analysis of the results, a comparison between the results of this research and those found in similar research in flat terrain was generated in Table 1. By using nadir and oblique images, the four scenarios analysed in this study presented values of horizontal RMSE between 1.7 and 7.3x the GSD, and a vertical RMSE between 2.5 and 10.3x the GSD [28]. These results confirm that rolling shutters in DAP-UAV are not recommended to achieve high-accuracy results, which are close to 1.7x the GSD for horizontal RMSE and 3x for the vertical RMSE (Table 1). Only the UAV-DAP rolling shutter effect can be minimised in Scenario B, which uses oblique images and GCPs at the edges of the overlapping zones and the perimeter (Configuration 3).

4.1. Flight Scenarios

Throughout the four analysed scenarios, the RMSE values of the CPs are higher than the GCPs, as these points represent the positioning accuracy of the GCPs. Thus, the lowest residuals are always achieved in the GCPs [44,66]. On the other hand, Mora et al. [39] reported GSD 0.75 cm/pix for an area of 1.7 ha, using nadir images and a ratio of 3 GCPs/ha. Our study found GSD 2.7 cm/pix, using 0.12 GCP/ha for an area of 0.8 km2. This difference is mainly due to the variation between the flight heights of each study since Mora et al. reported a flight height of 45m, and we used a flight height of 120 m. However, when comparing the vertical and horizontal RMSE results for the CPs, Scenario A of this study presents 4x and 1.8x the GSD, resulting in better than the results reported in [39] using a mechanical shutter.
Scenario B showed the best results compared to the other scenarios in this research for the CPs in the vertical RMSE. Scenarios B and D have oblique perimeter images, which, in different studies, have shown an improvement in vertical accuracy [38]. However, Scenario B presented better results than Scenario D, considering that the reduction of systematic errors is attributed to increased angles between homologous rays [67]. Scenario B, composed of forward strips combined with oblique perimeter images at the block edges, produced the lowest vertical RMSE for the CPs, 2.5x the GSD, and a horizontal RMSE equal to 1.7x the GSD. Scenario D presented the vertical RMSE for the CPs at 4.0x the GSD and a horizontal RMSE equal to 2.0x the GSD. A difference between Scenarios B and D was that Scenario D combined various strips with a significant overlap in the same project, which could negatively influence the result. Similarly, Scenario D had a higher battery consumption and required more time for post-processing than Scenario B.
According to reported studies in flat areas where the combination of nadir and oblique images was used (Table 1), Scenario B presents similar results in the value of the RMSE concerning [36,40]. These studies reported a lower flight height than ours and a higher number of GCP/ha. Therefore, using Scenario B, resources can be optimised, and larger areas can be covered. Furthermore, we confirmed that oblique images provide a major key point coincidence per image for studies in flat areas, improving vertical accuracy [37,64,68]. However, Yang et al. (2022) [37] presents the best results overall. The main difference is using oblique images through a special five-camera UAV with a microcontroller device. This implies using non-conventional UAV equipment specially designed for this type of photogrammetric survey.
Another parameter evaluated was the accuracy of the horizontal RMSE. Scenario C, which comprises forward strips and a cross strip at the edges of each block where the GCPs have been located, presented the lowest RMSE in the horizontal direction for the GCPs and CPs (Table 6). These results are consistent with [57,58,59], where the authors hypothesise that the cross strips improve accuracy in the photogrammetric restitution, using less GCP. On the other hand, Scenario A, although it is the most used in UAV-DAP, presents more unfavourable results than those obtained in Scenarios B and C. The same situation occurs in Scenario D.

4.2. Internal Camera Parameters and Block a Priori Accuracy

A lower value in the internal calibration parameters of the camera, shown in Table 5, was observed for Scenarios B and D. These scenarios are characterised by combining nadir and oblique images. They showed the lowest difference between focal length, principal point coordinates, and radial and tangential distortion coefficients during the geometric camera calibration process. Thus, we can deduce that combining nadir and oblique images substantially improves the results in calibrating inner camera parameters, which avoids additional adjustments to improve them. The results correspond to what was stated by the authors of [8], in which these optimised calibration values enhance horizontal and vertical accuracy. Adding oblique images substantially improves the relative difference between the camera’s initial and optimised internal parameters. The authors of [68] reported that the systematic error or dome effect typical of UAVs can be corrected using oblique images instead of GCPs. These images allow for the correction of radial distortion coefficients, thus boosting accuracy and reliability in cartography and photogrammetry.
The weight coefficient μ xyz for GCPs and CPs from the equation described in the methodology measures the accuracy of the results with the UAV-DAP proposed by the authors. This parameter was calculated from Equation 5 for the horizontal estimation and from Equation 6 for the vertical estimation. μ xyz is the total coefficient on the three components.
Scenario C achieved the lowest coefficient in the horizontal estimate, as shown in Table 7, for both GCPs and CPs. Scenario B, containing the oblique images, obtained the lowest coefficient in the vertical estimate in CPs. Additionally, Scenario B presented the best value μ xyz for CPs. Using these values allows for the estimation of the a posteriori accuracy for the beam block adjustment for flat areas in corridor flights.

4.3. GCPs and CPs Distribution

The precision depends mainly on the quantity and strategy for locating the GCPs. An analysis of the results obtained for the six configurations evaluated revealed the following.
Configurations 1 and 2 had very few GCPs, increasing the RMSE in the CPs beyond 30 cm. This value is more than 10x the GSD due to the lack of either control points or strips. Small samples of ground control points (GCPs) can reduce statistical significance and negatively affect the accuracy and reliability of the UAV-generated photogrammetric model.
Configuration 3 has a high RMSE value, similar to the Configuration 1 and 2 values; this occurs by the absence of GCPs in the block edges. This is why GCPs should go along the edges of square and rectangular blocks; in the case of irregular blocks, GCPs should follow a similar distribution [57].
Configuration 4 achieved the best RMSExyz CPs mean value. The authors of [43] analysed different distributions of GCPs in a corridor-shaped photogrammetric block. Several combinations of GCPs were used, but the best results were obtained by locating the GCPs on both sides of the road and one GCP for each edge of the block. This distribution is similar to this study, as it obtained an RMSExy = 3.1 cm and an RMSEz = 8.1 m, while our results left nine points as CPs (Table 6) were RMSExy = 4.5 cm and RMSEz = 6.7 cm. The main difference between [43] and this study is the addition of oblique perimeter images, which improved the RMSEz. Additionally, [43] achieved horizontal and vertical accuracies of approximately 3.5 x the GSD. In this study, the planimetric accuracy was similar (1.7 x the GSD), but the vertical accuracy was better (2.5x the GSD).
Although Configurations 5 and 6 had a higher GCP, the RMSE results did not decrease for Configuration 3, which essentially agrees with [69], which used six to seven GCPs well-distributed throughout the study area. The results were similar to those obtained using 15 GCPs. The same occurs in [70], in which an optimal GCP density was reached, and there was no further decrease in the horizontal and vertical errors.
According to the analysis, Configuration 4 presents the best results of the RMSE CPs. Therefore, it is essential to clarify that the GCPs must be well-distributed to ensure the cross strips cover them and can be captured by the camera at different directions, angles, and heights to correct errors of inclination and distortion.

4.4. Limitations and Potential Solutions

The use of rolling shutter cameras, such as the Zenmuse X5S employed in this study, introduces unique challenges in UAV photogrammetry due to the sequential image capture mechanism [35]. Unlike mechanical or global electronic shutters, rolling shutters expose each image line incrementally rather than simultaneously, which can lead to geometric distortions when the camera or subject is in motion [33]. These distortions, referred previously to as the rolling shutter effect, are not inherently accounted for by traditional photogrammetric models, potentially affecting the accuracy of derived products. This is especially problematic in dynamic environments or at higher UAV speeds, as the standard photogrammetric model does not inherently account for the temporal offsets between image lines. The authors of [35] recommend a flight speed below 4 m/s to reach results that are compatible with the well-accepted practical accuracy bound. As a result, some of the larger residuals observed in the CPs are attributed to uncorrected rolling shutter effects. In fact, Pix4Dmapper estimated a median camera speed of 14.5 m/s. Despite this, the algorithm of rolling shutter mitigation integrated into Pix4Dmapper improved the results across all four scenarios analysed (Table 4). The values obtained in this study after the algorithm application are comparable to those reported in studies using mechanical shutters [39,43]. For the production of more accurate photogrammetric outputs, the use of unmanned aerial vehicles (UAVs) equipped with mechanical shutters is recommended, as this type of shutter exposes the entire image sensor frame to light simultaneously.
This study demonstrates that strategic flight planning, incorporating oblique imagery, and optimising the GCP layout can significantly improve accuracy up to a limit level of 3x the GSD (Scenario B, Configuration 3), even when using the 8-parameter model. These findings highlight the importance of leveraging advanced processing algorithms and thoughtful survey design to overcome hardware limitations in order to achieve acceptable photogrammetric results.

4.5. Terrain Complexity

Photogrammetric surveys in flat areas present several challenges, mainly due to the low variation in terrain elevation. This lack of relief can affect the accuracy of the 3D model, as it limits the spatial information available for the calculation of internal and external camera parameters. Consequently, estimating these parameters may become less robust, compromising the quality of the final photogrammetric product.
The choice of an area with gentle slopes in this study responds to the objective of isolating the impact of key factors such as flight design and the distribution of control points, preventing topographic complexity from introducing interferences in the evaluation. By working on practically flat terrain, external variables that could affect the accuracy of the photogrammetric reconstruction are minimised, which is relevant when analysing the behaviour of cameras with electronic rolling shutters, which are more sensitive to geometric distortions that can be amplified by operating conditions such as flight speed, direction of travel, or the inclination of the captured images.

5. Conclusions

This research has focused on evaluating the accuracy of using a camera equipped with an electronic rolling shutter applied to UAV-DAP on large flat areas, by analysing four scenarios. Combinations of forward strips, cross strips at different flight heights, and convergent perimeter strips were used to assess the accuracy. Scenario B combining forward strips and convergent perimeter strips was the only one that achieved an acceptable RMSEXYZ result for the CPs. Other scenarios cannot be recommended for UAV-DAP with a rolling shutter camera.
Furthermore, the scenarios combining forward strips and convergent perimeter strips showed the lowest difference between focal length, principal point coordinates, radial, and tangential distortion coefficients during the geometric camera calibration process. Thus, we can deduce that combining nadir and oblique images substantially improves the results in the calibration of inner camera parameters, which avoids additional adjustments to improve them.
Analysing the adequate number and the best location of the GCPs in the block, the best RMSE CPs value was obtained using one GCP for each flight block corner, considering a ratio of 0.1 GCP/ha as a reference. Finally, locating GCPs in the corners and distributing them along the edges of the block improves the model’s accuracy (Configuration 4) by obtaining the minimum mean value for RMSE CPs (3x the GSD). However, the errors could be equal to or higher than 11x the GSD for configurations 1, 2 and 3, which make them unsuited for UAV-DAP.
Future analyses will consider the effect of including individual multi-shot oblique images in conventional non-ideal frontal overlapping swaths and advanced camera calibration models in a sloping terrain.

Author Contributions

A.N.A.-V., J.L.L., J.F.P., J.P.C.-R. and J.F. conceptualized the paper; A.N.A.-V., J.P.C.-R., J.L.L. and J.F.P. performed the data collection; J.L.L. developed the methodology; A.N.A.-V. and J.L.L. wrote the first version of the paper, and all authors revised the manuscript. J.L.L. and J.F. acquired the funding. All authors have read and agreed to the published version of the manuscript.

Funding

The work was supported by the Spanish Agencia Estatal de Investigación (10.13039/501100011033) grant PID2021-122142OB-I00 (G2HOTSPOTS). This work represents a contribution to the CSIC Thematic Interdisciplinary Platform PTI TELEDETECT.

Institutional Review Board Statement

Not applicable.

Informed Consent Statement

Not applicable.

Data Availability Statement

Data available on request from the authors.

Acknowledgments

We would like to express our gratitude to the reviewers, whose comments and suggestions have been essential in strengthening and enriching the content of the manuscript.

Conflicts of Interest

The authors declare no conflicts of interest.

References

  1. Escalante Torrado, J.O.; Cáceres Jiménez, J.J.; Porras Díaz, H. Orthomosaics and Digital Elevation Models Generated from Images Taken with UAV Systems. Tecnura 2016, 20, 119–140. [Google Scholar]
  2. Sanz-Ablanedo, E.; Chandler, J.H.; Rodríguez-Pérez, J.R.; Ordóñez, C. Accuracy of Unmanned Aerial Vehicle (UAV) and SfM Photogrammetry Survey as a Function of the Number and Location of Ground Control Points Used. Remote Sens. 2018, 10, 1606. [Google Scholar] [CrossRef]
  3. Mancini, F.; Dubbini, M.; Gattelli, M.; Stecchi, F.; Fabbri, S.; Gabbianelli, G. Using Unmanned Aerial Vehicles (UAV) for High-Resolution Reconstruction of Topography: The Structure from Motion Approach on Coastal Environments. Remote Sens. 2013, 5, 6880–6898. [Google Scholar] [CrossRef]
  4. Fonstad, M.A.; Dietrich, J.T.; Courville, B.C.; Jensen, J.L.; Carbonneau, P.E. Topographic Structure from Motion: A New Development in Photogrammetric Measurement. Earth Surf. Process. Landf. 2013, 38, 421–430. [Google Scholar] [CrossRef]
  5. Colomina, I.; Molina, P. Unmanned Aerial Systems for Photogrammetry and Remote Sensing: A Review. ISPRS J. Photogramm. Remote Sens. 2014, 92, 79–97. [Google Scholar] [CrossRef]
  6. Carrera-Hernández, J.J.; Levresse, G.; Lacan, P. Is UAV-SfM Surveying Ready to Replace Traditional Surveying Techniques? Int. J. Remote Sens. 2020, 41, 4818–4835. [Google Scholar] [CrossRef]
  7. Varbla, S.; Puust, R.; Ellmann, A. Accuracy Assessment of RTK-GNSS Equipped UAV Conducted as-Built Surveys for Construction Site Modelling. Surv. Rev. 2020, 53, 477–492. [Google Scholar] [CrossRef]
  8. Zeybek, M. Accuracy Assessment of Direct Georeferencing UAV Images with Onboard Global Navigation Satellite System and Comparison of CORS/RTK Surveying Methods. Meas. Sci. Technol. 2021, 32, 065402. [Google Scholar] [CrossRef]
  9. Yurtseven, H. Comparison of GNSS-, TLS- and Different Altitude UAV-Generated Datasets on the Basis of Spatial Differences. ISPRS Int. J. Geo-Inf. 2019, 8, 175. [Google Scholar] [CrossRef]
  10. Gindraux, S.; Boesch, R.; Farinotti, D.; Melgani, F.; Nex, F.; Kerle, N.; Thenkabail, P. Accuracy Assessment of Digital Surface Models from Unmanned Aerial Vehicles’ Imagery on Glaciers. Remote Sens. 2017, 9, 186. [Google Scholar] [CrossRef]
  11. Pires, A.; Chaminé, H.I.; Nunes, J.C.; Borges, P.A.; Garcia, A.; Sarmento, E.; Antunes, M.; Salvado, F.; Rocha, F. New Mapping Techniques on Coastal Volcanic Rock Platforms Using UAV LiDAR Surveys in Pico Island, Azores (Portugal). In Volcanic Rocks and Soils; CRC Press: Boca Raton, FL, USA, 2015; p. 181. [Google Scholar]
  12. Ortíz-Rodríguez, A.J.; Muñoz-Robles, C.; Rodríguez-Herrera, J.G.; Osorio-Carmona, V.; Barbosa-Briones, E. Effect of DEM Resolution on Assessing Hydrological Connectivity in Tropical and Semi-Arid Basins of Central Mexico. J. Hydrol. 2022, 612, 128104. [Google Scholar] [CrossRef]
  13. Wang, J.; Qin, Z.; Zhao, G.; Li, B.; Gao, C. Scale Effect Analysis of Basin Topographic Features Based on Spherical Grid and DEM: Taking the Yangtze River Basin as an Example. Yingyong Jichu Yu Gongcheng Kexue Xuebao/J. Basic Sci. Eng. 2022, 30, 1109–1120. [Google Scholar] [CrossRef]
  14. Kastridis, A.; Kirkenidis, C.; Sapountzis, M. An Integrated Approach of Flash Flood Analysis in Ungauged Mediterranean Watersheds Using Post-Flood Surveys and Unmanned Aerial Vehicles. Hydrol. Process. 2020, 34, 4920–4939. [Google Scholar] [CrossRef]
  15. Abdelal, Q.; Al-Rawabdeh, A.; Al Qudah, K.; Hamarneh, C.; Abu-Jaber, N. Hydrological Assessment and Management Implications for the Ancient Nabataean Flood Control System in Petra, Jordan. J. Hydrol. 2021, 601, 126583. [Google Scholar] [CrossRef]
  16. Dávila-Hernández, S.; González-Trinidad, J.; Júnez-Ferreira, H.E.; Bautista-Capetillo, C.F.; Morales de Ávila, H.; Cázares Escareño, J.; Ortiz-Letechipia, J.; Robles Rovelo, C.O.; López-Baltazar, E.A. Effects of the Digital Elevation Model and Hydrological Processing Algorithms on the Geomorphological Parameterization. Water 2022, 14, 2363. [Google Scholar] [CrossRef]
  17. Mora Mur, D.; Ibarra Benlloch, P.; Ferrer, D.B.; Echeverría Arnedo, M.T.; Losada García, J.A.; Ojeda, A.O.; Sánchez Fabre, M. Paisaje y SIG: Aplicación a Los Embalses de La Cuenca Del Ebro. In Análisis Espacial y Representación Geográfica: Innovación y Aplicación; Departamento de Geografía y Ordenación del Territorio: Zapopan, Mexico, 2015. [Google Scholar]
  18. Li, Z.; Xu, X.; Ren, J.; Li, K.; Kang, W. Vertical Slip Distribution along Immature Active Thrust and Its Implications for Fault Evolution: A Case Study from Linze Thrust, Hexi Corridor. Diqiu Kexue-Zhongguo Dizhi Daxue Xuebao/Earth Sci.-J. China Univ. Geosci. 2022, 47, 831–843. [Google Scholar] [CrossRef]
  19. Wang, Y.; Dong, P.; Zhu, Y.; Shen, J.; Liao, S. Geomorphic Analysis of Xiadian Buried Fault Zone in Eastern Beijing Plain Based on SPOT Image and Unmanned Aerial Vehicle (UAV) Data. Geomat. Nat. Hazards Risk 2021, 12, 261–278. [Google Scholar] [CrossRef]
  20. Bi, H.; Zheng, W.; Lei, Q.; Zeng, J.; Zhang, P.; Chen, G. Surface Slip Distribution Along the West Helanshan Fault, Northern China, and Its Implications for Fault Behavior. J. Geophys. Res. Solid Earth 2020, 125, e2020JB019983. [Google Scholar] [CrossRef]
  21. Lee, C.F.; Tsao, T.C.; Huang, W.K.; Lin, S.C.; Yin, H.Y. Landslide Mapping and Geomorphologic Change Based on a Sky-View Factor and Local Relief Model: A Case Study in Hongye Village, Taitung. J. Chin. Soil Water Conserv. 2018, 49, 27–39. [Google Scholar] [CrossRef]
  22. Amin, P.; Ghalibaf, M.A.; Hosseini, M. Modeling for Temporal Land Subsidence Forecasting Using Field Surveying with Complementary Drone Imagery Testing in Yazd Plain, Iran. Environ. Monit. Assess. 2022, 194, 29. [Google Scholar] [CrossRef]
  23. Betz, F.; Lauermann, M.; Cyffka, B. Geomorphological Characterization of Rivers Using Virtual Globes and Digital Elevation Data: A Case Study from the Naryn River in Kyrgyzstan. Int. J. Geoinform. 2021, 17, 47–55. [Google Scholar] [CrossRef]
  24. Carbonell-Rivera, J.P.; Torralba, J.; Estornell, J.; Ruiz, L.Á.; Crespo-Peremarch, P. Classification of Mediterranean Shrub Species from UAV Point Clouds. Remote Sens. 2022, 14, 199. [Google Scholar] [CrossRef]
  25. Nevalainen, O.; Honkavaara, E.; Tuominen, S.; Viljanen, N.; Hakala, T.; Yu, X.; Hyyppä, J.; Saari, H.; Pölönen, I.; Imai, N.N.; et al. Individual Tree Detection and Classification with UAV-Based Photogrammetric Point Clouds and Hyperspectral Imaging. Remote Sens. 2017, 9, 185. [Google Scholar] [CrossRef]
  26. DJI Fixed-Wing vs Multirotor: Which Drone Should You Choose for Aerial Surveying? Available online: https://enterprise-insights.dji.com/blog/fixed-wing-vs-multirotor-drone-surveying (accessed on 31 January 2025).
  27. Yan, Y.; Lv, Z.; Yuan, J.; Chai, J. Analysis of Power Source of Multirotor UAVs. Int. J. Robot. Autom. 2019, 34, 563–571. [Google Scholar] [CrossRef]
  28. Jiménez-Jiménez, S.I.; Ojeda-Bustamante, W.; Marcial-Pablo, M.D.J.; Enciso, J. Digital Terrain Models Generated with Low-Cost UAV Photogrammetry: Methodology and Accuracy. ISPRS Int. J. Geo-Inf. 2021, 10, 285. [Google Scholar] [CrossRef]
  29. Nex, F.; Remondino, F. UAV for 3D Mapping Applications: A Review. Appl. Geomat. 2014, 6, 1–15. [Google Scholar] [CrossRef]
  30. Quispe, O.C. GSD Analysis for Generating Cartography Using Drone Technology; Huaca of San Marcos University: Lima, Peru, 2015; Volume 18. [Google Scholar]
  31. Pix4D, S.A. USER MANUAL Pix4Dmapper 4.1; Pix4D: Lausanne, Switzerland, 2017; 305p. [Google Scholar]
  32. Agisoft Agisoft PhotoScan User Manual—Professional Edition, Version 1.2. Available online: https://www.agisoft.com/pdf/photoscan-pro_1_2_en.pdf (accessed on 2 June 2021).
  33. İncekara, A.H.; Seker, D.Z. Rolling Shutter Effect on the Accuracy of Photogrammetric Product Produced by Low-Cost UAV. Int. J. Environ. Geoinform. 2021, 8, 549–553. [Google Scholar] [CrossRef]
  34. Zhou, Y.; Daakir, M.; Rupnik, E.; Pierrot-Deseilligny, M. A Two-Step Approach for the Correction of Rolling Shutter Distortion in UAV Photogrammetry. ISPRS J. Photogramm. Remote Sens. 2020, 160, 51–66. [Google Scholar] [CrossRef]
  35. Vautherin, J.; Rutishauser, S.; Schneider-Zapp, K.; Choi, H.F.; Chovancova, V.; Glass, A.; Strecha, C. Photogrammetric accuracy and modeling of rolling shutter cameras. ISPRS Ann. Photogramm. Remote Sens. Spat. Inf. Sci. 2016, III-3, 139–146. [Google Scholar] [CrossRef]
  36. Sadeq, H.A. Accuracy Assessment Using Different UAV Image Overlaps. J. Unmanned Veh. Syst. 2019, 7, 175–193. [Google Scholar] [CrossRef]
  37. Yang, B.; Ali, F.; Zhou, B.; Li, S.; Yu, Y.; Yang, T.; Liu, X.; Liang, Z.; Zhang, K. A Novel Approach of Efficient 3D Reconstruction for Real Scene Using Unmanned Aerial Vehicle Oblique Photogrammetry with Five Cameras. Comput. Electr. Eng. 2022, 99, 107804. [Google Scholar] [CrossRef]
  38. James, M.R.; Robson, S. Mitigating Systematic Error in Topographic Models Derived from UAV and Ground-Based Image Networks. Earth Surf. Process. Landf. 2014, 39, 1413–1420. [Google Scholar] [CrossRef]
  39. Mora, O.E.; Suleiman, A.; Chen, J.; Pluta, D.; Okubo, M.H.; Josenhans, R. Comparing SUAS Photogrammetrically-Derived Point Clouds with GNSS Measurements and Terrestrial Laser Scanning for Topographic Mapping. Drones 2019, 3, 64. [Google Scholar] [CrossRef]
  40. Rossi, P.; Mancini, F.; Dubbini, M.; Mazzone, F.; Capra, A. Combining Nadir and Oblique UAV Imagery to Reconstruct Quarry Topography: Methodology and Feasibility Analysis. Eur. J. Remote Sens. 2017, 50, 211–221. [Google Scholar] [CrossRef]
  41. Santise, M.; Fornari, M.; Forlani, G.; Roncella, R. Evaluation of DEM Generation Accuracy from UAS Imagery. Int. Arch. Photogramm. Remote Sens. Spat. Inf. Sci. 2014, XL-5, 529–536. [Google Scholar] [CrossRef]
  42. Jiménez-Jiménez, S.I.; Ojeda-Bustamante, W.; Ontiveros-Capurata, R.E.; Flores-Velázquez, J.; Marcial-Pablo, M.d.J.; Robles-Rubio, B.D. Quantification of the Error of Digital Terrain Models Derived from Images Acquired with UAV. Ing. Agrícola Y Biosist. 2017, 9, 85–100. [Google Scholar] [CrossRef]
  43. Ferrer-González, E.; Agüera-Vega, F.; Carvajal-Ramírez, F.; Martínez-Carricondo, P. UAV Photogrammetry Accuracy Assessment for Corridor Mapping Based on the Number and Distribution of Ground Control Points. Remote Sens. 2020, 12, 2447. [Google Scholar] [CrossRef]
  44. Ewertowski, M.W.; Tomczyk, A.M.; Evans, D.J.A.; Roberts, D.H.; Ewertowski, W. Operational Framework for Rapid, Very-High Resolution Mapping of Glacial Geomorphology Using Low-Cost Unmanned Aerial Vehicles and Structure-from-Motion Approach. Remote Sens. 2019, 11, 65. [Google Scholar] [CrossRef]
  45. Arévalo-Verjel, A.N.; Lerma, J.L.; Prieto, J.F.; Carbonell-Rivera, J.P.; Fernández, J. Estimation of the Block Adjustment Error in UAV Photogrammetric Flights in Flat Areas. Remote Sens. 2022, 14, 2877. [Google Scholar] [CrossRef]
  46. DroneDeploy.com. Drone Deploy. Available online: https://help.dronedeploy.com/hc/en-us/articles/1500004964162-3D-Models (accessed on 5 April 2021).
  47. AEMET España—Agencia Estatal de Meteorología. Gobierno de España. Available online: https://www.aemet.es/es/eltiempo/prediccion/espana (accessed on 27 November 2022).
  48. Instituto Geográfico Nacional Centro de Descargas Del CNIG (IGN). Available online: http://centrodedescargas.cnig.es/CentroDescargas/index.jsp (accessed on 22 June 2022).
  49. Fernandez, J.; Prieto, J.F.; Escayo, J.; Camacho, A.G.; Luzón, F.; Tiampo, K.F.; Palano, M.; Abajo, T.; Pérez, E.; Velasco, J.; et al. Modeling the Two- and Three-Dimensional Displacement Field in Lorca, Spain, Subsidence and the Global Implications. Sci. Rep. 2018, 8, 14782. [Google Scholar] [CrossRef]
  50. Velasco, J.; Herrero, T.; Molina, I.; López, J.; Pérez-Martín, E.; Prieto, J. Methodology for Designing, Observing and Computing of Underground Geodetic Networks of Large Tunnels for High-Speed Railways. Inf. Construcción 2015, 67, e076. [Google Scholar] [CrossRef]
  51. Geosystems Leica Infinity Surveying Software|Leica Geosystems. Available online: https://leica-geosystems.com/products/gnss-systems/software/leica-infinity (accessed on 27 May 2023).
  52. Boehm, J.; Werl, B.; Schuh, H. Troposphere Mapping Functions for GPS and Very Long Baseline Interferometry from European Centre for Medium-Range Weather Forecasts Operational Analysis Data. J. Geophys. Res. Solid Earth 2006, 111, 2406. [Google Scholar] [CrossRef]
  53. Velasco-Gómez, J.; Prieto, J.F.; Molina, I.; Herrero, T.; Fábrega, J.; Pérez-Martín, E. Use of the Gyrotheodolite in Underground Networks of Long High-Speed Railway Tunnels. Surv. Rev. 2016, 48, 329–337. [Google Scholar] [CrossRef]
  54. Krzykowska, K.; Siergiejczyk, M.; Rosiński, A. Influence of Selected External Factors on Satellite Navigation Signal Quality. In Safety and Reliability–Safe Societies in a Changing World; CRC Press: Boca Raton, FL, USA, 2018; pp. 701–705. [Google Scholar]
  55. Wierzbicki, D.; Kedzierski, M.; Fryskowska, A. Assesment of the influence of UAV image quality on the orthophoto production. Int. Arch. Photogramm. Remote Sens. Spat. Inf. Sci. 2015, XL-1/W4, 1–8. [Google Scholar] [CrossRef]
  56. Boletín Oficial Del Estado (BOE). Real Decreto 1036/2017 de 15 de Diciembre; Government of Spain–Ministry of Transport and Sustainable Mobility: Madrid, Spain, 2015; p. 316. [Google Scholar]
  57. Lerma, J.L.G. Fotogrametría Moderna: Analítica y Digital; Universitat Politècnica de València: València, Spain, 2002; p. 560. ISBN 978-84-9705-210-8. [Google Scholar]
  58. Kraus, K. Photogrammetry. Volume 1, Fundamentals and Standard Processes; Dümmler: Bonn, Germany, 1993; p. 389. ISBN 3427786846. [Google Scholar]
  59. Kraus, K. Photogrammetry. Volume 2, Advanced Methods and Applications; Jansa, J., Kager, H., Eds.; Dümmler: Bonn, Germany, 1997; p. 459. ISBN 3427786943. [Google Scholar]
  60. Shoab, M.; Singh, V.K.; Ravibabu, M.V. High-Precise True Digital Orthoimage Generation and Accuracy Assessment Based on UAV Images. J. Indian Soc. Remote Sens. 2022, 50, 613–622. [Google Scholar] [CrossRef]
  61. Liu, Y.; Zheng, X.; Ai, G.; Zhang, Y.; Zuo, Y. Generating a High-Precision True Digital Orthophoto Map Based on UAV Images. ISPRS Int. J. Geo-Inf. 2018, 7, 333. [Google Scholar] [CrossRef]
  62. Agisoft Aerial Data Processing (with GCPs)—Orthomosaic&DEM Generation: Helpdesk Portal. Available online: https://agisoft.freshdesk.com/support/solutions/articles/31000153696 (accessed on 30 July 2021).
  63. Luhmann, T.; Fraser, C.; Maas, H.G. Sensor Modelling and Camera Calibration for Close-Range Photogrammetry. ISPRS J. Photogramm. Remote Sens. 2016, 115, 37–46. [Google Scholar] [CrossRef]
  64. Bruno, N.; Forlani, G. Experimental Tests and Simulations on Correction Models for the Rolling Shutter Effect in UAV Photogrammetry. Remote Sens. 2023, 15, 2391. [Google Scholar] [CrossRef]
  65. Federal Geographic Data Committee. Geospatial Positioning Accuracy Standards Part 3: National Standard for Spatial Data Accuracy Subcommittee for Base Cartographic Data Federal Geographic Data Committee; Federal Geographic Data Committee: Virginia, NV, USA, 1998. [Google Scholar]
  66. Rock, G.; Ries, J.B.; Udelhoven, T. Sensitivity Analysis of UAV-Photogrammetry for Creating Digital Elevation Models (DEM). Int. Arch. Photogramm. Remote Sens. Spat. Inf. Sci. 2012, XXXVIII-1/C22, 69–73. [Google Scholar] [CrossRef]
  67. Barba, S.; Barbarella, M.; Di Benedetto, A.; Fiani, M.; Gujski, L.; Limongiello, M. Accuracy Assessment of 3D Photogrammetric Models from an Unmanned Aerial Vehicle. Drones 2019, 3, 79. [Google Scholar] [CrossRef]
  68. Harwin, S.; Lucieer, A.; Osborn, J. The Impact of the Calibration Method on the Accuracy of Point Clouds Derived Using Unmanned Aerial Vehicle Multi-View Stereopsis. Remote Sens. 2015, 7, 11933–11953. [Google Scholar] [CrossRef]
  69. Zimmerman, T.; Jansen, K.; Miller, J. Analysis of UAS Flight Altitude and Ground Control Point Parameters on DEM Accuracy along a Complex, Developed Coastline. Remote Sens. 2020, 12, 2305. [Google Scholar] [CrossRef]
  70. Liu, X.; Lian, X.; Yang, W.; Wang, F.; Han, Y.; Zhang, Y. Accuracy Assessment of a UAV Direct Georeferencing Method and Impact of the Configuration of Ground Control Points. Drones 2022, 6, 30. [Google Scholar] [CrossRef]
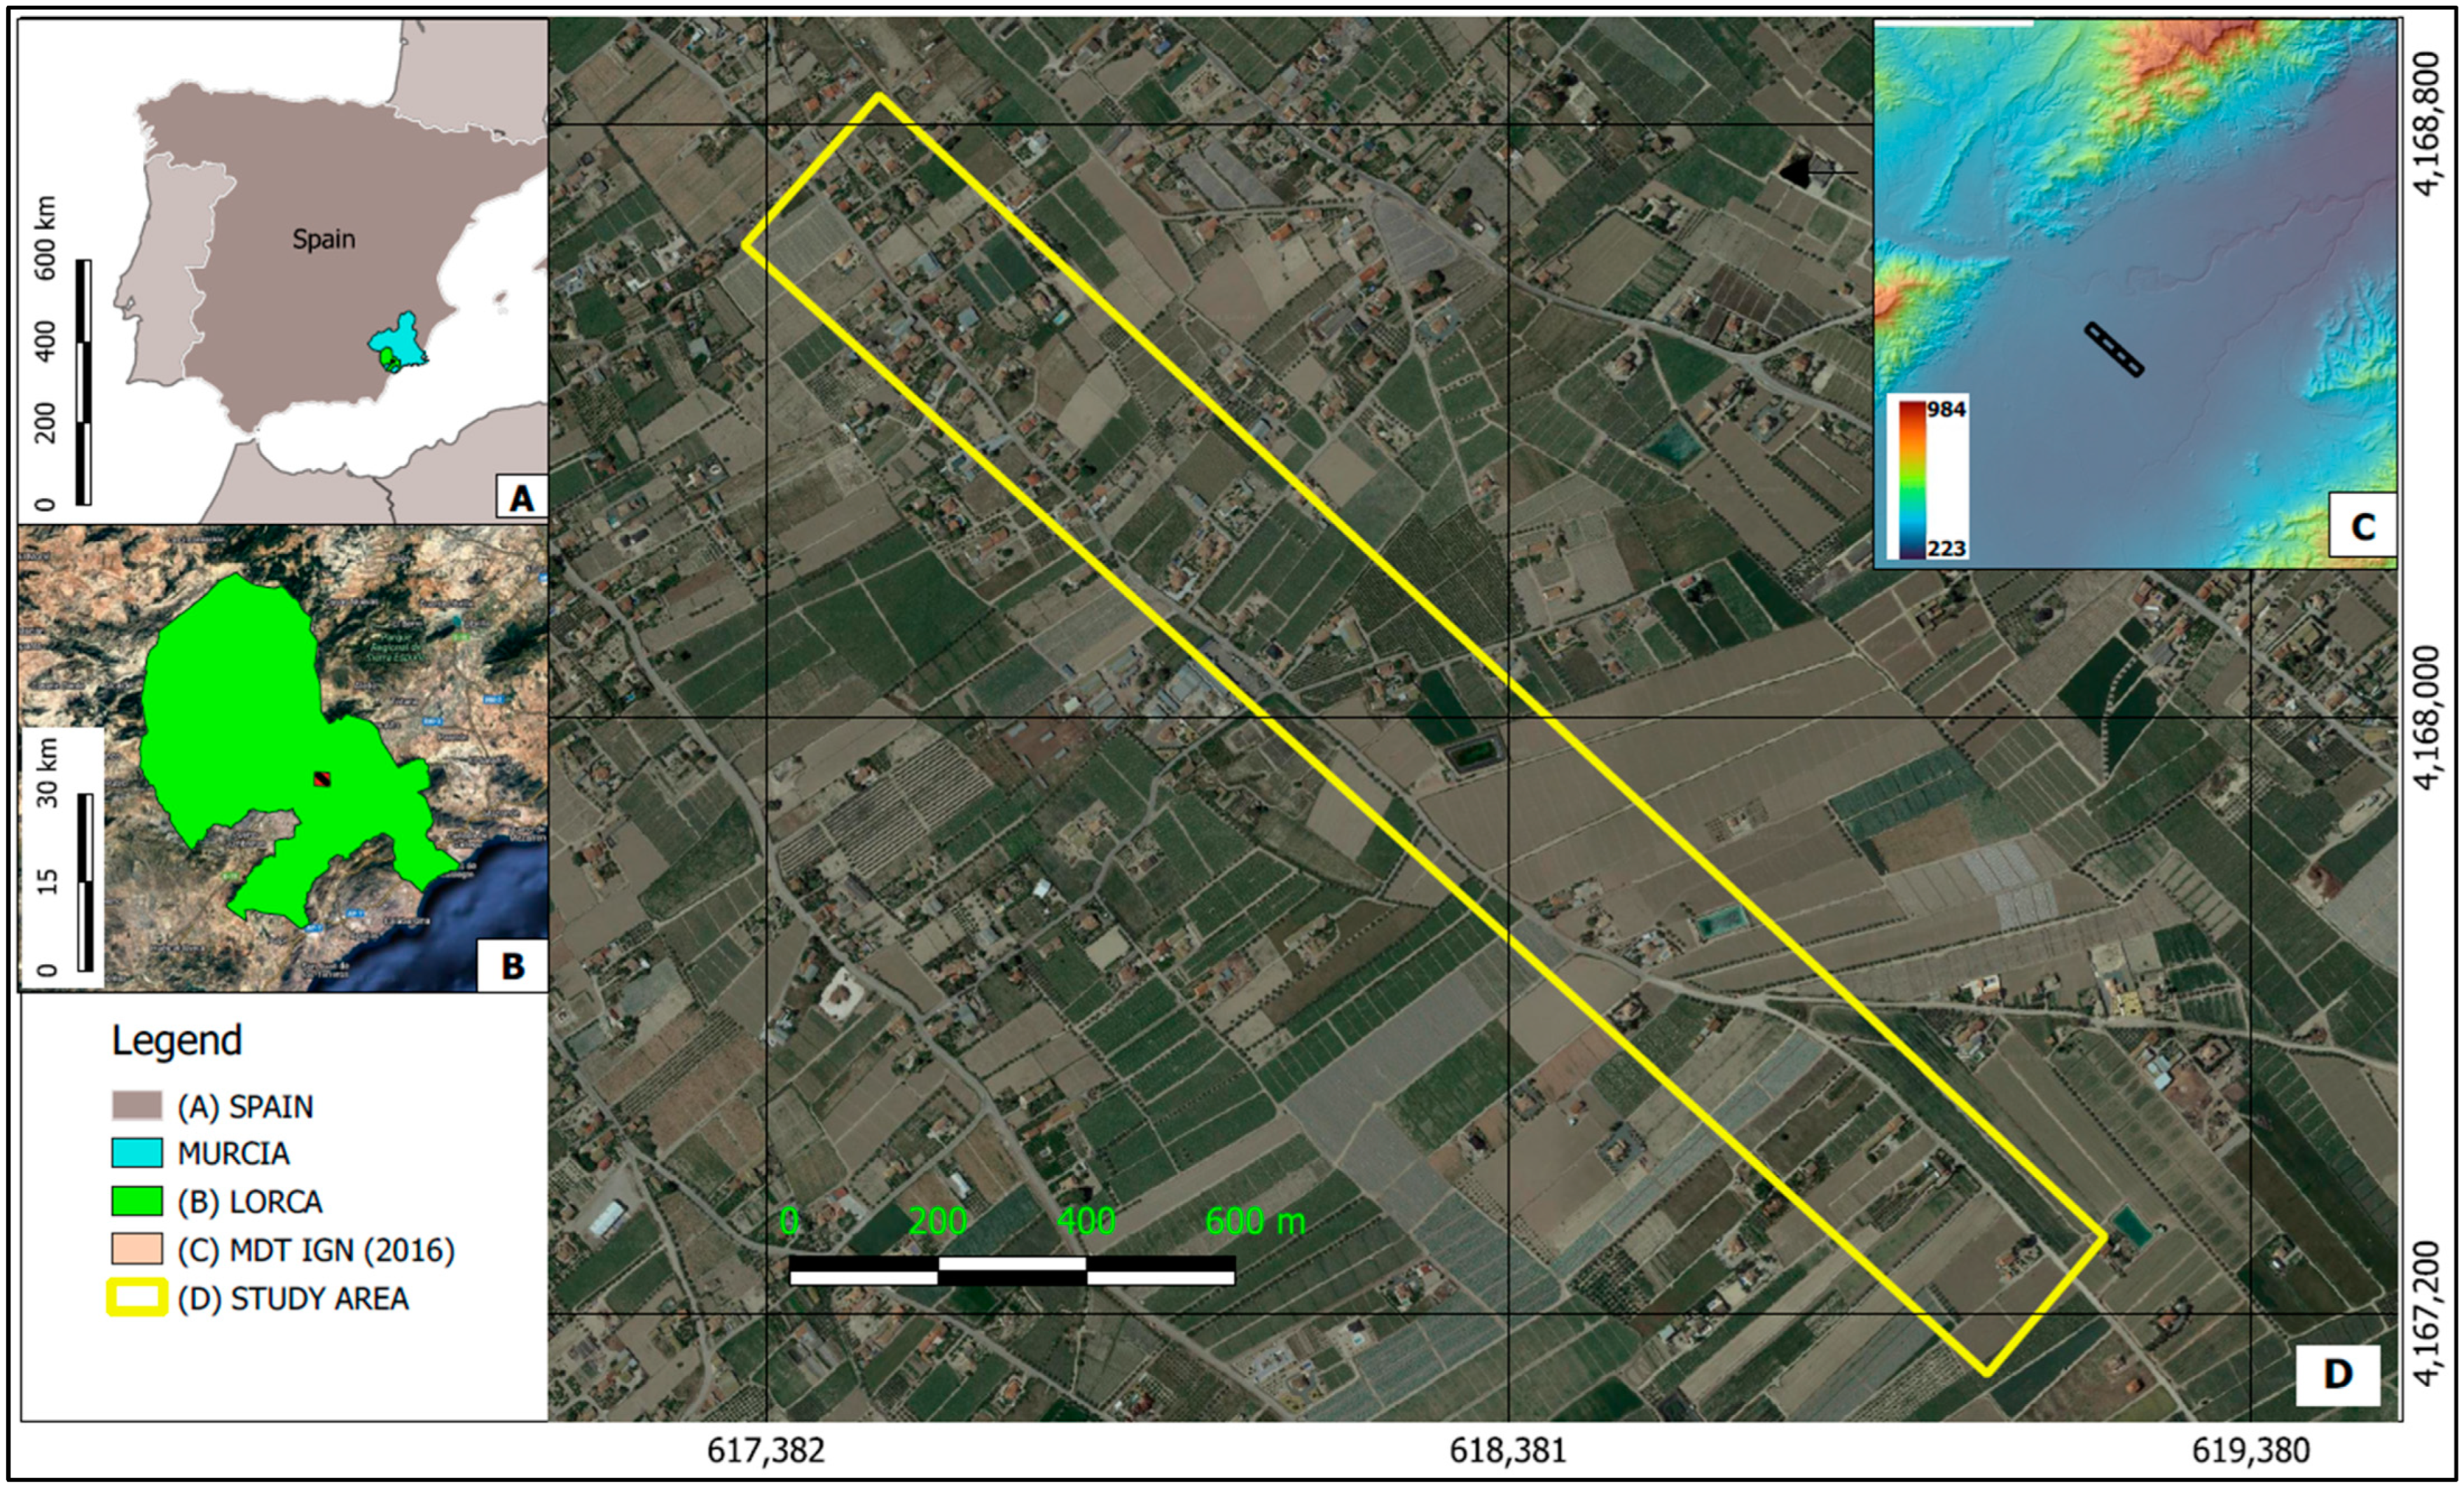
Figure 1. (A) Location of the study area in southeast Spain and location in the municipality of Lorca (green area) in the region of Murcia (yellow area); (B) location of the study area in the municipality of Lorca; (C) DTM obtained from ALS data downloaded from the IGN (National Geographic Institute) for 2016 [48]; (D) detailed location of the study area in Lorca along the road to Puente Alto, defined by the yellow rectangle. The geodetic reference system coordinates UTM 30N ETRS89.
Applsci 15 05035 g001
Figure 2. (A) Flat area study zone; (B) Inspire 2 UAV; (C) 60 × 60 cm template with reflective paint; (D) GNSS with tripod focused on the centre of the template; (E) the mark at a height of 120 m; and (F) an oblique photo taken on the perimeter.
Applsci 15 05035 g002
Figure 3. Photogrammetric scenarios analysed: (A) processing with forward strips only; (B) Scenario A combined with oblique perimeter images; (C) Scenario A combined with cross strips on the edges of each block at a different height; (D) Scenarios B + C.
Applsci 15 05035 g003
Figure 4. Difference between the computed GCP/Check Point 3D point and the original position in XYZ direction of the GCPs and CPs (in cm) for the four scenarios, A (pink), B (green), C (blue), and D (purple).
Applsci 15 05035 g004
Figure 5. Distribution of the Root Mean Square Error (RMSE) for the Ground Control Points (GCPs) and checkpoints (CPs) and Ground Sampling Distance (GSD) in the four studied scenarios.
Applsci 15 05035 g005
Figure 6. Scenario B distribution of GCPs and CPs for the six configurations in the study area.
Applsci 15 05035 g006
Figure 7. Scenario B RMSE in the CPs for the six configurations analysed.
Applsci 15 05035 g007
Table 1. Comparative overall results obtained vs. related research in flat terrain using nadir and oblique images, N/A is not applicable.
Ref.Area (km2)Image TypeFlight Height (m)Camera ModelShutter ModelFocal Length (mm)Overlap (for-ward-lateral) (%)GCPs–CPsGSD (cm/pix)RMSE/GSD
XYZ3D
[9]0.006Nadir25-50-120Sony Exmor R BSI 1/2. 3Electronic2095–9515–354.82.21.93
[39]0.017Nadir45Phantom 4 ProMechanic2485–755–190.752.64.35.1
[40]0.09Nadir and oblique50Canon EOS 550DMechanic2590–9018–51222.9
[36]0.09Nadir and oblique60Canon IXUS160Electronic2890–456–411.40.92.62.8
[41]0.25Nadir140Sony NEX 5Electronic3580–4035–10141.61.12
[42]0.370Nadir92Sony NEX-7dual1675–7511–1221.833.5
[43]0.40Nadir65Phantom 4 ProMechanic2480–6018–291.751.63.23.5
[8]0.024Nadir and oblique75–100Phantom 4 RTKMechanic2470–10N/A2.70.71.81.9
[44]1Nadir and oblique53Sony Exmor R BSI 1/2. 3Electronic2080–8030–151.9N/AN/A4.2
[37]2.1Nadir and oblique100DSC-QX100Electronic37.180–756–721.51.82.3
[45] *0.19Nadir120FC 300XElectronic2080–754–25.182.412.6
Mean1.72.33.1
Median1.722.9
Minimum0.71.11.9
exp Maximum2.64.35.1
* Scenario A, Block 1 was selected.
Table 2. Area in hectares for each block studied. hf refers to the forward flight height, and hc refers to the cross-flight height.
BlockStrip TypeArea
(km2)
Forward OverlapLateral
Overlap
Flight Height
(m)
GSD
(cm/pix)
No of Images
Block 1Forward strips0.1980%60%hf = 120 2.6191
Block 1Cross strip 10.01980%60%hc = 110 2.419
Block 1Perimeter 3D 80%60%hf = 1202.674
Blocks 1 and 2Cross strip 20.01980%60%hc = 110 2.419
Block 2Forward strips0.1980%60%hf = 120 2.6179
Blocks 2 and 3Cross strip 30.01980%60%hc = 110 2.419
Block 2Perimeter 3D 80%60%hf = 1202.669
Block 3Forward strips0.2380%60%hf = 120 2.6215
Blocks 3 and 4Cross strip 40.01980%60%hc = 110 2.419
Block 3Perimeter 3D 80%60%hf = 1202.678
Block 4Forward strips0.1980%60%hf = 120 2.6177
Block 4Cross strip 50.01980%60%hc = 110 2.419
Block 4Perimeter 3D 80%60%hf = 1202.668
Total 0.8 1106
Table 3. Coordinates of the GCPs, CPs, and the three continuous stations (ALHA, LRCA, and MAZA) for the observation period used for the adjustment using Microsearch GeoLab software (MicroSearch Corporation, Boston, MA, USA) and their standard deviations (Geodetic reference system ETRS89, UTM 30N). Values in meters.
PointCoordinatesStd. Deviation
NorthingEastingHeightNorthingEastingHeight
1 GCP 4,167,120.872619,065.846290.8960.0040.0030.011
2 GCP 4,167,301.180619,251.921291.0620.0040.0030.010
3 GCP 4,167,441.058618,678.165293.0670.0200.0170.055
4 GCP 4,167,651.253618,800.408293.2720.0060.0050.016
5 GCP 4,168,020.890618,440.211295.5570.0060.0050.012
6 GCP 4,167,885.738618,252.823296.3780.0060.0060.014
7 GCP 4,168,445.382617,870.494301.1730.0050.0040.012
8 GCP 4,168,275.535617,743.737301.2770.0060.0030.011
9 GCP 4,168,820.872617,556.983306.6730.0070.0070.019
10 GCP 4,168,643.303617,372.606305.9730.0140.0100.026
11 CP 4,168,139.300617,949.391299.7510.0090.0080.018
12 CP 4,167,644.991618,565.766294.1840.0050.0040.013
13 CP 4,168,465.150617,639.596303.4530.0060.0050.012
14 CP 4,168,587.195617,782.779301.7890.0030.0030.010
15 CP 4,168,564.801617,496.087305.3310.0070.0050.014
16 CP 4,168,060.373618,259.190296.8530.0050.0050.011
17 CP 4,167,871.156618,528.526294.3040.0060.0040.010
18 CP 4,167,325.170618,839.696292.3060.0060.0060.021
19 CP 4,167,568.703618,805.363293.1550.0050.0040.010
ALHA4,185,231.011636,738.932201.7970.0010.0010.002
LRCA4,168,655.115614,704.901332.2150.0010.0000.001
MAZA4,162,049.758649,154.77255.0720.0000.0000.001
Table 4. Comparison of RMSE values for checkpoints (CPs) with and without rolling shutter compensation in Pix4Dmapper across the four analysed scenarios. Values in centimetres.
Shutter TypeScenarioRMSE xRMSE yRMSE z
Fast ReadoutA403349
B383838
C393128
D303332
Rolling shutter linealA1.74.410.7
B2.93.46.7
C1.84.29.9
D3.24.110.9
Table 5. Pix4Dmapper quality report on the internal camera parameters for Scenarios A–D; R1, R2, R3: Radial distortion coefficients; and T1, T2: Lens tangential distortion coefficients (dimensionless).
ScenarioParametersFocal Length [pix]Principal Point x [pix]Principal Point y [pix]R1R2R3T1T2Result 1
AInitial Values4564.3992698.1591910.765−0.004−0.0430.087−0.0030.0043.56%
Optimised Values4741.210 2639.5951942.754−0.0060.014−0.015−0.0010.001
Uncertainties (Sigma)15.865 0.5411.5030.0000.0000.0010.0000.000
BInitial Values4559.840 2643.2901912.470−0.0050.009−0.008−0.0010.0040.34%
Optimised Values4554.4792640.7321916.975−0.0050.01−0.009−0.0010.001
Uncertainties (Sigma)0.7180.1110.7450.0000.0000.0000.0000.000
CInitial Values4564.3992698.1591910.765−0.004−0.0430.087−0.0030.0043.30%
Optimised Values4725.9752638.9601945.875−0.0060.014−0.015−0.0010.001
Uncertainties (Sigma)14.2250.4841.4210.0000.0000.0010.0000.000
DInitial Values4564.3992698.1591910.765−0.004−0.0430.087−0.0030.0040.16%
Optimised Values4560.5862642.1561910.781−0.0050.007−0.005−0.0010.001
Uncertainties (Sigma)0.7140.116 0.752 0.0000.0000.0000.0000.000
1 Relative difference between initial and adjusted internal camera parameters.
Table 6. Parameters of the RMSE GCPs and CPs (in cm), using PIX4Dmapper for the four scenarios studied, marking best results (green) and worst (red).
ScenarioGSD [cm]Reproj. Error
σo
RMSE GCPxyRMSE CPxyRMSE GCPzRMSE CPzRMSE GCPxyzRMSE CPxyzCPxy/
GSD
CPz/
GSD
CPxyz/
GSD
A2.70.30.34.8210.72.011.71.84.04.3
B2.70.40.74.62.36.82.48.21.72.53.0
C2.70.40.34.519.91.010.91.73.74.0
D2.70.50.95.3210.92.111.02.03.54.1
Table 7. Weight coefficients for the CP in horizontal (xy) and vertical (z) directions. The best results are shown in green and the worst in red (dimensionless).
Scenario μ xy CP μ z CP μ xyz CP
A1.01.51.8
B1.00.91.3
C0.91.41.7
D1.11.51.9
mean1.01.31.7
std 0.10.30.2
Disclaimer/Publisher’s Note: The statements, opinions and data contained in all publications are solely those of the individual author(s) and contributor(s) and not of MDPI and/or the editor(s). MDPI and/or the editor(s) disclaim responsibility for any injury to people or property resulting from any ideas, methods, instructions or products referred to in the content.