1. Introduction
Food waste is a global issue [
1]. The United Nations Food and Agriculture Organization estimates that approximately 1.3 billion tons of food is wasted or lost annually, accounting for about a third of global food production. Globally, countries like the United States, France, and Japan have established strategies to combat food waste. China, in its efforts to curtail this issue, enacted the ‘Anti-Food Waste Law’ on 29 April 2021, legislatively addressing the problem of ‘waste on the tip of the tongue.’ Additionally, China’s Ministry of Education issued the ‘Action Plan to Stop Catering Waste and Cultivate Thrifty Habits,’ emphasizing the innovative use of technology to promote the ‘Clean Plate Campaign’ as a critical component of the educational sector’s food waste reduction efforts. In Chinese universities, addressing food waste in cafeterias is not only a matter of social norms and traditional virtues but also a question of food security. Reports indicate that China’s annual food waste equates to about 50 billion kg of grain, sufficient to feed approximately 350 million people for a year, or one-tenth of the nation’s total grain production [
2,
3]. Surveys reveal that an average university student in China wastes between 36.11 and 37.22 kg of food annually in cafeterias, with the national scale of food waste in university dining reaching 1.33 to 1.37 billion kg per year [
4]. Such extensive waste not only fosters a culture of extravagance within campuses but also jeopardizes national resources and hinders the improvement of citizens’ quality of life. Hence, addressing campus food waste is urgent, and the ‘Clean Plate Campaign’ represents an effective approach to achieving conservation goals.
The implementation of the “Clean Plate Campaign” in university canteens requires efficient plate recognition technology and well-designed incentive mechanisms. Traditional approaches for assessing food waste behaviors typically rely on manual observation. While straightforward to implement, these methods are inherently subjective and labor-intensive, making them unsuitable for high-traffic environments like campus dining halls. In contrast, recent advancements in deep learning have provided more convenient and energy-efficient solutions. The potential of deep learning has been extensively demonstrated across domains: Bochkovskiy et al. [
5] achieved 43.5% accuracy (AP) on the MS COCO dataset using YOLOv4, significantly outperforming earlier YOLO architectures [
6,
7]; ResNet [
8] and Faster R-CNN [
9] laid technical foundations for real-time detection in complex scenarios; while Fully Convolutional Networks (FCNs) by Long et al. [
10] balanced precision and efficiency in pixel-wise segmentation tasks. It is worth noting that semantic segmentation technology has shown significant advantages in high-precision industrial quality inspection. For example, Nguyen [
11] achieved a Mean IoU of 94.14% in seam defect detection by combining DeepLabV3+ with the lightweight EfficientNet encoder, demonstrating its pixel-level localization ability for small targets. Semantic segmentation is particularly suitable for tasks involving the identification of object boundaries and detailed information. Food waste recognition, in essence, requires precise identification and localization of food residues and tray shapes. Therefore, semantic segmentation can accurately capture the distribution and shape of leftover food on trays through detailed pixel-level segmentation, providing data support for subsequent food waste quantification and intervention. However, defect detection in industrial scenarios typically relies on static, standardized image acquisition environments, whereas campus tray recognition must contend with diverse tableware and irregular food residue shapes, posing greater challenges for the model’s robustness. Deep learning has been applied to food waste reduction through optimized classification. Khoshboresh-Masouleh and Shah-Hosseini [
12] systematically reviewed its potential in food-related applications, and Mazloumian et al. [
13] enhanced food categorization accuracy using deep models, demonstrating technical feasibility for waste reduction. However, systematic applications in campus food waste management remain scarce, particularly in integrating plate recognition with behavioral interventions.
This study addresses this gap by developing an automated plate recognition system through China’s “Logistics Education Credit Service Management Platform”, exploring deep learning’s potential to reduce food waste in university canteens. By combining object detection algorithms with incentive mechanism design, we demonstrate the technical feasibility and social necessity of applying deep learning to the Clean Plate Campaign, thereby advancing national dual-carbon goals (carbon peaking and neutrality). It is important to note that the ‘Clean Plate’ phenomenon in this study is defined as diners failing to completely consume the food on their plates, i.e., there is significant leftover food on the plate. This standard focuses on the actual amount of food consumed, without considering other subjective factors. This definition provides an objective standard for quantifying food waste in this study, aiming to provide data support for the promotion and implementation of the Clean Plate Campaign and offering technical support for achieving the national “carbon peaking and carbon neutrality” goals. Our approach establishes a closed-loop framework connecting intelligent perception with behavioral nudges, offering scalable solutions for sustainable campus management.
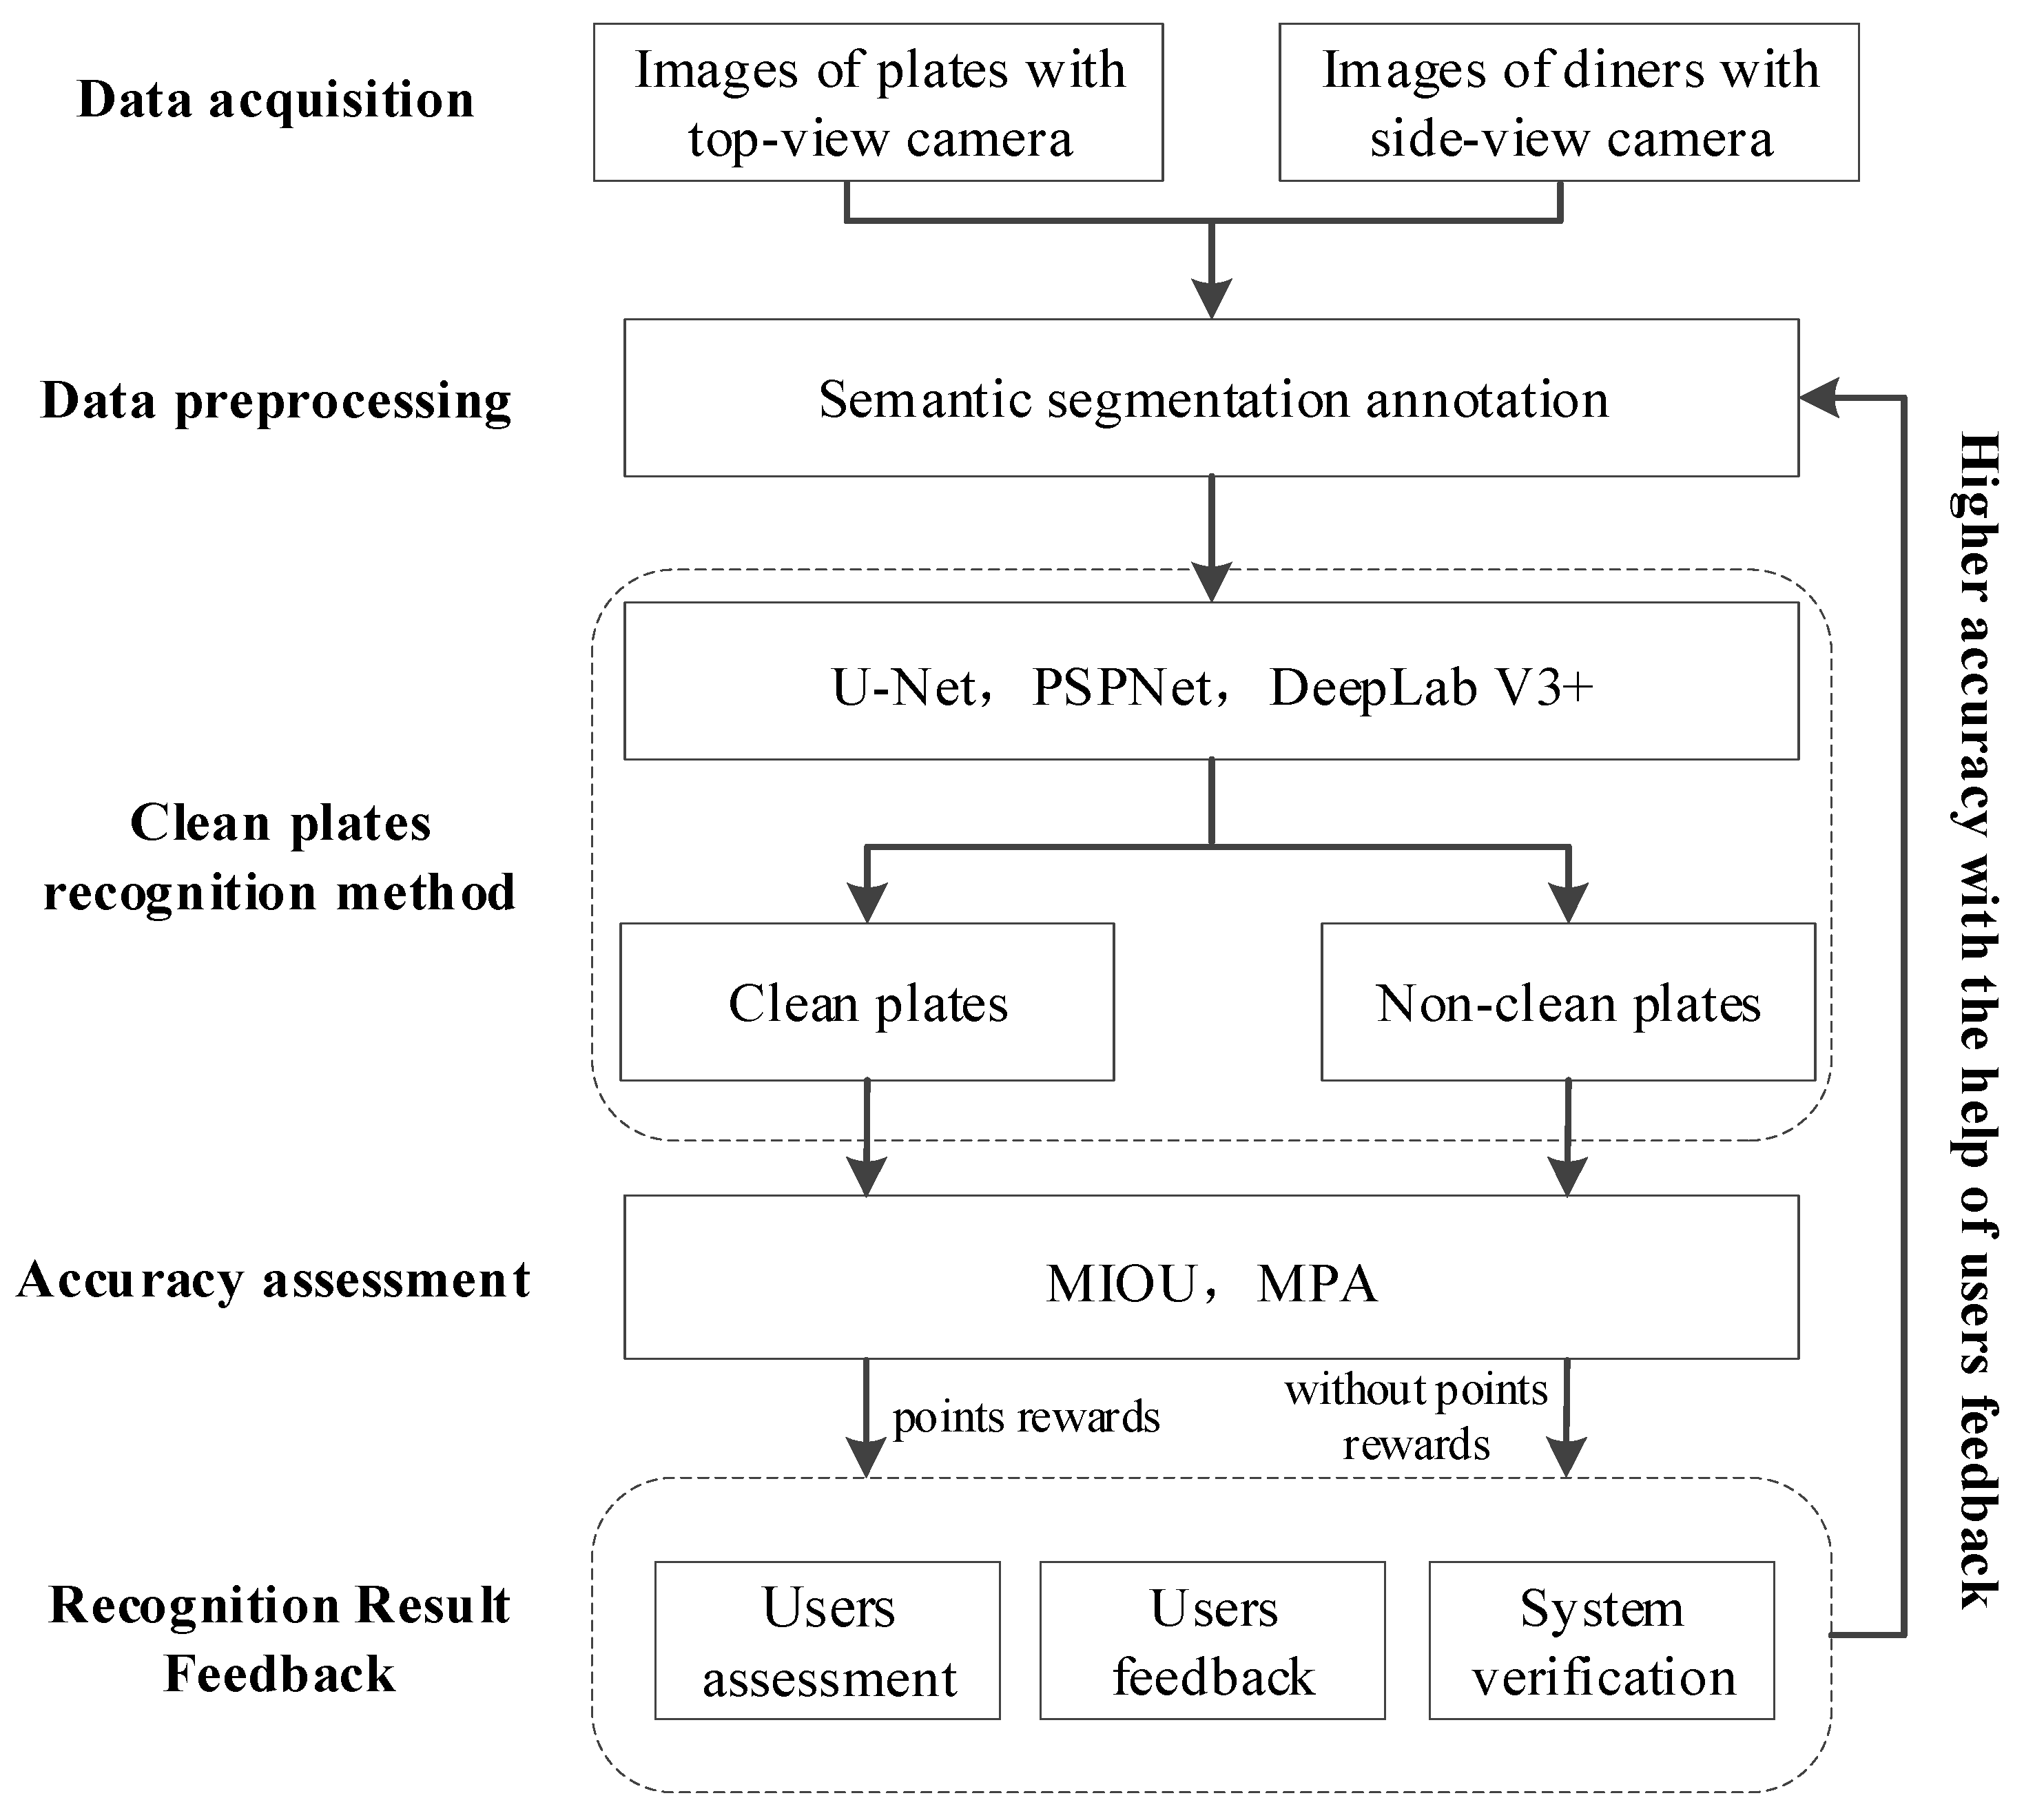
2. The Automatic Plates Recognition System
The automated plate recognition system comprises five main components: data acquisition, data preprocessing, plate recognition, accuracy assessment, and feedback (see
Figure 1).
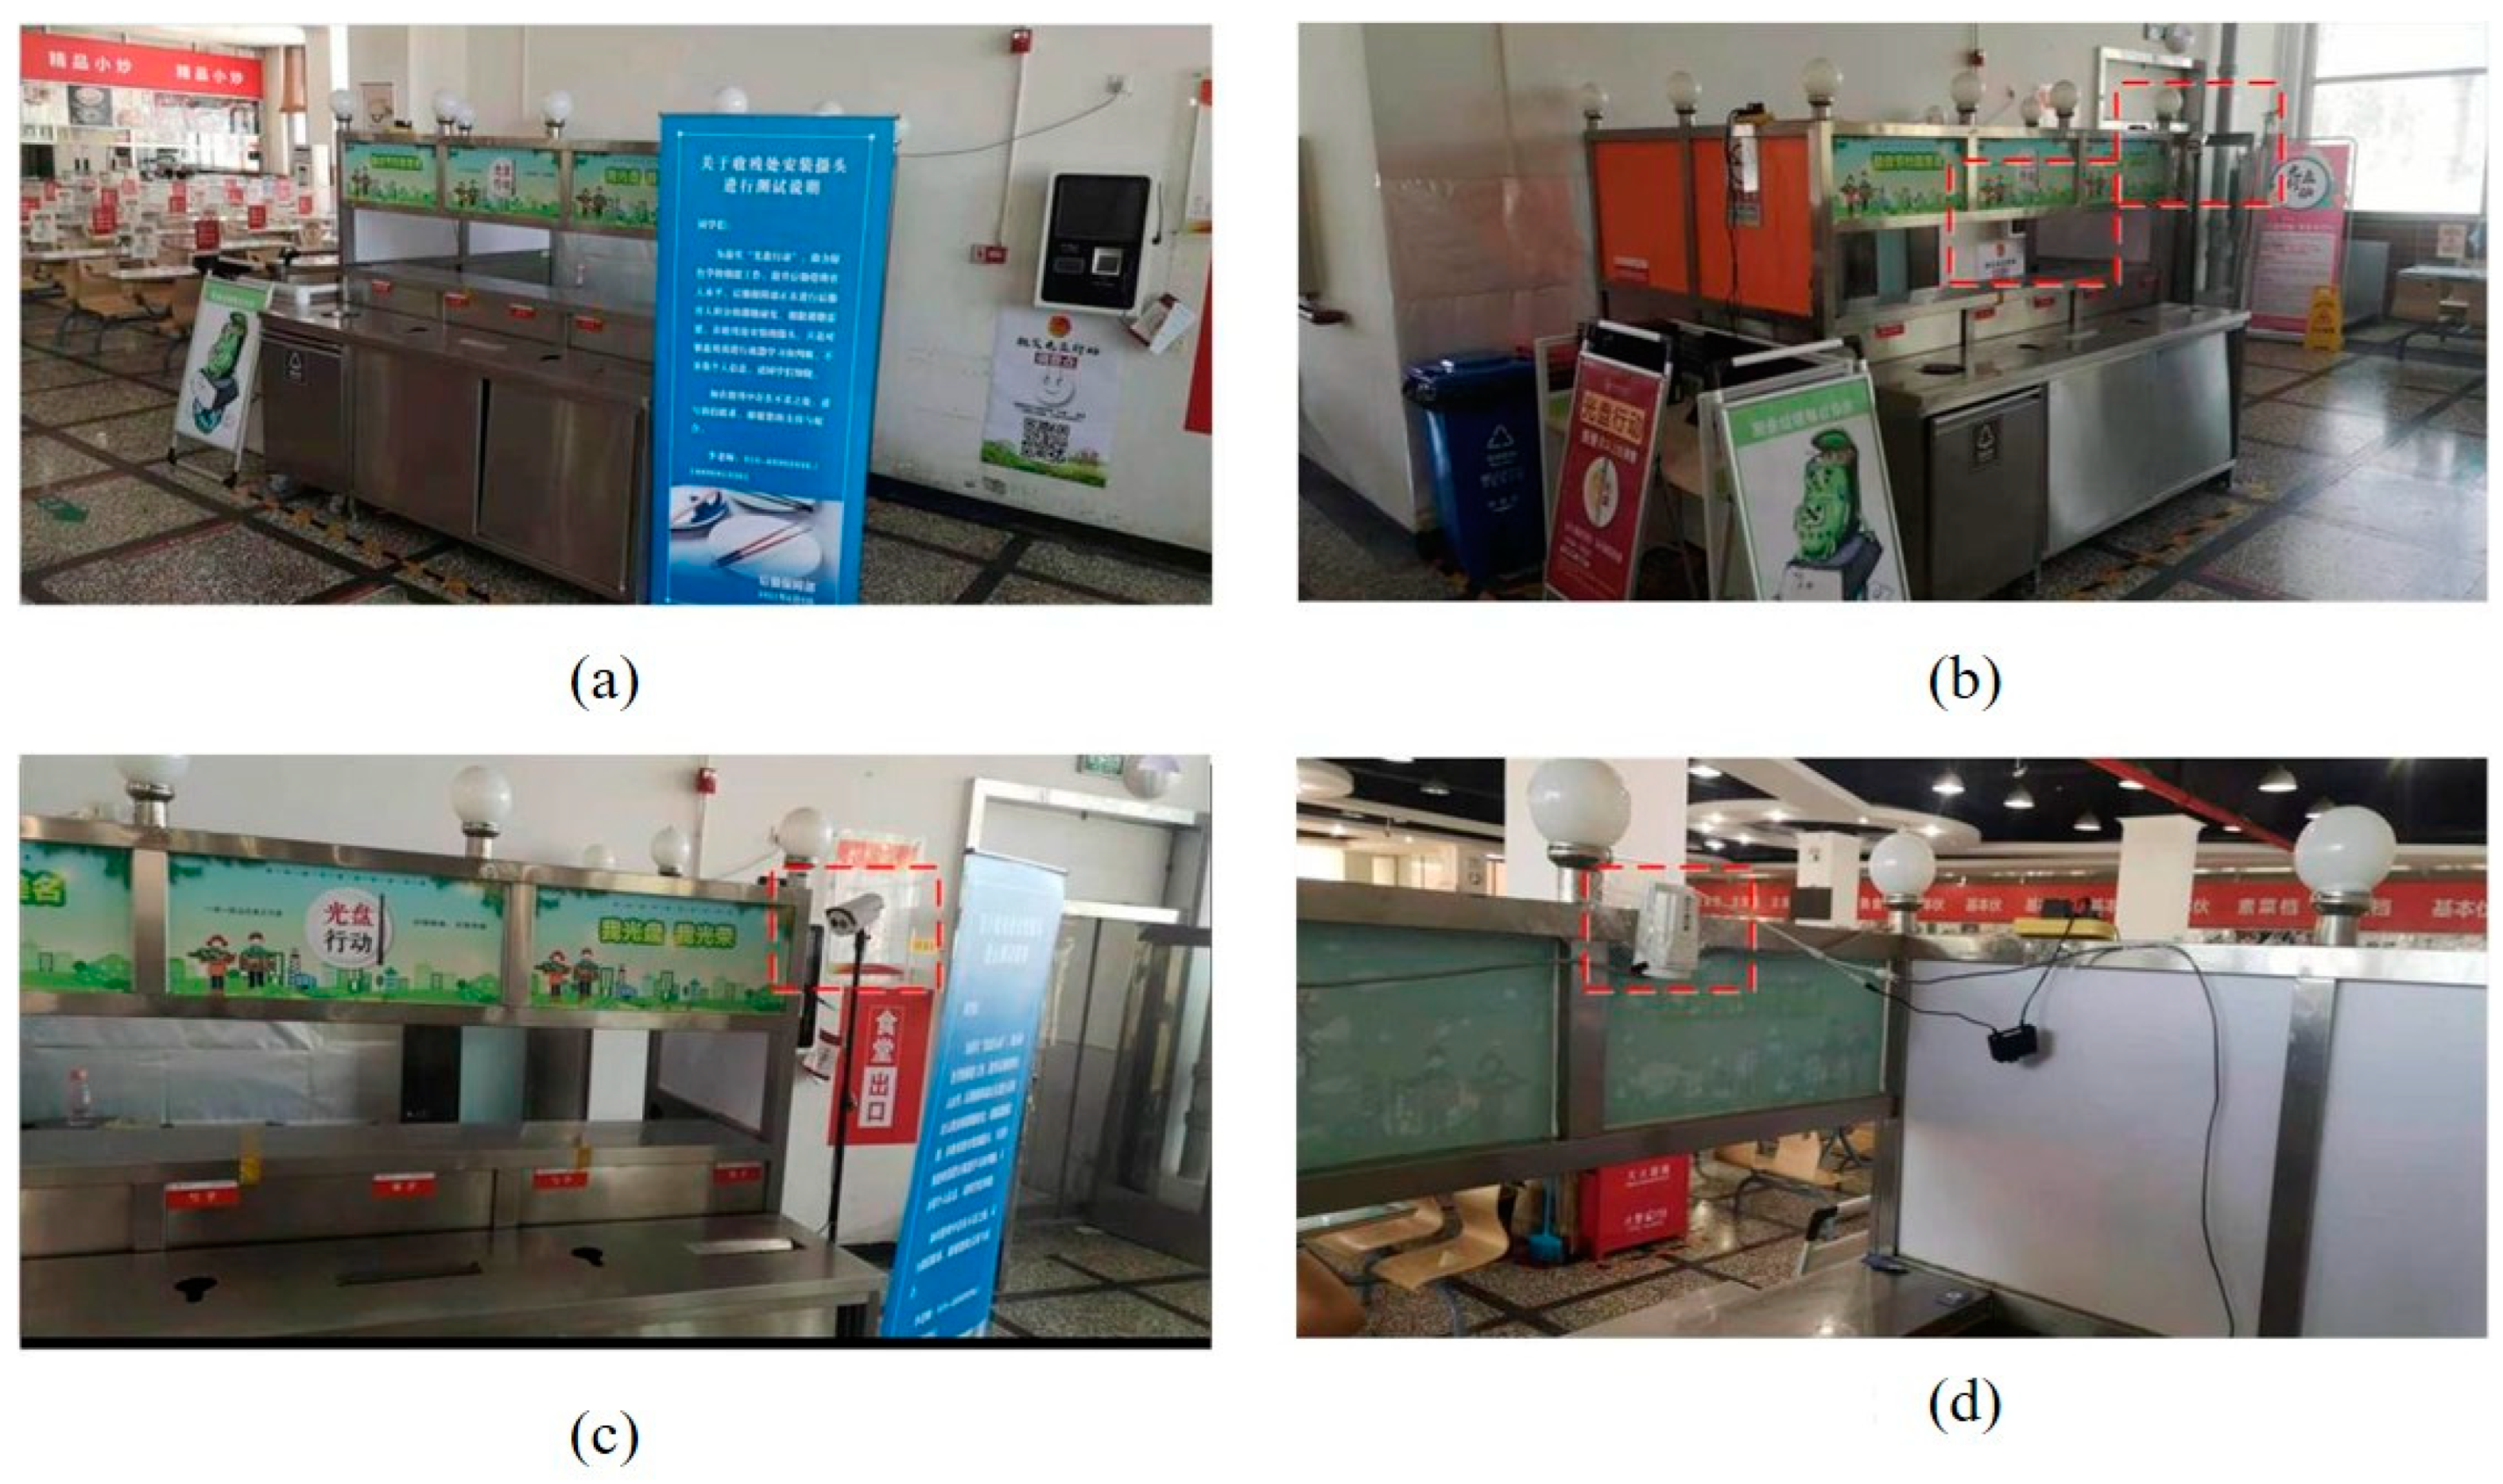
2.1. Data Acquisition
Data acquisition forms the backbone of the entire system, providing imagery that serves as training and validation samples for the plate recognition network (refer to
Figure 2). Multiple fixed cameras are installed at the waste collection points in each cafeteria (shown in the red box in the figure). These cameras are installed at fixed collection points, with a relatively stable shooting distance, allowing them to capture clear and detailed images while covering a limited variety of trays within the collection point. The cameras capture video data of both the plate and the diner’s face and use time-synchronization technology to achieve target identification and matching between multiple cameras.
As illustrated in
Figure 2, one camera is positioned directly above the waste collection point shown in
Figure 2d to vertically capture plate imagery. Additional cameras are mounted on tripods beside the collection point in
Figure 2c, primarily to capture the facial information of diners, aiding in matching plates with faces.
2.2. Data Preprocessing
Data preprocessing involves two key steps: interpretation marker establishment and dataset annotation. Interpretation markers, used to differentiate between clean and non-clean plates, are critical in reducing the subjectivity of human judgment and ensuring the accuracy of data annotation. Nearly 40 interpretation markers have been established based on extensive image data. The food waste determination standard adopts a combination of visual quantification and threshold grading: when only inedible parts (such as bones, shells), seasonings (such as garlic, ginger, and scallions), or edible residue covers less than 15% of the tray, it is classified as a “clean plate” (clean state); conversely, if the coverage of edible leftover food (such as leftover rice or vegetables) reaches or exceeds 15%, it is classified as a food waste event (See
Figure 3). This design addresses the FAO’s threefold requirements for food waste monitoring: edibility definition, operability quantification, and local adaptation. The specific threshold of 15% coverage rate is validated through local experiments. The overall classification framework refers to the authoritative standards for dining scenarios outlined in the FAO’s “
Global Initiative on Reducing Food Loss and Waste” published in 2015, aligning with the global collaborative efforts to reduce food waste.
In the dataset labeling process, firstly, one frame was extracted from the video recording every 0.5 s, and the images were screened based on manual visual inspection, discarding blurred or duplicated low-quality images. Due to the use of fixed camera shooting, the image quality was relatively stable, and there were fewer low-quality images. Next, the screened images were imported into Labelme v3.16.7 labeling software, and each image was labeled with clean and non-clean plates according to the preset labeling criteria. The corresponding .json labeling files were then generated. The annotation work was carried out by multiple annotators, and regular training and cross-checking of the annotation results were conducted among the annotators to ensure standardization and consistency of the annotation. Finally, all the .json annotation files were converted into .png format annotated images for training and accuracy verification of the deep learning network. A total of 2085 images were acquired and annotated, with a division of 4:1 between the training set and the validation set.
2.3. Clean Plate Recognition Method
The process of plate recognition in the target imagery involves locating and identifying the status of the plates (clean or not clean). The system utilizes a deep neural network based on semantic segmentation for plate recognition, which essentially follows a two-step process: (1) Inputting the training dataset into the network, which iteratively derives a fitting function; (2) Feeding the test dataset into the network, where the fitting function computes the recognition results. Selecting a suitable semantic segmentation network from the many available is crucial. Considering both hardware and software capabilities and practical needs, we employed three mature networks: U-Net, PSPNet, and DeepLab V3+ networks. In this study, we first compare the performance of the three networks in the task of recognizing CD-ROMs through quantitative analysis, and we select the network with the best performance for qualitative comparison. The main indexes for used quantitative comparison are the convergence speed and recognition accuracy of the networks, followed by qualitative analysis to further demonstrate the recognition effect of each model in different environments and tableware states. In the qualitative analysis, two typical scenarios, simple and complex, are selected for evaluation: the simple scenario includes a single empty plate arrangement, while the complex scenario involves different types of dinner plates with food residue. Due to the limited number of plate image scenes actually acquired, the selection of experimental scenes is relatively small, but it covers the typical situations commonly found in the cafeteria environment, which can effectively reflect the generalization ability of the model. The structure and characteristics of the three networks are as follows:
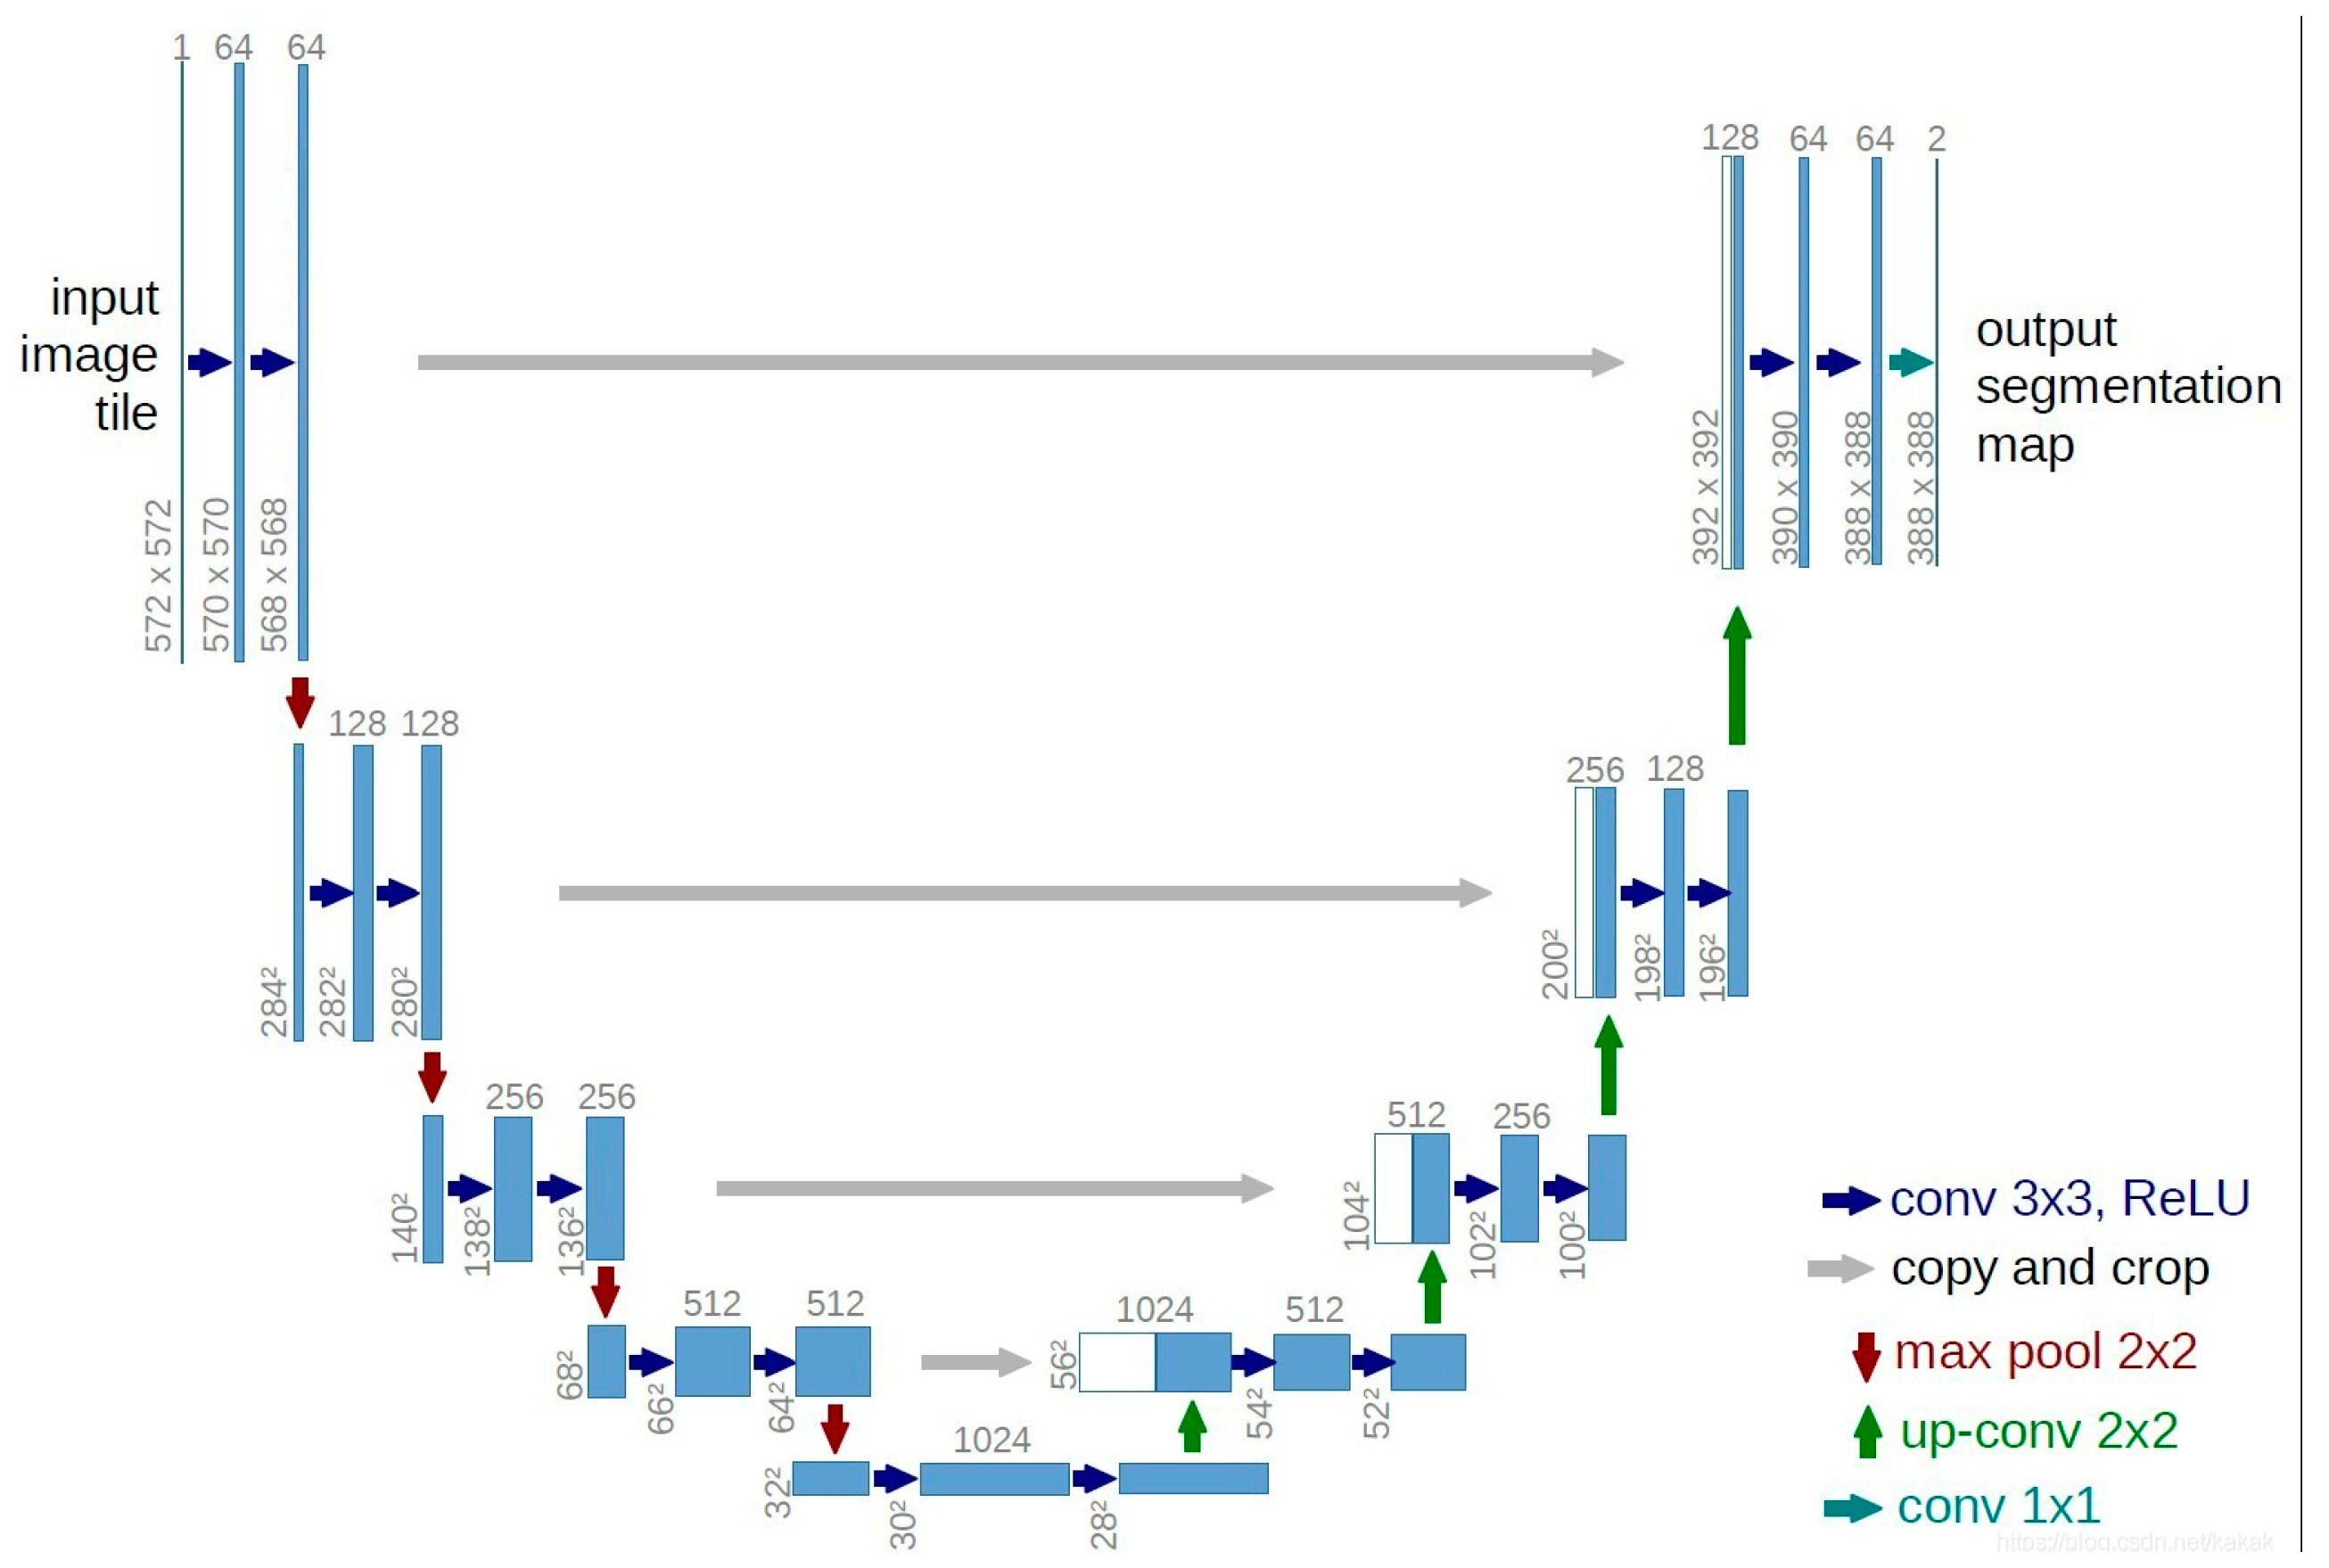
U-Net is a symmetric network with a simple structure that is capable of recognizing multi-scale features [
14]. Its structure is shown in
Figure 4.
The network structure is divided into three parts: downsampling, upsampling, and skip connections. During the encoding process, the network gradually reduces the image size through convolution and downsampling while extracting low-level features, such as the shape of the tray and the boundaries of food residues. During the decoding process, the network gradually restores the image size through upsampling and convolution, capturing high-level semantic features such as the specific location and shape of the leftover food. The skip connections in the middle fuse the features from the encoding and decoding stages, effectively preserving spatial information and improving the accuracy of tray details and food waste recognition. Through this structure, U-Net can efficiently extract key features necessary for clean plate recognition, enhancing the accuracy and robustness of object detection.
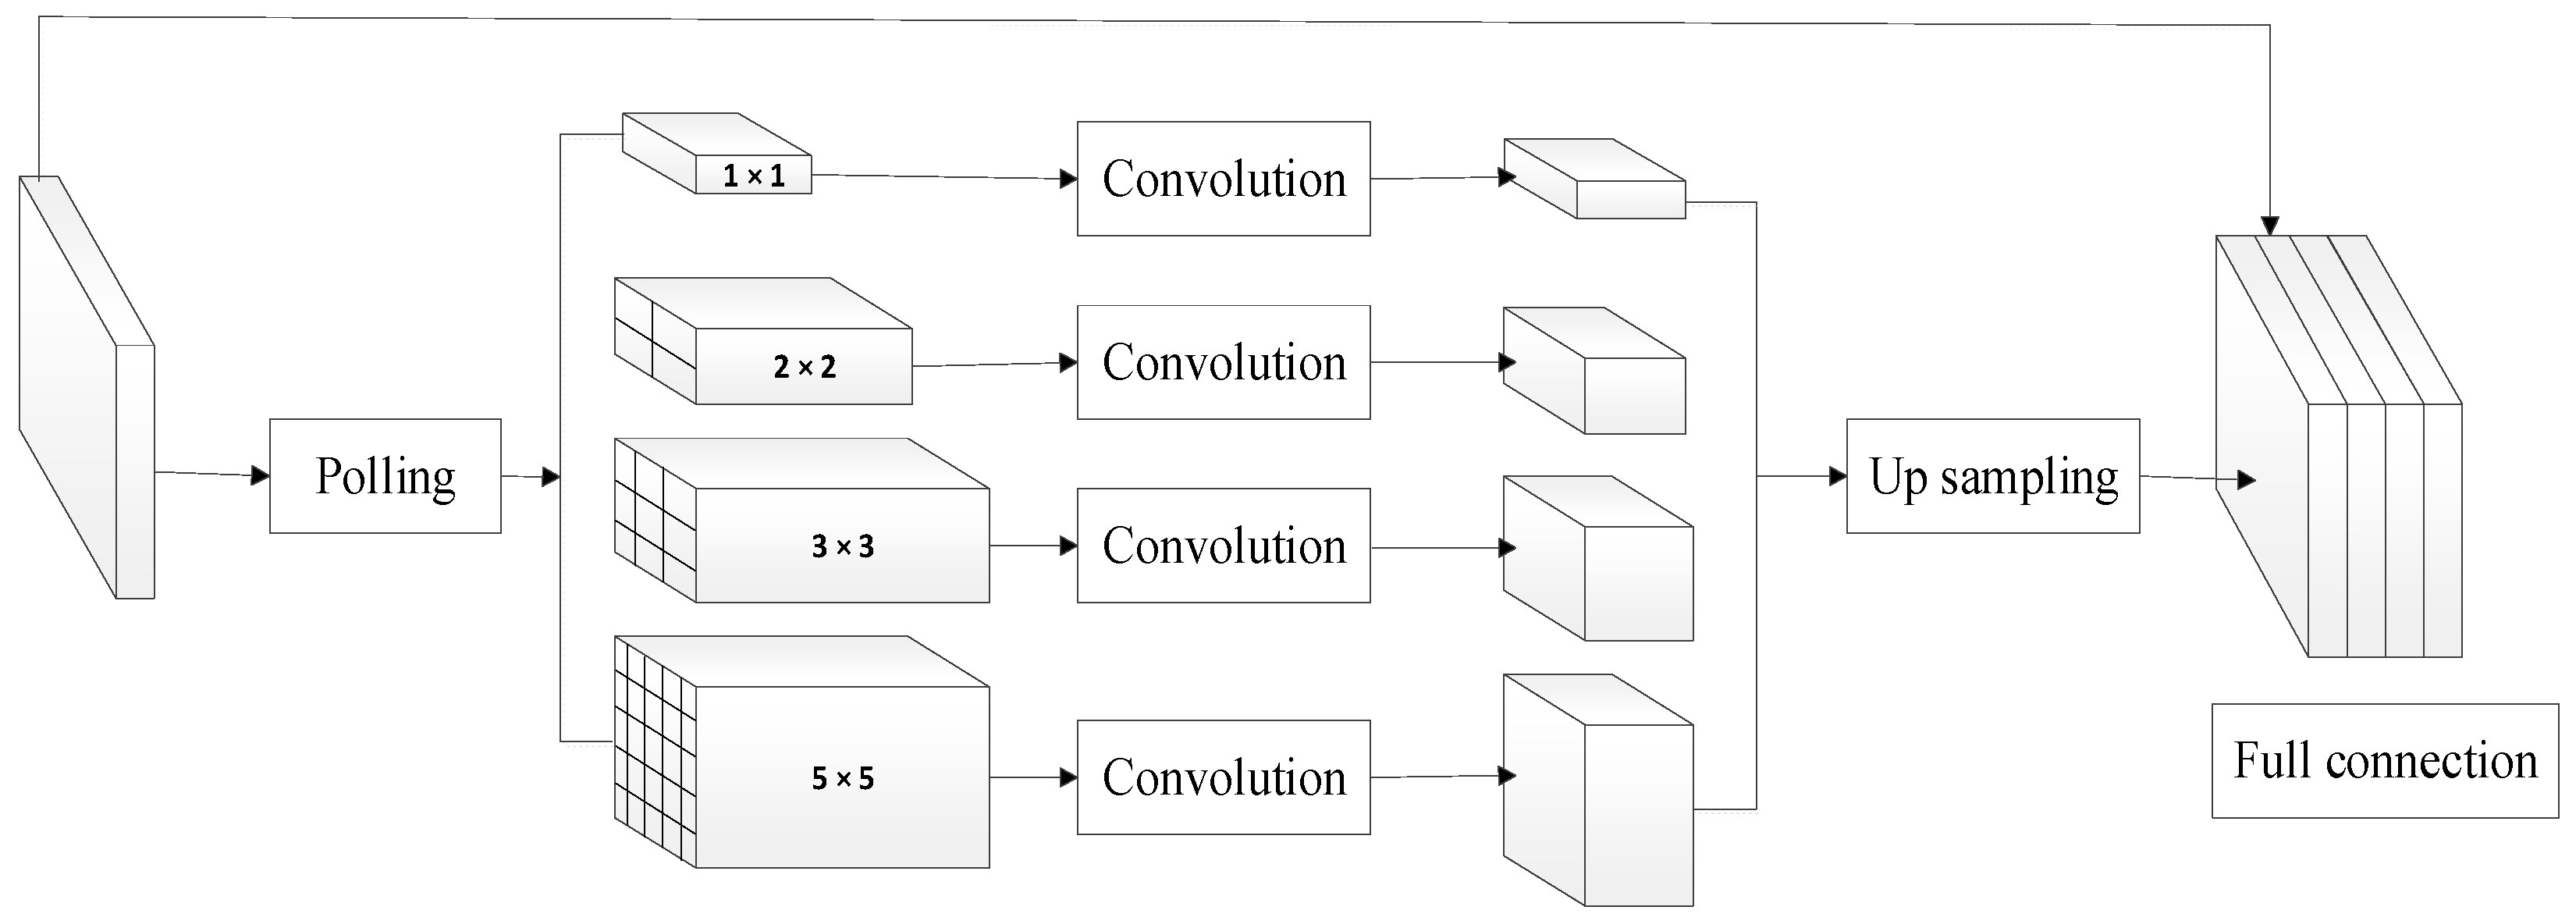
PSPNet has also been applied to the clean plate recognition task, with one of its key features being the use of auxiliary loss functions to accelerate the network’s convergence speed [
15]. This network structure can integrate image features from four different scales, as shown in
Figure 5. Each sub-region generates feature maps of different sizes through average pooling, which are then upsampled and merged. In this way, PSPNet enhances the understanding of global contextual information, which is particularly beneficial for accurately capturing global patterns of food residues and the overall layout of trays in clean plate recognition, reducing the likelihood of mis-segmentation. Additionally, the multi-scale feature fusion in PSPNet improves the model’s robustness when handling complex scenarios, especially in tray recognition tasks, allowing it to better handle trays and food residues of varying sizes and shapes.
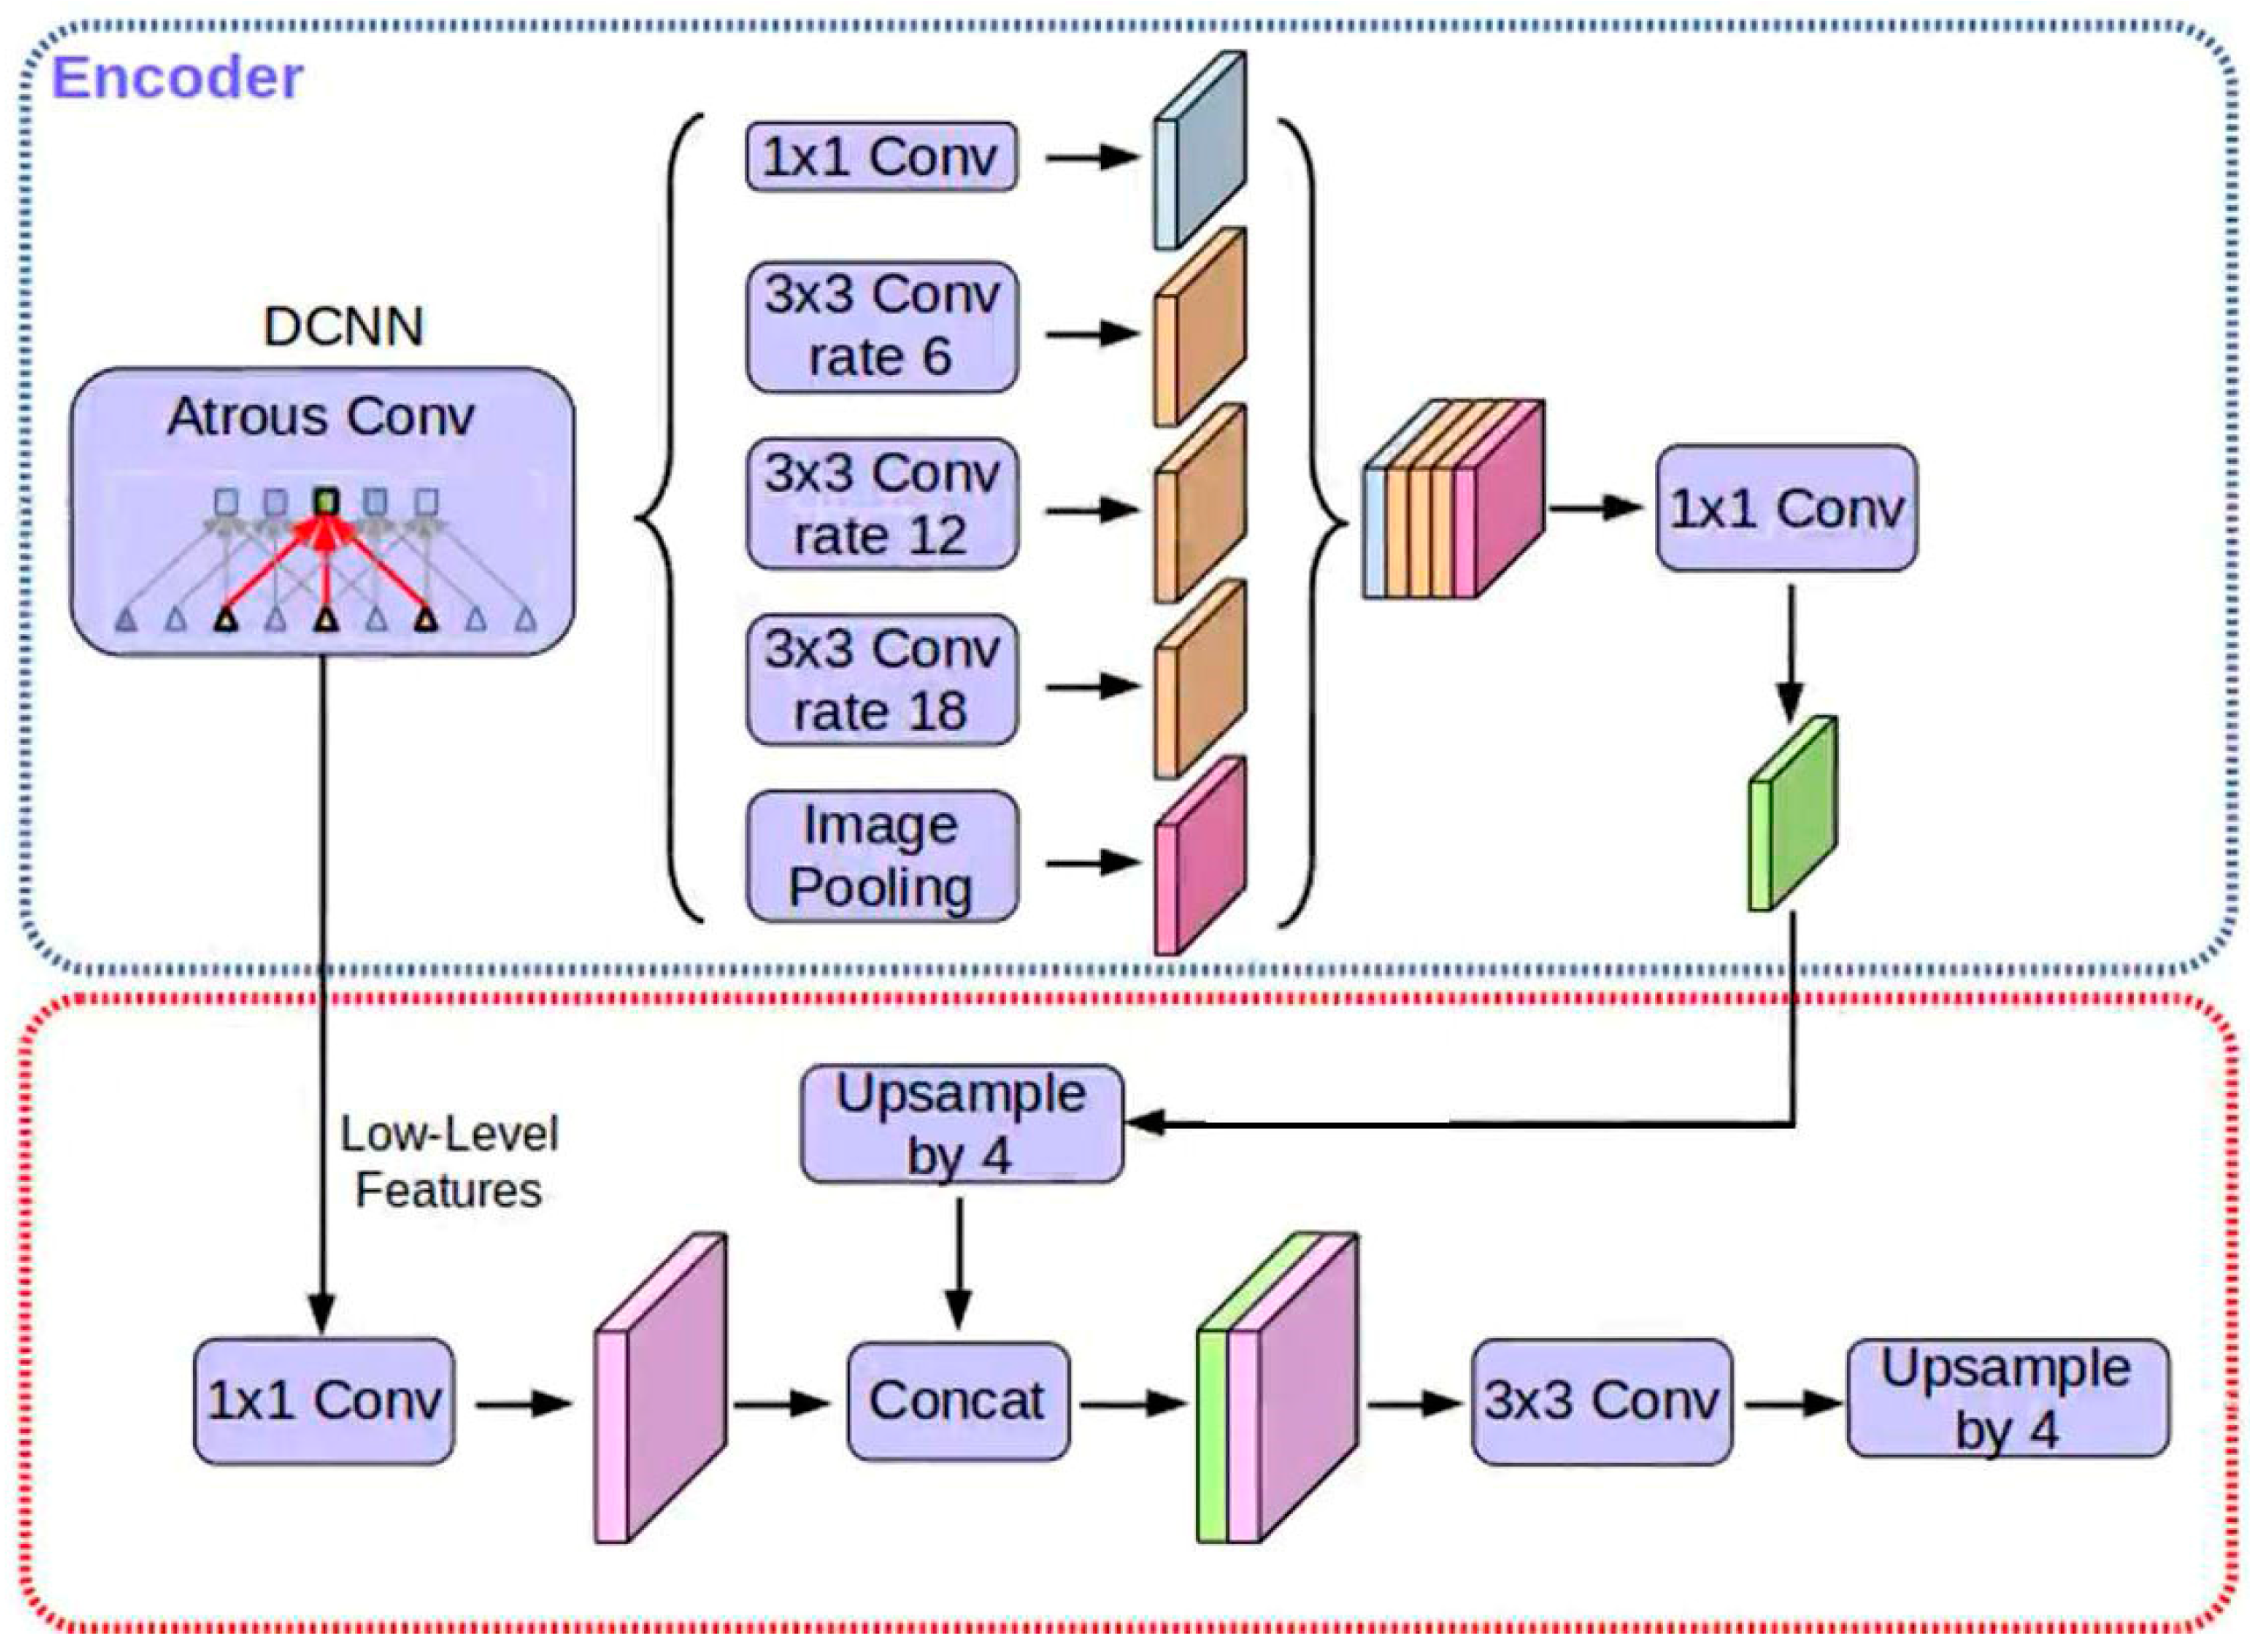
DeepLab V3+: With its encoder–decoder structure and edge segmentation enhancement features, DeepLab V3+ addresses the issue of feature loss caused by excessive sampling. In the encoding phase, the network expands the receptive field by introducing atrous convolution while avoiding loss of image resolution and increase in computational burden. In clean plate recognition, this enables the network to capture a wide range of information about the tray and its surrounding environment, improving the accuracy of food residue recognition. In the decoding phase, DeepLab V3+ processes the output feature tensor from the encoding phase through bilinear interpolation upsampling, gradually restoring the feature map to the original image size, as shown in
Figure 6 [
11]. Cross-layer connections further enrich the semantic and detailed information of the image [
16], aiding in the precise identification of food residues on the tray and mitigating the loss of details caused by excessive sampling.
The essence of the semantic segmentation model lies in mapping the image to pixel-wise semantic labels. The specific modeling process is as follows: Let the input image be
, which is an RGB tray image. The semantic segmentation model learns to map image III to a semantic label map
, where
C represents the number of semantic categories (in this case, tray and food residues). The loss function used during training is the pixel-wise multi-class cross-entropy, given as follows:
where
represents the true label, indicating that the pixel at position
(i,j) belongs to category
c, and
represents the predicted probability of the model for that category.
All networks were trained using Keras 2.1.5 with TensorFlow 1.13.2 as the backend on a 64-bit Ubuntu 16.04 system, powered by a 2.40 GHz CPU and an NVIDIA GeForce GTX 1080Ti GPU (NVIDIA Corporation, Santa Clara, CA, USA). To determine the optimal hyperparameter configuration, this study conducted ablation experiments on the three models, systematically evaluating the effects of different learning rates, batch sizes, and iteration counts on model performance. The learning rates (1 × 10⁻², 1 × 10⁻³, 1 × 10⁻⁴), batch sizes (16, 32, 64), and training iteration counts were tested through multiple rounds of experiments, with each hyperparameter combination evaluated individually to obtain the optimal configuration for each model.
2.4. Accuracy Assessment
To evaluate the recognition accuracy of the system, we used the Mean Intersection Over Union (MIOU) and Mean Pixel Accuracy (MPA) as the key metrics [
10]. The MIOU is defined as the ratio of the intersection to the union of the predicted and true value sets [
17,
18]. In contrast, the MPA represents the proportion of correctly classified pixels within each class, averaged across all classes:
MIOU is represented as , MPA is represented as , and k denotes the number of classes. Pij indicates the number of pixels that belong to class i but have been misclassified as class j, whereas Pii represents the number of pixels correctly classified as class i.
2.5. Recognition Result Feedback
The recognition results processed through the aforementioned procedures are imported in near-real time into the “University Logistics Education Points Service Management Platform” of Capital Normal University. This platform is designed to deeply explore the educational aspects within logistics operations. It quantifies students’ behavior, such as participation in anti-food waste initiatives and civilized dormitory competitions, and it allocates corresponding points. In order to further reduce food waste, the platform optimizes management in the following ways: (1) Personalized feedback mechanism based on recognition results: the system matches the recognition results with the diner’s information from facial recognition, and it matches it with the student’s number and name information, automatically updating it to the e-account. For users identified as “CD-ROM” users, the system will increase the number of points in their e-accounts to provide incentives. For users identified as having food waste behavior, the system will send reminders to their e-accounts, advising them to pick up food reasonably next time and encouraging them to pack leftovers in order to reduce waste. (2) Cafeteria management optimization: The system feeds back the results of the disc recognition to the cafeteria management to help them adjust the food supply structure based on the actual data. For example, they may reduce the supply of fatty foods and increase carbohydrates appropriately to better meet students’ dietary needs while optimizing the feeding strategy to reduce the waste of leftover food. In addition, the points platform provides a comprehensive feedback mechanism that allows users to verify the recognition results and raise objections or suggestions in a timely manner to ensure the fairness and accuracy of the data. Meanwhile, users can upload training samples on their own to continuously improve the recognition accuracy of the system. Students can check the details of the points at any time, understand the rules of the points, and use the points to offset part of the logistic service fees, thus enhancing their campus service experience. The platform has been integrated with other school management systems to achieve data sharing and interconnection, providing strong support for logistics management and education initiatives.
3. Results and Discussion
3.1. Hyperparameter Tuning and Experimental Setup
To optimize the model performance, hyperparameter tuning was conducted for PSPNet, U-Net, and DeepLab V3+. Three key hyperparameters were tested: learning rate, batch size, and training iteration count. For the learning rate, values of 1 × 10
−4, 5 × 10
−5, and 1 × 10
−3 were evaluated. The learning rate of 1 × 10
−4 was selected for both PSPNet and U-Net, while DeepLab V3+ performed optimally with a learning rate of 5 × 10
−5. The batch sizes tested were 16, 32, and 64. PSPNet and U-Net achieved the best performance with a batch size of 32, while DeepLab V3+ showed the best results with a batch size of 64. The final hyperparameter configurations are summarized in
Table 1.
3.2. Quantitative Comparison
This section employs quantitative analysis methods to compare the performance of the three networks, focusing primarily on network convergence speed and plate recognition accuracy. Network convergence is typically assessed by observing changes in network loss values. If the loss value decreases with the increase in epochs and stabilizes near a certain value, the network is considered to have reached convergence. Generally, faster network convergence indicates superior performance. The loss value trends for the three networks used in the system are shown in
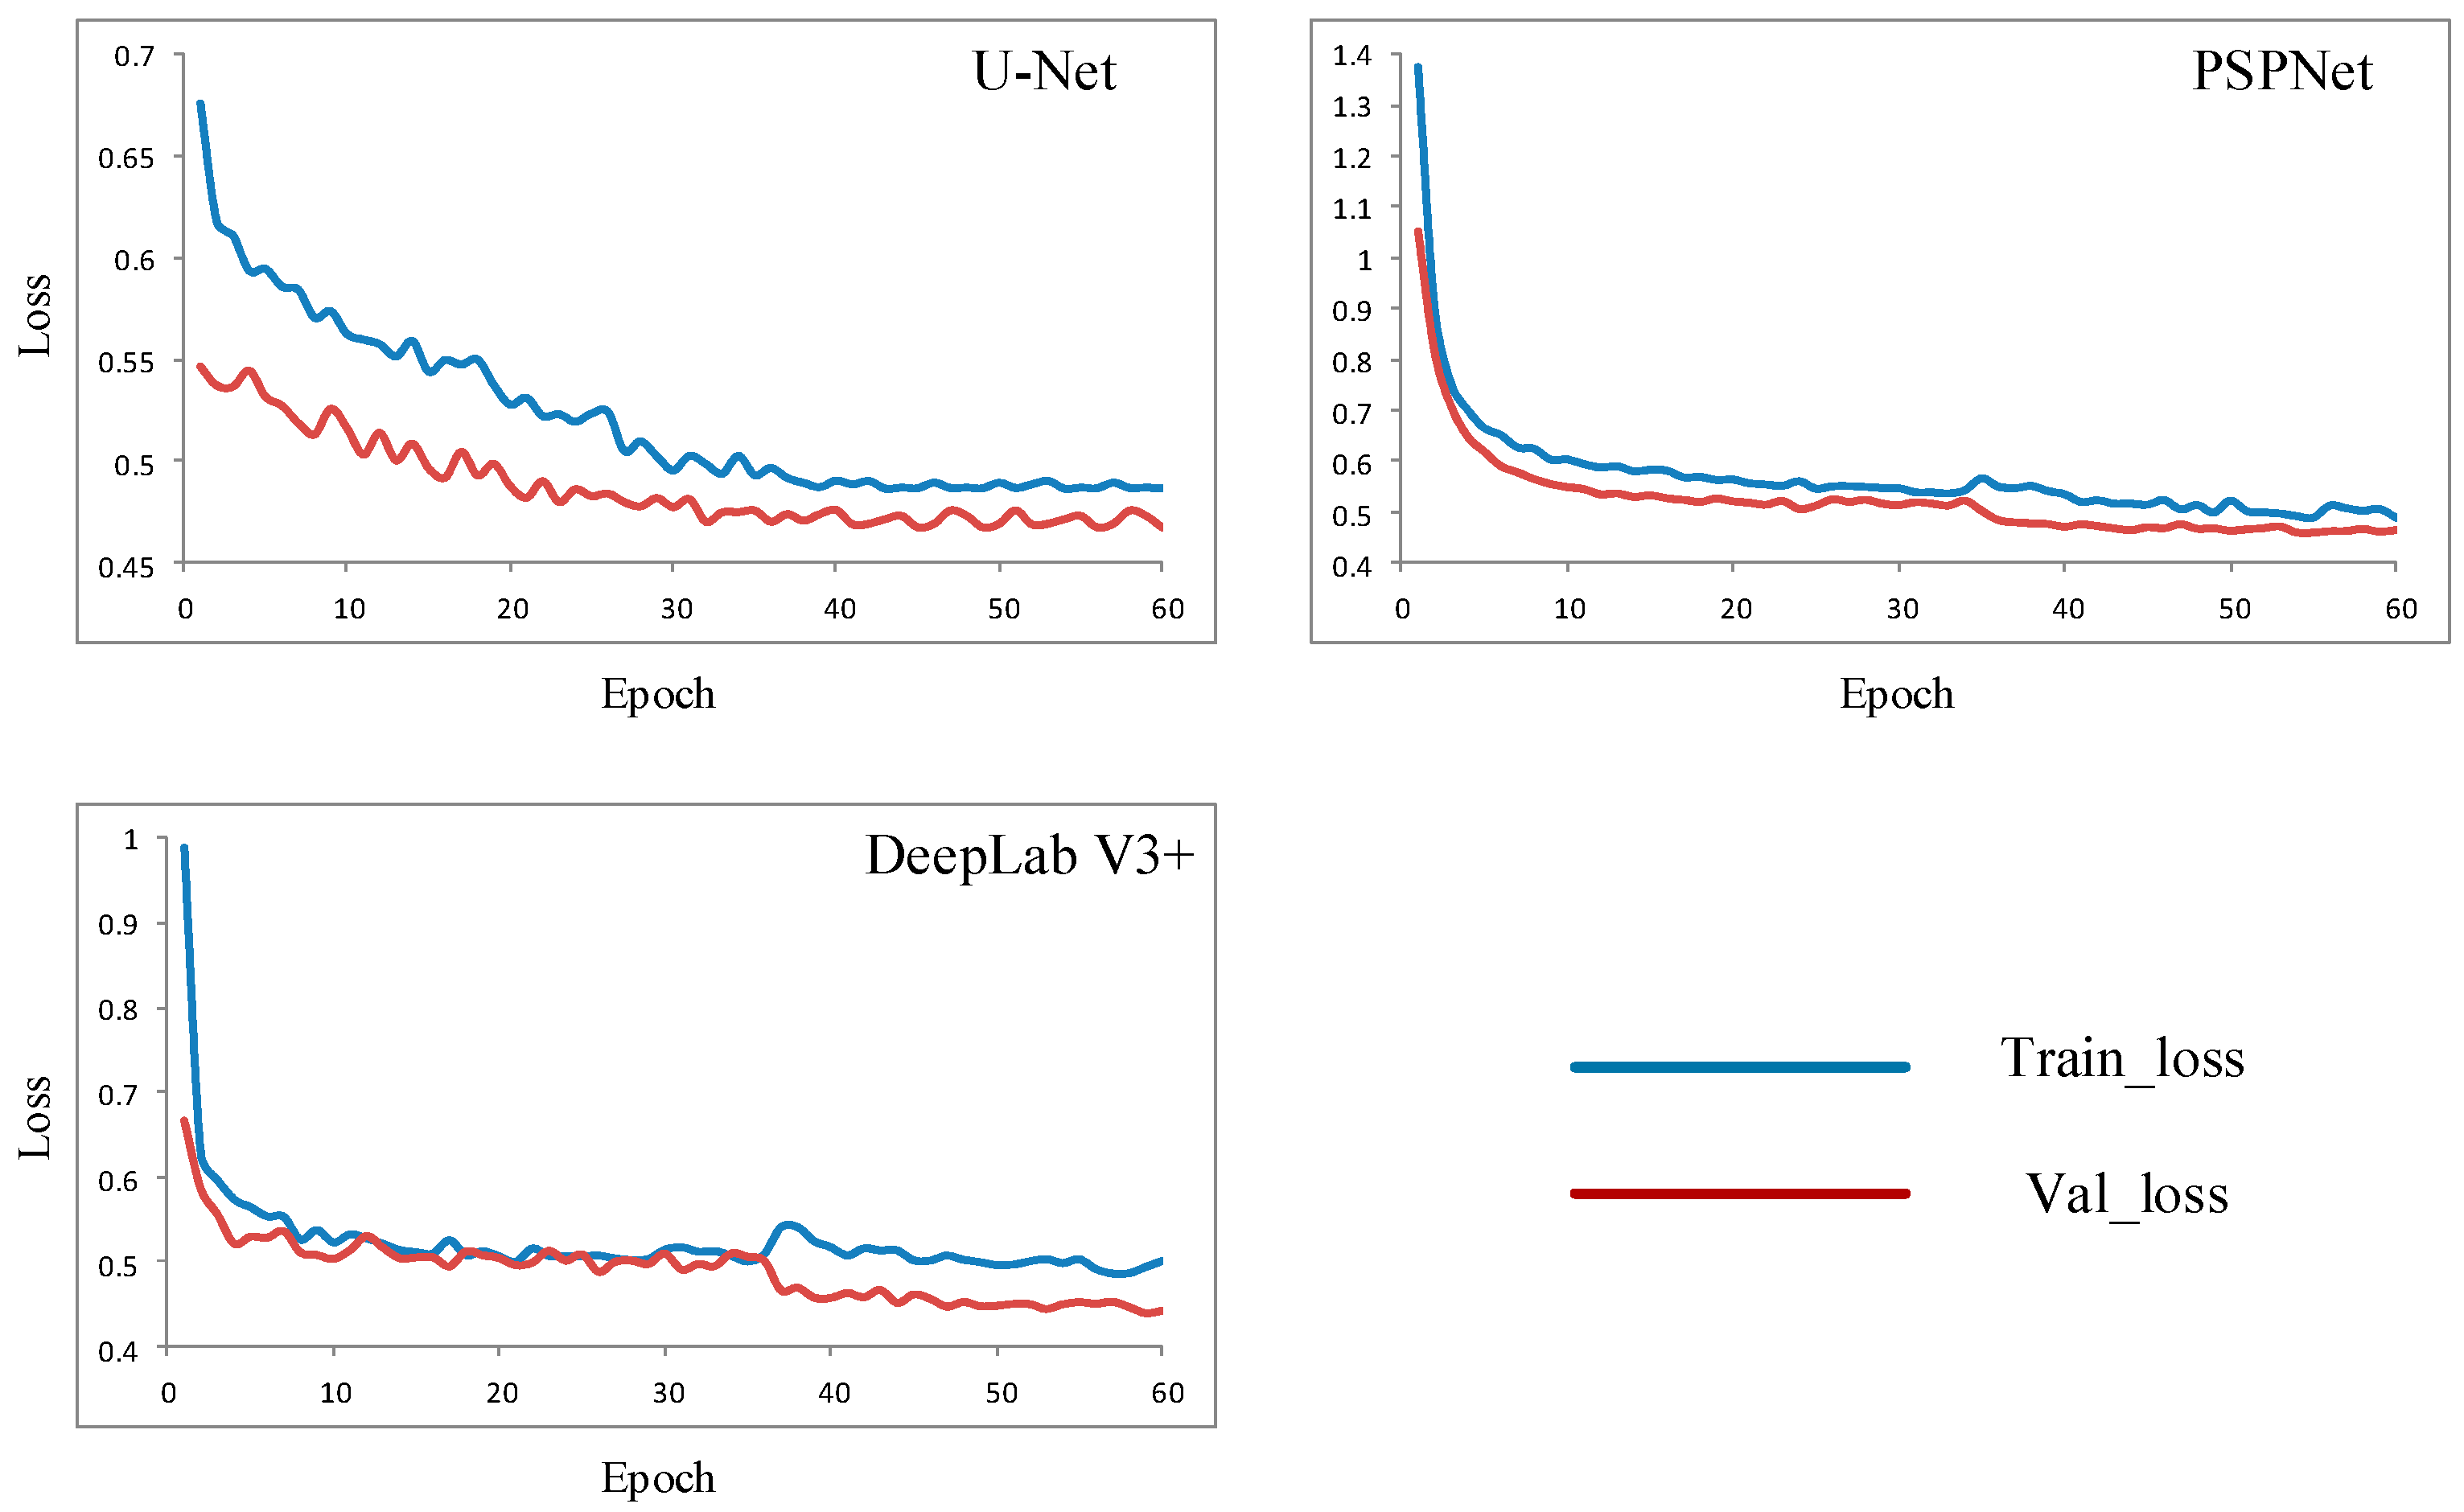
Figure 7, where the red line represents the loss function using the validation set, and the blue line represents the loss function using the training set.
Overall, under the parameter setting of epoch = 60, all three networks reached convergence. Regarding training set loss values, the U-Net network started with the lowest initial loss (<0.7), PSPNet had the highest (>1.3), and DeepLab V3+ was in between. The training loss values of all three networks decreased with the increase in epochs. U-Net’s loss value change was relatively gradual and remained almost constant after epoch = 40. PSPNet and DeepLab V3+ showed significant reductions in the first 10 epochs, then slowed down, similarly stabilizing after epoch = 40. The validation set loss value trends were similar, with U-Net having the lowest initial loss (<0.6), followed by PSPNet (>1.0), with DeepLab V3+ in between; all three networks’ validation set loss values remained largely unchanged after epoch = 40.
In summary, the training and validation loss values of all three networks stabilized after epoch = 40, indicating that each had reached convergence, and their convergence speeds were comparable.
The accuracy of plate recognition is the most direct reflection of network performance. Comparing the plate recognition accuracy of the three networks (
Table 2), it was found that all three could effectively identify clean plates (MIOU > 60%, MPA > 75%). Among them, U-Net had the highest recognition accuracy, with MIOU and MPA values of 68.64% and 78.21%, respectively. PSPNet had the lowest accuracy, with a MIOU of 63.72% and MPA of 75.66%, and DeepLab V3+ fell in between. Overall, without any parameter optimization, the three networks achieved relatively high recognition accuracy (accuracy difference < 5%), demonstrating the suitability of deep learning technology for effective plate recognition.
3.3. Qualitative Comparison
This section provides a qualitative analysis of network performance, focusing primarily on the effectiveness of plate recognition. Due to space limitations, we will only showcase the recognition results of the U-Net network, which has slightly higher plate recognition accuracy compared to PSPNet and DeepLab V3+.
Figure 8 and
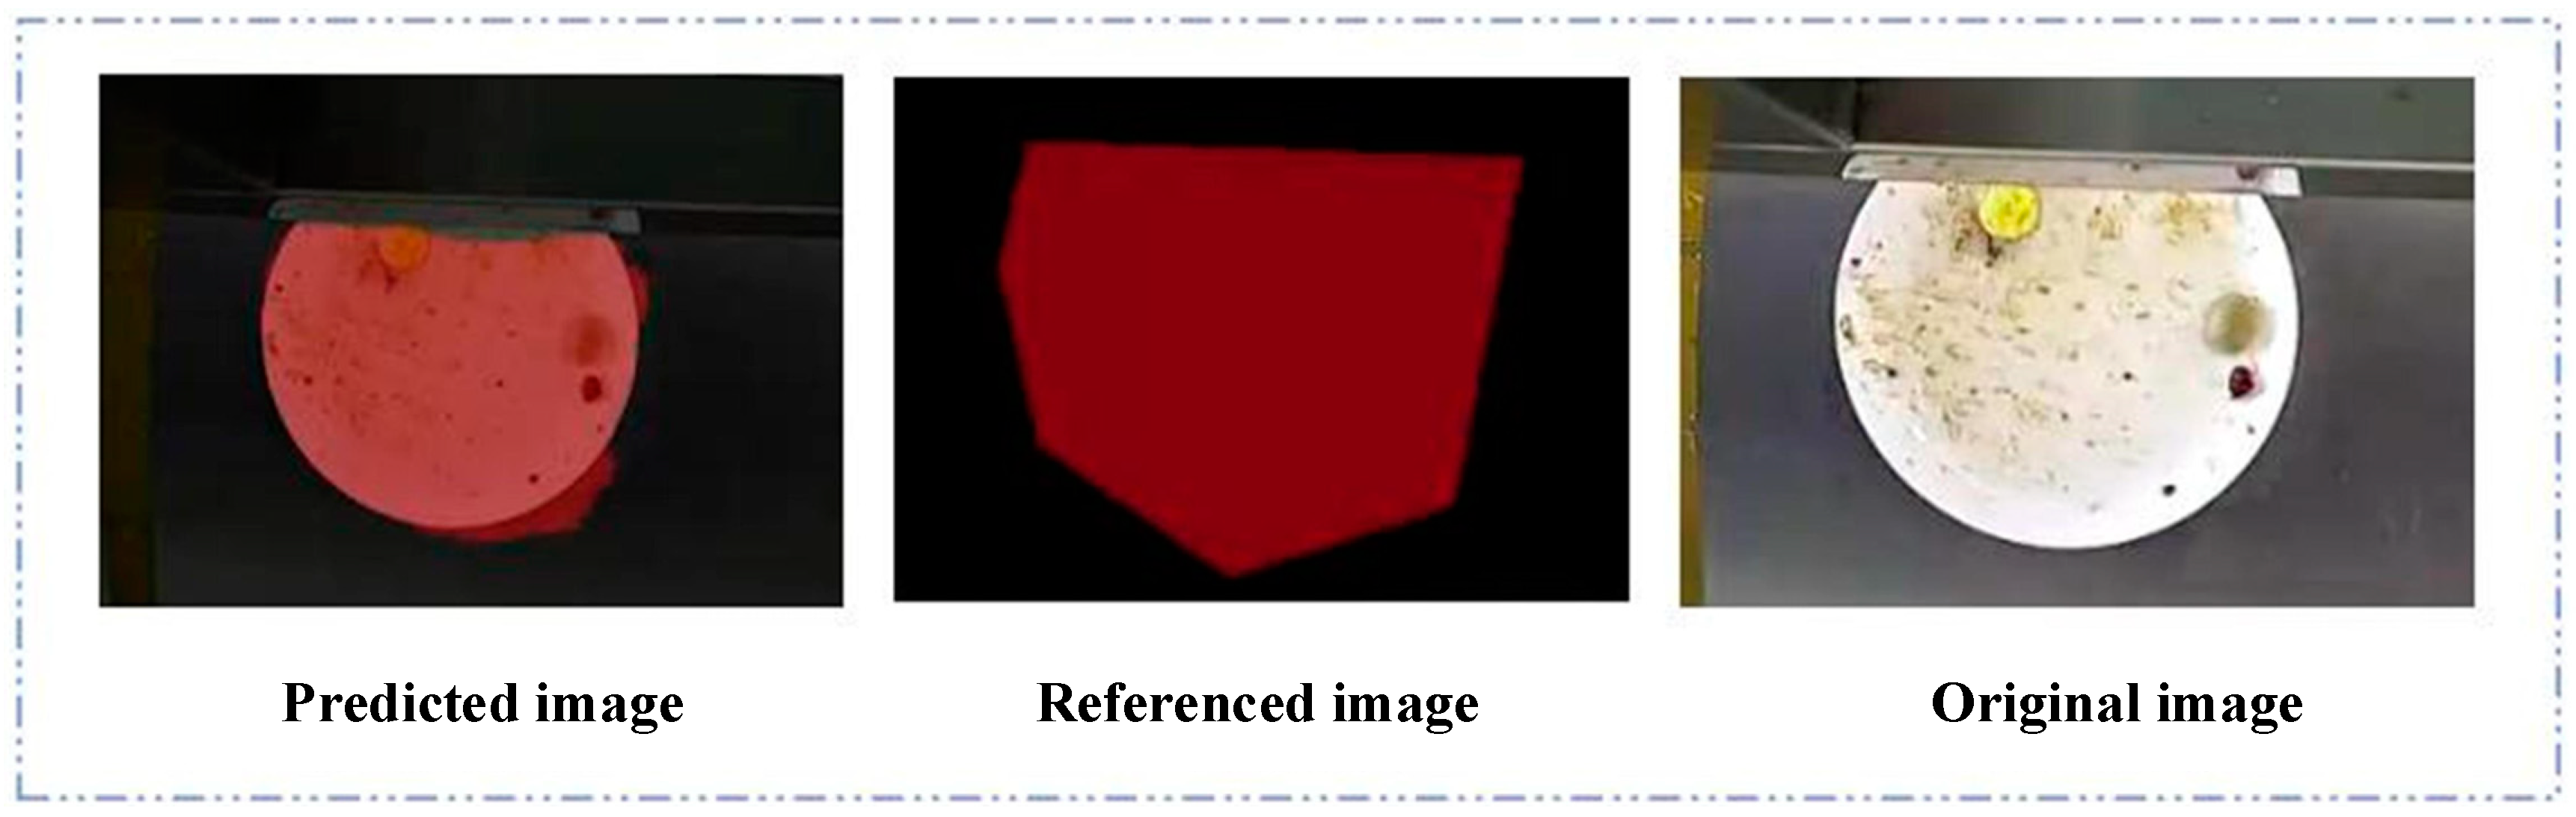
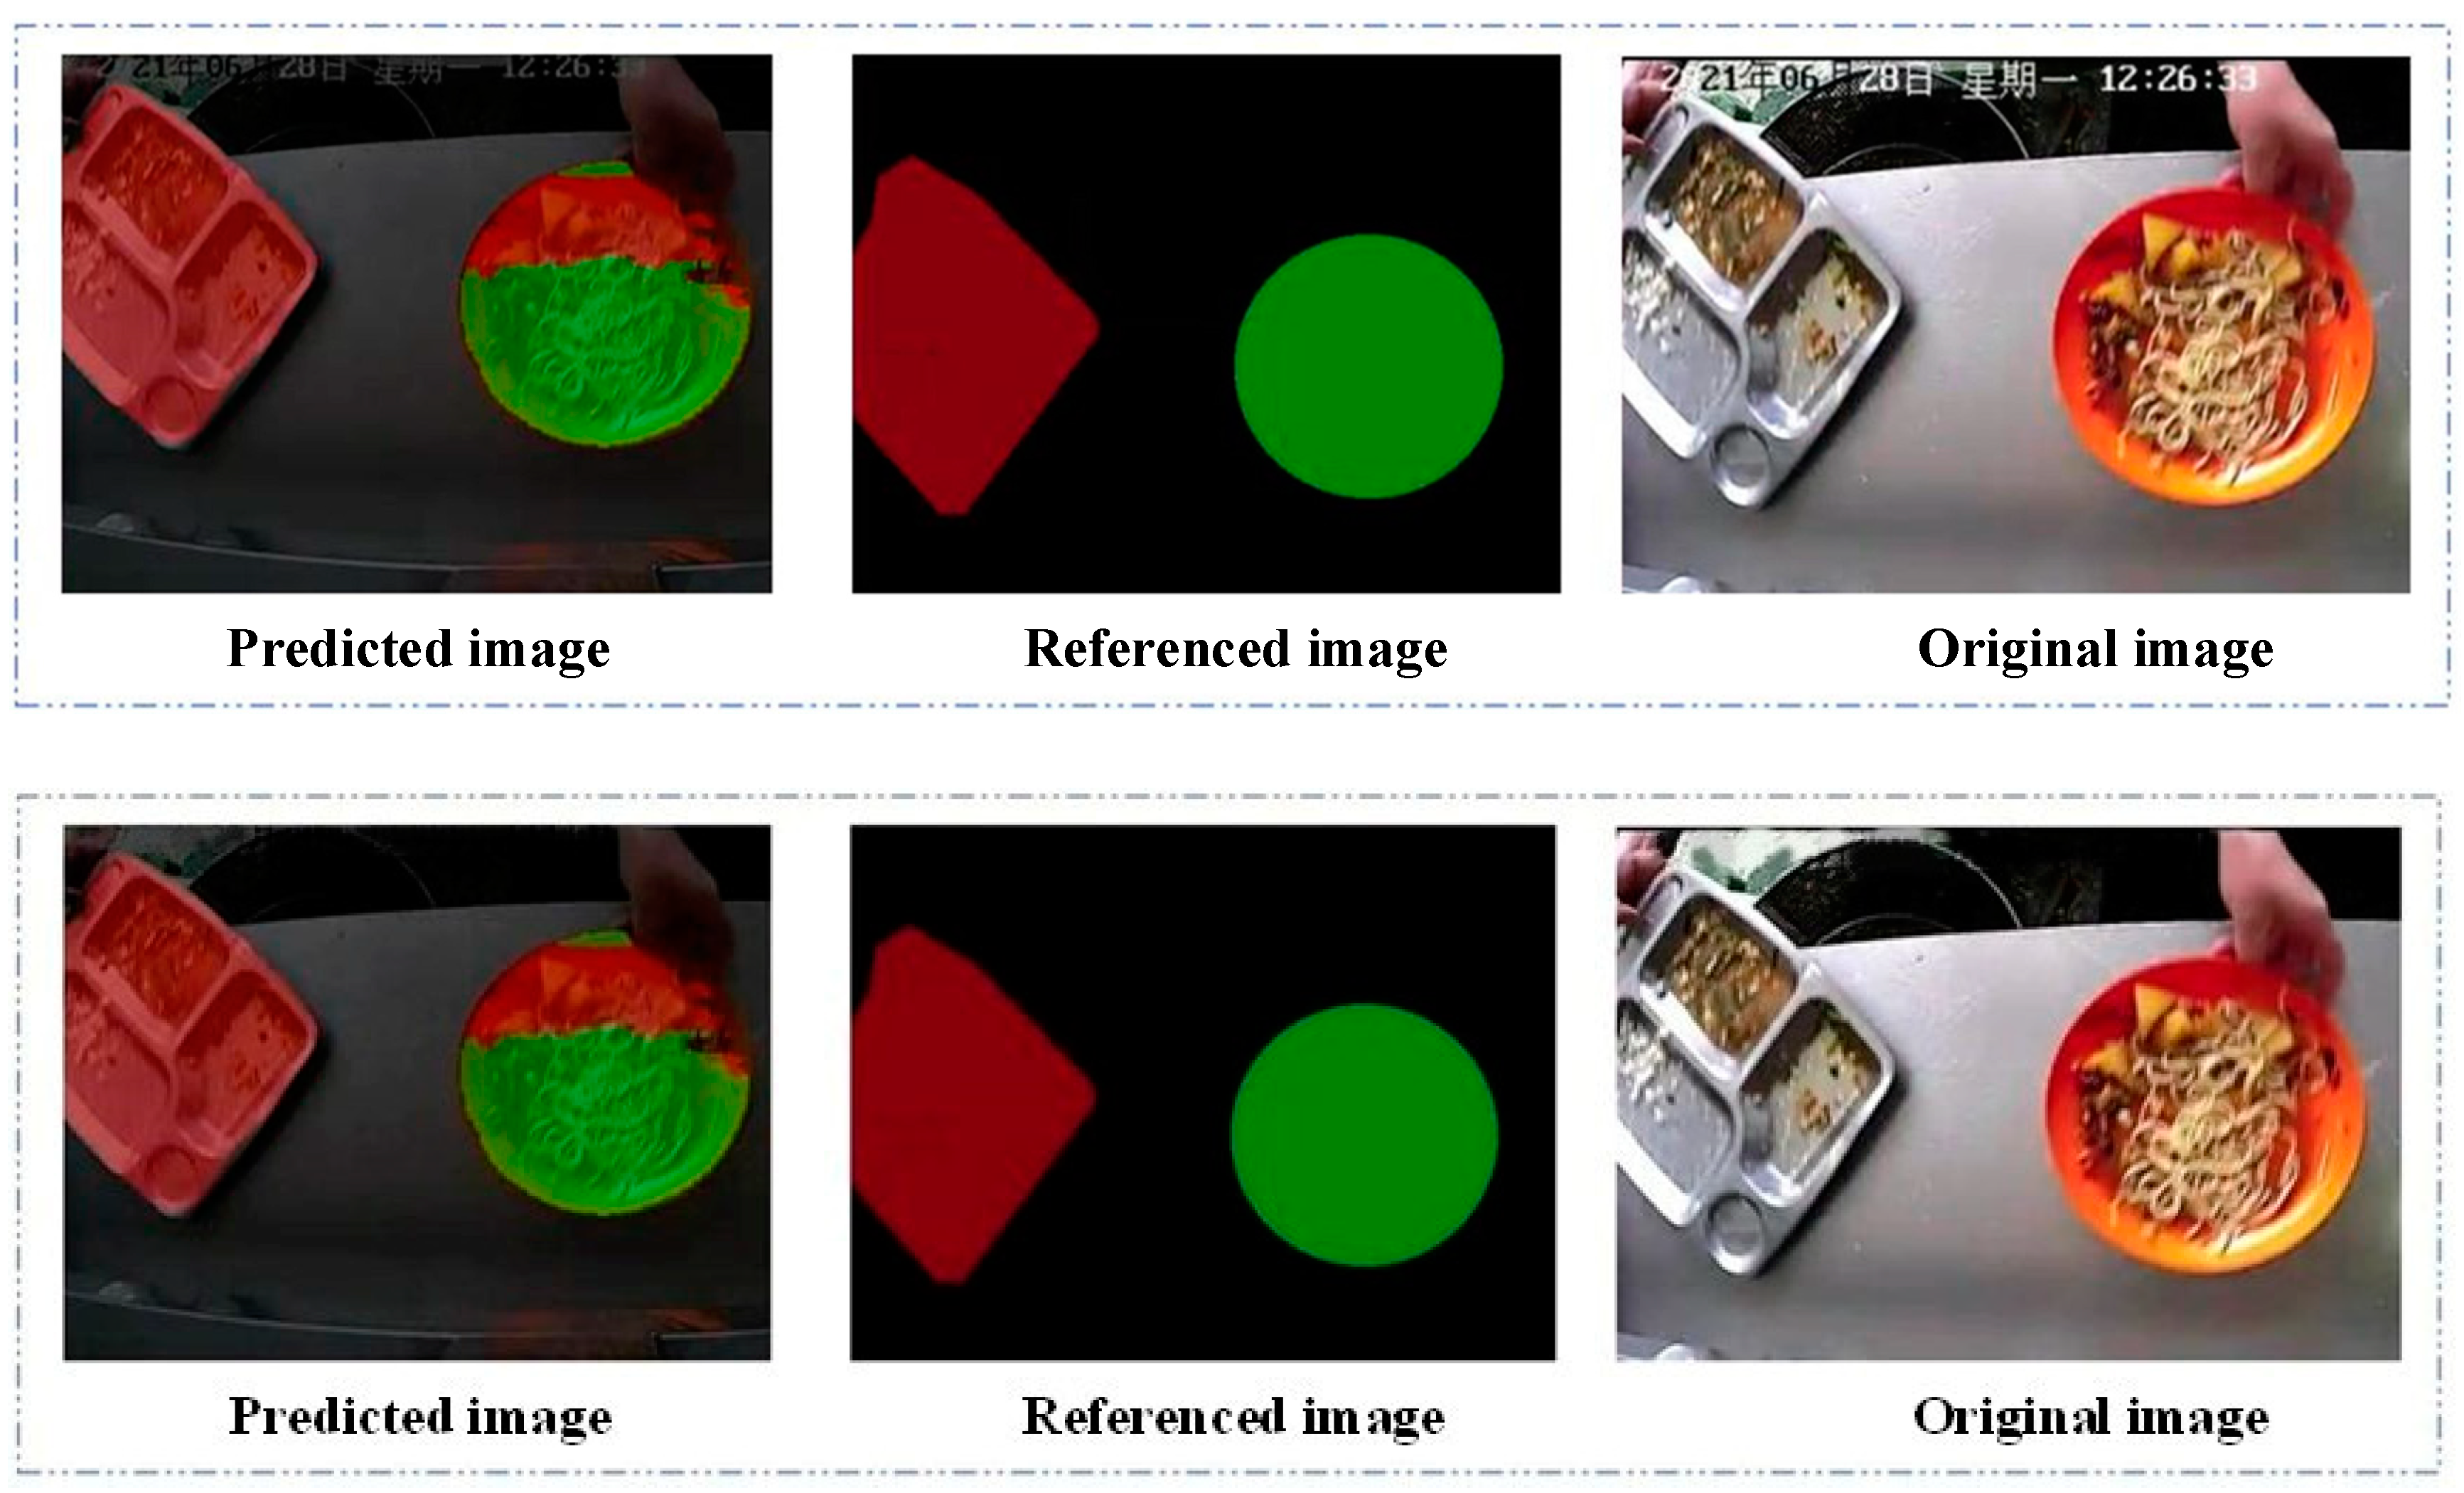
Figure 9 display recognition outcomes in various scenarios, featuring different types of dinnerware (bowls and plates) in various states (clean or not clean).
In the first scenario, which is relatively simple and contains only a single bowl in a clean state, the comparison between the annotated image and the original shows that the U-Net network can accurately identify the position of the bowl and precisely determine its status. Although the annotated image is not a perfect circle, the U-Net network still accurately recognizes the contour of the bowl. This result demonstrates the competent performance of the U-Net network in plate recognition tasks.
The second scenario is more complex, containing two targets: a plate and a bowl, with the plate being clean and the bowl not. Here, the U-Net network accurately identifies the positions of both the plate and bowl. Although it does not precisely determine the state of the bowl, the recognition is still accurate (not clean) based on the principle of area dominance. Notably, even when the plate’s color closely matches the background, the U-Net network can still accurately identify the plate and achieve an ideal recognition result. Some misidentification of bowl pixels may relate to an imbalance in the number of bowls and plates in the training samples. Overall, the U-Net network demonstrates commendable recognition performance in complex scenarios.
3.4. System Application Effectiveness
The plate recognition system developed in this study has been successfully implemented in a campus cafeteria environment, demonstrating significant effectiveness. Over one year of operation, the system covered a total of 12,000 users, with a notable increase in the proportion of users reducing food waste through point-based incentives. As a result, overall food waste in the cafeteria decreased by 13%. User feedback data indicate that over 85% of users were satisfied with the point redemption mechanism, and more than 75% actively participated in data uploads and provided improvement suggestions, highlighting broad acceptance of the system’s incentive strategy. Furthermore, the proposed approach was recognized as one of the “Top 10 Best Practices in Energy and Resource Conservation for Public Institutions (2021–2022)” by the China National Government Offices Administration, further validating its feasibility and effectiveness in promoting green campus initiatives and reducing food waste.
4. Discussion
The results affirm the effectiveness of the automated plate recognition system and demonstrate the feasibility of using deep learning in the creation of green schools. However, it is important to note that relying solely on limited manually annotated samples may not achieve high accuracy in plate recognition. In practice, issues such as misidentification can arise. Three key factors may contribute to lower recognition accuracy: (1) limitations in network selection and optimization for the “plate recognition” task; (2) an insufficient number of annotated samples and suboptimal annotation accuracy, making it difficult for the network to find the optimal parameter set; (3) challenges in deployment and expansion: environmental factors like lighting and complex backgrounds may affect recognition performance, and the system still has limitations in detecting food waste locations. To improve recognition accuracy, future research should focus on improvements in the three areas mentioned above, such as optimizing the network structure, increasing the number of high-quality annotated samples, enhancing the system’s adaptability to complex environments, and improving its scalability.
The plate recognition network based on semantic segmentation has a unique feature: it processes input plate images on a per-pixel basis, identifying each pixel on the plate. Under conditions like limited sample size and unoptimized network parameters, this approach can lead to inconsistencies in pixel classification for the same target (see
Figure 8). To address this, using a target detection-based plate recognition network could be a viable solution [
19,
20,
21]. Unlike per-pixel recognition in semantic segmentation, target detection networks classify the entire object, effectively preventing inconsistencies within the same target. These networks can not only recognize object categories but also differentiate between objects of the same category, thus effectively distinguishing between similar but differently shaped objects and reducing the frequency of misclassification. Therefore, in future model optimization, employing target detection networks could ensure more comprehensive target recognition, avoiding misidentification of plates. This study performed necessary hyperparameter adjustments and optimizations through ablation experiments to ensure fairness between different methods [
8,
18], but a comprehensive exploration of hyperparameter optimization has not been conducted. Future research could further explore the application of automated hyperparameter optimization techniques, such as Bayesian optimization and neural architecture search, to enhance model robustness and recognition accuracy.
The problem of insufficient sample size has long been considered a key challenge hindering the full potential of deep learning technology. To tackle this, researchers have explored data processing methods like data augmentation to overcome difficulties in data collection and annotation [
16,
22]. In this study, although the current dataset covers common cafeteria scenarios (such as simple and complex-shaped individual plates), the wide variety of food items and diverse plate shapes in school cafeterias pose challenges in sample acquisition. Additionally, manual annotation remains time-consuming and prone to inconsistencies. When using the coverage threshold method for labeling clean and non-clean plates, variations in food types (e.g., rice, vegetables, soup) and different forms of food residues (e.g., scattered rice grains, intact vegetable pieces, or residue with soup) may introduce discrepancies in shape and color, potentially leading to less precise annotations. The current dataset has demonstrated satisfactory performance in the canteen of Capital Normal University. However, to ensure the model’s robustness across diverse university canteen environments, further dataset expansion is necessary. This should encompass variations in tray types (e.g., material, compartment design), background conditions at collection points (e.g., window color, lighting conditions), and representative food categories (e.g., staple food preferences, residue patterns) to account for regional differences. To minimize these challenges, the system, through the logistics education platform, provides a user feedback service for the ‘Clean Plate Campaign.’ It employs incentive mechanisms like points redemption to encourage users to upload interpretation markers and plate sample data, providing suggestions for improvement of inadequate markers. This approach not only enriched the sample data and improved the network’s recognition accuracy but also fostered high user engagement. According to user feedback, over 85% of users were satisfied with the point redemption mechanism, and more than 75% actively participated in data uploads and provided improvement suggestions. The high level of user involvement enhanced the sense of participation among students and staff, further contributing to the continuous refinement of dataset annotation. Compared to traditional methods like meal card exchange, online points redemption is more aligned with student needs. Automating the points system in place of manual operations reduces human, material, and time costs while ensuring objective recognition results. The rewards, transitioning from fixed meals to both material and spiritual incentives, effectively promote the progress of green school initiatives.
In the practical deployment and expansion of the system, some issues still exist. Not only does the accuracy of tray recognition and adaptability in complex scenarios need improvement, but the system also faces new challenges when extending to broader dining and waste disposal scenarios. Variations in cafeteria lighting can cause plate edges to blur or colors to distort, reducing system performance. To address this, adaptive illumination enhancement algorithms (e.g., LIME) [
10] or multispectral data fusion can be integrated to improve robustness under complex lighting conditions. Additionally, the dynamic cafeteria environment presents challenges such as changing utensil placement angles, dishware variations, and food residues obscuring plate contours, all of which impact model performance. Introducing adaptive learning mechanisms could enable the model to automatically adjust parameters in response to new data, enhancing generalization ability. To address the issue of partial occlusion caused by improper tray placement, the camera array layout can be optimized to achieve multi-angle coverage. Additionally, a guided tray placement platform can be designed to standardize user behavior. However, when the tray is at an extreme tilt angle or partially obscured by highly reflective tableware, vision-based recognition systems still face a risk of misclassification. To address this, future research could integrate weight sensing units into the visual system to construct a multimodal perception network. By combining visual features and mass variation signals, a cross-validation mechanism could be established—for instance, triggering weight change analysis when the confidence of visual recognition falls below a threshold—thereby significantly enhancing the system’s fault tolerance in complex scenarios [
23]. This multi-source information fusion strategy not only compensates for the limitations of a single sensor but also provides multi-dimensional data support for subsequent statistics on tableware recycling.
In terms of system expansion, the current model primarily relies on data collected from fixed cameras in the canteen and has yet to cover broader dining and waste disposal scenarios (e.g., trash bins, dormitories). In the future, cameras or sensors could be deployed in waste collection areas and dormitories to enhance recognition capabilities. Additionally, the current model mainly focuses on leftover food on plates, overlooking the impact of individual and environmental factors on waste behavior. By analyzing these factors, the system can predict waste trends across different times, food types, and groups, improving adaptability and robustness. For instance, changes in ingredient consumption rates, diner fluctuations, and the effects of events or holidays can influence waste behavior. Integrating these data allows the system to adjust strategies in real-time, optimizing resources and reducing food waste more effectively. Secondly, food texture and quality may directly influence waste behavior. Future research could incorporate user feedback on food texture, as well as the types and quantities of leftover food, into model training. By analyzing consumption patterns and residual characteristics of different ingredients, a more sophisticated multimodal recognition system could be developed. Integrating visual information with behavioral data could further enhance recognition accuracy, driving the development of a more intelligent and efficient green campus.
5. Conclusions
This paper has detailed the exploration and implementation efforts of Capital Normal University towards green school initiatives, focusing on the construction background, system composition, recognition results, and policy mechanisms of the automated plate recognition system. Leveraging deep learning technology, the system enables fast and automated recognition of clean plates, achieving an accuracy of over 70%. This significantly reduces the subjectivity of manual identification while improving recognition efficiency. Despite the fact that the general deep learning model used was not specifically tuned for this task, it still performs well in plate recognition, demonstrating its applicability and potential in related scenarios. Additionally, the incentive mechanism of the educational platform fosters data accumulation and accuracy improvement. The system’s implementation has effectively promoted food conservation, reducing overall cafeteria food waste by 13%. Additionally, the reward and incentive mechanism established on the logistics education platform provides an improved platform for communication and feedback among students and staff, further supporting the enhancement of plate recognition accuracy with additional data.
However, the system has areas for improvement: the interpretation markers are not comprehensive enough, the recognition accuracy for meals with less distinct features is lower, and the efficiency of the student feedback sample review mechanism could be enhanced. Future developments will focus on improving the quality of data acquisition, refining interpretation markers, diversifying reward and penalty measures, and enhancing the humanized management mechanisms. These improvements aim to elevate the ‘Clean Plate Campaign’ to a new level, promoting a more intelligent and humane approach to advancing green campus initiatives.


