

Optimal Arrangement Strategy of IoT Sensors in Urban Drainage Networks: A Review


Abstract
1. Introduction
2. Literature Sources
3. Arrangement of IoT Sensors in the Drainage Network
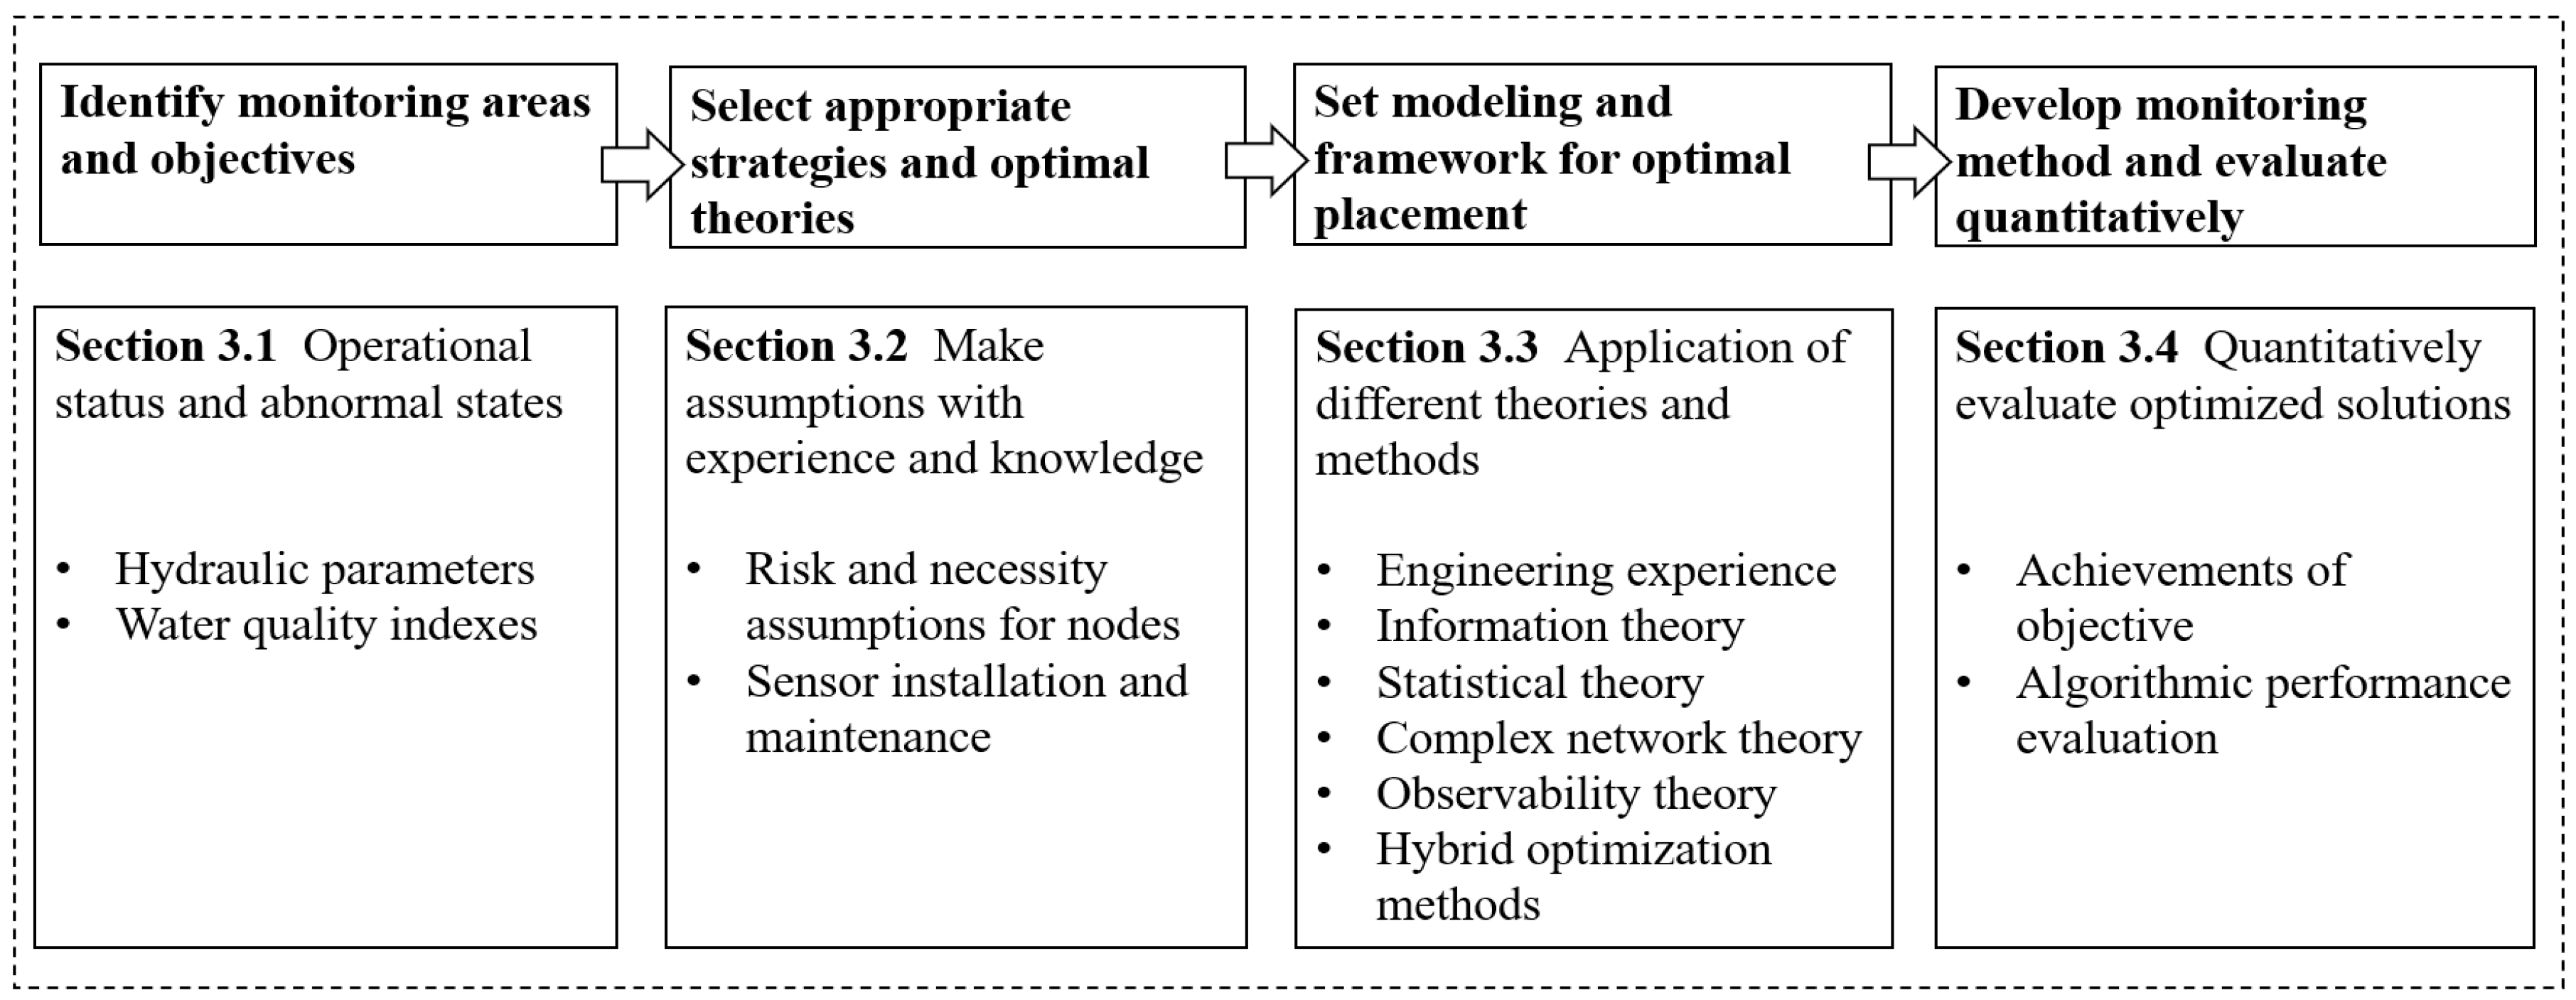
3.1. Classification of Monitoring Objectives
3.1.1. Monitoring of the Operational Status of the Pipeline Network
3.1.2. Identification of Abnormal States in Pipeline Networks
- (1)
- Tracking and Source Tracing of Target Pollutants
- (2)
- Hotspot Monitoring of Floods and Overflows
3.2. Assumptions for Scheme Design
3.2.1. Risk and Necessity Assumptions for Nodes
3.2.2. Assumptions for Sensor Installation and Maintenance
3.3. Optimization of Monitoring Point Locations
3.3.1. Design Evaluation Methods Based on Engineering Experience
3.3.2. Design Evaluation Methods Based on Information Theory
3.3.3. Design Evaluation Methods Based on Statistical Theory
3.3.4. Design Evaluation Methods Based on Complex Network Theory
3.3.5. Design Evaluation Methods Based on Observability Theory
3.3.6. Hybrid Optimization Methods and Application
3.4. Quantitative Evaluation of the Monitoring Scheme
4. Summary and Recommendations
- (1)
- The monitoring of drainage networks primarily reflects their operational status and detects and identifies abnormal states through hydraulic and water quality parameters. Different monitoring areas correspond to distinct monitoring indexes, which, in turn, gives rise to varying layout schemes. Nevertheless, the arrangement of IoT sensors for different networks should strive to provide the maximum amount of valid information.
- (2)
- In practical scenarios, multiple types of sensors are required for collaborative monitoring and sensing of UDNs. The sensor arrangement methods, based on information theory, statistical theory, and complex network theory, have their own characteristics and adaptation of application. Modularly combining these methods or employing hybrid optimal strategies can be useful for the design and evaluation of optimal layout solutions.
- (3)
- The quantitative evaluation of monitoring schemes is mainly conducted based on the degree of objective achievement, performance evaluation indexes of optimization algorithms, comparisons with the original sensor layout scheme, or contrasts in the effects achieved by different optimization methods. Nevertheless, a systematic and standardized quantitative evaluation process and methodology for monitoring schemes remain to be established. The current optimized layout methods may not be optimal and deserve further study.
- (4)
- The existing research on the optimal layout of sensors predominantly focuses on spatial distribution and quantity. In the future, dynamic optimization strategies can be explored by implementing a phased deployment–feedback iteration approach. In the initial stage, sensors should be preferentially arranged at critical nodes. Subsequently, the arrangement scheme for the next stage can be adjusted and determined according to the collected feedback data and information gain. The dynamic optimization strategy has the potential to enhance the accuracy and objectivity of scheme design and evaluation.
Author Contributions
Funding
Conflicts of Interest
References
- Fahle, M.; Hohenbrink, T.L.; Dietrich, O.; Lischeid, G. Temporal Variability of the Optimal Monitoring Setup Assessed Using Information Theory. Water Resour. Res. 2015, 51, 7723–7743. [Google Scholar] [CrossRef]
- Sikorski, A.; Solano Donado, F.; Kozdrowski, S. Cost-Efficient Coverage of Wastewater Networks by IoT Monitoring Devices. Sensors 2022, 22, 6854. [Google Scholar] [CrossRef] [PubMed]
- Banik, B.K.; Alfonso, L.; Torres, A.S.; Mynett, A.; Di Cristo, C.; Leopardi, A. Optimal Placement of Water Quality Monitoring Stations in Sewer Systems: An Information Theory Approach. Procedia Eng. 2015, 119, 1308–1317. [Google Scholar] [CrossRef]
- Buras, M.P.; Solano Donado, F. Identifying and Estimating the Location of Sources of Industrial Pollution in the Sewage Network. Sensors 2021, 21, 3426. [Google Scholar] [CrossRef]
- Rathi, S.; Gupta, R. Sensor Placement Methods for Contamination Detection in Water Distribution Networks: A Review. Procedia Eng. 2014, 89, 181–188. [Google Scholar] [CrossRef]
- Khorshidi, M.S.; Nikoo, M.R.; Sadegh, M. Optimal and Objective Placement of Sensors in Water Distribution Systems Using Information Theory. Water Res. 2018, 143, 218–228. [Google Scholar] [CrossRef]
- Salem, M. Urban Areas Management in Developing Countries: Analysis of the Urban Areas Crossed with Risk of Storm Water Drains, Aswan-Egypt. World Acad. Sci. Eng. Technol. Int. J. Transp. Veh. Eng. 2017, 14, 96–102. [Google Scholar]
- Alshami, A.; Elsayed, M.; Ali, E.; Eltoukhy, A.E.E.; Zayed, T. Monitoring Blockage and Overflow Events in Small-Sized Sewer Network Using Contactless Flow Sensors in Hong Kong: Problems, Causes, and Proposed Solution. IEEE Access 2023, 11, 87131–87149. [Google Scholar] [CrossRef]
- Cosco, C.; Cugueró, M.À.; Tàsies, F.; Aguiló, P.; Gómez, M. Sensor Placement for Combined Sewer System Monitoring in the Besòs River Basin. IFAC-Pap. 2018, 51, 949–956. [Google Scholar] [CrossRef]
- He, J. The Design of Urban Waterlogging Online Monitoring and Information Services Digital System and Optimization of Monitoring Points of Urban Waterlogging. Master’s Thesis, South China University of Technology, Guangzhou, China, 2014. [Google Scholar]
- Bartos, M.; Kerkez, B. Observability-Based Sensor Placement Improves Contaminant Tracing in River Networks. Water Resour. Res. 2021, 57, e2020WR029551. [Google Scholar] [CrossRef]
- Kim, K.; Ban, M.J.; Kim, S.; Park, M.-H.; Stenstrom, M.K.; Kang, J.-H. Optimal Allocation and Operation of Sewer Monitoring Sites for Wastewater-Based Disease Surveillance: A Methodological Proposal. J. Environ. Manag. 2022, 320, 115806. [Google Scholar] [CrossRef] [PubMed]
- Larson, R.C.; Berman, O.; Nourinejad, M. Sampling Manholes to Home in on SARS-CoV-2 Infections. PLoS ONE 2020, 15, e0240007. [Google Scholar] [CrossRef] [PubMed]
- Hou, S.; Wu, G. A Low-Cost IoT-Based Wireless Sensor System for Bridge Displacement Monitoring. Smart Mater. Struct. 2019, 28, 085047. [Google Scholar] [CrossRef]
- Smith, C.; McCain, J.; Downey, A.R.J.; Imran, J. An Open-Source IoT Remote Monitoring System for High-Hazard Dams. In Proceedings of the 2022 IEEE Sensors, Dallas, TX, USA, 30 October–2 November 2022; pp. 1–4. [Google Scholar]
- Shaik, R.; Kampara, R.K.; Kumar, A.; Sharma, C.S.; Kumar, M. Metal Oxide Nanofibers Based Chemiresistive H2S Gas Sensors. Coord. Chem. Rev. 2022, 471, 214752. [Google Scholar] [CrossRef]
- Rathi, S.; Gupta, R.; Kamble, S.; Sargaonkar, A. Risk Based Analysis for Contamination Event Selection and Optimal Sensor Placement for Intermittent Water Distribution Network Security. Water Resour. Manag. 2016, 30, 2671–2685. [Google Scholar] [CrossRef]
- Wu, Y.; Liu, S.; Wu, X.; Liu, Y.; Guan, Y. Burst Detection in District Metering Areas Using a Data Driven Clustering Algorithm. Water Res. 2016, 100, 28–37. [Google Scholar] [CrossRef]
- Kim, Y.; Lee, S.J.; Park, T.; Lee, G.; Suh, J.C.; Lee, J.M. Robust Leak Detection and Its Localization Using Interval Estimation for Water Distribution Network. Comput. Chem. Eng. 2016, 92, 1–17. [Google Scholar] [CrossRef]
- Ji, C. Optimizing Drainage Network Monitoring and Pollution Tracing Using Machine Learning and Markov Chain Monte Carlo. Master’s Thesis, Shandong University, Jinan, China, 2023. [Google Scholar]
- Jia, R.; Wu, J.; Zhang, Y.; Luo, Z. Site Prioritization and Performance Assessment of Groundwater Monitoring Network by Using Information-Based Methodology. Environ. Res. 2022, 212, 113181. [Google Scholar] [CrossRef]
- Li, J. Exploring the Potential of Utilizing Unsupervised Machine Learning for Urban Drainage Sensor Placement under Future Rainfall Uncertainty. J. Environ. Manag. 2021, 296, 113191. [Google Scholar] [CrossRef]
- Nourinejad, M.; Berman, O.; Larson, R.C. Placing Sensors in Sewer Networks: A System to Pinpoint New Cases of Coronavirus. PLoS ONE 2021, 16, e0248893. [Google Scholar] [CrossRef]
- Métadier, M.; Bertrand-Krajewski, J.-L. The Use of Long-Term on-Line Turbidity Measurements for the Calculation of Urban Stormwater Pollutant Concentrations, Loads, Pollutographs and Intra-Event Fluxes. Water Res. 2012, 46, 6836–6856. [Google Scholar] [CrossRef] [PubMed]
- Mishra, A.K.; Coulibaly, P. Developments in Hydrometric Network Design: A Review. Rev. Geophys. 2009, 47. [Google Scholar] [CrossRef]
- Alfonso, L.; Lobbrecht, A.; Price, R. Information Theory–Based Approach for Location of Monitoring Water Level Gauges in Polders. Water Resour. Res. 2010, 46. [Google Scholar] [CrossRef]
- Keum, J.; Coulibaly, P. Information Theory-Based Decision Support System for Integrated Design of Multivariable Hydrometric Networks. Water Resour. Res. 2017, 53, 6239–6259. [Google Scholar] [CrossRef]
- Alfonso, L.; Price, R. Coupling Hydrodynamic Models and Value of Information for Designing Stage Monitoring Networks. Water Resour. Res. 2012, 48, W0853. [Google Scholar] [CrossRef]
- Keum, J.; Kornelsen, K.C.; Leach, J.M.; Coulibaly, P. Entropy Applications to Water Monitoring Network Design: A Review. Entropy 2017, 19, 613. [Google Scholar] [CrossRef]
- Guo, X.; Zhao, D.; Du, P.; Li, M. Automatic Setting of Urban Drainage Pipe Monitoring Points Based on Scenario Simulation and Fuzzy Clustering. Urban Water J. 2018, 15, 700–712. [Google Scholar] [CrossRef]
- Wang, S.; Zhang, X.; Wang, J.; Tao, T.; Xin, K.; Yan, H.; Li, S. Optimal Sensor Placement for the Routine Monitoring of Urban Drainage Systems: A Re-Clustering Method. J. Environ. Manag. 2023, 335, 117579. [Google Scholar] [CrossRef]
- Sambito, M.; Di Cristo, C.; Freni, G.; Leopardi, A. Optimal Water Quality Sensor Positioning in Urban Drainage Systems for Illicit Intrusion Identification. J. Hydroinformatics 2019, 22, 46–60. [Google Scholar] [CrossRef]
- Banik, B.K.; Alfonso, L.; Di Cristo, C.; Leopardi, A.; Mynett, A. Evaluation of Different Formulations to Optimally Locate Sensors in Sewer Systems. J. Water Resour. Plan. Manag. 2017, 143, 04017026. [Google Scholar] [CrossRef]
- Fu, X.; Zhang, T.; Li, M.; Li, Y.; Li, X.; Zhou, R.; Wan, R.; Chen, S. Research on the method of monitoring points distribution of urban drainage network. J. Water Resour. Plan. Manag. 2023, 59, 452–456. [Google Scholar] [CrossRef]
- Guadagno, V.; Del Giudice, G.; Di Cristo, C.; Leopardi, A.; Simone, A. Impact Coefficient Evaluation for Sensor Location in Sewer Systems. J. Water Resour. Plan. Manag. 2023, 149, 04023063. [Google Scholar] [CrossRef]
- Simone, A.; Di Cristo, C.; Guadagno, V.; Del Giudice, G. Sewer Networks Monitoring through a Topological Backtracking. J. Environ. Manag. 2023, 346, 119015. [Google Scholar] [CrossRef] [PubMed]
- Banik, B.; Alfonso, L.; Di Cristo, C.; Leopardi, A. Greedy Algorithms for Sensor Location in Sewer Systems. Water 2017, 9, 856. [Google Scholar] [CrossRef]
- Simone, A.; Cesaro, A.; Cristo, C.D.; Fecarotta, O.; Morani, M.C. Monitoring Planning for Urban Drainage Networks. IOP Conf. Ser. Earth Environ. Sci. 2023, 1136, 012008. [Google Scholar] [CrossRef]
- Chachuła, K.; Nowak, R.; Solano, F. Pollution Source Localization in Wastewater Networks. Sensors 2021, 21, 826. [Google Scholar] [CrossRef]
- Shao, Z.; Xu, L.; Chai, H.; Yost, S.A.; Zheng, Z.; Wu, Z.; He, Q. A Bayesian-SWMM Coupled Stochastic Model Developed to Reconstruct the Complete Profile of an Unknown Discharging Incidence in Sewer Networks. J. Environ. Manag. 2021, 297, 113211. [Google Scholar] [CrossRef]
- Zhao, D.; Wang, H.; Chen, J.; Sheng, Z. Application and Analysis of Monitoring Technology in Operation and Management of Urban Drainage Network. China Water Wastewater 2012, 28, 11–14. [Google Scholar]
- Fattoruso, G.; Agresta, A.; Guarnieri, G.; Lanza, B.; Buonanno, A.; Molinara, M.; Marrocco, C.; De Vito, S.; Tortorella, F.; Francia, G.D. Optimal Sensors Placement for Flood Forecasting Modelling. Procedia Eng. 2015, 119, 927–936. [Google Scholar] [CrossRef]
- Walski, T.M. Technique for Calibrating Network Models. J. Water Resour. Plan. Manag. 1983, 109, 360–372. [Google Scholar] [CrossRef]
- Clemens, F. Evaluation of a Method for the Design of Monitoring Networks in Urban Drainage. In Proceedings of the Ninth International Conference on Urban Drainage (9ICUD), Portland, OR, USA, 8–13 September 2012; pp. 1–17. [Google Scholar] [CrossRef]
- De Vito, S.; Fattoruso, G.; Esposito, E.; Salvato, M.; Agresta, A.; Panico, M.; Leopardi, A.; Formisano, F.; Buonanno, A.; Delli Veneri, P.; et al. A Distributed Sensor Network for Waste Water Management Plant Protection; Andò, B., Baldini, F., Di Natale, C., Marrazza, G., Siciliano, P., Eds.; Springer International Publishing: Cham, Switzerland, 2018; Volume 431, pp. 303–314. [Google Scholar]
- He, M.; Zhang, Y.; Ma, Z.; Zhao, Q. Intelligent Optimal Layout of Drainage Pipe Network Monitoring Points Based on Information Entropy Theory. Front. Environ. Sci. 2024, 12, 1401942. [Google Scholar] [CrossRef]
- Brosky, H.; Prasek, S.M.; Innes, G.K.; Pepper, I.L.; Miranda, J.; Brierley, P.E.; Slinski, S.L.; Polashenski, L.; Betancourt, W.Q.; Gronbach, K.; et al. A Framework for Integrating Wastewater-Based Epidemiology and Public Health. Front. Public Health 2024, 12, 1418681. [Google Scholar] [CrossRef] [PubMed]
- Bibby, K.; Bivins, A.; Wu, Z.; North, D. Making Waves: Plausible Lead Time for Wastewater Based Epidemiology as an Early Warning System for COVID-19. Water Res. 2021, 202, 117438. [Google Scholar] [CrossRef] [PubMed]
- Yargeau, V.; Werschler, T. Wastewater-Based Epidemiology as an Input to National Statistics on Recreational Drug Use: A Canadian Pilot Study. Wastewater-Based Epidemiol. 2019, 1319, 137–153. [Google Scholar] [CrossRef]
- Huizer, M.; ter Laak, T.L.; de Voogt, P.; van Wezel, A.P. Wastewater-Based Epidemiology for Illicit Drugs: A Critical Review on Global Data. Water Res. 2021, 207, 117789. [Google Scholar] [CrossRef]
- Peccia, J.; Zulli, A.; Brackney, D.E.; Grubaugh, N.D.; Kaplan, E.H.; Casanovas-Massana, A.; Ko, A.I.; Malik, A.A.; Wang, D.; Wang, M.; et al. Measurement of SARS-CoV-2 RNA in Wastewater Tracks Community Infection Dynamics. Nat. Biotechnol. 2020, 38, 1164–1167. [Google Scholar] [CrossRef]
- Johnson, W.; Reeves, K.; Liebig, J.; Feula, A.; Butler, C.; Alkire, M.; Singh, S.; Litton, S.; O’Conor, K.; Jones, K.; et al. Effectiveness of Building-Level Sewage Surveillance during Both Community-Spread and Sporadic-Infection Phases of SARS-CoV-2 in a University Campus Population. FEMS Microbes 2022, 3, xtac024. [Google Scholar] [CrossRef]
- Tshehla, K.S.; Hamam, Y.; Abu-Mahfouz, A.M. State Estimation in Water Distribution Network: A Review. In Proceedings of the 2017 IEEE 15th International Conference on Industrial Informatics (INDIN), Emden, Germany, 24–26 July 2017; pp. 1247–1252. [Google Scholar]
- Gold, A.; Anarde, K.; Grimley, L.; Neve, R.; Srebnik, E.R.; Thelen, T.; Whipple, A.; Hino, M. Data from the Drain: A Sensor Framework That Captures Multiple Drivers of Chronic Coastal Floods. Water Resour. Res. 2023, 59, e2022WR032392. [Google Scholar] [CrossRef]
- Zhang, D.; Lindholm, G.; Ratnaweera, H. Use Long Short-Term Memory to Enhance Internet of Things for Combined Sewer Overflow Monitoring. J. Hydrol. 2018, 556, 409–418. [Google Scholar] [CrossRef]
- Wang, S.; Xu, K.; Zhou, Y. Cost-Effective Sensor Placement Optimization for Large-Scale Urban Sewage Surveillance. Sustain. Cities Soc. 2024, 103, 105250. [Google Scholar] [CrossRef]
- Vonach, T.; Tscheikner-Gratl, F.; Rauch, W.; Kleidorfer, M. A Heuristic Method for Measurement Site Selection in Sewer Systems. Water 2018, 10, 122. [Google Scholar] [CrossRef]
- Sambito, M.; Freni, G. Strategies for Improving Optimal Positioning of Quality Sensors in Urban Drainage Systems for Non-Conservative Contaminants. Water 2021, 13, 934. [Google Scholar] [CrossRef]
- Banik, B.K.; Di Cristo, C.; Leopardi, A. A Pre-Screening Procedure for Pollution Source Identification in Sewer Systems. Procedia Eng. 2015, 119, 360–369. [Google Scholar] [CrossRef]
- Berry, J.; Carr, R.D.; Hart, W.E.; Leung, V.J.; Phillips, C.A.; Watson, J.-P. Designing Contamination Warning Systems for Municipal Water Networks Using Imperfect Sensors. J. Water Resour. Plan. Manag. 2009, 135, 253–263. [Google Scholar] [CrossRef]
- Zheng, Z.; Zheng, F.; Bi, W.; Du, J.; Duan, H.-F.; Savic, D.; Kapelan, Z. Evaluating the Robustness of Water Quality Sensor Placement Strategies of Water Distribution Systems Considering Possible Sensor Failures and System Changes. J. Water Resour. Plan. Manag. 2022, 148, 04022050. [Google Scholar] [CrossRef]
- Berry, J.W.; Hart, W.E.; Phillips, C.A.; Uber, J.G.; Walski, T.M. Water Quality Sensor Placement in Water Networks with Budget Constraints. In Impacts of Global Climate Change; American Society of Civil Engineers: Reston, VA, USA, 2012; pp. 1–11. [Google Scholar] [CrossRef]
- Bai, H. Research on the Optimization Design Method of Separated Urban Drainage System under Uncertainty. Ph.D. Thesis, Tsinghua University, Beijing, China, 2016. [Google Scholar]
- Boënne, W.; Desmet, N.; Van Looy, S.; Seuntjens, P. Use of Online Water Quality Monitoring for Assessing the Effects of WWTP Overflows in Rivers. Environ. Sci. Process. Impacts 2014, 16, 1510–1518. [Google Scholar] [CrossRef]
- Kim, M.; Choi, C.Y.; Gerba, C.P. Development and Evaluation of a Decision-Supporting Model for Identifying the Source Location of Microbial Intrusions in Real Gravity Sewer Systems. Water Res. 2013, 47, 4630–4638. [Google Scholar] [CrossRef]
- Guo, X.; Li, M.; Du, P.; Zhao, D.; Zhang, X. Quantification of On-line Monitoring Layout in Urban Drainage Network. China Water Wastewater 2022, 38, 122–131. [Google Scholar] [CrossRef]
- Ogie, R.I.; Shukla, N.; Sedlar, F.; Holderness, T. Optimal Placement of Water-Level Sensors to Facilitate Data-Driven Management of Hydrological Infrastructure Assets in Coastal Mega-Cities of Developing Nations. Sustain. Cities Soc. 2017, 35, 385–395. [Google Scholar] [CrossRef]
- Shannon, C.E. A Mathematical Theory of Communication. Bell Syst. Tech. J. 1948, 27, 379–423. [Google Scholar] [CrossRef]
- Ozkul, S.; Harmancioglu, N.B.; Singh, V.P. Entropy-Based Assessment of Water Quality Monitoring Networks. J. Hydrol. Eng. 2000, 5, 90–100. [Google Scholar] [CrossRef]
- Kwon, T.; Lim, J.; Yoon, S.; Yoon, S. Comparison of Entropy Methods for an Optimal Rain Gauge Network: A Case Study of Daegu and Gyeongbuk Area in South Korea. Appl. Sci. 2020, 10, 5620. [Google Scholar] [CrossRef]
- Yeh, H.-C.; Chen, Y.-C.; Chang, C.-H.; Ho, C.-H.; Wei, C. Rainfall Network Optimization Using Radar and Entropy. Entropy 2017, 19, 553. [Google Scholar] [CrossRef]
- Sreeparvathy, V.; Srinivas, V.V. A Fuzzy Entropy Approach for Design of Hydrometric Monitoring Networks. J. Hydrol. 2020, 586, 124797. [Google Scholar] [CrossRef]
- Joo, H.; Jun, H.; Lee, J.; Kim, H.S. Assessment of a Stream Gauge Network Using Upstream and Downstream Runoff Characteristics and Entropy. Entropy 2019, 21, 673. [Google Scholar] [CrossRef]
- Salman, R.; Nikoo, M.R.; Shojaeezadeh, S.A.; Beiglou, P.H.B.; Sadegh, M.; Adamowski, J.F.; Alamdari, N. A Novel Bayesian Maximum Entropy-Based Approach for Optimal Design of Water Quality Monitoring Networks in Rivers. J. Hydrol. 2021, 603, 126822. [Google Scholar] [CrossRef]
- Masoumi, F.; Kerachian, R. Optimal Redesign of Groundwater Quality Monitoring Networks: A Case Study. Environ. Monit. Assess. 2010, 161, 247–257. [Google Scholar] [CrossRef]
- Li, C.; Singh, V.P.; Mishra, A.K. Entropy Theory-Based Criterion for Hydrometric Network Evaluation and Design: Maximum Information Minimum Redundancy. Water Resour. Res. 2012, 48, W05521. [Google Scholar] [CrossRef]
- Krause, A.; Singh, A.; Guestrin, C. Near-Optimal Sensor Placements in Gaussian Processes: Theory, Efficient Algorithms and Empirical Studies. J. Mach. Learn. Res. 2008, 9, 235–284. [Google Scholar]
- Zheng, Y.; Jin, X.; Wei, J.; Zhou, Y.; Zhang, Y. A Novel Framework for Optimization and Evaluation of Sensors Network in Urban Drainage System. Water Res. 2025, 270, 122833. [Google Scholar] [CrossRef] [PubMed]
- Yazdi, J. Water Quality Monitoring Network Design for Urban Drainage Systems, an Entropy Method. Urban Water J. 2018, 15, 227–233. [Google Scholar] [CrossRef]
- Gautam, D.K.; Kotecha, P.; Subbiah, S. Efficient K-Means Clustering and Greedy Selection-Based Reduction of Nodal Search Space for Optimization of Sensor Placement in the Water Distribution Networks. Water Res. 2022, 220, 118666. [Google Scholar] [CrossRef] [PubMed]
- Khaksar Fasaee, M.A.; Monghasemi, S.; Nikoo, M.R.; Shafiee, M.E.; Berglund, E.Z.; Bakhtiari, P.H. A K-Sensor Correlation-Based Evolutionary Optimization Algorithm to Cluster Contamination Events and Place Sensors in Water Distribution Systems. J. Clean. Prod. 2021, 319, 128763. [Google Scholar] [CrossRef]
- Peng, S.; Cheng, J.; Wu, X.; Fang, X.; Wu, Q. Pressure Sensor Placement in Water Supply Network Based on Graph Neural Network Clustering Method. Water 2022, 14, 150. [Google Scholar] [CrossRef]
- Cheng, L.; Kun, D.; Jia-peng, T.; Wei-xin, D. Optimal Placement of Pressure Sensors in Water Distribution System Based on Clustering Analysis of Pressure Sensitive Matrix. Procedia Eng. 2017, 186, 405–411. [Google Scholar] [CrossRef]
- Zhao, W.; Cheng, Y.; Li, M. Optimization of Monitoring Points in Drainage Pipe Network Based on Improved K-means Algorithm. Adm. Tech. Environ. Monit. 2024, 36, 79–83. [Google Scholar] [CrossRef]
- Simone, A.; Cesaro, A.; Del Giudice, G.; Di Cristo, C.; Esposito, G.; Fecarotta, O. The Spread of Contaminants in Urban Drainage Networks Based on a Topological Analysis. Environ. Sci. Proc. 2022, 21, 20. [Google Scholar] [CrossRef]
- Liu, Y.-Y.; Slotine, J.-J.; Barabási, A.-L. Observability of Complex Systems. Proc. Natl. Acad. Sci. USA 2013, 110, 2460–2465. [Google Scholar] [CrossRef]
- Farahmand, H.; Liu, X.; Dong, S.; Mostafavi, A.; Gao, J. A Network Observability Framework for Sensor Placement in Flood Control Networks to Improve Flood Situational Awareness and Risk Management. Reliab. Eng. Syst. Saf. 2022, 221, 108366. [Google Scholar] [CrossRef]
- Shao, Y.; Li, K.; Zhang, T.; Ao, W.; Chu, S. Pressure Sampling Design for Estimating Nodal Water Demand in Water Distribution Systems. Water Resour. Manag. 2024, 38, 1511–1527. [Google Scholar] [CrossRef]
- Taha, A.F.; Wang, S.; Guo, Y.; Summers, T.H.; Gatsis, N.; Giacomoni, M.H.; Abokifa, A.A. Revisiting the Water Quality Sensor Placement Problem: Optimizing Network Observability and State Estimation Metrics. J. Water Resour. Plan. Manag. 2021, 147, 04021040. [Google Scholar] [CrossRef]
- Palleti, V.R.; Narasimhan, S.; Rengaswamy, R.; Teja, R.; Murty Bhallamudi, S. Sensor Network Design for Contaminant Detection and Identification in Water Distribution Networks. Comput. Chem. Eng. 2016, 87, 246–256. [Google Scholar] [CrossRef]
- Lee, J.H. Determination of Optimal Water Quality Monitoring Points in Sewer Systems Using Entropy Theory. Entropy 2013, 15, 3419–3434. [Google Scholar] [CrossRef]
- Qin, L. The application of cluster analysis in monitoring point optimal of sewer system. J. Guizhou Univ. (Nat. Sci.) 2013, 30, 123–125, 134. [Google Scholar] [CrossRef]
- Yuan, J. Research on Hydraulic Modeling and Optimization of Monitoring Points of Urban Drainage System. Master’s Thesis, Hunan University, Changsha, China, 2010. [Google Scholar]
- Wu, Y.; Zheng, F.; Yang, Y.; Zhang, K.; Du, K.; Duan, H.; Savic, D.; Kapelan, Z. Enhancing Inflow and Infiltration Detection in Urban Sewer Networks with a New Deterministic Sensor Placement Method. Water Res. 2025, 268, 122591. [Google Scholar] [CrossRef]
- Mariacrocetta, S.; Piazza, S.; Freni, G. Bayesian Identification of Brackish Water Infiltration by Lagrangian Sensors. In Proceedings of the 39th IAHR World Congress, Granada, Spain, 19–24 June 2022; International Association for Hydro-Environment Engineering and Research (IAHR): Madrid, Spain; pp. 3718–3720. [Google Scholar]
- Salem, A.K.; Abokifa, A.A. Sensor Placement Optimization in Sewer Networks: Machine Learning–Based Source Identification Approach. J. Water Resour. Plan. Manag. 2024, 150, 04024048. [Google Scholar] [CrossRef]


| Time | Technology | Network | Theme |
|---|---|---|---|
| As of 31 December 2024 | IoT/sensor online/real time monitoring/continuous measurement | Sewer/sewerage/wastewater/drainage urban networks/system | Optimal/optimization placement/site/position |
| Category | Type of Study | Type of Node |
|---|---|---|
| Nodes in certain locations have a higher necessity for monitoring | WEB-based drainage network monitoring | Priority is given to areas with a high population density such as hospitals, nursing homes, community centers, and inspection wells connected to buildings [12,56]. |
| The location of potentially infected nodes is reflected through Bayesian prior probabilities [13] | ||
| Calibration of hydrodynamic models | The pipeline where the flow rate changes is the “potential measurement location” [57] | |
| Tracking and source tracing of pollutants | Most pollution events occur in nodes located downstream [32,58] | |
| Different levels of priority are assigned to each potential monitoring site considering CSO frequency, flow rate, and mass of pollutant [9] | ||
| A pre-screening procedure based on the concept of pollution matrix is introduced to screen some nodes [59] | ||
| Daily monitoring | Nodes in key topological locations, nodes located in areas with high residential density [31] | |
| Nodes have the same necessity for monitoring [17,33,35] | Monitoring and source tracing of pollutants in drainage networks | Any node has an equal probability of being the source |
| Entropy-Based Information Measure | Calculation Formula | Meaning |
|---|---|---|
| Entropy (high uncertainty entropy, information entropy or marginal entropy) | Amount of information provided by each monitoring point | |
| Joint entropy (joint information entropy, total entropy, multivariate joint entropy) | Total amount of information provided by multiple monitoring points together | |
| Total correlation | Redundancy of information between variables | |
| Transinformation (mutual information) The special cases of total correlation, where n = 2 [26] | Components of redundant information in the monitoring network | |
| Conditional entropy | the information loss that occurs during the trans-information process between random variates X1 and X2 |
| Method | Accuracy | Robustness | Computational Cost | Adaptability |
|---|---|---|---|---|
| Cluster analysis | Medium, dependent on data distribution and algorithm selection | low, parameters need to be preset, sensitive to noise | Moderate algorithmic complexity | Ideal for rapid deployment and cost control |
| Information theory | High, quantifying information content through information entropy | Medium, relies on data distribution stability, performance degrades with data noise or dynamic changes | High, requires complex optimization algorithms | Not applicable to old pipe networks or where data is missing |
| Complex network theory | Medium, based on topology, easy to overlook hydraulic details | High, topologically stable | Low, only network analysis required, no complex simulations | Not dependent on hydraulic parameters, but accuracy is limited |
| Observability theory | High, inferring state through mathematical modeling | High, model parameters optimized for noise immunity | High, involving matrix operations | Effectiveness is limited when data is extremely sparse |
| Theory | Research | Type | Objectives/Indicators | Size of Study Network | Monitoring Points | Evaluation Methodology/Indicators | ||||
|---|---|---|---|---|---|---|---|---|---|---|
| Hydraulics | Quality | Area | Conduits/ Pipelines | Nodes/ Junctions | Other Water Facilities | |||||
| Multi-objective optimization + information theory | [91] | √ | Maximizing marginal entropy and maximizing trans-information (all entropy variates have positive values) | 161 ha | \ | 80 | \ | The outlet + other 7 monitoring points | Scheme with maximized joint entropy and minimized total correlation | |
| [3] | √ | Monitoring of pollution of water quality in the sewer network | 12 sub-catchments, covering an area of 19.71 km2 | 1909 | 1902 | 14 pumps, 14 storage units and 1 treatment plant | 12 | |||
| [37] | √ | 12 sub-catchments, covering an area of 19.71 km2 | 1909 | 1902 | 14 pumps, 14 storage units and 1 treatment plant | 14 | ||||
| [79] | √ | 4 separate catchment areas | \ | 748 candidate sites | \ | 20 | ||||
| [78] | √ | understanding the operating status of UDS and facilitating urban flood early warning. | 2.679 km2, is divided into 2693 sub-catchments | 898 | 878 | \ | 4 monitoring points (lower budget) or 8 monitoring points (higher budget) | Maximize value of information (VOI), minimize trans-information (TE) and minimize economic costs | ||
| Complex network theory (CNT) | [36] | √ | Evaluating the ability of node to receive pollutants, detecting the maximum amount of information propagated on the network | \ | 79 | 77 | 1 outfall | 4 | In-Relevance-Harmonic Centrality as the indicator | |
| [85] | √ | Analyzing the impact of a pollutant spill at a given node on the entire system, focusing on the role of network topology in pollutant dispersion | SWMM example 3 | 32 | 32 | 1 outfall, 1 storage and 1 pump. | \ | node contamination index IC as the indicator | ||
| [35] | √ | Analyzing the dispersion of pollutants by calculating the influence coefficients of each node with respect to the installed sensor in the system (usually located at the outfall). | \ | 79 | 77 | 1 outfall | 7 monitoring points, with a network coverage equal to 60% | impact coefficient (IC) as the indicator | ||
| [38] | √ | Analyzing pollutant dispersion at various nodes | \ | 79 | 77 | 1 outfall | 7 monitoring points and the prioritization order of the sensors was further considered | topological impact coefficient (ICT) as the indicator | ||
| Multi-objective optimization + Expert advice | [67] | √ | Obtaining water level data to make decisions about the operation of flood control infrastructure | \ | 647 waterways | 579 | 71 pumping stations, 30 floodgates and 11 flood gauges | 4 sensors in the first phase, which will be expanded to 10 sensors in the following phases | Locations at high risk of monitored phenomena; locations to maximize network coverage; water level information to maximize water temperature infrastructure | |
| Cluster analysis | [92] | √ | √ | Improving monitoring of operational status in sever network | \ | 4 main pipelines | \ | \ | After optimization 10 monitoring points can replace all the initial monitoring points | Statistical significance analyses based on F-tests and t-tests were performed to compare the data for differences between groups |
| [93] | √ | √ | a catchment | \ | \ | \ | The original 23 monitoring sites were reduced to 10 sites through optimization | |||
| [30] | √ | 21.5 km2 | 192 | 187 | 17 outfalls | 12 | The composite indicator compounded from Pearson’s coefficient and Euclidean distance | |||
| [84] | √ | √ | 62.88 km2 | \ | 23 original monitoring points | \ | Reduction of 7 monitoring points | Calinski-Harabasz Index, Within-Group Sum of Squares (WGSS), Between-Group Sum of Squares (BGSS) | ||
| [31] | √ | √ | 2.63 km2 | 785 | 785 | 1 outlet | 20 | Scheme with maximized joint entropy and minimized total correlation | ||
| [22] | √ | Flood hotspot monitoring in combined drainage systems | 7 sub-catchments | 58 | 60 | 2 outfalls | 3 or 4 | Silhouette Coefficient Index (SCI) | ||
| [20] | √ | Monitoring of pollution of water quality in the sewer network | 139 | 135 | \ | 8 | Silhouette Coefficient (SC) | |||
| [94] | √ | detecting inflow and infiltration (I&I) in urban sewer networks | 15 km2 | 819 | 820 | 1 outlet | 20 | detection reliability (DR); distribution uniformity (DU) | ||
| Classification | Evaluation Indicator | Meaning |
|---|---|---|
| Algorithm performance indicator | Algorithm running time [2,37,42], hypervolume metric (HV) [56], Silhouette coefficient index (SC) [22], Calinski-Harabaz index (CH) [84]. | Quantitative evaluation of optimized sensor placement schemes via evaluation of algorithm performance |
| Mean Absolute Error (MAE), Root Mean Square Error (RMSE), relative RMSE (RRE), coefficient of determination (R2), Nash-Sutcliffe Efficiency (NSE) [20,56,57], Confidence Coefficient, Segregation Likelihood [58], Residual Squared, Correlation Coefficient, Consistency Index [57], Mean of Relative Error MRE [46]. | Differences between predicted and actual values obtained by inversion when studying the transport and traceability of pollutants | |
| Assessment of the achievement of objectives | Number of detected events and event detection rate [39,58], access to monitoring information wherever possible [31,33,84], response time to anomalous events [20,37], reliability of the monitoring network [30,33,37,58,94] uniformity of sensor distribution [94]. | Assessed by the degree of achievement of monitoring objectives |
Disclaimer/Publisher’s Note: The statements, opinions and data contained in all publications are solely those of the individual author(s) and contributor(s) and not of MDPI and/or the editor(s). MDPI and/or the editor(s) disclaim responsibility for any injury to people or property resulting from any ideas, methods, instructions or products referred to in the content. |
© 2025 by the authors. Licensee MDPI, Basel, Switzerland. This article is an open access article distributed under the terms and conditions of the Creative Commons Attribution (CC BY) license (https://creativecommons.org/licenses/by/4.0/).
Share and Cite
Ma, Y.; Guo, T.; Wang, Y. Optimal Arrangement Strategy of IoT Sensors in Urban Drainage Networks: A Review. Appl. Sci. 2025, 15, 4976. https://doi.org/10.3390/app15094976
Ma Y, Guo T, Wang Y. Optimal Arrangement Strategy of IoT Sensors in Urban Drainage Networks: A Review. Applied Sciences. 2025; 15(9):4976. https://doi.org/10.3390/app15094976
Chicago/Turabian StyleMa, Yiyi, Tianyu Guo, and Yiran Wang. 2025. "Optimal Arrangement Strategy of IoT Sensors in Urban Drainage Networks: A Review" Applied Sciences 15, no. 9: 4976. https://doi.org/10.3390/app15094976
APA StyleMa, Y., Guo, T., & Wang, Y. (2025). Optimal Arrangement Strategy of IoT Sensors in Urban Drainage Networks: A Review. Applied Sciences, 15(9), 4976. https://doi.org/10.3390/app15094976