Abstract
Within the framework of classical dynamics, the impact of laser amplitude on the cross-collision between a linearly polarized intense laser pulse and a relativistic electron under tight focusing conditions was investigated via numerical simulation. As the laser amplitude intensifies, the z-axis oscillation trajectory of the electron elongates. The spatial radiation angular distribution of the electron transforms from a “hill shape” to a “comet shape”, and the radiation peak shifts toward the direction of smaller polar angle, with the radiation concentrating in the forward position. The time spectrum is symmetrical; the number of peaks is reduced from multiple peaks to three peaks; and the relative height of the main peak and secondary peaks increases, with the time distribution gradually concentrating, which can be regarded as an ultrashort attosecond single pulse. The spectrum exhibits a multi-peak distribution trend. When the laser amplitude is relatively strong, radiation with a more concentrated frequency range and better quality can be output. The above research findings are beneficial for generating X-rays of higher quality and can be applied in fields such as biomedicine and atomic physics.
1. Introduction
In the 1980s, the introduction of chirped pulse amplification technology significantly reduced the width of laser pulses and enormously enhanced the output power of intense lasers [1]. This technological breakthrough offered robust support for research on the interaction between intense lasers and microscopic substances. In the domain of ultrafast physics, for studies at the molecular and atomic scales, shorter laser pulses can effectively enhance temporal resolution. Furthermore, in biomedical and atomic physics research, stable and high-quality X-ray sources are indispensable tools. Through the relativistic nonlinear Thomson inverse scattering process of the interaction between the intense laser and the high-energy electron, high-order harmonics can be generated, thereby generating X-ray radiation that fulfills the aforementioned requirements [2,3,4].
The movement of high-energy electrons within a powerful laser field demonstrates characteristics associated with relativistic effects [5]. Numerous scholars have carried out in-depth studies on nonlinear Thomson scattering under relativistic conditions [6]. Zhuang et al. investigated the quasi-monochromatic X-ray spectra resulting from the collision of lasers with low-energy electrons [7,8]. Chang et al. studied the interaction between intense laser and electrons, which produced ultra-high-power gamma rays [9]. Chen et al. examined the impact of laser intensity on the spatial radiation of high-energy electrons [10].
However, previous studies have predominantly centered on nonlinear inverse Thomson scattering [11,12,13]. Despite the fact that inverse axial collisions can give rise to radiation, they possess certain limitations. Specifically, the axial radiation generated by nonlinear inverse Thomson scattering may cause damage to the observation equipment and enhance the difficulty of measuring the intensity and distribution of the radiation [14,15]. Nevertheless, in contrast to this conventional method of generating X-rays through collisions, cross-collision represents a relatively more feasible and potentially promising theoretical solution. To overcome the observation difficulties and other issues associated with head-on collisions, in this paper, through numerical simulation, radiation is generated by the cross-collision of a strong laser and a high-energy electron, thereby enhancing the practical feasibility and safety of the research approach. Additionally, the majority of previous studies have centered on circularly polarized lasers, while research on the interaction of a linearly polarized laser with an electron in a 3D space is relatively scarce. To date, there have been scarcely any actual experiments on cross-collision. In this paper, through numerical simulation experiments in a 3D space, the feasibility of generating stable and efficient X-ray radiation through the cross-collision of the linearly polarized laser and the high-energy electron is explored, with the aim of drawing the attention of relevant scholars to this blank field and facilitating its development. Meanwhile, the simulation results derived in this article can offer certain references for experimental scholars.
In this paper, we employed the electrodynamics formula for derivation and investigated the impact of laser amplitude on the electron trajectory, spatial radiation power angular distribution, temporal spectrum and radiation spectrum of the cross-collision between the tightly focused linearly polarized laser pulse and the high-energy electron through numerical simulation. The experimental results indicate that the increase in laser amplitude can conspicuously elongate the length of the electron trajectory in the positive z-axis direction. When the laser amplitude is extremely small, the spatial radiation angular distribution of the electron exhibits a shape with a protrusion in the middle. As the laser amplitude increases, the radiation peak of the electron spatial radiation angular distribution graph approaches the z-axis, presenting a comet-like shape. With the growth of laser amplitude, the temporal distribution presents a multi-peak structure, and the number of secondary peaks is constantly reducing; the height of the first peak relative to the main peak is constantly decreasing; and the temporal distribution becomes more concentrated. The 2D radiation spectrum gradually assumes a multi-peak distribution with the enhancement of laser amplitude, and the energy is concentrated in the main peak and the first peak in the low-frequency band.
2. Materials and Methods
It can be inferred from Figure 1 that the schematic diagram of the cross-collision between a tightly focused linearly polarized laser pulse and an electron is obtained. The linearly polarized Gaussian laser pulse is incident along the positive z-axis after a certain delay time and collides with the high-energy electron moving in the positive direction on the negative half of the x-axis. Due to the Thomson scattering effect of the linearly polarized strong laser pulse in the plasma, the paraxial approximation of the tightly focused laser is no longer applicable, and the high-order field effects need to be taken into account when establishing the model [16,17,18,19]. A mathematical model is established, and the beam is regarded as a linearly polarized vector along the +x direction.
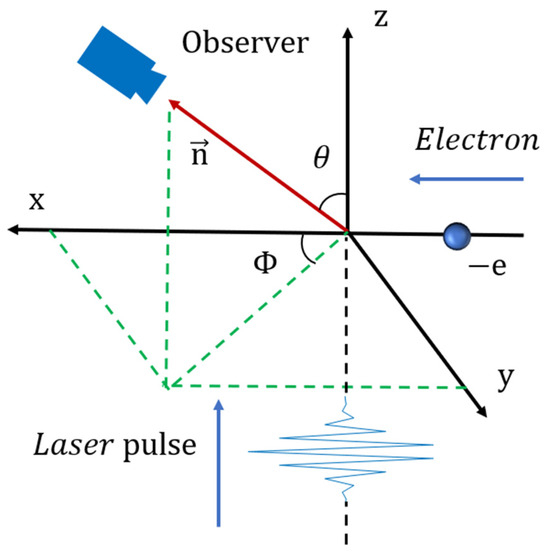
Figure 1.
Schematic illustration of the cross-collision between a tightly focused linearly polarized intense laser pulse and a relativistic electron.
The electric field components can be represented by the following formula [20]:
Likewise, the magnetic field components can also be derived and expressed as
The expression for the light field distribution can be expressed as , , and the field intensity , where is equal to . Formulas (1)–(6) are presented in approximate forms, and the precision of the approximation is related to the orders of “r” and “”. By constructing a fifth-order high-order field of the diffraction angle , the beam can be focused to a size of several micrometers. The orders presented in the formulae can both calculate the structure clearly and reduce unnecessary computational efforts. This model considers the light beam as a cylindrical structure, with each cross-section along the optical axis exhibiting a circular distribution. The variation in the beam radius along the propagation direction is described by , where the Rayleigh length , and the wave number . The beam radius is the smallest, and the intensity reaches its peak at the beam focus, which is the origin of the coordinate system. The diffraction effect is quantified by the parameter , characterizing the divergence property of the beam. The pulse duration is related to the spatial pulse width by (c being the speed of light), and this parameter simultaneously appears in the transverse distribution of the exponential term, determining the attenuation characteristics of the longitudinal distribution of the light field.
The phase structure of the laser pulse is constituted by the superposition of four components: . Herein, the plane wave propagation phase term is jointly determined by the optical angular frequency (where c is the speed of light) and the wave vector . The fixed phase term is a constant value, independent of space and time. The curvature phase characterizes the wavefront curvature effect, and its mathematical form indicates that this phase component has a quadratic relationship with the propagation distance z and the transverse coordinate . The Gouy phase term embodies the specific geometric phase accumulation during the beam propagation. When the beam propagates along the z-axis from negative infinity to positive infinity, this phase component will generate a cumulative phase shift of radians, forming the core phase feature that distinguishes Gaussian beams from plane waves.
The motion of the electron can be depicted by employing the Lorentz equation and the electron energy function. The formulae are presented as follows:
Among them, denotes the electron energy, with the Lorentz factor . c represents the speed of light; represents the velocity of the electron; and represents the rest mass of the electron. indicates the momentum of the electron.
The velocity of an electron can be represented as . Employing the 4–5th-order Runge–Kutta–Fehlberg method (RKF45) and conducting numerical simulation via MATLAB-R2020a, parameters such as the velocity and acceleration of the high-energy electron during the interaction process are obtainable.
The dynamic electromagnetic field excited by high-speed charged particles can be analytically modeled via the Liénard–Wiechert potentials. In the polar coordinate system, the angular distribution characteristics of the radiation field can be depicted by the unit solid angle parameter, where the spatial orientation vector is defined as , where represents the polar angle, and characterizes the azimuthal angle. The radiation power per unit solid angle can be computed in accordance with the following formula [21]:
Among them, the radiation power is normalized by . In the coordinate system setting, the displacement of the electron along the x-axis is denoted as . In the delay calculation requirement, the key parameter is introduced, where the observation distance is required to satisfy the far-field approximation condition , that is, a collinear distance needs to be maintained between the measurement point and the laser–electron interaction point.
The radiated energy is normalized to per unit angular frequency and per unit azimuthal angle, and it can be expressed as follows [21]:
Among these, the term represents the order of the radiated harmonic, with being the scattering angular frequency.
Equations (11) and (12) serve to determine the spatiotemporal distribution and spectrum of nonlinear cross Thomson scattering (NCTS).
3. Results
In this section, we will conduct research and analysis on the relationship between the radiation characteristics of nonlinear Thomson scattering resulting from the cross-impact of a linearly polarized Gaussian laser pulse and an electron in a tightly focused state and the laser amplitude. The linearly polarized laser pulse with varying laser amplitudes will exert distinct effects on the electrons in the cross-collision, and the resulting radiation characteristics will each have their unique characteristics. Consequently, to investigate the influence of the parameter of laser amplitude, it is necessary to effectively and reasonably set the other parameters of the linearly polarized laser and the high-energy electron. We can set the parameters of the laser pulse as follows: the normalized beam waist radius , the pulse width , the wavelength and the initial phase . The normalized initial energy of the electron is . The numerical simulation approach adopted in this paper is applicable within the realm of classical electrodynamics, and the parameter settings comply with its requirements [22,23]. When the intensity of the laser amplitude reaches a certain threshold (where the laser amplitude is 20 or even higher), the transition from Thomson scattering to Compton scattering requires the consideration of the recoil correction in quantum mechanics. Nevertheless, the range of the laser amplitude investigated in this paper is from 1 to 9, and therefore, the recoil correction need not be taken into account. In the Cartesian coordinate system, the interaction point of the laser and the electron in the cross-collision is set at the origin of the coordinate system, which renders the description more explicit. The delay time of laser emission determines the part of the laser where the electron collides, which will have a certain influence on various characteristics. Therefore, in this paper, the position where the electron collides with the laser is set at the center of the linearly polarized laser pulse, namely the position where the maximum radiation power is generated. After testing, the delay time of laser emission at this point is .
3.1. The Electron Deflection Trajectory in a Gaussian Pulse
Generally, the motion trajectory of the electron mainly consists of three stages: incidence, deflection and emission [24]. In the incidence stage, the electron starts to strike the linearly polarized Gaussian laser pulse moving along the positive z-axis along the positive x-axis, eventually resulting in a cross-collision at the origin of the Cartesian coordinate system. During the deflection stage, the electron undergoes a series of oscillatory motions within the polarization plane under the action of the laser. Generally, the amplitude of the oscillatory motions first increases and then decreases. Finally, in the emission stage, the electron leaves the range of the Gaussian pulse and is no longer subject to electromagnetic forces.
As depicted in Figure 2, the electron trajectory plots under varying laser amplitudes can be observed. Given that the incident direction of the electrons is parallel to the polarization plane of the linearly polarized laser, namely the XOZ plane, the electrons are not subject to a force in the y direction, and consequently, their trajectories remain within the XOZ plane. With the continuous enhancement of the laser amplitude, the electron trajectory exhibits virtually no change in the x-axis direction but continuously elongates in the positive z-axis direction. This is because the increase in the laser amplitude augments the longitudinal ponderomotive force of the linearly polarized laser pulse on the electron, resulting in a gradual elongation of the deflection distance of the electron along the z-axis. When the laser amplitude is extremely small, the electron merely undergoes oscillatory motions within a very narrow range before exiting. Observing Figure 2, the exit direction of the electron trajectories does not undergo a notable alteration, suggesting that the exit angle of the electron trajectories is minimally influenced by the laser amplitude.
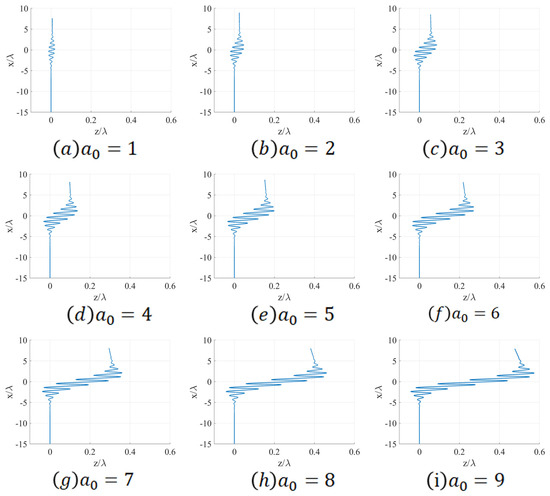
Figure 2.
The electron trajectories under various laser amplitudes.
As shown in Figure 3, when observing the changes in electron energy, it can be discerned that the period of electron energy variation is independent of the laser amplitude. However, the magnitude of electron energy change augments with the increase in laser amplitude. The period of electron energy change is equivalent to the period of velocity variation, which is correlated with the beam waist radius and the delay time of the laser pulse but shows no distinct relationship with the laser amplitude. The expansion of the laser beam waist radius can broaden the laser’s action scope and extend the action time and period of the electron along the x-axis. Owing to the increase in laser amplitude, the ponderomotive force exerted on the electron in the z-axis direction intensifies, and the acceleration and deceleration processes along the z-axis become more vigorous, causing the maximum value of electron energy to be greater and the minimum value to be smaller. Consequently, overall, a larger laser amplitude will result in a greater amplitude of electron energy variation.
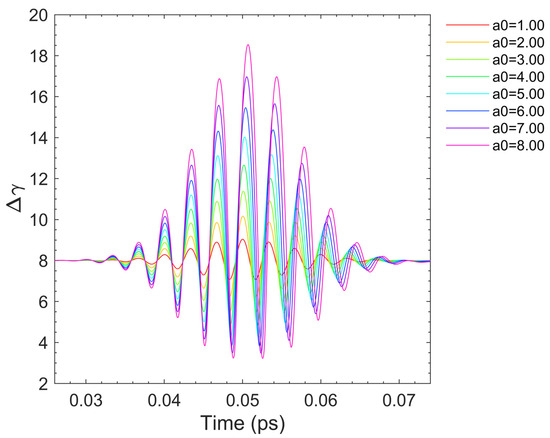
Figure 3.
The energy variations in electron motion under diverse laser amplitudes. represents the energy of the electron’s change.
3.2. Spatial and Angular Distribution
In order to maximize the electron radiation power, it is necessary to set an appropriate laser delay time to control the timing impact between the laser and the electron. Through tests, when the laser delay time is set at 5 fs, the electron precisely collides with the central position of the laser pulse, resulting in the maximum radiation power. During the collision process, the different collision parts between the electron and the laser pulse exert a considerable influence on the generated electron radiation power. Hence, for the purpose of investigating the characteristics of the electron radiation angle and spatial distribution, the normalized spatial angular distribution of the radiation power under the maximum radiation scenario, that is, when the delay time of laser emission is set at 5 fs, is plotted.
It can be derived from Figure 4 that with the gradual increase in the laser amplitude, the peak value of the normalized radiation power keeps escalating. Observing the scale of the coordinate axes, the peak radiation power rapidly surges from the order of to the order of , constituting a considerable variation. This is due to the fact that the increase in the laser amplitude intensifies the interaction between the laser and the electron, thereby leading to a more intense electron radiation during the collision.
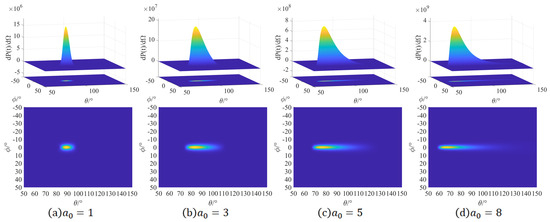
Figure 4.
The angular distribution diagram of the electron radiation power when the delay time is 5 fs. represents the radiant power per unit solid angle.
By observing the angular distribution of the polar angle and azimuthal angle in Figure 4, it can be observed that when the laser amplitude is extremely low, the electron radiation power is concentrated at and . This is attributed to the fact that the laser amplitude at this moment is very low, and its deflection effect on the fast-moving electron is extremely weak. The electron almost passes through the laser without deflection. Simultaneously, the radiation produced by the cross-collision between the laser and the electron is basically concentrated in the positive direction of the x-axis.
With the enhancement of the laser amplitude, a certain degree of differentiation emerges in the electron radiation adjuncts in both the and directions. The spatial angular distribution diagram of the electron radiation presents a comet-like image, with the radiation peak located at the head of the comet. Gradually, the comet moves toward the region of low values. As the laser amplitude intensifies, the peak of the polar angle decreases continuously and significantly.
According to the expression of radiation power, the radiation power is mainly influenced by two parameters: the energy of electron motion and the z-axis acceleration. In this article, the initial energy of electron motion remains invariant. Nevertheless, the increase in the laser amplitude will lead to the enhancement of the z-axis ponderomotive force that the electron undergoes when interacting with the laser pulse. Consequently, the electron will possess a greater z-axis acceleration, and the peak value of the generated radiation power will also become larger. In the direction of the polar angle, the increase in causes a substantial increase in the ponderomotive force along the z-axis, elongating the electron trajectory in the z-axis. Subsequently, the direction of the electron radiation power approaches the z-axis, indicating that more radiation is concentrated in the region with a smaller polar angle. Meanwhile, as the polarization plane of the linearly polarized laser is the XOZ plane, the radiation along the tangential direction of the electron trajectory lies in the XOZ plane, thereby resulting in the concentration of the radiation in the region where = 0.
By observing Figure 4, it can be discovered that the power distribution of the electron radiation in the and directions is highly uneven, which suggests that both have a rather obvious influence on the radiation power. Hence, we select the angular distribution diagram of the electron radiation power when the laser normalized amplitude and draw the cross-sectional plots in the and directions, respectively.
By observing the cross-sectional diagram of in Figure 5a, it can be observed that the electron radiation is basically concentrated within the range from −10° to 10°. Within the ranges from −180° to −10° and from 10° to 180°, the electron radiation is extremely small and can be disregarded. This is due to the fact that the electric field vector of the linearly polarized laser vibrates along the x-axis, and the polarization plane is the XOZ plane. Consequently, the generated electron radiation is primarily concentrated in the XOZ plane.
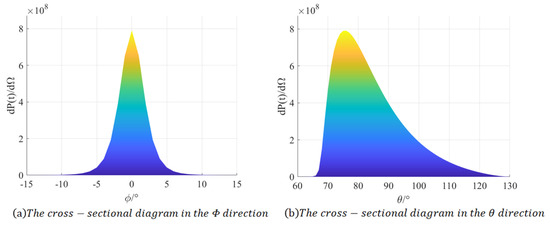
Figure 5.
The cross-sectional diagram of the angular distribution of the electron radiation power when .
Upon observing the cross-sectional diagram of in Figure 5b, it can be discerned that the electron radiation power is predominantly concentrated between 66° and 128°. Within the ranges 0–66° and 128–360°, the electron radiation is extremely minute and can be disregarded. There exists a rather intriguing phenomenon: as increases, the electron radiation power exhibits a sharp ascent followed by a gradual descent. This distribution regularity is associated with the angle of the electron’s movement within the range of laser influence. The tangential direction of the electron’s movement constitutes the direction of radiation. During the steep ascending phase, the electron’s movement is relatively stable without substantial directional alterations, thereby enabling the accumulation of a significant amount of electron radiation within a very narrow angle range. Meanwhile, in the slow descending phase, the electron radiation is unstable, and the movement direction undergoes rapid changes, resulting in a relatively sluggish accumulation of electron radiation.
3.3. Temporal Distribution
When the laser delay time is 5 fs, the temporal spectral characteristics of electron radiation are investigated in the observation direction with the maximum radiation power. As depicted in Figure 6, the position of the main peak is approximately at 51 fs, and a certain number of secondary peaks are symmetrically distributed on both sides. Generally, as the laser amplitude increases, the height of the main peak also increases rapidly, ranging from the order of magnitude to the order of magnitude, with a considerable span. This is because the increase in the laser amplitude enhances the effect of the linearly polarized Gaussian pulse on the high-energy electron, leading to a stronger radiation. As the laser amplitude increases, the position of the main peak will shift to the right correspondingly, and the coverage range of the main peak and the secondary peaks will expand. This suggests that the time for the electron to generate radiation in conjunction with the laser pulse is longer, and the time point for generating maximum radiation is retarded.
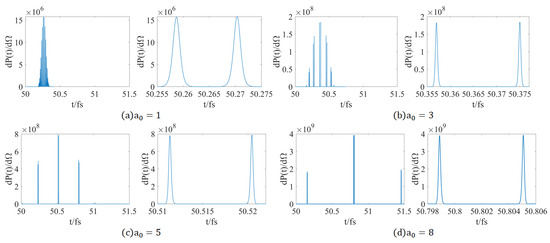
Figure 6.
The time distribution graphs of peak radiation power under different laser amplitudes and the magnified graphs of their main peaks.
When the laser amplitude is relatively small, there are numerous secondary peaks on both sides of the main peak, and the height of the first secondary peak is highly proximate to that of the main peak. Nevertheless, as the laser amplitude escalates, the quantity of secondary peaks on both sides of the main peak diminishes, and ultimately, only two essentially symmetrical and approximately equal-height secondary peaks persist. Concurrently, the height of the first secondary peak steadily declines. This implies that augmenting the laser amplitude is conducive to energy concentration. It can be rationally conjectured that when the laser amplitude is intense to a certain degree, the main peak will be significantly higher than the secondary peaks and can be regarded as a solitary ultrashort attosecond pulse.
It is noteworthy that although the multi-peak time spectrum generally assumes a symmetrical form, the heights of the symmetrical peaks exhibit differences and are not completely symmetrical. In the tightly focused context stipulated in this paper, the laser amplitude serves as the coefficient in the field strength formula . An increase in the laser amplitude will lead to an augmentation in the gradient of the field strength formula, thereby causing an increase in the velocity difference of electrons at symmetrical positions and giving rise to a more pronounced asymmetry. Owing to the ponderomotive force of the laser along the z-axis on the electron, the z-axis velocity of a single electron will undergo certain alterations within the oscillation periods corresponding to the two symmetrical secondary peaks. The interaction between a single electron and the laser during these two periods cannot be considered entirely the same [12].
It is rather intriguing that all the peaks, upon magnification, can be discerned to be constituted by two peaks with extremely minute time intervals. For the sake of convenient observation, taking the main peak as an example, we provided an enlarged diagram. After measurement, it is discovered that the distance between the closely adjacent double peaks of the main peak is constantly diminishing, and the intensity of the highest peak can reach the magnitude of .
3.4. Radiation Spectrum
This section examines the properties of the radiation spectrum with respect to the laser amplitude. As depicted in Figure 7, as the laser amplitude increases continuously, the quantity of higher harmonics in the radiation spectrum keeps augmenting, and the cutoff frequency rises from 1000 to 8000. This is due to the fact that an increase in laser amplitude intensifies the cross-collision interaction between the laser and electrons more vigorously, leading to a higher radiation intensity.
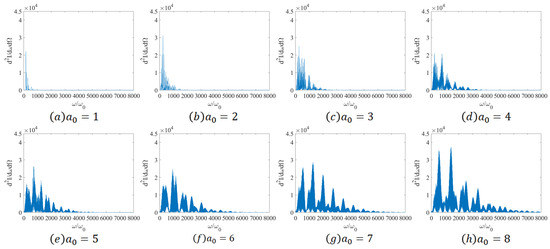
Figure 7.
Two-dimensional spectrum diagrams of the peak radiation power direction under various laser amplitudes.
Overall, the maximum intensity of the normalized radiation spectrum is not notably influenced by the laser amplitude. When the laser amplitude lies within the range of 1–3, the frequency of the radiation spectrum is predominantly distributed in the low-value region, and the frequency envelope is not distinct. The height of the main peak is conspicuously higher than that of the other secondary peaks, concentrating the majority of the energy. This is because at this juncture, the laser amplitude is relatively small; the emitted radiation intensity is low; and the output frequency is relatively low. When the laser amplitude is within the range of 4–6, the radiation spectrum gradually manifests an obvious multi-peak distribution. The heights of the main peak and the first secondary peak will exhibit a reciprocal relationship, equivalent to the maximum intensity of the radiation spectrum shifting to a higher frequency band. As the laser amplitude increases, the intensity of the interaction between the electron and the linearly polarized laser becomes higher, resulting in the output of radiation with a higher frequency. When the laser amplitude is within the range of 7–8, the height disparity between the main peak and the first peak of the radiation spectrum is narrowing, and both are significantly higher than the other secondary peaks. This implies that the energy is mainly concentrated on the main peak and the first peak in the medium- and low-frequency bands.
As depicted in Figure 8, with the augmentation of the laser amplitude, the spectral bandwidth of the spectrum is conspicuously broadened. On the one hand, due to the relativistic nonlinear effect, the acceleration encompasses higher-order frequency components, leading to an increase in higher harmonics. On the other hand, as a result of the Doppler effect, a certain frequency shift is generated. In contrast to the time spectrum, in accordance with the principle of Fourier transform, the spectral width of a short-time signal is proportional to . Hence, the shorter the pulse width, the broader the spectrum.
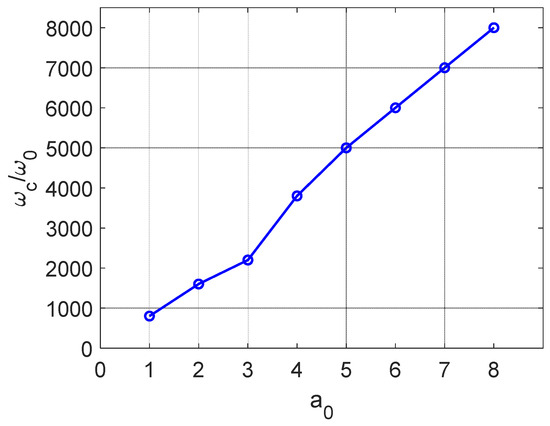
Figure 8.
The diagram depicting the relationship between laser amplitude and cutoff frequency.
Through the aforementioned research, it can be discerned that when the laser amplitude is relatively strong, radiation with a rather concentrated frequency range can be output. Hence, by enhancing the intensity of the laser, namely increasing the laser amplitude, radiation of a specific frequency can be concentratedly emitted. This proves to be of definite assistance to the actual production research.
For the sake of making the research more comprehensive, we also provide the three-dimensional spectrum related to . In Figure 9, it can be comprehended that as the laser amplitude keeps increasing, the three-dimensional radiation spectrum will constantly broaden in the direction, and the cutoff frequency will also keep rising. When the laser amplitude is relatively high, it can be distinctly observed that the three-dimensional spectral diagram presents a pronounced “valley-shaped” image. Specifically, the distribution of the polar angle is relatively broad at lower frequencies, and as the frequency increases, the radiation distribution in the direction gradually becomes concentrated.
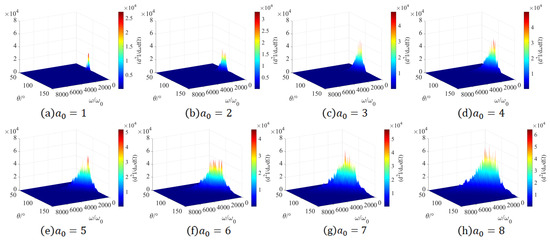
Figure 9.
Three-dimensional spectrum graphs of the peak radiation power direction under diverse laser amplitudes and polar angles.
4. Conclusions
By means of numerical simulation, this paper investigates the impact of laser amplitude on the spatial distribution, temporal characteristics and frequency-domain characteristics of radiation power under the circumstance of cross-collision between the tightly focused linearly polarized Gaussian laser pulse and the relativistic electron.
In terms of the electron trajectories, an augmentation of the laser amplitude can magnify the z-axis ponderomotive force exerted by a linearly polarized intense laser pulse on high-energy electrons, inducing a certain displacement of the electrons toward the z-axis and eventually elongating the oscillation trajectory of the electrons along the z-axis.
Meanwhile, the radiation power distribution diagram produced by the interaction of the linearly polarized intense laser and the high-energy electron will undergo certain distribution changes in the and directions as the laser amplitude increases. When the laser amplitude is very low, the electron radiation power is concentrated at and , and the image presents a “hill-like” distribution. As the laser intensity increases, the distribution of the image changes in the and directions, presenting a “comet-like” distribution. Generally speaking, the peak of the radiation power spectrum at the comet head shifts toward the direction of smaller , and the power peak continuously increases. This indicates that the radiation power can be enhanced by increasing the laser amplitude.
This paper also examines the temporal distribution characteristics in the direction of the maximal radiation power. The temporal distribution is mainly a symmetrical multi-peak structure. The number of peaks is reduced as the laser amplitude increases, eventually evolving into a symmetrical three-peak structure. The height of the secondary peaks relative to the main peak keeps shrinking, and the temporal distribution becomes more concentrated. It can be speculated that when the laser amplitude is large enough, the energy can be concentrated on the main peak, which can be regarded as a single attosecond laser pulse.
Ultimately, the morphology of the spectrum in the direction of the maximum radiation power will shift to a multi-peak state spectrum as the laser amplitude increases. When the laser amplitude is relatively intense, radiation with a more concentrated frequency range and superior quality can be output.
The research findings of this paper enrich the experimental experience of the nonlinear Thomson scattering theory and contribute to the study of cross-collision in the tight focusing state. Based on the above-mentioned rules, the laser amplitude can be regulated to generate X-rays that are more concentrated and more stable and can eventually be applied in fields such as biomedicine and atomic physics.
Author Contributions
Conceptualization, Y.T.; Methodology, Y.T.; Software, Y.T.; Validation, J.X. and Y.L.; Formal analysis, J.S., J.X. and Y.L.; Investigation, J.S.; Resources, J.X.; Data curation, J.S.; Writing—original draft, J.S.; Writing—review & editing, J.S.; Visualization, J.S.; Supervision, Y.L.; Project administration, G.Y.; Funding acquisition, G.Y. All authors have read and agreed to the published version of the manuscript.
Funding
This work was supported by the National Natural Sciences Foundation of China under Grant Nos. 10947170/A05 and 11104291; Natural science fund for colleges and universities in Jiangsu Province under Grant No. 10KJB140006; Natural Sciences Foundation of Shanghai under Grant No. 11ZR1441300; and Natural Science Foundation of Nanjing University of Posts and Telecommunications under Grant No. NY221098, and it was sponsored by Jiangsu Qing Lan Project and STITP Project under Grant No. CXXZD2024158.
Institutional Review Board Statement
Not applicable.
Informed Consent Statement
Not applicable.
Data Availability Statement
The original contributions presented in this study are included in the article. Further inquiries can be directed to the corresponding author.
Conflicts of Interest
The authors declare no conflicts of interest.
References
- Strickland, D.; Mourou, G. Compression of amplified chirped optical pulses. Opt. Commun. 1985, 55, 447–449. [Google Scholar] [CrossRef]
- Zeng, M.; Zhang, Y.; Chang, Y.; Tian, Y. Highly Collimated Monochromatic X-rays Generated by Collision of High-Energy Electrons with Tightly Focused Linearly Polarized Laser Pulse. Crystals 2023, 14, 13. [Google Scholar] [CrossRef]
- Zhou, Y.; Li, E.; Tian, Y. The Effect of the Initial Phase of a Tightly Focused Laser Pulse on the Emission Characteristics of High-Energy Electrons. Appl. Sci. 2024, 14, 4565. [Google Scholar] [CrossRef]
- Wang, H.; Gu, F.; Zhang, Y.; Wang, Y.; Yang, Q.; Tian, Y. Analysis of the Effect of Pulse Length and Magnetic Field Strength on Nonlinear Thomson Scattering. Appl. Sci. 2024, 14, 6776. [Google Scholar] [CrossRef]
- Pastor, I.; Alvarez-Estrada, R.F.; Roso, L.; Castejón, F.; Guasp, J. Nonlinear relativistic electron Thomson Scattering for laser radiation with orbital angular momentum. J. Phys. Commun. 2020, 4, 065010. [Google Scholar] [CrossRef]
- Wang, H.; Gu, F.; Zhang, Y.; Wang, Y.; Tian, Y. Analysis of the Effect of Pulse Width on Nonlinear Thomson Scattering from an Applied Magnetic Field. Appl. Sci. 2023, 13, 11710. [Google Scholar] [CrossRef]
- Zhuang, J.; Yan, Y.; Zhou, X.; Chen, Z.; Ren, S.; Tian, Y. Quasi-monochromatic spectral emission characteristics from electron collision with tightly focused laser pulses. Laser Phys. 2021, 31, 035401. [Google Scholar] [CrossRef]
- Zhuang, J.; Wang, Y.; Wang, C.; Cai, Y.; Tian, Y. Spectral shape of quasi-monochromatic radiation from electron colliding with tightly focused laser pulses. Laser Phys. 2021, 31, 065403. [Google Scholar] [CrossRef]
- Chang, Y.; Zeng, Z.; Wang, C.; Long, Z.; Tian, Y. Modulation of high-energy γ-rays by collision of an ultra-high-energy electron with a tightly focused circularly polarized laser pulse. Appl. Opt. 2022, 61, 6038–6045. [Google Scholar] [CrossRef]
- Chang, Y.; Wang, C.; Wang, Y.; Long, Z.; Zeng, Z.; Tian, Y. Collimation and monochromaticity of γ-rays generated by high-energy electron colliding with tightly focused circularly polarized laser with varied intensities. Laser Phys. Lett. 2022, 19, 065301. [Google Scholar] [CrossRef]
- Chen, S.; Maksimchuk, A.; Umstadter, D. Experimental observation of relativistic nonlinear Thomson scattering. Nature 1998, 396, 653–655. [Google Scholar] [CrossRef]
- Lee, K.; Cha, Y.H.; Shin, M.S.; Kim, B.H.; Kim, D. Temporal and spatial characterization of harmonics structures of relativistic nonlinear Thomson scattering. Opt. Express 2003, 11, 309–316. [Google Scholar] [CrossRef] [PubMed]
- Zhang, Y.; Yang, Q.; Wang, J.; Gong, X.; Tian, Y. Zeptosecond-Yoctosecond Pulses Generated by Nonlinear Inverse Thomson Scattering: Modulation and Spatiotemporal Properties. Appl. Sci. 2024, 14, 7038. [Google Scholar] [CrossRef]
- Qingyu, Y.; Yubo, W.; Youwei, T. Ultrashort and high-collimation X/γ-rays generated by nonlinear inverse Thomson scattering between off-axis electrons and circularly polarized intense laser pulses. Opt. Express 2023, 31, 27723–27734. [Google Scholar] [CrossRef]
- Yang, Q.; Wang, Y.; Cao, Y.; Li, J.; Tian, Y. Spatial radiation features of the off-axis collision between a relativistic electron and a tightly focused linearly polarized laser. Laser Phys. Lett. 2023, 20, 045301. [Google Scholar] [CrossRef]
- Harvey, C.; Marklund, M.; Holkundkar, A.R. Focusing effects in laser-electron Thomson scattering. Phys. Rev. Accel. Beams 2016, 19, 094701. [Google Scholar] [CrossRef]
- Blackburn, T.G. Radiation reaction in electron–beam interactions with high-intensity lasers. Rev. Mod. Plasma Phys. 2020, 4, 5. [Google Scholar] [CrossRef]
- Kravets, Y.; Noble, A.; Jaroszynski, D. Radiation reaction effects on the interaction of an electron with an intense laser pulse. Phys. Rev. E Stat. Nonlinear Soft Matter Phys. 2013, 88, 011201. [Google Scholar] [CrossRef]
- Piazza, A.D. Exact solution of the Landau-Lifshitz equation in a plane wave. Lett. Math. Phys. 2008, 83, 305–313. [Google Scholar] [CrossRef]
- Salamin, Y.I.; Keitel, C.H. Electron acceleration by a tightly focused laser beam. Phys. Rev. Lett. 2002, 88, 095005. [Google Scholar] [CrossRef]
- Jackson, J.D. Classical Electrodynamics; John Wiley & Sons: Hoboken, NJ, USA, 2021. [Google Scholar]
- Sarachik, E.S.; Schappert, G.T. Classical theory of the scattering of intense laser radiation by free electrons. Phys. Rev. D 1970, 1, 2738. [Google Scholar] [CrossRef]
- Brown, L.S.; Kibble, T.W.B. Interaction of intense laser beams with electrons. Phys. Rev. 1964, 133, A705. [Google Scholar] [CrossRef]
- Li, Y.; Yang, Q.; Tian, Y. Crescent-shaped spatial distribution: Radiation properties concerning beam waist from the cross collision of a tightly focused laser pulse and a relativistic electron. Laser Phys. 2024, 34, 065401. [Google Scholar] [CrossRef]
Disclaimer/Publisher’s Note: The statements, opinions and data contained in all publications are solely those of the individual author(s) and contributor(s) and not of MDPI and/or the editor(s). MDPI and/or the editor(s) disclaim responsibility for any injury to people or property resulting from any ideas, methods, instructions or products referred to in the content. |
© 2025 by the authors. Licensee MDPI, Basel, Switzerland. This article is an open access article distributed under the terms and conditions of the Creative Commons Attribution (CC BY) license (https://creativecommons.org/licenses/by/4.0/).