Abstract
This study proposes a simplified approach for the experimental dynamic characterization of the historic Messina Bell Tower (northeastern Sicily) using passive seismic single-station surveys. The Horizontal-to-Vertical Spectral Ratio (HVSR) analysis identified a site resonance frequency of approximately 1.06 Hz, while the Multichannel Analysis of Surface Waves (MASW) survey contributed to the characterization of the shear wave velocity profile, providing a coherent geophysical framework useful for structural dynamic analysis. Spectral ratios analysis revealed four distinct vibration modes, including a fundamental rocking mode (~1.4 Hz), a torsional mode (3.5 Hz), and two higher-frequencies flexural modes. The structure’s dynamic behavior, notably its sensitivity to torsion and rocking, is attributed to the deformable subsoil. Damping ratios estimated via the Random Decrement Method (RDM) were below 1%, consistent with the expected linear elastic response under ambient vibrations. The results show strong agreement with previous long-term monitoring, validating the effectiveness of passive seismic techniques for rapid, non-invasive assessment. This study demonstrates that streamlined, time-efficient methodologies are capable of delivering modal parameters consistent with those obtained from more extensive and resource-intensive monitoring campaigns, thereby providing a reliable and practical approach for the seismic vulnerability assessment of heritage structures.
1. Introduction
Dynamic characterization involves assessing the intrinsic properties of a structure, independent of the type or magnitude of the applied loads. It is a non-destructive investigative method suitable for various situations, ranging from newly constructed buildings to existing structures of historical or artistic significance. In the case of new structures, it is typically used to validate assumptions made during the design phase, such as material properties and structural stiffness. Applied to older or historically significant buildings, this method predominantly captures the actual structural behavior, helping in planning necessary safety interventions [1,2,3,4].
Numerous studies reported in the literature focus on the dynamic analysis of structures using this investigative method [1,2,3,4,5]. This approach also facilitates the identification of potential local or global damages within the structure, which, depending on their severity, can lead to a decline in performance. Typically, this deterioration is observed as a stiffness decrease, resulting in changes in frequencies and vibration modes, ultimately affecting the structure’s dynamic response [5,6].
Another application of experimental dynamic characterization concerns the study of dynamic loads acting during the service life of the structure. These loads could cause significant deformations that must be considered when analyzing structural responses and performing structural inspections. Examples include large-span bridges, dams, and towers subjected to wind action, seismic activity, vehicular or railway traffic, vibrations from heavy industrial machinery, or explosions in specific contexts (e.g., quarries) [7].
Dynamic characterization has gained widespread use due to an extensive architectural heritage and increasingly complex structures. Concurrently, significant technological progress in computing and electronics has enabled the study of static and dynamic properties of structures and comparisons between numerical models and actual structural behavior. The integration of experimental data and probabilistic methods has been suggested to address the uncertainties inherent in material and geometric variability. From such comparisons, substantial differences have often emerged between the mechanical properties derived from numerical modeling and those of the actual structure. These differences may arise from incomplete information about the structural material properties. Specifically, the natural variability in material characteristics, stemming from aging, degradation, and limited historical documentation, leads to deviations between model predictions and real-world behavior. Material properties and geometry are the origin of mass, stiffness, and damping properties, making it complicated to reproduce reality in the model [8]. Furthermore, the extent of these differences depends on the type of modeling conducted (finite element modeling, discrete models, macro-models, etc.) [9]. Recognizing these uncertainties is vital for enhancing safety, refining retrofit strategies, and ensuring more reliable seismic assessments of historical buildings.
Experimental techniques are necessary to bridge the gap between the real structure and the numerical model. The goal is to calibrate the model using experimental results that better represent the structure’s dynamic properties. Dynamic identification techniques are of two types, input–output techniques in which the structural response (output) is measured through excitation at one or more points (input), and output-only techniques based on measuring the structural response (output) excited by environmental sources (e.g., vehicular traffic and wind), assuming that the vibration-generating entity is a stochastic process. Input–output techniques, known as Experimental Modal Analysis (EMA), allow for estimating modal parameters, including modal frequencies, damping ratios, mode shapes, and modal participation factors. Modal parameters are identified using the frequency response function of the signal [10,11].
Unlike input–output techniques, output-only techniques rely on the excitation that can be considered white noise (often unknown and treated probabilistically [12]). Known as Operational Modal Analysis (OMA), this approach is particularly applicable when dynamically exciting massive structures (e.g., bridges and buildings) is challenging and costly, as well as in many typical civil engineering cases [12,13,14].
Both techniques lead to the determination of the structural response, with the primary difference being that OMA cannot identify modal participation factors due to unknown excitation input. Additionally, differences exist in instrumentation requirements; the output-only technique requires highly sensitive equipment due to reduced excitation levels and particular attention to data processing, given that only output data are available.
However, the advantages of this technique are numerous, such as the speed of execution and low costs. Allows acquisitions under conditions similar to those in actual operation, as it can be performed without compromising the structure’s intended use. This technique can identify closely spaced modes and can be applied for structural monitoring and damage localization.
Methods using ambient noise vibrations are widely used for the definition of dynamic properties of heritage buildings such as old towers and churches, making it possible to obtain information on the resonance frequency, damping, and propensity of the structure to undergo torsional effects [15,16,17,18,19,20,21].
In order to address the need for efficient and cost-effective monitoring, this study demonstrates that a simplified experimental dynamic characterization approach, implemented through passive single-station seismic surveys, can effectively capture the key modal parameters of a structure. Specifically, we apply this methodology to the Messina Bell Tower, an important UNESCO heritage site located in Messina, in the northeastern part of Sicily (Figure 1a). It hosts one of the largest astronomical clocks in the world (Figure 1b). It was first built in the XII century, but catastrophic seismic events such as the “Val di Noto” earthquake in 1693 and the “Messina earthquake” in 1908 seriously damaged it.
The current bell tower dates back to 1933; the structure is characterized in the highest part by a quadrangular spire on either side of which are four lower spires. It is 65 m high and is divided into eight floors plus the ground floor characterized by a square base. The bell tower hosts the astronomic clock, which evokes, with statues and mechanical combinations, the most interesting episodes of Messina’s religion, astronomy, and history (Figure 1b). The subsoil beneath the bell tower is characterized by sedimentary deposits with varying grain sizes, including silt, clay, sand, gravel, and conglomerates (Figure 1c). These sediments date from the Upper Miocene, characterized by evaporitic series, to the Upper Holocene and present day, featuring recent alluvial and coastal plain deposits of considerable thickness [22,23].
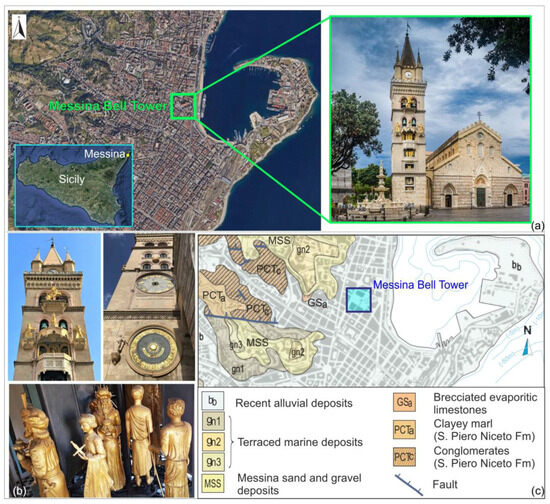
Figure 1.
(a) Location of the Messina Bell Tower (the insert in the bottom left-hand corner shows the location of the Messina city); (b) statues and details of astronomical clock; (c) geological sketch map of Messina area (modified from [23]).
Research has demonstrated that seismic wave amplification is particularly emphasized in areas with thick alluvial or coastal plain deposits, posing heightened risks to structures located in these regions [24]. The properties of underlying materials significantly influence the seismic response of structures built on sedimentary deposits. Variations in grain size, stiffness, density, and layering can amplify or attenuate seismic waves, resulting in localized ground motion effects. Soft or loose deposits, such as clay or silt, often amplify seismic waves more due to their lower stiffness and higher deformability compared to bedrock. This amplification effect, known as site effects, can lead to prolonged shaking and increased structural damage during earthquakes. Furthermore, the stratification and heterogeneity of deposits can cause resonance effects, where the natural frequency of the soil layers aligns with that of the structure, exacerbating seismic vulnerability.
Although the Messina Bell Tower has been studied in previous research through a permanent network of accelerometers [25], our approach aims to validate whether the results obtained from a brief, single-station survey are fully comparable to those from longer and more complex monitoring campaigns. By integrating the analysis of resonance frequency, damping, and vibration modes with a quick characterization of the site’s shear wave velocity distribution and resonance frequency, we provide a comprehensive evaluation of both the structure and its underlying soil conditions. Ultimately, this work not only confirms the reliability of passive seismic methods for dynamic characterization but also highlights their potential as a rapid, cost-effective tool for seismic vulnerability assessments of historical structures.
2. Materials and Methods
2.1. Site Characterization
The dynamic characterization of the subsoil is critical in various geotechnical and seismic engineering applications. Among the techniques commonly employed for this purpose, the Multichannel Analysis of Surface Waves (MASW) and Horizontal-to-Vertical Spectral Ratio (HVSR) methods are widely recognized for their efficiency, reliability, and cost-effectiveness in providing essential subsurface information.
The MASW technique is widely used due to its non-invasive nature, and the relatively quick acquisition and processing times required for generating reliable results [26]. The method examines surface wave propagation to determine the 1D shear wave (Vs) velocity profile of the subsurface. By analyzing the surface wave dispersion curves, this method provides a robust estimate of the Vs structure, which is essential for assessing the stiffness and dynamic behavior of the site.
The HVSR method [27] is based on the spectral ratio between horizontal and vertical components relative to environmental seismic noise recordings made through passive seismic single-station surveys. This method is widely used to identify the site resonance frequency, related to sediment thickness overlying the bedrock, giving information on the possible overall site response during seismic events. The minimal equipment and data processing required make this technique an excellent tool for rapid and large-scale surveys [28]. The complementary use of MASW and HVSR methods enhances their application in site characterization. Their use in various geological and environmental contexts has amply validated their ability to produce consistent and accurate results on subsurface conditions with minimal investment in time and resources [29,30,31,32].
Four passive single-station seismic recordings were carried out at different points in the area surrounding the bell tower (Figure 2a) to identify the site resonance frequencies and verify the possible presence of lateral variations in the subsoil characteristics. The environmental seismic noise was acquired at a sampling rate of 128 Hz for 16 min at each recording site. The recordings were performed using four portable three-component digital seismometers, which allowed all measurements to be taken in the same time frame. Signals acquired were subsequently processed using the HVSR technique. Each recorded signal was divided into time windows of 20 s, selecting the stationary part and removing the transient. Fourier spectra were calculated in the frequency band 0.5–20.0 Hz and smoothed using a Triangular window with a smoothness of 10% (Figure 2b).
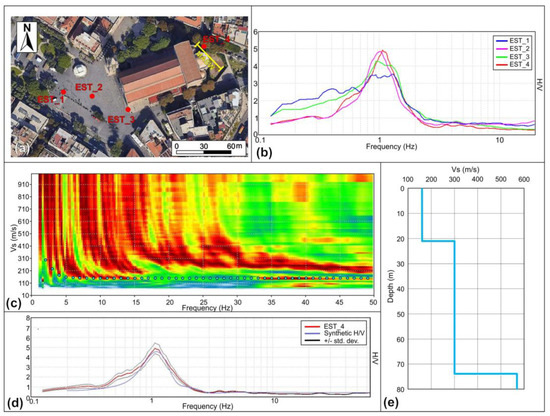
Figure 2.
(a) Location of the passive seismic single-station and MASW surveys performed in the Messina Bell Tower area; (b) HVSR spectra; (c) Rayleigh waves dispersion curve, obtained from the MASW survey; (d) HVSR spectrum, relating to EST4 seismic ambient noise record acquired near the MASW profile; (e) 1D Vs–depth profile obtained from MASW–HVSR joint fit. The blue dots on dispersion curve and the violet line on the HV spectrum correspond to syntetic curves obtained by the model.
In addition to the passive single-station surveys, a MASW survey was carried out to the east of the bell tower, in an area lower than the street level, behind the nearby cathedral (Figure 2a). The choice of the site where to carry out the survey was made considering the need to bypass the effect of the square floor where the bell tower is located, thus attempting to effectively investigate the subsoil characteristics without interference from the anthropized layer. The survey was carried out using 24 vertical geophones, with a frequency of 4.5 Hz, positioned at a distance of 1.5 m from each other, for a total array length of 34.5 m. The energizations were carried out at 3 and 6 m from the first and last geophones using an 8 kg sledgehammer. Five shots were performed at each energization point to increase the signal-to-noise ratio (vertical stacking).
The acquired signal was analyzed in the frequency–phase velocity domain to isolate the energy associated with Rayleigh waves. Assuming a predominance of surface waves in the wave field, the Vs–depth profile for the investigated area was derived after obtaining the dispersion spectrum of Rayleigh waves through MASW processing. This was achieved by performing a joint fit between the dispersion spectrum and an H/V spectrum acquired near the alignment. The combination of these two techniques is based on their complementary strengths. While HVSR is particularly sensitive to the resonance frequencies of the subsurface, which reflect impedance contrasts and elastic properties between different subsurface layers, MASW provides an evaluation of shear wave velocity, which is crucial for characterizing the mechanical properties of the subsurface, especially in the upper layers. The joint inversion integrates these two datasets, reducing the uncertainties that typically arise from separate inversions. While the low-frequency resolution of MASW is limited, it still provides valuable data for constraining the shear wave velocity profile, especially in the near-surface layers. These data combined with the resonance frequencies observed by HVSR help to constrain the shear wave velocity profile, at greater depths. The joint inversion of these two techniques enables a more comprehensive and accurate characterization of the subsurface structure that integrates both the resonance frequency information from HVSR and the shear wave velocity distribution at various depths. Starting with a subsurface model defined by parameters such as layer thickness, Vs, Vp, density, and Poisson’s ratio, based on geological knowledge of the site, both a dispersion curve and a theoretical H/V spectrum were calculated using Grilla software Rel. 7.6 (Micromed S.p.A., Treviso, Italy). These theoretical curves were then superimposed on the experimental Rayleigh wave dispersion spectrum (Figure 2c) and the experimental H/V spectrum (Figure 2d). The model was iteratively adjusted to maximize the alignment between the theoretical and experimental curves, the final model providing the 1D Vs–depth profile for the studied site (Figure 2e).
2.2. Bell Tower Experimental Dynamic Characterization
Proper planning of experimental tests is essential for determining data length, sampling frequency, sensor positioning, and the number of instruments required. Ideally, devices (e.g., velocimeters or accelerometers) should be placed at all locations critical for assessing structural behavior [33]. However, in practice, the number of sensors is often constrained by financial resources. Based on these limitations, a minimum number of instruments are deployed to ensure the collection of necessary data.
Avoid placing instruments at nodal points, as these can complicate mode interpretation. Additionally, while a specific sensor arrangement may optimize the detection of one mode, it could be less effective for others. A classic example is a supported beam: placing a sensor at midspan highlights the first mode values but renders the second mode values null. To mitigate this, sensors should generally not be placed along axes of symmetry to prevent the suppression of asymmetric modes.
Passive single-station seismic surveys were carried out at different levels of the bell tower to carry out its expeditious dynamic characterization. Five portable three-component digital seismometers equipped with three velocimeter sensors were used for the acquisitions. At each measurement point, environmental seismic noise was recorded with a sampling frequency of 256 Hz. All acquisitions were performed on the same day.
The structure vibration frequencies were investigated by performing passive seismic single-station acquisitions in two configurations.
Initially, non-synchronous measurements were carried out on each floor of the tower, in this phase No. 18 ambient noise recordings were performed; the measurements were carried out by positioning the three-component digital seismographs along two verticals, A and B, as shown in Figure 3a, keeping instrumental north oriented in the same direction for all measuring points. In addition, a measurement was made in a room below the ground floor, indicated in Figure 3a as RIF, with an acquisition time equal to the entire acquisition time of all the measurements made in the structure. This approach enabled the capture of the complete dynamic behavior of the structure, including accurate determination of natural frequencies and higher-order mode shapes, characterized by the presence of multiple nodal points, including at intermediate locations along the height of the structure. The second configuration carried out to obtain information on the vibration modes of the structure provided for the acquisition of the environmental seismic noise at four positions, in a partially overlapping time interval, located at different structure levels but aligned vertically, as shown in the diagram in Figure 4a. Even in this case, the same orientation of instrumental north was maintained for all the measurement stations. Since it was not possible to synchronize all the available devices either digitally or via radio, because not all of them were equipped with such synchronization instruments, the environmental seismic noise was acquired for a longer time, equal to 20 min, including a bell toll in the initial parts of this interval. This strong stress, clearly distinguishable from ambient noise in all recordings, was used for the subsequent traces synchronization, through a Matlab (R2023b) script appositely implemented.
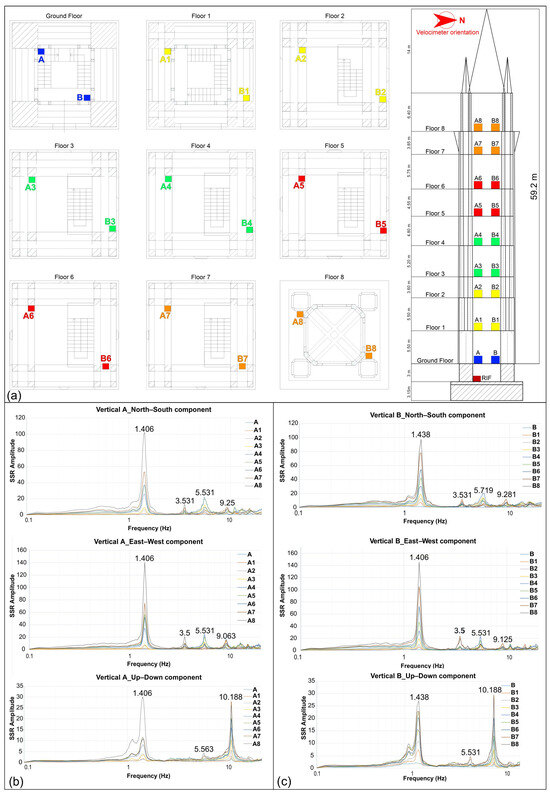
Figure 3.
(a) Location of the passive seismic single-station non-synchronous surveys performed inside the Messina Bell Tower; spectral ratio plots obtained from ambient seismic noise records performed at the A (b) and B (c) verticals.
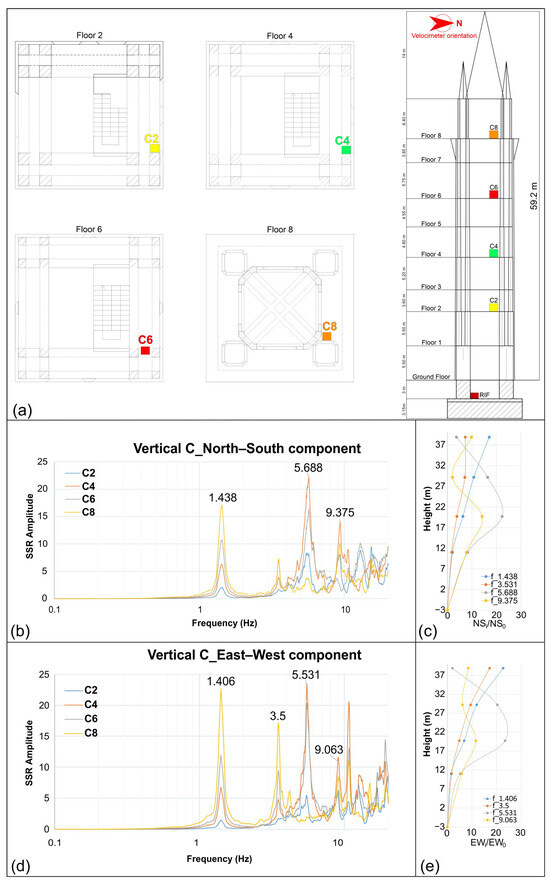
Figure 4.
(a) Location of the passive seismic single-station synchronous surveys (Vertical C) performed inside the Messina Bell Tower; (b) horizontal-to-horizontal spectral ratio plot obtained for the north–south component; (c) shape modes related to the vibration frequencies identified for north–south component; (d) horizontal-to-horizontal spectral ratio plot obtained for the east–west component; (e) shape modes related to the vibration frequencies identified for the east–west component.
In the script, the cross-correlation between two signals coming from two different devices and relating to the same direction (e.g., north–south) is calculated. Through this procedure, the similarities between the signals are assessed, normalized concerning the maximum value, given by the bell tolling, and the position of this point is determined to identify the delay. This procedure is performed between all possible signal pairs, which in our case are six. After assessing the cross-correlation between the signals, the alignment of the signals is carried out concerning the signal that starts first. At the end of this procedure, four synchronous signals with a duration of 9 min each were extracted.
In this research, the dynamic characterization of the structure, specifically identifying frequencies and modes of vibration, was carried out using the Standard Spectral Ratio (SSR) technique. This involves calculating the ratio of the Fourier spectra of signals from horizontal directions, measured at vertically aligned locations, with a reference record taken at ground level [34]. The structure’s natural frequencies are then determined through a straightforward identification of the spectral peaks. In particular, the Fourier spectrum of each component is computed by dividing the signal into 20 s, non-overlapping windows. A window length of 20 s represents a reasonable compromise between temporal and frequency resolution. Shorter windows enhance temporal resolution but degrade frequency resolution, particularly for low frequencies. In contrast, longer windows improve frequency resolution but may obscure rapid temporal variations in the signal. Considering these trade-offs, a 20 s window was chosen to optimize both temporal and frequency resolution, with a particular focus on the low-frequency range of interest. The engineering frequency range of primary interest typically spans from 0.5 to 10 Hz. Therefore, the lowest frequency of interest was assumed to be 0.5 Hz, corresponding to a period of 2 s (T = 1/f). To achieve improved spectral resolution, the analysis window should be at least ten times the period of the lowest frequency under investigation. Thus, a 20 s window was selected to ensure that the minimum resolvable frequency completes at least 10 full cycles within the analysis window. Each window is detrended, tapered, padded, fast Fourier transformed, and smoothed using triangular windows whose width is 1% of the central frequency. The peaks identification is performed on the distinct individual spectra normalized to a reference spectrum related to a signal acquired at the ground level.
Additional single-station passive seismic acquisitions were performed to assess the possibility of the structure being subject to rocking and torsion modes (Figure 5a) and to obtain preliminary information on the damping of the structure.
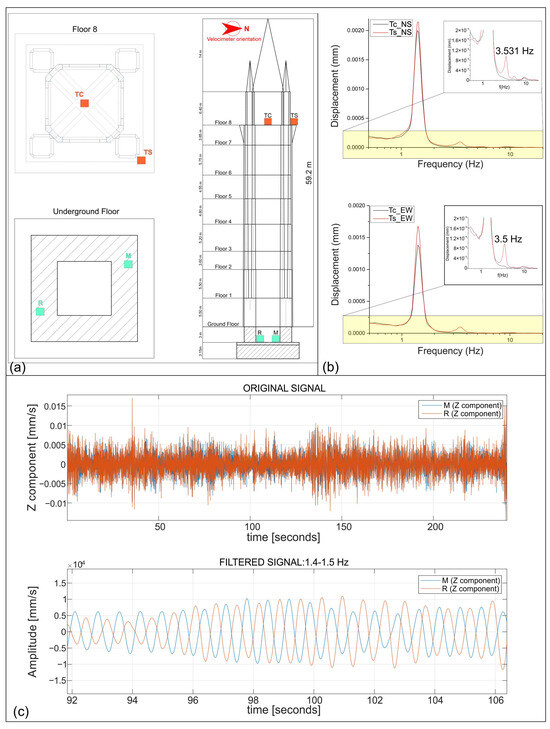
Figure 5.
(a) Location of the passive seismic single-station synchronous surveys performed at the base and at the top floor of Messina Bell Tower; (b) torsional mode identification: north–south and east–west displacement spectra related to the recordings carried out at the tower top floor; (c) rocking mode verification: top, original signals in time related to the Z components of the records performed at the tower base; bottom, amplitude relative motion of the signals filtered in the time domain, highlighting the 180° phase shift between the two opposite ends of the structure base.
All structural design codes take into account the possibility of torsional effects occurring in a building as they can contribute to a significant increase in damage under high stresses. Ambient noise recordings on the highest floor of a building [35] allow the identification of its propensity to experience torsional effects.
The stress increase (Δ) due to structural irregularities or uneven distribution of masses can be evaluated using the relationship:
where δmax and δavg are the displacements at the side and center of the building on the last floor, respectively. Generally, a torsional mode may be present on irregular structures since the center of mass and center of stiffness do not coincide.
The estimation of Δ can be retrieved by ambient seismic noise measurements performed on at least two points in the same structure level [36] by calculating the displacement spectra. For the best possible estimation of the structure propensity to be affected by torsional effects, it is essential to measure a position close to the barycenter axis of the building to detect the amount of translation and one at one end of the building, where the torsional component is also supposed to be recorded. The simultaneity of the recordings is not essential but makes it more immediate to establish whether the measured points move in-phase (same direction) or in phase opposition (opposite direction). Following these indications, two synchronous measurements were carried out at the highest floor of the bell tower; for each horizontal component, the displacement spectra were calculated. By comparing the spectra for homologous components of the recording acquired at the barycenter with that of the measurement acquired at one end, it is possible to identify a torsional mode when a spectral peak is observed in the lateral measurement and at the same frequency, the peak disappears in the barycenter measurement (Figure 5b).
In this work, those proposed by Eurocode 8 [37] for which the ratio Δ must not exceed 20% and 40% of δavg were considered as thresholds. Torsional effects showing values of Δ ≤ 1.2 are considered weak, values of 1.2 < Δ ≤ 1.4 are associated with a moderate torsional effect, and values of Δ > 1.4 (strong torsional effects) are considered significant.
The rocking motion generally refers to a rotational response of a structure around a horizontal axis at or near its base, caused by alternating uplift and contact loss. In idealized models, this phenomenon is often associated with rigid bodies rocking on perfectly stiff supports. However, in real structures, the manifestation of rocking is typically more complex. It may involve partial uplift, local detachment, foundation compliance, or even slight soil deformation, all of which affect the geometry and stiffness of the rotation axis.
Consequently, the axis of rotation is not strictly horizontal or fixed, and the rocking motion may appear coupled with other dynamic behaviors such as horizontal bending or torsion. Despite these complexities, rocking can still be identified by specific kinematic signatures, such as out-of-phase vertical displacements at opposite corners of the base and strong phase relationships across components. When rocking motion occurs, the base of the building oscillates around a horizontal rocking axis. The vertical displacements of two distant points, positioned on opposite sides of the rocking axis, are in phase but exhibit opposite amplitudes, resulting in a 180° phase shift [38]. To assess this behavior, two synchronous ambient vibration measurements were carried out using three-component velocimeters, positioned at opposite corners of the tower’s base (Figure 5a). No artificial excitation was applied; the structure was excited only by environmental sources. The instruments were synchronized via radio link. Having identified the spectral peak present on all three components, to better isolate the contribution of the identified mode of interest, a band-pass filter was applied to the recorded signals. The filter was centered on the frequency of the spectral peak common to all three components of both sensors, with a bandwidth of ±10% to retain the dominant modal contribution while attenuating noise and the influence of other modes. The filtering was performed in the time domain using a tool implemented by [16]. This allowed for a more accurate comparison of amplitude and phase differences between the two opposite points of the base of the structure, and facilitated a clearer identification of the relative motion, at the same instant, associated with the targeted vibration mode (Figure 5c).
Structural damping is a further factor conditioning the dynamic response of a structure and consequently the magnitude of shaking following a seismic event. The damping function serves to dissipate energy and limit the amplitude of vibrations induced in a structure. The specific damping capacity can be defined as the percentage of the total vibration energy lost in one cycle. Usually, in an oscillating building, the damping ratio is between 1 and 10% (1< ξ <10%) [39].
In the present study, to obtain expeditious information about this parameter, one of the environmental seismic noise recordings, performed at the highest floor of the structure, was analyzed using the Random Decrement Method (RDM) [39,40] (Figure 6). This method assumes that the input signal is the sum of a random signal and an impulse response function. Consequently, the random component tends to disappear by averaging multiple time windows with identical initial conditions, and the structural response becomes more pronounced. This process makes it possible to provide an estimate of the free vibration decay in the system. The RDM analysis was applied to the first vibration mode, which is detectable and distinct from the other modes [41], and which usually makes the greatest contribution to the structure’s motion [16]. The signals were processed through a tool implemented in Geopsy (http://www.geopsy.org/ accessed on 26 October 2024) using a Butterworth band-pass filter of order 3 in a range of ±10% around the fundamental mode and considering windows containing 20 times the analyzed period.
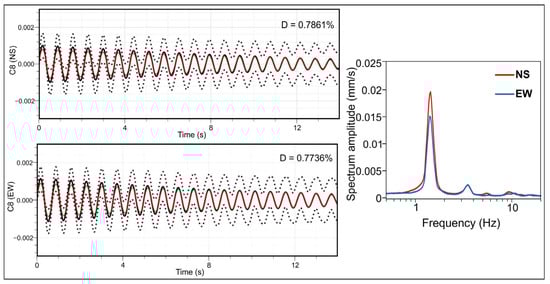
Figure 6.
Damping plot obtained using the Random Decrement Method (RDM) and corresponding Fourier spectra (FFT) for the C8 sampling point (see Figure 4a for location). The damping was evaluated for the fundamental vibration frequency identified. The continuous black line corresponds to the mean of the random decrement, the dashed lines correspond to the standard deviation, and the solid red line corresponds to the fitted exponentially decreasing function.
3. Results
3.1. Site Characterization
The H/V spectral ratio graphs obtained from processing the four ambient seismic noise recordings performed outside the bell tower show the presence of a single significant peak, with amplitude H/V spectral ratio > 2, at a frequency around 1 Hz (Figure 2b). This clear spectral peak corresponds to the site resonance frequency and indicates the presence of a sharp impedance contrast in the subsoil.
The joint fit between the dispersion curve, obtained from the MASW survey carried out behind the cathedral, and the H/V spectrum relative to the EST4 acquisition, closer to the array, made it possible to obtain a subsurface 1D shear wave velocity model up to a depth of approximately 80 m (Figure 2c–e).
In the 1D Vs–depth model, rather low velocities are observed (Figure 2e), in agreement with the lithotypes characterizing the area. There is a first, more superficial layer characterized by velocities of 160 m/s, up to a depth of 21 m, the second layer is 53 m thick with an average Vs of 300 m/s. From a depth of 74 m, the shear wave velocity tends to increase, reaching average values of 570 m/s. The significant resonance peak observed in the H/V spectra performed outside the building could be caused by this sharp transition.
3.2. Bell Tower Experimental Vibration Frequencies and Mode Shapes Detection
The SSR graph of spectra related to recordings acquired along the same vertical shows four large amplitude peaks related to bell tower vibration frequencies (Figure 3b,c), in the frequency range 0.5–10 Hz. A first large amplitude peak is observable at 1.406 Hz in the north–south component for the spectra associated with vertical A and at 1.438 Hz for vertical B and C (synchronous signals). The second vibration frequency identified emerges at 3.531 Hz in all the spectra. Two further peaks are at frequencies of 5.531 Hz and 9.25 Hz on the SSR related to vertical A; these peaks are present with slight frequency variations in the SSR graphs of vertical B and C (Figure 3b,c and Figure 4b) (Table 1).

Table 1.
Bell tower vibration frequencies and average of the percentage differences between each analyzed pair.
The SSR spectra of the east–west component show the first three frequency peaks at the same frequency in all the verticals investigated; the vibration frequencies detected are equal to 1.406 Hz, 3.5 Hz, and 5.531 Hz. Only the fourth peak, identified at 9.063 Hz, shows a small variation in the frequency value for vertical B (Figure 3b,c and Figure 4d) (Table 1).
The signal synchronization performed on the recordings for vertical C allowed the reconstruction of the mode shapes for the frequencies identified on both horizontal components (Figure 4c,e).
The shape relative to the first mode shows an almost linear trend with increasing amplitude from the base to the top of the bell tower; this indicates behavior dominated by a fundamental flexural mode.
The behavior is also similar in the EW direction, with increasing amplitudes up to the top. However, the stiffness may be slightly different, as the somewhat lower frequency suggests.
The shape of the second mode, for the north–south component, is characterized by an increasing amplitude from the base to the sixth floor, while at the eighth floor, the amplitude does not increase. In contrast, the east–west component shows a linearly increasing trend from the base upward.
The shape of the third mode presents a more complex pattern with two reversals of curvature for both components; again the slightly lower frequency for the east–west component suggests a slight difference in stiffness compared to the north–south component.
In the fourth mode, the modal shape for the two components follows the same pattern, becoming even more complex with several inversions of curvature for points at different heights in the bell tower.
The C8 acquisition performed on the highest floor of the bell tower was further processed using the RDM method to obtain a damping estimation that characterizes the structure (Figure 6). The RDM analysis was applied to the first vibration frequency, easily detectable and clearly distinct from the other modes. The damping percentage values obtained are low, less than 1%, for both horizontal components. These damping values highlight the predominant influence of the dissipation mechanisms intrinsic to the material and the linear elastic response of the structure, linked to the fact that the analysis is carried out based on small stress, such as environmental seismic noise.
3.3. Experimental Testing of Torsional and Rocking Mode
Two additional synchronous samplings were performed at the highest bell tower floor to assess the propensity of the structure to undergo possible torsional effects (Figure 5a). The displacement spectra of horizontal components for lateral and central measurements were compared using OriginPro 9.0.0 (64-bit) software. Analyzing the graph in which the displacement values for the N–S and E–W components of the two measurements are plotted, it is evident that, at a frequency of 3.5 Hz, the two spectra do not follow the same trend (Figure 5b). In particular, at this frequency, a spectral peak is observed in the lateral measurement that disappears in the barycenter measurement. This suggests that the mode at a frequency of 3.5 Hz is a torsional mode.
The simplified equation of Grimaz et al. [36] was used to test the propensity of a building to undergo torsional effects. The Δ computed for the NS and EW components (Table 2) is equal to 14.05 and 10.53, respectively, highlighting the propensity of the investigated structure to undergo strong torsional effects according to the classification proposed by Grimaz et al. [36].
Table 2.
Torsional effects Δ obtained through the analysis and comparison of the spectral displacement from data recorded in the central and lateral portions of the tower top floor.
Given the highly deformable nature of the subsoil on which the Messina Bell Tower rests, to verify whether the tower was subject to rocking mode, two synchronous measurements were carried out at the base of the tower, located at two opposite ends of the base (Figure 5a). Having ascertained from the SSR spectra the presence of a spectral peak at a frequency of approximately 1.4 Hz, corresponding to the fundamental mode of the structure and visible on all three components (Figure 3b,c), the signals related to the vertical (Z) components of the synchronous measurements were filtered, using a bandwidth filter around the analyzed frequency. The filtering process unveiled that the temporal trends in the vertical components exhibit a phase difference of approximately 180° with equivalent amplitudes at the two opposite sides of the building base (Figure 5c). This phase difference indicated that the two points were moving in opposite directions, at the same instant, a characteristic signature of rocking motion, where the structure rocks around its base rather than sliding. This observed mode concurs with the expected dynamic behavior of structures coupled to deformable subsoil, where the base experiences opposite rotations at distinct locations. The experimental results substantiate the presence of a rocking motion analogous to the behavior observed in solid-to-solid interfaces: the tower’s base undergoes a balanced rotational oscillation around a central pivot, causing complementary vertical movements (one side rising while the opposite side lowers). Thus, the observed 180° phase shift combined with amplitude symmetry robustly supports the hypothesis that the spectral peak at approximately 1.4 Hz corresponds to the rocking mode.
While structural systems prone to pure rocking are typically very sensitive to even minor changes in the excitation characteristics, the present study was conducted under weak ambient seismic noise that can be approximated as stationary over the analysis period. Under these low-amplitude conditions, the system’s response can be effectively linearized, enabling us to identify a predominant dynamic behavior. The spectral peak corresponding to the rocking mode was derived from an average of multiple 20 s time window analyses, conducted over a total span of 20 min. This averaging process significantly reduces the influence of noise and transient effects, yielding a robust and stable frequency component, thereby justifying the association of the rocking mode with a specific frequency value.
4. Discussion
This study explored the dynamic response of the Messina Bell Tower through a simplified experimental approach based on passive seismic single-station surveys. The HV spectra from measurements outside the structure show a clear peak at approximately 1.06 Hz, indicating the site resonance frequency. The consistency of the peak frequency across different locations suggests minimal lateral variation in subsurface stratigraphy and that the sediments’ thickness remains almost constant throughout the area. The HVSR/MASW-derived 1D Vs profile indicates low shear wave velocities, consistent with local lithology. These techniques are particularly suited for rapid site assessments, post-disaster investigations, and early-stage engineering studies.
The site’s resonance frequency (1.06 Hz) and the structure’s fundamental vibration frequency (~1.4 Hz) are close, raising the possibility of soil–structure resonance phenomena in the event of a seismic event. Furthermore, structural degradation over time could lead to convergence between soil and structural frequencies.
Four vibration modes were identified through SSR analysis, including rocking and torsional modes, along with higher-order modes. Minimal frequency differences between NS and EW components were observed, reflecting slight directional stiffness variations.
The low damping percentage values obtained are characteristic of linear dissipative phenomena and service conditions of the structure and can be a useful basis for monitoring under ordinary operating conditions.
The results were compared with those from Cacciola et al. [25] (Table 3), who used long-term monitoring and finite element (FE) modeling to study the seismic response of Messina Bell Tower.
Table 3.
Comparison between experimental vibration frequencies obtained in this study with experimental and numerical natural frequencies reported by Cacciola et al. [25].
Although our approach is limited to a single experimental field survey, as revealed by comparing the results obtained with those reported in Cacciola et al. [25], the value of rapid surveys for preliminary structural assessments where long-term monitoring is unfeasible is demonstrated.
5. Conclusions
Overall, the results of this study underline the potential of simplified experimental dynamic characterizations as valuable tools for rapid structural assessments in scenarios where continuous monitoring is unfeasible.
Despite minor discrepancies (Table 3), particularly in higher modes, the results confirm that an expedited experimental dynamic characterization can yield comparable fundamental modal parameters to those obtained through long-term monitoring and numerical simulation. The slight variations observed can be attributed to differences in measurement conditions, data processing techniques, and the inherent limitations of a single measurement session compared to continuous monitoring.
Furthermore, while Cacciola et al. [25] validated their FE model using earthquake recordings, our study relies solely on ambient noise measurements. The absence of high-intensity dynamic excitations in our data collection means that the effects of nonlinear soil–structure interaction may be less pronounced. Nevertheless, the strong correlation between the identified vibration frequencies suggests that simplified measurement techniques can provide valuable structural insights, particularly for preliminary assessments or cases where long-term monitoring is not applicable.
This comparison highlights the strengths and limitations of the different methodologies. While continuous monitoring provides more comprehensive data over time, simplified experimental dynamic characterizations can serve as effective tools for rapid assessments, particularly in cases where prompt structural assessments are required. Future research should integrate rapid experimental surveys with numerical modeling to enhance structural evaluation.
Author Contributions
Conceptualization, S.G. and S.I.; methodology, S.G. and G.M.; validation, S.G., S.I. and G.M.; formal analysis, S.G.; investigation, S.G., S.I. and G.M.; data curation, S.G.; writing—original draft preparation, S.G.; writing—review and editing, S.G., S.I. and G.M.; visualization, S.G. and G.M.; supervision, S.G. and S.I. All authors have read and agreed to the published version of the manuscript.
Funding
This research received no external funding.
Institutional Review Board Statement
Not applicable.
Informed Consent Statement
Not applicable.
Data Availability Statement
The raw data supporting the conclusions of this article will be made available by the authors on request.
Acknowledgments
The authors wish to thank Mons. La Speme for allowing the surveys to be carried out.
Conflicts of Interest
The authors declare no conflicts of interest.
Abbreviations
The following abbreviations are used in this manuscript:
| HVSR | Horizontal-to-Vertical Spectral Ratio |
| MASW | Multichannel Analysis of Seismic Wave |
| RDM | Random Decrement Method |
| SSR | Standard Spectral Ratio |
| FFT | Fast Fourier Transform |
References
- Brincker, R.; Zhang, L.; Andersen, P. Modal identification from ambient responses using frequency domain decomposition. In Proceedings of the International Modal Analysis Conference (IMAC), San Antonio, TX, USA, 7–10 February 2000. [Google Scholar]
- Reynders, E. System identification methods for (operational) modal analysis: Review and comparison. Arch. Comput. Methods Eng. 2012, 19, 51–124. [Google Scholar] [CrossRef]
- Haindl, M.; Pantoja-Rosero, B.; Beyer, K.; Smith, I.F. Reducing uncertainties in response predictions of earthquake-damaged masonry buildings using data from image-based inspection. In Proceedings of the International Conference on Structural Analysis of Historical Constructions, Kyoto, Japan, 12–15 September 2023; pp. 835–848. [Google Scholar] [CrossRef]
- Nochebuena-Mora, E.; Mendes, N.; Lourenço, P.B.; Greco, F. Dynamic behavior of a masonry bell tower subjected to actions caused by bell swinging. Structures 2021, 34, 1798–1810. [Google Scholar] [CrossRef]
- Farrar, C.R.; Jauregui, D.A. Comparative study of damage identification algorithms applied to a bridge: I. Experiment. Smart Mater. Struct. 1998, 7, 704–719. [Google Scholar] [CrossRef]
- Peeters, B.; Maeck, J.; De Roeck, G. Vibration-based damage detection in civil engineering: Excitation sources and temperature effects. Smart Mater. Struct. 2001, 10, 518–527. [Google Scholar] [CrossRef]
- Carden, E.P.; Fanning, P. Vibration based condition monitoring: A review. Struct. Health Monit. 2004, 3, 355–377. [Google Scholar] [CrossRef]
- Tomić, I.; Vanin, F.; Beyer, K. Uncertainties in the seismic assessment of historical masonry buildings. Appl. Sci. 2021, 11, 2280. [Google Scholar] [CrossRef]
- Farrar, C.R.; Worden, K. Structural Health Monitoring: A Machine Learning Perspective; John Wiley & Sons: Hoboken, NJ, USA, 2012. [Google Scholar]
- Allemang, R.J. A correlation coefficient for modal vector analysis. In Proceedings of the 1st International Modal Analysis Conference (IMAC), Orlando, FL, USA, 8–10 November 1982. [Google Scholar]
- Ewins, D.J. Modal Testing: Theory, Practice and Application; John Wiley & Sons: Hoboken, NJ, USA, 2009. [Google Scholar]
- Tsiavos, A.; Sextos, A.; Stavridis, A.; Dietz, M.; Dihoru, L.; Alexander, N.A. Large-scale experimental investigation of a low-cost PVC ‘sand-wich’ (PVC-s) seismic isolation for developing countries. Earthq. Spectra 2020, 36, 1886–1911. [Google Scholar] [CrossRef]
- Brincker, R.; Ventura, C. Introduction to Operational Modal Analysis; John Wiley & Sons: Hoboken, NJ, USA, 2015. [Google Scholar]
- Peeters, B.; De Roeck, G. One-year monitoring of the Z24-Bridge: Environmental effects versus damage events. Earthq. Eng. Struct. Dyn. 2001, 30, 149–171. [Google Scholar] [CrossRef]
- Kareem, A.; Gurley, K. Damping in structures: Its evaluation and treatment of uncertainty. J. Wind. Eng. Ind. Aerodyn. 1996, 59, 131–157. [Google Scholar] [CrossRef]
- Castellaro, S.; Mulargia, F. How far from a building does the ground motion free field start? The cases of three famous towers and of a modern building. Bull. Seism. Soc. Am. 2010, 100, 2080–2094. [Google Scholar] [CrossRef]
- Castellaro, S. Soil and structure damping from single station measurements. Soil Dyn. Earthq. Eng. 2016, 90, 480–493. [Google Scholar] [CrossRef]
- Imposa, S.; Lombardo, G.; Panzera, F.; Grassi, S. Ambient Vibrations Measurements and 1D Site Response Modelling as a Tool for Soil and Building Properties Investigation. Geosciences 2018, 8, 87. [Google Scholar] [CrossRef]
- Grassi, S.; Imposa, S.; Patti, G.; Boso, D.; Lombardo, G.; Panzera, F. Geophysical surveys for the dynamic characterization of a cultural heritage building and its subsoil: The S. Michele Arcangelo Church (Acireale, eastern Sicily). J. Cult. Herit. 2019, 36, 72–84. [Google Scholar] [CrossRef]
- Grassi, S.; Barbano, M.S.; Pirrotta, C.; Morreale, G.; Imposa, S. Seismic Soil–Structure Interaction of Three Historical Buildings at the University of Catania (Sicily, Italy). Heritage 2022, 5, 3562–3587. [Google Scholar] [CrossRef]
- Imposa, S.; Cuomo, M.; Contrafatto, L.; Mineo, S.; Grassi, S.; Li Rosi, D.; Barbano, M.S.; Morreale, G.; Galasso, M.; Pappalardo, G. Engineering Geological and Geophysical Studies Supporting Finite Element Analysis of Historical Buildings after Dynamic Identification. Geosciences 2023, 13, 84. [Google Scholar] [CrossRef]
- Lentini, F.; Carbone, S.; Catalano, S. Messina (Provincia). Assessorato territorio. Servizio geologico. In Carta Geologica Della Provincia di Messina; S. El. Ca.: Firenze, Italia, 2000. [Google Scholar]
- Carbone, S.; Messina, A.; Lentini, F. Note Illustrative Della carta Geologica d’Italia Alla Scala 1: 50.000: Foglio 601; Dipartimento Difesa del Suolo, Servizio Geologico d’Italia; S. EL. CA.: Firenze, Italia, 2008; p. 170. [Google Scholar]
- Bard, P.Y.; Bouchon, M. The two-dimensional resonance of sediment-filled valleys. Bull. Seism. Soc. Am. 1985, 75, 519–541. [Google Scholar] [CrossRef]
- Cacciola, P.; Caliò, I.; Fiorini, N.; Occhipinti, G.; Spina, D.; Tombari, A. Seismic response of nonlinear soil-structure interaction systems through the Preisach formalism: The Messina Bell Tower case study. Bull. Earthq. Eng. 2022, 20, 3485–3514. [Google Scholar] [CrossRef]
- Park, C.B.; Miller, R.D.; Xia, J. Multichannel analysis of surface waves. Geophysics 1999, 64, 800–808. [Google Scholar] [CrossRef]
- Nakamura, Y. A method for dynamic characteristics estimation of subsurface using microtremor on the ground surface. Railw. Tech. Res. Inst. Q. Rep. 1989, 30, 25–33. [Google Scholar]
- SESAME. Guidelines for the Implementation of the H/V Spectral Ratio Technique on Ambient Vibrations. Measurements, Processing and Interpretation; WP12. Deliverable D23.12. 2005. Available online: http://sesame.geopsy.org/SES_Reports.htm (accessed on 3 November 2024).
- Di Giulio, G.; Cornou, C.; Ohrnberger, M.; Wathelet, M.; Rovelli, A. Deriving wavefield characteristics and shear-velocity profiles from two-dimensional small-aperture arrays analysis of ambient vibrations in a small-size alluvial basin, Colfiorito, Italy. Bull. Seism. Soc. Am. 2006, 96, 1915–1933. [Google Scholar] [CrossRef]
- Martorana, R.; Capizzi, P.; Avellone, G.; D’Alessandro, A.; Siragusa, R.; Luzio, D. Assessment of a geological model by surface wave analyses. J. Geophys. Eng. 2017, 14, 159–172. [Google Scholar] [CrossRef]
- Grassi, S.; Patti, G.; Tiralongo, P.; Imposa, S.; Aprile, D. Applied geophysics to support the cultural heritage safeguard: A quick and non-invasive method to evaluate the dynamic response of a great historical interest building. J. Appl. Geophys. 2021, 189, 104321. [Google Scholar] [CrossRef]
- Martorana, R.; Capizzi, P. Seismic and non-invasive geophysical surveys for the renovation project of Branciforte Palace in Palermo. Archaeol. Prospect. 2023, 30, 13–26. [Google Scholar] [CrossRef]
- Greś, S.; Döhler, M.; Dertimanis, V.; Chatzi, E. Sensor placement optimal for the precision of modal parameter estimation with subspace methods. J. Phys. Conf. Ser. 2024, 2647, 212009. [Google Scholar] [CrossRef]
- Castellaro, S.; Padrón, L.A.; Mulargia, F. The different response of apparently identical structures: A far-field lesson from the Mirandola 20th May 2012 earthquake. Bull. Earthq. Eng. 2014, 12, 2481–2493. [Google Scholar] [CrossRef]
- Ditommaso, R.; Vona, M.; Mucciarelli, M.; Masi, A. Identificazione dei modi rotazionali degli edifici mediante tecniche di misura di vibrazione ambientale. In Proceedings of the Atti del 27° Congresso Nazionale Gruppo Nazionale di Geofisica della Terra Solida, Trieste, Italia, 7–10 October 2008; ISBN 88-902101-3-3. [Google Scholar]
- Grimaz, S.; Barazza, F.; Malisan, P. Misure all’interno degli edifici. In A Cura di M. Mucciarelli, Tecniche Speditive per la Stima Dell’amplificazione Sismica e Della Dinamica Degli Edifici-Studi Teorici ed Applicazioni Professionali; Aracne: Rome, Italy, 2011; pp. 195–209. ISBN 978-88-548-4495-7. [Google Scholar]
- Code, P. Eurocode 8: Design of Structures for Earthquake Resistance—Part 1: General Rules, Seismic Actions and Rules for Buildings; EN 1998-1; European Committee for Standardization (CEN): Brussels, Belgium, 2005. [Google Scholar]
- Rohmer, O.; Santisi d’Avila, M.P.; Bertrand, E.; Regnier, J. Rocking motion analysis using structural identification tools. Geotechnics 2023, 3, 601–623. [Google Scholar] [CrossRef]
- Cole, H.A. On-Line Failure Detection and Damping Measurement of Aerospace Structures by Random Decrement Signatures (No. NASA-CR-2205); NASA: Washington, DC, USA, 1973. [Google Scholar]
- Dunand, F.; Bard, P.Y.; Chatelain, J.L.; Gueguen, P.; Vassail, T.; Farsi, M.N. Damping and frequency from randomec method applied to in-situ measurements of ambient vibrations: Evidence for effective soil structure interaction. In Proceedings of the 12th European Conference on Earthquake Engineering, London, UK, 9–13 September 2002; Paper No. 868. Elsevier Science Ltd.: Amsterdam, The Netherlands, 2002. [Google Scholar]
- Tamura, Y. Amplitude dependency of damping in buildings and critical tip drift ratio. Int. J. High-Rise Build. 2012, 1, 1–13. [Google Scholar] [CrossRef]
Disclaimer/Publisher’s Note: The statements, opinions and data contained in all publications are solely those of the individual author(s) and contributor(s) and not of MDPI and/or the editor(s). MDPI and/or the editor(s) disclaim responsibility for any injury to people or property resulting from any ideas, methods, instructions or products referred to in the content. |
© 2025 by the authors. Licensee MDPI, Basel, Switzerland. This article is an open access article distributed under the terms and conditions of the Creative Commons Attribution (CC BY) license (https://creativecommons.org/licenses/by/4.0/).