
Non-Linear Modeling of Immune System Activation and Lymph Flow Dynamics

 , ,
, , 
Abstract
1. Introduction
2. Materials and Models
2.1. The Lymphatic System
2.1.1. Lymph Node
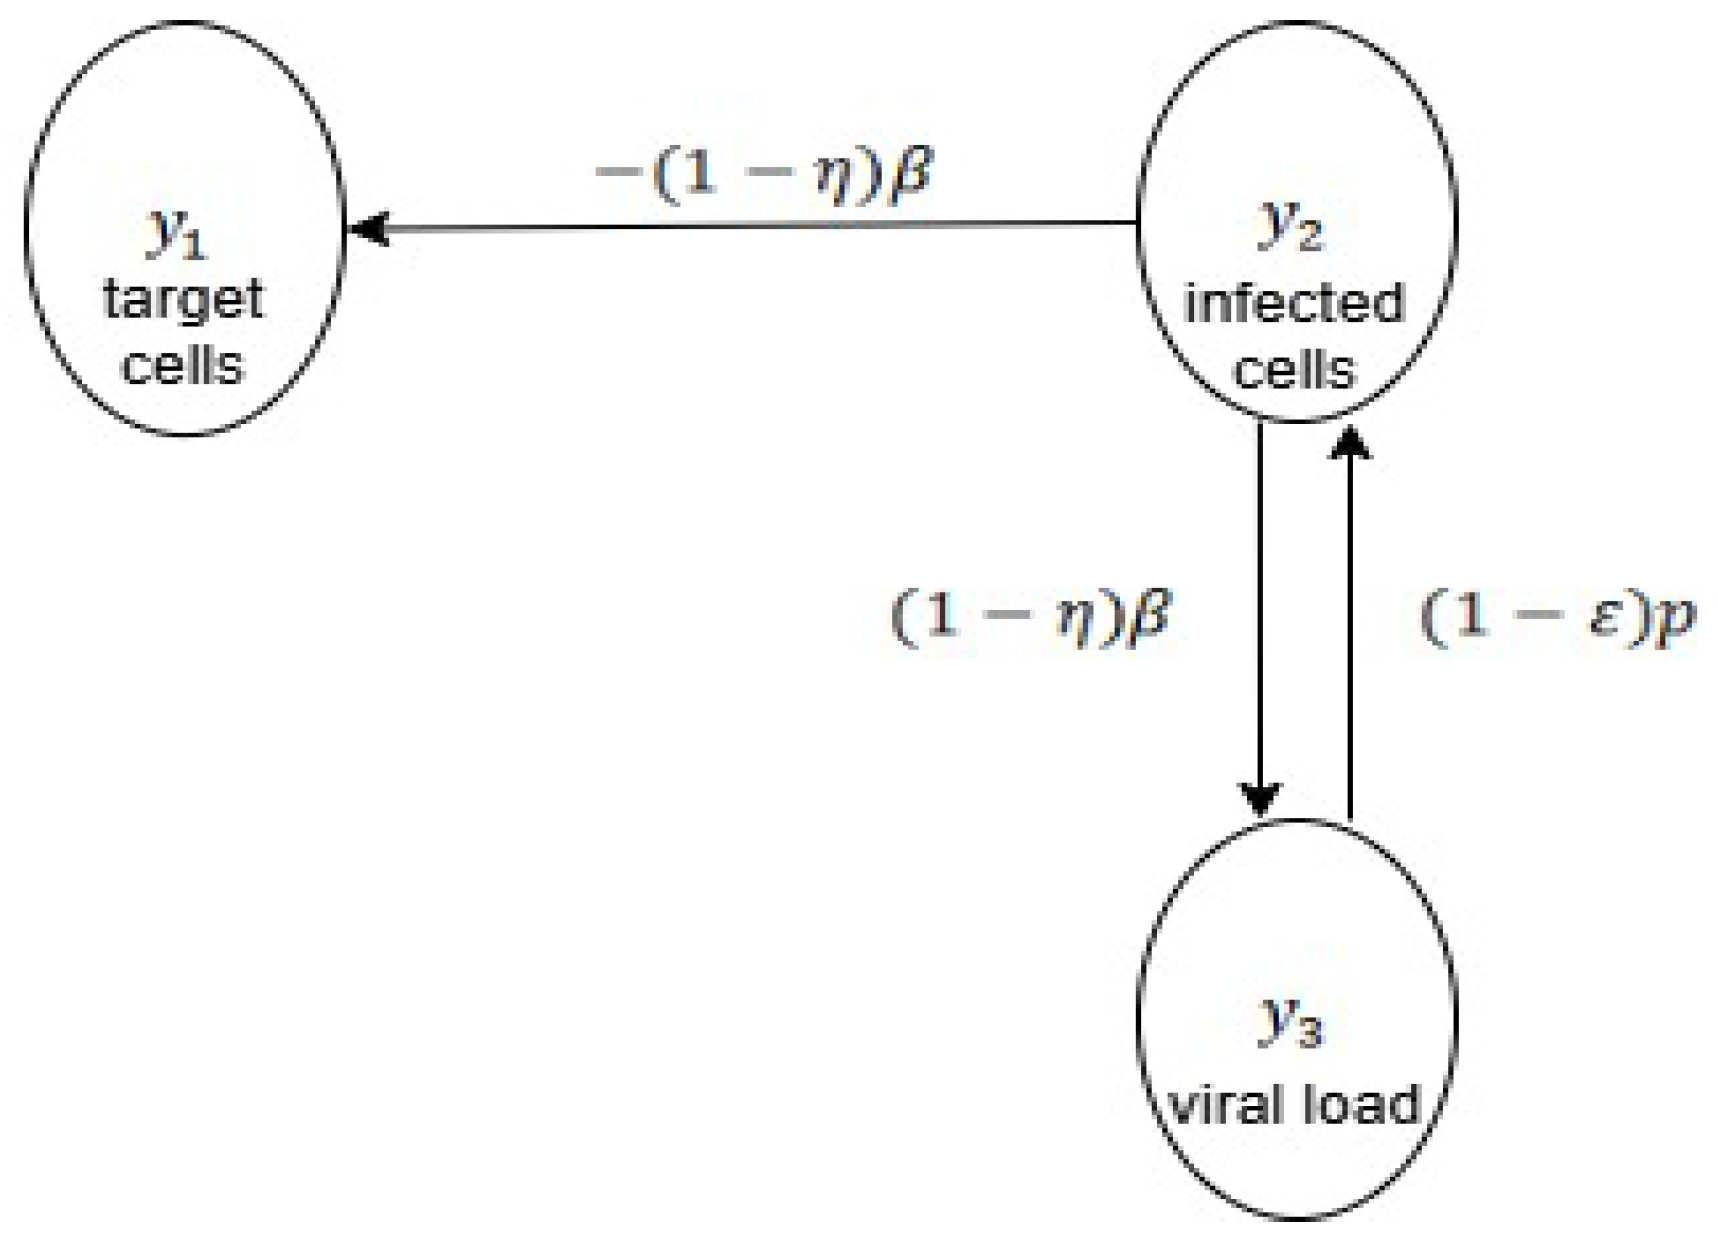
2.1.2. Virology
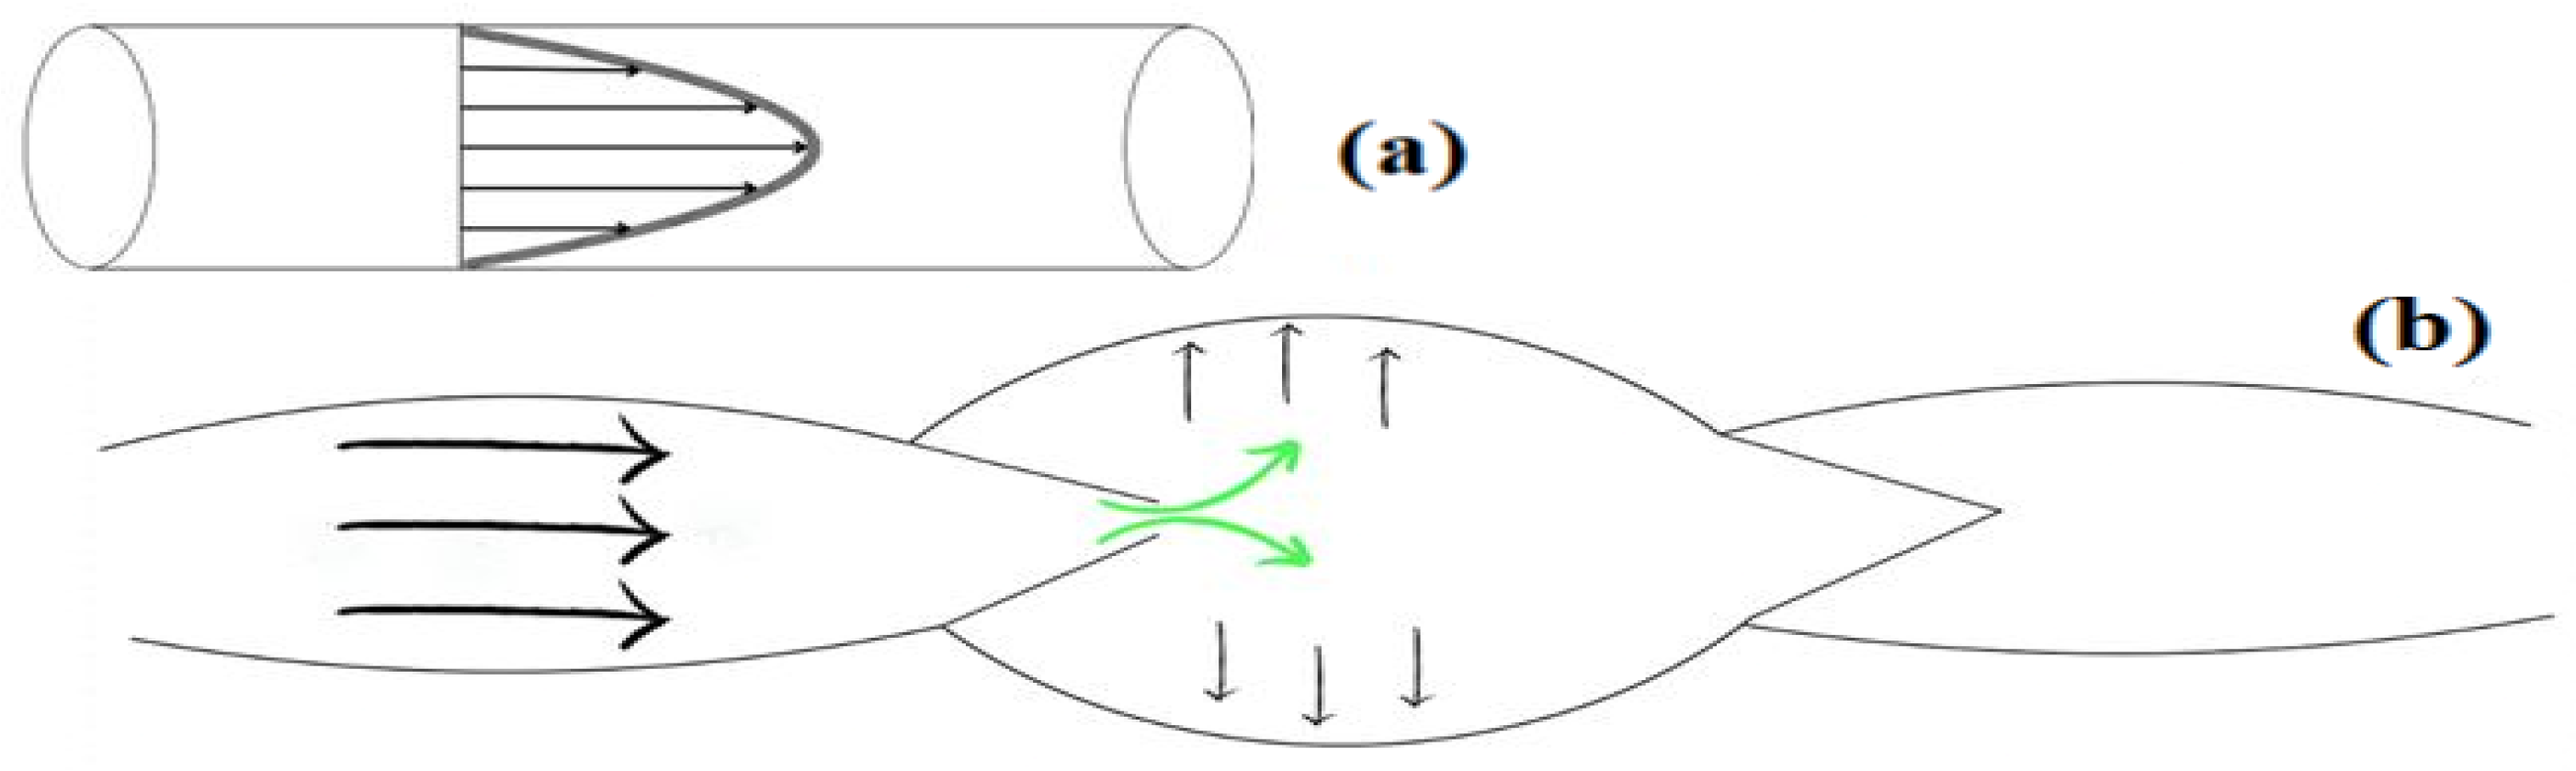
2.2. Lymph Flow
- Hagen–Poiseuille movement
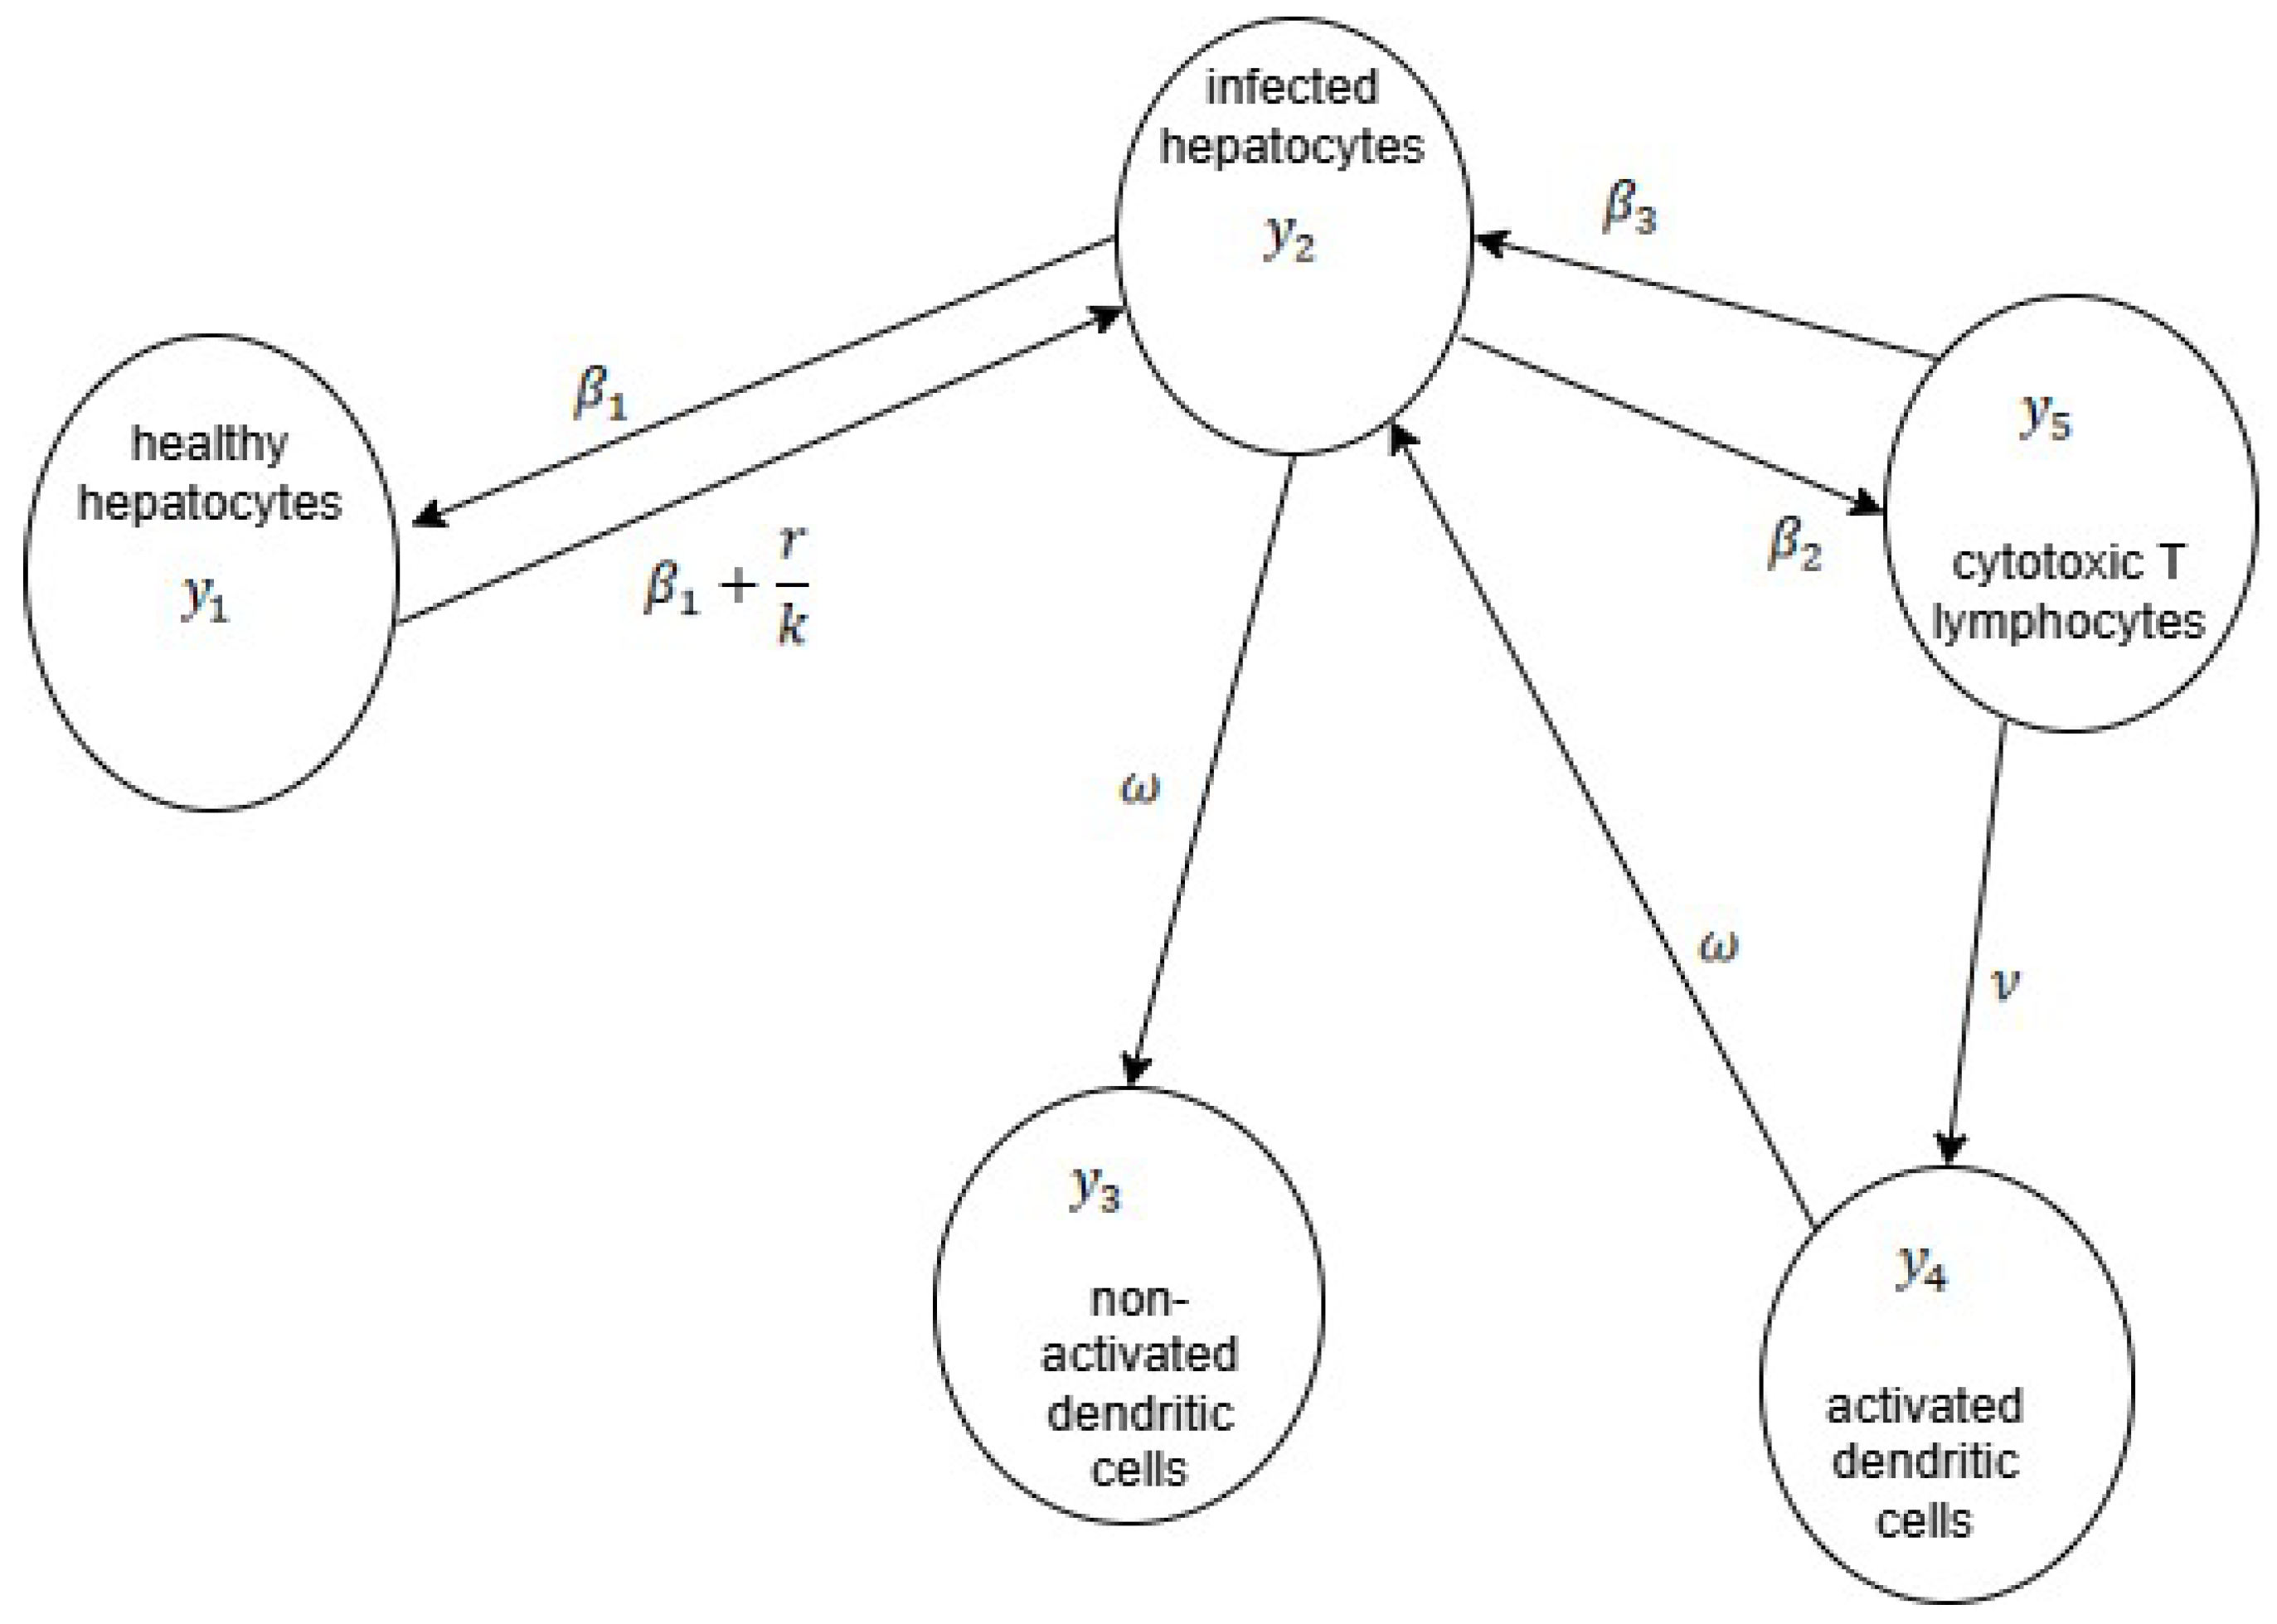
2.3. Associated Models
3. Main Study and Results
3.1. Parametric Analysis
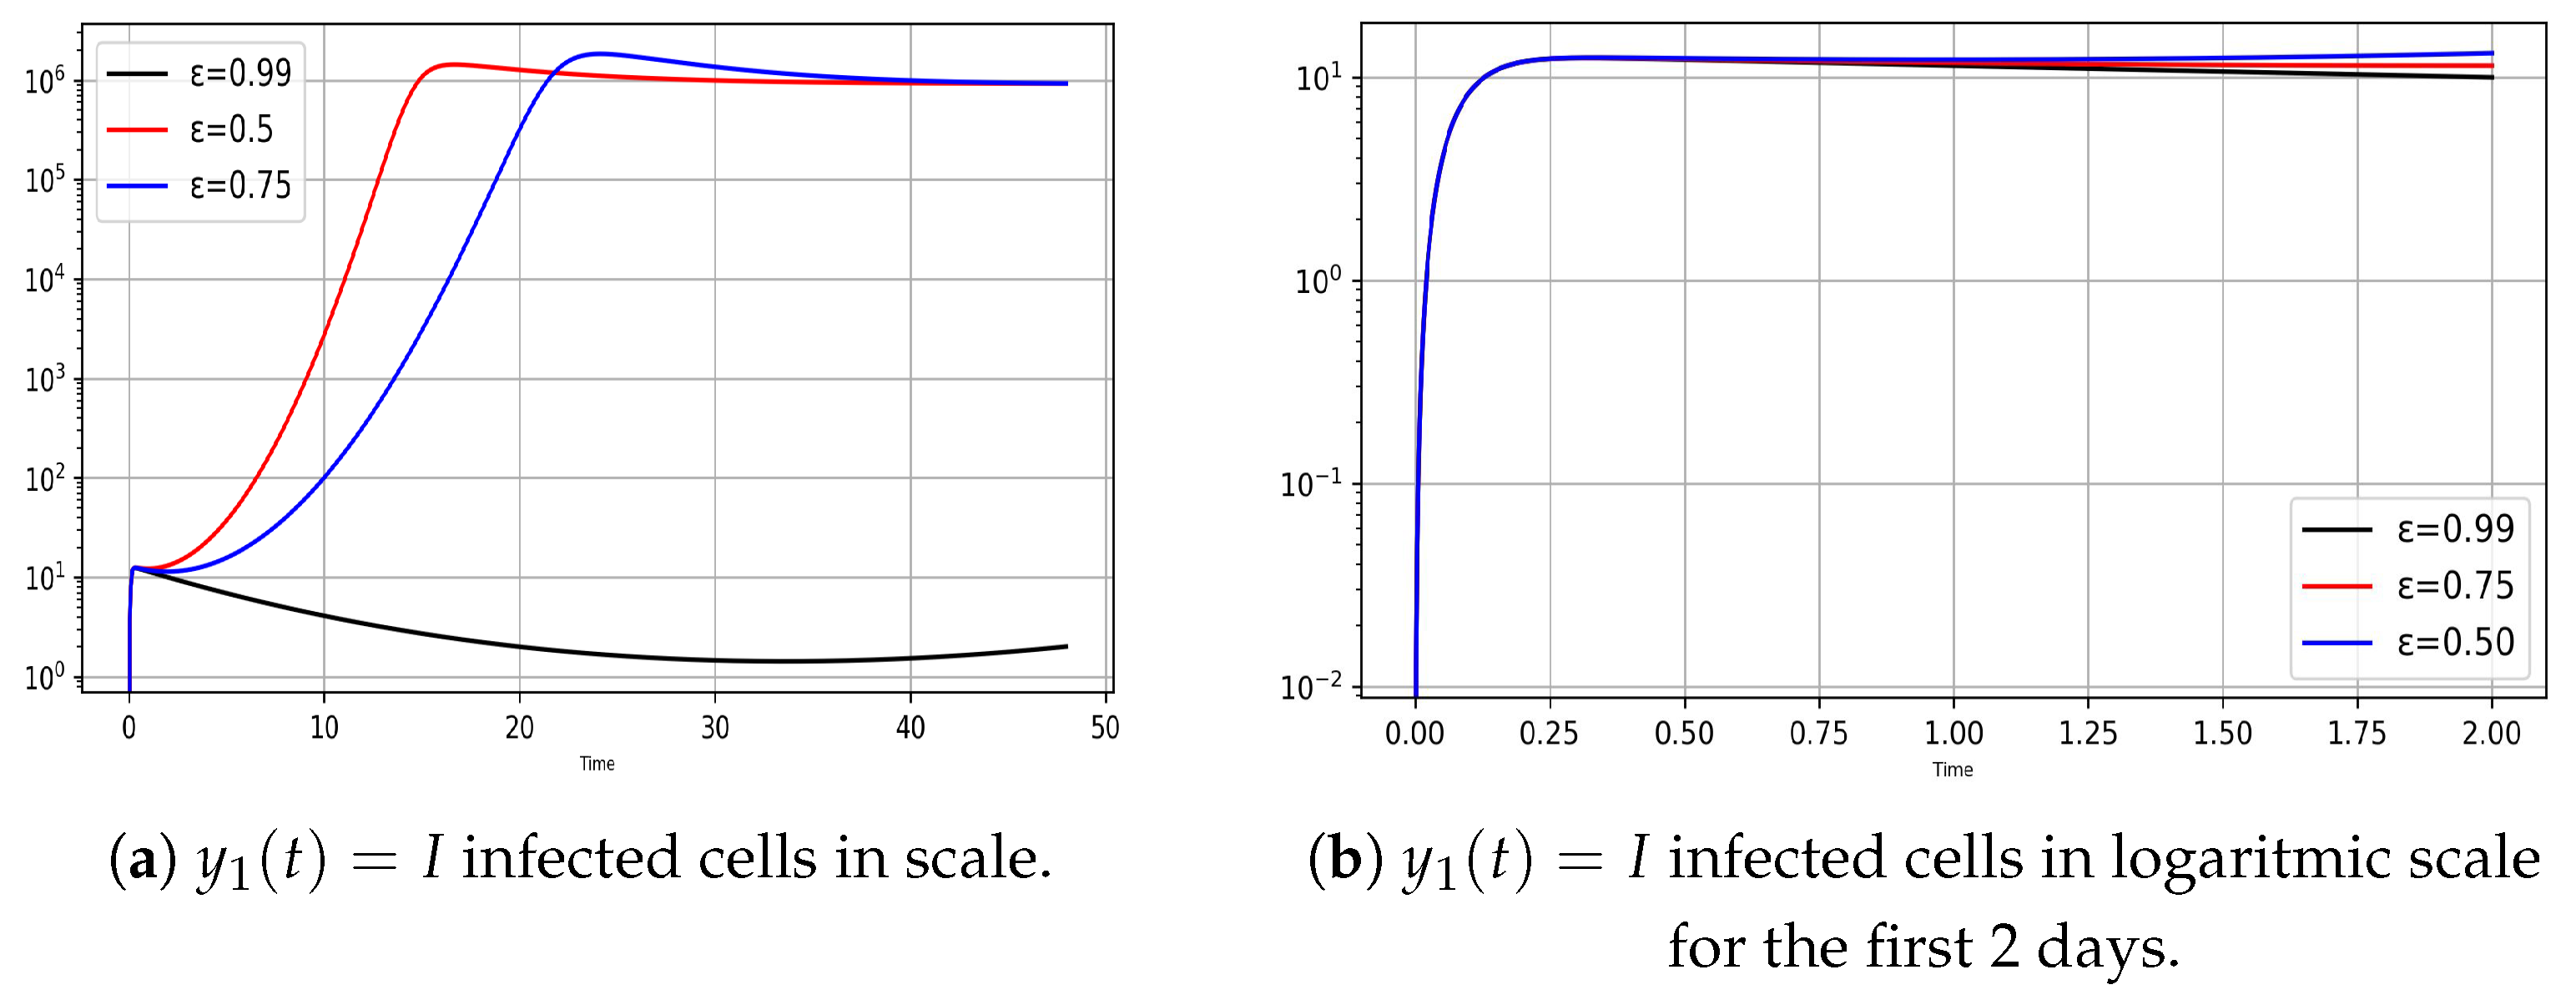
3.2. Analysis and Graph Interpretations
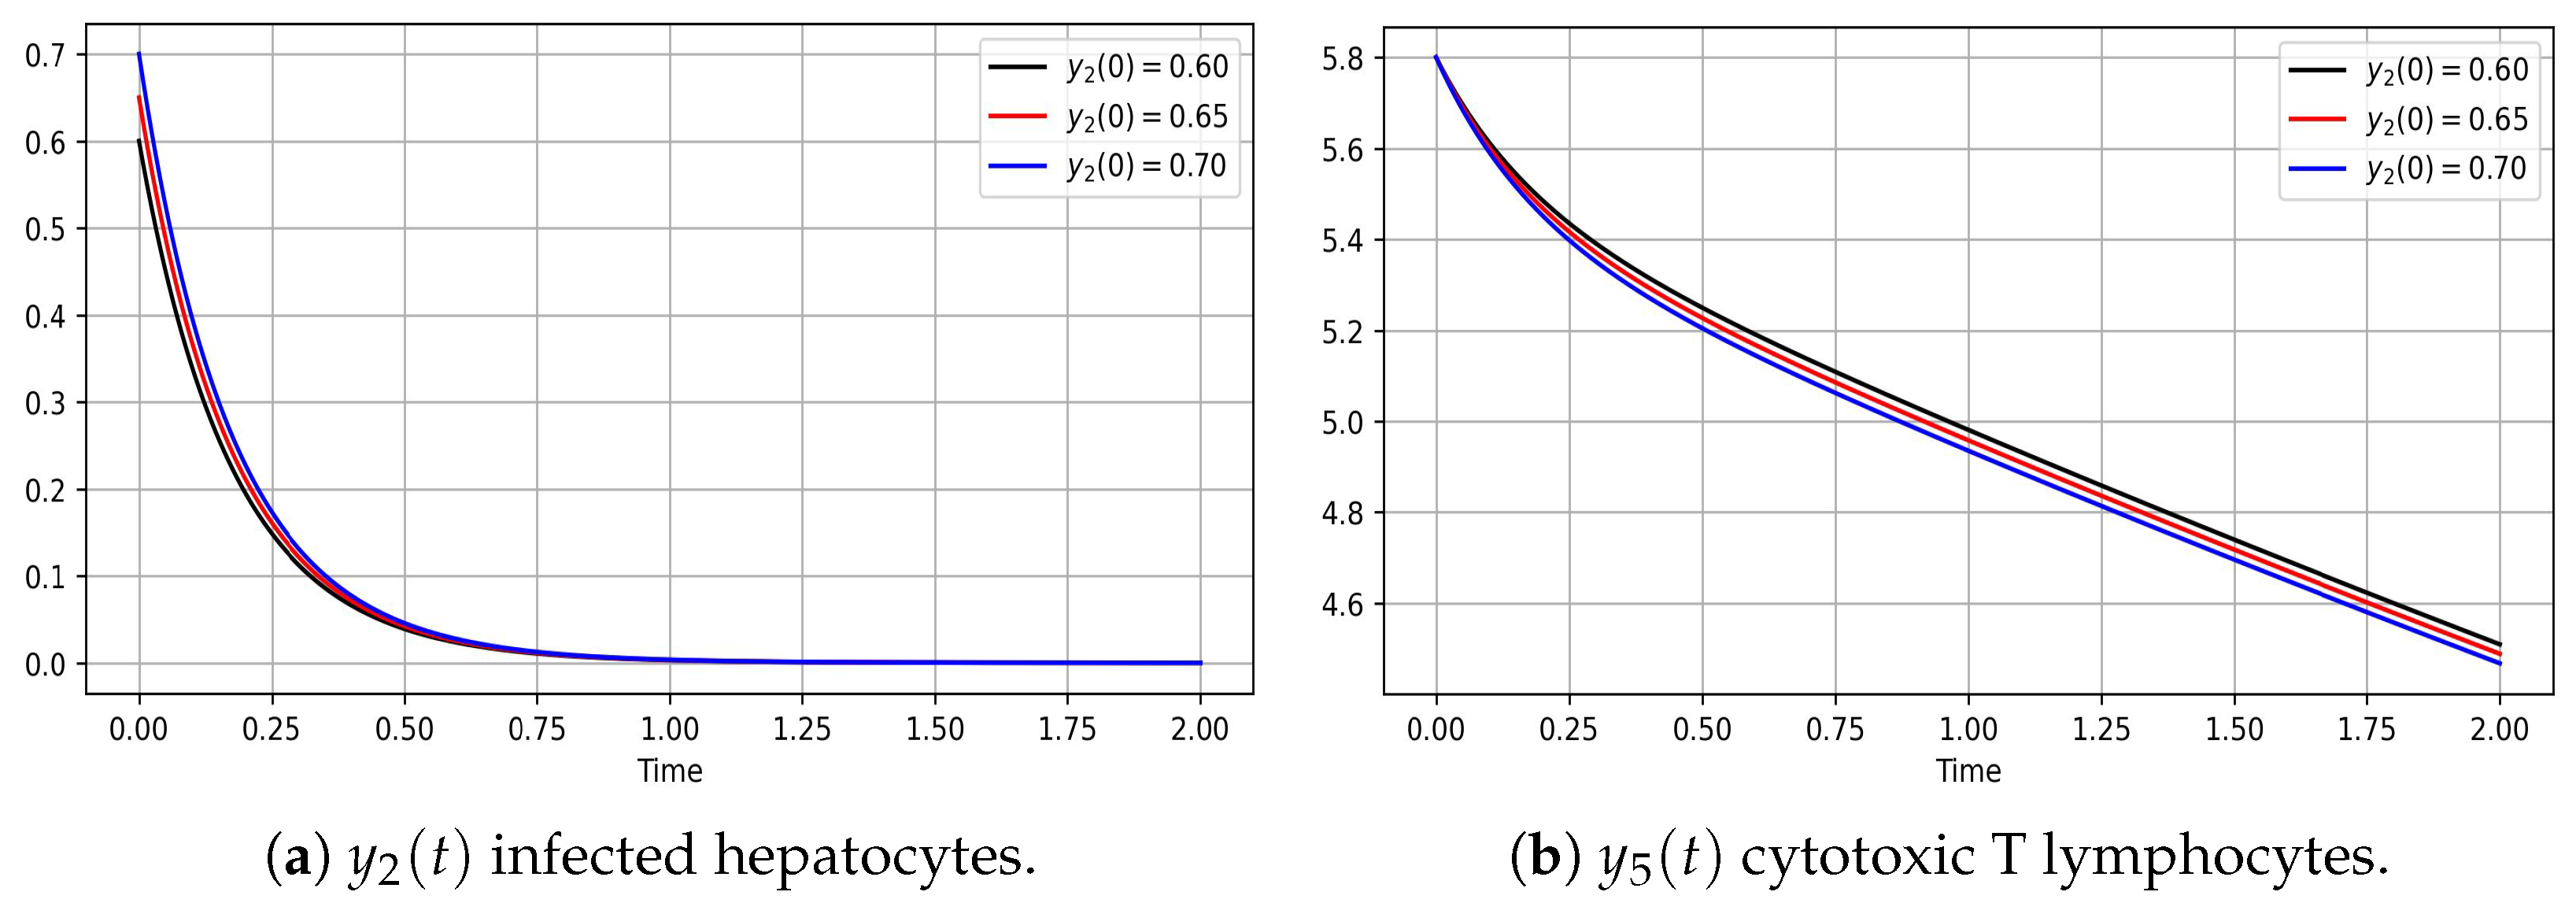
- Hepatits infection, model (8)
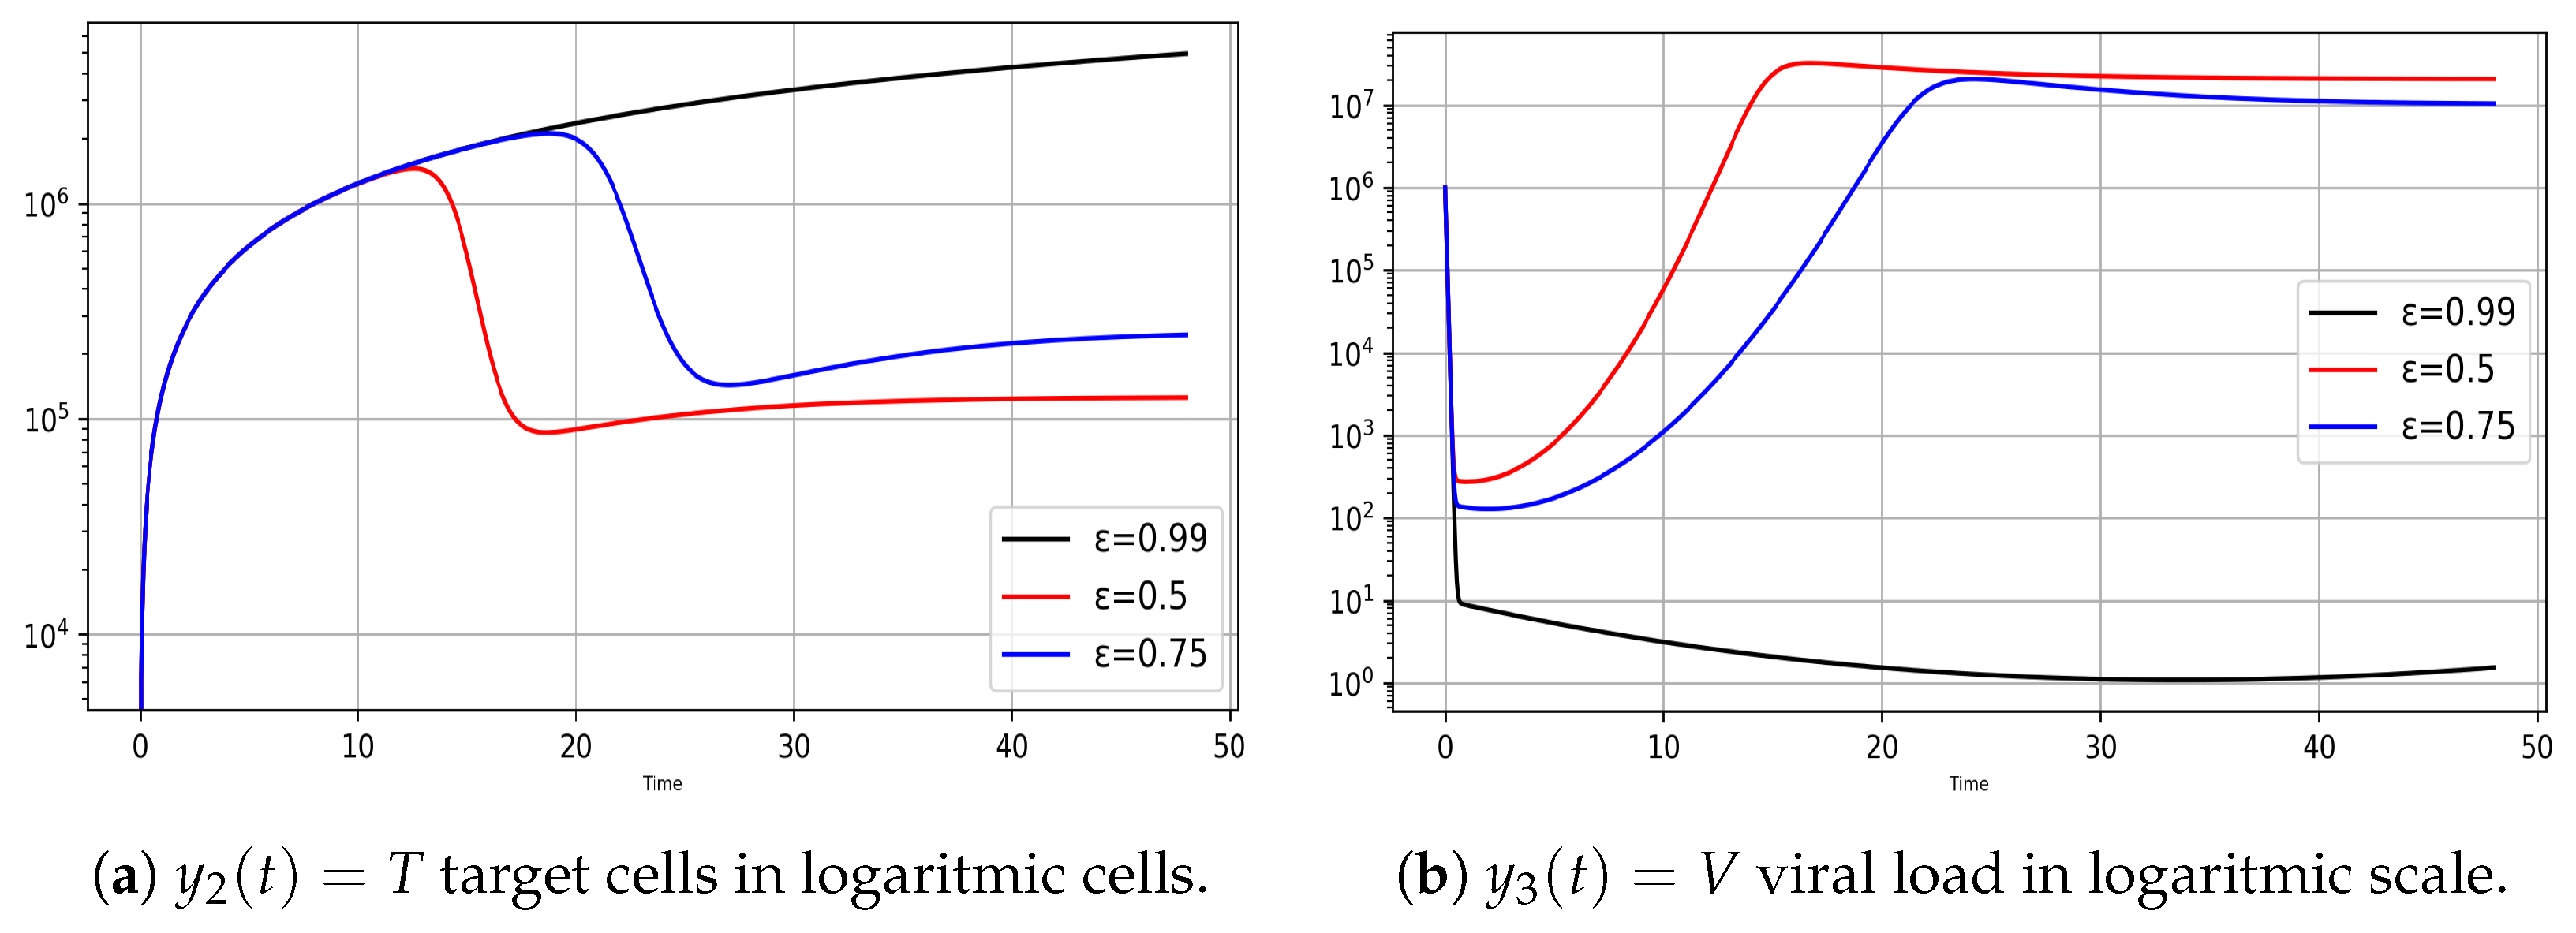
- Variation of infection rates for the model (8)
4. Conclusions
Author Contributions
Funding
Informed Consent Statement
Data Availability Statement
Conflicts of Interest
Appendix A
| = KL = carrying capacity of the liver | pfu/mL | |
| = Qs | 0.1 | mL |
| = QB | 0.3 | mL |
| = QL | 0.5 | mL |
| = C0 pDC | 0 | |
| = C0 m | 0 | |
| = MHV decay rate constant in medium | 0.155 | 1/h |
| = IFNa decay rate constant in medium | 0.012 | 1/h |
| = Gompertz death rate parameters for infected cells | 0.2 | 1/h |
| = Gompertz death rate parameters for infected cells m | 0.049 | 1/h |
| = d0C pDC | 0.0055 | |
| = d0C m | 0.0053 | |
| = virus transfer rate spleen to blood | 0.91 | 1/h |
| = virus transfer rate blood to spleen | 3.46 | 1/h |
| = virus transfer rate liver to blood | 0.61 | 1/h |
| = virus transfer blood to liver | 0.018 | 1/h |
| = virus elimination from blood | 1.22 | 1/h |
| = ifn production rate | 4.4 | |
| = ifn production rate m | 3.0 | |
| = virus production rate pDC | 1.7 | pfu/cell/h |
| = virus production rate m | 36.7 | pfu/cell/h |
| = infection rate of target cells pDC | 1.3 | cell/pfu/h |
| = infection rate of target cells m | 5.4 | cell/pfu/h |
| = threshold for 50% reduction of virus production rate by IFN pDC | 45.8 | pg/mL |
| = threshold for 50% reduction of virus production rate by IFN m | 0.09 | pg/mL |
| = IFN production delay pDC | 5.77 | h |
| = IFN production delay m | 5.8 | h |
| = virus production delay | 5.96 | h |
Appendix B
- Initialize Scientific Libraries:Import necessary libraries: Numpy, Scipy.integrate, and Matplotlib.pyplot.
- Define Functions for c1 and c2:Create functions for c1 and c2 that change dynamically over time.
- Initialize Arrays:Set up arrays to hold previous values for y2, y3, y22, y33, pDc, and Mphi.
- Define Parameters:Initialize the system parameters relevant to the ODE model.
- Set Initial Conditions:Impose the starting conditions for the variables involved in the ODE system.
- Model Functions and Delay Implementation:
- (a)
- Extract individual values from the input data.
- (b)
- Update c1 and c2 values depending on time-variable functions.
- (c)
- Introduce delay in the model:If time ≥ 18 h, update variables and parameters with specific values.
- Define Time Interval and Evaluation Points:
- (a)
- Set the time interval and points where the ODE system will be evaluated.
- Solve ODE System:Use the chosen solver to numerically integrate the ODE system.Input: The mathematical model, time interval, initial conditions, parameters, and evaluation points.
- Graphical Representation: Generate plots using Matplotlib to represent the system’s behavior over time. Output: Display graphs of the ODE system’s dynamics.
- end
| Aspect | Runge-Kutta Order 3 | Runge-Kutta Order 5 |
| Number of steps | 3 | 5 |
| Accuracy | Less accurate than order 5 | More accurate than order 3 |
| Computational cost | Lower than order 5 | Higher than order 3 |
| Stability | Moderately stable | Very stable |
| Implementation | Easy to implement | Complex to implement |
| Typical use cases | For moderate accuracy | For high accuracy |
Appendix C
References
- Choi, I.; Lee, S.; Hong, Y.K. The new era of the lymphatic system: No longer secondary to the blood vascular system. Cold Spring Harb. Perspect. Med. 2012, 2, a006445. [Google Scholar] [CrossRef] [PubMed]
- Favero, G.; Facchetti, L. Lymphatic System; IntechOpen: Rijeka, Croatia, 2024. [Google Scholar] [CrossRef]
- Bibliometrix. Available online: https://www.bibliometrix.org/home/ (accessed on 15 October 2024).
- Yaqoub, M.; Gao, Z.; Ye, X.; Al-Kassimi, K.; Chen, Z.; Haizhou, W. Three decades of glocalization research: A bibliometric analysis. Cogent. Soc. Sci. 2023, 9, 1–26. [Google Scholar] [CrossRef]
- WHO Global Hepatitis Report 2024, World Hepatitis Alliance. Available online: https://www.worldhepatitisalliance.org/wp-content/uploads/2024/07 (accessed on 10 January 2025).
- Sherman, I.L. Viral Hepatitis: Descriptive Epidemiology Based on Morbidity And Mortality Statistics. Ann. Intern. Med. 1956, 44, 1049. [Google Scholar] [CrossRef]
- Nguyen, M.H.; Wong, G.; Gane, E.; Kao, J.H.; Dusheiko, G. Hepatitis B Virus: Advances in Prevention, Diagnosis, and Therapy. Clin. Microbiol. Rev. 2020, 33, e00046-19. [Google Scholar] [CrossRef] [PubMed]
- Kiya, Y.; Yoshioka, Y.; Nagakawa, Y.; Ochiya, T. Extracellular Vesicles Are Important Mediators That Regulate Tumor Lymph Node Metastasis via the Immune System. Int. J. Mol. Sci. 2023, 24, 1362. [Google Scholar] [CrossRef]
- Wang, Q.; Yang, Y.; Chen, Z.; Li, B.; Niu, Y.; Li, X. Lymph Node-on-Chip Technology: Cutting-Edge Advances in Immune Microenvironment Simulation. Pharmaceutics 2024, 16, 666. [Google Scholar] [CrossRef]
- Swartz, M.A. The physiology of the lymphatic system. Adv. Drug Deliv. Rev. 2001, 50, 3–20. [Google Scholar] [CrossRef]
- Lodha, P.; Acari, A.; Rieck, J.; Hofmann, S.; Dieterich, L.C. The Lymphatic Vascular System in Extracellular Vesicle-Mediated Tumor Progression. Cancers 2024, 16, 4039. [Google Scholar] [CrossRef]
- Null, M.; Agarwal, M. Anatomy, Lymphatic System; StatPearls Publishing: Treasure Island, FL, USA, 2019. [Google Scholar]
- Mukherjee, A.; Hooks, J. Physiology: Lymph Flow. In Lymphedema: A Concise Compendium of Theory and Practice; Lee, B.B., Bergan, J., Rockson, S.G., Eds.; Springer International Publishing: Cham, Switzerland, 2018; pp. 91–111. [Google Scholar] [CrossRef]
- Bui, T.M.; Wiesolek, H.L.; Sumagin, R. ICAM-1: A master regulator of cellular responses in inflammation, injury resolution, and tumorigenesis. J. Leukoc. Biol. 2020, 108, 787–799. [Google Scholar] [CrossRef]
- Shimizu, Y.; Che, Y.; Murohara, T. Therapeutic Lymphangiogenesis Is a Promising Strategy for Secondary Lymphedema. Int. J. Mol. Sci. 2023, 24, 7774. [Google Scholar] [CrossRef]
- Atlas. Atlas 3D Catfish Animation Studio SRL—Version 4.1.0. Available online: https://play.google.com/store/apps/details?id=com.catfishanimationstudio.MuscularSystemLite&hl=en (accessed on 8 March 2024).
- Shou, Y.; Johnson, S.; Quek, Y.J.; Li, X.; Tay, A. Integrative lymph node-mimicking models created with biomaterials and computational tools to study the immune system. Mater. Today Bio 2022, 14, 100269. [Google Scholar] [CrossRef] [PubMed]
- Ali, S.; Mann-Nüttel, R.; Schulze, A.; Richter, L.; Alferink, J.; Scheu, S. Sources of Type I Interferons in Infectious Immunity: Plasmacytoid Dendritic Cells Not Always in the Driver’s Seat. Front. Immunol. 2019, 10, 778. [Google Scholar] [CrossRef]
- Rahbar, E.; Moore, J.E., Jr. A model of a radially expanding and contracting lymphangion. J. Biomech. 2011, 44, 1001–1007. [Google Scholar] [CrossRef] [PubMed]
- Pozrikidis, C. Fluid Dynamics; Springer: New York, NY, USA, 2017. [Google Scholar] [CrossRef]
- Mozokhina, A.; Savinkov, R. Mathematical Modelling of the Structure and Function of the Lymphatic System. Mathematics 2020, 8, 1467. [Google Scholar] [CrossRef]
- Grebennikov, D.; Savinkov, R.; Zelenova, E.; Lobov, G.; Bocharov, G. Network Modeling of Murine Lymphatic System. Algorithms 2023, 16, 168. [Google Scholar] [CrossRef]
- Zaleska, M.; Olszewski, W.L.; Durlik, M.; Miller, N.E. Signaling proteins are represented in tissue fluid/lymph from soft tissues of normal human legs at concentrations different from serum. Lymphat. Res. Biol. 2013, 11, 203–210. [Google Scholar] [CrossRef]
- Scallan, J.; Huxley, V.H.; Korthuis, R.J. Capillary Fluid Exchange: Regulation, Functions, and Pathology. In The Lymphatic Vasculature; Morgan and Claypool Life Sciences: San Rafael, CA, USA, 2010; Chapter 3. [Google Scholar]
- Neumann, A.U.; Lam, N.P.; Dahari, H.; Gretch, D.R.; Wiley, T.E.; Layden, T.J.; Perelson, A.S. Hepatitis C Viral Dynamics In Vivo and the Antiviral Efficacy of Interferon-α Therapy. Science 1998, 282, 103–107. [Google Scholar] [CrossRef]
- Saad, K.M.; Gómez-Aguilar, J.F.; Almadiy, A.A. A fractional numerical study on a chronic hepatitis C virus infection model with immune response. Chaos Solitons Fractals 2020, 139, 110062. [Google Scholar] [CrossRef]
- Bocharov, G.; Danilov, A.; Vassilevski, Y.; Marchuk, G.I.; Chereshnev, V.A.; Ludewig, B. Reaction-Diffusion Modelling of Interferon Distribution inSecondary Lymphoid Organs. Math. Model. Nat. Phenom. 2011, 6, 13–26. [Google Scholar] [CrossRef]
- Dhar, M.; Samaddar, S.; Bhattacharya, P. Modeling the cell-to-cell transmission dynamics of viral infection under the exposure of non-cytolytic cure. J. Appl. Math. Comput. 2021, 65, 885–911. [Google Scholar] [CrossRef]
- Yang, Z.; Kong, B.; Mosser, D.M.; Zhang, X. TLRs, macrophages, and NK cells: Our understandings of their functions in uterus and ovary. Int. Immunopharmacol. 2011, 11, 1442–1450. [Google Scholar] [CrossRef] [PubMed]
- Laskin, D.L.; Weinberger, B.; Laskin, J.D. Functional heterogeneity in liver and lung macrophages. J. Leukoc. Biol. 2001, 70, 163–170. [Google Scholar] [CrossRef] [PubMed]
- Reizis, B. Plasmacytoid Dendritic Cells: Development, Regulation, and Function. Immunity 2019, 50, 37–50. [Google Scholar] [CrossRef] [PubMed]
- Mogensen, S.C. Role of macrophages in natural resistance to virus infections. Microbiol. Rev. 1979, 43, 1–26. [Google Scholar] [CrossRef]


Disclaimer/Publisher’s Note: The statements, opinions and data contained in all publications are solely those of the individual author(s) and contributor(s) and not of MDPI and/or the editor(s). MDPI and/or the editor(s) disclaim responsibility for any injury to people or property resulting from any ideas, methods, instructions or products referred to in the content. |
© 2025 by the authors. Licensee MDPI, Basel, Switzerland. This article is an open access article distributed under the terms and conditions of the Creative Commons Attribution (CC BY) license (https://creativecommons.org/licenses/by/4.0/).
Share and Cite
Petrescu, Ş.C.; Cipu, R.I.; Maria-Fulaşu, A.C.; Cipu, E.C. Non-Linear Modeling of Immune System Activation and Lymph Flow Dynamics. Appl. Sci. 2025, 15, 4972. https://doi.org/10.3390/app15094972
Petrescu ŞC, Cipu RI, Maria-Fulaşu AC, Cipu EC. Non-Linear Modeling of Immune System Activation and Lymph Flow Dynamics. Applied Sciences. 2025; 15(9):4972. https://doi.org/10.3390/app15094972
Chicago/Turabian StylePetrescu, Ştefan Cǎtǎlin, Ruxandra Ioana Cipu, Andra Cristiana Maria-Fulaşu, and Elena Corina Cipu. 2025. "Non-Linear Modeling of Immune System Activation and Lymph Flow Dynamics" Applied Sciences 15, no. 9: 4972. https://doi.org/10.3390/app15094972
APA StylePetrescu, Ş. C., Cipu, R. I., Maria-Fulaşu, A. C., & Cipu, E. C. (2025). Non-Linear Modeling of Immune System Activation and Lymph Flow Dynamics. Applied Sciences, 15(9), 4972. https://doi.org/10.3390/app15094972