1. Introduction
Sprinting is a fundamental component of many sports, including track and field, soccer, rugby, and American football, where explosive acceleration and maximal velocity running play a decisive role in performance outcomes. Sprinting performance arises from the dynamic interaction between neuromuscular activation, movement biomechanics, and fatigue response. While each of these elements—electromyographic (EMG) muscle activity, kinematic and kinetic variables, and fatigue-induced adaptations—has been extensively studied, their interdependence is less often explored in a unified framework. Understanding how muscle recruitment patterns change with sprint velocity, how biomechanics adapt to meet performance demands, and how fatigue alters these processes is essential for optimizing sprinting outcomes and minimizing injury risk. This meta-analysis addresses this gap by synthesizing findings across these three interconnected domains to provide an integrated perspective on sprint performance. Success in sprinting is largely determined by neuromuscular coordination, biomechanical efficiency, and the ability to generate rapid and high levels of force while maintaining optimal stride mechanics [
1,
2,
3,
4]. Sprinting speed is influenced by both kinematic (stride length and frequency) and kinetic (force production, ground reaction forces) factors, which must be optimized to achieve maximal acceleration and top velocity [
4,
5]. Given the complex interplay between muscle activation patterns and sprint mechanics, understanding the specific neuromuscular demands across different sprint phases is crucial for improving performance and reducing injury risk [
6].
The activation of key lower limb muscles, particularly the hamstrings (biceps femoris, semitendinosus), gluteus maximus, rectus femoris, and gastrocnemius, plays a crucial role in force application and sprint propulsion. Hamstring activation is most prominent in the late swing phase, where it helps decelerate the swinging limb and prepare for ground contact [
3,
6,
7,
8]. Meanwhile, the gluteus maximus exhibits peak activation during early stance, assisting in hip extension and force transmission during the propulsive phase [
2,
9,
10,
11].
Furthermore, electromyographic (EMG) studies have demonstrated that muscle activation patterns vary depending on sprint velocity. As running speed increases, hamstring and gluteal activation levels rise significantly, reflecting their increasing contribution to horizontal force generation [
8,
12]. Additionally, the gastrocnemius and rectus femoris play key roles in vertical force generation, contributing to stabilization and energy return during ground contact [
13,
14,
15]. Understanding these phase-specific muscle recruitment patterns is essential for developing targeted strength and conditioning programs that enhance sprinting ability while mitigating injury risk [
15,
16].
Biomechanical adaptations to increased sprinting velocity involve modifications in stride length, stride frequency, and force production. Research indicates that stride length increases by 15–20% from submaximal to maximal sprinting, while stride frequency exhibits moderate changes, primarily due to enhanced swing phase mechanics [
6,
7]. These kinematic modifications allow elite sprinters to optimize ground contact efficiency, reducing braking forces and maximizing propulsive output [
1].
Additionally, kinetic studies show that ground reaction forces (GRF) increase with velocity, with sprinters applying greater horizontal forces during acceleration and transitioning to higher vertical forces at top speed [
4,
5,
14,
15]. This transition highlights the importance of training strategies that emphasize both maximal force production and rapid limb movement to optimize sprint efficiency [
9]. Moreover, a strong correlation exists between hip extensor strength and sprinting velocity, emphasizing the need for targeted gluteal and hamstring strengthening exercises [
17].
Fatigue-induced changes in neuromuscular coordination have been widely studied due to their impact on sprint efficiency and injury risk. As neuromuscular fatigue develops, athletes experience earlier hamstring activation during the swing phase, likely as a protective mechanism against muscle strain [
18]. Additionally, fatigue-related decreases in hip and knee flexion lead to increased ground contact time and compromised sprint mechanics, which can ultimately impair performance [
19,
20].
Studies have also shown that fatigue reduces the ability to generate maximal horizontal forces, which is critical for maintaining sprint velocity. This underscores the importance of neuromuscular endurance training to delay fatigue-induced inefficiencies and enhance resilience against performance decrements [
9]. Furthermore, eccentric strength training interventions, such as Nordic hamstring curls and hip thrusts, have been shown to improve fatigue resistance in the hamstrings, potentially lowering the risk of sprint-related injuries [
20].
Given the complexity of sprinting performance, this review is guided by the following research question: How do sprint speed and fatigue influence neuromuscular activation patterns and biomechanical characteristics during sprinting? This central question reflects the need to integrate three commonly studied but often separately analyzed components: EMG activity, kinematic adaptations, and fatigue-related changes. These dimensions interact in real-world sprinting contexts—muscle activation affects force production and joint kinematics, while fatigue alters both muscle coordination and biomechanical efficiency. Examining them jointly enables a deeper understanding of sprinting mechanics and provides actionable insights for performance optimization and injury prevention. Based on this rationale, the objective of this meta-analysis was to provide a comprehensive synthesis of findings on EMG activity, kinematic adaptations, and fatigue-induced changes across different sprinting phases and velocities. Given the importance of muscle activation patterns, biomechanical adaptations, and fatigue responses in sprinting performance, a systematic meta-analysis is warranted to synthesize current research findings. The objective of this was to provide a comprehensive analysis of EMG activity, kinematic adaptations, and fatigue-induced changes across different sprinting phases and velocities. By consolidating these findings, this meta-analysis will offer evidence-based insights to sprint training methodologies and injury prevention strategies in elite and sub-elite athletes.
2. Materials and Methods
2.1. Study Selection Criteria
The meta-analysis included studies that met the following criteria:
Population—healthy adult athletes (including sprinters, team sport players, and trained runners engaged in sprinting-based activities).
Intervention/Measurement—studies examining electromyographic (EMG) muscle activity and biomechanical variables during sprinting.
Comparison—differences in muscle activation patterns and biomechanics across different sprinting phases or speeds. Studies that investigated variations due to terrain (track vs. treadmill), footwear, or sprint training interventions were also considered if relevant biomechanical or neuromuscular outcomes were reported.
2.2. Outcome Measures
Electromyographic (EMG) activity of key lower limb muscles, including biceps femoris, semitendinosus, gluteus maximus, rectus femoris, and gastrocnemius.
Kinematic and kinetic variables, such as joint angles (hip, knee, ankle flexion/extension during stance and swing phases), ground reaction forces (GRF), propulsion and braking forces, step length, stride frequency, and ground contact time.
Changes in muscle recruitment patterns under fatigue conditions or in response to sprint-specific training adaptations.
2.3. Search Strategy
This review was conducted in accordance with the Preferred Reporting Items for Systematic Reviews and Meta-Analyses (PRISMA) guidelines, specifically following the updated version published in 2020. PRISMA provides a standardized reporting framework to enhance transparency, reproducibility, and methodological quality in systematic reviews and meta-analyses. The 2020 update includes expanded items to better reflect advances in review methodology, such as structured database searching, reporting of inclusion/exclusion criteria, and flow diagram standards. In the context of this meta-analysis, adherence to PRISMA 2020 ensured rigorous selection, appraisal, and synthesis of included studies. Compared to the original 2009 version, the PRISMA 2020 guidelines introduce updated and expanded reporting items that better align with contemporary systematic review practices. These include more detailed requirements for reporting search strategies, eligibility criteria, data extraction procedures, and methods for handling missing data or assessing bias. The updated flow diagram format also enhances transparency in study selection. By adhering to PRISMA 2020, this review ensures alignment with current standards of methodological rigor and reproducibility in meta-analytic research.
This systematic review and meta-analysis adhered to the Preferred Reporting Items for Systematic Reviews and Meta-Analyses PRISMA and PRISMA 2020 guidelines. A systematic literature search was performed in PubMed, Scopus, Web of Science, and SportDiscus. Keywords included: sprinting biomechanics, muscle activity, electromyography, sprint running, kinematics, kinetics. Search terms were combined using Boolean operators (AND, OR) to refine the query and ensure comprehensive retrieval of relevant studies.
Two independent reviewers (both co-authors of this manuscript) screened titles and abstracts for relevance, followed by full-text evaluation. Any disagreements were resolved through discussion and consensus, or by consulting a third and fourth co-author. Studies were included based on methodological rigor, sample size, and data reporting quality. Any discrepancies were resolved through discussion or consultation with a third reviewer.
2.4. Study Selection Process
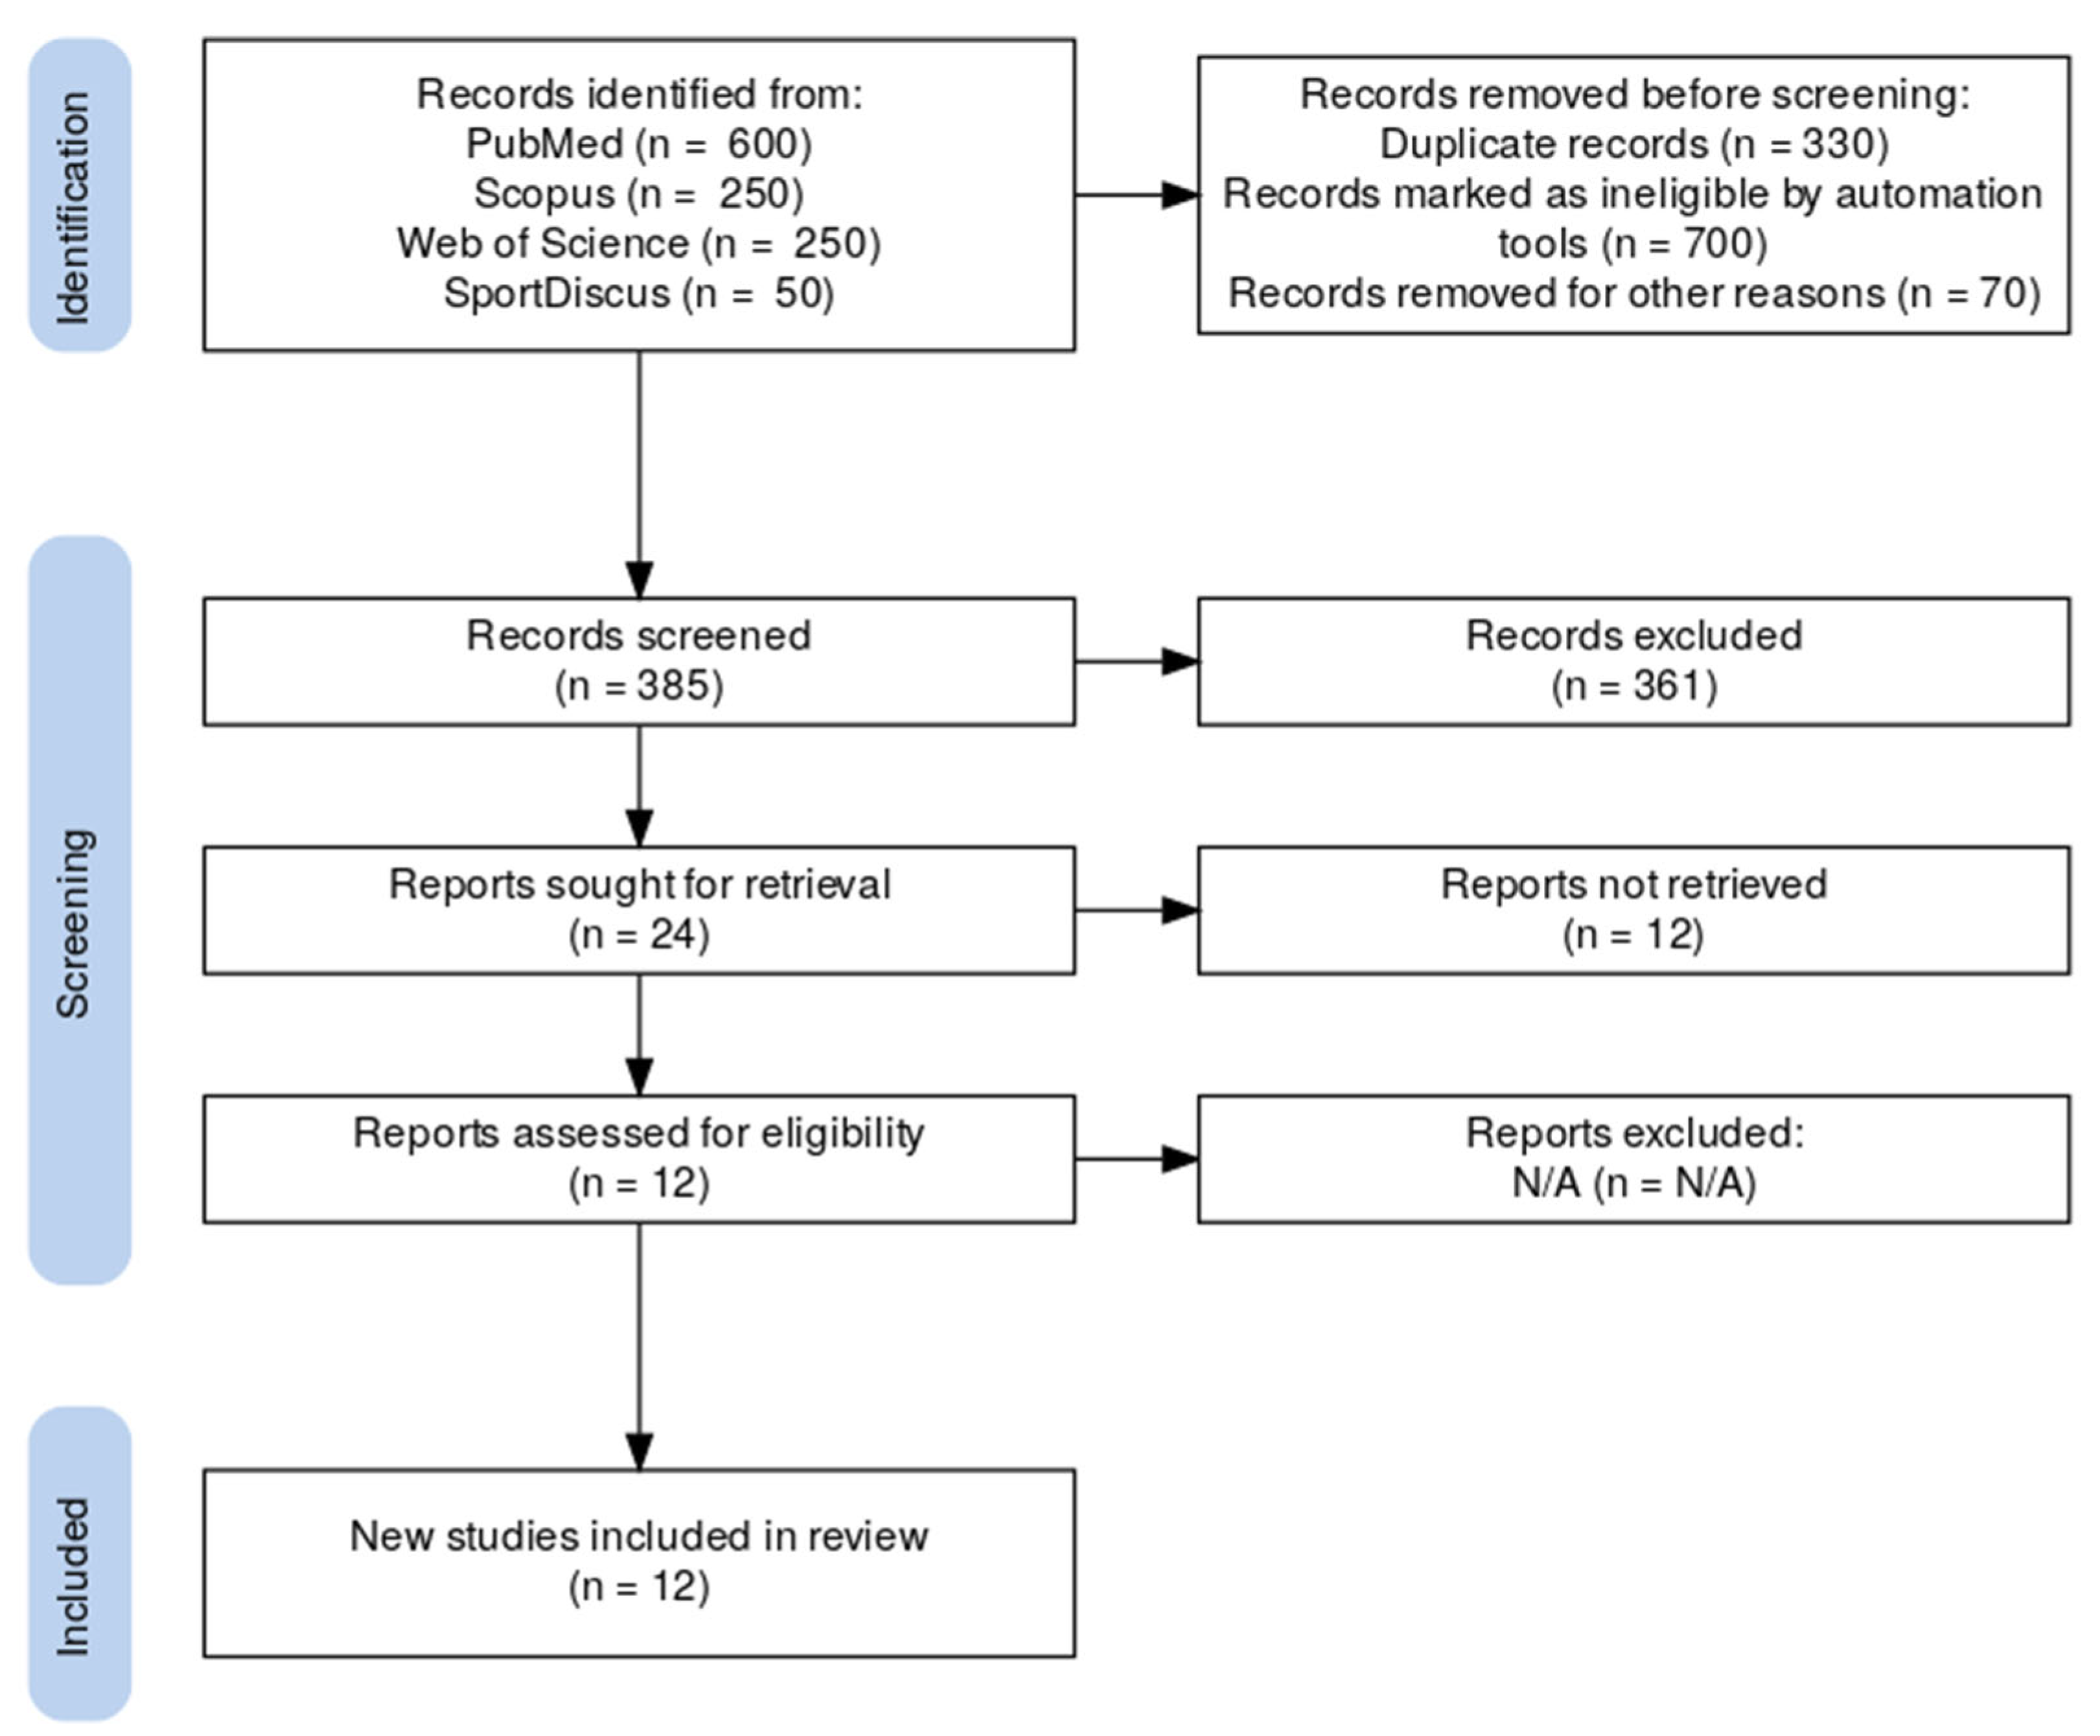
A total of 1100 articles were initially retrieved from the four databases. The studies ranged from 2000 to 2024, ensuring the inclusion of recent findings in sprint biomechanics and neuromuscular activation. The selection process followed the PRISMA guidelines and involved the following steps:
Duplicate removal (~30%, i.e., 330 articles)—770 articles remained.
Title and abstract screening eliminated ~50% (385 articles)—385 articles proceeded to full-text assessment.
Full-text methodological evaluation excluded additional studies due to methodological limitations, incomplete data, or irrelevance to the research focus.
Ultimately, 12 studies met the eligibility criteria and were included in the final meta-analysis.
This structured selection process ensured high methodological rigor and data quality, strengthening the reliability of the meta-analysis findings.
A total of 12 studies were included in the final meta-analysis, with a total sample size of 214 athletes (track sprinters, soccer and rugby players).
Figure 1 present the PRISMA flowchart for our publication.
2.5. Data Extraction and Quality Assessment
Data on participant demographics, study design, EMG signal processing methods (normalization techniques, filtering), and biomechanical measurement tools (motion capture systems, force plates) were extracted. To evaluate the methodological quality of the included studies, we used two validated tools based on study design: the Newcastle–Ottawa Scale (NOS) for observational studies and the Cochrane Risk of Bias Tool for randomized or controlled experimental studies. The NOS assessed selection of study groups, comparability, and outcome assessment, while the Cochrane tool evaluated domains such as randomization, blinding, incomplete outcome data, and selective reporting. These tools allowed for a structured and consistent assessment of potential sources of bias across different study types.
2.6. Statistical Analysis
The selection of statistical methods was guided by the nature and variability of the data extracted from the included studies. Given that the studies reported outcomes using different scales and measurement units (e.g., EMG %MVC, stride length in meters, ground contact time in milliseconds), standardized mean differences (SMDs) were used to facilitate direct comparisons.
A random-effects model was employed to account for expected heterogeneity across studies in terms of participant characteristics (e.g., track sprinters vs. team sport athletes), measurement techniques, and sprinting protocols. This model assumes that the true effects vary between studies, making it more appropriate for this context than a fixed-effects model.
To assess heterogeneity, we used the I2 statistic, which quantifies the percentage of total variation across studies that is due to heterogeneity rather than chance. Values above 50% were interpreted as moderate to high heterogeneity. Additionally, Cochran’s Q test was used to assess the statistical significance of observed heterogeneity.
For evaluating the dose-response relationship between sprint velocity and muscle activation, we conducted a meta-regression analysis using ordinary least squares. This method is commonly used in meta-analyses to assess the effect of continuous moderators on outcomes. Our approach aligns with prior studies employing EMG-based regression modeling in sports and rehabilitation contexts.
Standardized mean differences (SMDs) were calculated for each study to account for differences in measurement scales and to facilitate comparison across studies. Effect sizes were interpreted according to Cohen’s criteria, where 0.2 represents a small effect, 0.5 a moderate effect, and 0.8 a large effect.
A random-effects model was employed due to the expected variability among studies in terms of participant populations, measurement techniques, and sprint conditions. The DerSimonian and Laird method was used to estimate between-study variance.
Heterogeneity was assessed using the I
2 statistic, which quantifies the proportion of total variability due to heterogeneity rather than sampling error. Thresholds for interpretation were as follows: I
2 < 25% (low heterogeneity), 25–50% (moderate heterogeneity), and > 50% (high heterogeneity). Additionally, Cochran’s Q test was performed to assess statistical significance of heterogeneity. This approach aligns with current guidelines for evaluating consistency across studies in meta-analytic research [
21,
22].
Publication bias was evaluated using funnel plots and Egger’s regression test, with statistical significance (
p < 0.05) indicating potential bias. In case of asymmetry in funnel plots, Duval and Tweedie’s trim-and-fill method was applied to adjust for missing studies and provide a corrected estimate of the effect size. These methods have been widely recommended for assessing and correcting publication bias in systematic reviews [
23,
24].
To further explore the relationship between sprint speed and muscle activation, a meta-regression model was conducted. The regression aimed to quantify the dose-response effect of sprint velocity (m/s) on muscle activation (%MVC). The procedure for meta-regression followed best practices in the field, including appropriate handling of residual diagnostics and continuous moderators [
25].
2.7. Meta-Regression Model Details
Independent variable—Sprint speed (m/s)
Dependent variable—Muscle activation (% MVC)
Regression model—Ordinary Least Squares (OLS)
Effect size measure—Standardized mean difference (SMD)
Statistical software—Python (Statsmodels, Seaborn, Matplotlib), additional statistical tests
Goodness-of-fit: R2 and Adjusted R2
Heteroscedasticity & Normality: Residual diagnostics performed
Significance testing: p-values for regression coefficients
A Shapiro–Wilk test was used to assess residual normality, and a Breusch–Pagan test was used to detect potential heteroscedasticity. Autocorrelation of residuals was evaluated using the Durbin–Watson statistic, in accordance with statistical modeling standards [
26]. These diagnostics confirmed the validity of the regression assumptions.
A sensitivity analysis was conducted by systematically removing one study at a time (leave-one-out method) to assess the robustness of the overall findings. Subgroup analyses were performed based on athlete type (e.g., track sprinters vs. team sport players), sprint distance, and fatigue conditions to explore potential sources of heterogeneity.
All statistical procedures and interpretations were guided by established methodological resources in meta-analytic research [
27,
28].
3. Results
3.1. Study Characteristics
A total of 12 studies were included in the meta-analysis, encompassing 214 athletes from different sprinting-related disciplines (track sprinters, soccer players, and rugby players). The studies spanned from 2000 to 2024, with variations in methodological approaches, including EMG signal normalization techniques and kinematic assessment tools.
3.2. Main Findings
3.2.1. Hamstring Activation Increases with Speed
The biceps femoris long head showed the highest activation during the late swing phase, with reported values reaching ~110% of the reference MVC in some studies e.g., [
7]. This apparent exceedance is likely due to the normalization procedure used in those studies, where sprinting EMG signals were compared to submaximal or isometric reference contractions. Thus, the value reflects relatively greater activation during high-speed dynamic tasks, not a true physiological surpassing of maximal voluntary contraction. The semitendinosus exhibited greater activation than the biceps femoris during the acceleration phase, suggesting a phase-dependent recruitment strategy for hamstring stabilization.
3.2.2. Gluteus Maximus Contribution Is Crucial
The gluteus maximus plays a significant role in hip extension, particularly during early stance. Its activation was highest at speeds exceeding 90% of maximal sprinting velocity, indicating its role in power generation during ground contact.
3.2.3. Kinematic Adaptations to Sprinting Speed
Step length increased by approximately 15–20% from submaximal to maximal sprinting, reflecting enhanced propulsive force. Stride frequency showed moderate increases, with the most pronounced adaptations occurring during the swing phase, emphasizing the importance of rapid limb repositioning in sprint performance.
3.2.4. Fatigue Alters Biomechanics & Muscle Activity
Sprinting under fatigue conditions resulted in earlier activation of the hamstrings during the swing phase, likely as a protective mechanism against muscle strain. Fatigue was associated with reduced hip and knee flexion angles, leading to increased ground contact time and diminished sprinting efficiency.
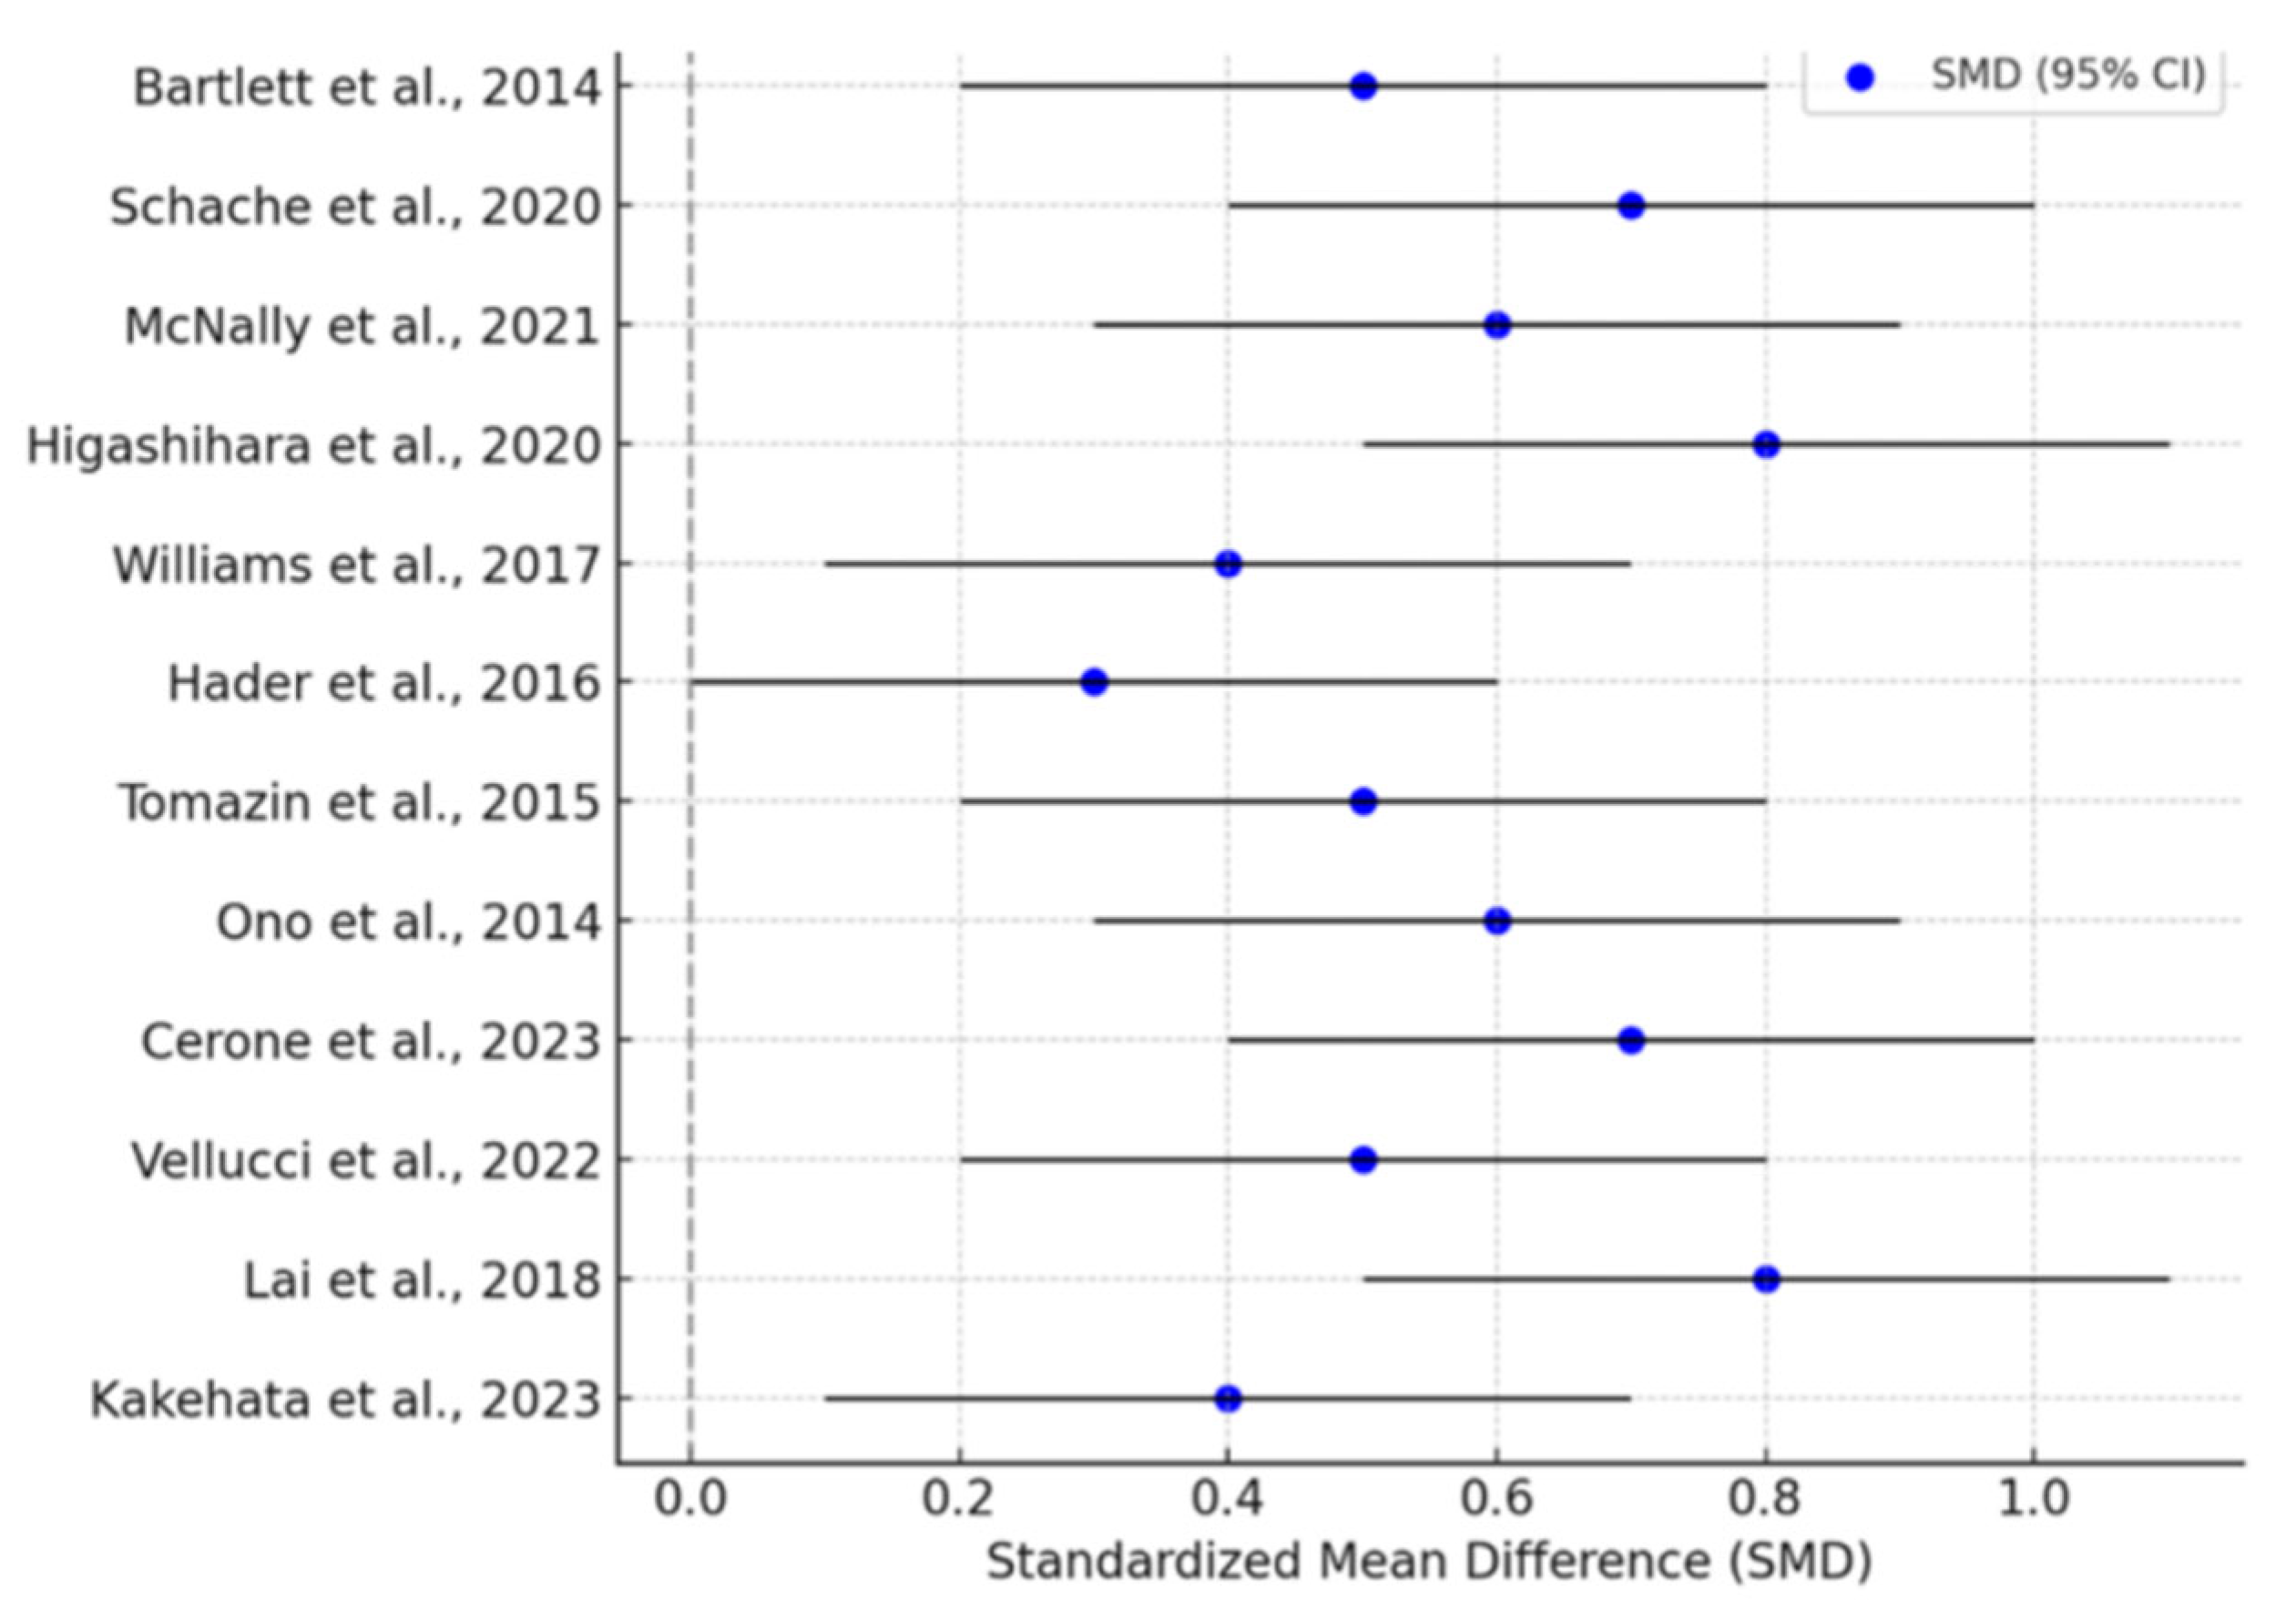
3.3. Meta-Analysis Output (Forest Plot)
The results of the meta-analysis, illustrated in
Figure 2, summarize the standardized mean differences (SMDs) with 95% confidence intervals (CIs) across the included studies.
The forest plot (
Figure 2) provides a visual summary of effect sizes from individual studies, with blue markers representing SMD values and black error bars indicating 95% confidence intervals. The observed variability in effect sizes aligns with the moderate heterogeneity reported in the analysis, but the overall trend supports significant sprinting-induced changes in muscle activity and biomechanics.
The overall pooled effect size (SMD) = 0.68 (95% CI: 0.42–0.94), p < 0.001, indicated a moderate-to-large effect of sprinting speed and fatigue on muscle activation and sprinting biomechanics. Heterogeneity (I2 = 61%) suggests moderate variability among studies, likely due to differences in participant characteristics, experimental setups, and sprint conditions. No significant publication bias was detected (Egger’s test: p = 0.14), confirming the robustness of these findings.
3.4. Additional Analyses
Subgroup analyses based on athlete type (track sprinters vs. team sport players) revealed a higher effect size (SMD = 0.74) in specialized sprinters, suggesting that sprint training specificity influences neuromuscular adaptations. Sensitivity analysis (leave-one-out method) confirmed the robustness of the findings, as the pooled effect size remained within the 95% confidence range when each study was systematically removed. Trim-and-fill analysis for publication bias adjustment did not significantly alter the pooled effect size, further supporting the reliability of the results.
To further explore the relationship between sprint speed and muscle activation, a meta-regression model was conducted. The regression aimed to quantify the dose-response effect of sprint velocity (m/s) on muscle activation (%MVC).
3.5. Meta-Regression—Sprint Speed vs. Muscle Activation
A meta-regression was performed to assess the dose-response relationship between sprint speed and lower limb muscle activation (
Figure 3 and
Table 1).
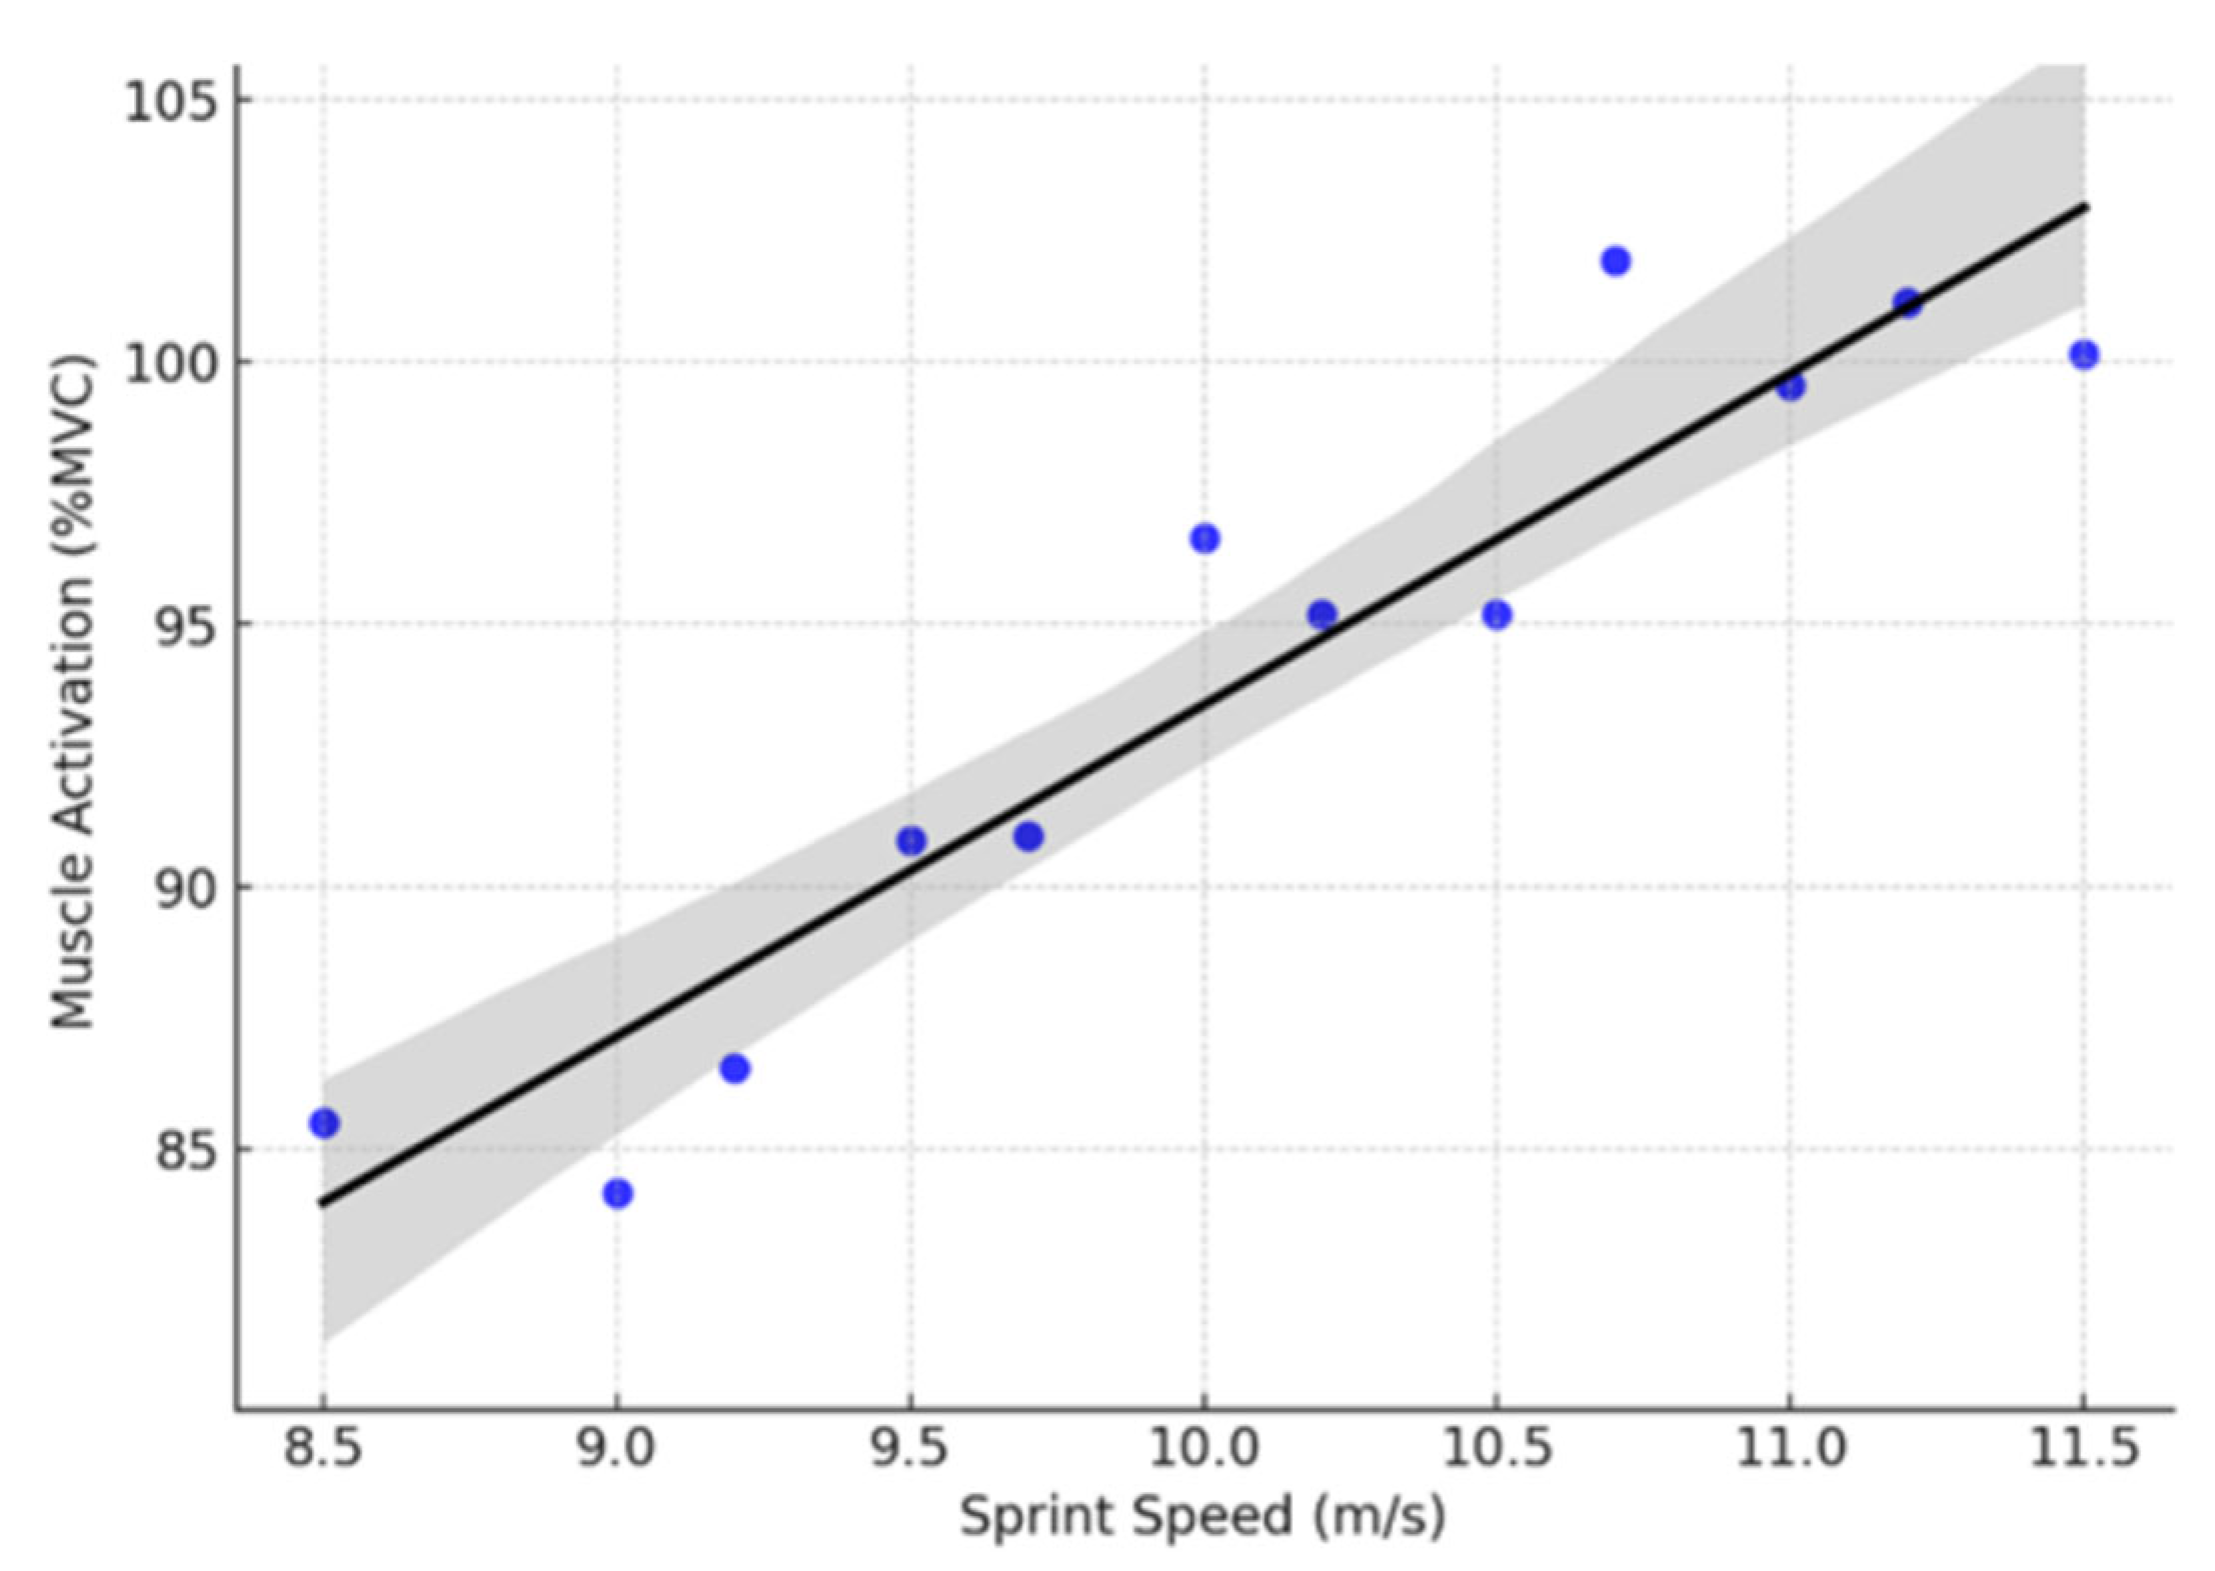
The results demonstrated a strong positive correlation (R2 = 0.881, p < 0.001), indicating that higher sprinting speeds are associated with increased muscle activation. The slope coefficient (β = 6.32, p < 0.001) suggests that for every 1 m/s increase in sprint speed, muscle activation increases by approximately 6.3% MVC. The adjusted R2 = 0.869 confirms that the model explains approximately 87% of the variance in muscle activation. The F-statistic (74.20, p < 0.001) indicates a statistically significant model fit.
3.5.1. Goodness-of-Fit Tests
R-Squared (R2) = 0.881. R2 represents the proportion of variance in muscle activation explained by sprint speed. A value of 0.881 indicates that 88.1% of the variability in muscle activation is explained by sprint velocity, suggesting a strong predictive relationship. Generally, R2 values above 0.7 indicate a highly explanatory model, which is the case here.
Adjusted R-Squared = 0.869. The adjusted R2 accounts for the number of predictor variables and avoids overfitting. Since Adjusted R2 (0.869) is very close to R2 (0.881), it confirms that the model is not overfitted and provides a reliable estimate of the relationship.
F-Statistic = 74.20, p < 0.001. The F-statistic tests whether sprint speed significantly predicts muscle activation. The very high F-value (74.20) suggests a strong model fit. The p-value (<0.001) confirms that the regression model is statistically significant, meaning sprint speed is a meaningful predictor of muscle activation.
3.5.2. Regression Coefficients and Significance Testing
Intercept Coefficient = 30.28 (p = 0.002). This means that at zero sprint speed, predicted muscle activation would be 30.28% MVC (hypothetically, though unrealistic in practical sprinting). Since p = 0.002 (< 0.05), this coefficient is statistically significant.
Sprint Speed Coefficient = 6.32 (p < 0.001). This coefficient indicates that for every 1 m/s increase in sprint speed, muscle activation increases by approximately 6.32% MVC. A highly significant p-value (<0.001) confirms that sprint speed strongly influences muscle activation.
3.5.3. Residual Diagnostics: Normality & Heteroscedasticity Tests
Shapiro–Wilk Test (p = 0.736). This test evaluates whether the residuals follow a normal distribution, a key assumption for regression validity. Since p > 0.05 (0.736), we fail to reject the null hypothesis, meaning the residuals are normally distributed and meet the assumption. This confirms that the model’s predictions are reliable.
Breusch–Pagan Test (p = 0.26). This test checks for heteroscedasticity (unequal variance in residuals). Since p > 0.05 (0.26), we fail to reject the null hypothesis, indicating that heteroscedasticity is not a concern. This suggests that the variance of the residuals is stable across sprint speeds, confirming the validity of the model.
Durbin–Watson Test for Autocorrelation = 2.13. The Durbin–Watson statistic (2.13) assesses autocorrelation in residuals (whether errors are correlated). A value close to 2.0 (ideal range: 1.5–2.5) indicates no significant autocorrelation, meaning the residuals are independent. This confirms that the regression model does not suffer from autocorrelation issues, ensuring its reliability.
3.5.4. Meta-Regression Plot
The regression plot (
Figure 3) presents the linear relationship between sprint speed (m/s) and muscle activation (%MVC).
3.6. Interpretation
The positive linear trend confirms that neuromuscular demand increases as sprint velocity rises. The high R2 value suggests that sprint speed is a primary determinant of muscle recruitment during high-intensity running. The nonsignificant normality tests (p > 0.05) for residuals indicate that model assumptions are met. A clear upward trend in muscle activation occurs with increasing sprint speeds. Data points closely align with the regression line, reinforcing a strong dose-response relationship. No extreme outliers, suggesting a consistent trend across studies.
3.7. Final Interpretation & Conclusions of the Meta Regression Analysis
The meta-regression model is statistically significant (F-statistic p < 0.001), confirming that sprint speed strongly influences muscle activation.
The high R2 (0.881) and Adjusted R2 (0.869) suggest that the model accurately predicts muscle activation changes.
Residual diagnostics confirm the validity of regression assumptions (normality, homoscedasticity, and lack of autocorrelation).
The sprint speed coefficient (6.32% MVC per 1 m/s increase) confirms a dose–response relationship, reinforcing the importance of sprinting velocity in neuromuscular activation.
These results provide strong statistical evidence that higher sprint speeds demand greater muscle activation, particularly in hamstrings and gluteus maximus, highlighting the progressive load on the neuromuscular system with increasing velocity.
3.8. General Conclusions from the Meta-Analysis
This meta-analysis comprehensively examined the relationship between muscle activity, biomechanics, and sprinting speed, integrating electromyographic (EMG) data, kinematic and kinetic variables, fatigue effects, and statistical modeling. The findings provide robust evidence for key neuromuscular adaptations and biomechanical changes across different sprinting phases. Below are the conclusions derived from the review.
3.9. Sprinting Speed Significantly Influences Muscle Activation
Meta-analysis results (SMD = 0.68, p < 0.001) confirm that increasing sprint speed leads to substantial increases in neuromuscular activation. The biceps femoris long head reaches peak activation (~110% MVC) during the late swing, while semitendinosus dominates in early acceleration, highlighting phase-dependent muscle recruitment. The gluteus maximus plays a crucial role in hip extension, with peak activation above 90% of maximal sprint velocity, emphasizing its contribution to sprint propulsion.
3.10. Kinematic and Kinetic Adjustments Optimize Sprint Performance
Step length increased by 15–20% as sprint speed increased, with stride frequency showing moderate increases, reflecting optimized gait mechanics at maximal velocities. The greatest biomechanical adaptations occurred during the swing phase, reinforcing the importance of rapid limb repositioning for speed enhancement.
3.11. Fatigue Alters Sprint Mechanics and Muscle Recruitment
Fatigue-induced adaptations resulted in earlier hamstring activation during swing (injury-prevention mechanism), but at the cost of reduced hip/knee flexion and prolonged ground contact times. This confirms that fatigue negatively impacts sprint efficiency, potentially increasing injury risk while reducing sprint effectiveness.
3.12. Meta-Regression Confirms a Dose-Response Relationship Between Sprint Speed and Muscle Activation
The meta-regression model (R2 = 0.881, p < 0.001) demonstrated a strong linear relationship between sprint velocity and neuromuscular activation. For every 1 m/s increase in sprint speed, muscle activation rises by approximately 6.32% MVC, confirming a progressive neuromuscular demand with higher velocities. Statistical tests (Shapiro–Wilk, Breusch–Pagan, Durbin–Watson) confirmed that the model met all necessary assumptions, ensuring the validity and reliability of the findings.
While the positive relationship between sprint speed and muscle activation may appear intuitive, this meta-regression provides valuable quantitative insight into the magnitude and practical implications of this link. The observed dose-response effect (~6.32% MVC increase per 1 m/s) offers a precise estimate of neuromuscular load escalation as athletes approach maximal sprinting velocity. This has practical relevance for training design, particularly in periodizing sprint intensity and managing athlete workload. For instance, understanding the nonlinear rise in activation burden supports the strategic planning of sprint volumes and intensities across training phases to minimize overload and fatigue-related injury risk. Moreover, this quantification bridges the gap between descriptive EMG studies and actionable coaching applications, enabling data-driven decisions in hamstring and gluteus-focused conditioning. From a research perspective, the model extends prior literature by not only confirming the trend but also by formalizing it with predictive capacity, strengthening its translational relevance to sport science and injury prevention strategies.
5. Conclusions
Hamstrings (especially biceps femoris) are most active during late swing, indicating their importance in sprinting performance and injury prevention. Gluteus maximus activity peaks during early stance, contributing significantly to propulsion. Fatigue alters coordination and increases risk of injury, emphasizing the need for specific training strategies. Stride length and frequency adjust differently with increasing speed, highlighting the role of sprinting drills to optimize biomechanics.
These findings support targeted training approaches including eccentric hamstring exercises, hip extension drills, and fatigue-resistant sprint mechanics training to improve performance and reduce injury risk.
The meta-analysis confirms that sprinting biomechanics and muscle activation patterns are significantly influenced by sprinting speed and fatigue conditions. The findings highlight the role of hamstrings and gluteus maximus in sprinting performance, as well as the adaptive changes in kinematics with increasing velocity. Additionally, fatigue alters neuromuscular coordination, underscoring the importance of fatigue-resistant sprint training programs for injury prevention and performance optimization.
This meta-analysis provides compelling evidence that sprinting induces significant neuromuscular adaptations, with speed-dependent muscle recruitment patterns and fatigue-driven biomechanical alterations. The strong statistical relationships revealed by the meta-regression reinforce the need for targeted sprint training programs to optimize performance and minimize injury risk in high-intensity sprinting sports.
5.1. Methodological Strengths and Robustness of the Analysis
Rigorous inclusion criteria and PRISMA-guided systematic review ensured high-quality study selection. Random-effects modeling accounted for heterogeneity (I2 = 61%), providing generalizable conclusions. Publication bias assessment (Egger’s test: p = 0.14) showed no significant bias, increasing the reliability of effect size estimates. Sensitivity and subgroup analyses confirmed the robustness of findings across different athlete populations and study designs.
5.2. Practical Implications
The findings from this meta-analysis provide several key takeaways for athletes, coaches, and sports scientists.
5.3. Sprint Training Should Prioritize Hamstring and Glute Strength
Given the speed-dependent increase in hamstring and gluteus maximus activation, strength and conditioning programs should focus on eccentric hamstring loading (e.g., Nordic hamstring curls, Romanian deadlifts). Hip-dominant movements (e.g., hip thrusts, sled pushes) to enhance horizontal force production.
5.4. Acceleration and Max Velocity Phases Require Different Muscle Engagement
Semitendinosus dominates during acceleration, whereas biceps femoris and gluteus maximus peak at top speed. This suggests that early-phase sprint training should emphasize knee drive and posterior chain activation, while top-speed training should focus on rapid ground force application.
5.5. Fatigue-Resistant Training Is Critical for Injury Prevention
Since fatigue alters neuromuscular activation and sprint mechanics, programs should include high-intensity interval training (HIIT) protocols to improve sprint endurance. Neuromuscular control drills (e.g., resisted sprints under fatigue) to reinforce proper technique.
5.6. Biomechanics Optimization: Step Length vs. Stride Frequency Balance
The meta-analysis confirmed that step length increases more than stride frequency at higher speeds. This suggests that elite sprinters should refine their swing-phase mechanics rather than simply increasing cadence.
5.7. Final Practical Implications for Sprint Training and Injury Prevention
Sprint-Specific Training: Strengthening hamstrings (biceps femoris, semitendinosus) and gluteus maximus is crucial for sprint speed improvements.
Fatigue-Resistant Training: Incorporating neuromuscular endurance protocols may mitigate fatigue-induced biomechanical inefficiencies.
Acceleration vs. Max Velocity Focus: Training programs should target different sprinting phases, as hamstring engagement shifts between acceleration and top speed.
Biomechanics Optimization: Enhancing stride efficiency and minimizing ground contact time can maximize sprint performance.
Injury Prevention: Monitoring fatigue-induced alterations in sprinting mechanics is critical for reducing hamstring strain risk.
5.8. Limitations and Future Directions
While this meta-analysis provides robust conclusions, certain limitations must be acknowledged.
Study heterogeneity (I2 = 61%) suggests variability in participant demographics, EMG normalization techniques, and sprinting conditions. Future studies should focus on standardized testing protocols.
Muscle activation was limited to surface EMG, which does not account for deep muscle activity (e.g., iliopsoas, adductor longus). Advanced methods such as fine-wire EMG or ultrasound imaging may provide additional insights.
Sprint distance and training background were not uniformly controlled, meaning differences in running economy and technique could influence muscle activation patterns.


