Article

Use of Model-Based Weather Forecasting Systems for Validation of Areas for Marine Energy Deployment in Port Service Areas

by
Raúl Cascajo
1,
Rafael Molina-Sánchez
2,3,* and
Gabriel Diaz-Hernandez
4
1
ENERMAR Working Group of the Spanish Association of Naval Architects and Marine Engineers, 28040 Madrid, Spain
2
Dpto. Ingeniería Civil: Transportes, Urbanismo y Territorio, Universidad Politécnica de Madrid (UPM), 28040 Madrid, Spain
3
ETSICCyP, CEHINAV, Universidad Politécnica de Madrid, 28040 Madrid, Spain
4
IHCantabria—Instituto de Hidráulica Ambiental de la Universidad de Cantabria, 39011 Santander, Spain
*
Author to whom correspondence should be addressed.
Appl. Sci. 2025, 15(9), 4948; https://doi.org/10.3390/app15094948
Submission received: 23 March 2025 / Revised: 26 April 2025 / Accepted: 27 April 2025 / Published: 29 April 2025
(This article belongs to the Section Green Sustainable Science and Technology)

Abstract

:

Featured Application

This study presents a model-based framework for port authorities and energy planners to assess the feasibility of integrating marine renewable energy sources, such as wave energy, into port infrastructures. By leveraging high-resolution meteorological and oceanographic modelling, the approach enables ports to explore pathways for energy self-sufficiency, optimize energy generation strategies, and reduce reliance on fossil fuels. This contributes to lowering greenhouse gas emissions, ensuring energy security, and facilitating compliance with evolving international environmental regulations and decarbonisation policies.

Abstract

Ports function as logistical hubs through which approximately 80% of the world’s goods are transported annually. Recent regulatory frameworks from the International Maritime Organization (IMO) and the European Union require ships and ports to adopt measures aimed at minimizing the environmental impact of port activities and mitigate climate change. These measures include investing in renewable energy generation systems to transition from fossil fuel-based energy to renewable electricity. Consequently, to meet increasing energy demands, new energy infrastructure must be developed. However, due to spatial constraints in port environments, there is a growing interest in utilizing port service areas, inner docks, and exterior/adjacent water zones for the deployment of marine renewable energy generation systems. This study applies high-resolution meteorological and oceanographic modelling—incorporating validated wave agitation models—to assess the feasibility of integrating marine renewable energy generation within port service areas.

1. Introduction

Maritime transport remains the cornerstone of global trade, enabling the movement of approximately 80% of goods worldwide [1]. However, this sector is also a significant contributor to greenhouse gas (GHG) emissions, accounting for nearly 3% of global CO₂ emissions [2]. Addressing this environmental impact has become a top priority for international and regional authorities, leading to a wave of innovative strategies aimed at reducing emissions. Recent trends in maritime transport include the adoption of cleaner propulsion technologies—such as liquefied natural gas (LNG), hydrogen, and ammonia—as well as operational measures like slow steaming and optimised routing [3]. These developments reflect a paradigm shift towards sustainability in the sector.
As key interfaces between maritime and terrestrial transport systems, ports play a pivotal role in driving this transition. Beyond serving as cargo gateways, ports are emerging as centres for innovation and decarbonisation. Notably, major European ports such as Rotterdam and Antwerp have implemented shore-side electricity (SSE) systems, enabling vessels to connect to renewable energy while at berth and thus reduce auxiliary engine emissions [4]. The European Union has further reinforced this trend through the Fit for 55 legislative packages, which mandate the adoption of alternative fuels and zero-emission technologies in ports by 2030 [5].
Another transformative opportunity for ports lies in integrating marine renewable energy sources. Offshore wind farms—such as those near the Port of Esbjerg in Denmark—demonstrate how ports can harness local resources to achieve energy sovereignty [6]. In parallel, wave and tidal energy technologies are gaining traction as complementary sources alongside wind and solar, supporting diversified and resilient energy portfolios [7]. These efforts not only decrease dependence on fossil fuels but also enhance the energy stability of port operations, aligning economic priorities with environmental goals [8].
The implementation of such systems depends on access to accurate, localized meteorological and oceanographic data. For example, offshore wind energy deployment requires high-fidelity wind resource assessments based on historical records and advanced numerical modelling [9]. Similarly, optimizing vessel traffic and cargo handling requires real-time weather forecasts to minimize delays and operational risks. Recent advances in mesoscale meteorological modelling are enabling ports to predict and mitigate the impact of extreme weather events, strengthening their resilience and adaptive capacity [10].
This article examines these interrelated trends by exploring how regulatory frameworks, technological innovations, and meteorological tools are collectively reshaping maritime transport and port operations. Through case studies and global best practices, this study highlights the critical role of ports in the energy transition and their alignment with international decarbonisation goals. Additionally, the study underscores the necessity of decarbonizing port activities as a key driver of sustainability, emphasizing how energy sovereignty is becoming an essential consideration for port authorities. Given the existing infrastructure and the availability of marine renewable resources, the article also explores the need to assess the feasibility and potential of harnessing these resources. By integrating renewable energy solutions into port operations, ports can reduce reliance on external energy sources, enhance self-sufficiency, and contribute more effectively to the broader goals of carbon neutrality and sustainable maritime development.
Section 2 of this article contextualizes the problem, highlighting the existing problems related to decarbonisation in maritime transport.
Section 3 describes ports that require a transition to an emission-free model and outlines the prospects for future growth.
Section 4 presents the main methodology and the implementation of a met-ocean system to assess climatic conditions near the ports, applied to the ports of Valencia, Sagunto, and Gandía (Spain).
Finally, Section 5 presents the general results yielded by the system’s implementation, as well as a discussion of its future and the direct application of this knowledge to marine energy generation systems in ports.

2. Role of Ports in the Decarbonisation of Maritime Transport

As mentioned, ports and maritime transport account for approximately 3% of global CO₂ emissions [1]. Consequently, the sector is under growing regulatory and societal pressure to decarbonize its operations and mitigate environmental impacts.
Ports host several energy-intensive activities. For instance, the 2016 “GHG Emissions Report of the Port of Valencia” delineates the port’s carbon footprint and identifies the sources of emissions generated by these activities. The report indicates that electricity consumption at the Port of Valencia was 65 Gigawatts-hour (GWh) per year, whereas fossil fuel consumption reached 360 GWh yearly. Additionally, energy demand from berthed ships accounted for 156 GWh per year—equivalent to half of the port’s total fuel consumption [11].
These figures indicate a fossil fuel-to-electricity consumption ratio of approximately 5.5:1, underscoring the need to significantly increase the share of electricity derived from renewable sources and alternative fuels.
Ports around the world are increasingly adopting advanced solutions to improve energy efficiency, reduce greenhouse gas emissions, and support the shift toward sustainable operations. Key measures include the implementation of energy management systems (EMS) for real-time monitoring and optimization of energy use, and the integration of smart grids and microgrids that manage energy flows dynamically and incorporate multiple renewable sources. Shore-side electricity (SSE), which enables vessels to connect to the local grid while at berth, is also widely used to cut emissions from auxiliary engines. Furthermore, ports are progressively investing in renewable energy sources such as solar photovoltaic (PV), offshore wind, wave, and tidal energy, which reduce fossil fuel dependence and contribute to energy sovereignty.
Complementary technologies like energy storage systems help stabilize power supply by storing surplus energy and ensuring continuous availability during peak demand or low generation periods. Additionally, digital innovations such as digital twins and artificial intelligence (AI) are transforming energy management in ports. These tools allow for predictive maintenance, scenario modelling, and real-time optimization of operations.
Figure 1 comprehensively represents the whole marine port power supply system, illustrating the interconnection between renewable energy sources, energy storage facilities, and various port-side energy consumers. On the generation side, the system integrates multiple renewable energy sources—including wind power, solar power, and wave and tidal energy—which are complemented by traditional grid electricity. These energy inputs feed into the port’s power infrastructure, which also incorporates diverse energy storage solutions such as batteries, hydrogen storage, and compressed air systems. The stored energy can be flexibly deployed based on demand fluctuations or generation variability. The system then distributes power to a wide array of port operations and consumers, including electric vehicles, shore-side electricity or cold ironing systems (onshore power for berthed ships), cranes, refrigerated storage units, and industrial facilities. A centralized control and distribution unit manages the flow and balance of energy across the system, ensuring efficient, stable, and sustainable operation.

2.1. Key Regulations Driving Change

The maritime industry is undergoing a major transformation, propelled by regulatory frameworks designed to reduce greenhouse gas emissions and promote sustainable fuels. These policies set ambitious targets to enhance energy efficiency, implement stricter emissions standards, and develop infrastructure for alternative fuels. By expediting the adoption of cleaner technologies and ensuring compliance with evolving environmental requirements, these regulations are reshaping the future of maritime transport.
  • International Maritime Organization (IMO): The IMO’s Initial Strategy for Reducing GHG Emissions from Ships aims to cut emissions by at least 50% by 2050 compared to 2008 levels. The introduction of the Energy Efficiency Existing Ship Index (EEXI) and Carbon Intensity Indicator (CII) regulations in 2023 enforces compliance with stricter efficiency standards [1].
  • European Green Deal: The European Union (EU) has adopted the Fit for 55 legislative packages, including the Fuel EU Maritime Initiative. This initiative mandates a gradual shift towards alternative fuels and sets specific reduction targets for GHG emissions from shipping by 2030 and 2050 [5].
  • Alternative Fuels Infrastructure Regulation (AFIR): The EU has proposed new infrastructure requirements for alternative fuel supply, ensuring ports are equipped with refuelling facilities for sustainable fuels like hydrogen, methanol, ammonia, and bio-LNG [13], among others.
Although regulatory frameworks such as the IMO’s Initial GHG Strategy, the EU’s Fit for 55 legislative packages, and the Alternative Fuels Infrastructure Regulation are driving the maritime sector’s shift toward decarbonisation, this research focuses primarily on the technical dimension of that transition—specifically, the role of met-ocean modelling tools in supporting feasibility studies for offshore renewable energy systems in port environments. Therefore, while these policies provide essential context, the discussion remains at a general level to maintain the main scope on methodological approaches and environmental data analysis rather than detailed regulatory evaluation.
Following its April 2025 meeting, the International Maritime Organization (IMO) adopted a revised GHG reduction strategy that sets a firm target of achieving net-zero greenhouse gas emissions from international shipping by 2050. The updated strategy includes strengthened intermediate checkpoints—at least a 30% reduction by 2030 and 80% by 2040 compared to 2008 levels—and emphasizes the development and uptake of zero- and near-zero emission fuels, as well as the implementation of lifecycle-based fuel standards and a global pricing mechanism for maritime emissions [14]. Meanwhile, the EU’s Emissions Trading System (ETS) has been extended to maritime transport, creating financial incentives for emissions reductions [15].

2.2. Role of Ports in the Energy Transition and Technological Developments

Ports play a crucial role in the transition towards sustainable maritime operations, acting as enablers of alternative fuel adoption and technological advancements aimed at reducing emissions. Alternative fuels, including liquefied natural gas (LNG), biofuels, methanol, hydrogen, and ammonia, are being tested and adopted to replace conventional heavy fuel oil (HFO). For example, major ports such as Rotterdam and Antwerp are developing bunkering facilities for LNG and hydrogen [16]. Additionally, hybrid and fully electric vessels are becoming increasingly common in short-sea shipping and port operations, reflecting the rapid electrification of the sector [17]. The trials carried out in the port of Valencia with a reach-stacker and a terminal tractor powered by fuel cells illustrate the potential of hydrogen in port applications.
A key strategy for reducing emissions in ports is the implementation of shore-side electricity (SSE) systems, allowing ships to connect to the grid while berthed, eliminating the need for auxiliary engines running on fossil fuels. In Spain, the port of Barcelona is pioneering the construction of SSE installations to supply electrical power to container ships, cruise ships, and ro-ro/ro-pax vessels. Similarly, the ports of Valencia, Bilbao, Cádiz, Tenerife, and Las Palmas are developing their first SSE facilities to align with EU regulations [18].
Beyond alternative fuels and SSE, technological advancements drive further decarbonisation in the maritime sector. The deployment of zero-emission vessels (ZEVs) powered by hydrogen, ammonia, and electric batteries is expected to dominate by 2050. According to [17], by mid-century, hydrogen and ammonia could account for over 30% of marine fuel consumption. Simultaneously, advanced digital technologies, including autonomous vessels and smart port systems, enhance energy efficiency by optimizing logistics and operations, reducing unnecessary fuel consumption, and supporting real-time decision-making.
By integrating sustainable fuels, electrification measures, and cutting-edge digital solutions, ports are evolving into key hubs of maritime decarbonisation. This ensures compliance with international regulations while fostering innovation in the shipping industry.

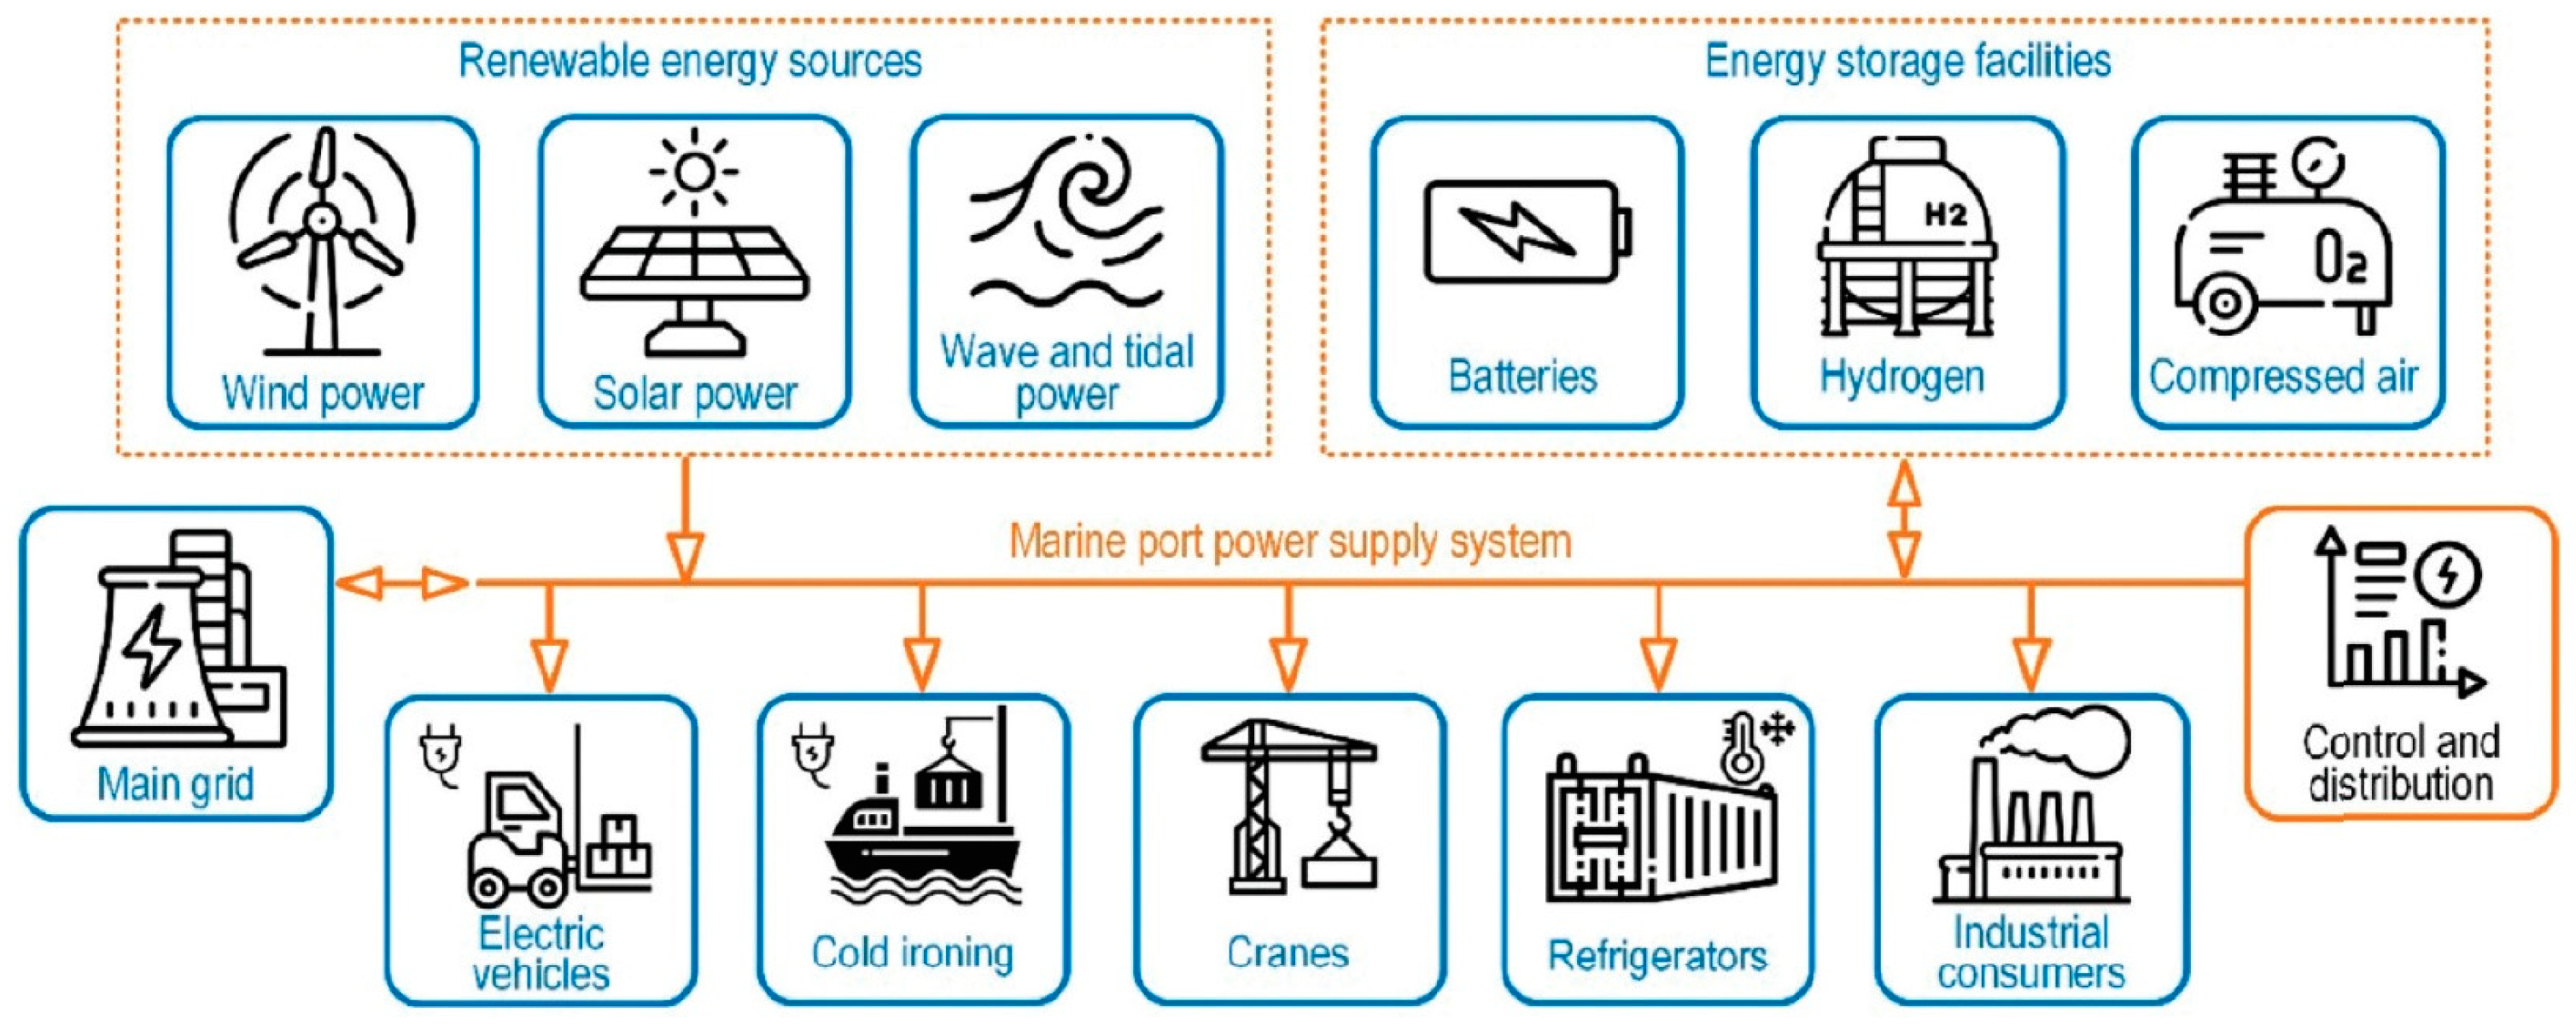
2.3. Integration of Renewable Energy in Ports

Ports are key enablers of the energy transition by integrating renewable energy systems such as offshore wind and solar power. These initiatives are designed to reduce operational emissions and ensure a stable, sustainable energy supply for maritime operations. By 2050, most major ports are expected to operate as energy hubs, integrating offshore renewable energy systems to supply clean energy to vessels and local grids. The development of floating offshore wind farms near ports—such as those planned in the North Sea, exemplifies this trend [19].
In conclusion, the maritime transport sector and ports are shifting towards decarbonisation. Regulatory mandates and advancements in alternative fuels and renewable energy drive this transformation. By 2050, ports are expected to operate as self-sufficient, sustainable hubs, supporting a fleet of zero-emission vessels and contributing to global climate goals. However, achieving these ambitions will require continued investment, international cooperation, and a commitment to innovation.

3. Maritime-Port Operations That Are Likely to Be Carried out with a More Sustainable Energy Model

Ports host numerous facilities that serve both the cargo they handle and the ships transporting it. These facilities are becoming increasingly specialized to enhance efficiency in cargo operations. This specialization shapes the energy consumption model of each facility or terminal, as some require more internal movements than others. For example, container terminals typically require more dockside machinery than bulk terminals, which results in higher absolute energy consumption and contributes significantly to the overall increase in port energy demand—even if, on a per-unit basis, they may operate with greater energy efficiency. This means that achieving a more sustainable energy model requires focusing heavily on optimizing energy consumption patterns within port terminals, which account for 43% of the port’s total energy use. Given their significant impact, enhancing efficiency and integrating low-carbon energy solutions in these terminals is essential to driving the overall decarbonisation of port operations.
To illustrate the above, the results from Valencia, one of the four most relevant ports of general interest in the Spanish state, have been examined. According to its 2016 GHG emissions report [11], Scope 3 of its emissions inventory includes activities carried out within the port premises—managed either by concessionaire companies or directly by the port authority—as well as road and maritime transport operations. Among these, the activities under the port authority’s jurisdiction represent the most actionable category, as road and maritime transport typically fall outside of direct operational control.
The port’s activities can be classified under Scope 3 according to the activities classification given by the Climeport project and included in the 2016 “GHG emissions report of the port of Valencia” (see Table 1).
These activities have an annual energy consumption of 186 GWh, which corresponds to 43% of the total energy consumption of the port. In addition, the port authority’s own consumption—an extra 2%—should be added. Therefore, the managing body’s direct capacity for action accounts for 45% of the total energy consumption [11].
In addition to these activities, other possible sources for the reduction of greenhouse gases in ports are road transport and maritime transport, whose regulation goes beyond the direct management of port authorities but which they can facilitate by incorporating technology such as shore-side electricity or by using alternative fuels for trucks entering and leaving the port.
The integration of renewable energy generation systems within port environments presents several strategic opportunities. On the one hand, such systems increase the energy autonomy of ports. On the other, surplus energy can be redirected toward the production of alternative fuels (e.g., hydrogen, methanol, and biofuels) or used to power dockside operations through electrification. This clean energy can then be utilised in port terminals to facilitate the transition from fossil fuels to clean fuels or electricity during dockside cargo handling operations.
For all of these reasons, there is a clear need to allocate resources toward analysing the marine environment as a means to expand port capacities for clean energy generation and support the broader energy transition.

4. Met-Ocean Strategy for Assessing the Feasibility of Marine Renewable Energy near Ports

4.1. Introduction

As highlighted earlier, ports are emerging as critical hubs in the transition to sustainable maritime transport, not only by adopting low-emission operational measures and alternative fuels but also by exploring the integration of marine renewable energy systems. Building on this framework, this section emphasizes that the successful deployment of such renewable energy infrastructure near ports depends heavily on the availability and accuracy of meteorological and oceanographic (met-ocean) data.
This section underscores the necessity of precise met-ocean data at every stage of renewable energy project development—from site selection and energy potential assessment to infrastructure design, operational planning, maintenance scheduling, and environmental compliance. Technologies such as offshore wind turbines and wave or tidal energy converters require highly detailed and localized data on wind speeds, wave heights and directions, and current velocities. The accurate characterization of these parameters is critical for developing reliable and efficient energy, particularly in complex coastal and port environments.
It is also important to emphasize the role of met-ocean data in ensuring the structural safety and operational resilience of marine infrastructure. Exposure to extreme weather events, high waves, and strong currents poses a significant challenge to offshore and nearshore installations. Engineers rely on precise environmental data to design structures that can withstand these forces over time, minimizing the risk of damage, costly repairs, or operational downtime. Moreover, the economic viability of these projects is tightly linked to data-driven planning, especially in relation to maintenance activities, which must be carried out during favourable conditions to avoid delays and risks.
In line with the broader sustainability goals discussed in the introduction, the integration of marine renewables into port operations must also consider energy demand compatibility and seasonal variability. Ports require a continuous and stable energy supply, and any renewable energy system must be designed to align with daily and seasonal fluctuations in wind, wave, or tidal resources. This is especially true for wave energy systems, where power output is directly derived from parameters like wave height and period, necessitating accurate, long-term datasets for proper evaluation.
To address these challenges, this section compares two main strategies for acquiring met-ocean data: direct measurement using in situ instrumentation, and the use of numerical models and virtual buoy networks, such as those provided by SIMAR [20] or international systems like CMEMS or NOAA. While direct measurements offer high precision and local relevance, they are costly and geographically limited. In contrast, numerical models provide wide coverage and cost-efficiency but may lack accuracy nearshore unless calibrated with localized data.
Currently, a gap exists between large-scale ocean models and fine-scale coastal dynamics that define port environments, especially when it comes to wave behaviour influenced by local features such as breakwaters (partial wave reflection) or seabed morphology (wave energy dissipation or focusing). For this reason, the study proposes a hybrid approach, combining large-scale numerical data with localized measurements and advanced modelling tailored to specific port conditions.
Finally, the methodology is applied to the ports of Valencia, Sagunto, and Gandía, and aims to assess wave agitation and estimate wave energy potential, using both external and internal wave data. This directly supports the overarching objective outlined in the introduction: to enhance energy sovereignty in ports through the integration of marine renewable energy systems, while ensuring environmental compliance, operational reliability, and alignment with international decarbonisation goals.

4.2. Selection of the Most Suitable Agitation Model

Currently, numerical models based on elliptic mild-slope equations are the most commonly used for this type of study. These models offer a practical and effective way to accurately evaluate port agitation, considering real bathymetric contours and complex bathymetries for irregular waves. These models are capable of solving linear processes such as refraction, diffraction, shoaling, and reflection (total and partial), as well as energy dissipation processes due to friction and wave breaking in a two-dimensional numerical domain. This project proposes the MSP port agitation model developed by IHCantabria. The MSP model solves the aforementioned elliptic mild slope equations using a finite element numerical scheme. The MSP model [21] has been successfully employed in various research projects, consulting engagements, and technical support tasks from 2001 to the present, delivering excellent results and highly competitive performance.

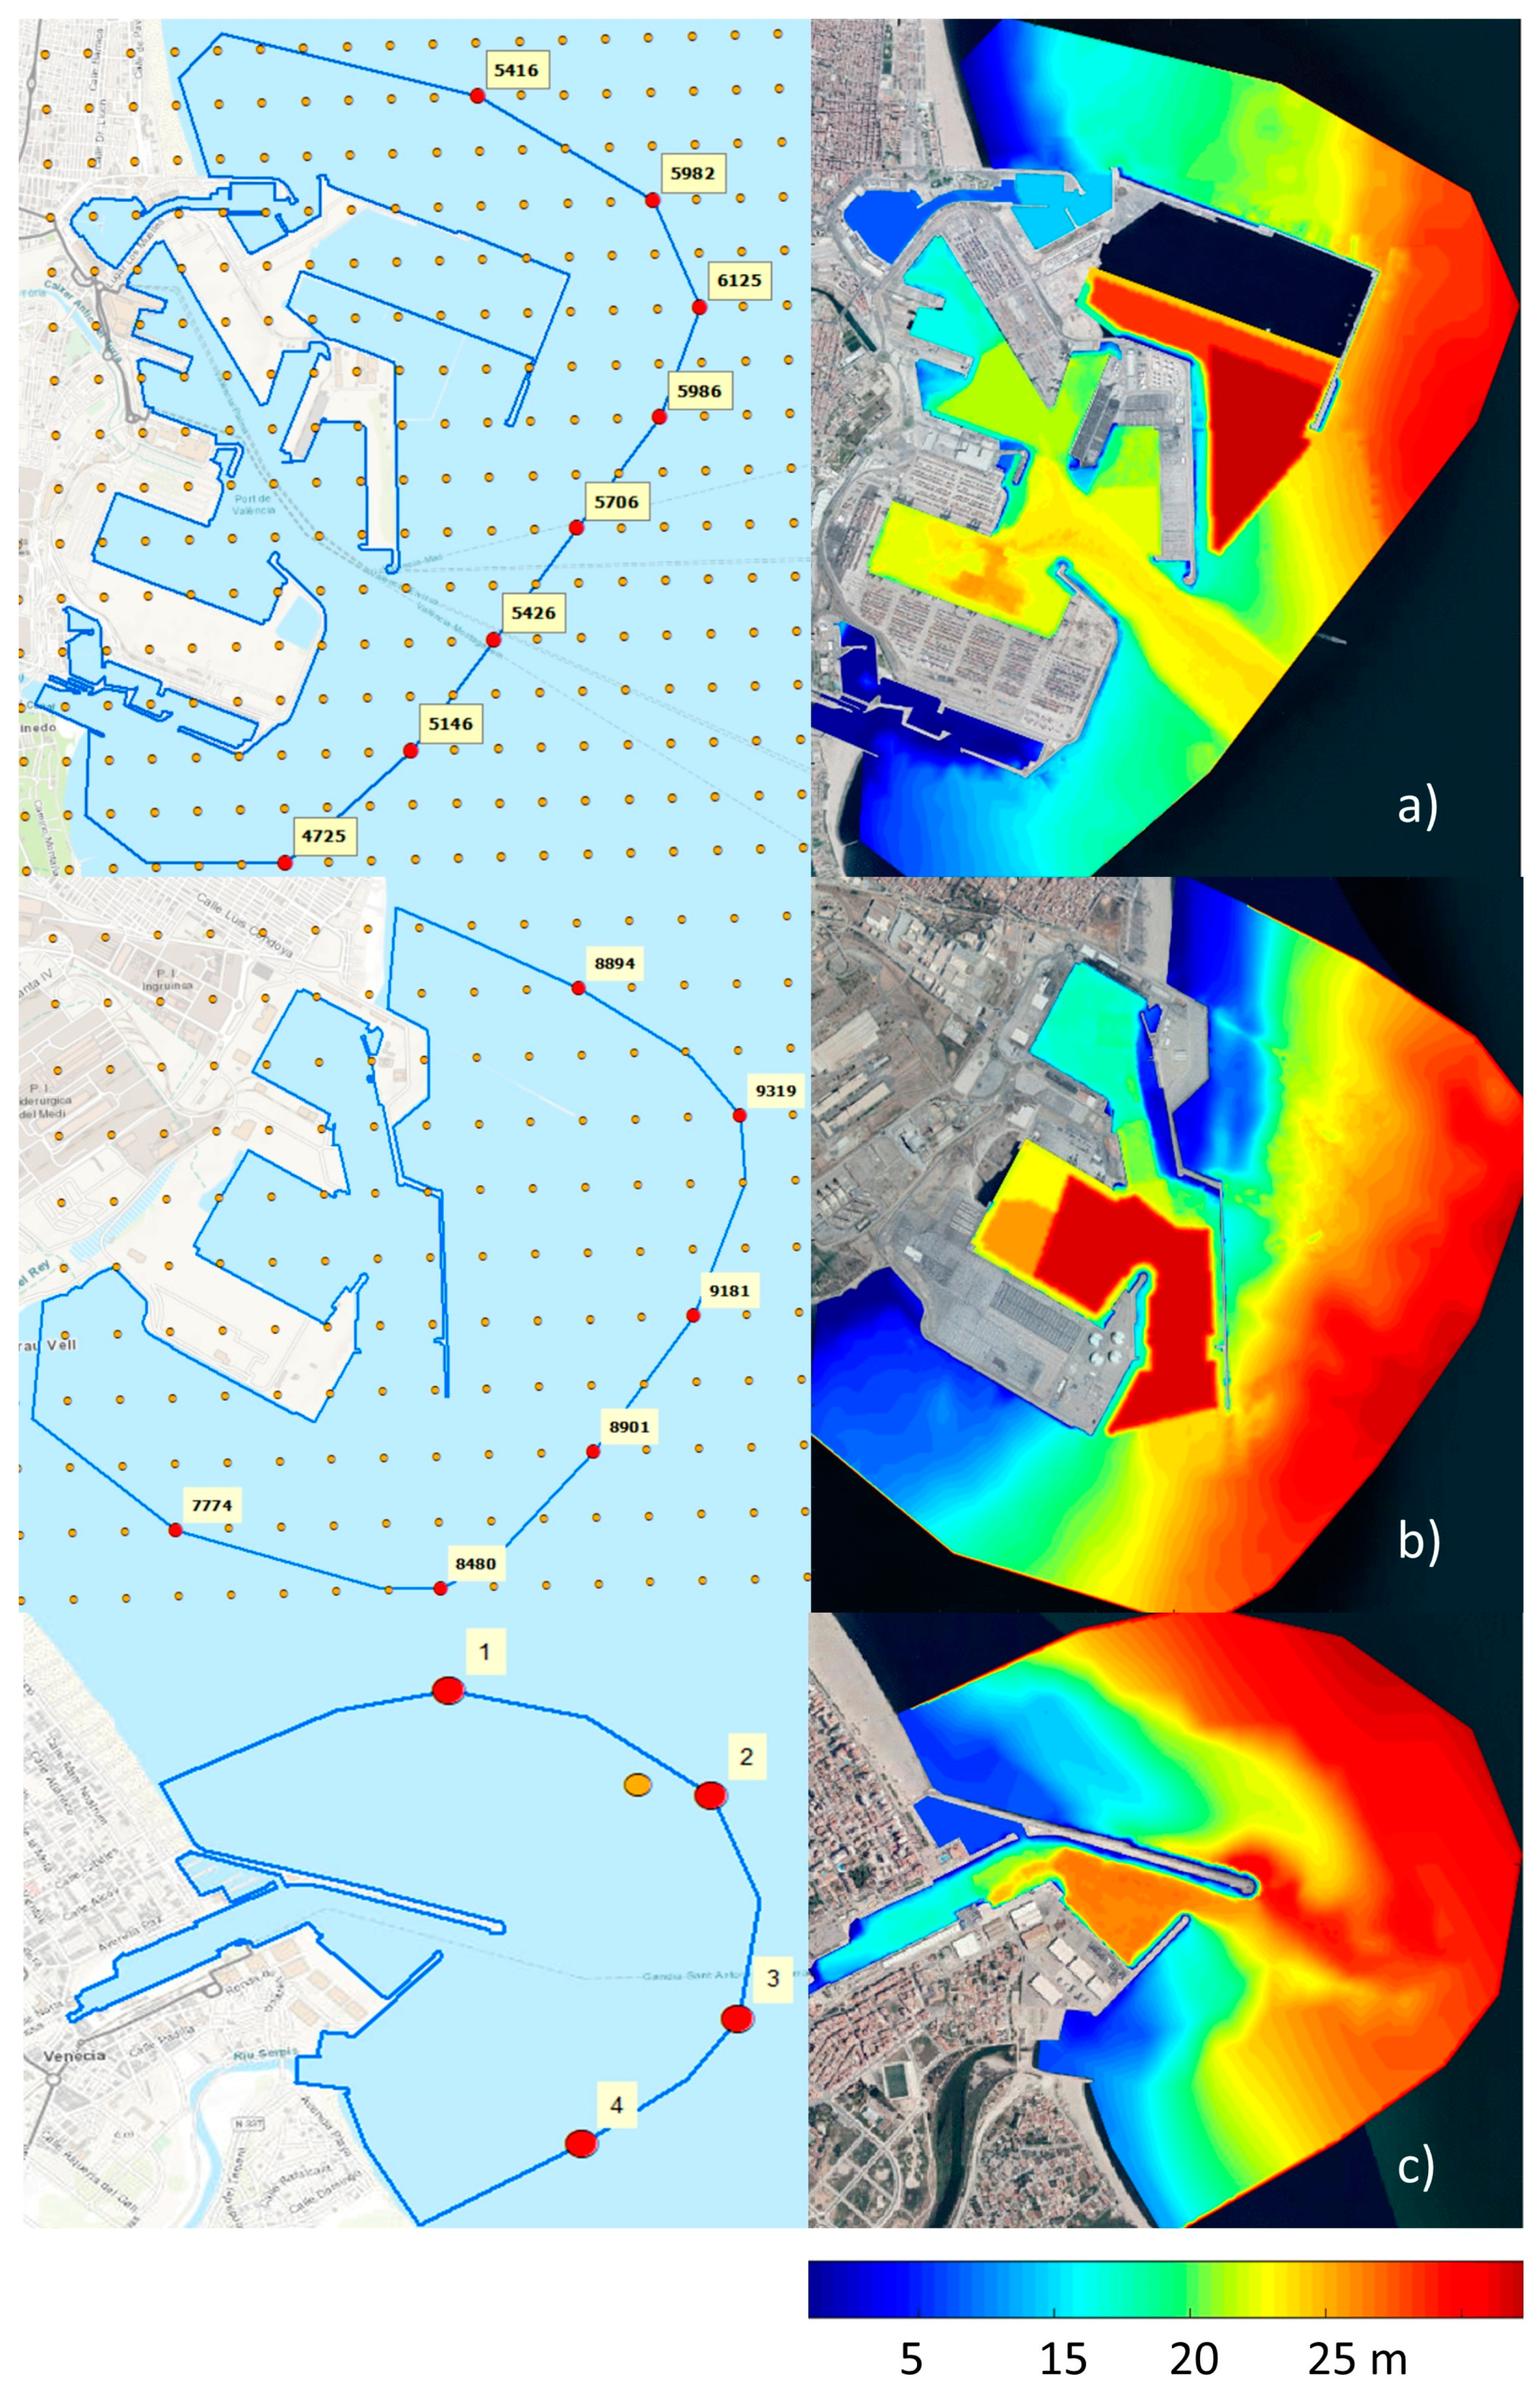
4.3. Bathymetric, Port Contour/Typologies, Instrumental Data, and Forcing Used

One of the fundamental and crucial tasks in developing the operational agitation system, which paves the way for a proper setup of the numerical strategy, is related to the concept of data normalization. Instrumental data from field campaigns or permanent measurement networks of Puertos del Estado, were initially provided in a free format (ASCII). Data regarding port section typologies include vital information about the various typologies that comprise each port’s perimeters, structures, docks, and protective elements. Spectral forcing data, obtained from previous numerical executions under the coverage of the regional SAPO system of the Puertos del Estado, were provided as spectral wave files in the predefined format of the SWAN wave propagation model. Data about the general port geometry were aligned with the updated reality of each port facility. Bathymetric data standardized within a Geographic Information System (GIS) platform in native ArcGIS® formats defining the final port geometry (port perimeter) were considered for each study port (Sagunto, Valencia, and Gandía), see Figure 2.

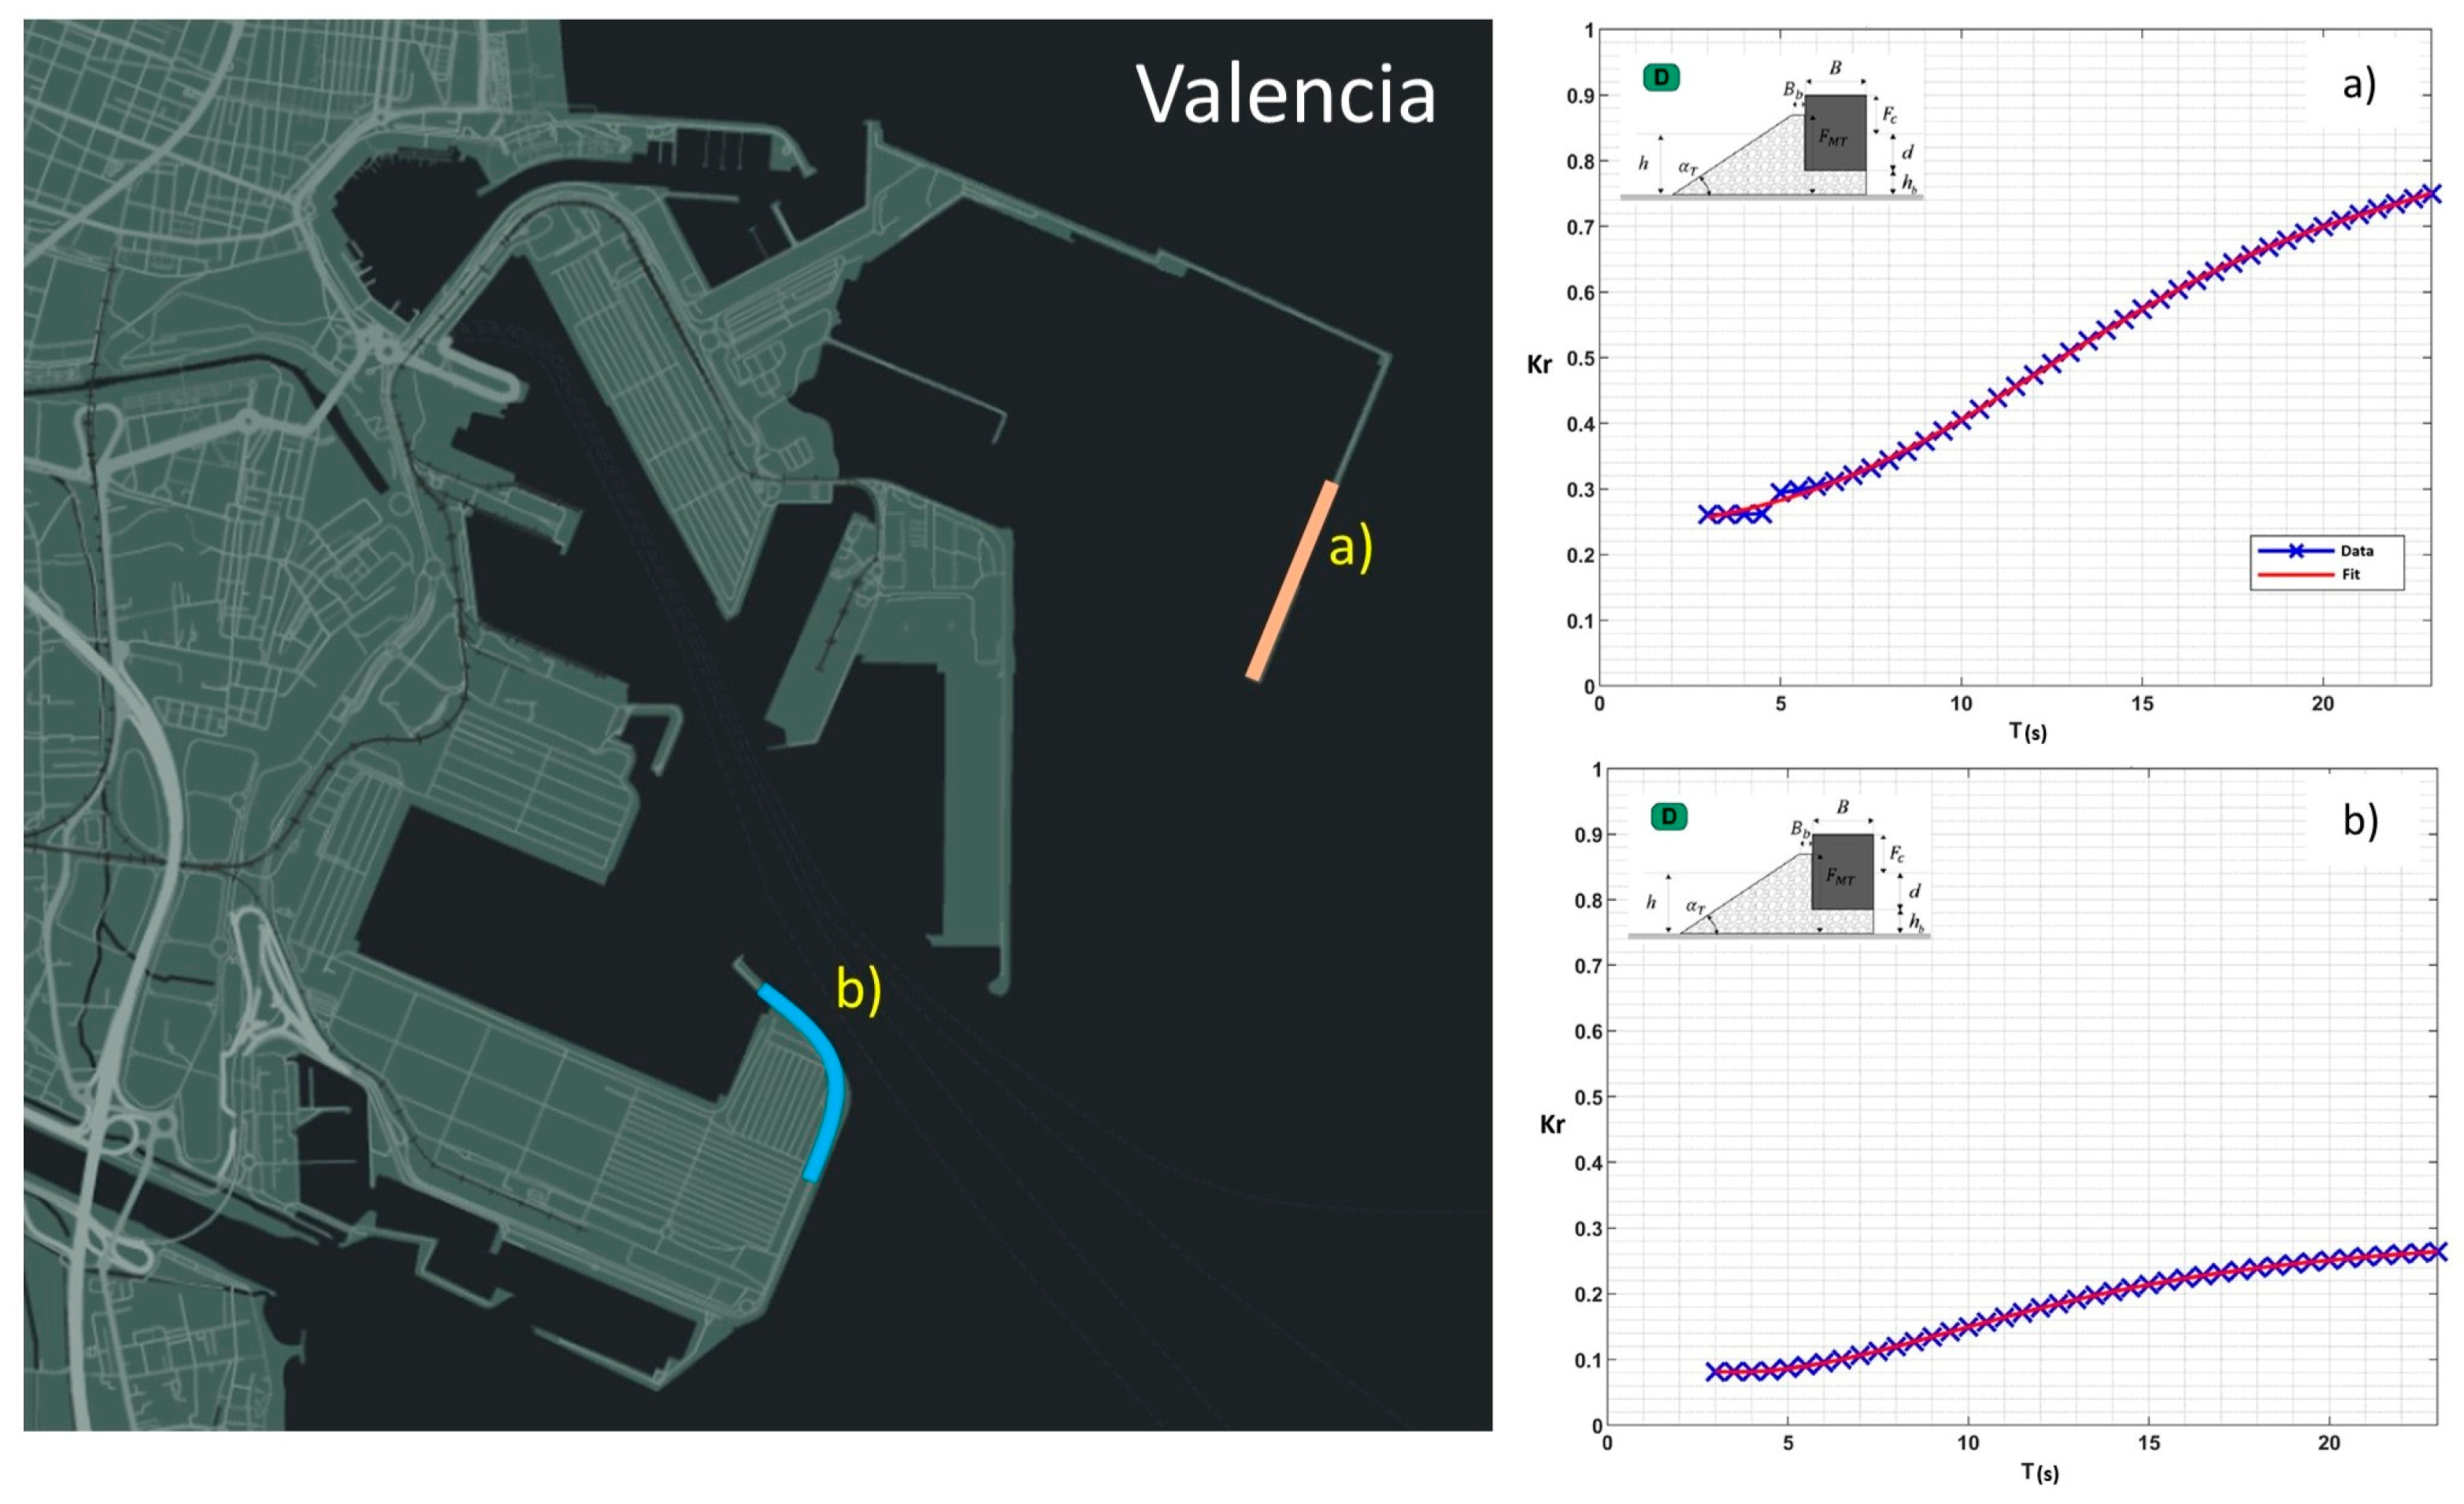
4.4. Selection of Coastal/Port Contour Reflection Coefficients

In order to deliver the most accurate and realistic representation of how port energy systems respond to incoming and penetrating wave conditions within the docks, part of the recent work developed by IHCantabria has focused on analysing how classical numerical agitation models account for wave reflections from both inner and outer port boundaries. The MSP model contributes to this objective by incorporating a more appropriate and realistic approach to applying dynamic partial reflection coefficients. These coefficients are based on frequency variations of the incident waves that reach each contour based on the classification in [22,23] for 6 dike-family typologies to obtain a polynomial fit that ultimately defines the reflection coefficients as a function of the incident wave period. Thus, a unique function will be obtained for each typology (see Figure 3).

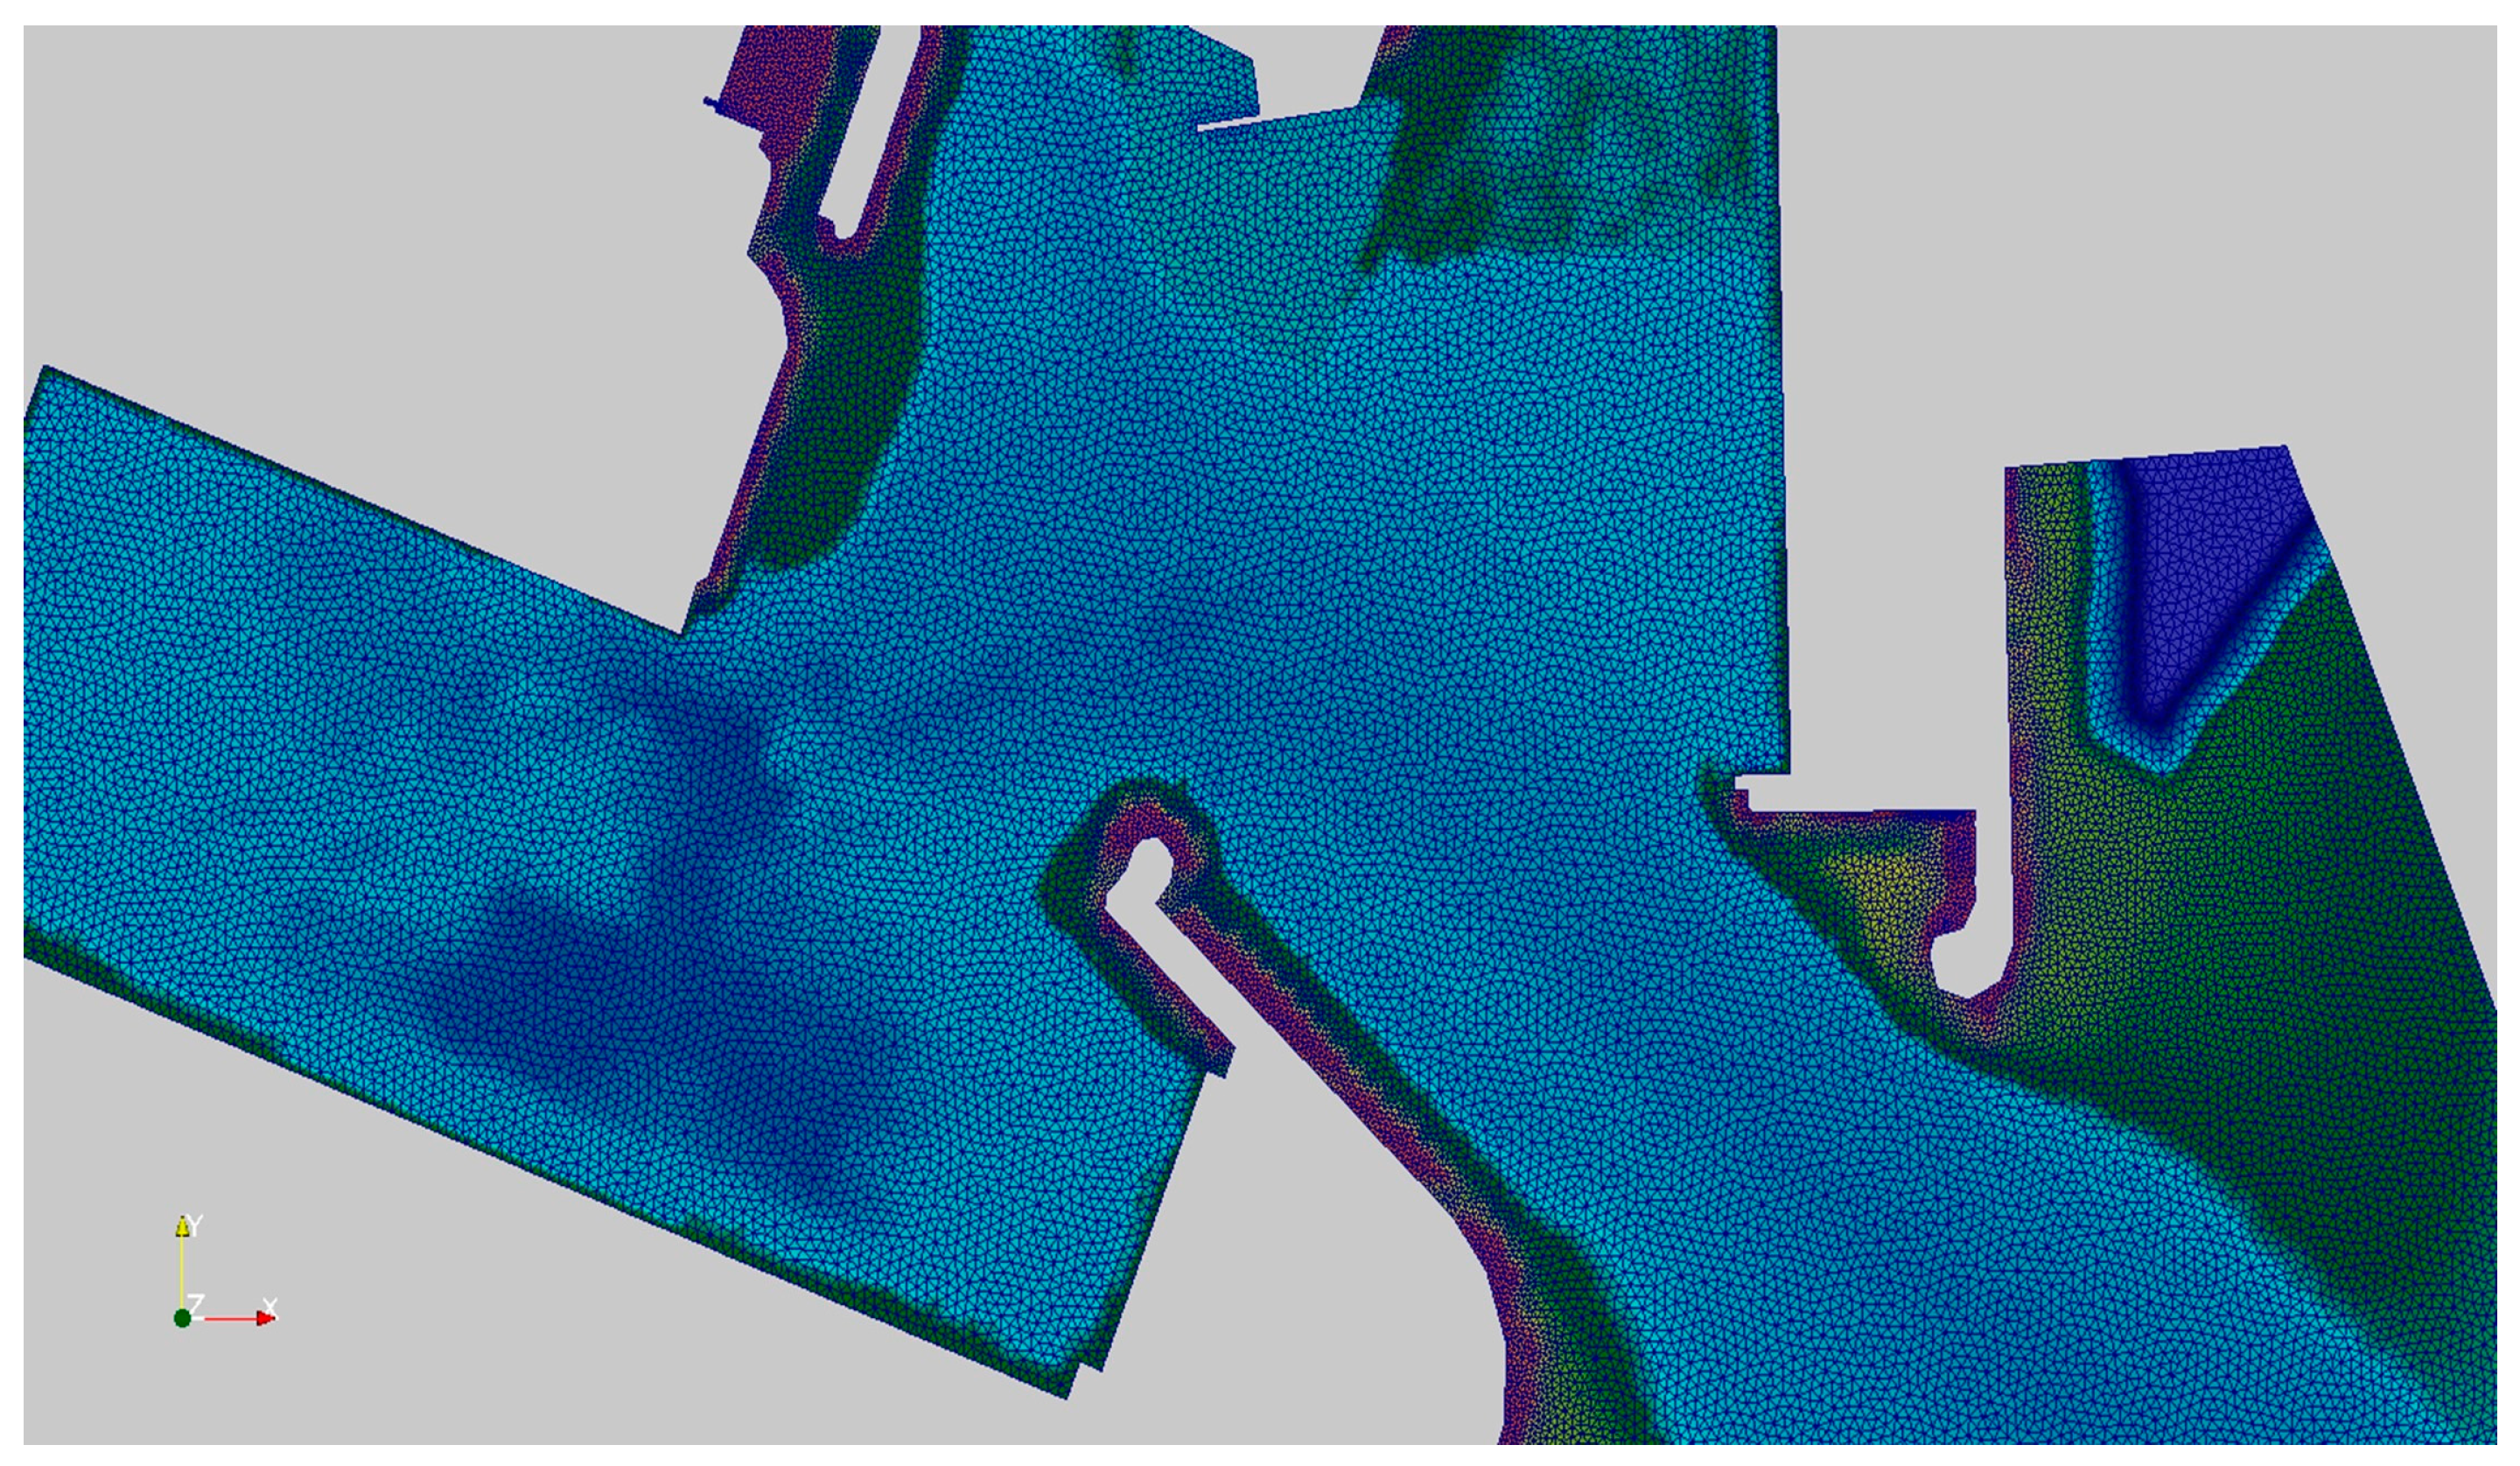
4.5. Design of the MSP Numerical Grid

The numerical domain must adhere to the constraints of the MSP model, the spatial dimensions of the study area, and the waves that will propagate within it, as discussed in previous sections. The topographic file provided by the APV will be used to define the MSP port contour. On the other hand, to delimit the marine side of the execution domain, the MSP contour is completed with the line or polygon of wave generation, traditionally known as the “generation perimeter”, where the tool introduces the irregular waves, taking into account the directional range of waves in the study area so that the contour accommodates all of them. Furthermore, the criterion of numerical efficiency is met using an adaptive mesh in triangular and unstructured finite elements. The mesh allows the optimisation of the resources required by the MSP model (CPU memory), since the nodes and elements of the finite element mesh adapt to the geometric contours of the port and corresponding bathymetric depths. This concentrates a higher number of elements in shallower areas of the domain (smaller wave periods) and relaxes the mesh for deeper areas (see Figure 4). It is crucial to ensure that the generated mesh adequately evaluates the minimum wave period.

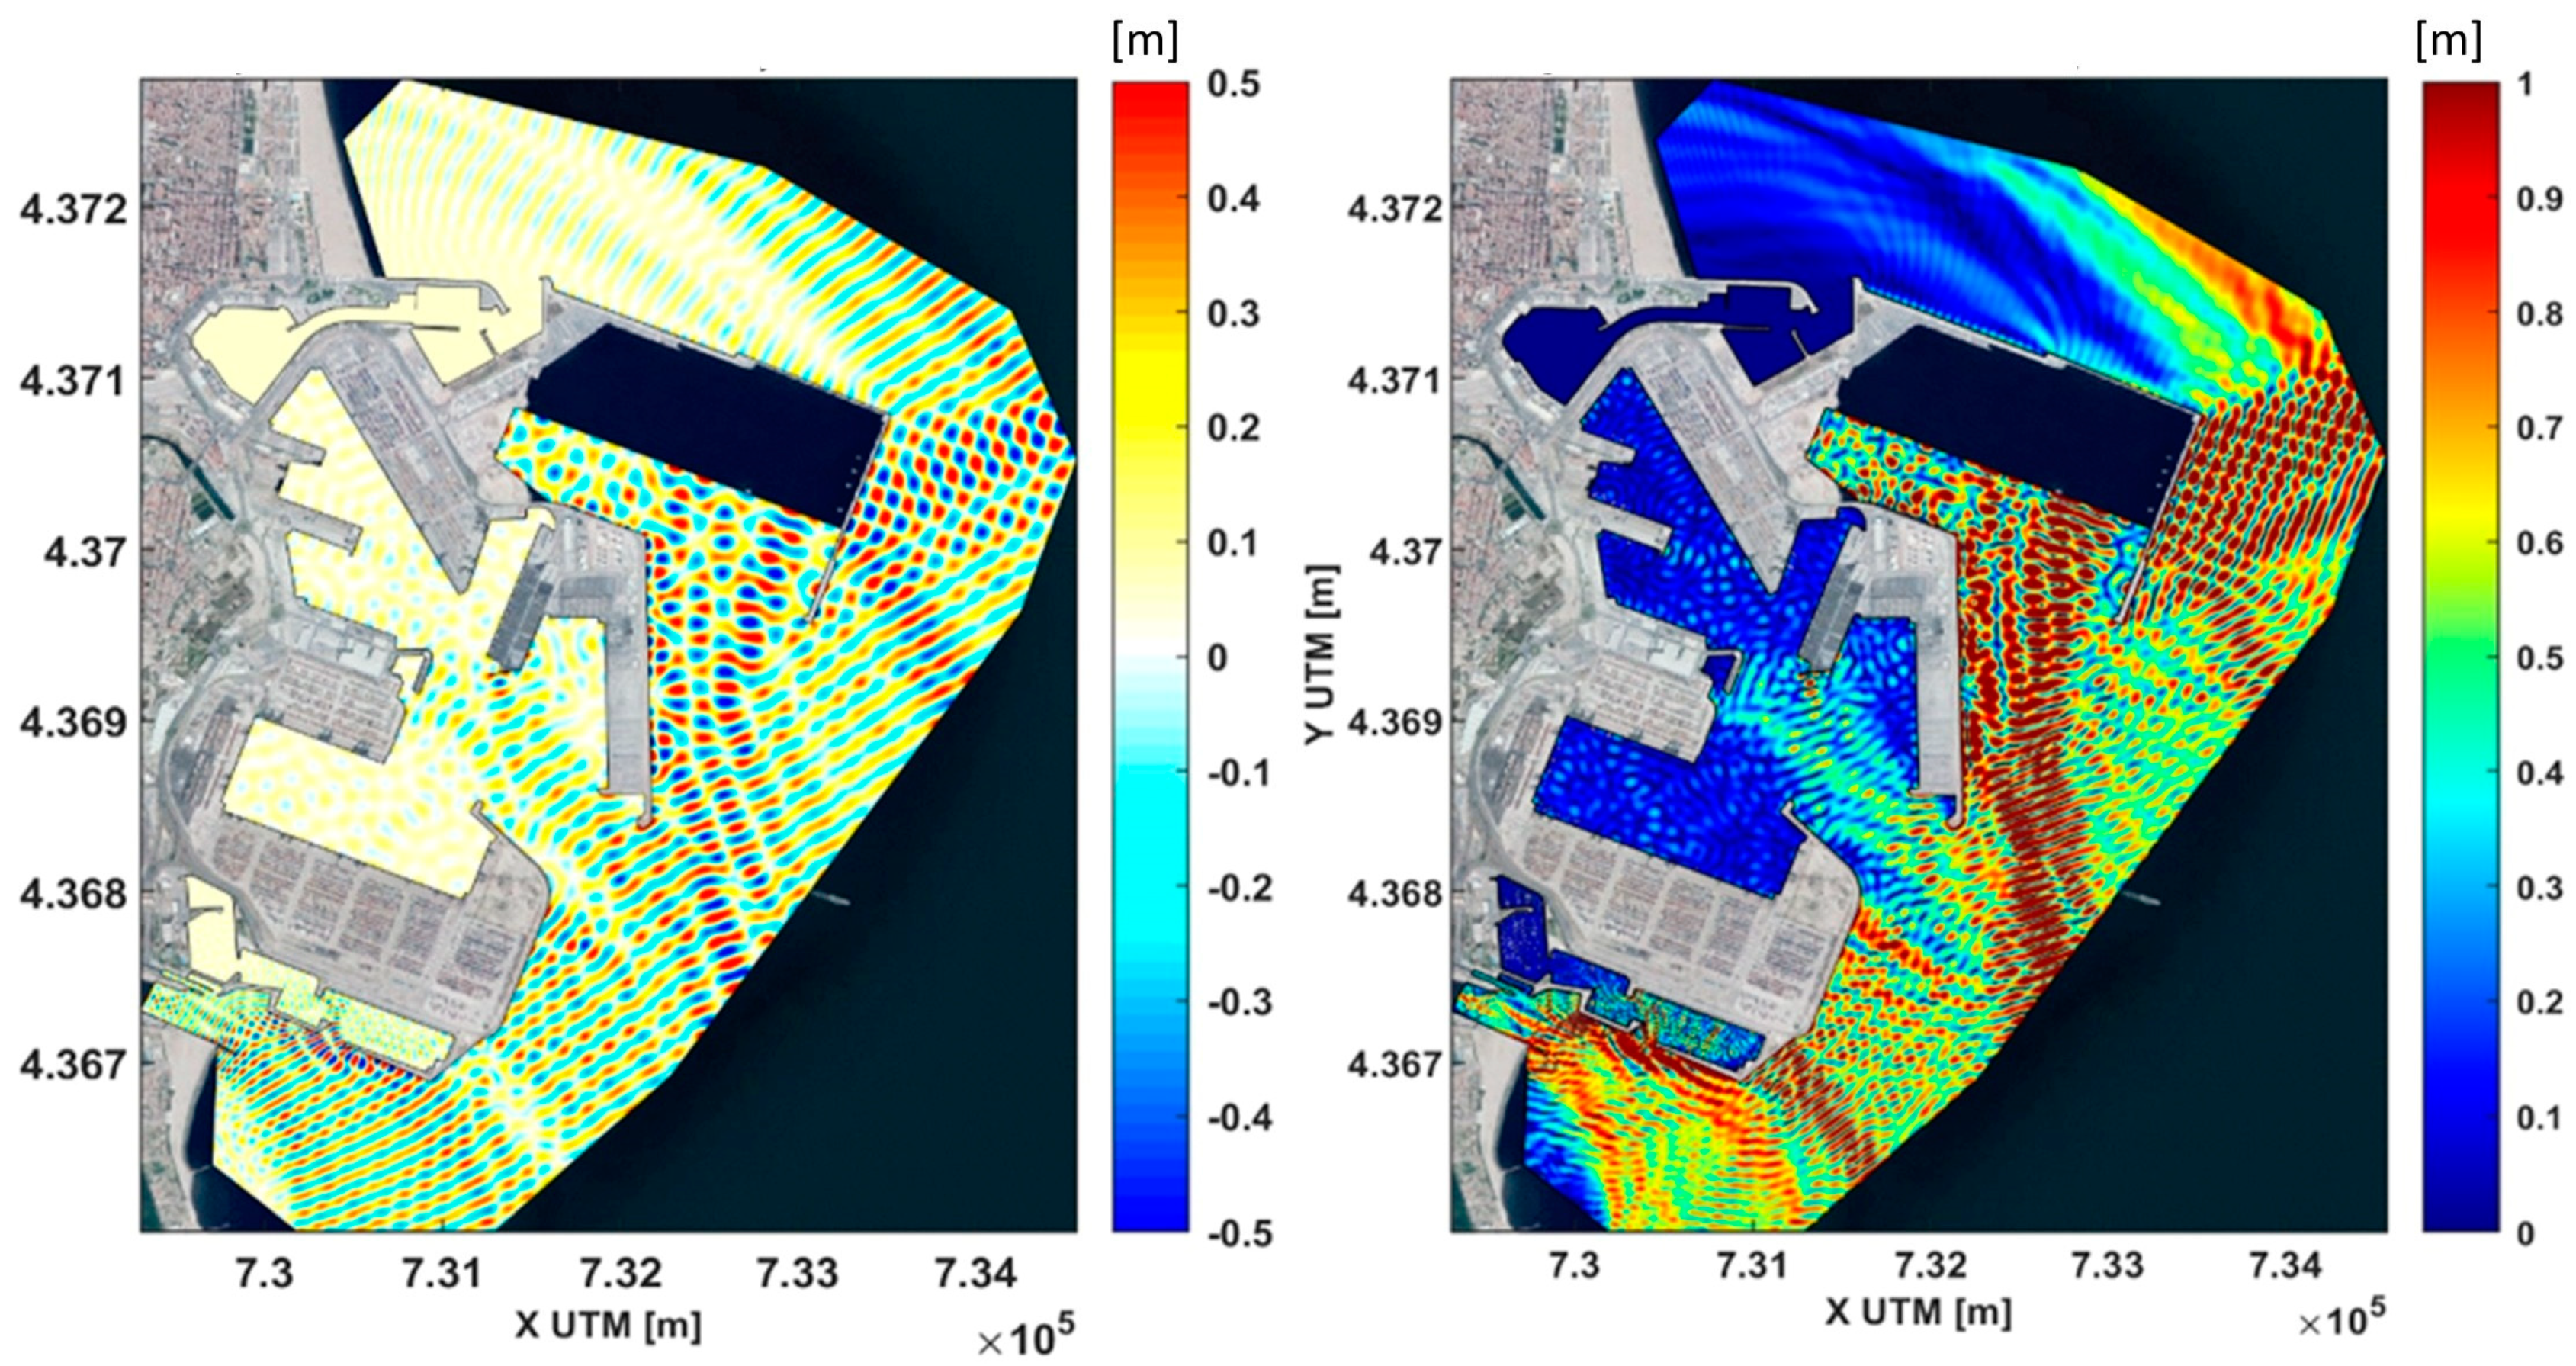
4.6. Model Runs and General Results

The MSP model is run on the Linux system, allowing simulations to be conducted at the IHCantabria Supercomputing and Information Technologies Laboratory. This significantly alleviates the computational burden of the project. Specifically, the NEPTUNO node within the ALTAMIRA node of the University of Cantabria is employed, part of the Spanish Supercomputing Network. This node features 1296 cores, 100 TB of storage, and 5 TB of RAM. Thanks to this supercomputing infrastructure, a monochromatic wave strategy can be expedited significantly, as it can be divided among different processors, thereby parallelizing the executions. For example, for a large port such as the Port of Valencia, with 528 monochromatic waves to be executed (with 3 repetitions based on tidal levels, reaching 1584 monochromatic waves), the overall execution time can be reduced to a maximum of 3 days. This capability provided by the IHCantabria infrastructure is advantageous for any repetition of catalogues (geometry changes, validation and calibration work, etc.) typically carried out in the pre-numerical assembly phase of each port (see Figure 5). Iterations (repetitions) are crucial during this phase to provide ultimate reliability to the operational agitation system. The results of each propagated case for each tidal level are stored in a general hypermatrix for each port, containing significant wave height (Hm0), peak wave period (Tp), and wave energy potential (Pw) at every location within the entire numerical domain, for all of the monochromatic runs and water levels. These catalogues of monochromatic waves will be used to reconstruct the spectra predicted by SAPO and obtain the spectral map of Hs across the entire domain. These pre-run agitation catalogues were provided to the client in Python 3.5 format for direct implementation into their operations and Environmental Management Dashboard (CMA). Additionally, analogous matrices are generated for the free surface and phase, which will be used for the directional wave decomposition of each variable related to waves and energy potential.

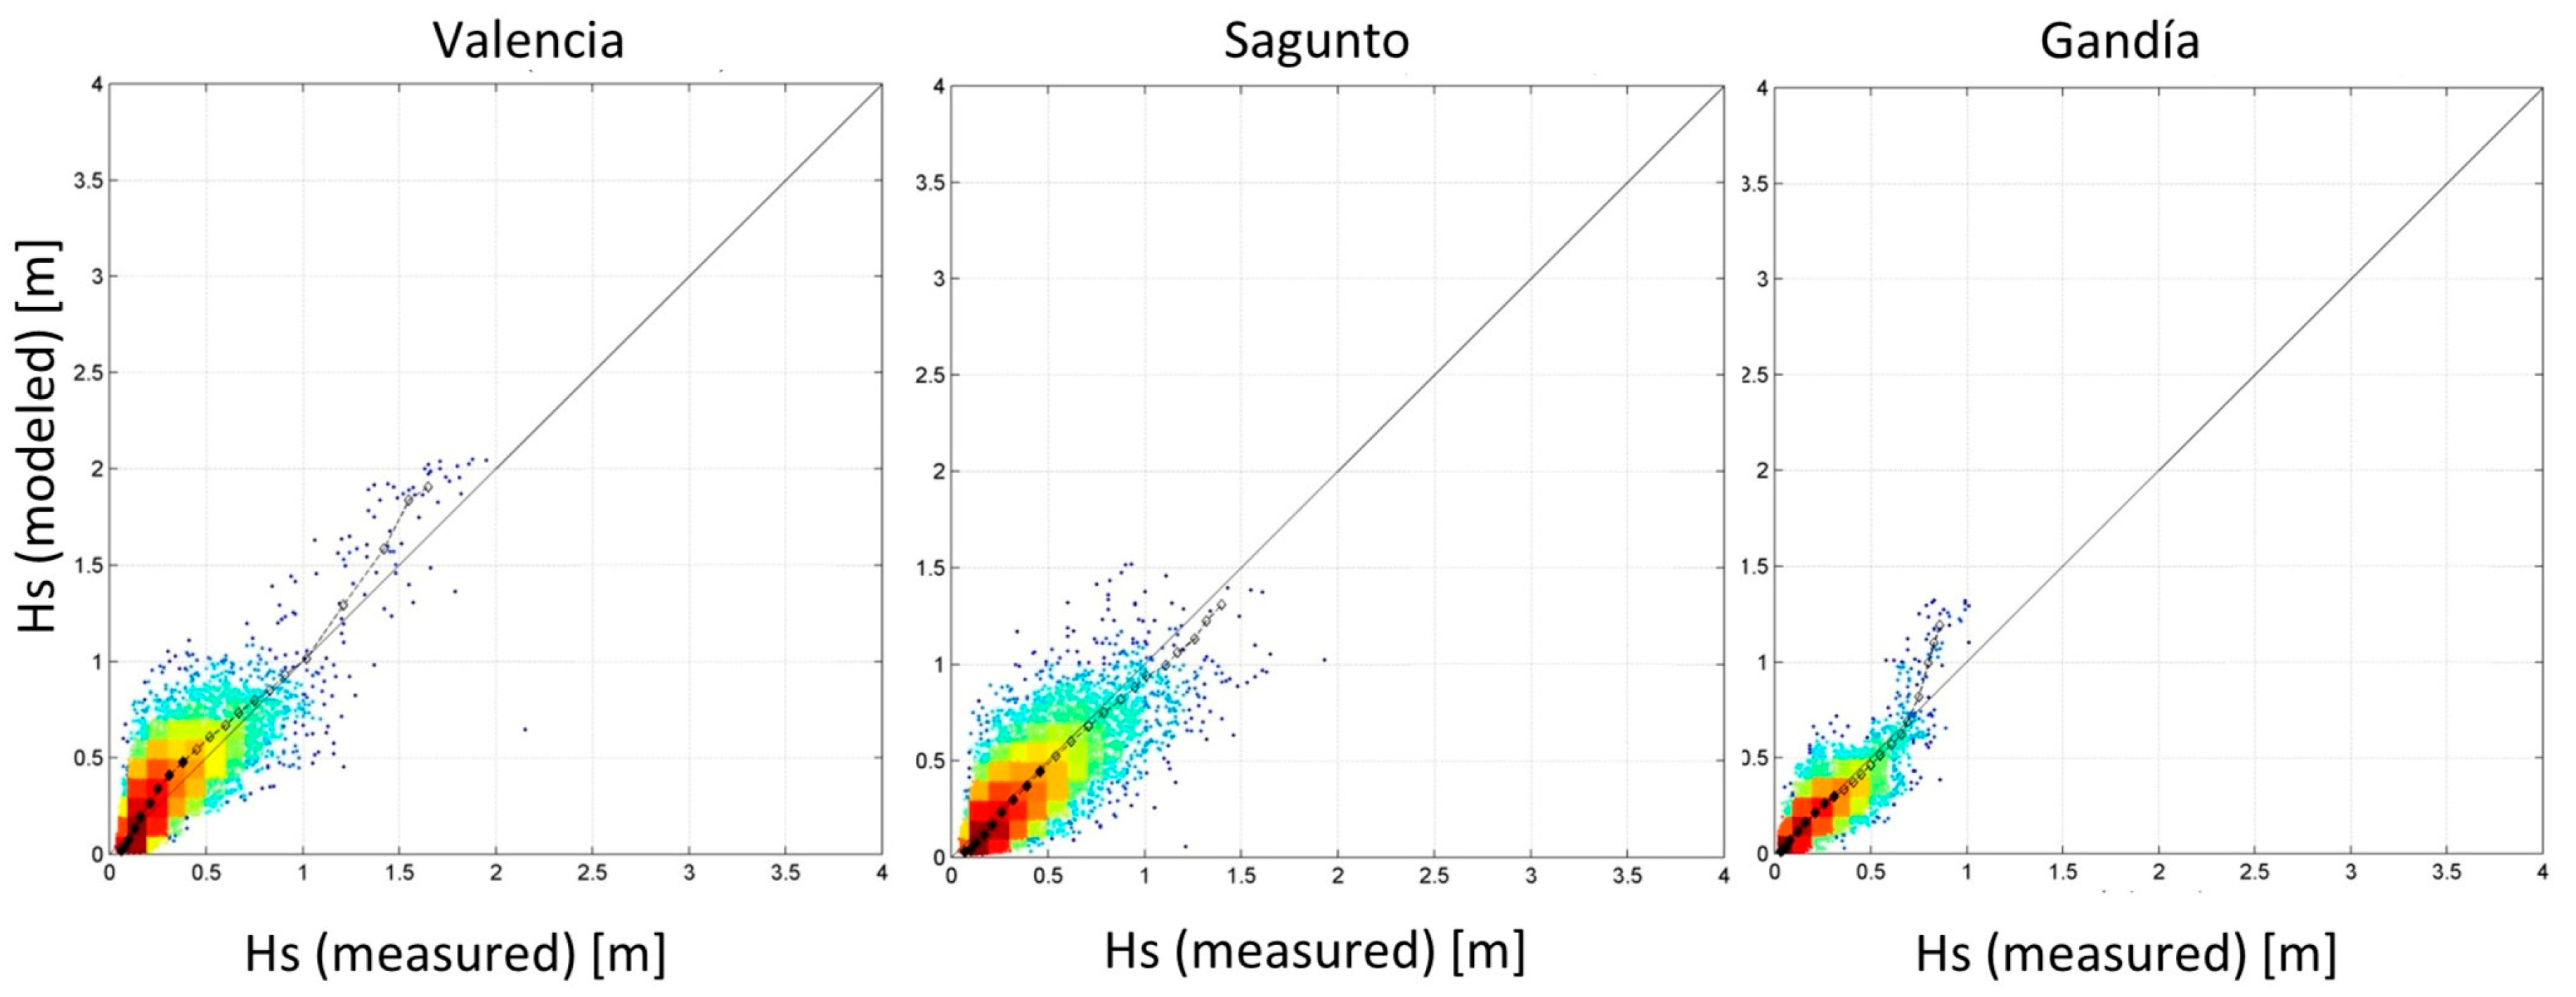
4.7. Pre-Operational Validation and System Calibration

Using the spectral reconstruction codes, the system underwent pre-operational validation and, if necessary, calibration. The purpose was to assess the quality of the results produced by the developed wave and agitation operational system at each port before its implementation by Puertos del Estado. To accomplish this, the developed codes were executed on dates when coincident wave data were available at the study port (SAPO system input for the MSP model, to be provided by Puertos del Estado), along with in situ instrumental data from coastal buoys and radar tide gauges operated by Puertos del Estado. The goals of this validation process were twofold: (a) to understand the functionality of the numerical wave propagation and port agitation system, the discrepancies it introduces compared to reality, and potential errors that might arise, and (b) to recalibrate the results within the generated MSP numerical grids. If necessary, this recalibration aimed to refine the initially considered reflection coefficients (an iterative process). The numerical system was validated using standard statistical indicators (see Table 2)—BIAS, RMSE, SI, CORR, and R2—by comparing instrumental measurements and numerical predictions (see Figure 6), which provide a clear visualisation of the model’s performance and accuracy. This task quantified the predictive capability of the agitation model and concurrently identify weaknesses that contribute to divergent predictions, potential errors in the numerical setup, or disparities in the bathymetric and geometric information of each port compared to the physical reality of the problem.

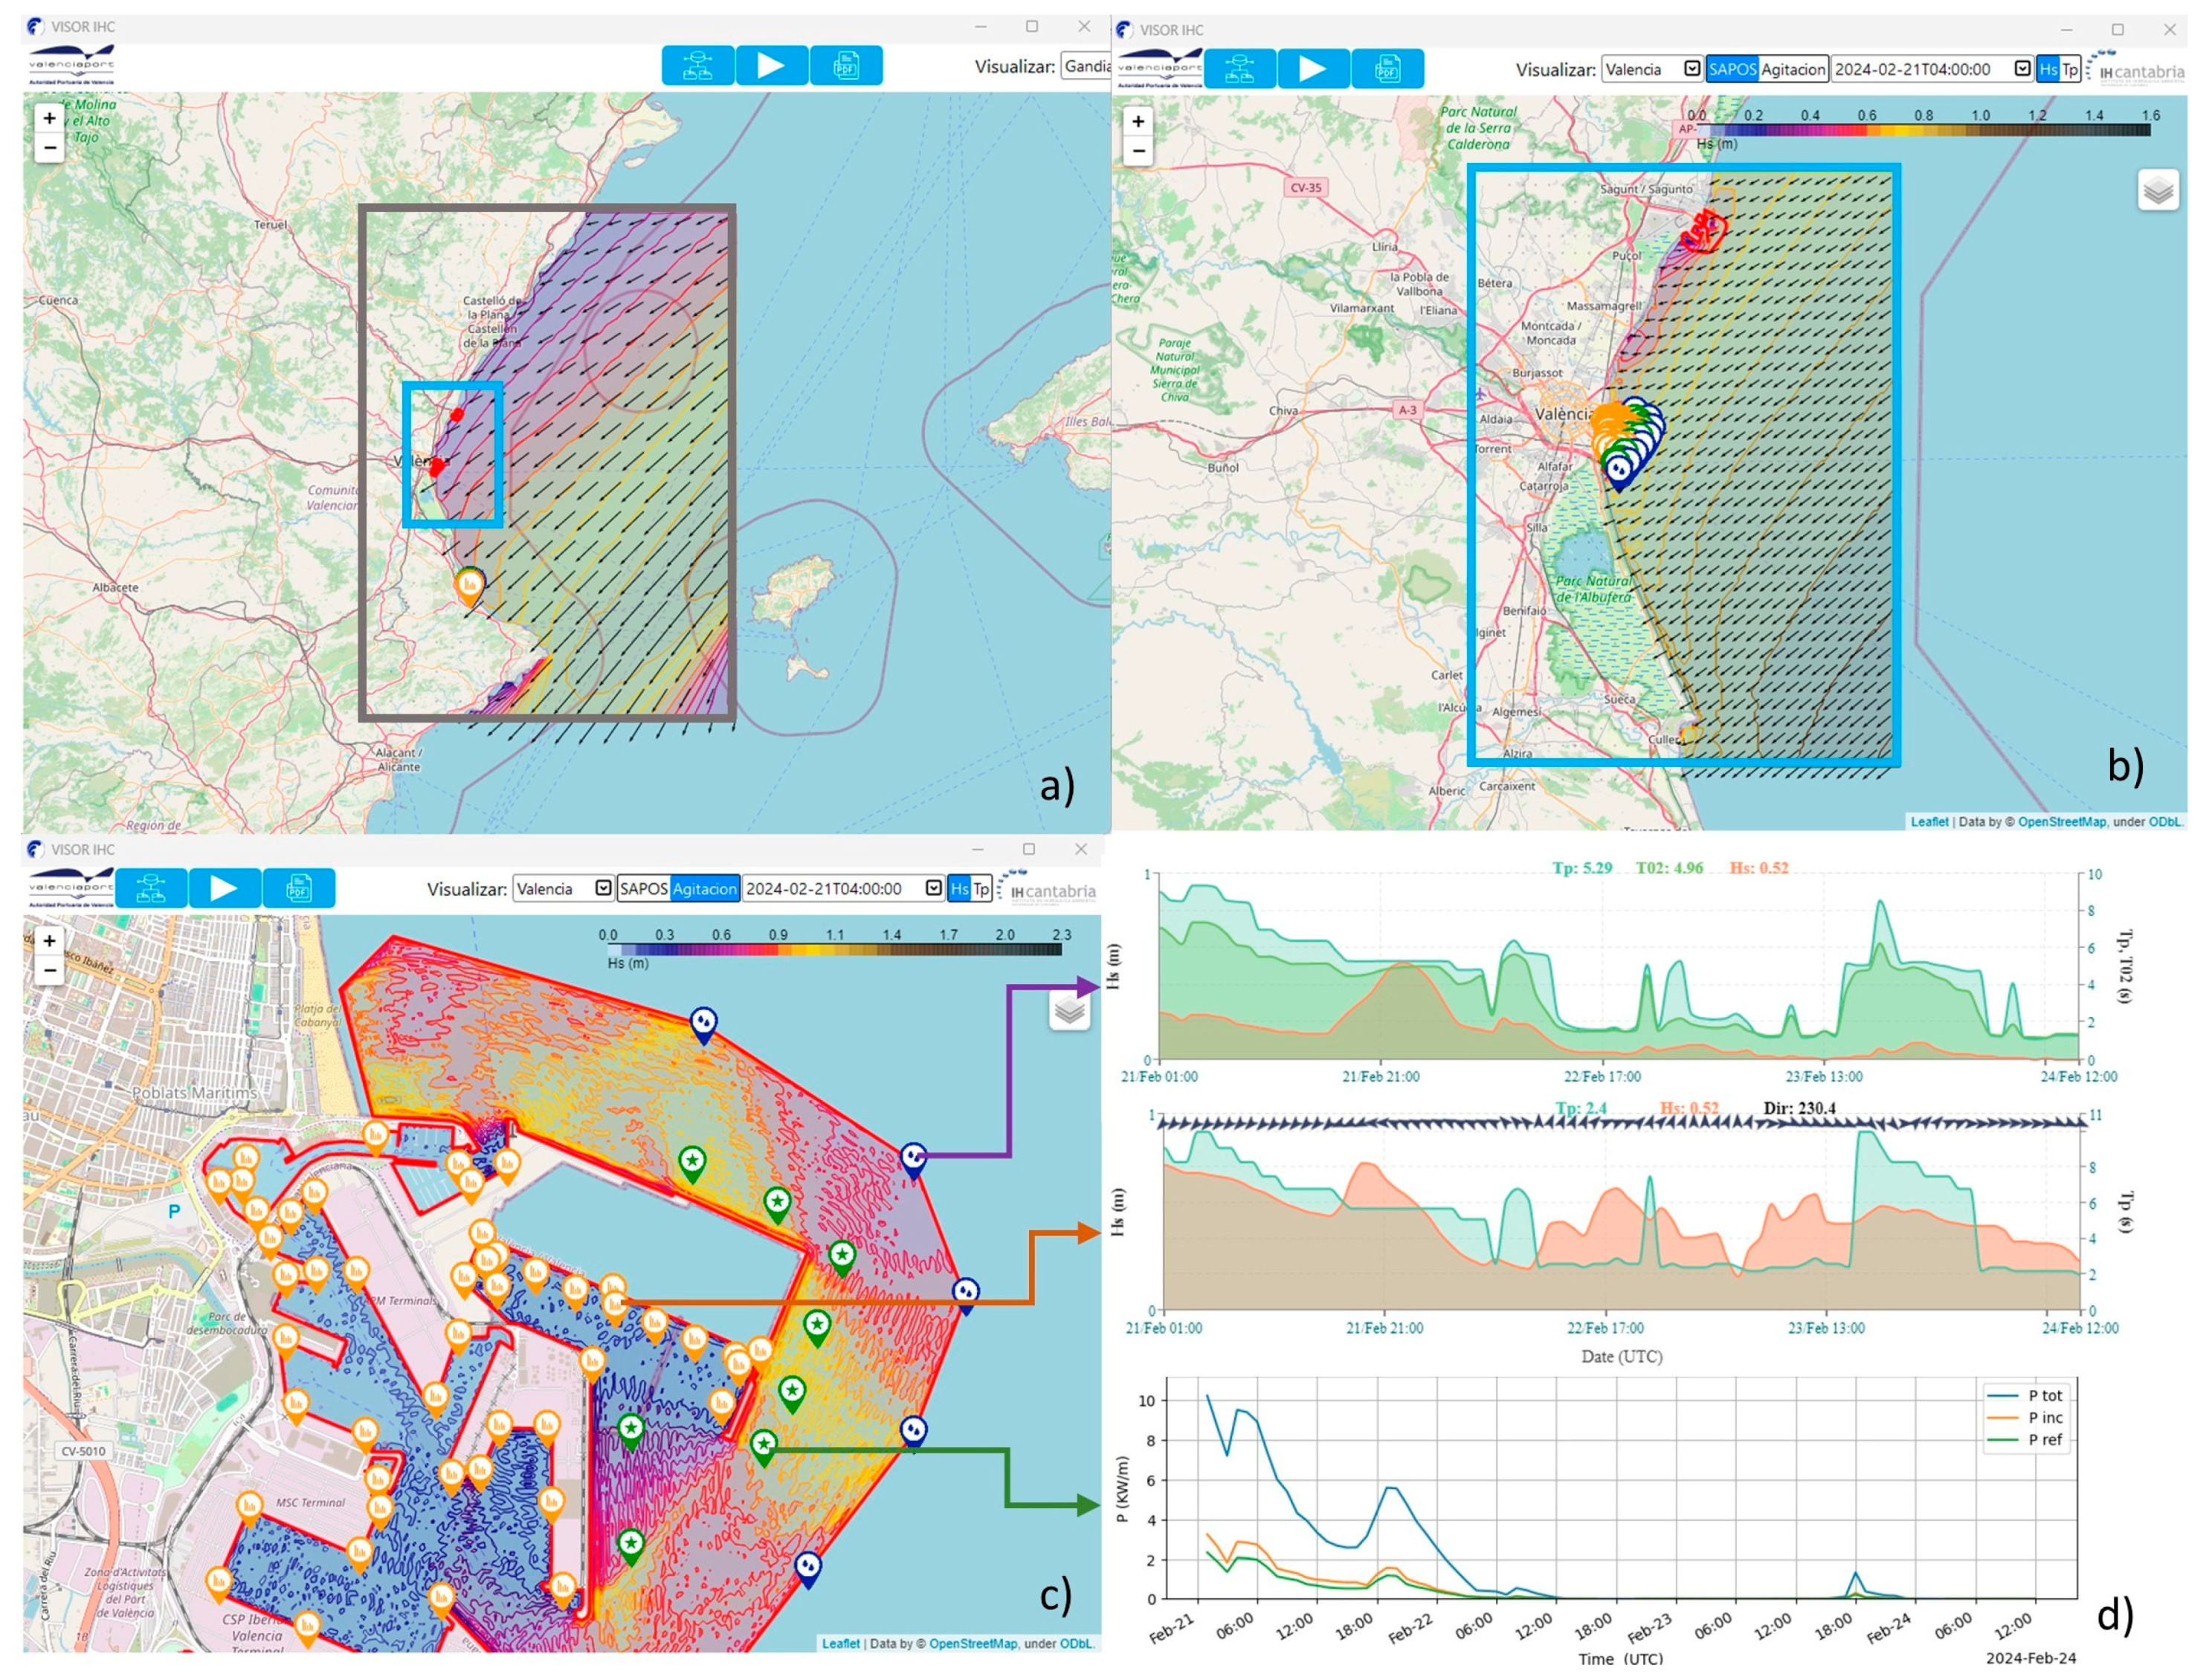
4.8. Post-Processing

The system was included within a web-based graphical user interface (GUI), capable of providing the following visualisations: i. hourly agitation prediction maps for the next 72 h for Hs; ii. hourly time series of Hs, Tp, and Pw at specific points of interest (pre-selected and agreed upon with APV for each study port); iii. Ocean-meteorological prediction reports featuring agitation maps across the port domain and time series of Hs, Tp, and Pw at points of interest; iv. directional wave disaggregation; and v. the generation of hourly energy potential maps covering a minimum of one year (see Figure 7).
For the calculation of directional energy potential (Pw), the method employs a sea state represented hourly by its directional energy spectrum S(ω,θ), which represents the temporal energy flux given by the following expression, integrating the energy fluxes from all components of the spectrum:
P w = ρ g 0 2 π 0 c g ω , z   S ω , θ d ω d θ
c g = c 2 1 + 2 k z s i n h   ( 2 k z )
where
ρ is the density of seawater, ρ = 1025 kg/m3;
g is the acceleration due to gravity, g = 9.81 m/s2;
S(ω,θ) is the directional energy spectrum representing the energy density (energy per unit area) assigned to each frequency ω and direction θ of the sea state.
Cg(ω,z) is the group celerity representing the propagation velocity of wave energy, calculated by the following:
c is the wave celerity, c = L/T = ω/k;
ω is the angular frequency of the wave, ω = 2π/T;
k is the wave number, k = 2π/L;
T is the wave period;
L is the wavelength;
z is the water depth (positive distance from the surface to the seabed).
Angular frequency, wave number, and depth are related by the dispersion relation:
ω 2 = g k   t a n h   ( k z )
In cases where the directional spectrum of the sea state is unavailable, wave power can be determined using spectral parameters representative of the sea state (obtained directly through the spectral reconstruction method developed by IHCantabria and implemented in Puertos del Estado’s operations), as follows:
P w = 1 8 ρ g   H m 0 2 c g ω , z
where the moment of order n of the energy spectrum is as follows:
m   n = 0 2 π 0 ω n S ω , θ   d ω d θ ;     n = 0 ,   1 ,   2 ,

5. Conclusions and Future Perspectives

The growing imperative to decarbonize maritime transport and port operations necessitates innovative solutions integrating renewable energy sources with predictive meteorological modelling. This study presents a model-based approach to assessing marine energy potential within and around port service areas, offering a pathway for sustainable energy integration. The conclusions drawn from this research highlight the relevance of advanced computational modelling and data-driven methodologies in evaluating the feasibility of marine renewable energy infrastructure.

5.1. Integration of Marine Renewable Energy in Port Operations

Ports must diversify energy sources by deploying offshore renewables (e.g., wave and wind) to reduce fossil fuel dependence. Predictive modelling (e.g., MSP) enables optimal placement and mitigates energy variability. Implementing such systems within port service areas provides a dual advantage: reducing dependency on fossil fuels and ensuring a stable, sustainable energy supply tailored to port operational demands. By leveraging meteorological and oceanographic modelling, ports can optimize the placement and efficiency of renewable energy installations, mitigating the inherent variability of marine energy sources.
Weather and ocean forecasting models facilitate the investments needed to guarantee the energy supply that ports will need in order to achieve the objective of decarbonisation.

5.2. The Role of Predictive Modelling in Enhancing Energy Feasibility Assessments

The methodology employed in this study illustrates how numerical modelling enhances the accuracy and reliability of marine energy assessments and ensures robust feasibility studies. Met-ocean forecasting tools, such as the MSP port agitation model, allow for a detailed evaluation of wave-induced energy potential while considering real-time climatic conditions. This approach bridges the gap between theoretical energy estimates and practical implementation, ensuring that renewable energy projects are both technically and economically viable.
Additionally, integrating high-resolution bathymetric data, port contour configurations, and instrumental observations into the numerical modelling framework significantly enhances the predictive capabilities of wave energy assessments. The validation process using real-world data ensures that the model outputs align closely with actual wave dynamics, strengthening the decision-making process for renewable energy deployment.

5.3. Implications for Port Sustainability and Energy Sovereignty

The transition towards sustainable port operations aligns with global climate objectives and regulatory mandates, such as those set forth by the International Maritime Organization (IMO) and the European Union’s Fit for 55 initiatives. By adopting marine renewable energy solutions, ports can play a pivotal role in reducing maritime sector emissions and advancing the broader energy transition.
Applying wave and tidal energy converters, as well as floating photovoltaic and floating wind power generation systems, among other renewable energy technologies, in port service areas represents a tangible opportunity for ports to achieve energy sovereignty. As energy demand in ports continues to increase due to electrification initiatives and the growing adoption of shore-side electricity (SSE) power systems, marine renewables can serve as a complementary and decentralised energy source. This not only reduces dependence on external power grids, but it also improves the resilience of port energy infrastructures to market fluctuations and supply chain disruptions.

5.4. Future Directions and Research Opportunities

Several avenues for future research emerge from this study, namely the following:
  • Refine small-scale hydrodynamic modelling;
  • Explore hybrid systems (wind + wave + solar);
  • Assess socio-economic feasibility of marine energy technologies.
Future research should investigate the economic feasibility of different marine energy technologies, considering installation costs, maintenance requirements, and long-term operational benefits. Furthermore, policy frameworks and financial incentives tailored to promote renewable energy adoption in ports must be analysed to support the large-scale implementation of sustainable energy solutions. Regulations for consenting processes must be streamlined to improve efficiency.
As an example of the direct application of the methodology described in this article, it is worth noting that it has been applied in the preliminary feasibility studies for the implementation of two pilot actions in the ports of Sagunto and Valencia. These pilot projects, funded by IDAE (Spanish Institute for Diversification and Energy Saving) under the Next Generation Programme (Renmarinas Demos Initiative), aim to demonstrate the feasibility of integrating marine renewable energy into port infrastructure.
The first pilot project involves the deployment of a wave energy converter (WEC) in the Port of Sagunto. This device, with an estimated capacity of 270 kW, will harness the kinetic and potential energy of ocean waves to generate electricity. The WEC selected for this case study is designed to operate in nearshore conditions, with a focus on modularity, the ease of maintenance, and environmental integration. The system is particularly relevant for ports with moderate to high wave energy potential, and its performance will help inform the broader application of wave energy in port infrastructures.
The second pilot project is a 1 MW floating photovoltaic platform (Floating PV-BOS) to be installed in the Port of Valencia. This system consists of photovoltaic panels mounted on buoyant structures designed to float on water surfaces within the port. The platform aims to make use of underutilized water areas in the port basin while avoiding land-use conflicts. In addition to clean energy generation, the floating system offers secondary benefits such as reduced water evaporation and improved panel efficiency due to the cooling effect of the water body. Its integration into port energy systems is expected to demonstrate a scalable, replicable model for other ports aiming to increase renewable energy uptake without significant land requirements.
Together, these two pilot devices provide a concrete context for the future implementation of the methodology and demonstrate its ability to evaluate different renewable technologies under port-specific environmental and operational conditions.

5.5. Final Considerations

This study demonstrates that ports possess significant potential for integrating marine renewable energy into their operations. Advanced numerical modelling and predictive weather forecasting systems enable precise evaluations of energy potential, facilitating informed decision-making. As ports worldwide seek to align with sustainability targets and enhance energy security, the methodologies presented in this research offer a valuable framework for guiding future developments in marine renewable energy deployment.
Achieving a sustainable maritime sector requires a holistic approach combining technological innovation, regulatory compliance, and collaborative industry efforts. By promoting interdisciplinary research and engaging stakeholders across the maritime and energy sectors, the vision of self-sufficient, decarbonized ports can become a reality.

Author Contributions

R.C.: Conceptualization, Methodology, Investigation, Data curation, Resources, Formal analysis, Funding acquisition, and Writing—Original draft preparation; G.D.-H.: Conceptualization, Methodology, Investigation, Resources, Supervision, and Writing—Critical review; R.M.-S.: Conceptualization, Methodology, Investigation, Resources, and Writing—Critical review. All authors have read and agreed to the published version of the manuscript.

Funding

The “Model-based weather forecasting systems for validation of areas for marine energy deployment in port service areas” project has been co-financed by the European Union through the Interreg Sudoe program, under grant number SOE/P4/E0960.

Institutional Review Board Statement

Not applicable.

Informed Consent Statement

Not applicable.

Data Availability Statement

The raw data supporting the conclusions of this article will be made available by the authors on request.

Acknowledgments

The authors would like to express their sincere gratitude to the Port Authority of Valencia for their valuable support, for providing key initial data, and for sharing their vision and interest in this research. Their collaboration and commitment have been instrumental in the development of this study.

Conflicts of Interest

The authors declare no conflicts of interest.

References

  1. United Nations Conference on Trade and Development (UNCTAD). Review of Maritime Transport 2022. 2022. Available online: https://unctad.org (accessed on 26 January 2025).
  2. International Maritime Organization (IMO). Fourth IMO GHG Study 2020. 2020. Available online: https://www.imo.org (accessed on 26 January 2025).
  3. European Community Shipowners’ Associations (ECSA). Decarbonization Pathways for Maritime Transport. 2021. Available online: https://www.ecsa.eu (accessed on 26 January 2025).
  4. Port of Rotterdam. Shore Power Projects for Sustainable Shipping. 2023. Available online: https://www.portofrotterdam.com (accessed on 26 January 2025).
  5. European Commission. Fit for 55: Delivering the EU’s 2030 Climate Target on the Way to Climate Neutrality. 2021. Available online: https://eur-lex.europa.eu/legal-content/EN/TXT/HTML/?uri=CELEX:52021DC0550 (accessed on 26 January 2025).
  6. Available online: https://www.offshorewind.biz/2023/07/07/port-of-esbjerg-lines-up-eur-780-million-investment-in-offshore-wind-turbine-production-facilities (accessed on 17 March 2025).
  7. Pérez-Collazo, C.; Greaves, D.; Iglesias, G. A review of combined wave and off-shore wind energy. Renew. Sustain. Energy Rev. 2015, 42, 141–153. [Google Scholar] [CrossRef]
  8. Li, L.; Zhong, M.; Ma, X.; Zhao, H.; Safdar, M.; Chuwang, D.D.; Zhang, Z. Optimal planning of renewable energy infrastructure for ports under multiple design scenarios considering system constraints and growing transport demand. J. Clean. Prod. 2024, 477, 143827. [Google Scholar] [CrossRef]
  9. Hassan, G. Offshore Wind Resource Assessment Techniques. 2020. Available online: https://www.dnv.com (accessed on 26 January 2025).
  10. World Meteorological Organization (WMO). Advances in Numerical Weather Prediction for Ports. 2022. Available online: https://public.wmo.int (accessed on 26 January 2025).
  11. Informe de Emisiones de Gases de Efecto Invernadero del Puerto de Valencia. Año 2016. Available online: https://www.valenciaport.com/wp-content/uploads/Memoria-Verificaci%C3%B3n-GEI-2016.pdf (accessed on 3 March 2025).
  12. Kovalishin, P.; Nikitakos, N.; Boris Svilicic, B.; Zhang, J.; Nikishin, A.; Dalaklis, D.; Kharitonov, M.; Stefanakou, A. Using Artificial Intelligence (AI) methods for effectively responding to climate change at marine ports. J. Int. Marit. Saf. Environ. Aff. Shipp. 2023, 7, 2186589. [Google Scholar] [CrossRef]
  13. European Parliament. Alternative Fuels Infrastructure Regulation (AFIR). 2023. Available online: https://www.europarl.europa.eu (accessed on 28 January 2025).
  14. International Maritime Organization. Available online: https://www.imo.org/en/MediaCentre/PressBriefings/pages/IMO-approves-netzero-regulations.aspx (accessed on 25 April 2025).
  15. European Commission. Extension of the EU Emissions Trading System to Maritime Transport. 2022. Available online: https://ec.europa.eu (accessed on 28 January 2025).
  16. Port of Rotterdam. Hydrogen and LNG Bunkering Facilities. 2023. Available online: https://www.portofrotterdam.com (accessed on 28 January 2025).
  17. DNV. Maritime Forecast to 2050: Energy Transition Outlook. 2022. Available online: https://www.dnv.com/publications/maritime-forecast-to-2050-2022-edition-235251/ (accessed on 28 January 2025).
  18. European Sea Ports Organisation. Sustainable Ports in Europe: Shore-Side Electricity. 2022. Available online: https://www.espo.be (accessed on 28 January 2025).
  19. WindEurope. Floating Offshore Wind Farms: Opportunities for Ports. 2023. Available online: https://windeurope.org (accessed on 28 January 2025).
  20. Puertos del Estado. (n.d.). Red de Boyas: Información Meteorológica y Oceanográfica. Available online: https://www.puertos.es (accessed on 28 January 2025).
  21. Diaz-Hernandez, G.; Fernández, B.R.; Romano-Moreno, E.; Lara, J.L. An improved model for fast and reliable harbour wave agitation assessment. Coast. Eng. 2021, 170, 104011. [Google Scholar] [CrossRef]
  22. Vílchez, M.; Clavero, M.; Losada, M.A. Operational behaviour of a 2D breakwater: Synthesis and design performance curves. In Report EM 200; Instituto Interuniversitario de Investigación del Sistema Tierra en Andalucía. Sede CEAMA. Universidad de Granada: Granada, Spain, 2015. [Google Scholar]
  23. Vílchez, M.; Clavero, M.; Losada, M.A. Hydraulic performance of different non-overtopped breakwaters types under 2D wave attack. Coast. Eng. 2016, 107, 34–52. [Google Scholar] [CrossRef]
Figure 1. Schematic diagram of marine port power supply system microgrid concept taken from [12].
Applsci 15 04948 g001
Figure 2. Valencia, Sagunto, and Gandía ports’ numerical domain and outer forcing locations along with numerical domain and bathymetry definition. The numbers in each image indicate the identification of the control points chosen in the model (a) Port of Valencia; (b) Port of Sagunto; (c) Port of Gandía.
Applsci 15 04948 g002
Figure 3. An example of wave-reflection coefficients (Kr) vs. individual/incident wave period (T) for two different breakwater typologies/sections at Valencia Port (a) Breakwater section of the north basin; (b) Breakwater section south of the harbour entrance channel.
Applsci 15 04948 g003
Figure 4. Example (zoom) of the triangular and depth-adaptive mesh used for the MSP model runs at Valencia Port.
Applsci 15 04948 g004
Figure 5. An example of one monochromatic wave run at Valencia Port. Free surface (left panel) and wave height (right panel), for a H = 0.25 m, T = 11 s, and Dir = 150° N.
Applsci 15 04948 g005
Figure 6. Hs scatter plot for data measured vs. modelled at Valencia Port (Ports of Valencia, Sagunto and Gandía).
Applsci 15 04948 g006
Figure 7. Valencia Port GUI example for (a) regional wave downscaling, (b) local wave propagation, (c) high-resolution agitation, and (d) wave forcing, wave agitation, and (total, incident, and reflected) wave potential energy forecast.
Applsci 15 04948 g007
Table 1. Port activities’ classification.
LevelName of Activity
1Business-Oriented Activities (Managed by Concessionaires)
1.1.Passenger Terminals
1.2.Cargo Terminals:
1.2.1Ro-Ro and Vehicle Terminals
1.2.2.Container Terminals
1.2.3.Multipurpose Terminals
1.2.4.Bulk Terminals
1.2.5.Petroleum and Chemical Terminals (Dangerous cargo)
1.3.Private Services:
1.3.1.Storage of Cargo
1.3.2.Repair of Ships and Shipyards
1.3.3Supply to Ships
1.3.4.Nautical Services
1.3.5.Hospitality Services
2.Service-Oriented Activities (Managed by the Port Authority)
2.1.Infrastructure
2.1.1.Maintenance and Construction/Road Lighting
2.2.Port Services:
2.2.1.Pilots
2.2.2.Tugs
2.2.3.Mooring services
2.3.Administrative and Community Services:
3.Other activities
Table 2. Post-validation statistical values for Hs validation for Valencia, Sagunto y Gandía.
Port# of HoursBIASRMSESICORRR2
Valencia26,9620.0350.1220.5550.810.637
Sagunto26,879−0.0390.1260.4650.820.667
Gandía26,745−0.0100.0650.4000.880.778
Disclaimer/Publisher’s Note: The statements, opinions and data contained in all publications are solely those of the individual author(s) and contributor(s) and not of MDPI and/or the editor(s). MDPI and/or the editor(s) disclaim responsibility for any injury to people or property resulting from any ideas, methods, instructions or products referred to in the content.

