1. Introduction
With the rapid development of the economy, the demand for road transportation has surged, accompanied by swift road network expansion. China’s highway network, for instance, has grown from 85,000 km in 2011 to 183,600 km in 2023, forming a large-scale and increasingly complex network. This expanding infrastructure has provided a solid foundation for diverse travel modes [
1]. As the primary medium for conveying critical road information, highway guide signs are essential in minimizing driver errors and reducing risks. However, statistics reveal that accidents involving traffic signs and markings constitute 60% of all traffic accidents, underscoring how inadequate or inaccurate signage can substantially elevate driving hazards [
2]. For instance, missing or unclear signs may lead drivers to miss exits or fail to anticipate sharp curves. Therefore, optimizing the design and placement of highway guide signs is an important issue in current road traffic management [
3,
4]. With the further expansion of the highway network, the opening of new or extended highways has altered driving routes, requiring timely adjustments to guide signs along the routes to ensure the continuity of network information. In densely connected highway networks, guide signs not only need to direct drivers to single destinations but also provide multi-level information to prevent missed exits or incorrect turns. These demands place higher requirements on the design and setup of signage [
5,
6]. Therefore, it is essential to establish a scientific evaluation method and indicator system to comprehensively analyze the effectiveness of these adjustments.
Existing research on the evaluation of traffic signs primarily focuses on the impact of design elements, information load thresholds, and driver characteristics on the effectiveness of traffic sign usage, as well as the methods used to assess traffic sign systems. Studies on design elements often emphasize how features such as color, font size, shape, and contrast influence the visibility and comprehension speed of drivers [
7,
8,
9]. Researchers assess the effectiveness of these elements under various conditions, including low light, poor weather, and complex road environments [
10,
11]. Liu et al. [
12], applying human ergonomics principles, developed an evaluation model encompassing information needs, comprehension, and information load. In terms of setting information thresholds, studies show that excessive information can increase drivers’ visual load, potentially leading to adverse driving behaviors and even causing traffic accidents [
13,
14,
15,
16]. Lv et al. [
17] demonstrated through experiments that traffic signs with varying amounts of information significantly affect driving load. Chang et al. [
18] observed a significant reduction in legible reading distance as the information load on variable message signs increased. Notably, when the number of messages reached six, drivers’ comprehension accuracy declined sharply. Ren et al. [
19] studied the effectiveness of bilingual guide signs (in Chinese and English) for drivers with different language backgrounds on Chinese highways. Yang et al. [
20] noted that cantilever signs can accommodate up to five pieces of information, while gantry signs can hold up to nine.
Different characteristics, such as age and education, also influence the visibility and comprehension of traffic signs [
21,
22,
23,
24]. Taheri et al. [
25] investigated the effect of personal characteristics and traffic sign design on traffic sign usability and found that four of the five personal characteristics studied (e.g., age, education level, and driving experience) correlated significantly with traffic sign usability. Taamneh et al. [
26] examined the relationship between drivers’ personal characteristics and their familiarity with and comprehension of traffic signs. In research on the effectiveness evaluation of traffic signs, scholars have approached the topic from multiple perspectives, employing a variety of methods for analysis and assessment [
27,
28,
29]. Wang [
30] developed an evaluation system for traffic safety facilities by examining their impact on drivers and vehicles, incorporating indicators such as speed and driving trajectories into the framework. Yao et al. [
31] developed the guide sign evaluation method to assess the effectiveness of traffic signs through simulation experiments and applied it to the evaluation of traffic signs at intersections. Li et al. [
32] evaluated and classified interchange diagrammatic guide sign complexity, proposing a theoretical framework for quantitative assessment that offers valuable insights for traffic sign design and application.
In summary, existing research has made significant progress in areas such as the layout design of traffic signs, information load control, driver characteristics, and evaluation methods. Studies have shown that design elements (e.g., color, font size, contrast, and layout) significantly impact drivers’ visibility and comprehension speed, while reasonable control of information load helps prevent information overload and reduces drivers’ cognitive burden. Moreover, research indicates that drivers’ personal characteristics (e.g., age, experience, and educational background) strongly affect their ability to recognize and understand sign information, suggesting that sign design should accommodate the needs of diverse groups. However, with the continuous expansion of the highway network and increasing complexity of road structures, traditional sign design and evaluation methods face new challenges: (1) Delayed information updates: New or expanded highways often alter travel routes, but signage on certain sections may not be updated promptly, leading to misjudgments by drivers. (2) Increasingly complex information hierarchies: In dense road networks, signs must provide multi-level route guidance to ensure drivers can accurately select directions at complex interchanges. (3) Lack of standardization and consistency: Inconsistencies in information delivery, layout specifications, and continuity among regional signage systems undermine the navigation experience for drivers. (4) Insufficient comprehensive evaluation systems: Existing studies tend to focus on individual design elements or specific case analyses, lacking systematic evaluation models for complex networks.
Given these challenges, this study proposes a comprehensive evaluation framework synthesizing insights from driver behavioral analytics, cognitive science principles, and traffic engineering methodologies. By integrating subjective and objective assessment methods, it contributes to the academic discourse on optimizing traffic signage systems for safety, efficiency, and user experience in complex highway networks.
3. Survey Plan
Guide signs should be designed in accordance with highway and traffic conditions, providing users with information (i.e., destinations, distances, key public facilities, driving directions, etc.) to ensure smooth arrival at their destinations [
39]. However, as the highway network becomes increasingly dense, the guide information has grown more complex, leading to issues such as discontinuity, inconsistency, and non-compliance with standards in some signs. Therefore, it is essential to conduct field investigations to identify the main problems with highway guide signs.
3.1. Survey Design
The goal of this survey is to gather subjective evaluations from highway users about highway guide signs and understand their needs. Additionally, the survey aims to explore specific issues with guide signs from the perspective of regulatory compliance and scientific design, analyzing the needs of travelers regarding these signs. To ensure comprehensive data collection, the selected survey section must include at least five interchanges to capture various potential problems with guide signs. The survey consists of two steps: (a) Questionnaire survey: Gather drivers’ feedback on their experience with guide signs and any identified problems. (b) Field investigation: Based on issues highlighted in the questionnaires, extensive data collection is performed to analyze the guide signs. The goal is to summarize the major problems in the setup of guide signs across China’s highway network.
3.2. Survey Implementation
The survey focuses on the representative section of the Beijing–Shanghai Expressway (G2), covering the Beijing, Tianjin, and Hebei segments. This highway stretches across six provinces and municipalities, including Beijing, Tianjin, Hebei, Shandong, Jiangsu, and Shanghai, with a total length of 1219 km. Through preliminary research, it is known that there are a large number of traffic signs on this highway, and there are different types of problems. As it passes through a dense and complex highway network with diverse information needs, this section offers valuable insights into the challenges faced in highway guide sign systems. The intersections where guide sign data are collected are summarized in
Table 4.
3.2.1. Questionnaire Survey
The questionnaire survey was conducted at highway service areas, targeting four categories of respondents: taxi drivers, private car drivers, bus drivers, and truck drivers, to account for their differing driving preferences. Private car drivers were the focus of this research, as they tend to prioritize convenience and comfort in their travels.
The content of the questionnaire was designed based on an extensive review of relevant literature and consultation with experts in traffic safety and frequent drivers. A draft version of the questionnaire was then subjected to the pilot study phase, which included 25 items. This phase aimed to identify issues such as unclear wording, unreasonable options, and incomplete coverage. Feedback from respondents and expert reviews during this phase guided item modifications and reductions to enhance clarity and relevance. For reliability and validity testing, we employed Cronbach’s alpha as the primary measure of internal consistency, with a threshold value of 0.7, which is commonly accepted as indicating adequate reliability.
The survey was divided into two phases: (1) Pilot survey: This was conducted on a small scale to identify issues such as unclear wording, unreasonable options, and incomplete coverage in the questionnaire. Adjustments were made based on the feedback received. (2) Formal survey: After finalizing the questionnaire content, the formal survey was conducted. Upon collecting the responses, the reliability and validity of the questionnaires were analyzed, leading to the removal of any invalid surveys that contained all identical answers or omitted key questions. While some questionnaires were incomplete, this did not significantly impact the overall reliability and validity, thus they were retained.
3.2.2. On-Site Survey
This survey focused on the design and placement of direction signs, particularly concerning the information needs of drivers seeking their destinations, as well as the selection of sign information and the continuity of directional signs. By combining real-time vehicle photography with GPS positioning, the team collected photos of traffic signs and matched them with road network maps, conducting objective evaluations based on national standards and industry norms to identify major issues in the existing direction sign setups.
The survey team consisted of three members: one driver, one person responsible for photographing signs and collecting data, and one recorder. The survey commenced from a designated starting point, with both the sign imaging collection equipment and GPS positioning devices activated simultaneously as the vehicle traveled along the main highway at normal speeds. Direction signs were thoroughly photographed at the interchanges between highways, and the vehicle turned back at the next exit to gather information from the opposite direction. When the survey vehicle reached the intersection of the highway and a national road, it entered the national road and captured sign information for 2 km in both directions. After reaching the boundary between Hebei and Shandong provinces, the vehicle turned around at the nearest exit and returned along the same route to collect reverse direction sign information.
3.2.3. Data Processing
The data collected from the questionnaires and on-site surveys were processed. A total of 236 valid samples were recovered from the questionnaire survey, of which 203 (86%) were male and 33 (14%) were female. Private vehicle drivers and commercial vehicle drivers accounted for 61% and 39%, respectively. The survey collected relevant data on direction signs along the G2 expressway in the Beijing-Tianjin-Hebei region and connecting roads, totaling 558 signs. After data processing and analysis, it was found that 99 direction signs did not meet relevant standard requirements, accounting for 17.7% of the total. The proportional statistics of various issues are shown in
Table 5.
3.3. Analysis of Questionnaire Data
Topic 1: Importance of guide signs
In the survey, team members asked respondents: “Which guidance tools do you rely on while driving? (Please rank them in order of importance)”. Drivers ranked the options based on their experience, and the sequence was assigned values of 1, 2, 3, and 4, with lower values indicating higher priority. The average value for each option was then calculated to assess its overall importance. The lower the average value, the more important the option was perceived to be. The statistical results are shown in
Table A1 (N represents the number of respondents who selected each item). Vehicle navigation systems emerged as the most critical tool, followed by guide signs, maps, and asking locals. Notably, while vehicle navigation is frequently relied upon, 78% of drivers stated they trust road signs more when discrepancies arise, indicating that standardized road signs remain a trusted source of information. This suggests a need for enhanced precision in navigation systems to complement the consistency of road signs.
Topic 2: Overall evaluation and main issues of guide signs
In this survey, a statistical analysis of the question, “Have you ever taken a wrong turn due to guide signs?” revealed that approximately one-third of respondents admitted taking wrong turns due to guide signs, indicating a need for improvement in their accuracy and reliability. Additionally, a statistical analysis of the question, “What do you think are the main problems with highway guide signs?”, as shown in
Table A2 (see
Appendix A), highlighted the main issues identified by the respondents. The main issues identified, ranked by importance, included missing useful information, poor visibility, complicated graphics, information overload, inconvenient placement, and signs being blocked by trees. These problems highlight challenges such as difficulty in finding essential details, insufficient visibility, and complex designs that hinder quick interpretation, particularly under time constraints. Addressing these issues through clearer, more visible, and user-friendly signage is essential to enhance safety and driving efficiency.
Topic 3: Driver-focused guidance information
To conduct an in-depth study on the issue of “unable to find useful information” reported by drivers, we further inquired about which information drivers primarily focus on in highway signs. The statistical analysis results for the survey question “Which information do you mainly use from highway signs (multiple choice)?” are presented in
Table A3 (see
Appendix A).
The survey revealed that the most critical guidance information for drivers includes “names of reachable destinations” (75.0%), “names of reachable highways” (62.3%), and “current highway name” (27.1%). For unfamiliar destinations, drivers prioritize information about “highways along the route”, followed by “traffic hubs and interchanges” and “towns along the route”. While drivers are generally satisfied with highway signs, issues such as the inability to find useful information, unclear signage, and complex graphics remain. These findings emphasize the importance of clear, accessible, and relevant information on guide signs to enhance navigation and reduce errors. Further field research is planned to address these concerns.
3.4. Issues Identified in Highway Guide Signs
3.4.1. Configuration or Placement Problems
A review of guide signs along the G2 Expressway in the Beijing-Hebei section identified several configuration and placement issues, especially with distance and exit direction signs.
- (1)
Improper placement of distance signs
According to the standards, distance signs should be placed 1 km before the end of the acceleration lane in an interchange and must be repeated at least every 5 km [
39]. However, the investigation identified the following issues: (a) Insufficient distance between signs: Some signs are only spaced 1 km apart, failing to meet the 5 km requirement. (b) Incorrect placement: Some signs are installed near ramp exits, which can distract drivers entering the mainline, posing safety risks.
- (2)
Incomplete configuration of exit direction signs
Standards stipulate that exit direction signs should be placed at intervals of 2 km, 1 km, 500 m, and at the exit point along the deceleration lane of expressways or urban roads [
39]. However, the following problems were noted: (a) Missing levels: Many locations lack the 500 m level signs. (b) Insufficient pre-warning: Some places only provide 500 m signs and action point markers, but omit the 2 km and 1 km signs, posing safety hazards.
- (3)
Incomplete entrance direction signs
The standards recommend placing entrance direction signs on roads connecting to expressways, at 2 km, 1 km, 500 m, and at the reference point [
39]. However, in certain cases, signs are missing, particularly at the 500 m mark, where only those of other places are present.
- (4)
Incomplete service area signs
Service area signs are required at 2 km, 1 km, 500 m, and at the start of the deceleration lane [
39]. However, some service areas lack 2 km signs, leading to insufficient information for drivers.
3.4.2. Layout Design Problems
An analysis of collected guide signs reveals that the layout design of some signs fails to comply with standard regulations. The following two key issues were identified.
- (1)
Information overload on signs
According to the standards, no more than six destinations should be displayed on a single guide sign, and the total number of destination names on signs within the same gantry structure should not exceed eight [
39]. However, the survey found some cases of excessive information, with up to nine destinations shown on a single gantry. This overload can make it difficult for drivers to quickly extract relevant information, potentially compromising road safety.
- (2)
Improper sequence of information on distance signs
The standards recommend that distance signs display up to three rows of information, arranged in descending order of proximity (i.e., from nearest to farthest, top to bottom) [
36]. However, the survey found that some signs contained four rows of information, with the sequence sometimes reverse-listed from farthest to nearest. This inconsistency introduces unnecessary complexity, making it harder for drivers to quickly interpret the information, which could lead to delayed decision-making and increased driving risks.
3.4.3. Information Selection Problems
The analysis of the collected highway guide signs revealed the following key issues regarding the selection of sign information.
- (1)
Inconsistent guide information
According to standards, the information displayed on exit signs, including advance exit signs, exit markers, and signs at branch points after the exit, must remain consistent throughout. Additionally, the first row of the distance sign should align with the destination shown on the subsequent exit marker [
39]. However, the survey found that some exit signs presented conflicting information, and the distance signs lacked correspondence with upcoming exit markers. Furthermore, the guide information on exit markers was inconsistent with that on signs at post-exit branch points, leading to driver confusion.
- (2)
Lack of hierarchical information selection
Standards require that distance signs follow a hierarchical structure: the first row should display the destination accessible via the next interchange, while the second and third rows should indicate destinations at increasing distances (Tier B and Tier A information, respectively) [
39]. However, the survey identified non-compliance, where signs failed to use this hierarchical format and omitted highway numbers, resulting in inconsistencies with previous signs and creating information overload.
- (3)
Inconsistent reference points for distance calculations
The standards specify that distance calculations must use a consistent reference point, such as the beginning of the taper at deceleration lanes when guiding towards exits [
39]. However, discrepancies were found in the network, with multiple distance signs using inconsistent reference points. This inconsistency can mislead drivers regarding the actual distance to destinations, reducing the accuracy of navigation systems and compromising driving safety.
3.5. Summary of Survey Questions
Based on in-depth analysis of the driver survey and field research on highway guide signs, the main issues identified and their proportions are as follows: (a) Non-compliance of sign information and font height: 42%; (b) Non-standard sign layout design: 39%; (c) Improper sign placement: 3%; (d) Inconsistent guide information: 9%; (e) Overloaded sign content: 7%. These issues can be grouped into three main categories: (a) Sign layout design: The signs must adhere to relevant design standards to ensure readability and usability. (b) Sign placement and configuration: Proper placement of signs is essential for maximizing visibility and ensuring safe driving behavior. (c) Selection of guide information: The information on signs must be accurate, consistent, and easy to understand to prevent driver confusion. The findings indicate that highway guide signs need improvements in layout design, accurate information selection, and rational placement to ensure they meet safety standards and facilitate efficient navigation.
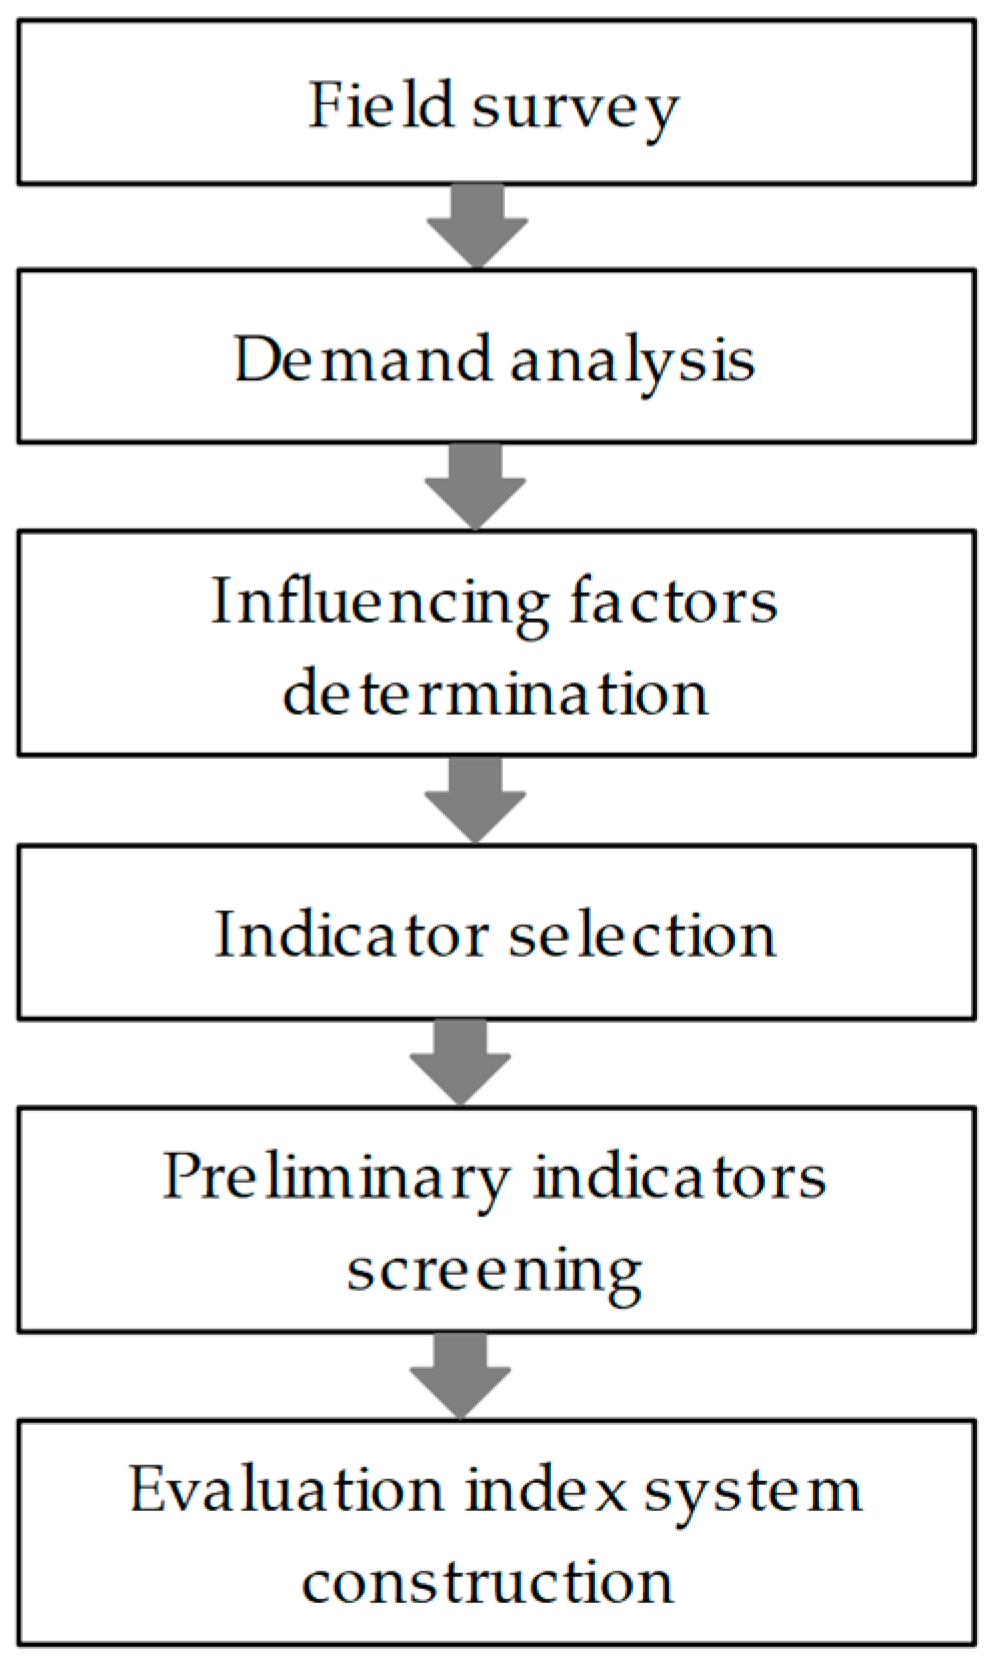
4. Construction of Evaluation Index System
The primary function of guide signs is to guide drivers by providing information about routes to destinations, along with relevant details about nearby towns, public service facilities, distances, and driving directions. Properly setting up guide signs can not only enhance the efficiency of the road network but also ensure effective communication of information. This allows drivers to quickly, accurately, and safely acquire relevant information and choose the optimal driving path.
4.1. Demand Analysis
Highways must meet three core requirements from the drivers’ perspective: safety, efficiency, and comfort. Guide signs, as essential tools for conveying information, play a pivotal role in fulfilling these objectives. To ensure optimal performance, several key factors must be considered: (1) Appropriate location: Signs should be placed where drivers can easily spot them. (2) Clear information: The design must allow quick reading and comprehension. (3) Continuity and consistency: Information should flow logically across signs to prevent confusion and ensure smooth navigation. Thus, for highways to deliver safe, efficient, and comfortable journeys, guide signs must exhibit standardization, readability, continuity, and consistency.
Standardization: The proper placement and arrangement of guide signs directly affect the use efficiency of a highway. A well-designed layout can enhance driver comfort by providing effective information at the right moment, preventing confusion due to missing or improperly installed signs. Readability: Clear signage ensures that drivers can quickly obtain information and respond promptly. Poor readability increases the likelihood of risky driving behaviors, such as sudden braking or abrupt lane changes. Continuity: Guide signs should announce upcoming destinations and maintain consistency before and after exits. For instance, exit preview signs should align with the information presented at the exit and at branching points. In distance signs, the first-listed destination should correspond with the upcoming exit’s information, ensuring seamless guidance until drivers reach their destination. Consistency: Sign information must remain consistent across the highway network. For instance, the top-listed destination on distance signs should align with corresponding exit preview signs, and mainline exit signs must match their previews. Additionally, toll station signs should correspond with relevant entry and exit signs to ensure smooth, uninterrupted navigation for drivers.
4.2. Influencing Factors Analysis
Through questionnaire surveys and on-site research, it was identified that drivers’ key requirements for highway directional signs focus on four aspects: standardization, readability, continuity, and consistency. Further analysis of these requirements revealed multiple influencing factors, which form the basis of the evaluation index system. The influencing factors for these needs are summarized in
Table 6.
4.3. Evaluation Metric Determination
Based on the influencing factors listed in
Table 6, appropriate evaluation metrics were selected to assess the effectiveness and compliance of guide signs.
4.3.1. Compliance Indicators
To address factors affecting the compliance of guide signs, the following evaluation metrics are proposed.
- (1)
Conformity rate of distance signs (D1)
According to the standards, distance signs should be placed more than 1 km after the end of the acceleration lane of an interchange, with repeated signs spaced at intervals of at least 5 km. This metric is defined as the proportion of distance signs meeting these placement standards relative to the total number of signs.
is the conformity rate of distance signs, is the number of distance signs not set according to standards or with incorrect spacing, and is the total number of required distance signs.
- (2)
Configuration rate of advance exit signs and confirmation signs (D2)
Highways must have advance exit signs before interchanges to alert drivers of upcoming exits, and confirmation signs at the exits to verify the destination. This metric is defined as the proportion of interchanges with complete advance and confirmation signage relative to the total.
is the configuration rate of advance exit signs and confirmation signs, is the number of interchanges with incomplete signage, and is the total number of interchanges.
- (3)
Completeness rate of facility guide signs (D3)
Facilities along highways include gas stations, service areas, and parking zones. Appropriate guide signs must be placed before reaching these facilities. This metric is defined as the proportion of facilities with corresponding guide signs relative to the total number
of facilities.
is the completeness rate of facility guide signs. is the number of facilities without guide signs.
4.3.2. Readability Indicators
Based on the factors affecting the readability of guide signs, the following evaluation indicators are proposed.
- (1)
Compliance rate of layout standards (D4)
This indicator assesses whether guide signs meet standards in design elements like color, shape, font, and directional arrows. For highways and urban expressways, guide signs should have a green background with white symbols, a white border, and green edging, with a square shape. Fonts should primarily be in Chinese, with additional languages or English if needed; English names must follow pinyin rules, capitalizing only the first letter. Up to six types of directional arrows are permitted, including right, diagonal right, straight, and diagonal left. This metric is the proportion of compliant guide signs to total signs.
is the compliance rate of layout standards, is the number of signs that do not meet standards, and is the total number of guide signs.
- (2)
Visual comfort of layout (D5)
The comfort experienced by highway users depends on both the design of the signs and environmental factors. Poor design may increase driver fatigue and elevate the risk of traffic accidents. To assess visual comfort, an attitude scale is applied, with five levels of satisfaction: very satisfied (5 points), satisfied (4 points), neutral (3 points), dissatisfied (2 points), very dissatisfied (1 point). Score = Total score from all questionnaires/(5* number of questionnaires).
- (3)
Non-overload rate of layout information (D6)
When the amount of information on a guide sign exceeds recommended limits, drivers may struggle to recognize and process key details in time, potentially compromising safety. According to the standard, the total number of destination entries on a single sign should not exceed six per direction. This indicator is defined as the ratio of signs with non-overloaded information to the total number
of guide signs.
represents the rate of non-overloaded signage information, while denotes the number of overloaded signs.
- (4)
Unobstructed signage rate (D7)
Guide signs may be blocked by trees, vegetation, or other structures, impairing visibility and reducing their effectiveness. This indicator is defined as the ratio of guide signs that are not blocked by obstacles to the total number
of guide signs.
represents the rate of unobstructed signs, while denotes the number of obstructed signs in the directional signage.
- (5)
Intact reflective film rate (D8)
Reflective films enhance the visibility of guide signs at night, contributing to driver safety. However, signs with faded, cracked, or peeling reflective film reduce visibility and hinder the communication of critical information. This indicator is defined as the ratio of guide signs with undamaged reflective film to the total number
of guide signs.
represents the completeness rate of reflective film, while denotes the number of directional signs with incomplete reflective film.
- (6)
Maintenance rate for clean signage (D9)
Guide signs exposed to outdoor elements are prone to dirt accumulation, which reduces their visibility and effectiveness. Regular maintenance is essential to keep signs legible. This indicator is defined as the ratio of signs free from dirt and damage to the total number
of guide signs.
represents the maintenance rate of signs with dirt, while denotes the number of dirty signs among directional signs.
- (7)
Alignment accuracy rate (D10)
Guide signs may bend or tilt due to wind loads, especially in coastal areas where severe weather is frequent. This indicator is defined as the ratio of guide signs with correct alignment to the total number
of guide signs.
represents the rate of signs positioned correctly, while denotes the number of signs that are tilted among the directional signs.
- (8)
Effectiveness of information retrieval (D11)
The goal of guide signs is to provide timely and accurate information to road users. However, the effectiveness of information retrieval can be influenced by the design of signage and external factors. To assess user satisfaction with the ease of information retrieval, a five-level Likert scale is employed, with the following scores: very satisfied (5 points), satisfied (4 points), neutral (3 points), dissatisfied (2 points), very dissatisfied (1 point). Score = Total score/(5* sum of questionnaires).
4.3.3. Continuity Indicators
To address the factors influencing the continuity of guide signs, the following evaluation indicators are proposed.
- (1)
Reasonableness rate of hierarchical information selection (D12)
Information on guide signs should follow the hierarchical structure outlined in the standards, including both advance guide signs and confirmation signs at intersections. This indicator measures the proportion of signs with appropriately selected hierarchical information among all destination distance signs. It is defined as the ratio of signs with appropriately selected hierarchical information to the total number of distance signs.
represents the rate of reasonable selection of information layers; denotes the number of signs with unreasonable information layers; is the total number of distance signs.
- (2)
Satisfaction with information selection (D13)
Given the complexity of highway operations and the varying levels of familiarity drivers have with road conditions, user needs and capacities to process guide sign information may differ based on individual cognitive abilities and physical conditions. Therefore, information selection should strive to meet the diverse needs of road users. To assess user satisfaction with the information provided, a five-level Likert scale is employed, with the following scores: very satisfied (5 points), satisfied (4 points), neutral (3 points), dissatisfied (2 points), very dissatisfied (1 point). Score = Total score/(5* sum of questionnaires).
- (3)
Continuity rate of guidance information (D14)
This indicator assesses interruptions in guidance information along highways. Each interchange is treated as an evaluation unit, measuring the consistency of destination information through destination distance signs. Specifically, it checks the destination consistency from the first row of a distance sign to the advance guide and confirmation signs of the next exit. If the destination information changes before reaching the next exit, it is considered a break in continuity. This indicator is defined as the ratio of uninterrupted interchanges to the total number
.
represents the continuity rate of guiding information; denotes the number of interchanges with uninterrupted guidance information.
- (4)
Completeness rate of advance signs (D15)
Advance guide signs must be installed along highways or urban expressways at 2 km, 1 km, 500 m, and at the beginning of the deceleration lane transition section. Each interchange serves as an evaluation unit. The completeness rate is defined as the ratio of interchanges with fully installed advance signs to the total number
of interchanges.
represents the completeness rate of exit warning signs; denotes the number of interchanges with incomplete exit warning signs.
4.3.4. Consistency Indicators
The factors influencing the consistency of guide signs primarily include the reasonableness of the advisory sign information, the accuracy of reaching destinations, and the effectiveness of path guidance. The following evaluation indicators are proposed to assess these factors.
- (1)
Reasonableness rate of exit advisory sign layout (D16)
Exit advisory signs should display an exit number and follow a two-line format: the first line shows the highway number or name, while the second lists a notable location along that route. Signs lacking an exit number or with disorganized information fall short of layout standards. This indicator measures the proportion of exit advisory signs with a compliant layout relative to the total number of such signs.
represents the rationality rate of the layout of exit warning signs; denotes the number of exit warning signs with unreasonable layouts; is the total number of exit warning signs.
- (2)
Consistency rate of directional signs (D17)
This indicator evaluates the coherence and consistency of directional signage across road segments to ensure drivers receive accurate, continuous guidance. Inconsistent information—such as differing destinations on distance versus exit signs—can cause confusion, misjudgment, and missed exits. The consistency rate measures how well information aligns between successive signs, facilitating smooth and safe travel. It is defined as the proportion of the number of straight-ahead signs where the next exit information matches the second-line location information on the previous distance sign to the total number
of exit straight signs at interchanges.
represents the consistency rate of directional signs; denotes the number of non-corresponding exit straight signs.
- (3)
Appropriateness of route guidance effect (D18)
This indicator assesses the effectiveness of route guidance for road users, which is a core function of directional signage. It reflects whether drivers, under the guidance of these signs, can smoothly reach their intended destinations and whether the suggested route is the most optimal. To quantify the effectiveness of route guidance, an attitude-based rating method is applied. User satisfaction is divided into five levels: very satisfied (5 points), satisfied (4 points), neutral (3 points), dissatisfied (2 points), very dissatisfied (1 point). Score = Total score/(5* sum of questionnaires).
4.4. Framework of the Evaluation Indicator System
Based on the analysis of the issues present in directional signs, four key areas of demand have been identified. Corresponding evaluation indicators have been established based on these needs, leading to the creation of a comprehensive evaluation indicator system for guide signs, as illustrated in
Figure 2.
5. Evaluation Model and Application
In the evaluation indicator system for highway guide signs, the proximity of each indicator’s quantified results to its ideal value directly reflects the effectiveness of guide sign placement. This “proximity to ideal solution” characteristic aligns perfectly with the core concept of the TOPSIS method. By calculating the distances between evaluated objects and the positive/negative ideal solutions, TOPSIS can precisely measure how closely guide sign configurations approach the ideal standard, thereby enabling scientific evaluation of their effectiveness. Consequently, this study employs the TOPSIS method to construct the evaluation model, ensuring the objectivity and accuracy of assessment results.
5.1. Construction of the Evaluation Model Based on the TOPSIS Method
5.1.1. Evaluation Model Construction
From the previous analysis, it is evident that the evaluation system for guide signs is divided into two levels. The primary indicators include the normative nature of guide signs (B1), the readability of guide signs (B2), the continuity of guide signs (B3), and the consistency of guide signs (B4). These indicators evaluate the effectiveness of guide sign settings from four aspects of demand. By analyzing the influencing factors of each demand aspect, corresponding secondary evaluation indicators are proposed, thereby constructing a structural model for assessing the effectiveness of guide signs, as shown in
Figure 3.
5.1.2. Evaluation Procedure
The evaluation of highway guide signs follows a structured approach based on the previously established indicators and evaluation model. The steps are as follows:
- (1)
Collection of background data
Gather relevant basic information about the evaluated road, including its classification, number of lanes, road alignment, geometric conditions, and intersections.
- (2)
Development of a survey plan
Define a detailed survey strategy. Subjective indicators: Use questionnaires focusing on driver behavior and needs to collect relevant data. Objective indicators: Conduct field research to obtain real-world data on the guide signs along the road.
- (3)
Implementation of field surveys
Execute the survey plan as designed: Conduct subjective surveys by distributing questionnaires to drivers at highway service areas to gather feedback for subjective metrics. For objective data, surveyors drive along the highway section under evaluation, using direct observation and video recordings to collect data on the guide signs.
- (4)
Calculation of evaluation indicators
Classify the collected data based on the indicator categories. Compute each indicator using the formulas provided in the research framework.
- (5)
Evaluation of the objects
Apply the TOPSIS method to assess the effectiveness of the guide signs on the highway, determining how well they meet optimal standards. There are seven specific steps, as follows:
- (a)
Formulate the decision matrix. In the evaluation of road network signage, let
represent the set of evaluation objects and
represent the set of indicators. The value of an evaluation object
concerning an indicator
is denoted as
. Thus, the decision matrix X is structured as follows:
- (b)
Normalization of indicators. To eliminate the impact of differing dimensions among evaluation indicators on decision-making, normalization is applied to the data. Indicators are classified into two categories based on their nature: high-priority indicators (where larger values are better) and low-priority indicators (where smaller values are better). Different normalization algorithms are used for these two types of indicators.
- (c)
Determine the weights of each indicator. The Analytic Hierarchy Process (AHP) is employed to perform pairwise comparisons of each indicator’s importance relative to the corresponding criteria at the upper level. This method helps in establishing the relative weights of the indicators and conducting a consistency check to verify their coherence.
- (d)
Construct the weighted decision matrix. Multiply the weights of each indicator by the non-dimensional matrix to obtain the weighted decision matrix
for the directional signs. This matrix reflects the importance of each indicator in relation to the overall assessment, allowing for a more informed evaluation of the directional signs’ effectiveness.
- (e)
Determine the optimal and worst solutions. The optimal solution
is formed by the maximum values of each column in matrix R.
The worst solution
is formed by the minimum values of each column in matrix R.
- (f)
Calculate the distance of each option from the optimal and worst solutions. At this point, use the Euclidean distance to calculate the distance
,
from the optimal and worst solution.
- (g)
Calculate the closeness of each solution to the optimal solution
as follows:
The larger the value of , the closer the decision-making solution is to the optimal solution, indicating a better overall solution.
5.1.3. Practical Analysis of Evaluation Results
The application of evaluation results can be divided into two scenarios:
- (1)
Single object evaluation
The evaluation indicators are divided into three categories: standardized indicators, optimizable indicators, and subjective indicators (as shown in
Table 7). Among them, the value of the standardized indicator should be 1, which is a mandatory standard requirement in the Chinese logo specification. The requirements are relatively strict, and if the rating value is lower than 0.95, it must be rectified. There is no clear requirement for optimizable indicators in Chinese signage standards, but they are still relatively important in terms of guidance effectiveness. If the score is below 0.9, rectification is needed. Subjective indicators reflect the feelings of road users, which are not explicitly required in Chinese signage standards. However, the driving experience of drivers is also relatively important. If the rating value is below 0.9, it also needs to be rectified.
- (2)
Comparison of two objects (e.g., before and after adjustments)
By comparing the scores before and after adjustments, the effectiveness of the optimization can be evaluated: If the post-adjustment score is higher than the pre-adjustment score, the improvement was successful. If the score decreases after the adjustment, it indicates that the changes negatively impacted performance.
The specific rectification standards and measures can be flexibly designed based on the project’s context to ensure that the guide signs meet both safety and guidance needs, improving the overall highway user experience.
5.2. Application of the Evaluation Model
The G2 Expressway in China, a major north–south arterial route, connects Beijing to Shanghai and passes through key cities in Hebei Province, such as Langfang and Cangzhou. Through the investigation of existing traffic signs on the G2 expressway mentioned earlier, it was found that this section has significant high traffic flow characteristics. It is worth noting that a questionnaire survey and in-depth interviews with high-frequency drivers on this section revealed that the Hebei section of the G2 Expressway intersects with 11 typical roads, with a large number of traffic sign samples (involving 11 typical sections), and a large number of sign facilities do not comply with standard specifications. Based on this, in order to effectively verify the practical application effectiveness of the traffic sign evaluation model constructed in this article, the research team selected the Hebei section of the G2 Expressway, including its intersections with 11 other highways (e.g., G3, G2501, and G18), as the empirical research object, focusing on the technical evaluation of the standardization of its sign system. A total of 558 traffic guide signs were surveyed along the selected segment, with 99 signs failing to meet the relevant requirements for guide signage. In addition, for subjective indicators (D5, D11, D13, and D18), on-site questionnaires were administered to collect drivers’ evaluations of the signage’s effectiveness. After filtering out invalid responses, the corresponding indicator values were calculated. Microsoft Excel (Version 2019) was utilized for the computational processes of the TOPSIS method. The evaluation results for all indicators are summarized in
Table A4 (see
Appendix A).
From
Table A4, it can be seen that the issues with traffic signs are layout specification problems (58), sign occlusion problems (21), and layout information overload problems (18). The number of problematic traffic signs corresponding to different evaluation indicators varies greatly, which reflects the actual situation of traffic signs on this highway.
- (1)
Forming the decision matrix
In the evaluation of the G2 Hebei section’s signage indicators, the optimal value for all indicators is set to 1, while the worst value is set to 0. All optimal indicator values are treated as an optimal set (denoted as M1), and all worst indicator values are treated as a worst set (denoted as M2). The actual indicator values from the road network form the actual set (denoted as M3). Thus, the decision matrix X is formed, and normalization is applied to X to obtain standardized values.
- (2)
Determining the weights of indicators
- (a)
Determining the weights of primary indicators: Using the AHP, pairwise comparisons are made to evaluate the relative importance of the primary indicators. The pairwise comparison matrix constructed for evaluating the effectiveness of highway signage is shown in
Table A5 (see
Appendix A).
In the primary indicators, the normativity and compliance are the fundamental requirements. More importantly, continuity and consistency are pursued only after ensuring normative and compliance standards are met. Therefore, normative and compliance aspects are relatively more significant. After data processing, the weights of each primary indicator are as shown in
Table A6 (see
Appendix A).
The values of CI and CR in the table are both less than 0.1, indicating that the consistency check is satisfied.
- (b)
Determining the weights of secondary indicators: Within the primary indicator of “Normativity”, the three indicators—location distance sign, exit notification confirmation sign, and guidance sign for roadside facilities—are primarily concerned with whether they are set up correctly. Since these three indicators are of equal importance, their weights relative to the higher-level objective are also equal, as shown in
Table A7 (see
Appendix A).
The weights for the secondary indicators corresponding to the other three primary indicators (Readability, Continuity, and Consistency) are also determined using the AHP. Pairwise comparisons are made regarding the importance of these indicators in relation to their respective primary indicators. The comparison matrices are constructed as shown in
Table A8,
Table A9 and
Table A10 (see
Appendix A), in accordance with the standards outlined.
The summary of the weighted values for all secondary indicators of expressway signage after data processing is shown in
Table A11 (see
Appendix A). The values of CI and CR in the table are both less than 0.1, indicating that the consistency check is satisfied.
- (c)
Constructing the weighted decision matrix
Multiply the weights of each indicator by the dimensionless matrix to obtain the weighted decision matrix for the road signs
.
- (d)
Determining the optimal and worst solutions
In this evaluation case, the optimal value for each indicator is 1, which defines the optimal solution as optimal solution
. Similarly, the worst value for each indicator is 0, defining the worst solution as worst solution
. Calculate the distance between solution
and the optimal solution
and the worst solution
, respectively.
The relative closeness
of the solution
to the optimal solution
is
Therefore, the final evaluation indicates that the closeness of this solution to the optimal solution is 0.9121.
The effectiveness evaluation of the G2 Expressway’s guide signs indicates room for improvement. Six evaluation metrics scored below 0.9: layout compliance rate, visual comfort of spatial arrangement, rational selection rate for hierarchical information, user satisfaction with information prioritization, completeness of advance signage, and appropriateness of route guidance. These findings suggest a need to revise layout standards and enhance advance signage configuration to ensure regulatory compliance. Furthermore, three subjective indicators (i.e., visual comfort, satisfaction with information selection, and appropriateness of route guidance) directly reflect drivers’ subjective experiences. This underscores the necessity of optimizing the signage system with a user-centric approach to improve operational usability. Case validation demonstrates that the proposed evaluation method effectively assesses expressway signage performance while providing actionable recommendations for optimization. Such improvements can enhance both traffic safety compliance and user experience outcomes.
6. Discussion and Conclusions
Highway direction signs are vital for safety and navigation, yet field research reveals significant practical challenges. Drivers struggle with cluttered information, inconsistent placement, and poor visibility. To address these, we propose a TOPSIS-based evaluation model focusing on four key needs: normativity (compliance with standards), readability (clear content hierarchy), continuity (logical advance signage), and consistency (uniform symbols). In the actual management and operation of highways, this comprehensive evaluation model demonstrates significant practical value. Taking the busy highway interchange areas on urban outskirts as an example in this study, the model quantitatively analyzes core indicators such as sign standardization, visibility, continuity, and consistency, accurately identifying issues such as missing or discontinuous information at certain interchange ramp exits. These issues often lead to driver misjudgment in complex traffic conditions. Based on the risk warning list generated by the model, management authorities swiftly formulated a prioritized renovation plan, supplementing missing exit warning signs and standardizing terminology across multiple zones to ensure consistent information presentation. The main findings of this study are summarized as follows:
- (1)
The questionnaire and field research indicate that, from the drivers’ subjective perspective, there are challenges such as difficulties in information retrieval, unclear sign content, and complex graphics. From a regulatory standpoint, issues include non-compliant font sizes, information overload, missing advance signs, unreasonable placements, insufficient hierarchy, and lack of continuity. Analysis of the survey responses reveals that drivers prioritize safety, efficiency, and comfort in their journeys. Based on the role of direction signs, it is suggested that drivers require signs to exhibit normativity, readability, continuity, and consistency, with a definition and analysis of these four types of needs provided.
- (2)
Based on drivers’ needs regarding highway direction signs, factors influencing these needs were analyzed, leading to the design of corresponding evaluation indicators. The evaluation is proposed at interchange units, assessing normativity, visibility, continuity, and consistency, and quantifying these indicators to construct a comprehensive evaluation system.
- (3)
By analyzing the evaluation indicator system and comparing various comprehensive evaluation methods, the TOPSIS method was selected for evaluating the effectiveness of highway direction signs. Selecting the Hebei section of the G2 expressway as a case study, it was demonstrated that the proposed evaluation index system and model are feasible and can be used for the comprehensive evaluation of highway directional signs.
From a traffic management perspective, the model facilitates a shift from traditional reactive maintenance to a proactive, dynamic prevention approach. It enables authorities to anticipate and address potential issues in advance, improving the scientific rigor and foresight of traffic management. For drivers, the optimized signage system provides clearer and more accurate guidance, reducing confusion and misjudgment during driving, mitigating fatigue and accident risks, and ultimately enhancing the travel experience. From an industry development standpoint, the model’s evaluation framework lays a solid foundation for updating sign design standards. It clarifies critical metrics such as information density thresholds and graphic simplification principles, promoting more standardized, uniform, and user-friendly highway sign design. This elevates the overall service quality and operational efficiency of the road traffic system, providing robust support for building a safer, more efficient, and convenient transportation environment.
In future research, we will add multiple highways of different types and scenarios to collect traffic sign data for further testing and evaluation of the model. Meanwhile, several key areas can be further explored: (1) User-centric factors: Future research should thoroughly consider the individual differences among road users and how these variances affect the effectiveness of highway direction signs. This includes studying demographic factors, driving experience, and cognitive load, and exploring strategies to mitigate the negative impacts of these differences on sign usability. (2) External environmental factors: In evaluating the use of highway direction signs, it is essential to take into account external factors such as road alignment, traffic volume, other vehicles, and weather conditions. Research should focus on how to integrate these variables into the evaluation methods and correct their effects on assessment results. This may involve developing adaptive models that can dynamically adjust to changing conditions, ensuring a more accurate reflection of sign effectiveness under varying circumstances.


