Article

Image-Based Nutritional Advisory System: Employing Multimodal Deep Learning for Food Classification and Nutritional Analysis

Department of Computer Science and Information Engineering, National Cheng Kung University, Tainan 701, Taiwan
*
Author to whom correspondence should be addressed.
Appl. Sci. 2025, 15(9), 4911; https://doi.org/10.3390/app15094911
Submission received: 20 March 2025 / Revised: 25 April 2025 / Accepted: 27 April 2025 / Published: 28 April 2025
(This article belongs to the Topic Electronic Communications, IOT and Big Data, 2nd Volume)

Abstract

:
Accurate dietary assessment is essential for effective health management and disease prevention. However, conventional methods that rely on manual food logging and nutritional lookup are often time consuming and error prone. This study proposes an image-based nutritional advisory system that integrates multimodal deep learning to automate food classification, volume estimation, and dietary recommendation to address these limitations. The system employs a fine-tuned CLIP model for zero-shot food recognition, achieving high accuracy across diverse food categories, including unseen items. For volume measurement, a learning-based multi-view stereo (MVS) approach eliminates the need for specialized hardware, yielding reliable estimations with a mean absolute percentage error (MAPE) of 23.5% across standard food categories. Nutritional values are then calculated by referencing verified food composition databases. Furthermore, the system leverages a large language model (Llama 3) to generate personalized dietary advice tailored to individual health goals. The experimental results show that the system attains a top 1 classification accuracy of 91% on CNFOOD-241 and 80% on Food 101 and delivers high-quality recommendation texts with a BLEU-4 score of 45.13. These findings demonstrate the system’s potential as a practical and scalable tool for automated dietary management, offering improved precision, convenience, and user experience.

1. Introduction

Currently, most dietary recording and control applications rely on users manually uploading images and filling in related information. Due to the lack of automated classification and calculation of food portions, users often find the process cumbersome and time consuming, which reduces their engagement and persistence in using the applications.
This study proposes an innovative system that not only automatically identifies food images but also accurately assesses the nutritional content of the food and provides automated dietary recording functions. The system leverages advanced multimodal deep learning methods, combining image classification with natural language processing (NLP) techniques to achieve comprehensive food analysis. Through this system, users can take pictures of their food to obtain corresponding food categories and detailed nutritional information, including calories, protein, fat, carbohydrates, etc., and receive dietary recommendations based on their health conditions and goals.
In previous studies, the field of food image classification commonly adopted convolutional neural networks (CNNs) [1,2,3,4] and other deep learning techniques as the core model architecture. Although these methods demonstrated excellent performance on specific training datasets, their applicability is often limited to the food categories already present in the datasets, with relatively poor generalization and applicability to unseen categories. To address this limitation, this study employs a zero-shot learning approach based on the CLIP model [5]. By learning the correspondence between images and texts, the model can effectively recognize and classify food images that did not appear during the training phase, bringing higher flexibility and broad applicability to the classification field and better meeting the diverse needs of food analysis.
Furthermore, volume plays a critical role in nutritional assessment because it allows consumers to calibrate their nutritional intake through portion sizes and is crucial for improving the accuracy of dietary evaluations. As pointed out by Thames et al. from Google in a 2021 study [6], integrating volume information into neural network-based food nutritional assessment models can significantly enhance the effectiveness and accuracy of the assessment. In terms of volume measurement, this study adopts the E-Volume [7] technique, representing an innovative method that replaces traditional methods of using depth cameras and reference planes [8,9] to estimate food volume. It overcomes the limitations of requiring specialized hardware or portable devices, expands the generality and convenience of the application, and makes volume measurement more accurate and user friendly.
This study employs the Llama 3 [10] language model developed by Meta as the main core architecture to establish the dietary recommendation system. Its high adaptability and powerful language understanding capabilities can effectively parse and process complex nutritional information, thus providing personalized dietary recommendations.
The primary contributions of this work are as follows:
  • We develop a unified system that combines zero-shot image classification, learning-based volume estimation, and language-based dietary recommendation.
  • The system removes the need for specialized hardware, improving accessibility and user convenience.
  • Extensive evaluations demonstrate strong classification accuracy, volume prediction, and natural language generation performance.
The remainder of this paper is organized as follows. Section 2 reviews related work in food classification, volume estimation, and dietary recommendation models. Section 3 presents the proposed system architecture and its core components, including food classification, volume estimation, nutrient calculation, and personalized recommendations. Section 4 details the experimental setup and evaluation. Section 4.6 discusses limitations, and Section 5 concludes this study with suggestions for future work.

2. Related Work

2.1. Zero-Shot Learning

Zero-shot learning (ZSL) [11,12] is a machine learning method that allows a model to classify objects in specific categories not encountered during training. This is especially useful when gathering training data for every possible category is unfeasible.
The key concepts of zero-shot learning (ZSL) include semantic space, projection functions, and generalized zero-shot learning (GZSL). ZSL relies on a semantic space, encompassing both seen and unseen categories, which can be constructed using attributes, word embeddings, or other high-level category descriptions. Projection functions map visual features into this semantic space. While traditional models typically project visual features into the semantic space, newer approaches suggest reverse projection or joint embedding spaces. Generalized zero-shot learning extends ZSL by including both seen and unseen categories during the testing phase, making it more realistic and challenging as the model must simultaneously distinguish between them.
ZSL has applications in various fields, such as image classification, natural language processing, and remote sensing. For instance, in remote sensing, ZSL can classify new types of land cover without labeled data; in NLP, ZSL can enhance the ability of language models to handle new tasks without task-specific training data.
Current research [13,14,15] focuses on improving the robustness of ZSL models, developing more comprehensive benchmarks, applying ZSL to a broader range of complex real-world problems, and combining ZSL with self-supervised learning to explore its potential in dynamic environments where categories evolve.

2.2. Image Classification

Image classification is a fundamental task in computer vision, aiming to assign input images to predefined categories. This process involves feature extraction and pattern recognition and is widely applied in various scenarios, such as object recognition, facial recognition, and medical image analysis. With the development of deep learning, convolutional neural networks (CNNs) have become mainstream due to their excellent ability to process image data, leading to significant advancements in image classification technology.

2.2.1. Convolutional Neural Networks

Convolutional neural networks (CNNs) [1,2,3,4] are among the most crucial and widely used models in image classification tasks. CNNs primarily extract local features of images through multiple layers of convolution and pooling and ultimately classify them into fully connected layers. This hierarchical structure mimics the human visual system, automatically allowing CNNs to learn image feature representations.
Classic CNN models, such as AlexNet [16], achieved groundbreaking success in the 2012 ImageNet competition, demonstrating the immense potential of deep learning in image classification. Subsequently, VGGNet [17] proposed a deeper network structure, further improving classification performance. ResNet [18] introduced residual modules to solve the problem of gradient vanishing in deep network training, enabling deeper models with better performance. DenseNet [19] enhanced feature reuse by densely connecting each layer, improving efficiency and performance. EfficientNet [20] optimized the use of computational resources by comprehensively considering the network’s depth, width, and resolution.

2.2.2. Contrastive Language–Image Pre-Training

Although deep learning techniques, such as convolutional neural networks (CNNs), have achieved remarkable success in image classification, their performance often relies on large amounts of labeled data, and their scalability to unseen categories is limited. To address this issue, OpenAI proposed the Contrastive Language–Image Pre-Training (CLIP) model [5], which enables zero-shot learning by learning the correspondence between images and text.
The core innovation of CLIP lies in mapping images and text into the same space. This model uses different encoders to process images and text separately, mapping them into the same vector space. The image encoder uses ResNet [18] or Vision Transformer (ViT) [21] as the base architecture, converting input images into fixed-length feature vectors through convolutional layers or multi-head self-attention mechanisms. The text encoder uses a Transformer [22] model to process text inputs, converting them into embedding vectors with the exact dimensions as the image feature vectors, as shown in Figure 1.
During training, CLIP learns the correspondence between image-text pairs in different batches through contrastive learning [23,24,25,26]. For each image–text pair, the model maximizes the similarity of positive matches while minimizing the similarity of negative matches. This ensures that matching images and texts are mapped to the exact location in the embedding space while non-matching pairs are pushed to different places. This feature enables CLIP to accurately classify images based on textual descriptions in zero-shot learning scenarios, achieving high generalizability.

2.3. Volume Estimation

Accurate estimation of food volume is crucial for dietary management. This section explores two primary volume estimation methods: depth cameras and learning-based MVS techniques.

2.3.1. Depth Camera

In volume estimation research, the depth camera method [8,9] is one of the most commonly used approaches. This method uses depth sensors to capture depth images of food and calculates the volume by measuring the distance of each pixel in the depth map from the reference plane. For example, the Depth Calorie Cam method [27] estimates the volume of food placed on a reference plane, such as a plate or table, by calculating the depth of each pixel relative to the reference plane. However, the accuracy of this method highly depends on the initial setup, such as whether the camera is parallel to the reference plane. The prediction results may be affected if the camera angle is not perfectly perpendicular to the reference plane.

2.3.2. Learning-Based Multi-View Stereo

Multi-view stereo (MVS) [28] is a technique that reconstructs three-dimensional structures using multiple images from different perspectives. Traditional MVS methods [28,29,30] rely on finding correspondences between pixels in different images and using triangulation to estimate depth information. However, these methods often face difficulties in complex scenes, lighting conditions, and occlusions. Learning-based MVS methods [31,32] address these challenges using deep learning to predict correspondences and depth maps from images. A notable method is MVSNet [33], which compresses images from different views into a three-dimensional cost volume through homography transformation and decodes this volume into depth maps for each view. This learning-based approach allows the model to generalize to new scenes without extensive fine tuning. It makes it effective in applications such as 3D reconstruction, augmented reality (AR), virtual reality (VR), and robotic vision.

2.3.3. Learning-Based Multi-View Stereo Volume Estimator

In E-Volume [7] network architectures, a learning-based multi-view stereo (MVS) technique is used to overcome the reliance on depth cameras in traditional methods, reducing hardware requirements. This system captures multiple images from different angles and uses the backbone network of MVSNet to generate depth maps. These depth maps are then converted into a complete scene point cloud, providing a three-dimensional representation of the scene. Next, a segmentation mask extracts the target object from the point cloud, ensuring that only the relevant data are considered for volume estimation.
For volume estimation, a neural network composed of four convolutional layers and batch normalization layers is used to extract features from the target object point cloud. These features are downsampled and passed through pooling layers to form a global feature vector, which is then fed into fully connected layers to predict the object’s volume, as shown in Figure 2.
This innovative approach eliminates the need for specialized depth cameras and enhances the flexibility and applicability of volume estimation in various environments. By leveraging learning-based MVS and advanced neural network architectures, the learning-based multi-view stereo volume estimator provides an efficient and accurate volume estimation solution suitable for multiple applications, including dietary management and health monitoring.

2.4. Large Language Models

2.4.1. Language Models

Language models (LMs) [34,35,36] are computational models primarily focused on parsing and generating human language, enabling machines to predict and create text sequences based on given inputs. Traditional models, such as N-gram models [37], make predictions by estimating the probability of word occurrence based on previous words. Although they provide basic predictive functionality, they face many challenges in handling rare and complex semantics and avoiding overfitting. Therefore, current research is focused on developing more efficient model architectures and training methods to address these issues.

2.4.2. Large Language Models

Large language models (LLMs) [38,39,40] are advanced language models with massive parameter counts and exceptional learning capabilities. With advanced deep learning technologies, LLMs, such as GPT [41,42,43] and BERT [34], utilize enormous parameters and sophisticated algorithms to enhance their processing power. The core of these models is the self-attention mechanism of the Transformer [22], which enables the models to effectively handle the sequential nature of data, achieve parallelization, and capture long-range dependencies within the text, thereby revolutionizing the field of natural language processing.
As shown in Table 1, we compare several representative LLMs in terms of their model architecture, number of parameters, and training objectives. This comparison highlights the evolution of LLM design and their respective strengths in language understanding and generation tasks.
A significant feature of LLMs is in-context learning [44], allowing models to generate highly relevant and coherent responses based on a given context or prompts after training. This makes them particularly suitable for dialogue systems and other interactive applications. Within this realm, Reinforcement Learning from Human Feedback (RLHF) [45,46] is also a crucial technique. RLHF uses human responses as rewards to fine tune the models, enabling them to learn from mistakes and improve their performance over time.

2.5. Transformer

The Transformer [22] is a powerful and flexible deep learning architecture that has achieved remarkable success in the fields of natural language processing (NLP) and computer vision (CV). Vaswani et al. [22] proposed that the Transformer introduced the self-attention mechanism, enabling the model to handle sequential data with more excellent parallel computing capabilities and context capture.
Compared to traditional recurrent neural networks (RNNs) and long short-term memory networks (LSTMs) [47], the introduction of the self-attention mechanism allows the Transformer to process entire sequences simultaneously and effectively capture long-distance dependencies within sentences. This capability significantly reduces training time and enhances semantic understanding, enabling the model to capture richer semantic and contextual information. Consequently, the Transformer excels in various NLP tasks such as machine translation, text summarization, and question-answering systems.

2.5.1. Qwen

Qwen [48], developed by Alibaba Co. (Hangzhou, China), is a deep learning model based on the Transformer architecture, designed to enhance text generation and comprehension capabilities. It employs multiple layers of Transformer encoders and decoders. It uses multi-head self-attention mechanisms to process input sequences, capture contextual information, and learn long-distance dependencies between words within sequences. This provides significant advantages when handling long texts. Qwen is characterized by its support for multilingual processing capabilities and efficient data compression rates, utilizing relative position encoding (RoPE) and digit segmentation to improve compression and efficiency.

2.5.2. BLOOMZ

BLOOM [49,50], developed and open sourced by BigScience, is a Transformer-based model. BLOOMZ is a multilingual model fine tuned on a large scale based on BLOOM, focusing on multilingual processing and cross-cultural understanding. Its architecture is similar to the standard Transformer but includes the ability to fine tune across various tasks. BLOOMZ leverages large-scale pre-training and multilingual data to enhance performance across different languages and cultural contexts, supporting text output in 46 languages and 13 programming languages. It excels in multilingual machine translation, cross-language text summarization, and multilingual question-answering systems, demonstrating excellent zero-shot task generalization capabilities.

2.5.3. Large Language Model Meta AI

Large Language Model Meta AI (Llama) [10,51,52] is a series of large-scale language models developed by Meta, with Llama 3 being the latest version as of April 2024. It is a system optimized for large-scale language models, designed to improve the deployment efficiency of Transformer models in resource-constrained environments by maximizing the utilization of computational resources to enhance inference performance. Its architecture is trained based on the traditional Transformer self-attention mechanism and performs well in multilingual and multitasking environments. Its unique feature is the optimization of computational and memory usage.
Llama introduces a large language model block optimization system that dynamically allocates model blocks based on available resources, thus improving computational efficiency. It performs outstandingly in tasks requiring efficient computational resource utilization, such as large-scale text classification and topic modeling. Its optimized resource utilization makes it ideal for deploying large-scale language models on mobile devices and edge computing environments.
Llama 3 has performed well on multiple standard test sets, excelling in generating long texts and understanding complex contexts. Its architectural design allows for faster data processing and results under the same hardware conditions, which is crucial for applications requiring frequent inference and generation. Therefore, this study selected Llama 3 as the main framework.
In summary, the main contributions of this study are as follows:
  • Propose a novel integrated nutritional advisory system utilizing multimodal deep learning techniques to automate and enhance the dietary assessment process.
  • Integrate a zero-shot learning model for food classification, significantly enhancing the system’s ability to recognize various food categories.
  • Utilize a learning-based multi-view stereo method for food volume measurement, eliminating the need for additional hardware devices to achieve the desired results.
  • Employ a large language model to generate personalized dietary recommendations, providing users with appropriate reminders and aiding in analyzing health conditions.

3. Approach

This study aims to analyze image data and combine various models to calculate the nutritional content of food and provide subsequent dietary recommendations.
Through the following process, the system can accurately identify food categories and provide detailed nutritional content and practical dietary advice to support users in achieving a healthier diet. This research methodology integrates advanced image processing techniques and artificial intelligence algorithms, demonstrating efficient and practical performance in real-world applications.

3.1. Food Image Classification

Contrastive learning [23,24,25,26] has increasingly become a mainstream method in deep learning in recent years, and it is used for learning meaningful representations. The core idea of this learning framework is that semantically related concepts should have similar representations, while non-related concepts should have different representations. Contrastive learning was initially used mainly for self-supervised image representation learning [23,26] and has gradually expanded to the linguistic fields [24,25]. Recent studies have further leveraged contrastive training to integrate different communication modalities, such as vision and language, audio and language, etc. These models learn the concepts of other modalities and optimize their proximity in a shared abstract space.
CLIP [5] is a multimodal neural network that combines vision and language, and it is trained through a contrastive learning method specifically designed to associate visual concepts with corresponding textual descriptions. The model includes an image encoder and a text encoder, which map image and text representations into the same vector space, training the model to bring related images and descriptions closer together in this space. However, although CLIP performs well in general tasks, it requires further fine tuning and optimization for specific domain applications, such as food classification. This study aims to develop and evaluate a pre-trained model specifically designed for the food domain—NutritionCLIP—through contrastive learning.
This section focuses on improving the accuracy of the food classification model by fine tuning the CLIP model. This process involves specific training of the image and text encoder to optimize their ability to process data in the food domain.
During the dataset processing stage, as described in Section 4.2.1, we divide the datasets into three parts: training set, validation set, and testing set. Each image is converted into a fixed-size tensor and standardized to improve data consistency. Next, using ViT [21] as the image encoder, these standardized images are transformed into feature vectors I . For text processing, considering the specific requirements of regional languages, Chinese-RoBERTa-wwm-large [53,54] is chosen as the text encoder to handle Chinese inputs and convert the text into feature vectors T .
After data feature processing, contrastive learning is used to learn the associations of image–text pairs in different batches. Since the embedded vectors in CLIP are high-dimensional and focus on the similarity between vectors, cosine similarity [55] is selected as the measure. The primary calculation method is as follows:
s i m i l a r i t y I , T = I T I T
where I and T are the image and text embedding vectors, respectively, and I and T represent their norms.
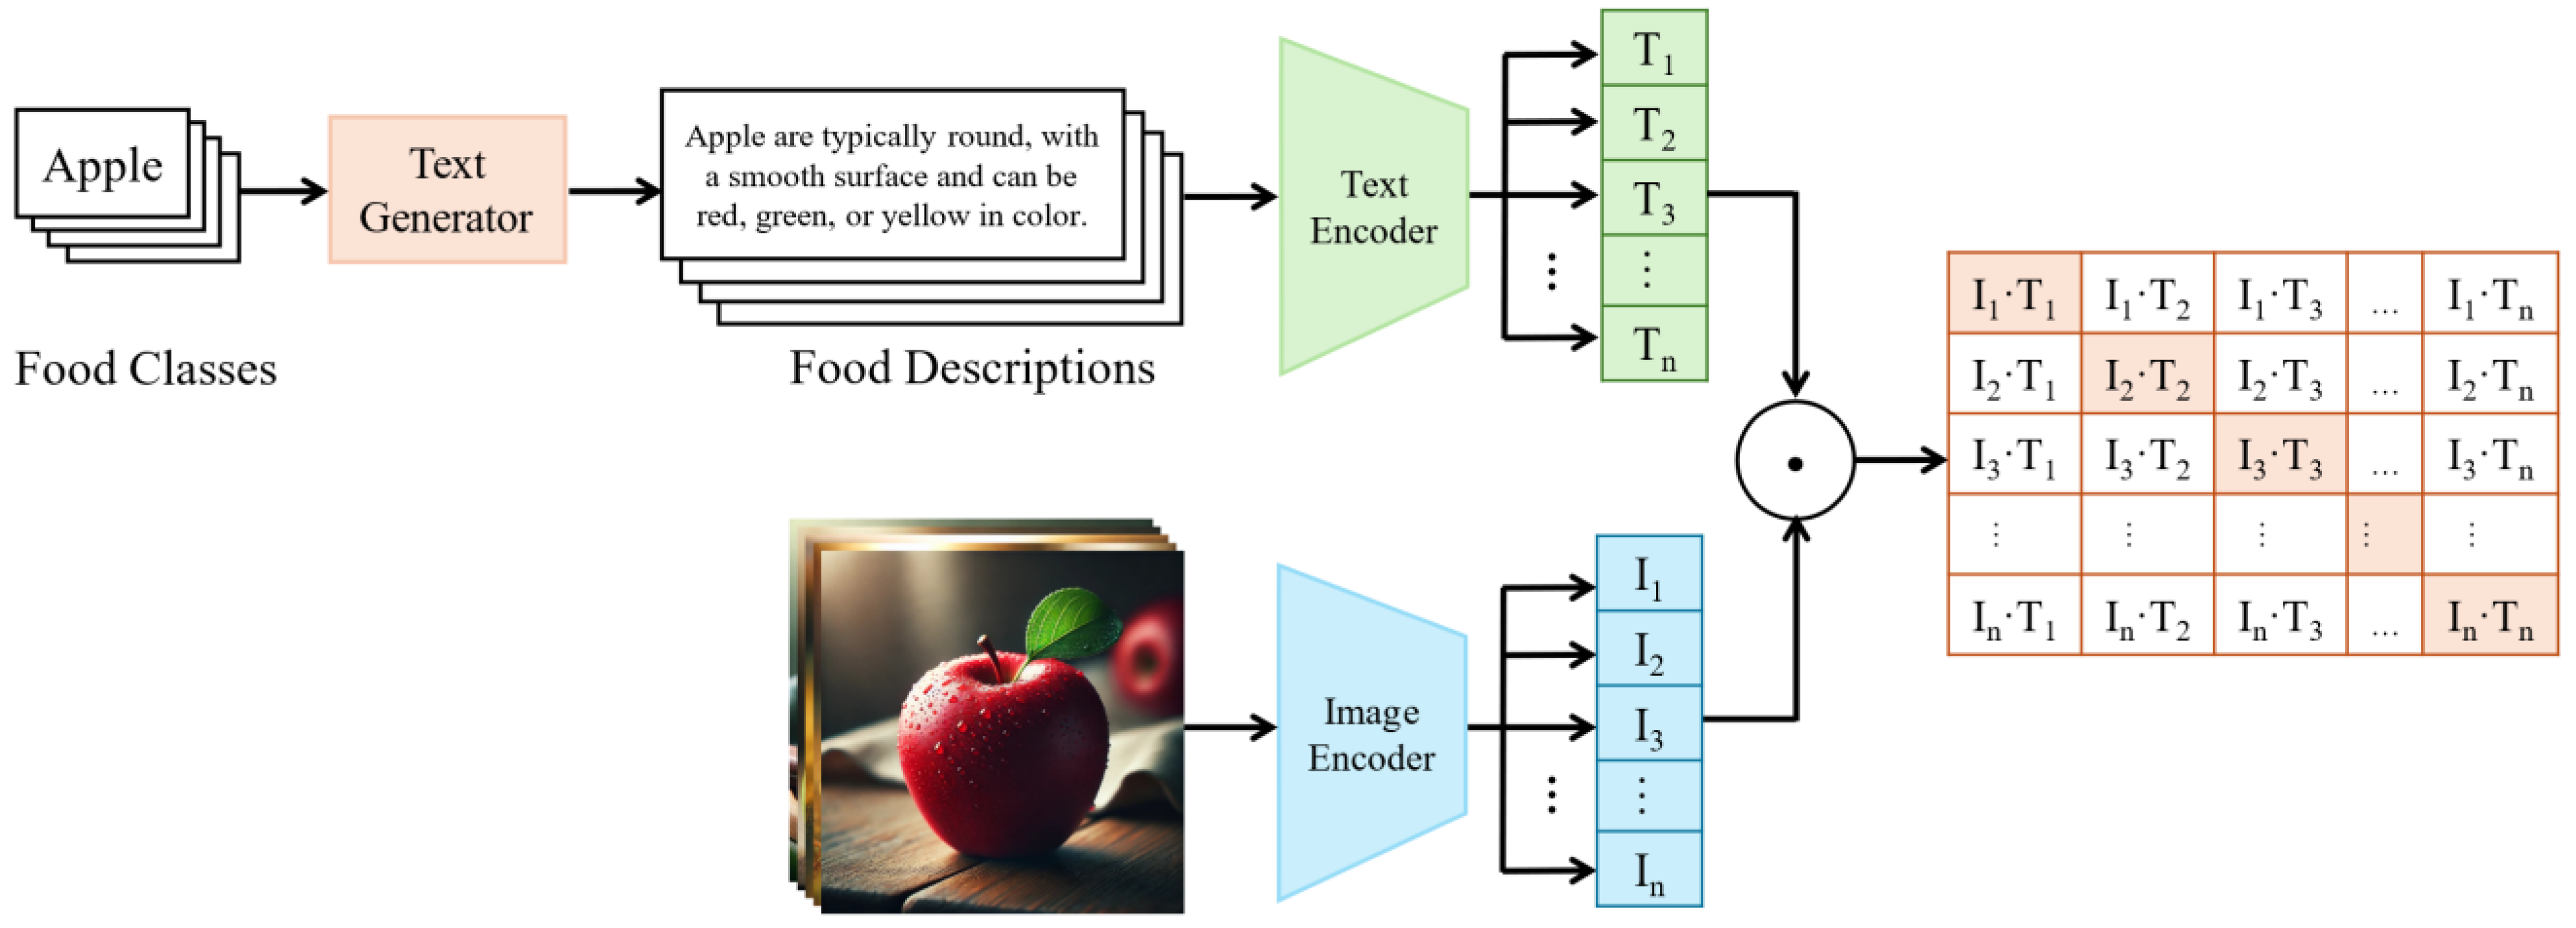
For each batch of n pairs of images and texts I n , T n , CLIP calculates a similarity matrix of size n × n , where each element’s similarity I i , T j represents the cosine similarity between the i t h image embedding vector and the j t h text embedding vector. Each row of this similarity matrix represents the similarities between an image embedding vector and all text embedding vectors, and each column represents the similarities between a text embedding vector and all image embedding vectors, as shown in Figure 3.
Next, the model is trained based on contrastive loss, maximizing the similarity between matching image and text pairs and minimizing the similarity between non-matching pairs. The calculation method is as follows:
L c o n t r a s t i v e = i = 1 n p a i r i 1 s i m i l a r i t y I i , T i + 1 p a i r i max 0 , s i m i l a r i t y I i , T i α
where n is the number of samples and α is a margin hyperparameter. p a i r i indicates whether it is a matching pair. If I i and T i are matching, then p a i r i = 1 ; otherwise, p a i r i = 0 .
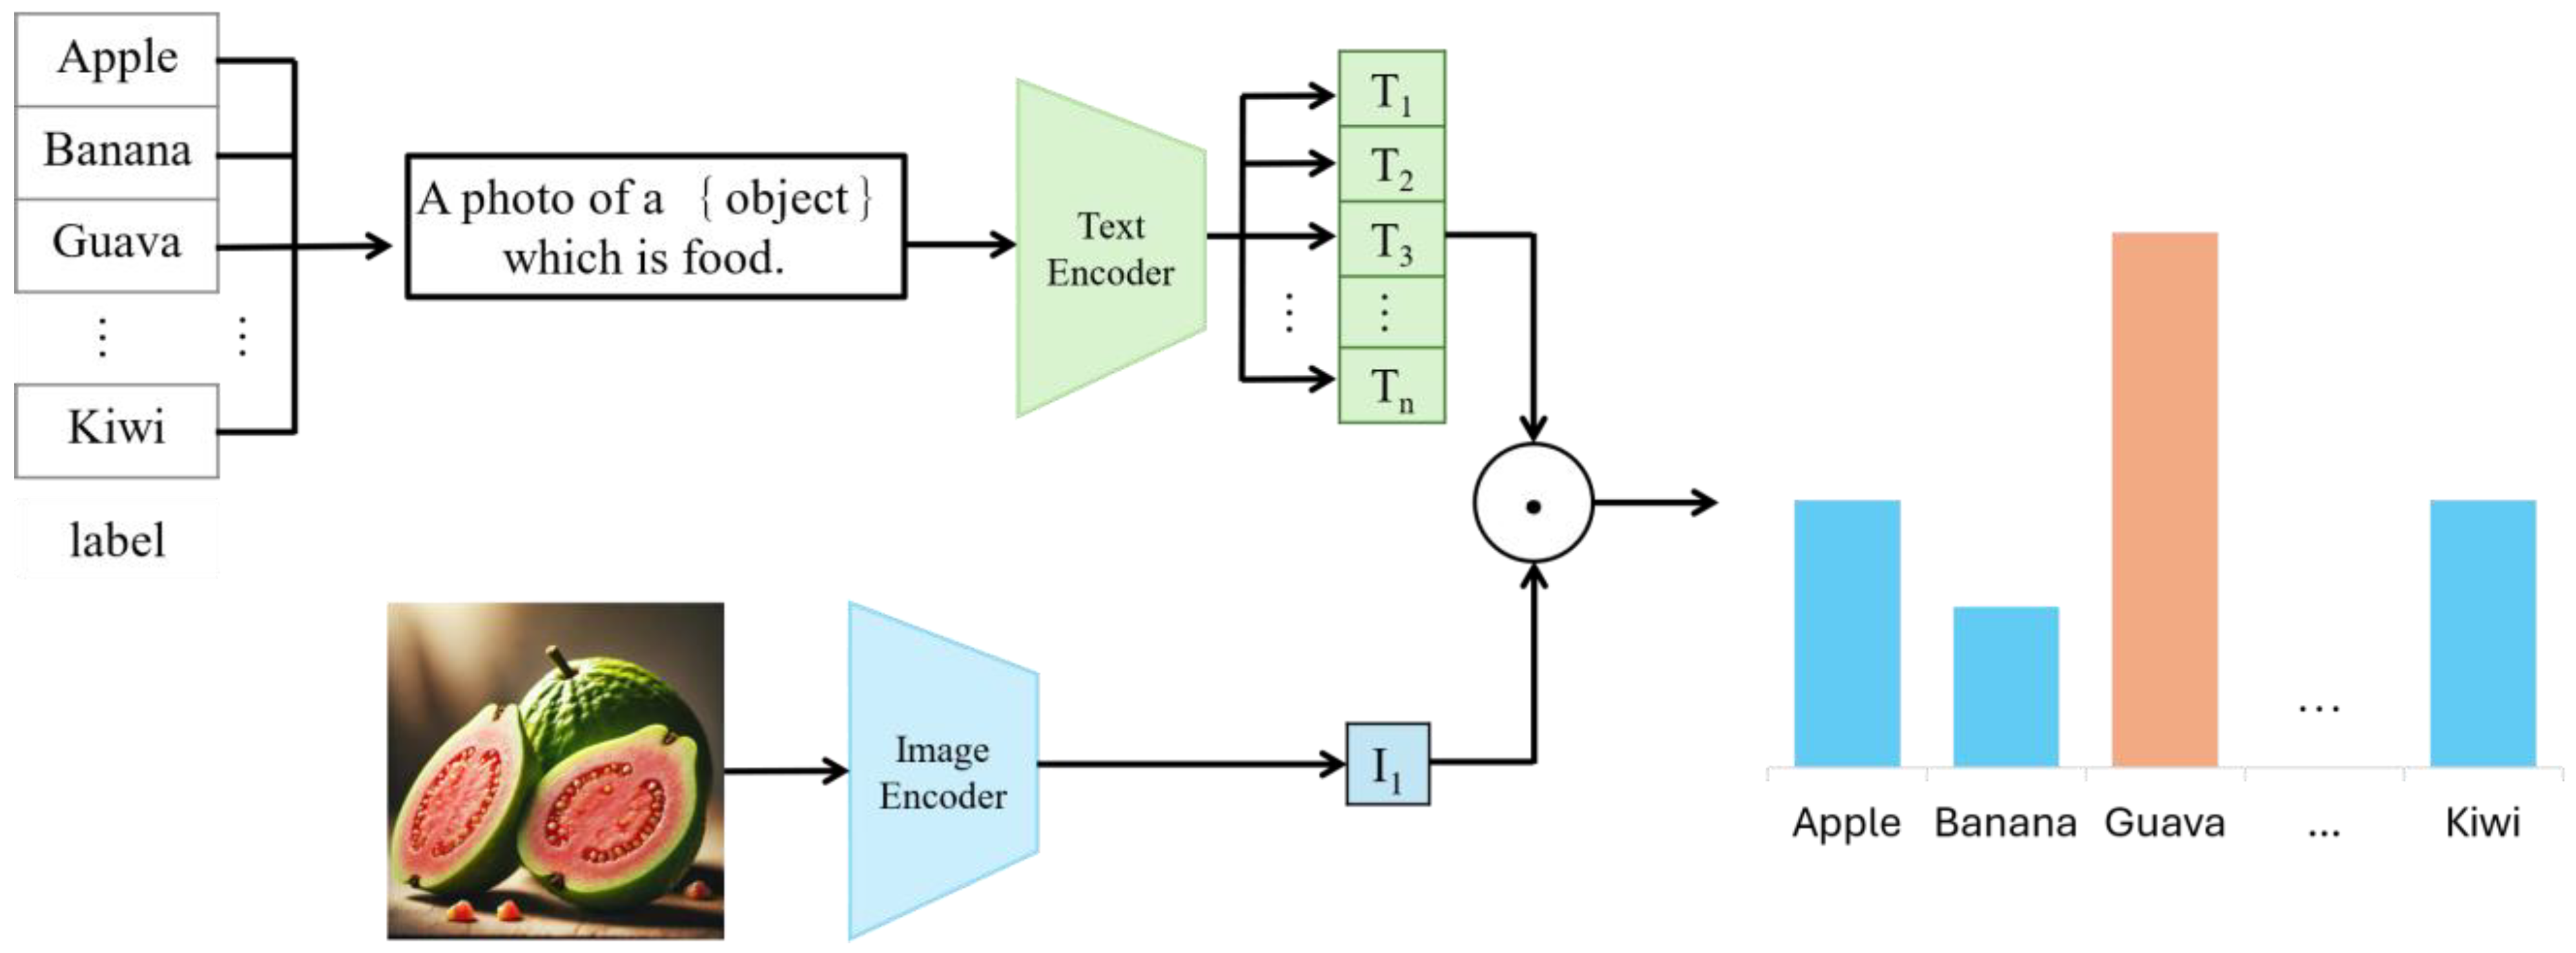
Finally, cross-entropy loss is used to classify and predict each image as the correct food category. The calculation method is as follows:
L C E = i = 1 n l a b e l i log p i
where l a b e l i represents the actual label, usually a one-hot vector indicating that sample i belongs to a specific category. p i is the predicted probability. Fine tuning the model can be used for zero-shot classification of food categories, as shown in Figure 4.

3.2. Food Volume Measurement

After food classification, the next step is to calculate the volume of the food. Using the method from E-Volume [7], MVSNet [33] generates depth maps of the image scene. These depth maps are then converted into scene point clouds using a point cloud generator, allowing for object segmentation and an accurate food volume estimation.
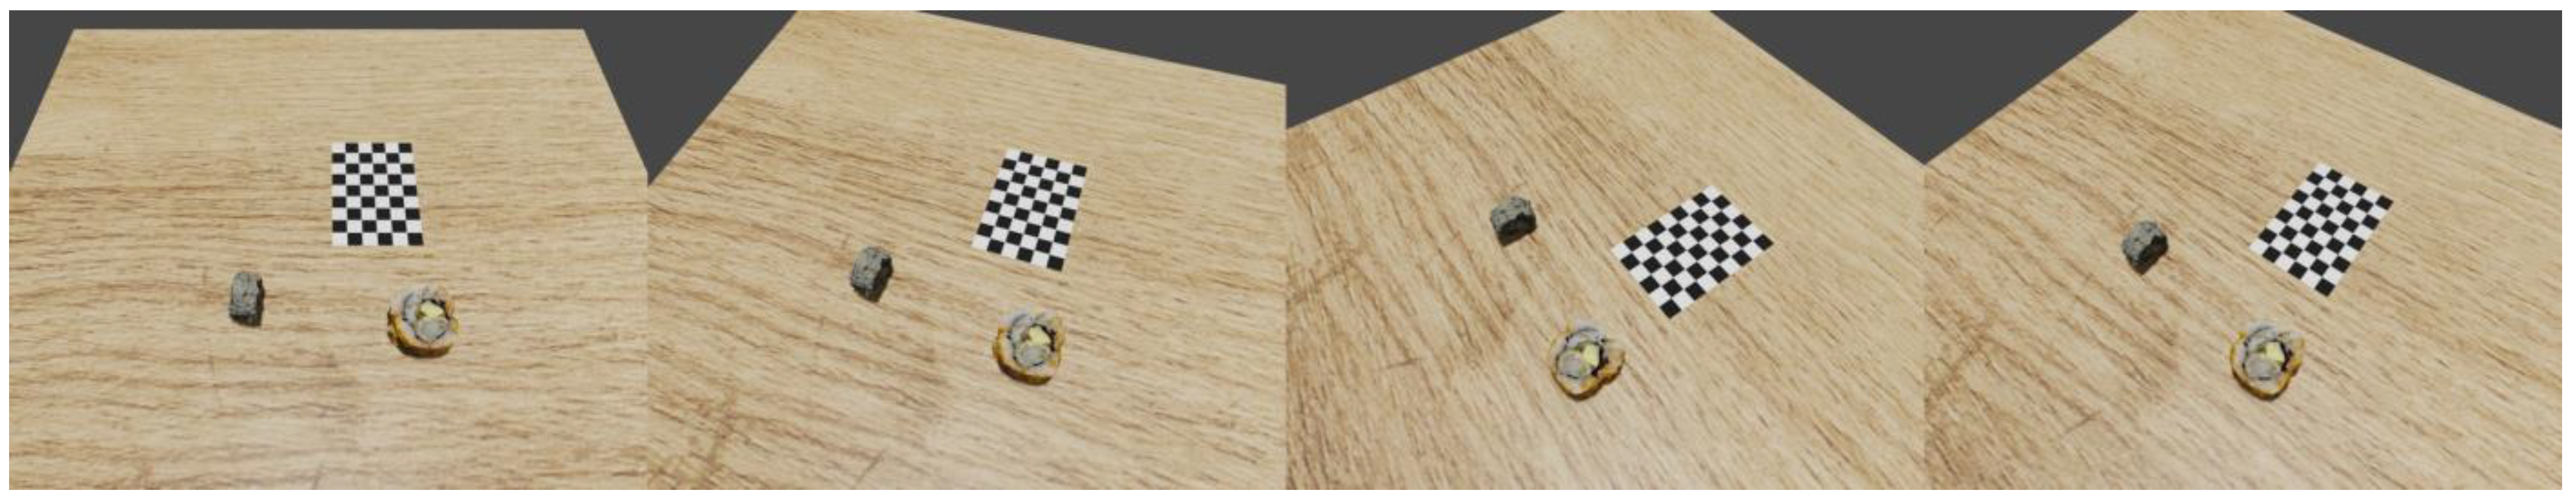
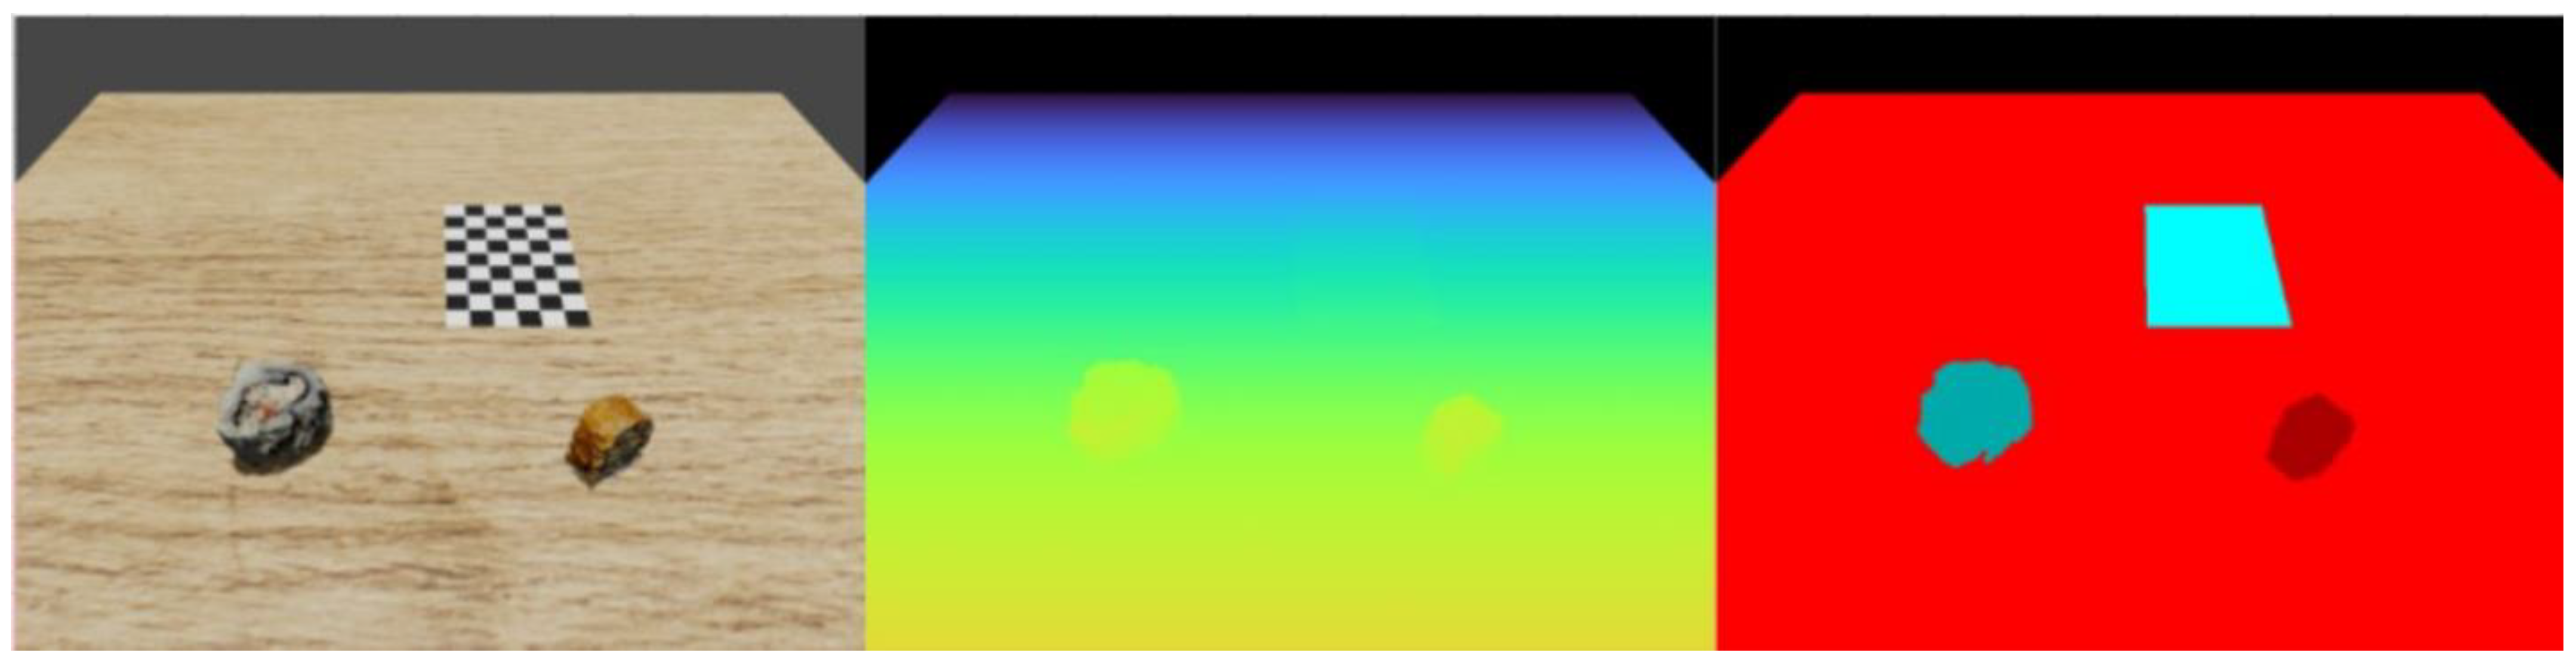
First, the food 3D models from the NutritionVerse3D [56] dataset are rendered onto a plane using Blender to generate precise scene image data, as shown in Figure 5.
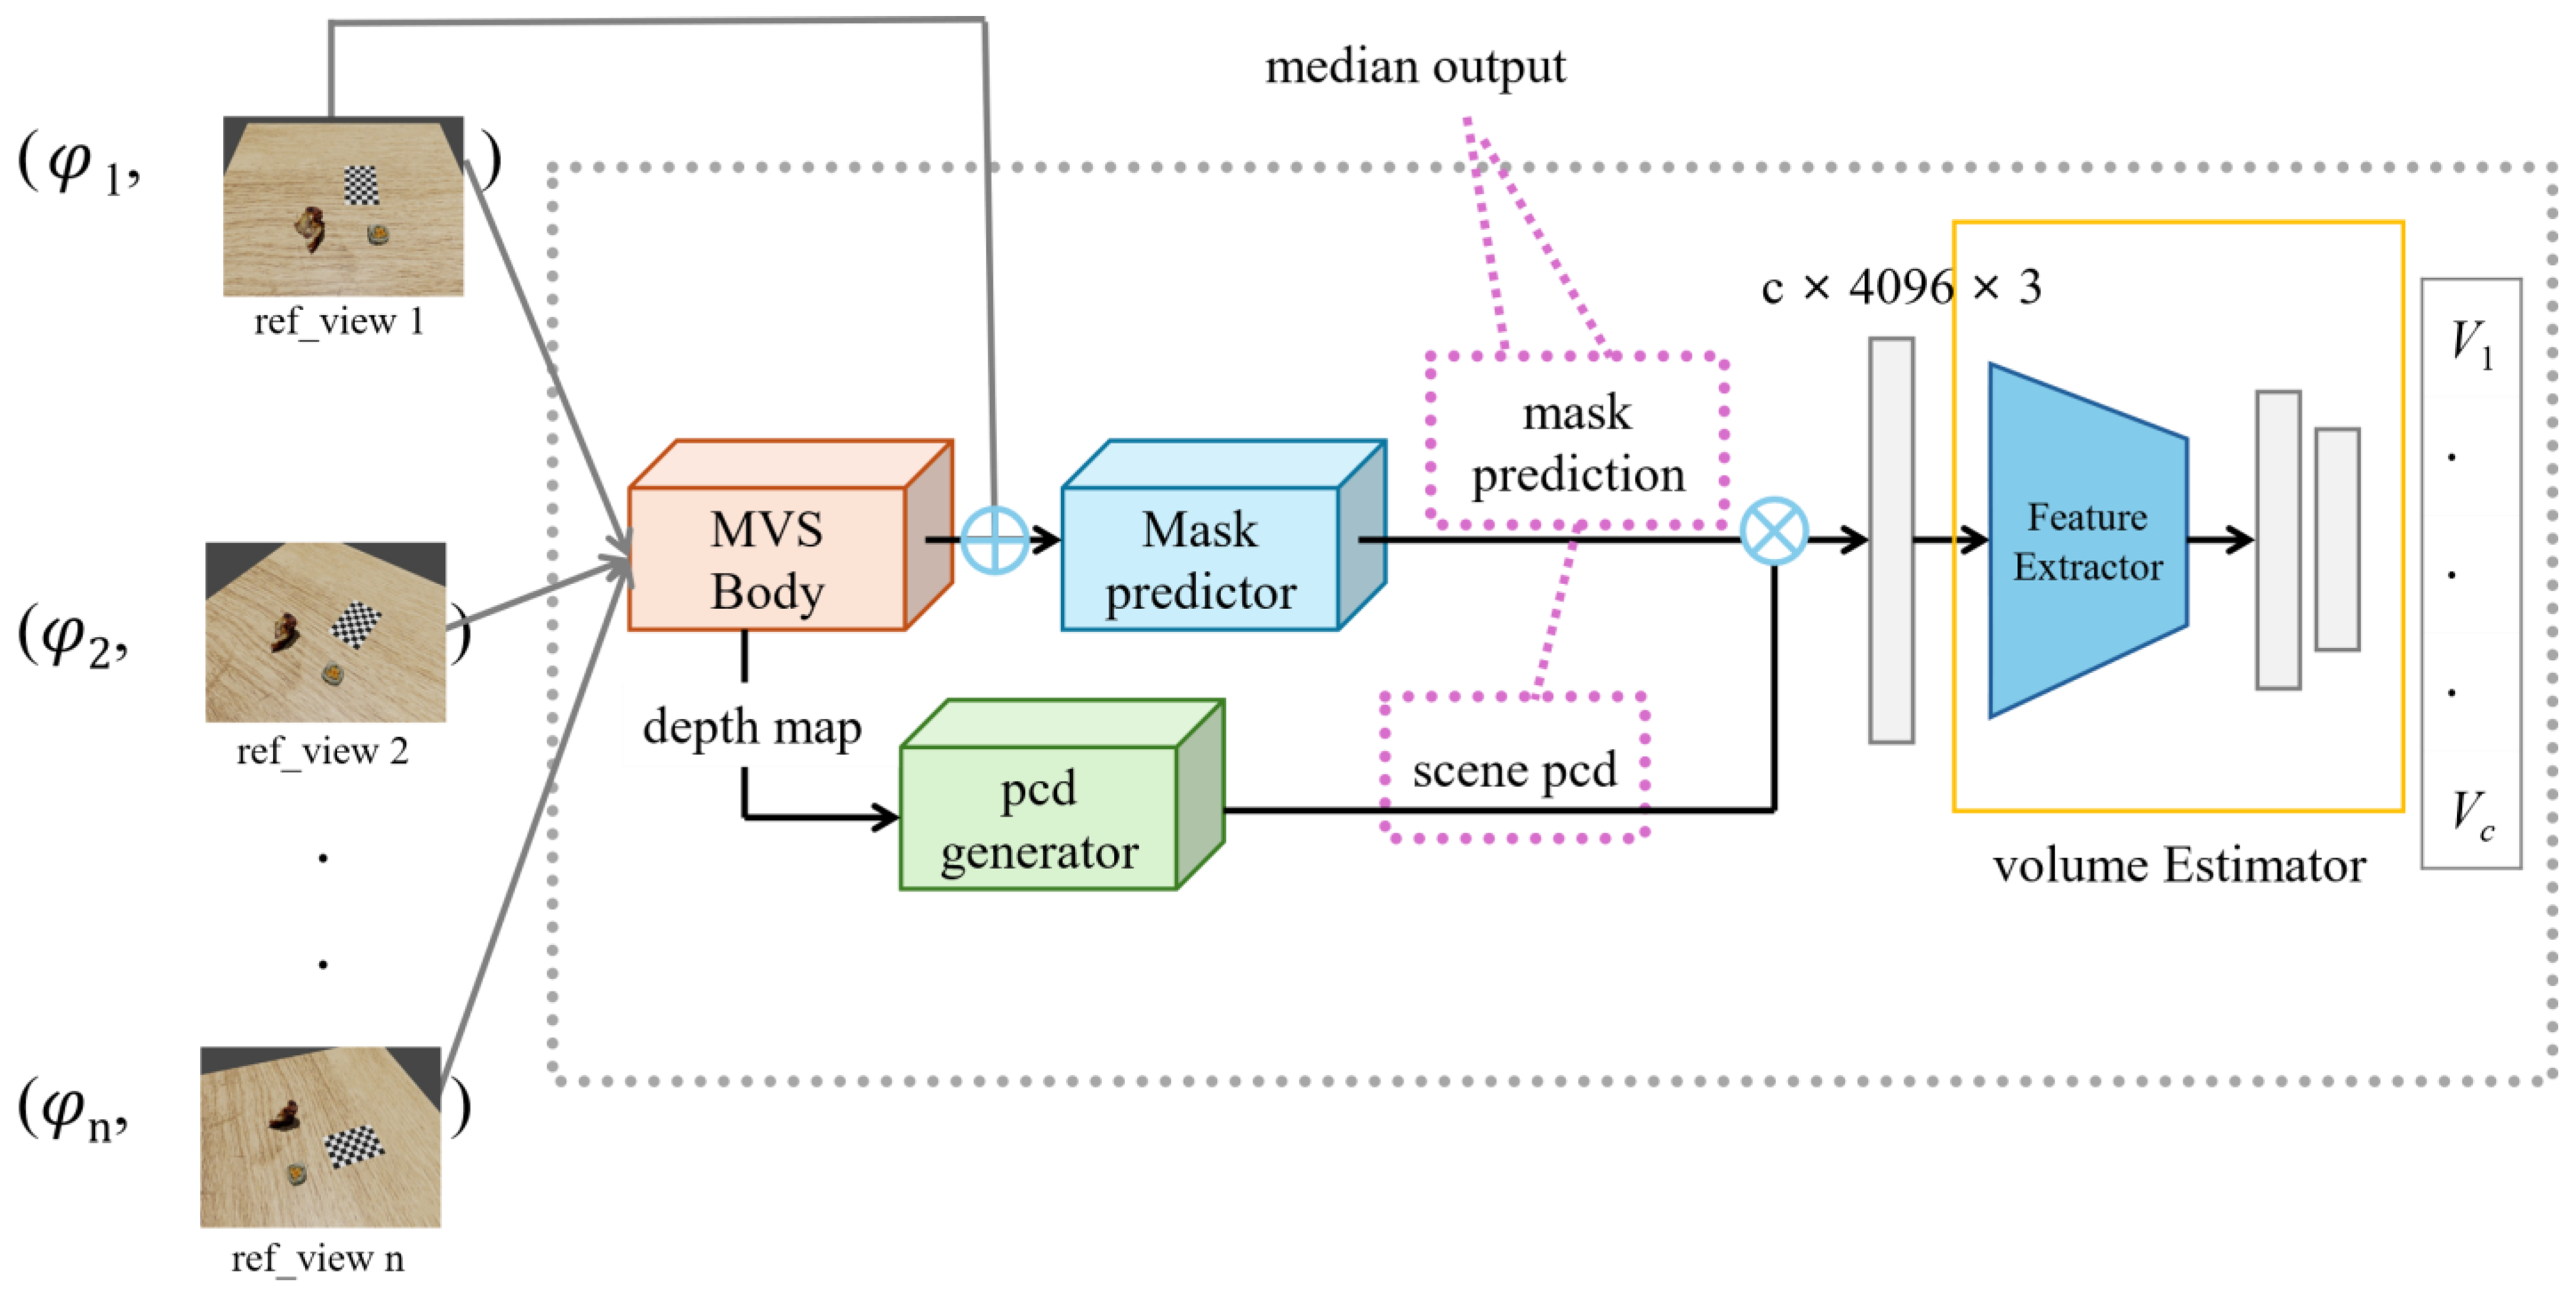
After generating scene data from different angles, the E-Volume architecture is used for volume prediction. MVSNet is used to produce depth maps of the scene. The generation method involves capturing multiple images of the scene from different perspectives with each image I i R H × W × 3 , where H and W are the height and width of the image, respectively. The input images are then passed through an eight-layer CNN for feature extraction to obtain deep features. A differentiable homography transformation is used to warp the features extracted from different viewpoints into a standard reference frame, forming a three-dimensional cost volume C . This cost volume integrates information from all input images to facilitate accurate depth estimation. A multi-scale 3D CNN is then used to regularize the cost volume, generating probability volumes from which depth maps are inferred. The final depth map is obtained using the soft margin operation, calculating the probability-weighted sum of depth hypotheses.
Once the depth maps are generated, the depth value of each pixel and the camera’s intrinsic parameters are used to reproject each pixel from the depth map into 3D space, forming a dense point cloud for each viewpoint. The transformation process is as follows:
P i = d i K i 1 u i , v i , 1 T
where P i represents the corresponding point in 3D space, d i is the depth value, u i , v i are the pixel coordinates in the image, and K i is the camera intrinsic matrix.
To segment the scene and object and obtain the point cloud of the food object, a segmentation mask generated for each viewpoint is used to crop the point cloud, removing parts that do not belong to the food. This results in an object point cloud containing only the food items.
Finally, this object point cloud is processed through convolutional layers and batch normalization for feature extraction. Max pooling is used to obtain a global feature vector, capturing the overall geometric shape of the food item. This global feature vector is then fed into a fully connected layer, outputting the estimated volume of the food item through a single-channel output, as shown in Figure 6.

3.3. Nutrient Calculation

After estimating the food volume in Section 3.2, our system retrieves the corresponding density information from the INFOODS Density Database maintained by the United Nations Food and Agriculture Organization (FAO). The total weight of the food is obtained by applying the density values to the previously calculated volumes.
Once the weight of each food item is determined, we use an established nutrition database to estimate the nutritional content of the food. These databases include the Food Composition Database, integrated by the Ministry of Health and Welfare of Taiwan, and the International Network of Food Data Systems (INFOODS), maintained by the FAO. We extract basic nutritional information from these resources: calories, protein, fat, and carbohydrates. This allows the system to provide accurate nutritional values for the foods.

3.4. Nutritional Advisory System

In our system, to deploy a large language model on mobile devices for providing personalized dietary advice and answering user nutrition-related questions, we have used Meta’s Llama 3 (Large Language Model Meta AI) as the core large language model to optimize performance.
We fine tuned Llama 3 using publicly available datasets such as alpaca_gpt4_en, alpaca_gpt4_zh, Animal-nutrition-alpaca, and Animal-nutrition-new-alpaca. These datasets include basic knowledge and nutrition-related datasets to ensure a diversity of information, and some prompting phrases are added to train the model.
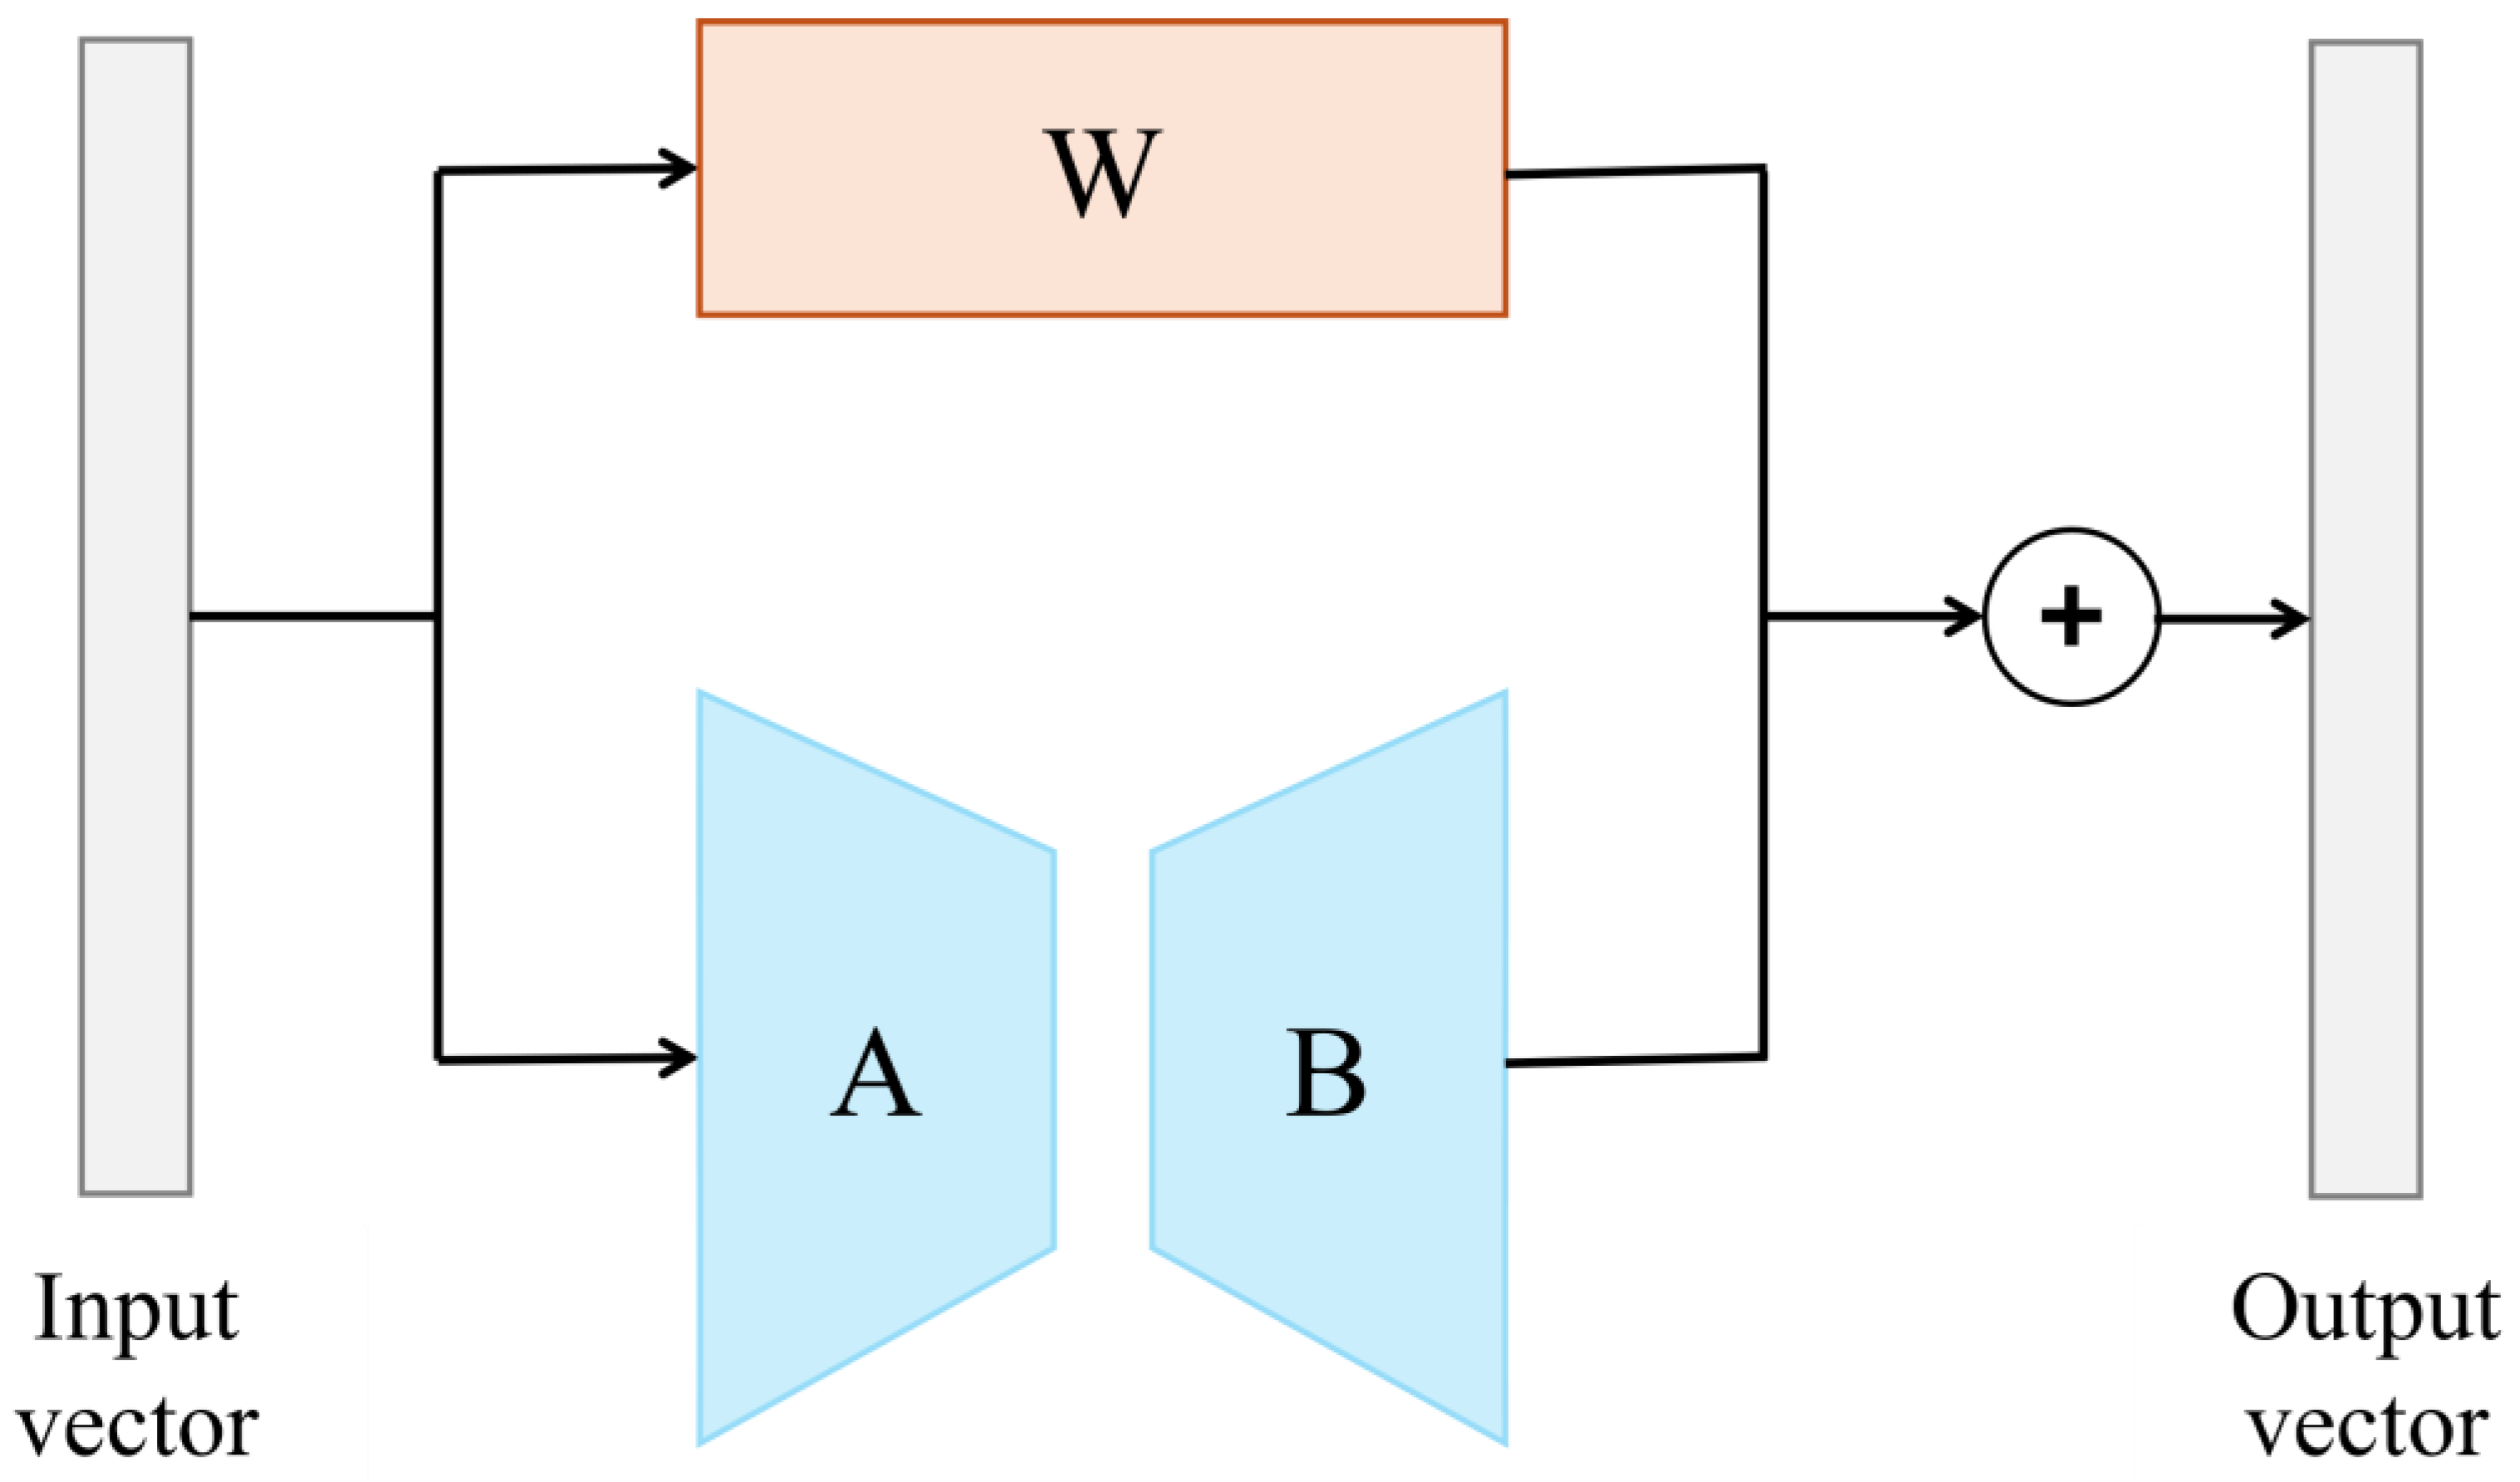
To further enhance the performance of Llama 3 in nutrition question answering and diet recommendation generation, we adopted LoRA (Low-Rank Adaptation) [57] for model fine tuning. LoRA is an efficient model adaptation technique that aims to achieve effective knowledge transfer by lightweight adjustment of the pre-trained model through low-rank matrix decomposition, as shown in Figure 7. This involves decomposing the weight matrix of the large pre-trained model into two low-rank matrices, reducing the number of parameters in the adjustment process and making the fine-tuning process lighter and more efficient. This approach retains the original capabilities of the pre-trained model while quickly adapting to new data and tasks, which is particularly beneficial for application scenarios requiring frequent model updates and adjustments.
The process of fine tuning the model using LoRA can be expressed with the following equations:
Δ W = W W = A · B
where W is the original weight matrix of the pre-trained model, W is the weight matrix after fine tuning, and A and B are low-rank matrices, with A R d × r , B R r × k , and rank r min d , k . This decomposition significantly reduces the number of parameters that must be trained, thereby improving computational efficiency.
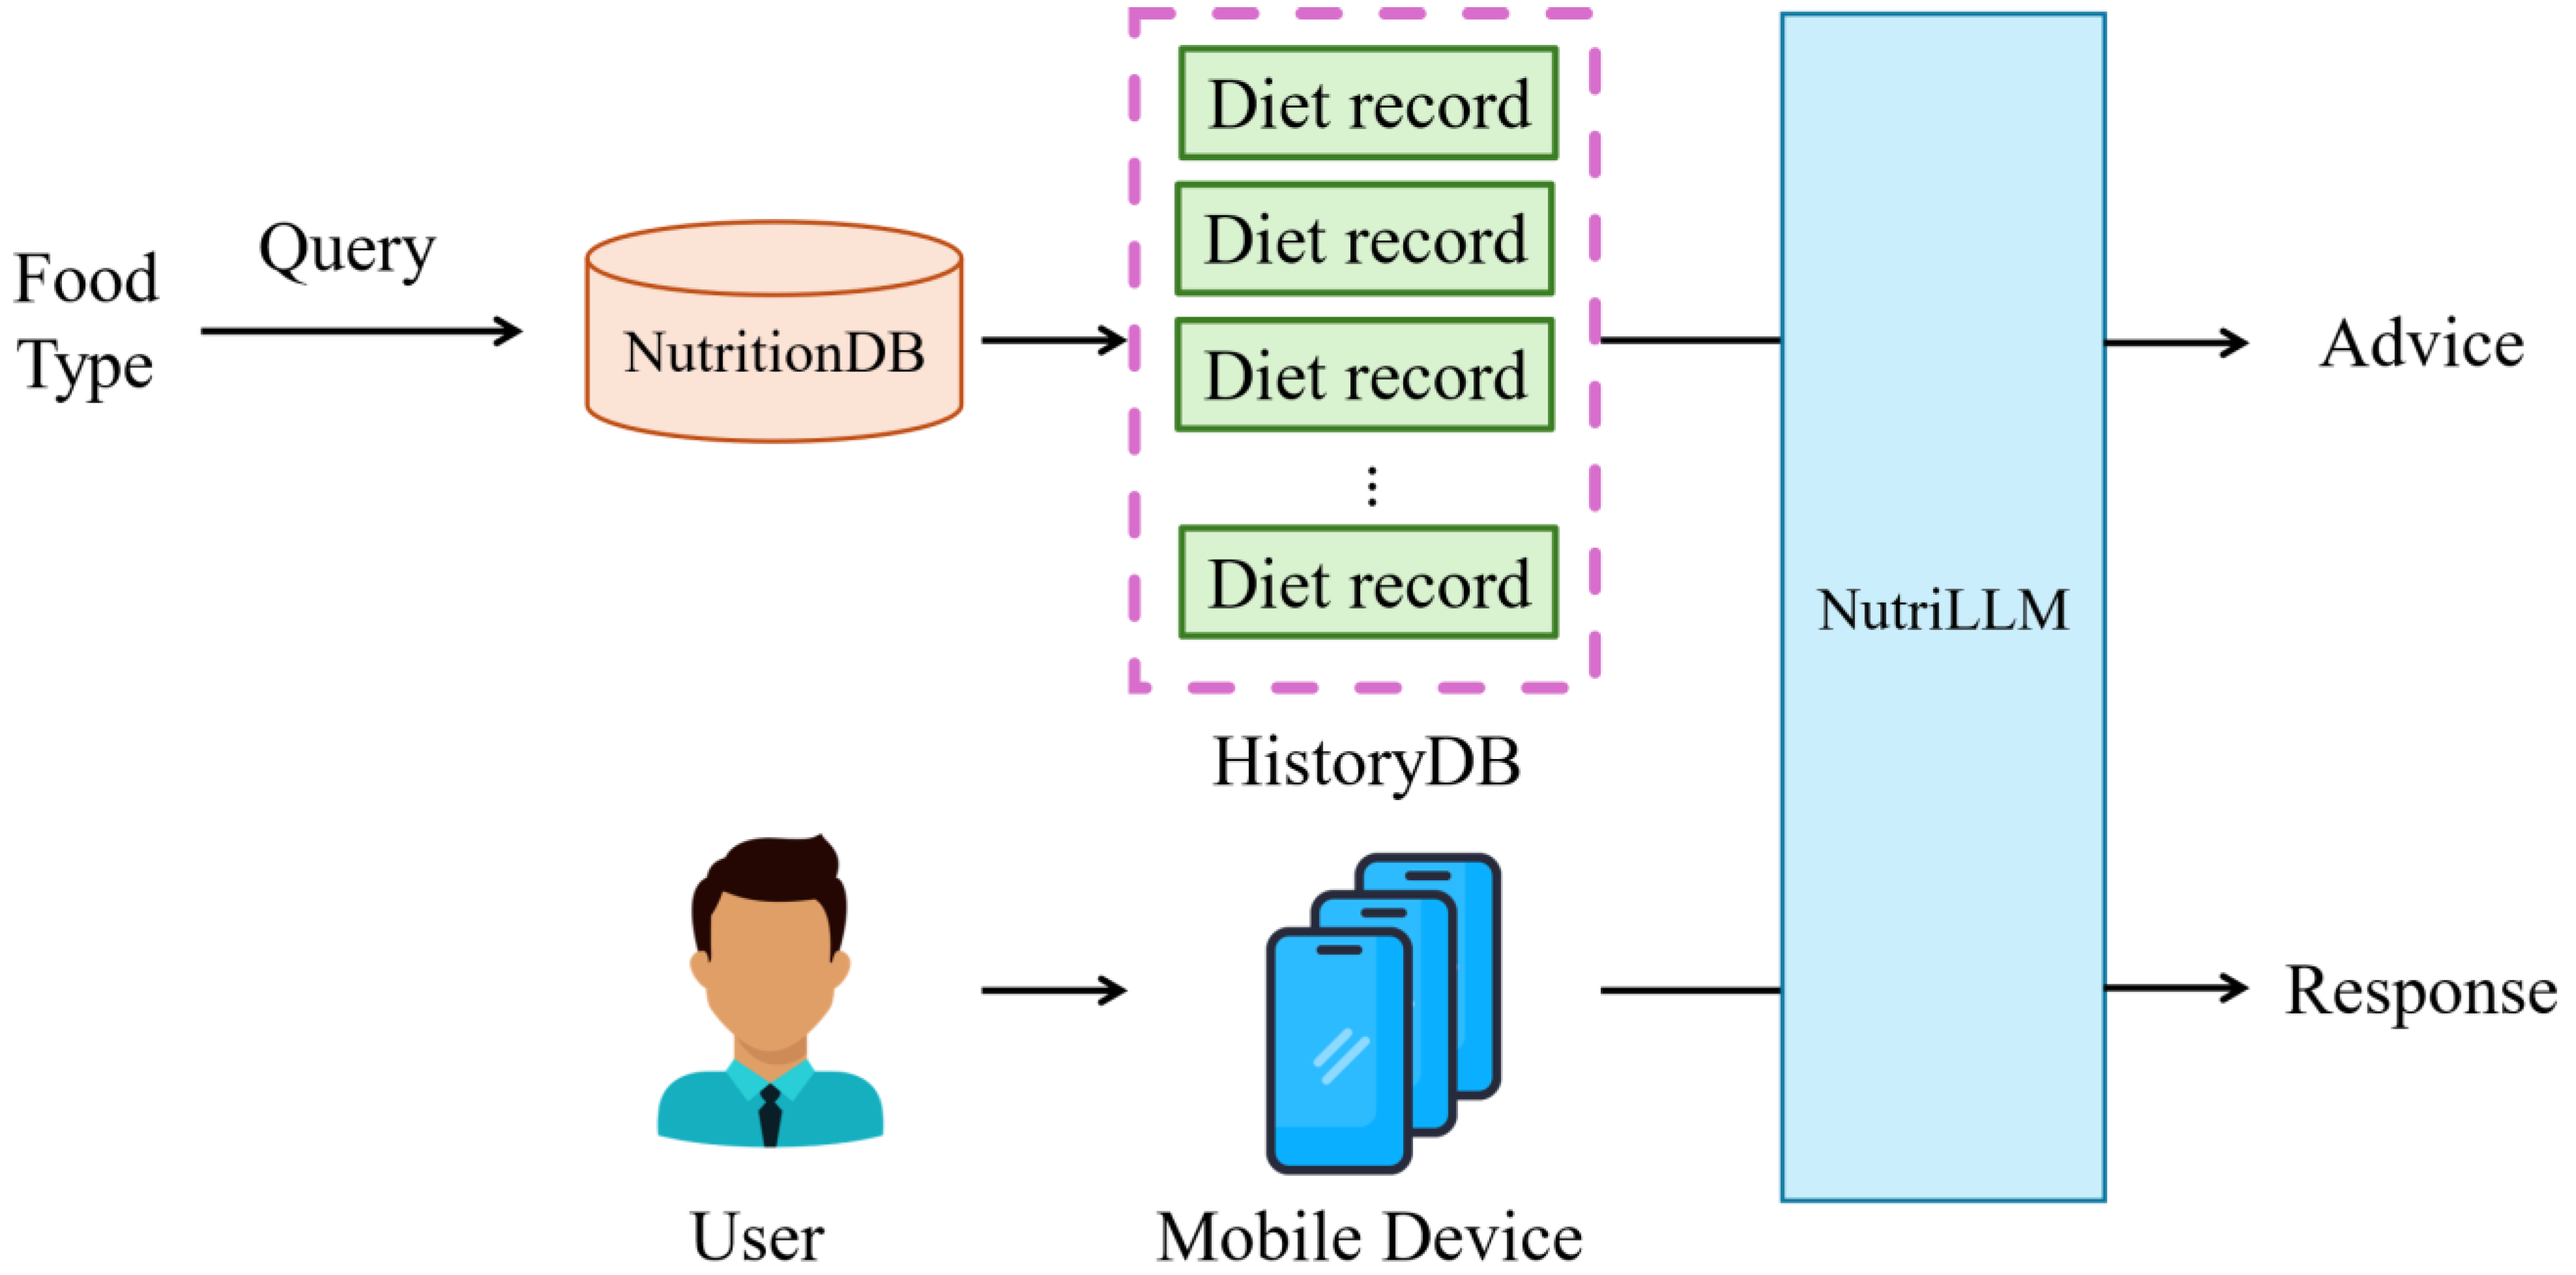
Using this method, we have successfully fine tuned Llama 3 to handle nutrition-related queries and generate personalized dietary recommendations. This enables our system to provide nutritional value calculations for food and offer practical dietary advice based on the user’s personal needs and nutritional records, helping users achieve a healthier eating pattern, as shown in Figure 8.

3.5. Architecture

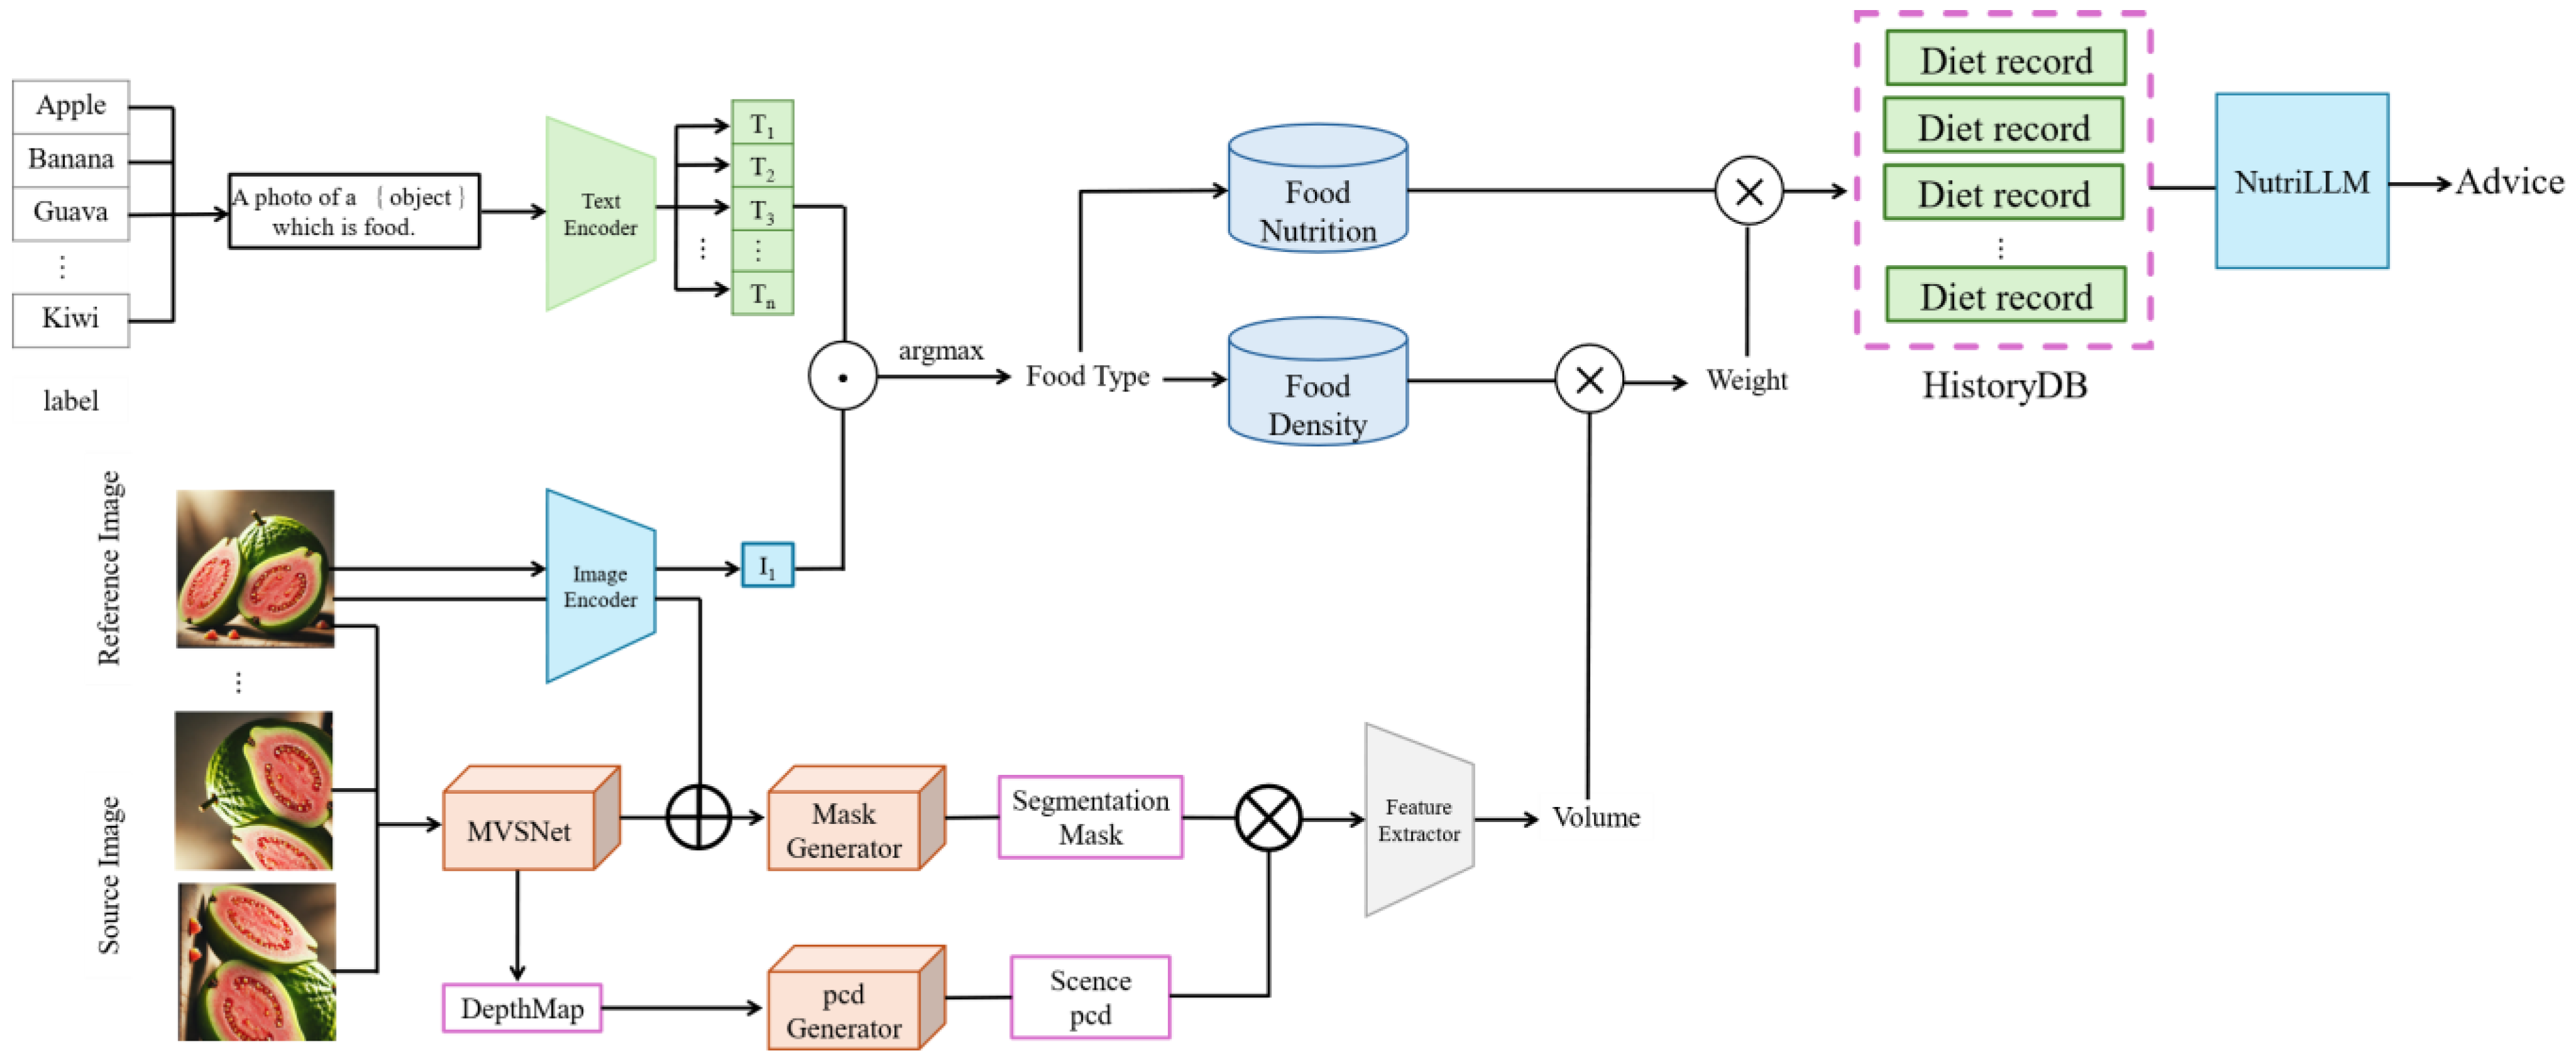
The system integrates multiple advanced multimodal deep learning models into a coherent pipeline to facilitate accurate food classification, volume estimation, nutrient calculation, and personalized dietary recommendations. Figure 9 illustrates the overall architecture and workflow of the proposed nutritional advisory system, highlighting the interactions and data flows between the core modules: NutritionCLIP, E-Volume, nutrient calculation, and NutriLLM.

3.5.1. NutritionCLIP Module

The first stage involves recognizing and classifying the food images provided by the user. We utilize the NutritionCLIP model, specifically fine tuned for food domain tasks based on the CLIP framework. The NutritionCLIP comprises two main components:
  • An image encoder, which employs a Vision Transformer (ViT) to convert standardized images into meaningful feature vectors III.
  • A text encoder, which utilizes Chinese-RoBERTa-wwm-large for processing Chinese textual descriptions of food, converting them into textual embedding vectors T.
NutritionCLIP applies a contrastive learning approach, mapping related image–text pairs into a shared semantic space and pushing apart unrelated pairs. Cosine similarity serves as the metric for measuring feature vector similarities. The model optimizes classification accuracy through a combined contrastive loss and cross-entropy loss strategy, ensuring accurate zero-shot food recognition across diverse and previously unseen food categories.

3.5.2. E-Volume Module

Following classification, the system accurately estimates food volume using the E-Volume module, a learning-based multi-view stereo (MVS) approach. The process begins with the data pre-processing stage, leveraging the NutritionVerse3D dataset, which includes the following diverse 3D food models:
  • Data Generation. Food models are randomly sampled and rendered onto real-world dining table scenarios using Blender, generating a rich dataset of realistic food scene images from various perspectives.
The E-Volume volume estimation comprises several sub-components:
  • MVS body predicts depth maps for each viewpoint through a learning-based MVS approach, using MVSNet as the backbone network to generate robust 3D reconstructions.
  • Mask predictor conducts semantic segmentation on selected images to produce masks delineating food objects from their surroundings clearly.
  • Point cloud generator integrates depth information from multiple viewpoints, synthesizing comprehensive scene point clouds.
  • Object point cloud extraction employs generated segmentation masks to isolate food objects from the scene point cloud, preparing precise input for volume calculation.
Finally, the isolated food object point clouds undergo convolutional neural network processing, extracting global geometric features and producing accurate food volume estimations.

3.5.3. Nutrient Calculation Module

With the food category and volume identified, the system computes the corresponding nutritional information by referencing the following authoritative food density and nutrient databases:
  • The Food Density Database retrieves density values corresponding to the identified food categories.
  • The Food Composition Database calculates the nutritional content, including calories, protein, fat, and carbohydrates, based on the determined food weight (derived from density and estimated volume).
The output from this stage generates a detailed nutrient profile, enabling precise dietary tracking and management.

3.5.4. NutriLLM Module

The final module employs a fine-tuned large language model (LLM), NutriLLM, to provide personalized dietary recommendations tailored to individual health goals and historical dietary data. NutriLLM utilizes Meta’s advanced Llama 3 architecture due to its optimized computational and memory efficiency, which is well suited for mobile deployment.
  • Training Data. NutriLLM undergoes extensive fine tuning with large, publicly available datasets encompassing general nutritional knowledge and targeted nutrition-specific dialogues.
  • Low-Rank Adaptation (LoRA). Applies LoRA to efficiently fine tune the pre-trained model. LoRA significantly reduces the computational load by decomposing weight matrices into lower-rank components, facilitating rapid and efficient model adaptation.
NutriLLM excels in generating contextually relevant and personalized dietary recommendations, leveraging users’ historical dietary records and current nutritional assessments to provide tailored advice. It supports extensive interactions, effectively parsing user queries and generating coherent nutritional guidance, contributing to a comprehensive dietary management experience.

3.5.5. Integration and Data Flow

These core modules are seamlessly integrated into an automated pipeline as follows:
1.
Users upload images of their meals, which are initially processed by NutritionCLIP to determine the food category.
2.
The classified images feed into E-Volume for multi-view stereo-based volume estimation, yielding accurate measurements of food quantities.
3.
The nutrient calculation module subsequently computes comprehensive nutritional information using authoritative food databases.
4.
Finally, NutriLLM synthesizes nutritional data, historical dietary records, and personalized health objectives to deliver actionable dietary recommendations and advice directly to the user.

4. Implementation and Experiments

4.1. Experimental Environment

We ran our algorithm on a device with the following hardware configurations, and Table 2 shows the detailed experimental environment.

4.2. Datasets

4.2.1. NutritionCLIP Datasets

To effectively fine tune the CLIP model for the specific needs of the food domain, this study utilizes large, publicly available food image datasets such as Food 101 [58], CNFOOD-241 [59], and Taiwanese Food 101 [60] as image inputs. The Food 101 dataset primarily includes a collection of popular food items, encompassing 101 food categories. Considering the highly diverse dietary habits in different regions, the CNFOOD-241 and Taiwanese Food 101 datasets are specifically introduced to enrich the model’s regional adaptability. CNFOOD-241 comprises 241 types of Chinese cuisine, while Taiwanese Food 101 contains 101 kinds of Taiwanese snacks, ensuring that the classification results better align with local dietary cultures.
In Table 3, “Train”, “Validation”, and “Test” represent the number of data points divided from each dataset into training, validation, and testing sets, respectively.
GPT-3.5 [44] is also employed to augment the textual data input to enhance the model’s language understanding capabilities. Using the names of food categories as inputs, GPT-3.5 generates detailed textual descriptions of various foods guided by prompts. These descriptions cover aspects such as the color, appearance, and standard serving containers of the foods, providing rich and semantically meaningful data as textual input for the model. This enhancement improves the accuracy and applicability of the model in food classification, better meeting specific application requirements.

4.2.2. Food Volume Estimator Datasets

This section will primarily introduce the dataset used in the volume measurement experiment. Its main content is the same as mentioned in Section 3.2, utilizing 3D food models from the NutritionVerse3D [56] dataset. Blender renders these models onto a flat surface, producing precise scene image data. A total of 400 different scene datasets were generated, and based on the experimental results from E-Volume [7], each scene is set to have 40 images to achieve the best prediction results. In our experiment, to compare the test accuracy of different food categories, we further divided the dataset into the following four categories, as detailed in Table 4.
The above four categories are used to analyze whether there are differences in measuring different types of food using the learning-based MVS method and further explore the direction of subsequent improvement.

4.2.3. NutriLLM Datasets

This chapter primarily focuses on fine tuning the Llama 3 model using the following datasets: the train and validation sets. Identity prompts direct the model, ensuring that the outputs mainly emphasize nutritional analysis. Additionally, the alpaca_gpt4 dataset is used to improve the coherence of the generated sentences. Finally, multiple nutrition-related datasets are leveraged to enhance the model’s knowledge in this domain. Table 5 shows a detailed description.

4.3. Training Procedure and Evaluation Metrics

4.3.1. NutritionCLIP Training and Evaluation Framework

The training process of CLIP fine tuning utilized the following parameters in Table 6, including batch sizes, learning rate, number of epochs, choice of optimizer, and the selection of an appropriate loss function.
In this training process, cross-entropy was used for classification, predicting each image as the correct food category, and it is defined as follows:
L C E = i = 1 n l a b e l i log p i
where l a b e l i is the actual label, usually a one-hot vector indicating that sample i belongs to a specific category, and p i is the predicted probability. Its main features include bias punishment, which emphasizes the predicted probability for the correct class; the resulting loss increases when the model predicts a lower probability for this class. This method is well suited for scenarios where output categories are mutually exclusive, ensuring each input sample belongs to only one category. Moreover, it typically utilizes the softmax function to calculate predicted probabilities for each category, enhancing numerical stability, especially when the model’s output range is extensive.
In the testing phase, we use accuracy, precision, recall, and F1 score to validate the performance of the food image classification problem. The definitions are as follows.
Accuracy is the proportion of correct predictions made by the model, which is the ratio of all correct predictions (true positives and negatives) to the total number of predictions. The formula is as follows:
A c c u r a c y = T P + T N N
Precision represents the proportion of instances predicted as positive by the model that are positive. The formula is as follows:
P r e c i s i o n = T P T P + F P
Recall indicates the proportion of actual positive instances correctly predicted as positive by the model. The formula is as follows:
R e c a l l = T P T P + F N
The F1 score is the harmonic mean of precision and recall used to measure the model’s overall performance. The formula is as follows:
F 1 s c o r e = 2 P r e c i s i o n × R e c a l l P r e c i s i o n + R e c a l l
where N is the total number of predictions made by the model, true positives (TPs) are the number of instances correctly predicted as positive, true negatives (TNs) are the number of cases correctly predicted as negative, False Positives (FPs) are the number of instances incorrectly predicted as positive, and False Negatives (FNs) are the number of cases incorrectly predicted as negative.

4.3.2. Food Volume Estimator Training and Evaluation Framework

The training process of multi-view stereo utilized the following parameters in Table 7, including batch size, learning rate, number of epochs, choice of optimizer, and the selection of an appropriate loss function.
In the testing phase, mean absolute percentage error (MAPE) and Mean Absolute Error (L1 loss) were used as the primary performance evaluation metrics for the model, and they are defined as follows.
MAPE is an indicator that measures the difference between predicted values and actual values by calculating the average of the absolute percentage error for each prediction. It provides the average percentage of prediction errors and is commonly used to assess the accuracy of forecasting models. The main formula is as follows:
M A P E = 1 N i = 1 N y i y i ^ y i
L1 loss is a method that measures the difference between predicted and actual values by calculating the average of the absolute differences between them. The main formula is as follows:
L 1   L o s s = 1 N i = 1 N y i y i ^
where N is the total number of data points, y i is the ground truth value, and y i ^ is the predicted value.

4.3.3. NutriLLM Training and Evaluation Framework

The training process of Llama 3 fine tuning utilized the following parameters in Table 8: batch size, learning rate, number of epochs, choice of optimizer, and the selection of an appropriate loss function.
Cross-entropy loss is one of the most commonly used loss functions in natural language processing, particularly in generation tasks, such as machine translation and text summarization. It measures the difference between the probability distribution predicted by the model and the probability distribution of the actual labels.
In the testing phase, we used the following metrics to evaluate the sentences generated by the LLM.
Bilingual Evaluation Understudy (BLEU-4) is a metric for evaluating the quality of machine translations by comparing the similarity between machine-generated and human translations. BLEU-4 specifically focuses on matching sequences of four consecutive words (4-g). Scores range from 0 to 1, with higher scores indicating closer resemblance to human translations. Its calculation involves two main steps: n-gram precision and brevity penalty (BP). The detailed definition is as follows:
B L E U = B P × exp n = 1 4 w n log p n
The following is a description of the parameters in the BLEU calculation test. p n is the n-gram precision, and it is defined as follows:
p n = T o t a l   n u m b e r   o f   n g r a m   s i n   t h e   g e n e r a t e d   t e x t N u m b e r   o f   m a t c h i n g   n g r a m   s i n   t h e   g e n e r a t e d   t e x t
w n is the weight, which is typically equal for each n-gram, such as w n = 0.25 .
Brevity penalty (BP) means that if the length of the generated text is less than the reference text, a penalty is applied.
I   a m   r u n n i n g   a   f e w   m i n u t e s   l a t e ; m y   p r e v i o u s   m e e t i n g   i s   r u n n i n g   o v e r .
where c is the length of the generated text and r is the length of the reference text.
Recall-Oriented Understudy for Gisting Evaluation (ROUGE-N).
  • ROUGE-1 mainly measures the overlap of unigrams (single words) between the generated text and the reference text. It focuses on recall by measuring the number of words in the reference text that the model predicts.
  • ROUGE-2 is similar to ROUGE-1 but focuses on bigrams (two-word sequences), measuring the overlap of consecutive word pairs in the generated text and the reference text.
  • ROUGE-L is based on the longest common subsequence (LCS). This metric considers the most extended sequence of words that appear in the generated text and the reference text in the same order, which relates to the overall structure similarity. It takes into account both precision and recall.
The metric for Evaluation of Translation with Explicit Ordering (METEOR) is a machine translation evaluation metric that considers basic word matching, synonyms, and word order matching. METEOR is designed to address some of the shortcomings of BLEU, handling synonyms and syntactic variations better, and providing a more balanced evaluation by considering precision and recall.

4.4. Experimental Results

4.4.1. NutritionCLIP Experimental Results

This section compares the results of our fine-tuned NutritionCLIP model with other zero-shot learning-based image classification models. As shown in Table 9, Table 10 and Table 11, we evaluate the performance of different models across three food image datasets—Food 101, CNFOOD-241, and Taiwanese Food 101. Each table reports key performance metrics, including top 1 accuracy, top 5 accuracy, precision, recall, and F1 score, comprehensively assessing model effectiveness in zero-shot scenarios.
The tables above show that NutritionCLIP significantly outperforms other models across all three datasets in terms of top 1 accuracy, Top 5 accuracy, precision, recall, and F1 score. This indicates that our fine-tuned NutritionCLIP model is highly accurate and reliable in food image classification.
Specifically, on the CNFOOD-241 dataset, NutritionCLIP achieved a top 1 accuracy of 0.91, far surpassing the performance of other models, demonstrating its superior adaptability to different food image datasets. The precision and recall also reached 0.88 and 0.90, respectively, indicating the model’s precision and comprehensiveness in the prediction process.
Additionally, on the Food 101 dataset, NutritionCLIP achieved a top 1 accuracy of 0.80, significantly outperforming other models. Even without specific dataset adjustments, NutritionCLIP can still provide reliable results.
On the Taiwanese Food 101 dataset, NutritionCLIP continued to perform well, with a top 1 accuracy of 0.73, showing its stable performance on diverse datasets. These results indicate that with proper fine tuning, NutritionCLIP can significantly enhance model performance in food image classification tasks.
Overall, these experimental results demonstrate the excellent performance of our proposed NutritionCLIP model in food image classification and its strong adaptability across different food datasets.

4.4.2. Food Volume Estimator Experimental Results

In this section, we will demonstrate the accuracy of food volume measurement based on multi-view stereo using the NutritionVerse3D dataset. Based on the experimental results from E-Volume [7], we found that the best prediction results were achieved with a shooting angle of 60 degrees and 40 images. Therefore, this experimental setup is used for the comparison experiment. To analyze the results more clearly, we divided the foods in the dataset into four categories: meals, meat, fruit and vegetables, and snacks, and we calculated their L1 loss and MAPE (mean absolute percentage error). Table 12 below summarizes the results for each category.
The table above indicates varying results in volume measurement across four categories. The meals category shows higher L1 loss and MAPE values, at 67.90 and 37.76, respectively, suggesting that predicting volume for this category is relatively challenging. This difficulty may be attributed to the greater diversity in the shapes and sizes of these foods. Conversely, the meat category exhibits a relatively low L1 loss of 29.47 and MAPE of 25.89, indicating good accuracy in volume measurement for this group.
For the fruits and vegetables category, the L1 loss is 12.25, and MAPE is 27.70. These figures suggest a good absolute error in volume measurement but a slightly higher percentage error, possibly due to the irregular shapes of the items in this category. The snacks category, with an L1 loss of 18.10 and a MAPE of 23.50, demonstrates high accuracy in volume measurement. This is likely because snacks usually have regular shapes and smaller volumes.
Overall, the MVS-based volume measurement method performs differently across various food categories. These results suggest room for improvement for foods with diverse shapes and sizes.

4.4.3. NutriLLM Experimental Results

In this section, we compare the capabilities of several standard large language models with the proposed NutriLLM, which is fine tuned on a nutrition question-and-answer dataset to generate personalized dietary advice. As illustrated in Figure 10, the generated responses exhibit varying levels of relevance and coherence across models. We employ multiple metrics to assess the divergence between the model-generated answers and the original reference responses to evaluate the performance quantitatively. As shown in Table 13, we present a detailed comparison of the text generation capabilities of different models. The table reports results across evaluation metrics, such as BLEU, ROUGE-L, METEOR, and BERTScore, providing a comprehensive analysis of linguistic quality and semantic alignment in nutritional dialogue generation.
In the table above, it can be seen that NutriLLM significantly outperforms the other models across all evaluation metrics. Specifically, NutriLLM achieved a BLEU-4 score of 45.13, indicating high accuracy in generating text close to the target answers. Additionally, NutriLLM scored 53.73, 34.79, and 43.82 in ROUGH-1, ROUGH-2, and ROUGH-L, respectively, demonstrating its excellence in generating text that contains the correct key information and sentence structure. Furthermore, NutriLLM achieved a meteor score of 42.46, further proving the quality of its generated text.
In comparison, the Llama3-8B-Instruct, Llama3-8B-Chinese-Chat, and Qwen2-7B-Instruct models performed next best on the various metrics, still showing strong text generation capabilities. However, the untuned BLOOMZ-7b1-mt model scored lower on all metrics, indicating certain limitations in generating nutrition-related text.
These experimental results show that fine tuning the Llama 3 model using the nutrition question and answering dataset can significantly enhance its ability to generate nutrition-related text. The excellent performance of the NutriLLM model across various metrics demonstrates its potential as a dietary advice assistant that is capable of providing high-quality suggestions based on users’ nutritional habits.

4.5. Discussion

This section will investigate the experimental results, analyzing the system’s performance and practical application potential. Firstly, the experimental results show that NutritionCLIP excels in food image classification, demonstrating its accuracy and reliability on the Food 101, CNFOOD-241, and Taiwanese Food 101 datasets. This indicates that our fine-tuning method effectively enhances the model’s performance in food classification, enabling it to achieve high classification accuracy across different food image datasets.
Regarding volume estimation, the MVS-based method demonstrated good accuracy but varied performance across different food categories. Specifically, the meal category had higher errors, indicating that predicting the volume of foods with diverse shapes, sizes, and types remains challenging and requires further optimization in future work.
In evaluating language model generation capabilities, NutriLLM performed excellently, especially in generating nutrition-related text, demonstrating its potential practical value. This suggests that our model is instrumental in analyzing users’ dietary habits and providing recommendations.
In summary, these results highlight the effectiveness of our approach across multiple tasks and point to directions for further improvements to enhance the system’s overall performance and application scope.

4.6. Limitations

Despite the promising performance of several experiments, our system still has notable limitations. The accuracy of volume estimation tends to decline when processing foods with highly diverse shapes and appearances, which suggests that more advanced modeling approaches are needed to handle such complexity. Although NutriLLM shows strong capabilities in generating nutrition-related content, it remains limited in addressing more complex or nuanced user queries, highlighting the need for further fine tuning and domain-specific enhancement. The current processing speed may also pose challenges for real-time use, potentially affecting the overall user experience; future improvements will focus on optimizing computational efficiency while maintaining predictive accuracy. Additionally, the scope of the datasets used for training and evaluation remains confined to a limited range of food types. Broader and more diverse datasets are essential to improve the system’s generalizability and robustness. Future work will also explore clinical validation in collaboration with certified nutrition experts or dietitians to strengthen the system’s real-world applicability, enabling a more rigorous assessment of its practical effectiveness and reliability.

5. Conclusions and Future Work

5.1. Conclusions

This study presents an innovative integrated dietary recommendation system that utilizes advanced multimodal deep learning techniques to automate and enhance dietary assessment. The system effectively integrates zero-shot learning models for food classification, learning-based MVS methods for food volume measurement, and large language models to generate personalized nutritional recommendations. The main contributions of this study include the following:
  • Zero-Shot Food Classification. By fine tuning the CLIP model, the system can accurately classify various foods, including categories not present in the training data, overcoming the limitations of traditional food classification models.
  • Convenient Volume Estimation. Using learning-based MVS technology, the system can measure food volume from multi-angle images, ensuring nutritional analysis accuracy without requiring specialized hardware.
  • Personalized Dietary Recommendations. The system combines LLMs to analyze nutritional content and provide personalized dietary recommendations based on individual health conditions and goals.
  • Enhanced User Experience. The automated food classification and nutritional analysis process significantly reduces user manual recording work, making dietary management more convenient and accurate.
  • Comprehensive Evaluation. The research results show that the system can effectively identify various common foods and accurately estimate their nutritional value, enhancing the convenience and precision of dietary control.

5.2. Future Work

In the future, several directions can be explored to further enhance and extend the research presented in this paper. Future research will focus on the following areas:
  • Improving Volume Estimation Accuracy. For foods with complex shapes, explore more advanced 3D reconstruction technologies and introduce more perspectives and depth information to enhance volume estimation accuracy.
  • Optimizing System Performance. Enhance the system’s operational efficiency while ensuring model accuracy, reducing runtime, and improving the user experience.
  • Expanding Datasets. Collect and annotate more food images and nutritional data to broaden the diversity and scale of datasets, further verifying and enhancing the system’s performance.
  • Expanding the Application Scope of Language Models. Introduce more nutrition and diet-related datasets to improve their generation capabilities and accuracy in diverse language environments.
  • Implementing Diverse Functions. Based on user feedback and needs, develop more practical functions, such as personalized diet plan generation and real-time health indicator monitoring, to enhance the system’s usability.
We hope to provide a more comprehensive and accurate food classification and nutritional recommendation system through these improvements and expansions, offering excellent assistance in users’ health management.

Author Contributions

Conceptualization, S.-T.C.; Methodology, Y.-J.L. and C.T.; Software, C.T.; Validation, Y.-J.L. and C.T.; Formal analysis, Y.-J.L.; Investigation, Y.-J.L.; Writing—original draft, C.T.; Writing—review & editing, Y.-J.L.; Supervision, S.-T.C.; Project administration, S.-T.C. All authors have read and agreed to the published version of the manuscript.

Funding

This research received no external funding.

Institutional Review Board Statement

Not applicable.

Informed Consent Statement

Not applicable.

Data Availability Statement

The original contributions presented in the study are included in the article, further inquiries can be directed to the corresponding author.

Conflicts of Interest

The authors declare no conflict of interest.

References

  1. Chaitanya, A.; Shetty, J.; Chiplunkar, P. Food Image Classification and Data Extraction Using Convolutional Neural Network and Web Crawlers. Procedia Comput. Sci. 2023, 218, 143–152. [Google Scholar] [CrossRef]
  2. Chun, M.; Jeong, H.; Lee, H.; Yoo, T.; Jung, H. Development of Korean Food Image Classification Model Using Public Food Image Dataset and Deep Learning Methods. IEEE Access 2022, 10, 128732–128741. [Google Scholar] [CrossRef]
  3. He, Y.; Yin, S. Food Images Classification Based on Improved Convolutional Neural Network. In Proceedings of the 2023 4th International Conference on Electronic Communication and Artificial Intelligence (ICECAI), Guangzhou, China, 12–14 May 2023; pp. 290–293. [Google Scholar]
  4. Islam, M.T.; Siddique, B.M.N.K.; Rahman, S.; Jabid, T. Food Image Classification with Convolutional Neural Network. In Proceedings of the 2018 International Conference on Intelligent Informatics and Biomedical Sciences (ICIIBMS), Bangkok, Thailand, 21–24 October 2018; Volume 3, pp. 257–262. [Google Scholar]
  5. Radford, A.; Kim, J.W.; Hallacy, C.; Ramesh, A.; Goh, G.; Agarwal, S.; Sastry, G.; Askell, A.; Mishkin, P.; Clark, J.; et al. Learning transferable visual models from natural language supervision. In Proceedings of the International Conference on Machine Learning, PMLR, Virtual, 18–24 July 2021; pp. 8748–8763. [Google Scholar]
  6. Thames, Q.; Karpur, A.; Norris, W.; Xia, F.; Panait, L.; Weyand, T.; Sim, J. Nutrition5k: Towards automatic nutritional understanding of generic food. In Proceedings of the IEEE/CVF Conference on Computer Vision and Pattern Recognition, Nashville, TN, USA, 20–25 June 2021; pp. 8903–8911. [Google Scholar]
  7. Yang, T.-H. E-Volume: Learning-based Multi-View Stereo Volume Estimator—A Case Study on Food on the Dining Table. Master’s Thesis, Department of Computer Science and Information Engineering, National Cheng Kung University, Tainan, Taiwan, 2023. [Google Scholar]
  8. Lo, F.P.-W.; Sun, Y.; Qiu, J.; Lo, B. Food Volume Estimation Based on Deep Learning View Synthesis from a Single Depth Map. Nutrients 2018, 10, 2005. [Google Scholar] [CrossRef] [PubMed]
  9. Pfisterer, K.J.; Amelard, R.; Chung, A.G.; Syrnyk, B.; MacLean, A.; Keller, H.H.; Wong, A. Automated food intake tracking requires depth-refined semantic segmentation to rectify visual-volume discordance in long-term care homes. Sci. Rep. 2022, 12, 83. [Google Scholar] [CrossRef]
  10. Team, M.L. Introducing Meta Llama 3: The Most Capable Openly Available LLM to Date. Available online: https://ai.meta.com/blog/meta-llama-3/ (accessed on 20 May 2024).
  11. Xian, Y.; Schiele, B.; Akata, Z. Zero-shot learning-the good, the bad and the ugly. In Proceedings of the IEEE Conference on Computer Vision and Pattern Recognition, Honolulu, HI, USA, 21–26 July 2017; pp. 4582–4591. [Google Scholar]
  12. Xian, Y.; Lampert, C.H.; Schiele, B.; Akata, Z. Zero-Shot Learning—A Comprehensive Evaluation of the Good, the Bad and the Ugly. IEEE Trans. Pattern Anal. Mach. Intell. 2019, 41, 2251–2265. [Google Scholar] [CrossRef]
  13. Damalla, R.; Datla, R.; Chalavadi, V.; Mohan, C.K. Self-supervised embedding for generalized zero-shot learning in remote sensing scene classification. J. Appl. Remote Sens. 2023, 17, 032405. [Google Scholar] [CrossRef]
  14. Ge, Y.; Ren, J.; Gallagher, A.; Wang, Y.; Yang, M.H.; Adam, H.; Zhao, J. Improving zero-shot generalization and robustness of multi-modal models. In Proceedings of the IEEE/CVF Conference on Computer Vision And pattern Recognition, Vancouver, BC, Canada, 17–24 June 2023; pp. 11093–11101. [Google Scholar]
  15. Liu, X.; Zhang, F.; Hou, Z.; Mian, L.; Wang, Z.; Zhang, J.; Tang, J. Self-supervised learning: Generative or contrastive. IEEE Trans. Knowl. Data Eng. 2021, 35, 857–876. [Google Scholar] [CrossRef]
  16. Krizhevsky, A.; Sutskever, I.; Hinton, G.E. ImageNet classification with deep convolutional neural networks. Adv. Neural Inf. Process. Syst. 2012, 25, 1097–1105. [Google Scholar] [CrossRef]
  17. Simonyan, K.; Zisserman, A. Intense convolutional networks for large-scale image recognition. arXiv 2014, arXiv:1409.1556. [Google Scholar]
  18. He, K.; Zhang, X.; Ren, S.; Sun, J. Deep residual learning for image recognition. In Proceedings of the IEEE Conference on Computer Vision and Pattern Recognition, Las Vegas, NV, USA, 27–30 June 2016; pp. 770–778. [Google Scholar]
  19. Huang, G.; Liu, Z.; Van Der Maaten, L.; Weinberger, K.Q. Densely connected convolutional networks. In Proceedings of the IEEE Conference on Computer Vision and Pattern Recognition, Honolulu, HI, USA, 21–26 June 2017; pp. 4700–4708. [Google Scholar]
  20. Tan, M.; Le, Q. Efficientnet: Rethinking model scaling for convolutional neural networks. In Proceedings of the International Conference on Machine Learning, PMLR, Long Beach, CA, USA, 9–15 June 2019; pp. 6105–6114. [Google Scholar]
  21. Dosovitskiy, A.; Beyer, L.; Kolesnikov, A.; Weissenborn, D.; Zhai, X.; Unterthiner, T.; Dehghani, M.; Minderer, M.; Heigold, G.; Gelly, S.; et al. An image is worth 16x16 words: Transformers for image recognition at scale. arXiv 2020, arXiv:2010.11929. [Google Scholar]
  22. Vaswani, A.; Shazeer, N.; Parmar, N.; Uszkoreit, J.; Jones, L.; Gomez, A.N. Attention is all you need. Adv. Neural Inf. Process. Syst. 2017, 30, 5998–6008. [Google Scholar]
  23. Chen, T.; Kornblith, S.; Norouzi, M.; Hinton, G. A simple framework for contrastive learning of visual representations. In Proceedings of the International Conference on Machine Learning, PMLR, Vienna, Austria, 12–18 July 2020; pp. 1597–1607. [Google Scholar]
  24. Iter, D.; Guu, K.; Lansing, L.; Jurafsky, D. Pretraining with contrastive sentence objectives improves discourse performance of language models. arXiv 2020, arXiv:2005.10389. [Google Scholar]
  25. Su, Y.; Lan, T.; Wang, Y.; Yogatama, D.; Kong, L.; Collier, N. A contrastive framework for neural text generation. Adv. Neural Inf. Process. Syst. 2022, 35, 21548–21561. [Google Scholar]
  26. Grill, J.B.; Strub, F.; Altché, F.; Tallec, C.; Richemond, P.; Buchatskaya, E.; Doersch, C.; Avila Pires, B.; Guo, Z.; Azar, M.G.; et al. Bootstrap your own latent-a new approach to self-supervised learning. Adv. Neural Inf. Process. Syst. 2020, 33, 21271–21284. [Google Scholar]
  27. Ando, Y.; Ege, T.; Cho, J.; Yanai, K. Depthcaloriecam: A mobile application for volume-based foodcalorie estimation using depth cameras. In Proceedings of the 5th International Workshop on Multimedia Assisted Dietary Management, New York, NY, USA, 21 October 2019; pp. 76–81. [Google Scholar]
  28. Seitz, S.M.; Curless, B.; Diebel, J.; Scharstein, D.; Szeliski, R. A comparison and evaluation of multi-view stereo reconstruction algorithms. In Proceedings of the 2006 IEEE Computer Society Conference on Computer Vision and Pattern Recognition (CVPR’06), New York, NY, USA, 17–22 June 2006; Volume 1, pp. 519–528. [Google Scholar]
  29. Goesele, M.; Snavely, N.; Curless, B.; Hoppe, H.; Seitz, S.M. Multi-View Stereo for Community Photo Collections. In Proceedings of the 2007 IEEE 11th International Conference on Computer Vision, Rio de Janeiro, Brazil, 14–21 October 2007; pp. 1–8. [Google Scholar]
  30. Agarwal, S.; Snavely, N.; Simon, I.; Seitz, S.M.; Szeliski, R. Building Rome in a day. In Proceedings of the 2009 IEEE 12th International Conference on Computer Vision, Kyoto, Japan, 29 September–2 October 2009; pp. 72–79. [Google Scholar]
  31. Ji, M.; Gall, J.; Zheng, H.; Liu, Y.; Fang, L. Surfacenet: An end-to-end 3d neural network for multiview stereopsis. In Proceedings of the IEEE International Conference on Computer Vision, Venice, Italy, 22–29 October 2017; pp. 2307–2315. [Google Scholar]
  32. Kar, A.; Häne, C.; Malik, J. Learning a multi-view stereo machine. Adv. Neural Inf. Process. Syst. 2017, 30, 365–376. [Google Scholar]
  33. Yao, Y.; Luo, Z.; Li, S.; Fang, T.; Quan, L. Mvsnet: Depth inference for unstructured multi-view stereo. In Proceedings of the European Conference on Computer Vision (ECCV), Munich, Germany, 8–14 September 2018; pp. 767–783. [Google Scholar]
  34. Devlin, J.; Chang, M.-W.; Lee, K.; Toutanova, K. Bert: Pre-training of deep bidirectional transformers for language understanding. arXiv 2018, arXiv:1810.04805. [Google Scholar]
  35. Gao, J.; Lin, C.-Y. Introduction to the Special Issue on Statistical Language Modeling, 3rd ed.; ACM: New York, NY, USA, 2004; pp. 87–93. [Google Scholar]
  36. Kombrink, S.; Mikolov, T.; Karafiát, M.; Burget, L. Recurrent Neural Network Based Language Modeling in Meeting Recognition. Interspeech 2011, 11, 2877–2880. [Google Scholar]
  37. Brown, P.F.; Della Pietra, V.J.; Desouza, P.V.; Lai, J.C.; Mercer, R.L. Class-based n-gram models of natural language. Comput. Linguist. 1992, 18, 467–480. [Google Scholar]
  38. Chen, M.; Tworek, J.; Jun, H.; Yuan, Q.; Pinto, D.O.; Kaplan, J.; Edwards, H.; Burda, Y.; Joseph, N.; Brockman, G.; et al. Evaluating large language models trained on code. arXiv 2021, arXiv:2107.03374. [Google Scholar]
  39. Kasneci, E.; Seßler, K.; Küchemann, S.; Bannert, M.; Dementieva, D.; Fischer, F.; Gasser, U.; Groh, G.; Günnemann, S.; Hüllermeier, E.; et al. ChatGPT for good? On opportunities and challenges of large language models for education. Learn. Individ. Differ. 2023, 103, 102274. [Google Scholar] [CrossRef]
  40. Zhao, W.X.; Zhou, K.; Li, J.; Tang, T.; Wang, X.; Hou, Y. A survey of large language models. arXiv 2023, arXiv:2303.18223. [Google Scholar]
  41. Floridi, L.; Chiriatti, M. GPT-3: Its nature, scope, limits, and consequences. Minds Mach. 2020, 30, 681–694. [Google Scholar] [CrossRef]
  42. OpenAI. GPT-4 Technical Report. arXiv 2023, arXiv:2303.08774. [Google Scholar]
  43. Ouyang, L.; Wu, J.; Jiang, X.; Almeida, D.; Wainwright, C.; Mishkin, P.; Zhang, C.; Agarwal, S.; Slama, K.; Ray, A.; et al. Training language models to follow instructions with human feedback. Adv. Neural Inf. Process. Syst. 2022, 35, 27730–27744. [Google Scholar]
  44. Brown, T.; Mann, B.; Ryder, N.; Subbiah, M.; Kaplan, J.D.; Dhariwal, P.; Neelakantan, A.; Shyam, P.; Sastry, G.; Askell, A.; et al. Language models are few-shot learners. Adv. Neural Inf. Process. Syst. 2020, 33, 1877–1901. [Google Scholar]
  45. Christiano, P.F.; Leike, J.; Brown, T.; Martic, M.; Legg, S.; Amodei, D. Deep reinforcement learning from human preferences. Adv. Neural Inf. Process. Syst. 2017, 30, 4299–4307. [Google Scholar]
  46. Ziegler, D.M.; Stiennon, N.; Wu, J.; Brown, T.B.; Radford, A.; Amodei, D.; Christiano, P.; Irving, G. Fine-tuning language models from human preferences. arXiv 2019, arXiv:1909.08593. [Google Scholar]
  47. Sherstinsky, A. Fundamentals of recurrent neural network (RNN) and long short-term memory (LSTM) network. Phys. D Nonlinear Phenom. 2020, 404, 132306. [Google Scholar] [CrossRef]
  48. Bai, J.; Bai, S.; Chu, Y.; Cui, Z.; Dang, K.; Deng, X.; Fan, Y.; Ge, W.; Han, Y.; Huang, F.; et al. Qwen technical report. arXiv 2023, arXiv:2309.16609. [Google Scholar]
  49. Le Scao, T.; Fan, A.; Wolf, T.; Gugger, S.; Minixhofer, B.; Singh, R.; Rasmussen, A.; Muennighoff, N.; Szlam, A.; Scialom, T.; et al. Bloom: A 176B-Parameter Open-Access Multilingual Language Model. Available online: https://huggingface.co/bigscience/bloom (accessed on 12 June 2024).
  50. Muennighoff, N.; Wang, T.; Sutawika, L.; Roberts, A.; Biderman, S.; Scao, T.L.; Bari, M.S.; Shen, S.; Yong, Z.X.; Schoelkopf, H.; et al. Crosslingual generalization through multitask finetuning. arXiv 2022, arXiv:2211.01786. [Google Scholar]
  51. Touvron, H.; Lavril, T.; Izacard, G.; Martinet, X.; Lachaux, M.A.; Lacroix, T.; Rozière, B.; Goyal, N.; Hambro, E.; Azhar, F.; et al. Llama: Open and efficient foundation language models. arXiv 2023, arXiv:2302.13971. [Google Scholar]
  52. Touvron, H.; Martin, L.; Stone, K.; Albert, P.; Almahairi, A.; Babaei, Y.; Bashlykov, N.; Batra, S.; Bhargava, P.; Bhosale, S.; et al. Llama 2: Open foundation and fine-tuned chat models. arXiv 2023, arXiv:2307.09288. [Google Scholar]
  53. Cui, Y.; Che, W.; Liu, T.; Qin, B.; Wang, S.; Hu, G. Revisiting pre-trained models for Chinese natural language processing. arXiv 2020, arXiv:2004.13922. [Google Scholar]
  54. Cui, Y.; Che, W.; Liu, T.; Qin, B.; Yang, Z. Pre-training with whole word masking for chinese bert. IEEE/ACM Trans. Audio Speech Lang. Process. 2021, 29, 3504–3514. [Google Scholar] [CrossRef]
  55. Rahutomo, F.; Kitasuka, T.; Aritsugi, M. Semantic cosine similarity. In Proceedings of the 7th International Student Conference on Advanced Science and Technology ICAST, Seoul, Republic of Korea, 29–30 October 2012; University of Seoul South Korea: Seoul, Republic of Korea, 2012; Volume 4, p. 1. [Google Scholar]
  56. Tai, C.E.A.; Keller, M.; Kerrigan, M.; Chen, Y.; Nair, S.; Xi, P.; Wong, A. Nutritionverse-3d: A 3d food model dataset for nutritional intake estimation. arXiv 2023, arXiv:2304.05619. [Google Scholar]
  57. Hu, E.J.; Shen, Y.; Wallis, P.; Allen-Zhu, Z.; Li, Y.; Wang, S.; Wang, L.; Chen, W. Lora: Low-rank adaptation of large language models. arXiv 2021, arXiv:2106.09685. [Google Scholar]
  58. Bossard, L.; Guillaumin, M.; Van Gool, L. Food-101–mining discriminative components with random forests. In Lecture Notes in Computer Science, Proceedings of the Computer Vision–ECCV 2014: 13th European Conference, Zurich, Switzerland, 6–12 September 2014; Proceedings, Part VI 13; Springer: Berlin/Heidelberg, Germany, 2014; pp. 446–461. [Google Scholar]
  59. Fan, B.-K.; CNFOOD-241. Mendeley Data 2022, V1. Available online: https://data.mendeley.com/datasets/fspyss5zbb/1 (accessed on 12 June 2024).
  60. Yang, T.-L. Taiwanese-Food-101: A Dataset for Recognizing Taiwanese Cuisines and its Application. Master’s Thesis, Department of Electronic Engineering, National Taipei University of Technology, Taipei, Taiwan, 2020. [Google Scholar]
Figure 1. CLIP model architecture (adapted from [5]).
Applsci 15 04911 g001
Figure 2. Learning-based E-Volume architecture (adapted from [7]).
Applsci 15 04911 g002
Figure 3. NutritionCLIP fine-tuning architecture (adapted from [5]).
Applsci 15 04911 g003
Figure 4. Zero-shot food category classification using NutritionCLIP (adapted from [5]).
Applsci 15 04911 g004
Figure 5. Example images generated for the NutritionVerse3D dataset.
Applsci 15 04911 g005
Figure 6. Generated image. Starting with the scene image on the left, the generated depth map in the middle, and the segmentation mask on the right.
Applsci 15 04911 g006
Figure 7. LoRA reparametrization.
Applsci 15 04911 g007
Figure 8. NutriLLM function introduction.
Applsci 15 04911 g008
Figure 9. Overall architecture.
Applsci 15 04911 g009
Figure 10. Comparison of dietary advice. NutriLLM generates the text on the left, while the text on the right is from the original dataset responses.
Applsci 15 04911 g010
Table 1. Comparison of different models.
Machine LearningDeep LearningLLMs
Data RequirementMediumHighExtremely High
Feature ProcessingManualSemi-AutomaticFully Automatic
System ComplexityLowMediumHigh
InterpretabilityHighLowLowest
Prediction PerformanceMediumHighHighest
Computational CostLowMediumHigh
Table 2. Experimental environment setup.
Developing Environment and ToolsSpecifications
Central Processing Unit (CPU)AMD Ryzen 9 5950X 16-Core Processor (AMD, Santa Clara, CA, USA)
Graphics Processing Unit (GPU)NVIDIA RTX A6000 (NVIDIA Corporation, Santa Clara, CA, USA)
Random-Access Memory (RAM)64G
Operating System (OS)Ubuntu 20.04.6 LTS (Canonical Ltd., London, UK)
Python3.11.9
PyTorch2.3.1
CudaV11.6.124
Table 3. List of CLIP fine-tuning datasets.
DatasetsTrainValidationTest
Food 10175,75012,62512,625
CNFOOD-241170,84310,47210,472
Taiwanese Food 10120,37125462546
Table 4. List of food category quantities.
Food CategoryQuantity
Meals25
Meat66
Fruits and Vegetables10
Snacks10
Table 5. List of Llama 3 fine-tuning datasets.
DatasetsTrainValidationDescription
Identity9110System prompt
alpaca_gpt4_en20 k500English comprehensive Q&A
alpaca_gpt4_zh20 k500Chinese comprehensive Q&A
Animal-nutrition-alpaca5.03 k300English nutrition Q&A
Animal-nutrition-new-alpaca4.94 k300English nutrition Q&A
Animal-nutrition-alpaca-to-zh5.03 k300Chinese nutrition Q&A
Animal-nutrition-new-alpaca-to-zh4.94 k300Chinese nutrition Q&A
Table 6. CLIP fine-tuning parameters.
Experimental Setup
Batch size32
Learning rate1 × 10−5
Number of epochs30
OptimizerAdam
Loss functionCross-entropy loss
Table 7. Multi-view stereo training parameters.
Experimental Setup
Batch size16
Learning rate1 × 10−3
Number of epochs50
OptimizerAdam
Loss functionMean Square Error (MSE)
Table 8. Llama 3 fine-tuning parameters.
Experimental Setup
Batch size8
Learning rate1 × 10−5
Number of epochs20
OptimizerAdamW
Loss functionCross-entropy loss
Table 9. Zero-shot learning model performance on the Food 101 dataset.
ModelTop1Top5PrecisionRecallF1 Score
ResNet50-quickgelu0.430.720.460.430.42
ALIGN0.480.730.550.480.48
SigLIP0.620.820.710.620.64
CLIP0.560.840.620.560.55
NutritionCLIP0.800.960.820.800.80
Table 10. Zero-shot learning model performance on the CNFOOD-241 dataset.
ModelTop1Top5PrecisionRecallF1 Score
ResNet50-quickgelu0.080.240.090.080.06
ALIGN0.130.350.160.130.11
SigLIP0.010.020.000.000.00
CLIP0.190.420.190.170.15
NutritionCLIP0.910.970.880.900.89
Table 11. Zero-shot learning model performance on the Taiwanese Food 101 dataset.
ModelTop1Top5PrecisionRecallF1 Score
ResNet50-quickgelu0.190.430.180.190.16
ALIGN0.280.580.350.280.26
SigLIP0.510.790.540.510.49
CLIP0.290.560.320.290.26
NutritionCLIP0.730.940.790.740.74
Table 12. Performance of volume estimation by food category.
Food CategoryMAPEL1 Loss
Meals37.7667.90
Meat25.8929.47
Fruits and Vegetables27.7012.25
Snacks23.5018.10
Table 13. Text generation capabilities of different models.
ModelBLEU-4ROUGH-1ROUGH-2ROUGH-LMETEOR
Qwen2-7B-Instruct30.1838.3616.9325.8035.01
BLOOMZ-7b1-mt2.6111.633.328.0410.56
Llama3-8B-Instruct24.6729.7712.8018.5930.09
Llama3-8B-Chinese-Chat31.2539.9518.1927.2135.71
NutriLLM45.1353.7334.7943.8242.46
Disclaimer/Publisher’s Note: The statements, opinions and data contained in all publications are solely those of the individual author(s) and contributor(s) and not of MDPI and/or the editor(s). MDPI and/or the editor(s) disclaim responsibility for any injury to people or property resulting from any ideas, methods, instructions or products referred to in the content.

