Article

Study on Collision Avoidance Behavior in the Social Force-Based Pedestrian–Vehicle Interaction Simulation Model at Unsignalized Intersections

1
Faculty of Electrical Engineering and Computer Science, Ningbo University, Ningbo 315000, China
2
College of Science and Technology, Ningbo University, Cixi 315300, China
*
Authors to whom correspondence should be addressed.
Appl. Sci. 2025, 15(9), 4885; https://doi.org/10.3390/app15094885
Submission received: 29 March 2025 / Revised: 22 April 2025 / Accepted: 24 April 2025 / Published: 28 April 2025

Abstract

:
Modeling pedestrian–vehicle interaction behaviors not only helps better predict the intentions and actions of traffic participants but also contributes to generating more realistic pedestrian trajectories for testing autonomous vehicles. Most existing pedestrian–vehicle interaction models use repulsive forces toward target directions to avoid collisions. However, pedestrian agents in these models lack the ability to plan avoidance routes based on their positions when facing conflicting vehicles, leading to poor simulation effects at unsignalized intersections. By analyzing the crossing trajectories of pedestrians at unsignalized intersections through video data, we observed that when participants reject a current vehicle gap, they may tend to move toward the vehicle’s rear to start crossing the traffic flow earlier, thereby obtaining a safer opportunity to cross the road. In contrast, most previous pedestrian–vehicle interaction models only simulated pedestrians’ avoidance by moving away from vehicles. In response, we propose a pedestrian–vehicle interaction model incorporating pedestrian avoidance tendencies, which is based on the social force framework. Our improvements include refining the vehicle’s influence on pedestrians in lateral and longitudinal dimensions. The pedestrian agents in this model can make appropriate crossing decisions and select collision avoidance paths according to traffic conditions. This model can simulate pedestrian–vehicle interaction scenarios at unsignalized intersections and can be extended to pedestrian safety testing for autonomous vehicles.

1. Introduction

Statistics indicate that most vehicle collisions occur when pedestrians are crossing roads, particularly at unsignalized crosswalks [1,2,3]. According to the World Health Organization (2018) [4], pedestrians account for approximately 23% of global road traffic fatalities. As the most vulnerable road users, pedestrians face significantly higher risks of injury or death in traffic collisions compared to other participants, warranting focused research. Accurately modeling interactions between vehicles and pedestrians in traffic remains a challenge in traffic safety simulation, particularly at unsignalized intersections, where pedestrian behavior becomes difficult to predict due to the lack of traffic signal guidance.
We incorporate pedestrian behavior into our pedestrian–vehicle interaction model using a generalized force framework. This force is inspired by the social force model, which has been widely adopted in existing models for urban traffic simulation [5,6,7]. However, most of these models only consider repulsive-direction interactions, where pedestrians tend to move away from approaching vehicles. At unsignalized intersections, pedestrian–vehicle interactions often exhibit greater diversity. We refine the interaction forces between pedestrians and vehicles by improving the direction and magnitude of the forces that vehicles exert on pedestrians, which allows for more realistic pedestrian avoidance behaviors, such as gradually approaching and detouring behind a vehicle.
Inspired by existing traffic models and pedestrian experiments [8], we propose a social force-based pedestrian–vehicle interaction model for simulating crossing behaviors at unsignalized intersections. All traffic participants in the scene are modeled within a force-based framework, allowing for the efficient generation of complex traffic environments. The overall framework of the model is shown in Figure 1, comprising a basic agent decision layer and an extended agent conflict interaction layer. In the agent decision layer, the pedestrian agent can make crossing decisions based on the current vehicle speed and vehicle gaps. In the conflict interaction layer, based on our pedestrian–vehicle interaction model, the pedestrian agent can make natural conflict avoidance behaviors according to the relative position and speed of the interacting vehicles.
In summary, the key contributions of this work are as follows:
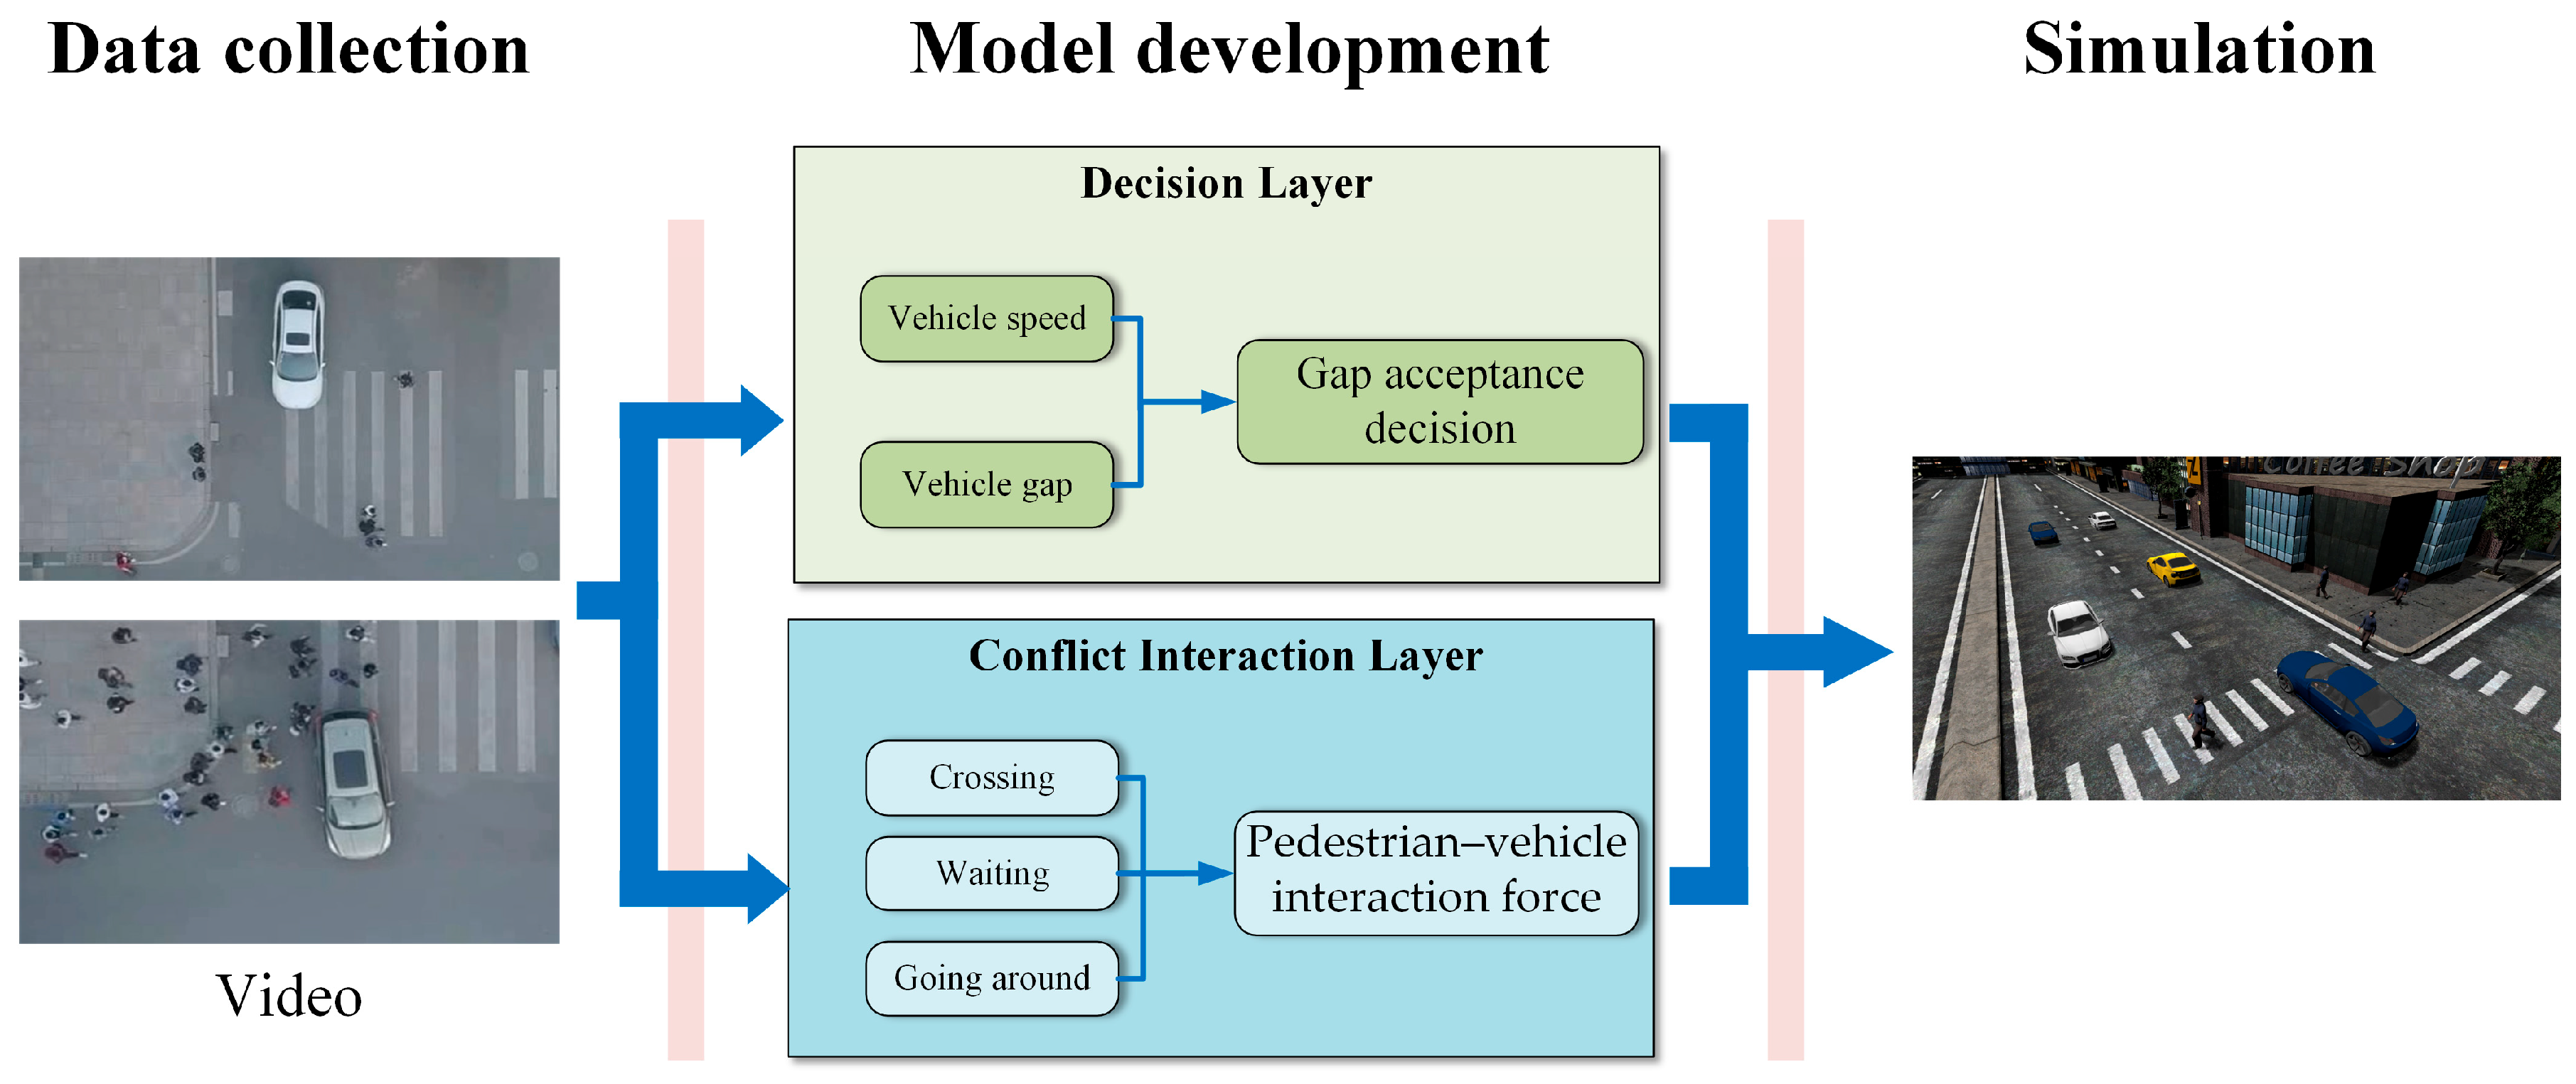
  • We enhance the ability of pedestrian agents to plan their routes when facing conflicting vehicles by refining the direction and magnitude of the forces they experience at different positions relative to vehicles. This makes pedestrian behavior more realistic and diverse.
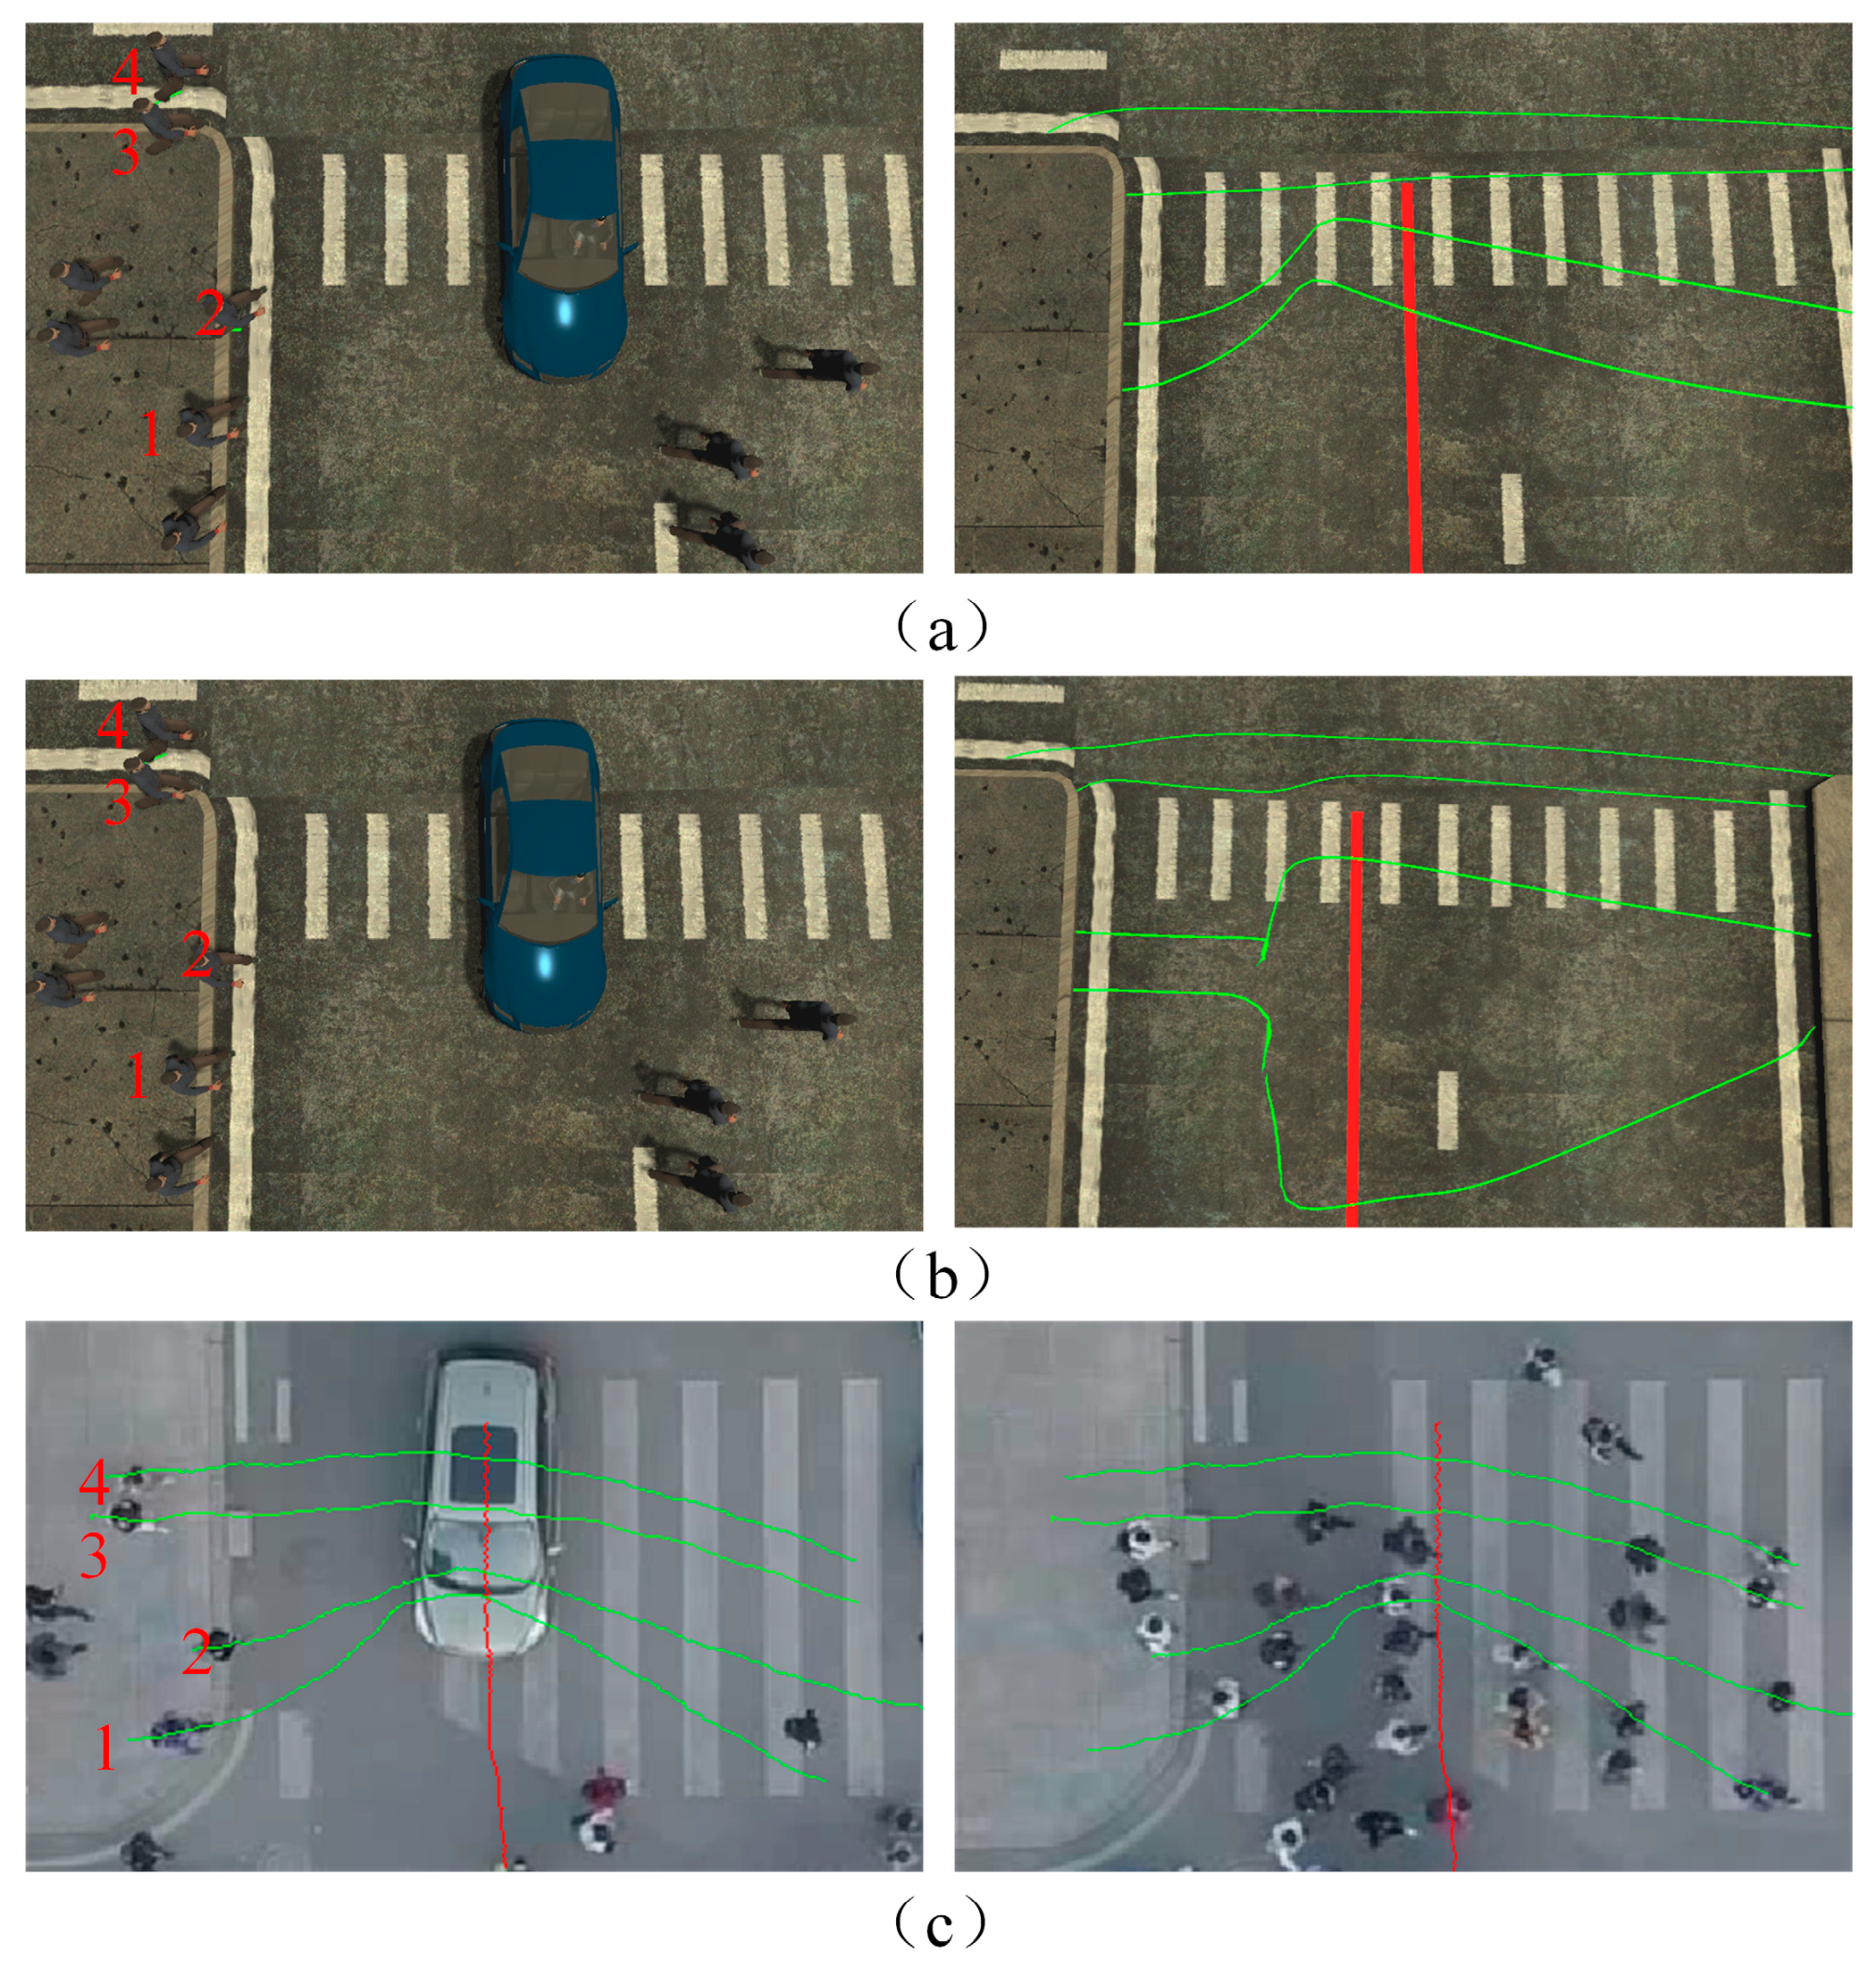
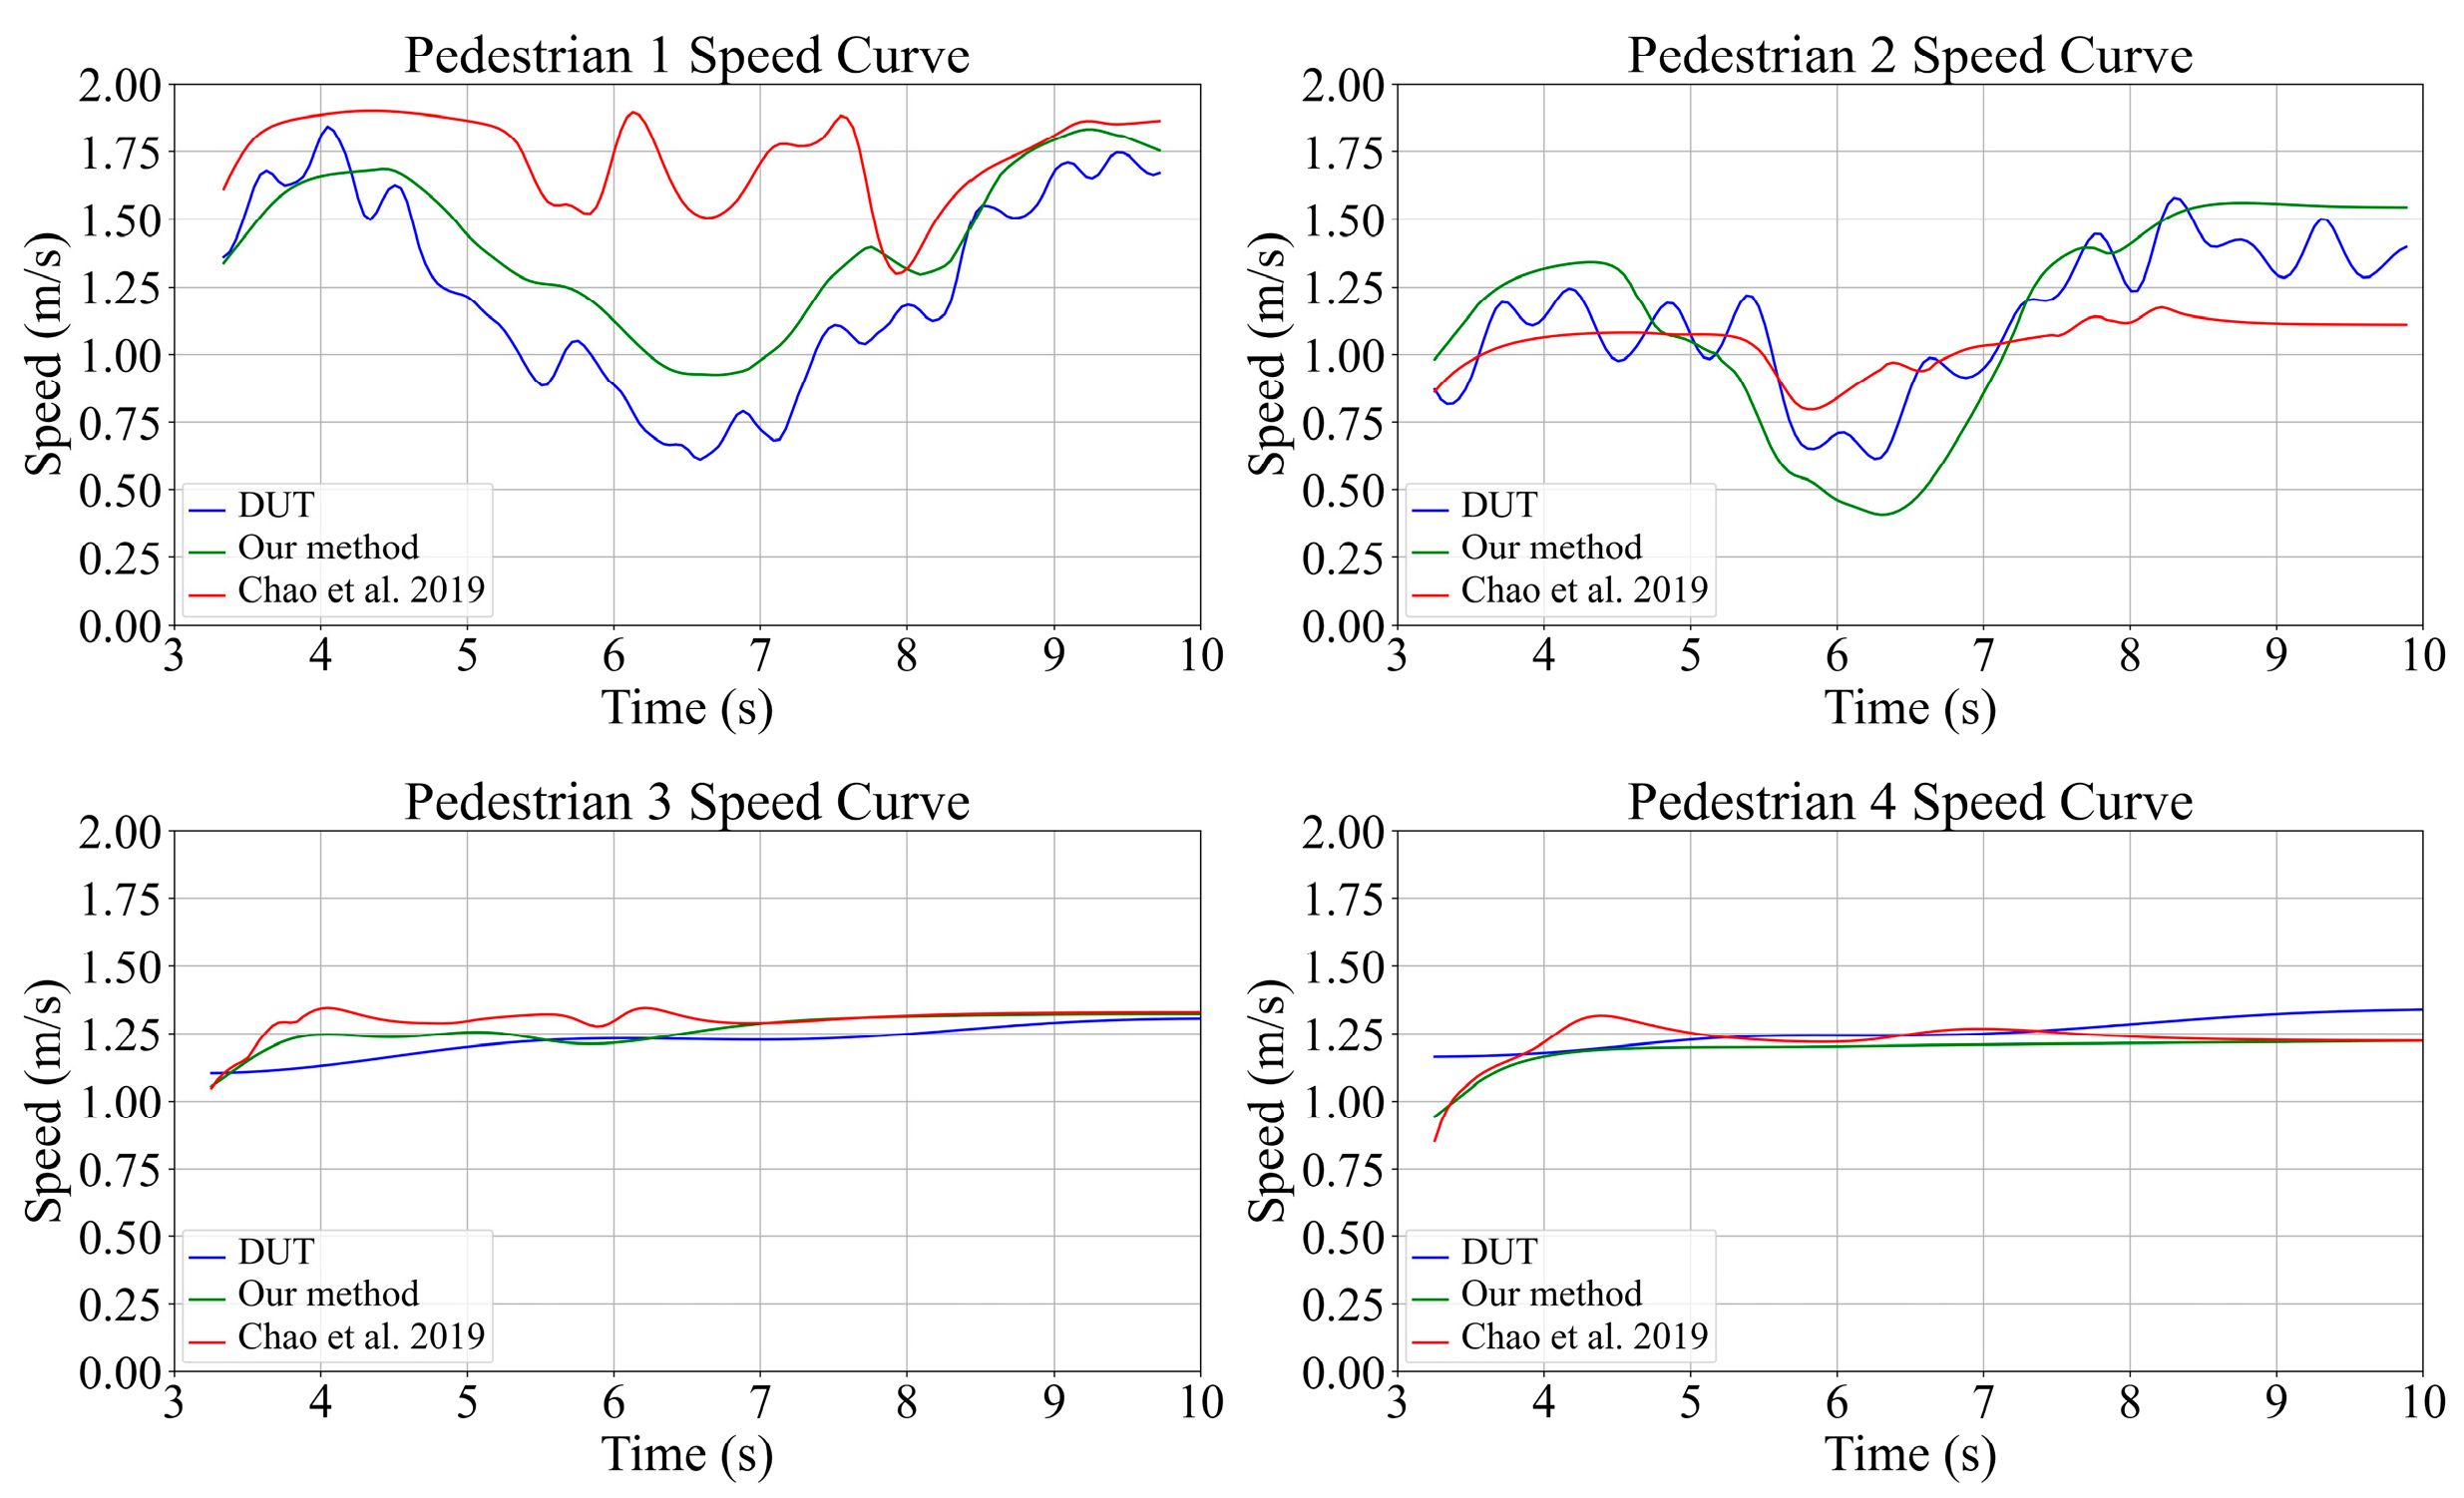
  • We conduct qualitative and quantitative analyses of both the trajectories and speed of pedestrian–vehicle interaction behaviors in different interaction scenarios and compare them with currently advanced social force-based pedestrian–vehicle interaction models. The results indicate that our model better replicates the observed pedestrian behavior.

2. Related Works

Pedestrian–vehicle interaction models can be primarily classified into two categories: data-driven models and expert models. Each method has its advantages and disadvantages, but both can effectively simulate pedestrian–vehicle interaction trajectories. This section will introduce and analyze the characteristics, practical applications, and limitations of the two methods.

2.1. Data-Driven Models

Data-driven models learn pedestrian movement characteristics from the real world, and the model optimizes parameters based on real-world datasets to improve simulation performance. Chao et al. [9] proposed a data-driven method that fills a virtual road network with real traffic flow and calculates the speed of each agent in each frame based on real data. Ren et al. [10] introduced a data-driven model that defines an energy function based on the needs of traffic interaction, where a smaller energy function indicates better simulation results. The model selects the optimal speed and behavior from real datasets to minimize the energy function, which can better replicate real traffic interactions. However, this method’s simulated trajectories are overly dependent on the optimized dataset, and due to the limited data on direct pedestrian–vehicle interactions, the model features fewer pedestrian–vehicle interactions in its simulations. The pedestrian trajectories lack validation and cannot be directly applied to pedestrian–vehicle interaction behavior.
With the development of artificial intelligence, deep learning-based trajectory prediction has begun to be applied in pedestrian–vehicle interaction models. Alahi et al. [11] and Cheng et al. [12] applied optimized LSTM to mixed-interaction simulations, using the LSTM model to extract latent features of trajectories during forward propagation and optimizing the prediction of the next position during backward propagation, achieving better trajectory prediction capabilities than expert models. However, such methods require large datasets and significant computational power, meaning the model cannot run in real time and cannot meet the requirements of autonomous driving simulation tests.
Compared to expert models, data-driven models have strong capabilities in pedestrian trajectory prediction but require large datasets for learning and have high demands on data optimization. However, collecting mixed-traffic data that include pedestrian–vehicle interactions remains a challenging and costly task. Furthermore, data-driven models generally cannot run in real time, which makes them unsuitable for autonomous driving testing needs. Expert models, on the other hand, do not require large datasets for learning, have lower computational demands, and are more easily run in real time, making them better suited for autonomous driving platform testing.

2.2. Expert Models

A key component of virtual traffic simulation involves modeling vehicle motion at varying levels of detail [13]. Microscopic traffic simulation methods generate vehicle movements at a high level of detail, where each vehicle is modeled as a discrete agent influenced by surrounding vehicles, effectively simulating interactions between vehicles and other road participants. Based on car-following rules, several variants and extensions of microscopic traffic simulation have been developed, such as the Optimal Velocity Model (OVM) [14] and the Intelligent Driver Model (IDM) [15]. In the IDM proposed by Helbing et al., specific parameters can be adjusted to simulate various vehicle types and driving styles. In terms of evaluating urban traffic simulation models using microscopic models, Zhu et al. [16] calibrated and assessed several representative car-following models. The results showed that IDM demonstrated good portability across different traffic conditions.
While these car-following models can effectively simulate urban vehicle-following behavior, they cannot be used for simulating mixed-traffic scenarios. In the field of mixed-traffic simulation, the main expert models are those based on cellular automata and social forces.
The environment of cellular automata consists of cells, where traffic participants change their state according to transition rules and move from one cell to another. Crociani et al. [17], based on cellular automata, proposed a mixed-traffic simulation model for intersections. In this model, pedestrians and vehicles can sense each other in advance when crossing the road, and pedestrians predict whether they can cross before the vehicle arrives, thus deciding whether to wait in place. Improved cellular automaton-based unsignalized intersection pedestrian–vehicle interaction simulation models have been widely studied [18,19]. However, cellular automaton-based simulation models are primarily used to assess traffic safety regulations and improve traffic policies rather than simulating the diverse crossing behaviors of pedestrians. Since pedestrians can only choose from a limited number of cells, the number of cells limits the accuracy of the simulation. Furthermore, these models only consider the lateral interaction between pedestrians and vehicles, lacking diversity in pedestrian–vehicle interactions.
The social force model (SFM) proposed by Helbing et al. [20] describes the movement of each pedestrian as the result of a combination of social repulsive or attractive forces from surrounding pedestrians and a desire to reach the destination. The advantage of the social force model lies in its ability to describe pedestrians’ continuous dynamic motion in both space and time, with each equation and parameter being easily interpretable from a kinematic perspective. The social force model has been successfully applied to various types of mixed-traffic simulations. Anvari et al. [21] discovered the potential of social force model in traffic simulation and applied it to pedestrian–vehicle interaction simulations. However, because it does not consider the diversity of pedestrian behaviors, the interaction modes of pedestrians in the simulation results are relatively simple. Chao et al. [7] combined the social force model with a decision model, allowing pedestrians to predict potential conflicts with vehicles in advance and choose whether to stop or continue crossing the road based on the vehicle’s time to arrival (TTA). This approach achieved more diverse pedestrian–vehicle interactions, but the interactions were limited to lateral interactions, and the variety of interaction modes was still insufficient. Rinke et al. [6] modeled pedestrians, vehicles, and bicycles based on the social force model, constructing a relatively complete urban traffic simulation model. However, at the pedestrian–vehicle interaction level, it only considered lateral interactions, so this model is generally used to evaluate urban traffic design rather than predict pedestrian behaviors. Finally, Chao et al. [22] proposed a unified social force model to describe the interaction behaviors between different traffic participants in mixed traffic. This model improved the repulsive forces between different participants, generating different types of repulsive forces based on the interaction type. However, during pedestrian–vehicle interactions, the model uses a single-direction repulsive force, lacking avoidance strategies for pedestrian–vehicle interactions.
In traditional social force-based pedestrian–vehicle interaction models, the influence range of vehicles is often simplified to shapes such as an ellipse [23] or a moving rectangular obstacle with four edges and four vertices [24,25,26]. Once a pedestrian enters the vehicle’s influence range, they are affected by the vehicle’s force field, causing the pedestrian to move away from the vehicle or stop. While these methods can effectively describe the repulsive force of vehicles on pedestrians, they only consider the repulsive effect of the vehicle on pedestrians and fail to account for pedestrians’ actual avoidance behavior. As a result, pedestrian models lack route-planning abilities when confronted with conflicting vehicles and cannot be applied to complex intersections without signal guidance. Our model considers avoidance strategies for pedestrians during interactions with vehicles. The repulsive forces are modeled separately in both the lateral and longitudinal directions, making the pedestrian’s avoidance behavior safer and more reasonable.

3. Pedestrian Agents

3.1. Gap Acceptance Decision

For continuous traffic flow, pedestrians generally make crossing decisions by judging whether the gap between two consecutive vehicles is large enough to safely cross. Therefore, accepting the gap is a key indicator in evaluating pedestrian crossing behavior. The gap G between vehicles is defined as the time it takes for the target vehicle to travel the distance between itself and the preceding vehicle at its current speed, as shown in Equation (1).
G k + 1 = d ( k , k + 1 ) v c k + 1
G k + 1 represents the gap between the k+1-th vehicle and the preceding vehicle, d ( k , k + 1 ) is the distance between the k-th and k+1-th vehicles, and v c ( k + 1 ) is the speed of the k+1-th vehicle.
If there are no other vehicles in front of the conflicting vehicle k, the time required for the vehicle k to reach the location of pedestrian i, known as the time to arrival (TTA), can be used as a substitute for the vehicle gap, as shown in Equation (2):
G T T A = d ( i , k ) v c k
where d ( i , k ) represents the distance between the pedestrian and the vehicle, and v c k is the speed of the vehicle.
Only when the pedestrian’s predicted crossing time t a c r o s s is less than the vehicle gap G can the pedestrian safely cross the road. Otherwise, the pedestrian needs to wait for the next larger vehicle gap. The pedestrian’s predicted crossing time t a c r o s s is shown in Equation (3):
t a c r o s s = D v a c r o s s + t r
where D is the width of the lane that the pedestrian needs to cross, v a c r o s s is the pedestrian’s speed while crossing the road, and t r is an empirical parameter representing the pedestrian’s reaction time.

3.2. Force-Based Pedestrian Model Framework

Based on the social force model, the total force F i acting on pedestrian agent i at time t during the crossing process is described by Equation (4):
F i ( t ) = f i ( t ) + j , j i f i j ( t ) + W f i W ( t ) + C f i k ( t )
where f i is the driving force for the movement of the pedestrian agent, f i j is the repulsive force from other pedestrian agents, f i W is the repulsive force exerted by the surrounding building environment on the pedestrian agent, and f i k is the force applied by interacting vehicles on the pedestrian.
In the design of additional forces for vehicles, existing methods mainly include repulsive forces based on the pedestrian–vehicle distance [22], additional shape repulsion [24], and vector field navigation [27], all of which aim to maintain a distance between pedestrians and vehicles to avoid collisions. However, they lack route-planning capabilities when confronted with conflicting vehicles. As shown in Figure 2, pedestrians near the front of a vehicle reduce their speed in advance to avoid a collision and wait for the vehicle to pass, while pedestrians near the rear of the vehicle are less affected by the vehicle and thus slowly approach the vehicle and move toward the rear, crossing the traffic flow safely. This section considers the relative spatial position and social psychological factors based on the original social force model, and the proposed model divides the forces by direction according to the relative position between the pedestrian and the vehicle, enabling pedestrians to exhibit more realistic and varied behaviors in conflict avoidance.
Due to the unidirectional motion of vehicles on straight roads, pedestrians tend to prioritize evading vehicles in the lateral direction. Therefore, the forces in the lateral direction and the longitudinal direction should not be considered equally. This paper models the forces exerted by vehicles on pedestrians in different directions. The force f i k exerted by vehicle k on pedestrian i within the pedestrian’s field of view is shown in Equation (5):
f i k = f i k x + f i k y
where f i k x and f i k y represent the forces exerted by the vehicle in the lateral direction and longitudinal direction on the pedestrian, respectively. The force experienced by the pedestrian is shown in Figure 3.
The repulsive effect of vehicles on pedestrians increases as the distance decreases. Decay functions can effectively describe the magnitude of forces at different interaction distances, with commonly used functions including exponential and linear decay.
To demonstrate the effect of parameters in the decay function on the results, as shown in Figure 4a, the value of the exponential function decays exponentially with distance. This function is widely applied in the social force model to describe rapid avoidance behavior at close distances. Its general formula is given by Equation (6):
f exp ( x , A , B ) = A e ( B x )
where x is the independent variable, typically representing the distance between interacting objects in social force models, A denotes the function’s maximum value at the closest approach distance, and B is the parameter that modulates the decay characteristics.
As shown in Figure 4b, the linear function describes a smooth decreasing linear relationship between the variables. Its formula is given by Equation (7):
f l i n e a r ( x , x 0 , C ) = C [ x 0 x + ( x 0 x ) 2 ] 2 x 0
where x is the independent variable representing distance, x 0 is the threshold distance at which the function almost reaches zero, and C is the maximum value of the function when the distance reaches zero.
The rapid decay characteristic of the exponential function can effectively describe the rapidly increasing repulsive force when pedestrians approach vehicles. This behavior is reasonable due to the severe consequences of potential collisions. Constrained by the mechanical characteristics of the vehicle, vehicles typically do not change direction quickly or significantly. During the process of avoiding the vehicle, the lateral direction is the most efficient evasion direction, allowing the pedestrian to quickly move away from the front of the vehicle, which aligns with the application characteristics of the exponential decay function. However, in other situations, the exponential relationship may not be the most suitable. When pedestrians adjust their position in the longitudinal direction relative to the vehicle, there is no potential collision, so the longitudinal direction is more suited to the application characteristics of the linear decay function. Based on the parameter characteristics of the decay function, we can initially set the parameter values according to actual physical parameters.
Linear decay functions are more suitable for describing smooth influence relationships at close distances. The force f i k x exerted by vehicle k on nearby pedestrian i in the longitudinal direction is expressed by Equation (8):
f i k x = α x [ d a v o i d d i c r + ( d a v o i d d i c r ) 2 ] 2 d a v o i d n x , G k + 1 > G a c c e p t 0                  , G k + 1 < G a c c e p t
where α x is a constant, d a v o i d is the maximum response distance for pedestrian detour behavior, d i c r is the longitudinal relative distance from the pedestrian to the rear of vehicle, n x is the unit vector parallel to the vehicle’s direction of travel, and G a c c e p t is the pedestrian’s currently acceptable gap.
The exponential function is commonly used for collision avoidance in social force interactions due to its characteristic of an exponentially decaying response force with distance. The effectiveness of this function has been demonstrated by most social force-based models [25]. The force f i k y exerted by vehicle k on pedestrian i in the pedestrian’s forward direction (i.e., the lateral direction of the vehicle) is expressed by Equation (9):
f i k y = α y e [ θ ( d i k s δ ) ] n y , d c o n f l i c t d i c r 0       , d c o n f l i c t < d i c r
d c o n f l i c t = d a v o i d + ρ v c
where α y ,   θ are constants, d i k s is the lateral relative distance between pedestrian i and vehicle k, δ is the minimum lateral distance between the pedestrian and the vehicle, n y is the unit vector perpendicular to the direction of travel of vehicle k and pointing toward the pedestrian side, d c o n f l i c t is the conflict distance between the vehicle and the pedestrian, d a v o i d is the minimum conflict distance for the pedestrian to avoid the vehicle, v c is the speed of the current vehicle, and ρ is a constant representing the intensity of the vehicle’s speed on the pedestrian’s psychological impact.

4. Vehicle Agents

4.1. Normal Following

Pedestrian-related accidents are particularly common at unsignalized intersections, as vehicles are less likely to yield to pedestrians in these locations [28]. For scenarios where vehicles do not yield to pedestrians, the vehicles can be considered to be in a normal car-following state. This study adopts the IDM as the car-following simulation model. The IDM exhibits strong adaptability and stability across various traffic conditions, making it suitable for microscopic traffic simulation in most urban environments [16].

4.2. Yielding Behavior

Unlike pedestrians and other traffic participants, vehicles, due to the constraints of their mechanical structures, typically do not deviate significantly from their driving paths. As a result, pedestrians on the driving route impose greater psychological pressure on drivers, leading them to decelerate more quickly and earlier. Consequently, the IDM cannot be used to describe pedestrian–vehicle interactions. To address this issue, this study proposes an improved IDM based on psychological pressure, as shown in Equation (11).
v ˙ = a 1 v c v 0 4 F p ( i , k , v c , Δ v c )
The equation combines the social force model with the IDM, simulating vehicles that can react to other traffic participants during normal driving, allowing them to slow down in advance to avoid pedestrians ahead. The first part of the equation represents the speed-driving term from the IDM. Since interactions between vehicles are primarily governed by spacing and speed, the speed-driving term in the IDM aligns more closely with the dynamic behavior of vehicles compared to using the driving force from the social force model, where v ˙ represents the current vehicle’s acceleration, a is the maximum acceleration or deceleration of the vehicle, v c is the current speed of the vehicle, and v 0 is the desired speed of the vehicle.
The latter part, F p i , j , v , Δ v , represents the force exerted by pedestrians on vehicles. Inspired by the social force model in crowd simulation, this paper introduces the concept of psychological forces between different traffic participants. When a potential conflict occurs between a pedestrian and a vehicle, the vehicle begins to decelerate and avoid the pedestrian, generating a psychological force in the opposite direction of travel to reduce its speed. The formula for this psychological force F p is shown in Equation (12), and it is influenced by the vehicle’s braking deceleration term within the desired gap and the psychological force between the vehicle and the pedestrian.
F p ( i , k , v c , Δ v c ) = f s s , s * + f p ( i , k ) m c
f s s , s * is the braking deceleration term of the vehicle within the desired distance, and its calculation formula is shown in Equation (13):
f s s , s * = s * ( v c , Δ v c ) s 2
where s represents the actual spacing between the vehicle and the adjacent vehicle, and s * is the current desired spacing of the vehicle, which is calculated based on the difference between the current speed of the vehicle and the speed of the pedestrian. The formula for calculating s * is shown in Equation (14):
s * ( v c , Δ v c ) = s 0 + s 1 v c v 0 + T v c + v c Δ v c 2 a b
where b is the comfortable deceleration of the vehicle, s 0 and s 1 are the minimum following distance and waiting distance of the vehicle, respectively, T is the safe time gap of the vehicle, and v c is the velocity difference between the vehicle and the pedestrian in the driving direction.
f p ( i , j ) is the additional psychological force exerted by the pedestrian on the vehicle driver, and its calculation formula is shown in Equation (15):
f p ( i , k ) = A c e d i c h / μ
where d i c h is the distance between the pedestrian and the front of the vehicle, and A c and μ are constants, representing the intensity of the repulsive force and the minimum acceptable distance between the vehicle and the pedestrian, respectively.

5. Simulation Results

5.1. Simulation Environment

We built a mixed pedestrian–vehicle traffic scenario using Unity3D game engine version 2021.3.8 and implemented the model proposed in this paper using C#, as shown in Figure 5. All simulation experiments can run and display smoothly on a desktop computer equipped with an Intel (R) Core(TM) i5-10500 CPU processor, 16 GB RAM, and an NVIDIA RTX 2070 graphics card. During real-time testing, the average runtime achieved t = 0.02   s in scenarios containing 20 vehicles and 20 pedestrians, meeting the requirements for real-time simulation ( t 0.05   s ).
The selection of model parameters determines the validity of the simulation results. The main model parameters used in this experiment are shown in Table 1, where the social force parameters between pedestrians and the psychological repulsive force of pedestrians towards vehicles are the same as those in [29] and are, therefore, not provided. Based on the DUT and CRIT datasets, we have statistically analyzed the average speed, acceleration, and evasion distance of pedestrians, among other relevant behavioral parameters. In the experiment, through qualitative analysis of the individual pedestrian behaviors observed and simulated, we determined the effective parameter set.

5.2. Pedestrian–Vehicle Interaction

Figure 6 illustrates four pedestrian–vehicle interaction scenarios implemented in our simulation model. These scenarios include (1) a pedestrian waiting for the vehicle to decelerate, accepting the current vehicle gap, and crossing the road in front of the vehicle; (2) a pedestrian accepting the current vehicle gap and choosing to cross the road directly; (3) a pedestrian selecting the next vehicle gap, thus moving closer to the rear of the vehicle to avoid a collision while seeking a safer crossing opportunity; and (4) a pedestrian rejecting all vehicle gaps within their field of vision and waiting in place for a crossing opportunity. The schematic diagram at the bottom of the image shows the pedestrian and vehicle trajectories for the current scenario. The red and blue trajectories represent vehicles and pedestrians, respectively, with arrows indicating the direction and the length of the arrow representing the target’s speed.
To better understand the performance of our model, in Figure 7, we show the longitudinal and lateral velocities of pedestrians and vehicles in the first and third scenarios mentioned above. In Figure 7a, the pedestrians and vehicles slow down after detecting each other, and the pedestrian intelligent agent accelerates through the road after observing that the vehicle speed decreases to within its own acceptance gap range. After the interaction, the two return to their original state. In addition, the lateral avoidance behavior of pedestrian intelligent agents during the process of crossing the road can be seen, which is consistent with the behavior of real traffic. In Figure 7b, the pedestrian rejected the blue car’s gap and accepted the white car’s gap. It can be seen that the pedestrian intelligent agent decelerates and avoids the blue car in the longitudinal direction while moving towards the rear of the blue car in the transverse direction. After the blue car passes, it quickly returns to its original state and crosses the road, which is consistent with the behavior of pedestrians at signal-less intersections in reality.
To evaluate the simulation performance of the model presented in this paper, we compare it with a more advanced model used in autonomous driving simulation platforms [22]. Compared to the traffic simulation algorithms of current mainstream driving platforms, the force-based method proposed by Chao et al. simulates the interactions of various road users by applying additional forces. This method generates a repulsive force from the vehicle towards the pedestrian based on the distance between them, restoring pedestrian behaviors such as decelerating when approaching a vehicle and accelerating away after crossing the road. However, this method focuses on avoiding pedestrian–vehicle collisions and overlooks the social behavior of pedestrians yielding to vehicles at unsignalized intersections. The pedestrian agent lacks route-planning capabilities when facing conflicting vehicles, resulting in poor simulation performance of direct interactions between pedestrians and vehicles.
Using the four pedestrians marked by red circles in Figure 8c as simulation subjects, the behavioral comparison results between our proposed method and Chao et al.’s method, alongside real footage, are shown in Figure 8a,b, where the red arrows indicate the movement directions of the pedestrians. In our method, when pedestrian–vehicle interaction occurs, the pedestrian agent makes decisions based on its position and the vehicle’s speed, avoiding strong frontal conflicts with the vehicle. After confirming the safety of the gap behind the vehicle, the pedestrian chooses not to cross in front of the vehicle but instead turns to the rear side of the vehicle and crosses the road, avoiding conflict. This behavior aligns with that of pedestrians in the real footage. In Chao et al.’s model, however, since the relative spatial positions between pedestrians and vehicles are not considered and the pedestrian–vehicle interaction force is primarily based on distance, the pedestrian agent lacks route-planning capability when facing conflicting vehicles. Some pedestrian agents attempt to pass in front of the vehicle, waiting for the vehicle to decelerate before maneuvering around the vehicle to cross.
Figure 9 compares pedestrian trajectories for the DUT dataset, Chao et al.’s method, and our method. Due to the high crowd density and not all pedestrians interacting with vehicles, we used Track 6.1.0 to track four pedestrians who had direct conflicts with vehicles at an unsignalized intersection. Pedestrian trajectories were sampled every 0.05 s. Based on a real video, we simulated four pedestrians interacting with vehicles at the intersection and six nearby pedestrians. It can be observed that our method is more effective in simulating pedestrian behavior when interacting with vehicles at an unsignalized intersection. When pedestrian agents interact with vehicles that do not actively yield at the unsignalized intersection, our model is capable of selecting reasonable evasive paths.
Figure 10 shows the speed curves of the four tracked pedestrians in both the real video and the simulated scenario. The results indicate that the speed of the agents simulated by our algorithm is closer to the real situation. The average speed of pedestrians simulated using our method and Chao et al.’s method is shown in Figure 11. We also calculated the error and root mean squared error (RMSE) between the average speeds simulated using both methods and the actual data, as shown in Table 2. The results show that in the scenario where pedestrians interact with vehicles at an unsignalized intersection, our method simulates pedestrian behavior more reasonably than Chao et al.’s method. Specifically, in cases where conflicts occur in front of vehicles, the average speed error is reduced from 39.87% to 13.39%. Therefore, our method can more reasonably simulate pedestrians’ evasive behavior.

6. Conclusions and Future Work

In this paper, we propose a social force-based simulation model for pedestrian–vehicle interaction at unsignalized intersections to simulate pedestrian road-crossing behaviors. The model consists of a decision-making layer and a conflict interaction layer. At the decision-making layer, we simulate various pedestrian gap-acceptance decisions based on pedestrians’ gap-acceptance habits. At the conflict interaction layer, we present a social force-based framework for pedestrian–vehicle interaction, where forces are decomposed into lateral and longitudinal directions based on the relative spatial positions of pedestrians and vehicles. This framework simulates more natural pedestrian avoidance behaviors at unsignalized intersections and enhances the route-planning capability of pedestrian agents in pedestrian–vehicle interaction models when encountering conflicting vehicles. In the simulation results section, the performance of our model is validated through comparisons with state-of-the-art simulation algorithms used in autonomous vehicle testing.
Autonomous driving test platforms, such as Carla, only use rule-based models to simulate pedestrian–vehicle interactions [22]. When pedestrians detect vehicles on their path, they stop moving, which is inconsistent with real-world behavior. Data-driven simulation methods can more accurately reproduce the movement details of traffic participants, but these data-driven models typically fail to meet the real-time operation requirements of autonomous driving platforms. In contrast to the methods mentioned above, the social force-based model framework used in this study is simple and scalable. Under the influence of social forces, it allows pedestrians to portray more realistic avoidance behaviors based on the detected distance and speed of vehicles, and it can run in real-time, meeting the real-time simulation needs of autonomous driving test platforms.
The model proposed in this paper can be improved in several aspects: First, different initial parameters can be set for pedestrians and vehicles to eliminate the homogeneity assumption, allowing for the simulation of heterogeneous traffic. Second, the current model scenario only considers pedestrian–vehicle interaction behaviors at unsignalized intersections. In other complex traffic scenarios, such as high-density traffic flow or the presence of abnormal traffic participants, pedestrians and vehicles may exhibit different interaction behaviors, requiring further research in the future. Third, more real-world pedestrian–vehicle interaction data and optimization algorithms can be used to further calibrate the model. Finally, to simulate diverse mixed-traffic environments and meet the diverse needs of autonomous driving test platforms, interaction behaviors between different traffic participants, such as bicycles and electric vehicles, can be modeled based on their movement characteristics.

Author Contributions

Conceptualization, X.W. and Z.L.; methodology, X.W.; software, X.W.; validation, X.W., Z.L. and T.L.; writing—original draft preparation, X.W.; writing—review and editing, X.W., Z.L. and T.L.; supervision, Z.L. and T.L. All authors have read and agreed to the published version of the manuscript.

Funding

This research received no external funding.

Institutional Review Board Statement

Not applicable.

Informed Consent Statement

Not applicable.

Data Availability Statement

The data presented in this study are available on request from the corresponding author.

Conflicts of Interest

The authors declare no conflicts of interest.

References

  1. Alver, Y.; Onelcin, P.; Cicekli, A.; Abdel-Aty, M. Evaluation of pedestrian critical gap and crossing speed at midblock crossing using image processing. Accid. Anal. Prev. 2021, 156, 106127. [Google Scholar] [CrossRef] [PubMed]
  2. Zhang, C.; Chen, F.; Wei, Y. Evaluation of pedestrian crossing behavior and safety at uncontrolled mid-block crosswalks with different numbers of lanes in China. Accid. Anal. Prev. 2019, 123, 263–273. [Google Scholar] [CrossRef] [PubMed]
  3. Nassereddine, H. Modeling vehicle-pedestrian interactions at unsignalized intersections. J. Transp. Saf. Secur. 2024, 1–19. [Google Scholar] [CrossRef]
  4. World Health Organization. Global Status Report on Road Safety 2018; World Health Organization: Geneva, Switzerland, 2018. [Google Scholar]
  5. Han, Y.; Chao, Q.; Jin, X. A simplified force model for mixed traffic simulation. Comput. Animat. Virtual Worlds 2021, 32, e1974. [Google Scholar] [CrossRef]
  6. Rinke, N.; Schiermeyer, C.; Pascucci, F.; Berkhahn, V.; Friedrich, B. A multi-layer social force approach to model interactions in shared spaces using collision prediction. Transp. Res. Procedia 2017, 25, 1249–1267. [Google Scholar] [CrossRef]
  7. Chao, Q.; Deng, Z.; Jin, X.J. Vehicle–pedestrian interaction for mixed traffic simulation. Virtual Worlds 2015, 26, 405–412. [Google Scholar] [CrossRef]
  8. Yang, D.; Li, L.; Redmill, K.; Özgüner, Ü. Top-view trajectories: A pedestrian dataset of vehicle-crowd interaction from controlled experiments and crowded campus. In Proceedings of the 2019 IEEE Intelligent Vehicles Symposium (IV), Paris, France, 9–12 June 2019; IEEE: New York, NY, USA, 2019. [Google Scholar]
  9. Chao, Q.; Deng, Z.; Ren, J.; Ye, Q.; Jin, X. Realistic data-driven traffic flow animation using texture synthesis. IEEE Trans. Vis. Comput. Graph. 2017, 24, 1167–1178. [Google Scholar] [CrossRef]
  10. Ren, J.; Xiang, W.; Xiao, Y.; Yang, R.; Manocha, D.; Jin, X. Heter-sim: Heterogeneous multi-agent systems simulation by interactive data-driven optimization. IEEE Trans. Vis. Comput. Graph. 2019, 27, 1953–1966. [Google Scholar] [CrossRef]
  11. Alahi, A.; Goel, K.; Ramanathan, V.; Robicquet, A.; Fei-Fei, L.; Savarese, S. Social lstm: Human trajectory prediction in crowded spaces. In Proceedings of the IEEE Conference on Computer Vision and Pattern Recognition, Las Vegas, NV, USA, 27–30 June 2016. [Google Scholar]
  12. Cheng, H.; Sester, M. Modeling mixed traffic in shared space using lstm with probability density mapping. In Proceedings of the 2018 21st International Conference on Intelligent Transportation Systems (ITSC), Maui, HI, USA, 4–7 November 2018; IEEE: New York, NY, USA, 2018. [Google Scholar]
  13. Chao, Q.; Bi, H.; Li, W.; Mao, T.; Wang, Z.; Lin, M.C.; Deng, Z. A survey on visual traffic simulation: Models, evaluations, and applications in autonomous driving. Comput. Graph. Forum. 2020, 39, 287–308. [Google Scholar] [CrossRef]
  14. Peng, G.; Cai, X.; Liu, C.; Cao, B.; Tuo, M. Optimal velocity difference model for a car-following theory. Phys. Lett. A 2011, 375, 3973–3977. [Google Scholar] [CrossRef]
  15. Kesting, A.; Treiber, M.; Helbing, D. Enhanced intelligent driver model to access the impact of driving strategies on traffic capacity. Philos. Trans. R. Soc. A Math. Phys. Eng. Sci. 2010, 368, 4585–4605. [Google Scholar] [CrossRef] [PubMed]
  16. Zhu, M.; Wang, X.; Tarko, A. Modeling car-following behavior on urban expressways in Shanghai: A naturalistic driving study. Transp. Res. Part C Emerg. Technol. 2018, 93, 425–445. [Google Scholar] [CrossRef]
  17. Crociani, L.; Vizzari, G. An integrated model for the simulation of pedestrian crossings. In Proceedings of the Cellular Automata: 11th International Conference on Cellular Automata for Research and Industry, ACRI 2014, Krakow, Poland, 22–25 September 2014; Springer: Berlin/Heidelberg, Germany, 2014. Proceedings 11. [Google Scholar]
  18. Chen, P.; Wu, C.; Zhu, S. Interaction between vehicles and pedestrians at uncontrolled mid-block crosswalks. Saf. Sci. 2016, 82, 68–76. [Google Scholar] [CrossRef]
  19. Wu, W.; Chen, R.; Jia, H.; Li, Y.; Liang, Z. Game theory modeling for vehicle–pedestrian interactions and simulation based on cellular automata. Int. J. Mod. Phys. C 2019, 30, 1950025. [Google Scholar] [CrossRef]
  20. Helbing, D.; Molnar, P. Social force model for pedestrian dynamics. Phys. Rev. E 1995, 51, 4282. [Google Scholar] [CrossRef]
  21. Anvari, B.; Bell, M.G.; Sivakumar, A.; Ochieng, W.Y. Modelling shared space users via rule-based social force model. Transp. Res. Part C Emerg. Technol. 2015, 51, 83–103. [Google Scholar] [CrossRef]
  22. Chao, Q.; Jin, X.; Huang, H.-W.; Foong, S.; Yu, L.-F.; Yeung, S.-K. Force-based heterogeneous traffic simulation for autonomous vehicle testing. In Proceedings of the 2019 International Conference on Robotics and Automation (ICRA), Montreal, QC, Canada, 20–24 May 2019; IEEE: New York, NY, USA, 2019. [Google Scholar]
  23. Xu, M.; Wang, H.; Chu, S.; Gan, Y.; Jiang, X.; Li, Y.; Zhou, B. Traffic simulation and visual verification in smog. ACM Trans. Intell. Syst. Technol. TIST 2018, 10, 1–17. [Google Scholar] [CrossRef]
  24. Zeng, W.; Chen, P.; Yu, G.; Wang, Y. Specification and calibration of a microscopic model for pedestrian dynamic simulation at signalized intersections: A hybrid approach. Transp. Res. Part C Emerg. Technol. 2017, 80, 37–70. [Google Scholar] [CrossRef]
  25. Yang, D.; Özgüner, Ü.; Redmill, K. A social force based pedestrian motion model considering multi-pedestrian interaction with a vehicle. ACM Trans. Spat. Algorithms Syst. TSAS 2020, 6, 1–27. [Google Scholar] [CrossRef]
  26. Zhao, J.; Malenje, J.O.; Wu, J.; Ma, R. Modeling the interaction between vehicle yielding and pedestrian crossing behavior at unsignalized midblock crosswalks. Transp. Res. Part F Traffic Psychol. Behav. 2020, 73, 222–235. [Google Scholar] [CrossRef]
  27. Schönauer, R.; Stubenschrott, M.; Huang, W.; Rudloff, C.; Fellendorf, M. Modeling concepts for mixed traffic: Steps toward a microscopic simulation tool for shared space zones. Transp. Res. Rec. 2012, 2316, 114–121. [Google Scholar] [CrossRef]
  28. Tian, K.; Markkula, G.; Wei, C.; Lee, Y.M.; Madigan, R.; Merat, N.; Romano, R. Explaining unsafe pedestrian road crossing behaviours using a psychophysics-based gap acceptance model. Saf. Sci. 2022, 154, 105837. [Google Scholar] [CrossRef]
  29. Helbing, D.; Farkas, I.; Vicsek, T. Simulating dynamical features of escape panic. Nature 2000, 407, 487–490. [Google Scholar] [CrossRef] [PubMed]
Figure 1. Overall framework of our model.
Applsci 15 04885 g001
Figure 2. Pedestrian crossing behaviors in unsignalized intersections [8].
Applsci 15 04885 g002
Figure 3. Force interactions on pedestrian agents.
Applsci 15 04885 g003
Figure 4. Decay functions with different parameter values: (a) exponential decay function; (b) linear decay function.
Applsci 15 04885 g004
Figure 5. The intersection environment constructed for the simulation model in this paper.
Applsci 15 04885 g005
Figure 6. Pedestrian and vehicle behaviors at an unsignalized intersection generated based on the model in this paper. (a) A pedestrian crosses the road after the vehicle slows down. (b) A pedestrian crosses the road directly. (c) A pedestrian bypasses the vehicle from behind and crosses the road. (d) A pedestrian waits for a safer vehicle gap.
Applsci 15 04885 g006
Figure 7. Speed curves during pedestrian–vehicle interaction. (a) A pedestrian crosses the road after the vehicle decelerates. (b) A pedestrian bypasses the vehicle from behind and crosses the road.
Applsci 15 04885 g007
Figure 8. Simulation of pedestrian–vehicle interaction at an unsignalized intersection: (a) our method, (b) Chao et al.’s method [22], and (c) DUT dataset [8].
Applsci 15 04885 g008
Figure 9. Comparison of simulated trajectories: (a) our model, (b) Chao et al.’s method [22], and (c) DUT dataset [8].
Applsci 15 04885 g009
Figure 10. Comparison of speed curves of 4 pedestrians in the DUT dataset [8], our method, and Chao et al’s method [22].
Applsci 15 04885 g010
Figure 11. Comparison of the average speeds of 4 pedestrians in the DUT dataset [8], our method, and Chao et al’s method [22].
Applsci 15 04885 g011
Table 1. Parameter values used in the experiment.
ParametersValueUnitDescription
α x ,   α y ,   A c {200, 500, 15,000} / scale factor of force
μ ,   θ {5, 2.5} / sensitivity to distance
d a v o i d 7 m minimum conflict distance
ρ 1.5 / scale factor of v c
δ 0.1 m minimum lateral distance
t r [0.7, 1.0] s pedestrian reaction time
v c 0 [7, 12] m / s desired speed of the vehicle
a c [2, 3] m / s 2 maximum acceleration of the vehicle
b s l [3, 4] m / s 2 comfortable deceleration of the vehicle
s 0 [1, 2] m jam space headway
T c [1, 2] s desired safety time headway
Table 2. Data-based evaluation results (RMSE/average speed error).
Pedestrian 1Pedestrian 2Pedestrian 3Pedestrian 4
Our method0.215/13.39%0.195/1.01%0.057/3.59%0.075/5.00%
Chao et al.’s method [22]0.591/39.87%0.233/7.59%0.093/6.45%0.076/2.36%
Disclaimer/Publisher’s Note: The statements, opinions and data contained in all publications are solely those of the individual author(s) and contributor(s) and not of MDPI and/or the editor(s). MDPI and/or the editor(s) disclaim responsibility for any injury to people or property resulting from any ideas, methods, instructions or products referred to in the content.

