Article

Machine-Learning-Based Rollover Risk Prediction for Autonomous Trucks: A Dynamic Stability Analysis

Department of Smart Mobility Engineering, Joongbu University, Goyang-si 10279, Republic of Korea
Appl. Sci. 2025, 15(9), 4886; https://doi.org/10.3390/app15094886
Submission received: 31 March 2025 / Revised: 25 April 2025 / Accepted: 27 April 2025 / Published: 28 April 2025

Abstract

:
In response to the 2023 mandate requiring electronic stability control (ESC) for trucks in South Korea, domestic manufacturers have called for a relaxation of the maximum safe slope angle to reduce production costs. However, limited research exists on the quantitative relationship between ESC implementation and vehicle rollover stability under relaxed safety standards. This study addresses this gap by conducting dynamic simulations of standardized rollover tests to evaluate the static stability factor (SSF) and by developing a machine-learning-based model for predicting rollover risk. The model incorporates planned path curvature and driving speed to compute lateral acceleration, which serves as a key input for predicting the lateral load transfer ratio (LTR), a critical indicator of vehicle stability. Among several models tested, the recurrent neural network (RNN) achieved the highest accuracy in LTR prediction. The results highlight the effectiveness of integrating data-driven models into dynamic stability assessment frameworks, offering practical insights for optimizing route planning and speed control—particularly in autonomous freight vehicle applications.

1. Introduction

With the emergence of Level 4 autonomous freight trucks, ensuring on-road safety remains a critical challenge [1]. In South Korea, according to statistics from the National Police Agency [2], a total of 24,233 truck-related accidents occurred in 2022, resulting in 630 fatalities and 34,922 injuries. Although single-vehicle rollover and overturning accidents constitute a smaller proportion compared to vehicle-to-vehicle collisions, they exhibit relatively higher fatality rates.
To account for the rollover stability of freight vehicles, the maximum safe slope angle is set at 35° for unloaded vehicles classified as passenger cars, trucks, special vehicles, and vans with a seating capacity of 10 or fewer. For vehicles with a total weight of up to 1.2 times their unloaded weight, the limit is 30°, while for vans with a seating capacity of 11 or more, the limit is 28° under loaded conditions. In South Korea, these regulations have remained largely unchanged since their initial establishment in 1962. In contrast, in Europe, the maximum safe slope angle for medium- and large-sized buses under loaded conditions is 28°, while for hazardous material transport trucks and trailers, it is set at 23°.
As of 2023, electronic stability control (ESC) installation has been mandated for trucks exceeding 4.5 tons and up to 20 tons in gross vehicle weight, as well as for trucks over 4.5 tons with a total length of 11 m or less, excluding four-axle or more vehicles, dump trucks, special-purpose trucks, recovery vehicles, and specialized work vehicles. As the rollover stability of trucks improves due to ESC implementation, domestic truck manufacturers have increasingly called for a relaxation of the maximum safe slope angle to reduce manufacturing and operational costs. Ensuring the dynamic stability of heavy-duty vehicles, particularly autonomous freight trucks, is a growing concern globally. Modern safety systems such as anti-lock braking systems (ABS) and ESC have shown notable effectiveness in mitigating rollover risks [3,4]. Nevertheless, these systems operate reactively and depend heavily on predefined threshold responses. Consequently, there is a growing need for predictive systems that can proactively assess stability based on vehicle state and environmental inputs. To mitigate the human and material losses caused by truck rollovers and enhance road operation efficiency, technology is needed to actively control vehicle speed to prevent accidents and optimize driving speed for improved freight transport efficiency. Traditional vehicle safety technologies, such as ABS and ESC, have primarily focused on real-time braking control; however, new technologies capable of proactively preventing hazards in rapidly changing situations are becoming increasingly necessary [5,6].
Key factors contributing to vehicle rollover in dynamic conditions include lateral acceleration, the position and height of the center of gravity, suspension performance, and roll resistance. Among these, lateral acceleration is considered the most influential factor [7]. While lateral acceleration can be derived from road curvature and vehicle speed, it alone is insufficient to determine vehicle stability. Other factors, such as the center of gravity height and suspension characteristics, vary due to vehicle aging, maintenance conditions, and real-time changes in cargo weight and position during driving. Due to these uncertainties, recent advancements in machine-learning-based autonomous driving technologies have emerged as a promising solution.
Recent research has explored the integration of machine learning techniques for predicting dynamic vehicle states such as roll angle and lateral load transfer ratio (LTR). For example, Antonio et al. [8] developed a machine-learning-based model to estimate the roll angle and LTR using a comprehensive set of vehicle kinematic variables such as vehicle speed, longitudinal acceleration, lateral acceleration, vertical acceleration, roll rate, yaw rate, pitch rate, and steering angle into a machine learning model to estimate roll angle and LTR for both the front and rear axles. Similarly, Chao et al. [9] developed an improved time-to-rollover (TTR) prediction model using neural networks to prevent rollovers in new energy vehicles. This study analyzed multiple parameters affecting rollovers and evaluated the impact of various hyperparameters on prediction accuracy. It demonstrated that key machine learning parameters, including the number of hidden layers, training cycles, learning rate, and batch size, significantly influence prediction performance, further highlighting the efficiency of machine learning algorithms over traditional sensor-based methods. Additionally, Nie et al. [10] introduced an innovative approach by developing a deep neural network (DNN) model designed for predicting vehicle dynamics during complex maneuvers, such as double lane changes. This model leverages data generated from multibody simulation techniques, with input variables including wheel torque and initial speed. The DNN effectively predicts critical vehicle state parameters, such as longitudinal and lateral distances, velocities, and yaw angles. Validation results demonstrate that the DNN predictions align closely with multibody simulation outcomes, highlighting its potential as a robust tool for real-time vehicle state estimation. And Kemal Koysuren et al. [11] proposed a novel physics-informed deep learning approach for real-time estimation of critical vehicle parameters, including cornering stiffness. By integrating physical modeling with deep learning techniques, this method significantly improves the accuracy and computational efficiency of parameter estimation, an essential aspect for vehicle stability control systems. The validity of this approach was demonstrated through experiments using a scaled vehicle model, showcasing its potential in enhancing dynamic stability applications.
Despite these advancements, there remains a need to further contextualize rollover prediction within broader, globally relevant safety frameworks. Vijayarangan et al. [12] emphasized a multivariable control strategy for autonomous vehicle stability using data-driven simulations, which aligns with this study’s simulation-based approach. Additionally, Kumar et al. [13] presented a real-world evaluation methodology for vehicular dynamics using experimental datasets, suggesting pathways for model validation beyond simulation.
The occurrence of rollover accidents, although less frequent than other types of vehicular incidents, presents significantly higher fatality rates. Traditional vehicle safety evaluation methods have predominantly focused on metrics such as the static stability factor (SSF), which evaluates a vehicle’s resistance to rollover under static conditions [14]. While the SSF serves as a foundational measure, it does not fully capture the dynamic complexities introduced by real-time maneuvers, road geometry, or load variations. This study evaluated the dynamic stability of trucks concerning maximum safe slope angles through simulation. First, the relationship between the static stability factor (SSF) and the maximum safe slope angle was analyzed. The SSF is a critical metric for assessing vehicle stability and is expressed as follows [14]:
S S F = T 2 h
where T represents the average track width of the front and rear axles, and h denotes the height of the vehicle’s center of gravity.
According to existing literature [14], SSF values typically range from 1.02 to 1.45 for passenger cars and light trucks (gross vehicle weight ≤ 4536 kg), 0.65 to 1.14 for medium-duty commercial vehicles (4536–11,793 kg), and 0.51 to 0.7 for heavy-duty commercial vehicles (>11,793 kg). In fully loaded conditions, SSF values tend to be even lower.
Next, the dynamic stability of trucks was evaluated based on SSF. To consider various dynamic scenarios, six test evaluation methods defined by NHTSA and SAE were employed: circle, double lane change (DLC), slowly increasing steer (SIS), J-turn, sine with dwell (SWD), and fishhook [15,16,17]. The simulations incorporated five types of freight vehicles to account for different vehicle parameters. For each test scenario, the lateral load transfer ratio (LTR) was analyzed to assess the dynamic stability of trucks concerning the maximum safe slope angle. Additionally, a machine learning model was developed to predict LTR based on the planned path curvature and driving speed in an autonomous driving environment. The LTR metric represents the load transfer between a vehicle’s left and right wheels, with values approaching 1 indicating that the load is almost entirely shifted to one side, increasing the risk of rollover. The machine learning models used in this study included multiple linear regression (MLR), random forest regression (hereafter, random forest), and recurrent neural networks (RNN). The experimental results compared the prediction accuracy of the machine learning models. The findings indicate that using curvature and vehicle speed directly as input features yielded lower accuracy compared to using lateral acceleration derived from these parameters. The RNN model demonstrated the highest prediction accuracy, highlighting its suitability for LTR estimation. These results suggest that machine-learning-based predictive models can enhance vehicle safety assessments by providing precise rollover risk predictions. Furthermore, the findings support the integration of machine learning into autonomous freight transportation systems, offering valuable insights for optimizing route planning and speed control to improve overall safety and efficiency.

1.1. Research Gap

While existing studies have addressed vehicle stability improvement through ESC and active control systems, few have directly investigated the dynamic implications on regulatory stability margins, such as safe slope angles, specifically for heavy-duty autonomous trucks operating under updated safety standards.

1.2. Problem Statement

There is insufficient quantitative analysis connecting ESC effects, dynamic stability metrics such as static stability factor (SSF) and lateral load transfer ratio (LTR), and permissible regulatory changes to safe slope angles for heavy-duty trucks.

1.3. Research Questions

  • How does ESC installation influence the maximum safe slope angle for heavy trucks?
  • Can rollover risks be accurately predicted using machine learning models based on planned path curvature and driving speed?
  • What level of accuracy can be achieved through simulation-based prediction methods, and what are their limitations?

1.4. Hypothesis

Integrating machine-learning-based predictive models with dynamic simulation results can accurately estimate rollover risk under various driving scenarios, supporting optimized safety standards and proactive control strategies for autonomous trucks.

1.5. Novelty of This Study

This study uniquely combined large-scale dynamic stability simulations (based on international test protocols) with machine-learning-based rollover risk prediction. Unlike previous research, it focuses on adjusting regulatory safety margins post-ESC installation, providing a framework for quantitative evaluation of maximum safe slope relaxation. The study also investigates input variable transformation (curvature and lateral acceleration) for improving machine learning model performance.
To address these objectives, this study conducted dynamic simulations across standardized test scenarios (circle, double lane change, slowly increasing steer, J-turn, sine with dwell, and fishhook maneuvers) for five different truck configurations. Furthermore, machine learning models—including multiple linear regression (MLR), random forest, and recurrent neural networks (RNN)—were developed to predict the LTR index based on driving parameters. The comparative performance analysis highlights the effectiveness of RNN models for rollover prediction tasks.

2. Methods

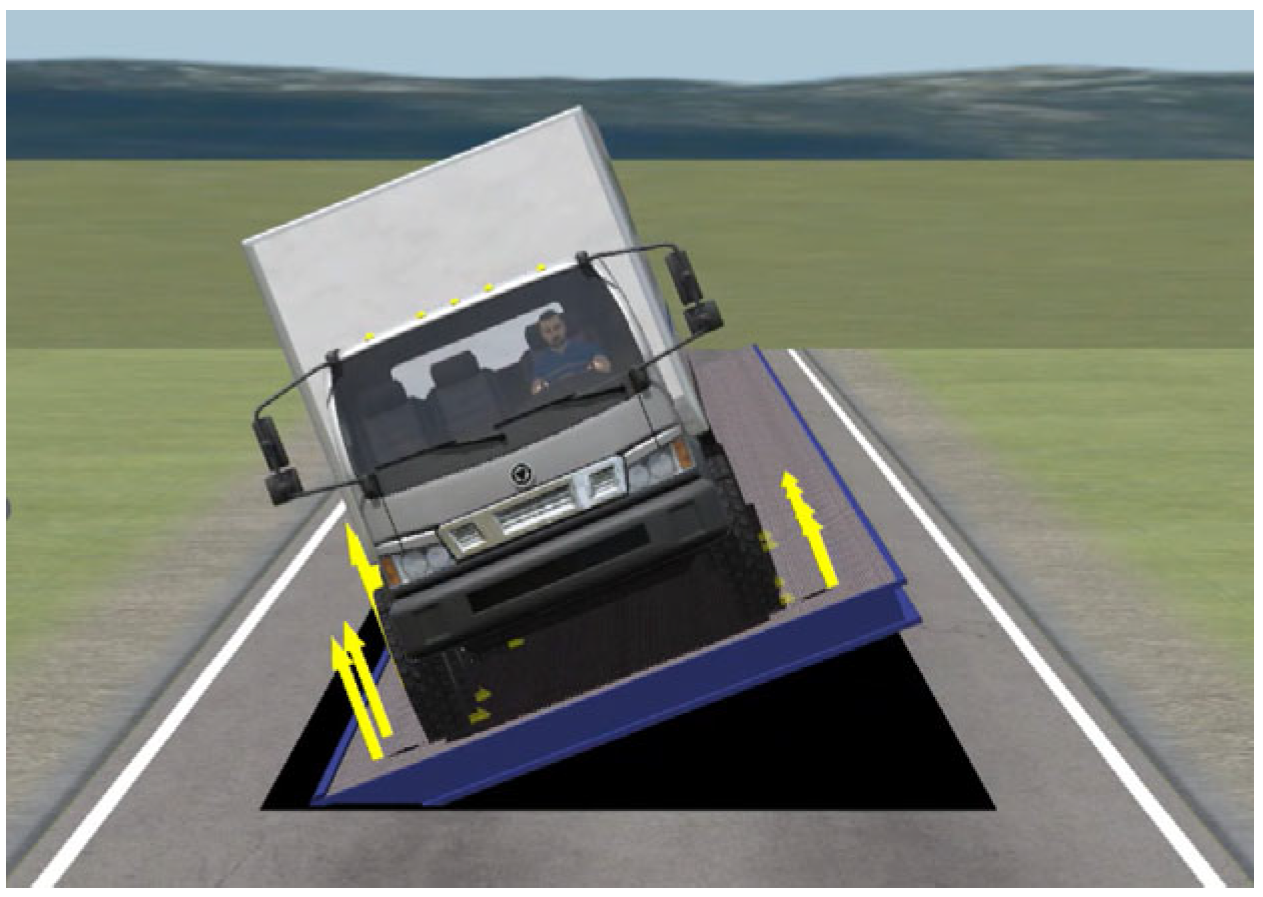
2.1. Maximum Safe Slope Angle Test

To represent diverse commercial freight vehicles, five truck models with varying axle configurations were selected. These are
  • 540S: Five-axle tractor truck;
  • Arocs: Two-axle rigid truck;
  • New Power Truck (NPT): Three-axle dump truck;
  • Prima: Four-axle cargo truck;
  • Xcient: Four-axle cargo truck.
Vehicle specifications were obtained from manufacturer technical datasheets and TruckSim simulation model parameters. Table 1 summarizes the key specifications of the five heavy-duty vehicles selected for the simulation study. The vehicle fleet comprised one 5-axle tractor truck (540S), two 4-axle trucks (Prima and Xcient), one 3-axle dump truck (New Power Truck, NPT), and one 2-axle rigid truck (Arocs), representing a diverse range of axle configurations and structural designs commonly used in commercial freight transport. This diversity was intended to reflect varying stability characteristics across different vehicle types. The center of gravity (CG) height for each vehicle was estimated based on the respective track width and the static stability factor (SSF), applying the relationship defined in Equation (1). This approach allows for a standardized comparison across vehicles while maintaining fidelity to the physical dynamics influencing rollover behavior. To determine the maximum safe slope angle for each vehicle, a tilt table test was conducted using the TruckSim simulation environment.
As illustrated in Figure 1, each virtual vehicle model was positioned on a dynamic tilt platform that incrementally increased in inclination until the onset of rollover was detected. This test method is widely accepted for evaluating a vehicle’s rollover threshold under quasi-static conditions and provides a controlled setting to assess stability margins. The output from these simulations serves as a critical baseline for evaluating the effects of vehicle design and configuration on rollover resistance.
The surface condition was set to a standard road surface, and the platform’s friction coefficient was predefined. The platform width was fixed at 4 m, with the vehicle centrally positioned. The rotation speed of the tilt platform was maintained at 0.1 °/s.

Software and Hardware Setup

  • TruckSim 2021 for vehicle dynamic simulation;
  • MATLAB R2023a with Simulink for data processing;
  • TensorFlow 2.11 for machine learning model training;
  • Hardware: Intel i9-12900K CPU, NVIDIA RTX 3080 GPU, 64GB RAM;
  • Operating System: Windows 11 Pro.

2.2. Test Evaluation Scenarios
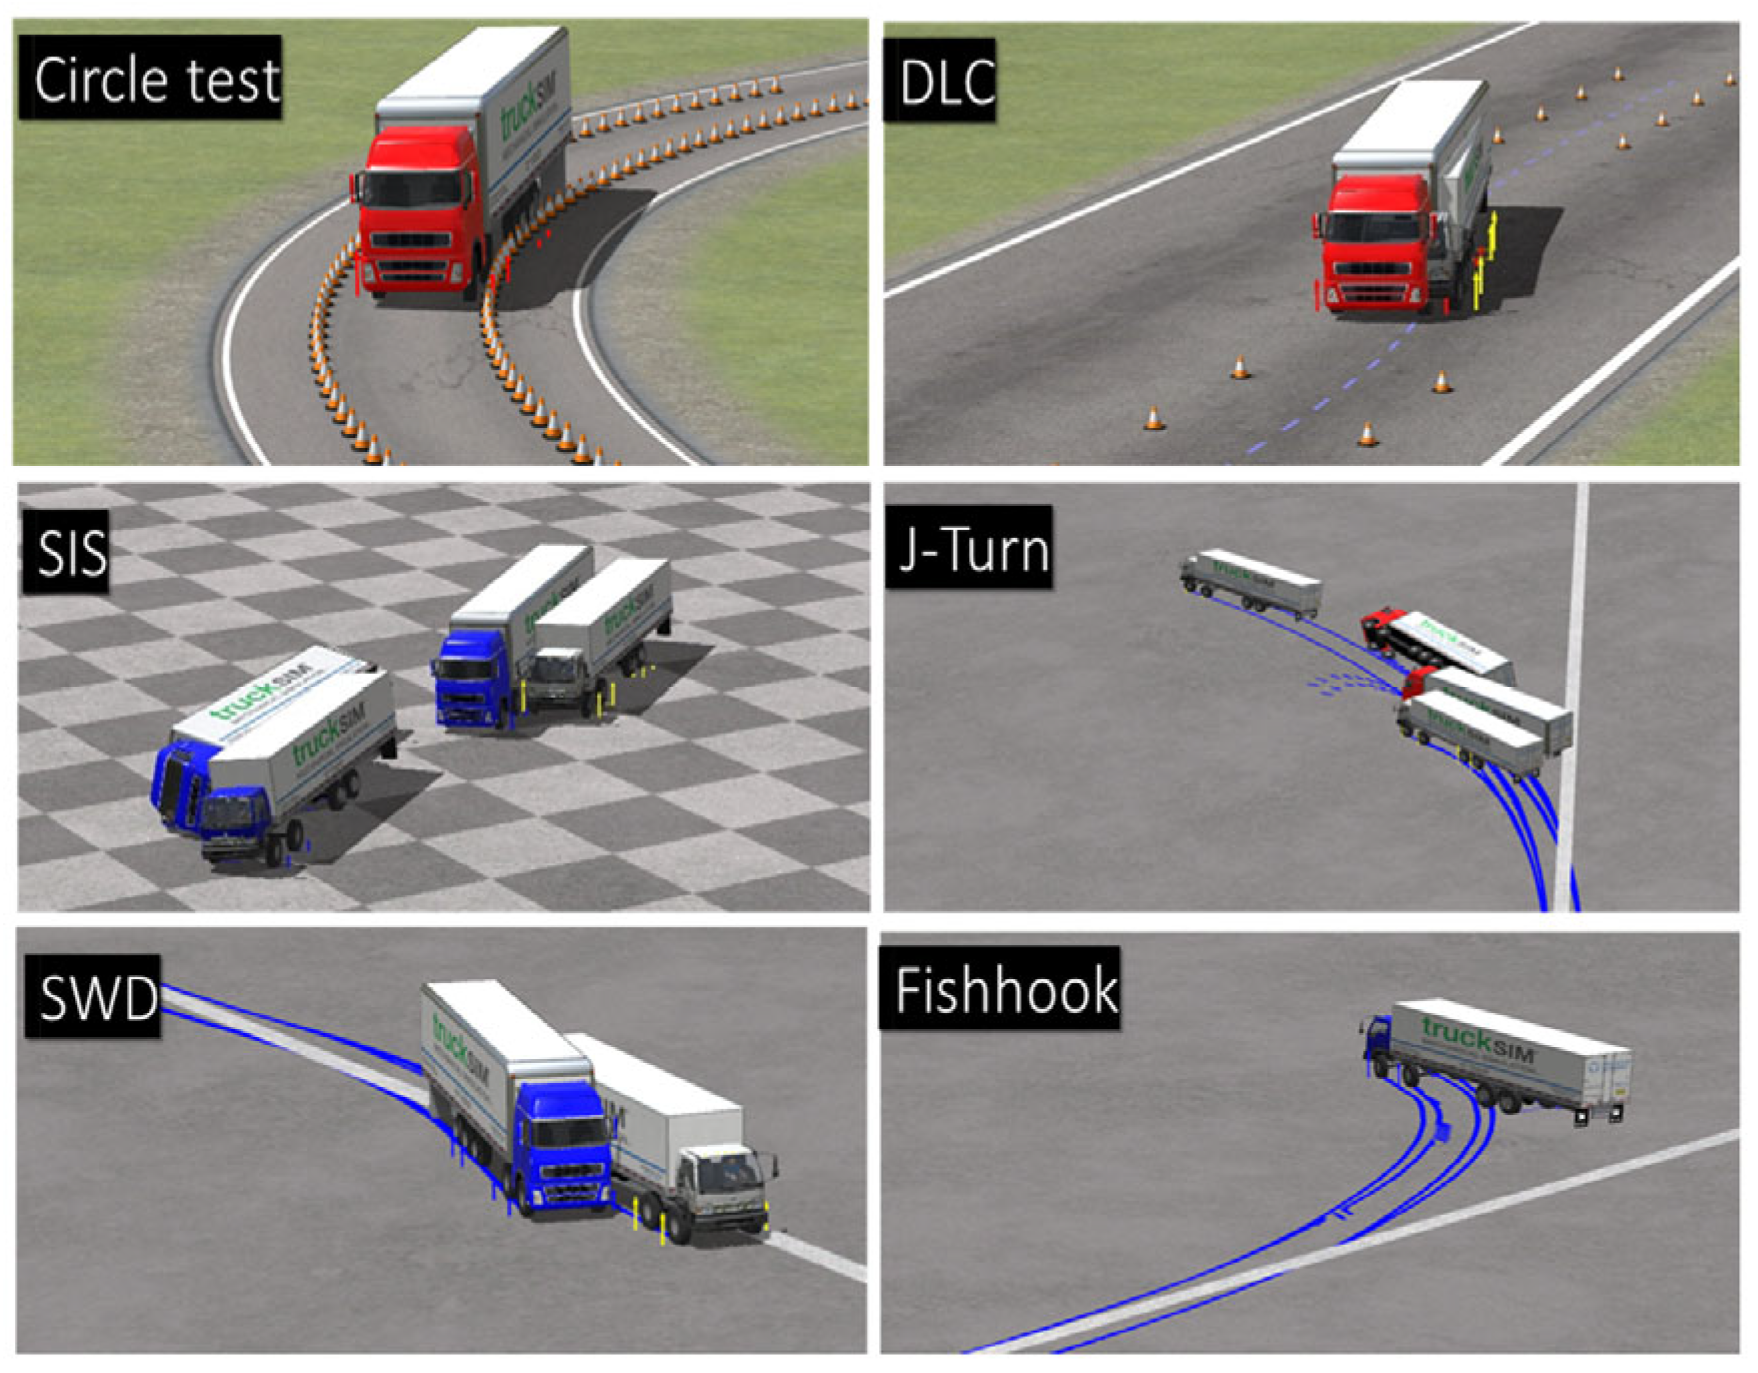
2.2.1. Circle Test

The circle test was conducted based on the National Highway Traffic Safety Administration (NHTSA) guidelines [15]. As shown in Figure 2a, the test was performed on a U-shaped track with a radius of 45.72 m. The vehicle was initially driven at a speed of 32.19 km/h, with the velocity increasing at a rate of 1.61 km/h per second while following a counterclockwise trajectory. The test was terminated when the vehicle exited the track, was unable to maintain speed, or exhibited wheel lift.

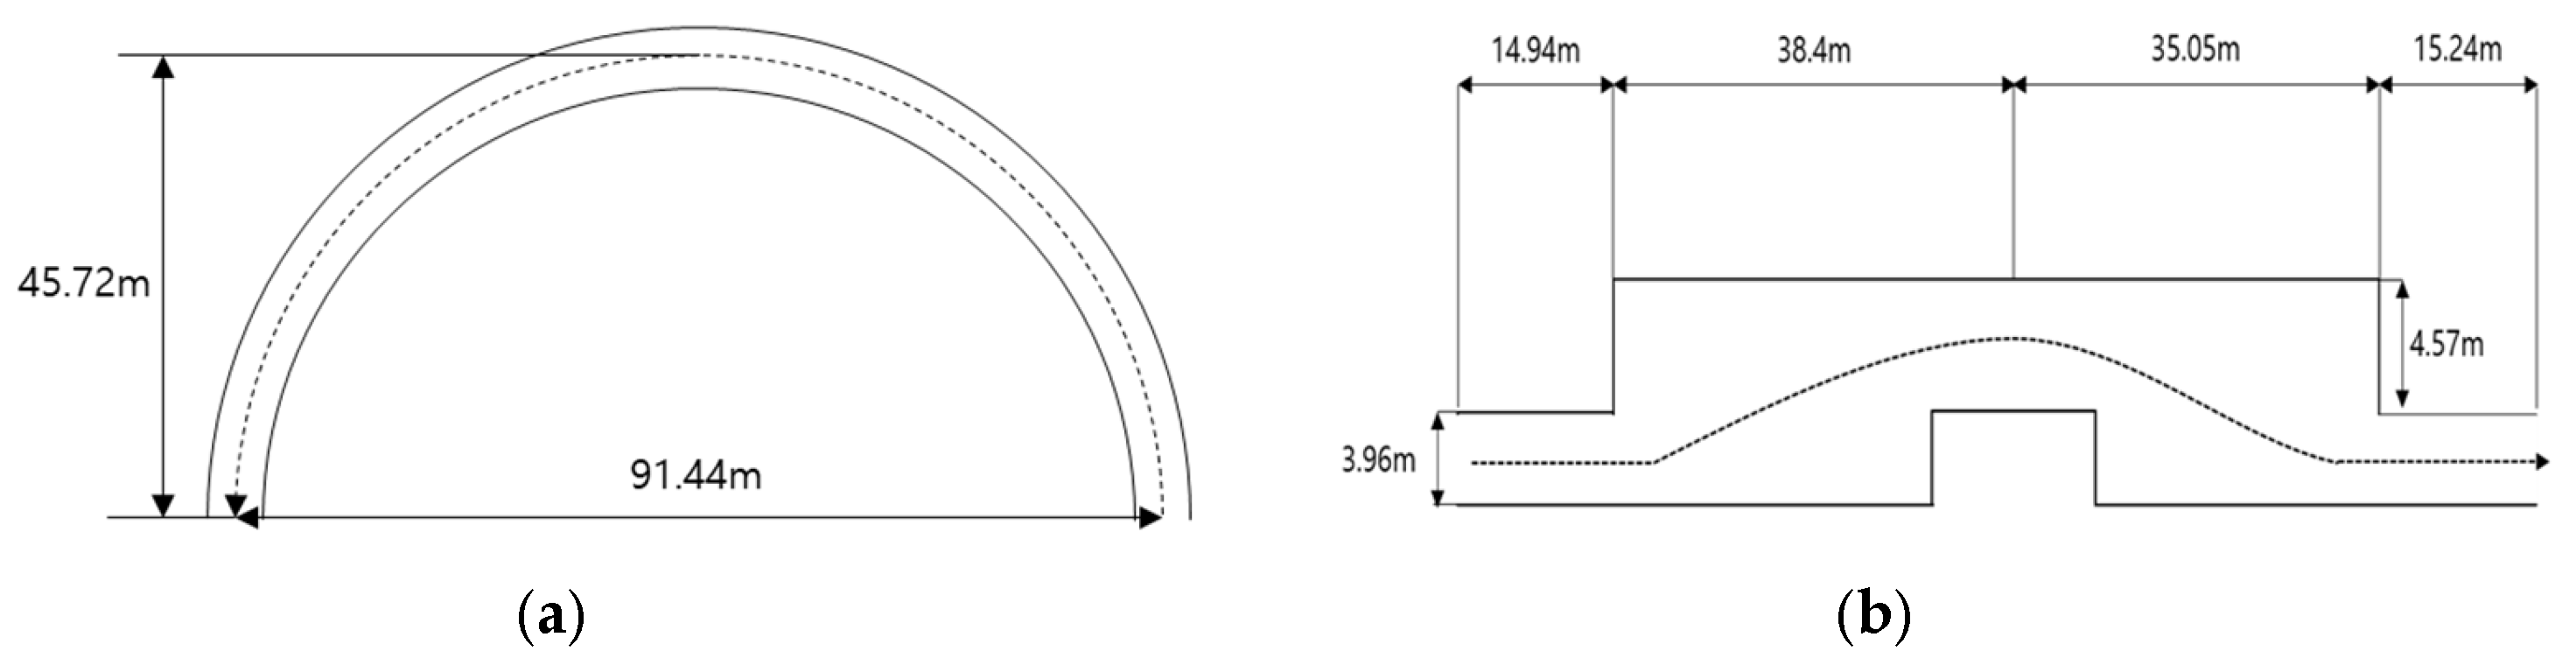
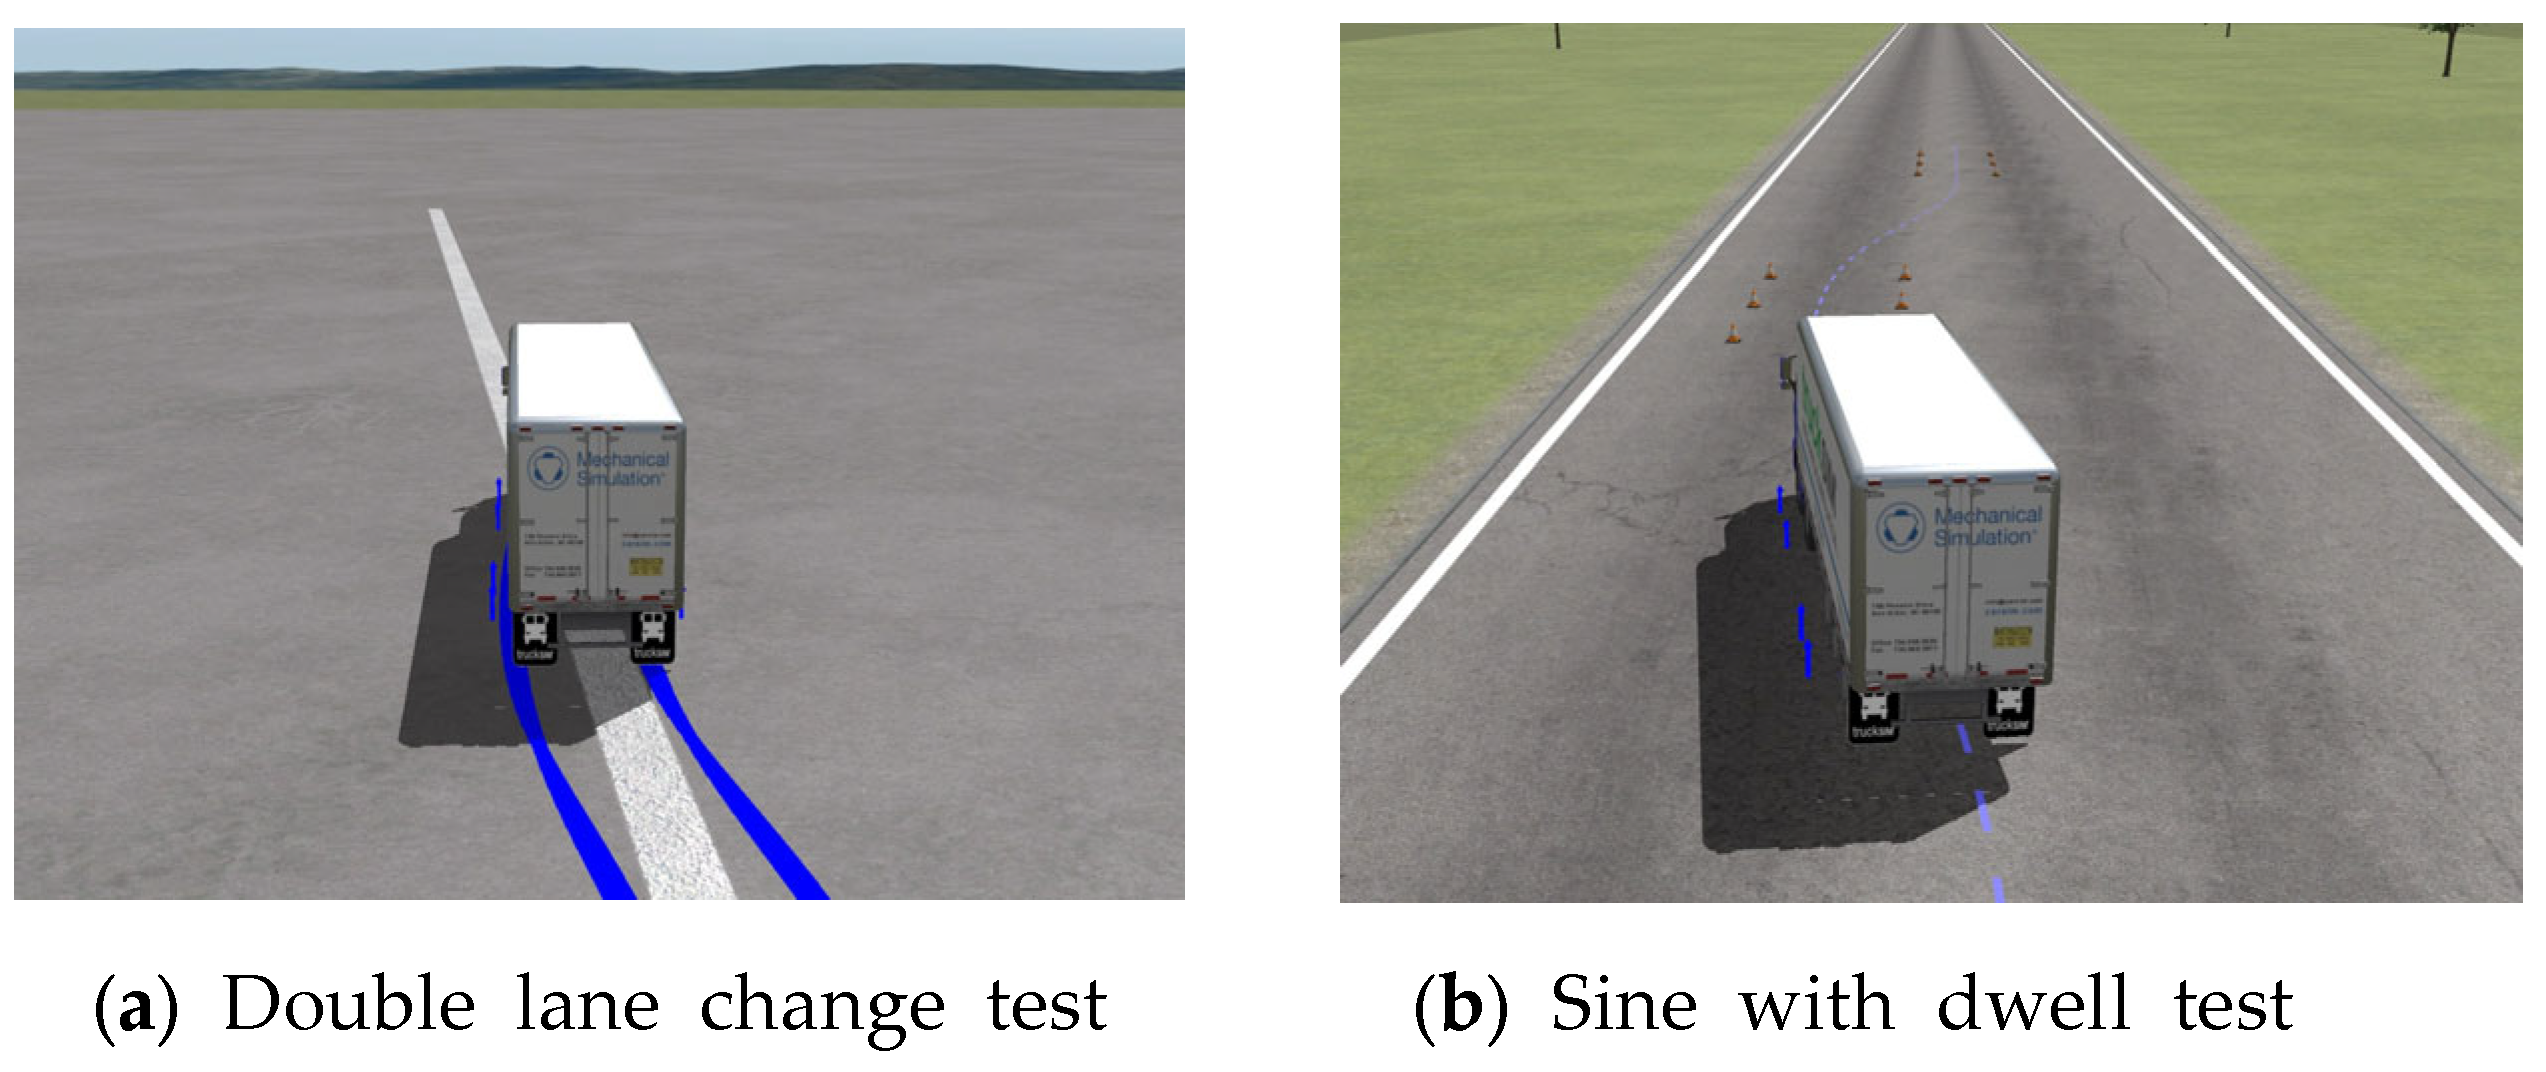
2.2.2. Double Lane Change (DLC)

The DLC test followed the NHTSA procedure [15], in which the vehicle traveled at a constant speed of 80.5 km/h. The vehicle performed a single lane change to the left, immediately followed by a lane change to the right, as illustrated in Figure 2b. The test concluded if wheel lift was observed or the vehicle deviated from the designated track.

2.2.3. Slowly Increasing Steer (SIS)

The SIS test was conducted based on the Society of Automotive Engineers (SAE) test procedure [4]. The vehicle was driven at a speed of 48.3 km/h while the steering angle was increased at a rate of 13.5 deg/s until reaching 270 degrees. Upon reaching this angle, the steering angle was maintained for 2 s before being returned to neutral at a rate of 90 deg/s. The test ended when the maximum steering angle was reached or when wheel lift occurred.

2.2.4. J-Turn

The J-turn test was performed following the NHTSA procedure [15]. The vehicle was driven at a constant speed while the steering input was applied at a rate of 175 deg/s until reaching the reference steering angle obtained from the SIS test. This angle was maintained for 5 s before the steering returned to neutral. The test was conducted with an increasing entry speed until the vehicle reached its stability limit or wheel lift occurred.

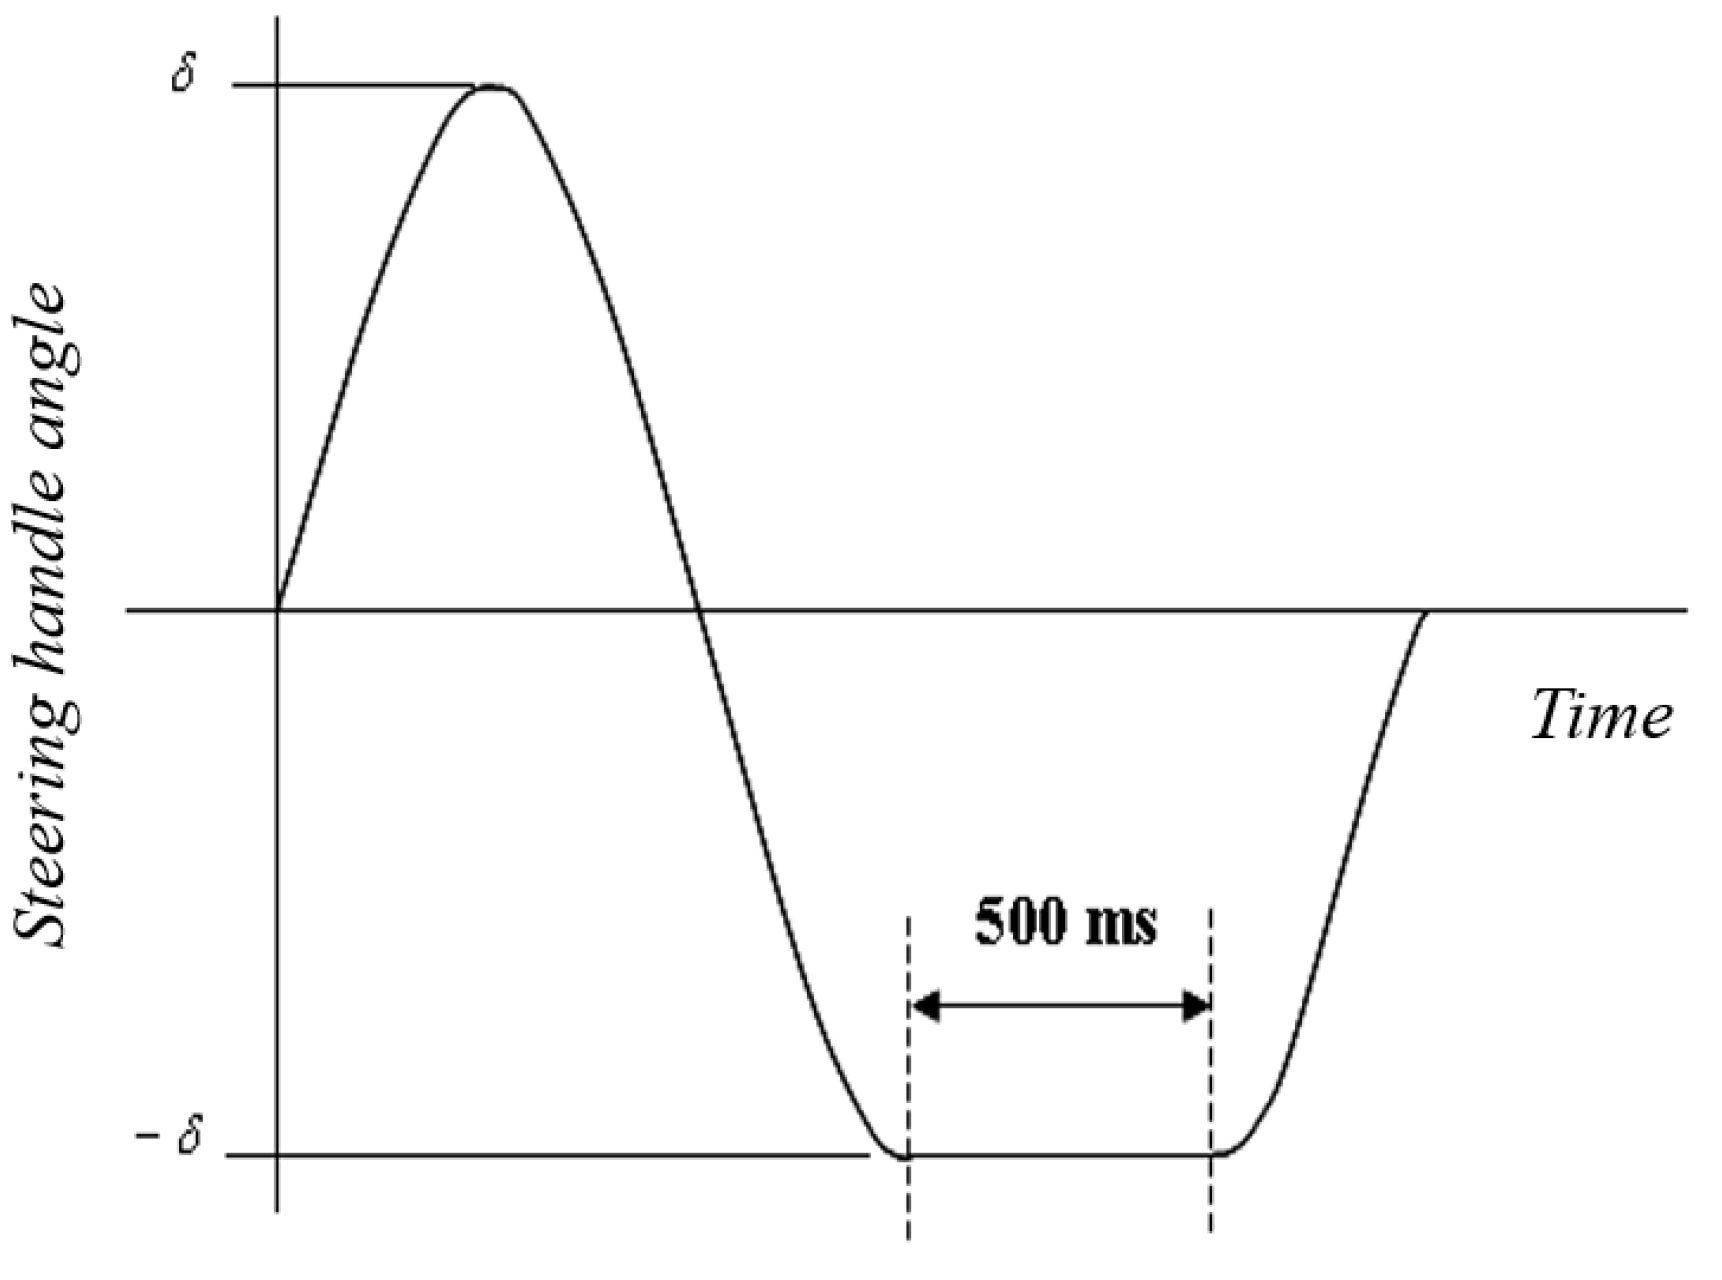
2.2.5. Sine with Dwell (SWD)

The SWD test followed the NHTSA methodology [16], in which the reference steering angle obtained from the SIS test was applied in a sinusoidal manner at 0.5 Hz. In the third quarter of the sinusoidal cycle, the steering angle was held constant for 1 s. The applied steering angle was set to 1.3 times the reference steering angle. After the steering ceased, lateral acceleration and yaw rate were measured at 0.75 s and 1.5 s to calculate the lateral acceleration ratio and yaw rate ratio.

2.2.6. Fishhook

The fishhook test was based on the SAE procedure [4], designed to replicate a vehicle maneuver attempting to re-enter a lane after an unintended departure. The steering input was applied at a rate of 720 deg/s up to 6.5 times the reference steering angle obtained from the SIS test. This maximum steering angle was maintained for 0.25 s before reversing at the same rate in the opposite direction. The test concluded after maintaining the counter-steering input for 3 s.

2.2.7. Simulation Conditions

To analyze the rollover stability of trucks concerning the maximum safe slope angle, we defined the simulation parameters as presented in Table 2. The test variables included vehicle type, static stability factor (SSF), test evaluation methods, and the presence of electronic stability control (ESC). Additionally, other factors such as vehicle weight, wheelbase length, number of axles, and suspension characteristics were considered to evaluate their influence on rollover stability. Five different truck models, as described in Table 1, were utilized for the simulation. To ensure a comprehensive assessment, the test scenarios were selected from established regulatory methods commonly used for rollover safety and ESC performance evaluations.

2.2.8. Methodological Contribution

Unlike previous studies [15,16] focusing solely on immediate rollover detection, this study extended the analysis by systematically comparing lateral load transfer ratio (LTR) variations across standardized SSF adjustments and ESC conditions. Furthermore, it integrated machine-learning-based risk prediction to support real-time operational control for autonomous trucks, bridging simulation results with practical deployment.

2.3. Machine-Learning-Based Driving Simulation Scenarios

To evaluate the rollover stability of heavy trucks, we compared three machine learning models in two driving scenarios. This study employed TruckSim and MATLAB Simulink to collect driving data for heavy trucks. The vehicle model used for data acquisition was based on a five-axle truck with the following specifications: overall length of 12,990 mm, overall height of 3995 mm, overall width of 2495 mm, vehicle weight of 12,800 kg, and a center of gravity height of 1000 mm. The vertical load data were extracted from the left and right tires of each axle, while a sensor model was placed at the vehicle’s center of gravity to record the vehicle’s trajectory coordinates. The driving scenarios were designed based on the double lane change (DLC) and sine with dwell (SWD) test methods.
Figure 3 illustrates the simulation performed in TruckSim following the DLC and SWD scenarios. The DLC scenario was implemented according to the ISO-3888-1 standard [17], using a test track similar to Figure 4.
To compare rollover stability at different speeds, three velocity settings were used: a fixed speed of 40 km/h, a variable speed between 50 and 70 km/h, and a high-speed condition of 80.5 km/h. The SWD scenario was based on the “0.7 Hz Sine Steering Test with Dwell” method from the automotive stability control system test regulations [18]. The reference steering angle was obtained from the slowly increasing steer (SIS) test, and the input steering model was constructed as shown in Figure 5 by applying 1.5 times the reference steering angle in a 0.7 Hz sine wave pattern. The driving speed for this test followed the regulation standard of 80 ± 2 km/h, with the same three-speed conditions as the DLC test.

2.3.1. Machine Learning Dataset Generation

Data were collected by simulating DLC and SWD scenarios using TruckSim. Three speed conditions were tested:
  • Low-speed: 40 km/h;
  • Medium-speed: 50–70 km/h (variable);
  • High-speed: 80.5 km/h.
To use road curvature and lateral acceleration as independent variables, the simulation data included vehicle speed and trajectory coordinates. The road curvature k was calculated as follows [10]:
k = x ˙ t u ¨ t x ¨ ( t ) u ˙ ( t ) x ˙ ( t ) 2 + y ˙ ( t ) 2 3 / 2
where x and y are the longitudinal and lateral coordinates (m), and t is the time (s).
Using the computed curvature and vehicle speed data, the lateral acceleration was determined as follows [10]:
a y = k V x
where k is the road curvature and V is the longitudinal speed (m/s). All input features were normalized using Min-Max scaling before model training.
The lateral load transfer ratio (LTR) was selected as the dependent variable. The LTR index, representing the ratio of the vertical loads acting on the left and right sides of the vehicle, was computed using the vertical load values from each tire [14]:
L T R = F L F R F L + F R
where FL is the vertical load on the left tire (N) and FR is the vertical load on the right tire (N).

2.3.2. Machine Learning Model Development

Three machine learning models—multiple linear regression (MLR), random forest, and recurrent neural network (RNN)—were compared in terms of prediction accuracy. The RNN model was ultimately selected for predicting the LTR index due to its superior performance. The RNN structure, designed for processing sequential data, considers both current and past inputs, making it well-suited for time-series prediction [19]. The RNN model parameters were set as listed in Table 3, and the dataset used for training was categorized by test models as shown in Table 4.
The RNN model used in this study consisted of an input layer, an LSTM layer, a dropout layer, and an output layer. Below is the RNN model architecture:
  • Input: curvature and lateral acceleration;
  • Sequence input layer (10 time steps);
  • LSTM layer with 50 units;
  • Dropout layer (dropout rate = 0.2);
  • Fully connected output layer;
  • Optimizer: Adam;
  • Loss Function: mean squared error (MSE);
  • Epochs: 50;
  • Batch Size: 32;
  • Training-validation-testing split: 70%-15%-15%.
Hyperparameters were tuned manually through iterative trials. Other sequence models (e.g., GRU, LSTM-Stacked) were tested but underperformed compared to RNN under identical conditions. For the reproducibility, each simulation scenario was repeated three times with different random seeds to ensure stability of results.
Two different input layer configurations were tested: one using road curvature and driving speed, and another using road curvature and lateral acceleration. The time step length for training was set to 10. The LSTM layer had 50 units, and a dropout rate of 0.2 was applied, as determined empirically for optimal prediction accuracy. The output layer was configured to predict a single LTR value.
The machine learning process involved using road curvature and lateral acceleration as independent variables and LTR as the dependent variable. Each simulation dataset was split into 70% for training and 30% for prediction. Model performance was evaluated by computing the mean squared error (MSE). The prediction tasks included six datasets—three variations of DLC tests at different speeds and three variations of SWD tests—each trained and tested separately.

3. Results

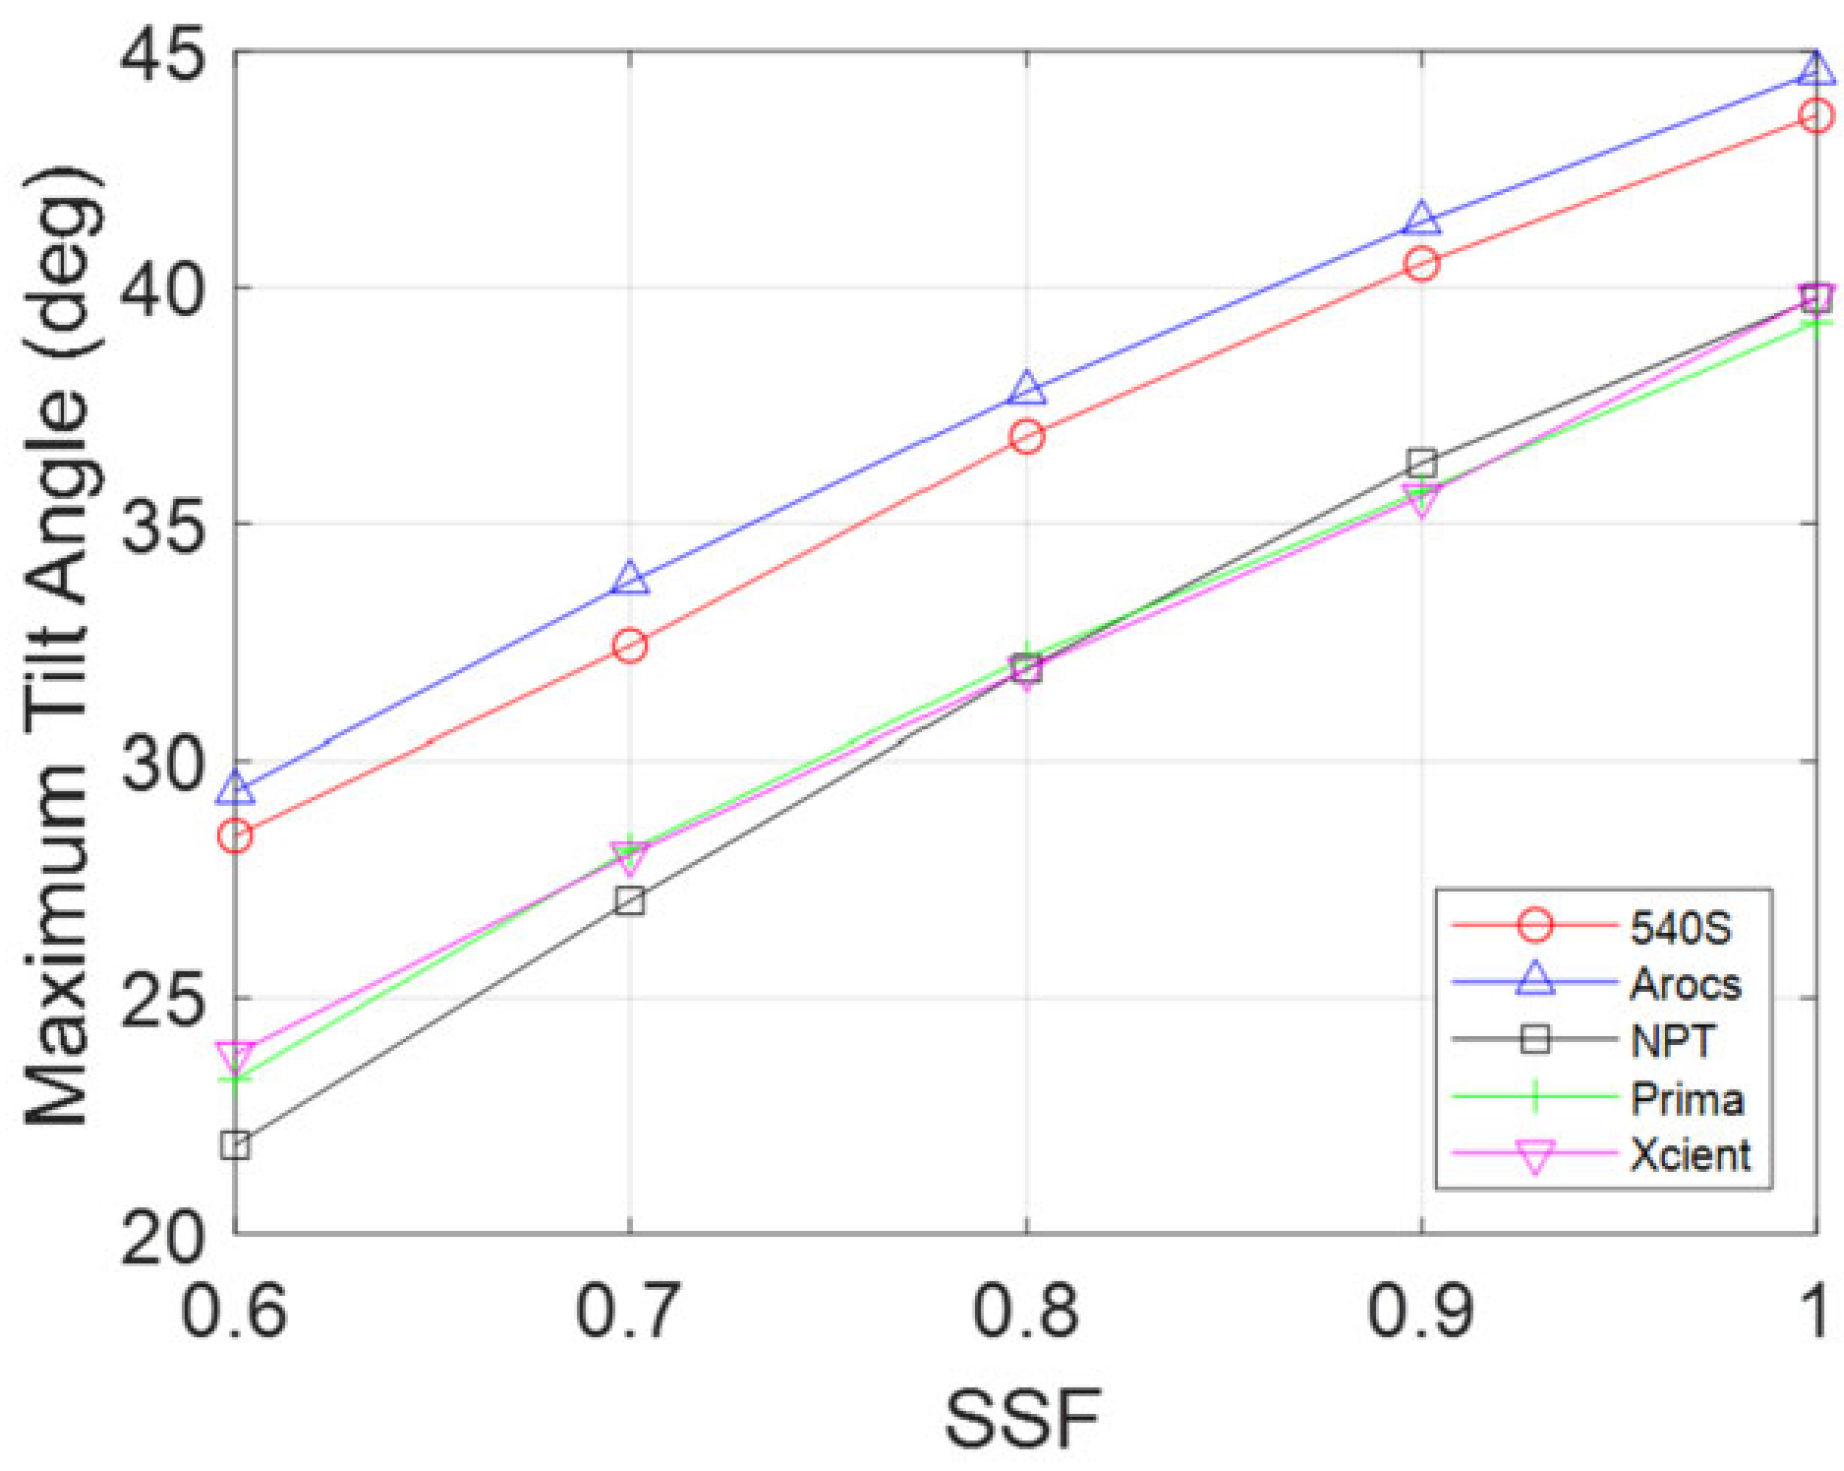
3.1. Relationship Between Maximum Safe Tilt Angle and SSF

Figure 6 illustrates the relationship between Equation (1)’s static stability factor (SSF) and the maximum safe tilt angle. The simulation data indicate that the four-axle truck models, Prima and Xcient, exhibited similar tilt angles due to their comparable specifications. Although the New Power Truck had a lower curb weight than Prima and Xcient, it also had fewer axles, resulting in a maximum safe tilt angle similar to that of the two models.
The five-axle truck model, 540S, had a lower curb weight than Prima and Xcient, but the additional axle count enhanced roll stability, resulting in a higher maximum safe tilt angle. The two-axle truck model, Arocs, had fewer axles than the other models but demonstrated high rollover stability due to its curb weight being over 30% lower than the other trucks.

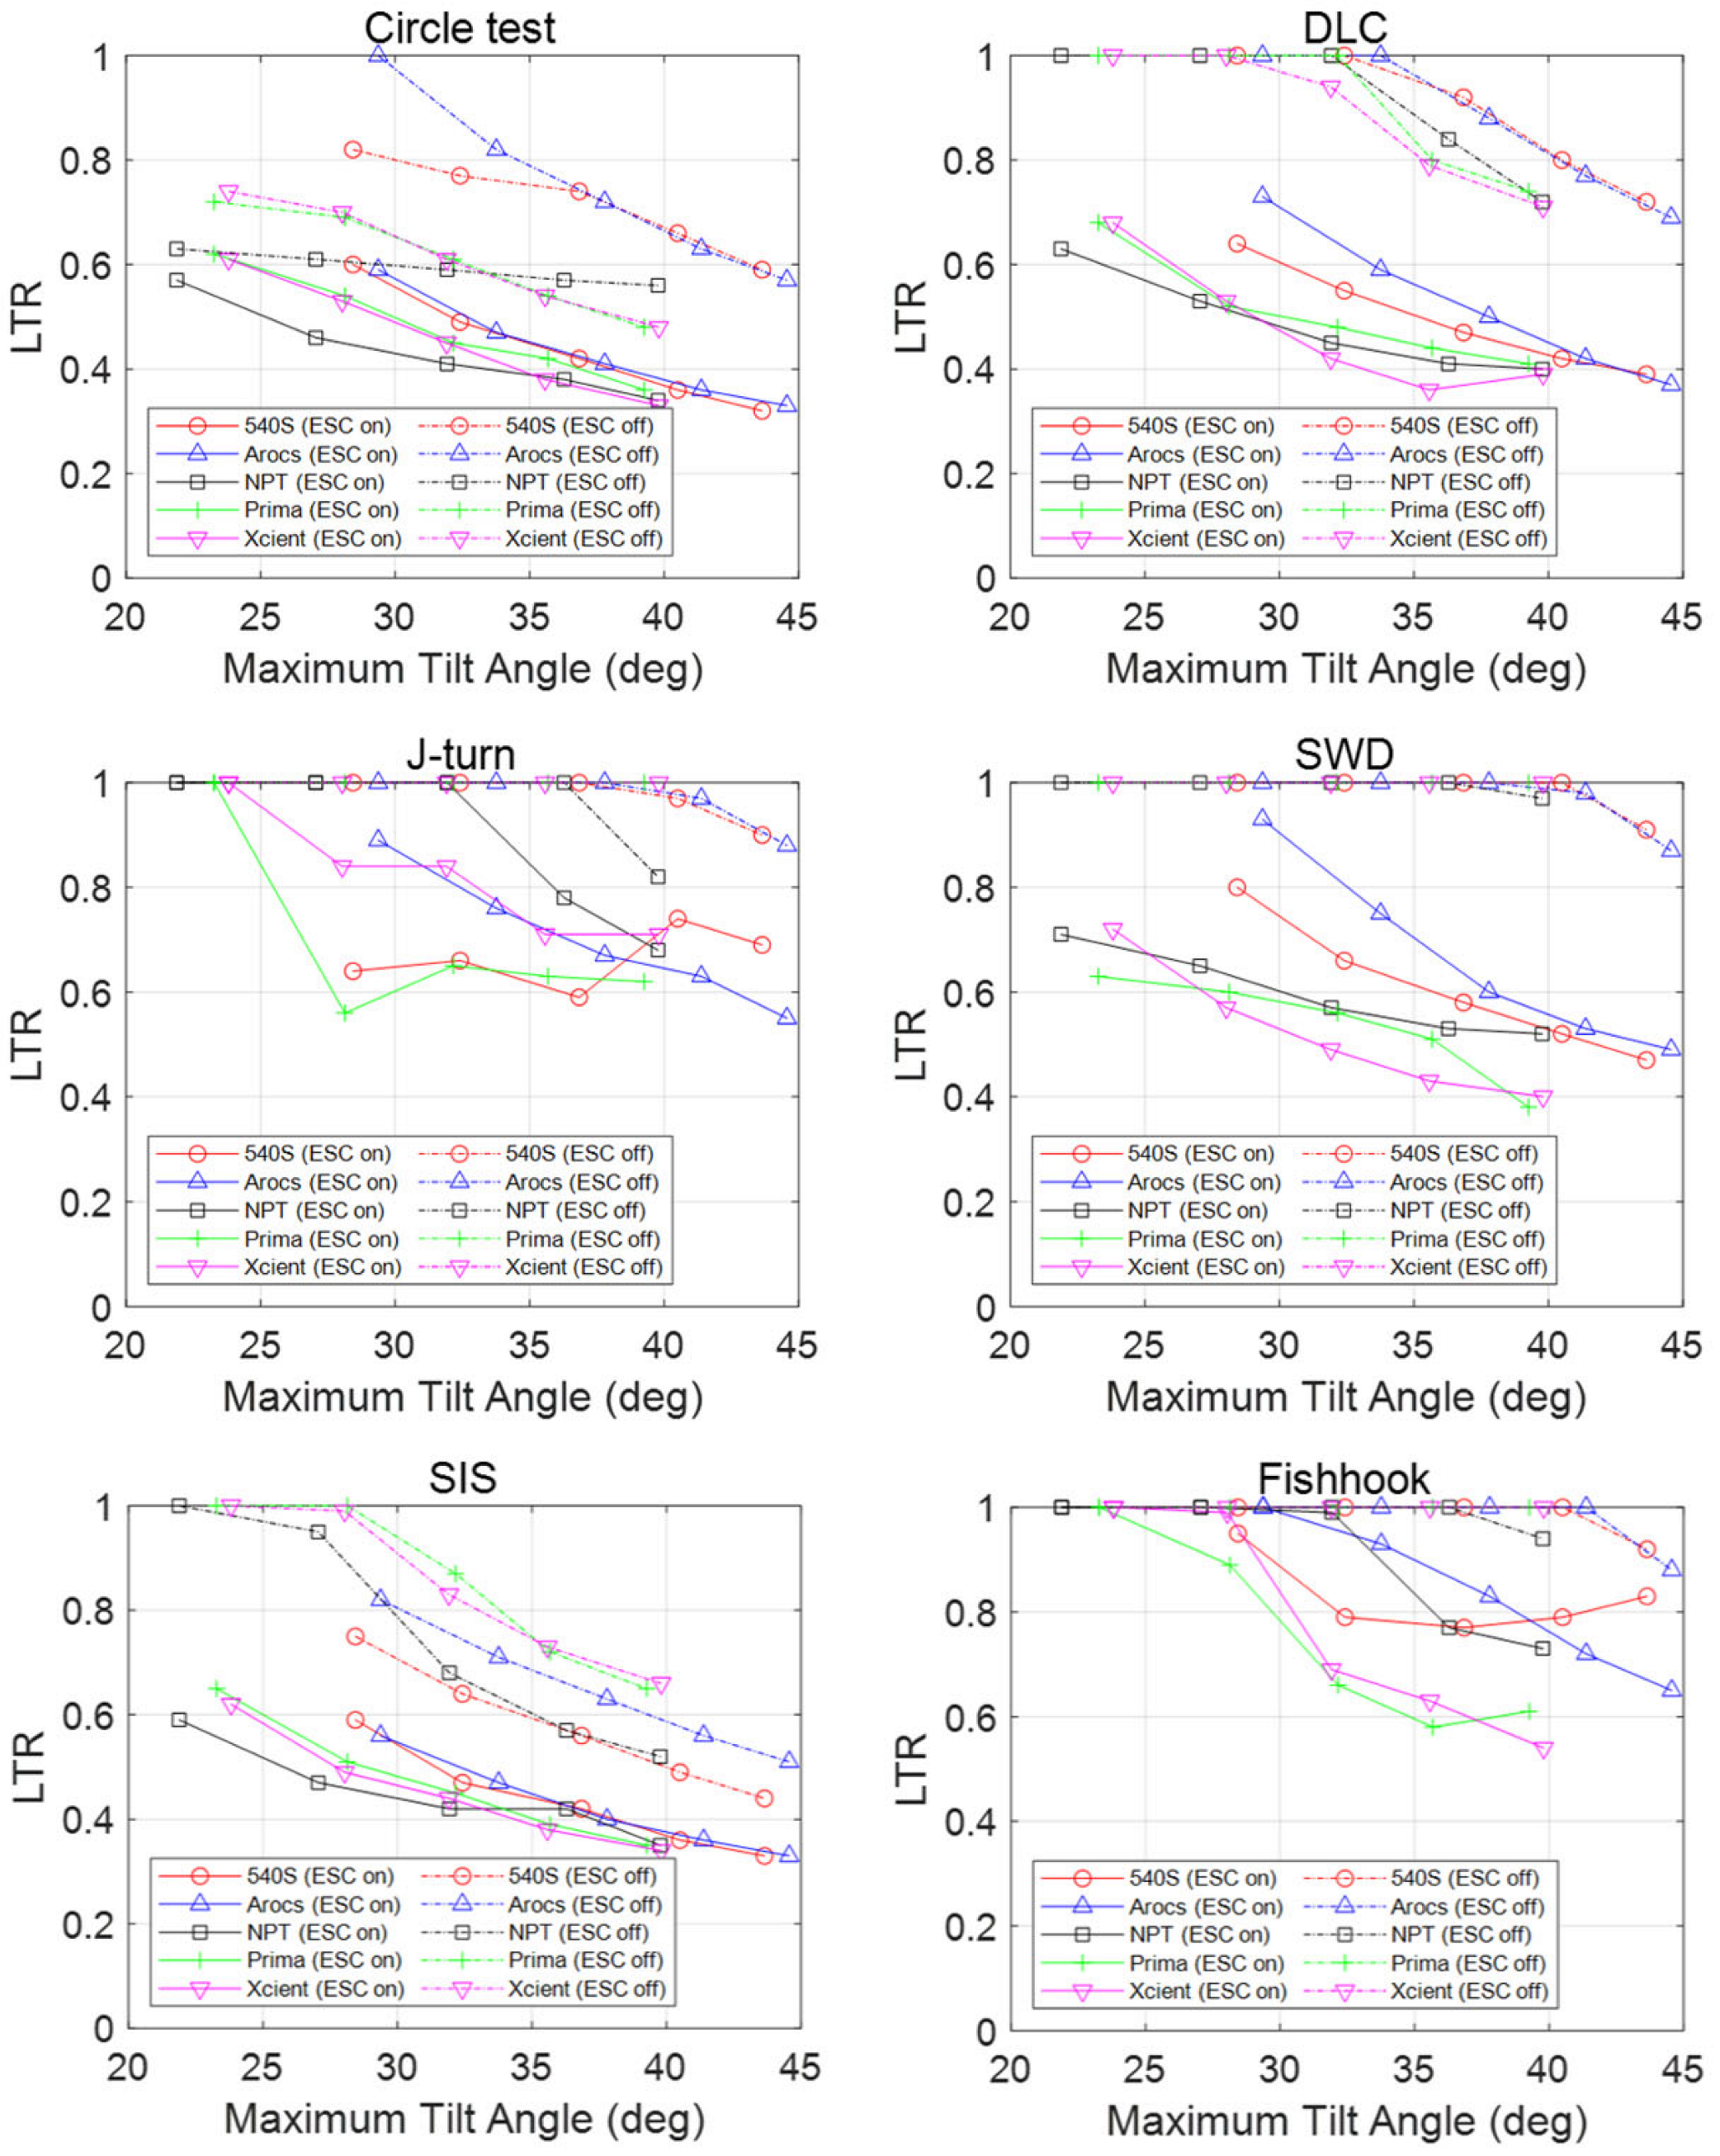
3.2. Dynamic Stability Test Results for Heavy Trucks

Figure 7 presents six driving test scenarios simulated using TruckSim. The simulations were conducted on five truck models, each tested at five different SSF values, and the presence or absence of an electronic stability control (ESC) system was also considered.
Figure 8 shows the relationship between the maximum safe tilt angle and the peak LTR of Equation (4) for each truck model.
  • Circle test: In the circle test, all vehicles except for the ESC-disabled Arocs successfully maintained stability without rolling over, although some models came close to rolling but recovered their posture. The effect of ESC installation was observed in the maximum LTR difference, ranging from 0.06 to 0.35.
  • DLC (double lane change) test: In the DLC test, all ESC-disabled vehicles exceeded a maximum safe tilt angle of 30–33°, leading to rollovers in all cases. However, with ESC enabled, no vehicles rolled over. The ESC system reduced the peak LTR from Equation (4) by 0.32–0.52. Compared to the circle test, even vehicles with high stability exhibited more significant differences depending on the presence of ESC, while vehicles with lower stability showed even greater improvements with ESC activation.
  • SIS (slowly increasing steer) test: Similar to the previous tests, the SIS test showed that higher maximum safe tilt angles corresponded to lower peak LTR values. Like the DLC test, ESC-disabled models with lower maximum safe tilt angles either rolled over or experienced significant wheel lift, even if a full rollover did not occur. However, fewer vehicles rolled over in the SIS test compared to the DLC test, and the average LTR values were generally lower. The ESC system reduced the maximum LTR by 0.11–0.52.
  • J-turn test: In the J-turn test, most ESC-disabled models rolled over, with only a few high-tilt-angle models maintaining stability. Even among ESC-enabled models, some lower-stability vehicles still experienced rollovers. Additionally, certain high-SSF models exhibited higher maximum LTR values due to differences in ESC activation timing based on vehicle stability characteristics.
  • SWD (sine with dwell) test: In the SWD test, most ESC-disabled models rolled over. Among the five models that did not roll over, some exhibited wheel lift in certain tests, and three models recorded LTR values above 0.87. In contrast, all ESC-enabled models successfully avoided rollovers, and vehicles with higher maximum safe tilt angles exhibited increased stability.
  • Fishhook test: The fishhook test results were similar to the SWD test, where most ESC-disabled models experienced rollovers. Among the five models that did not roll over, some experienced wheel lift, and two models recorded LTR values above 0.88. In ESC-enabled models, vehicles with a maximum safe tilt angle exceeding 30° generally did not roll over. However, their peak LTR values were mostly above 0.6, indicating lower stability compared to other test scenarios.

3.3. Machine Learning Results for Rollover Prediction

The RNN model was trained using driving data obtained from TruckSim and MATLAB Simulink, with curvature and speed as input variables. The model output consisted of 12 predicted LTR values. Figure 9, Figure 10 and Figure 11 compare the predicted LTR values against actual data for DLC simulations conducted at speeds of 40 km/h, 80.5 km/h, and 50–70 km/h, using both curvature-speed and curvature-lateral acceleration as input variables. Similarly, Figure 12, Figure 13 and Figure 14 depict the results of the SWD simulation models following the same methodology. Here, Vx denotes the vehicle’s driving speed, and ay represents the lateral acceleration acting on the vehicle.

4. Discussion and Limitations

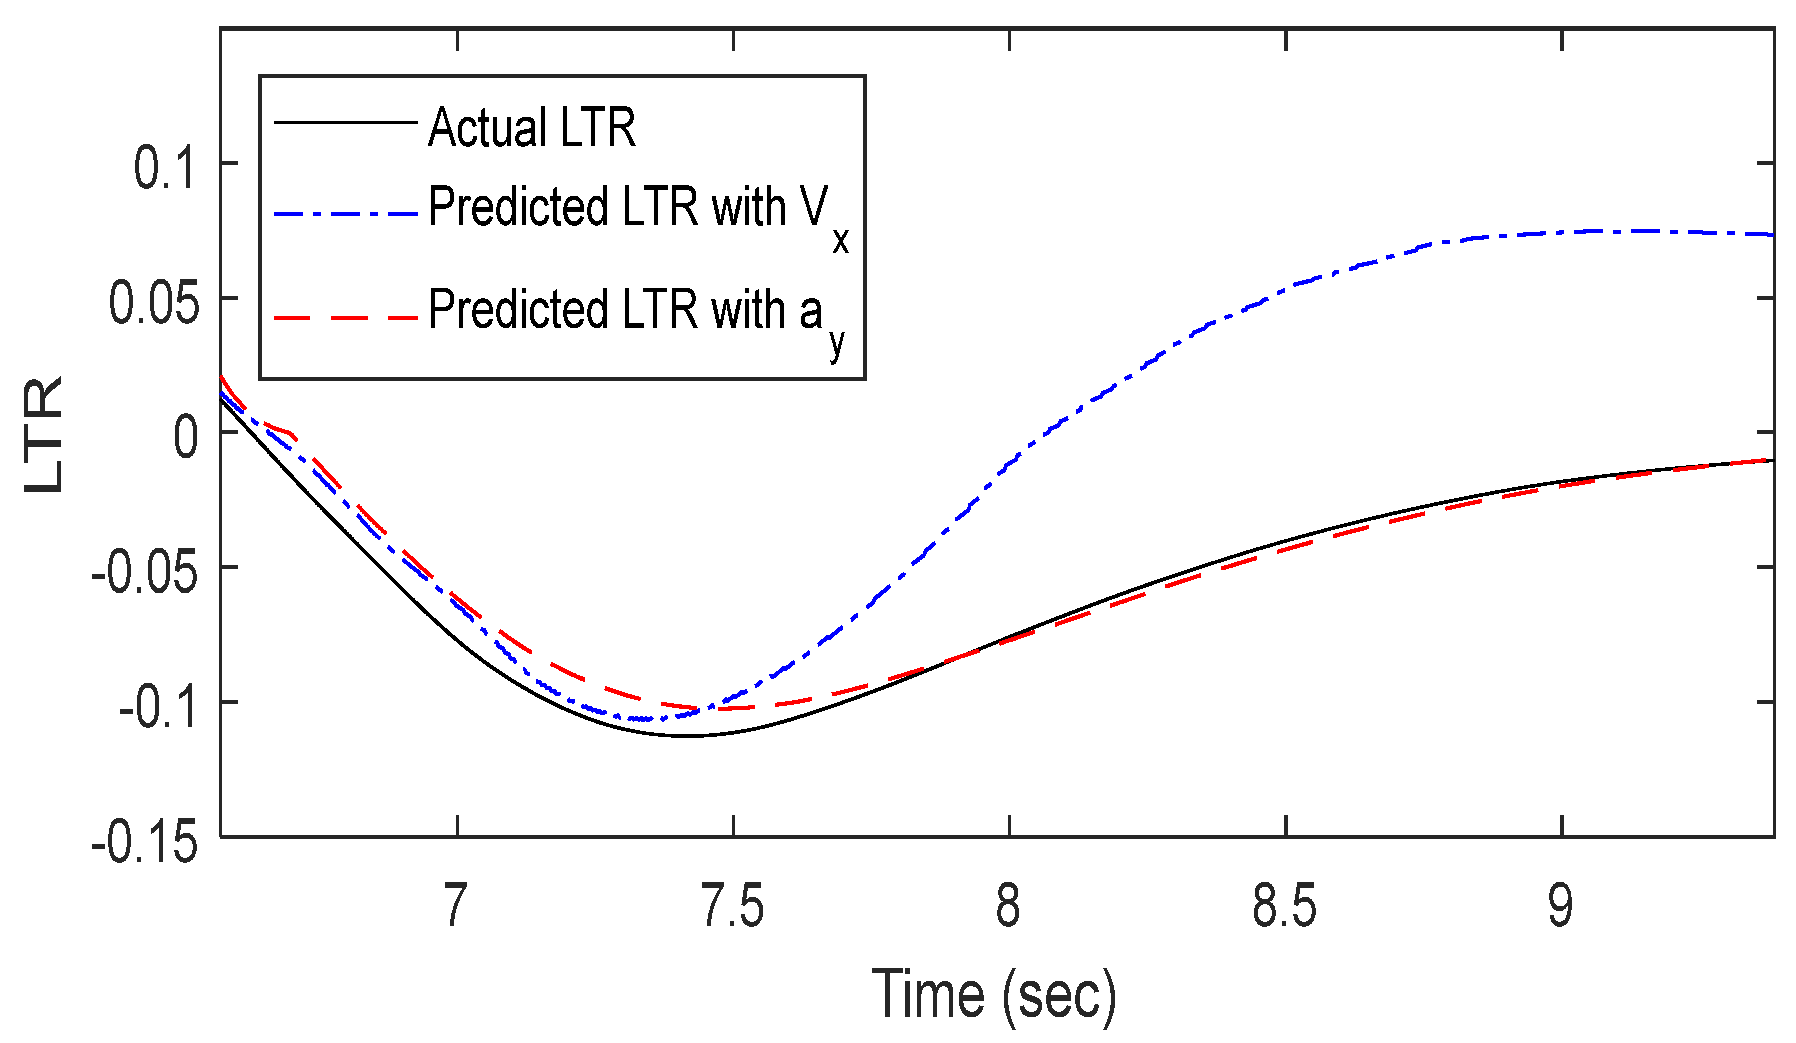
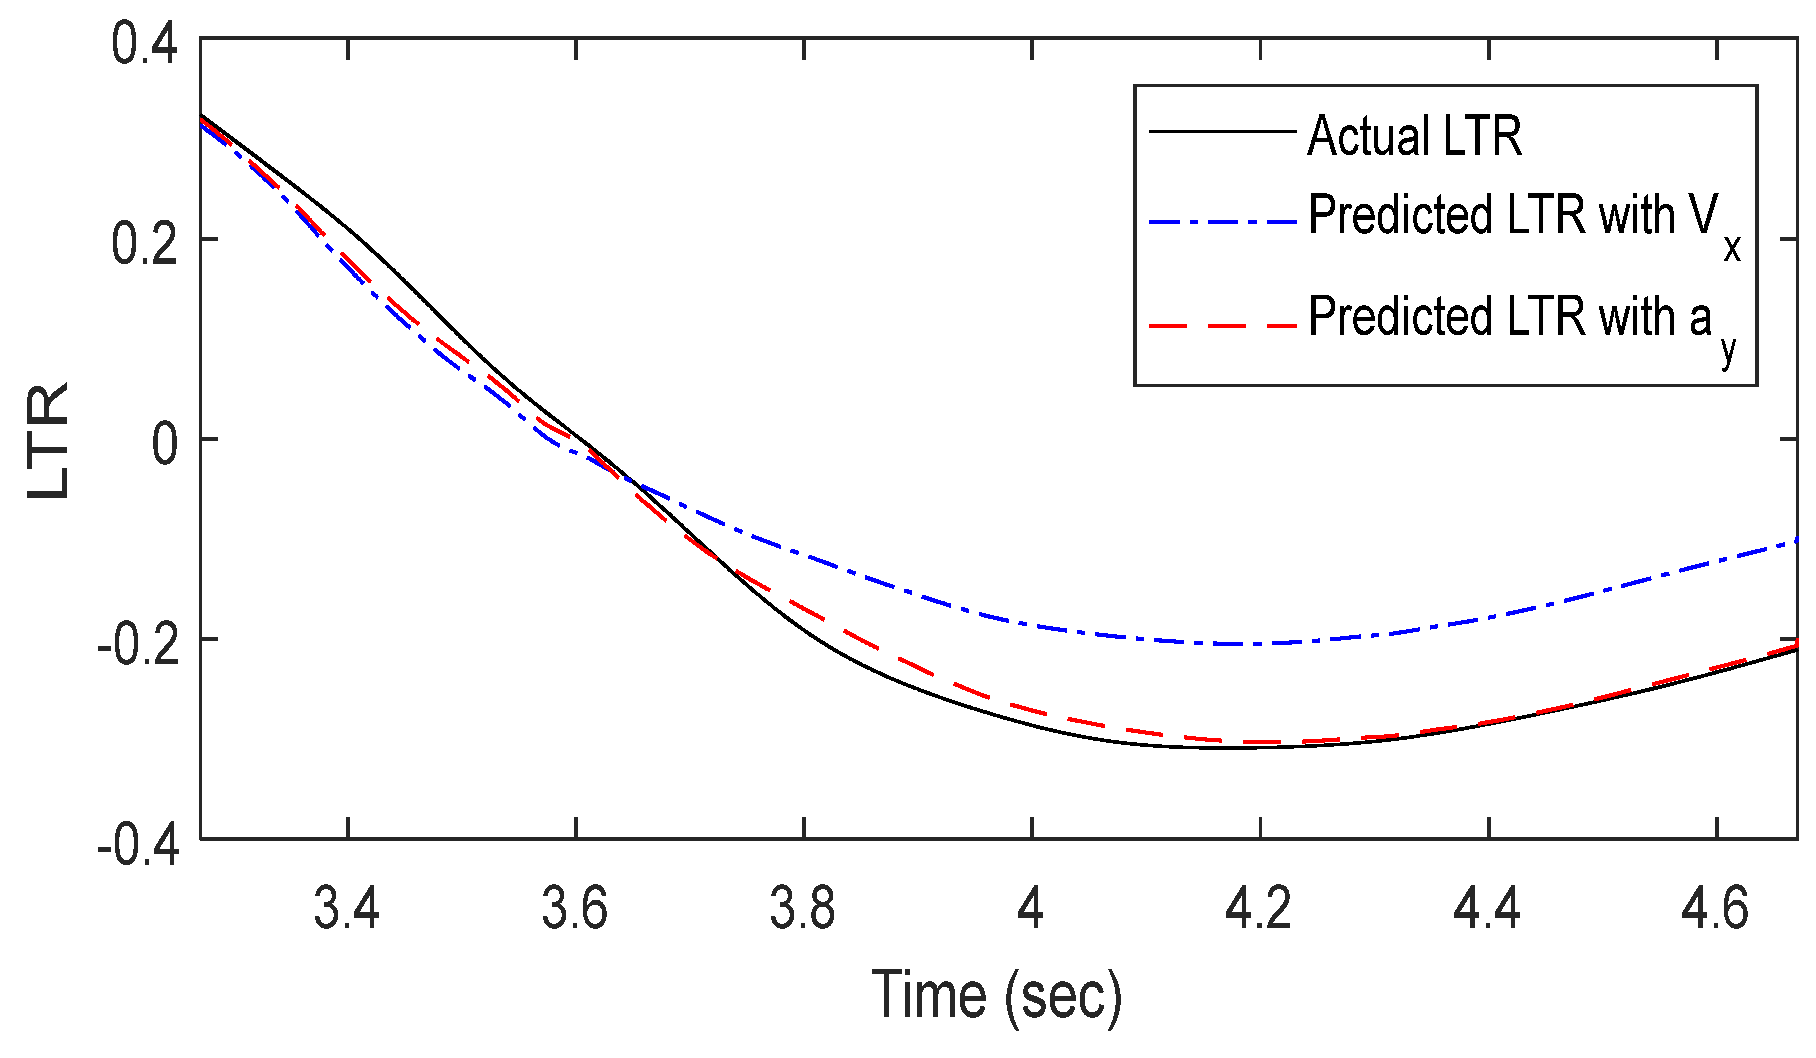
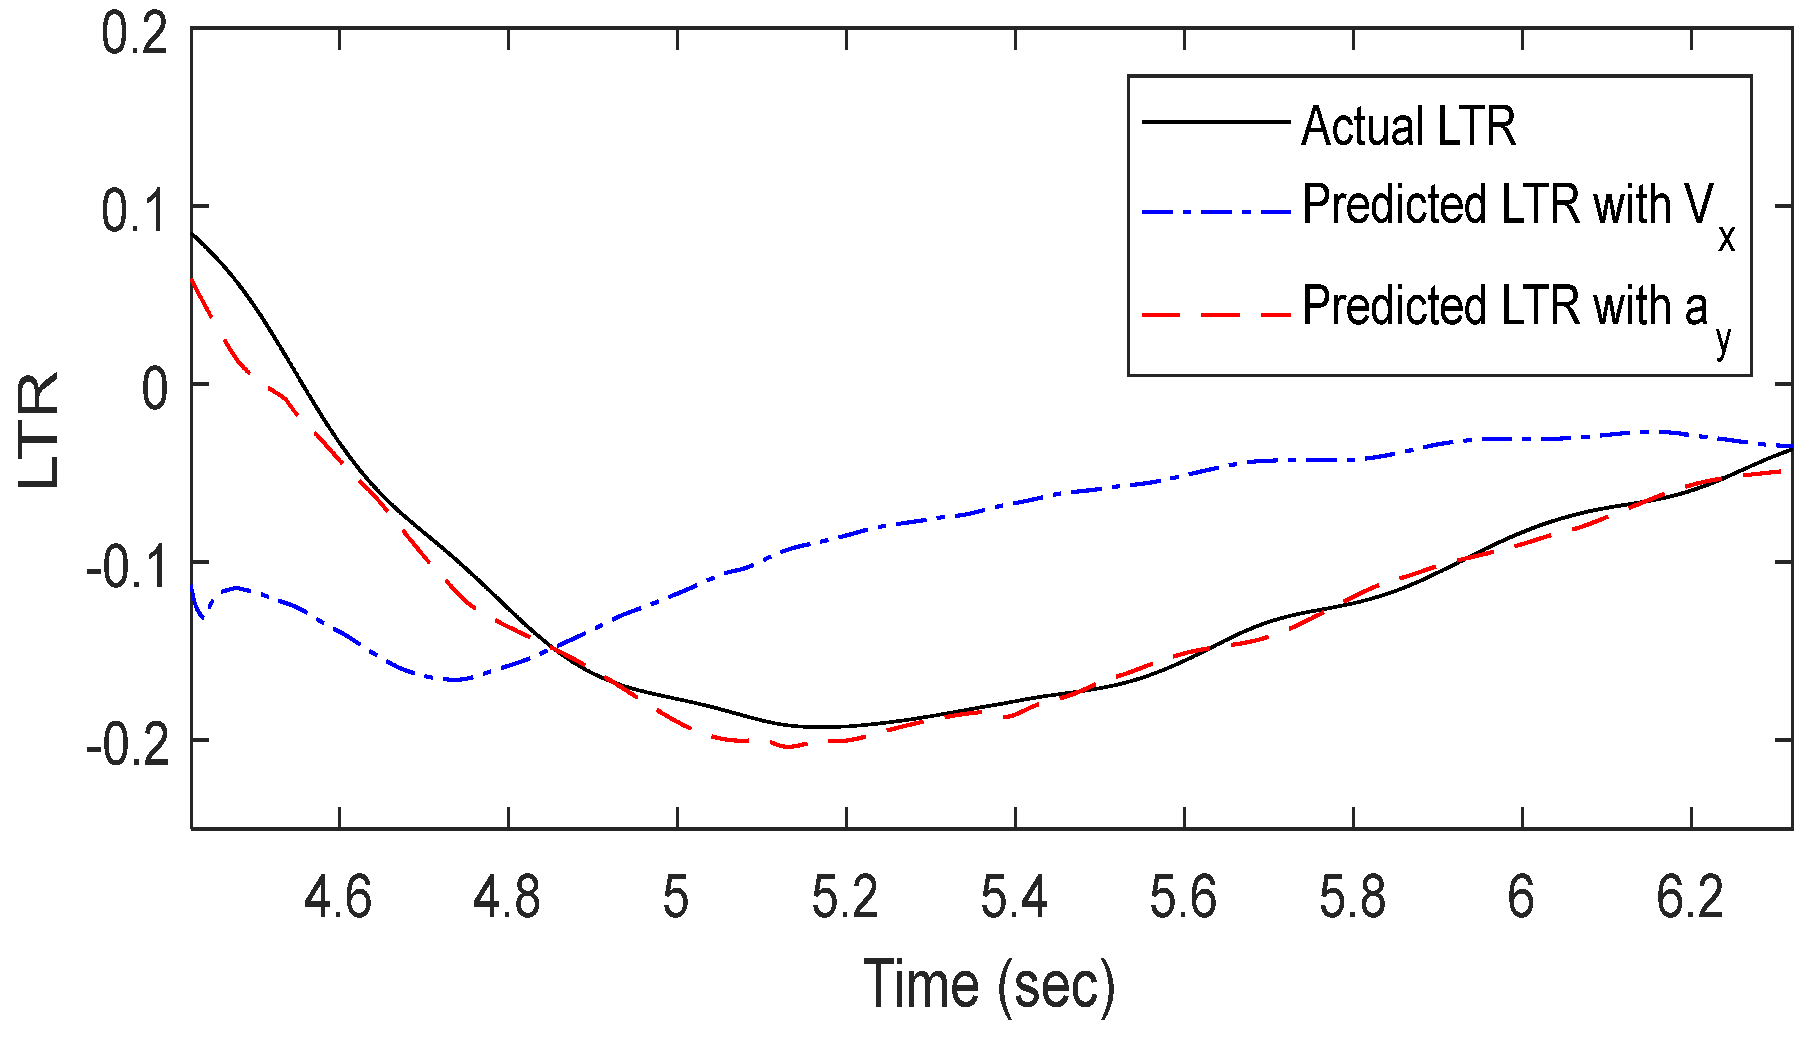
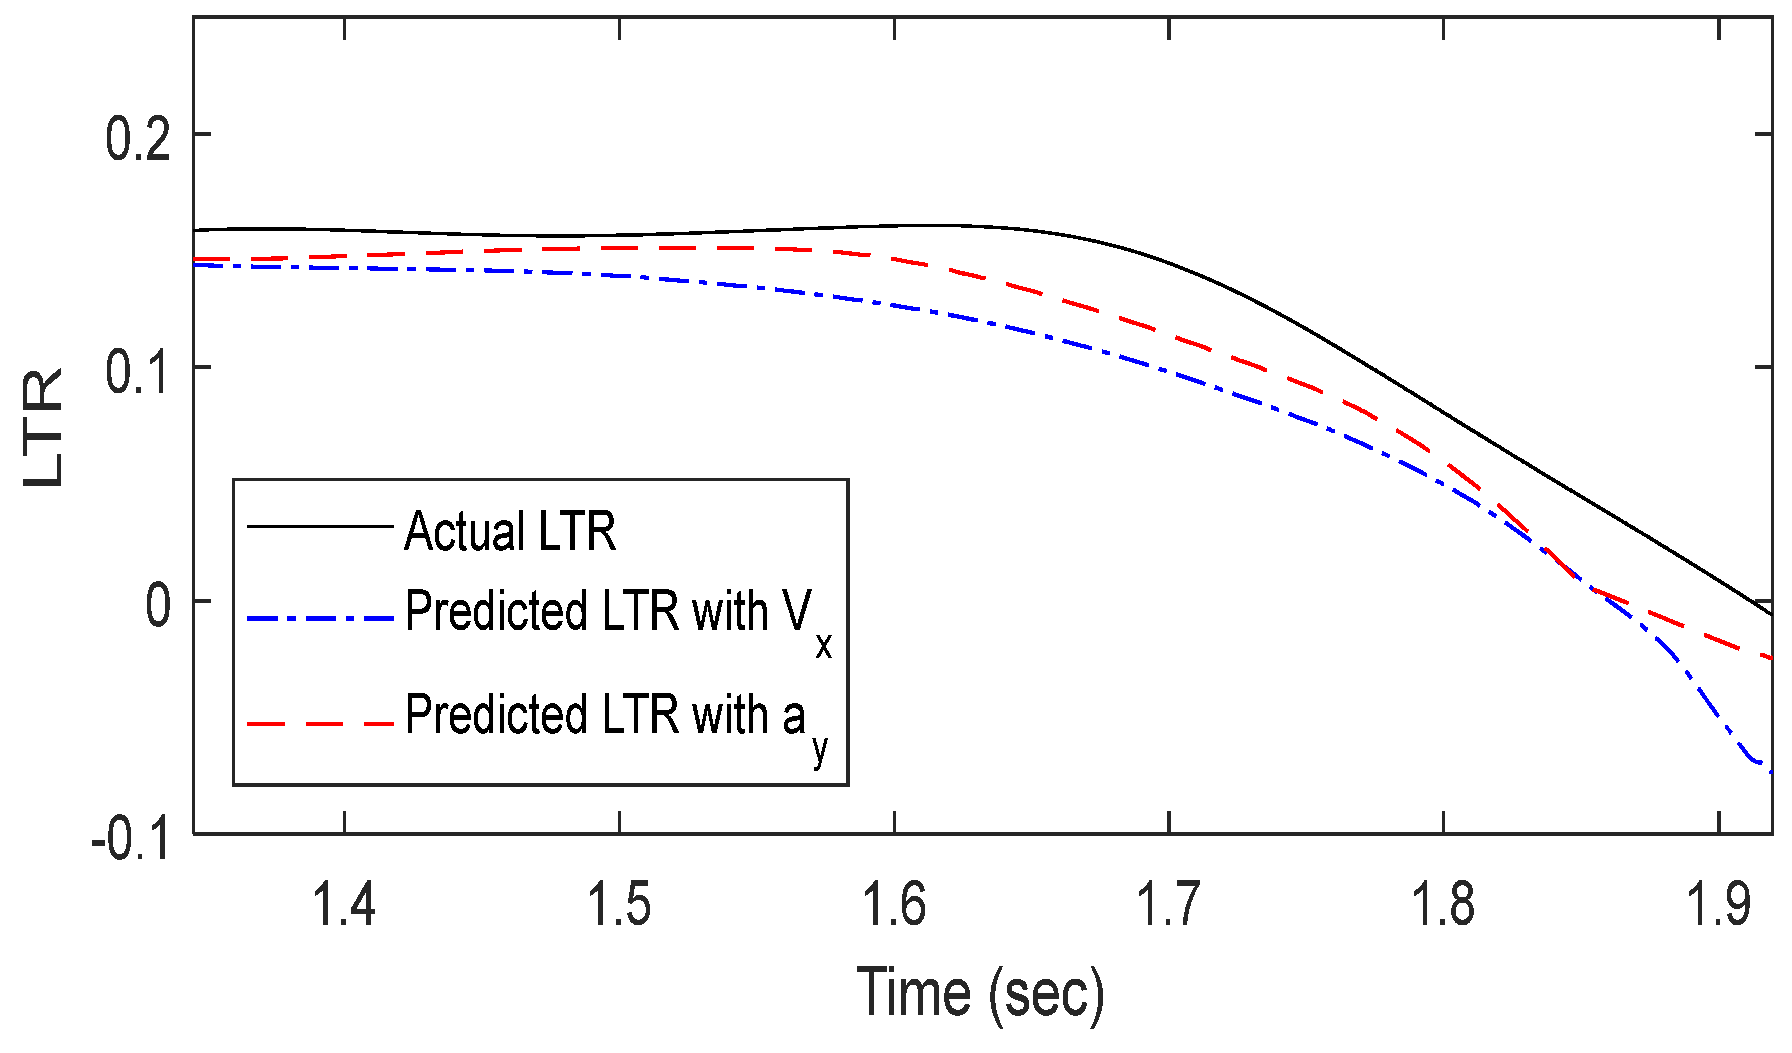
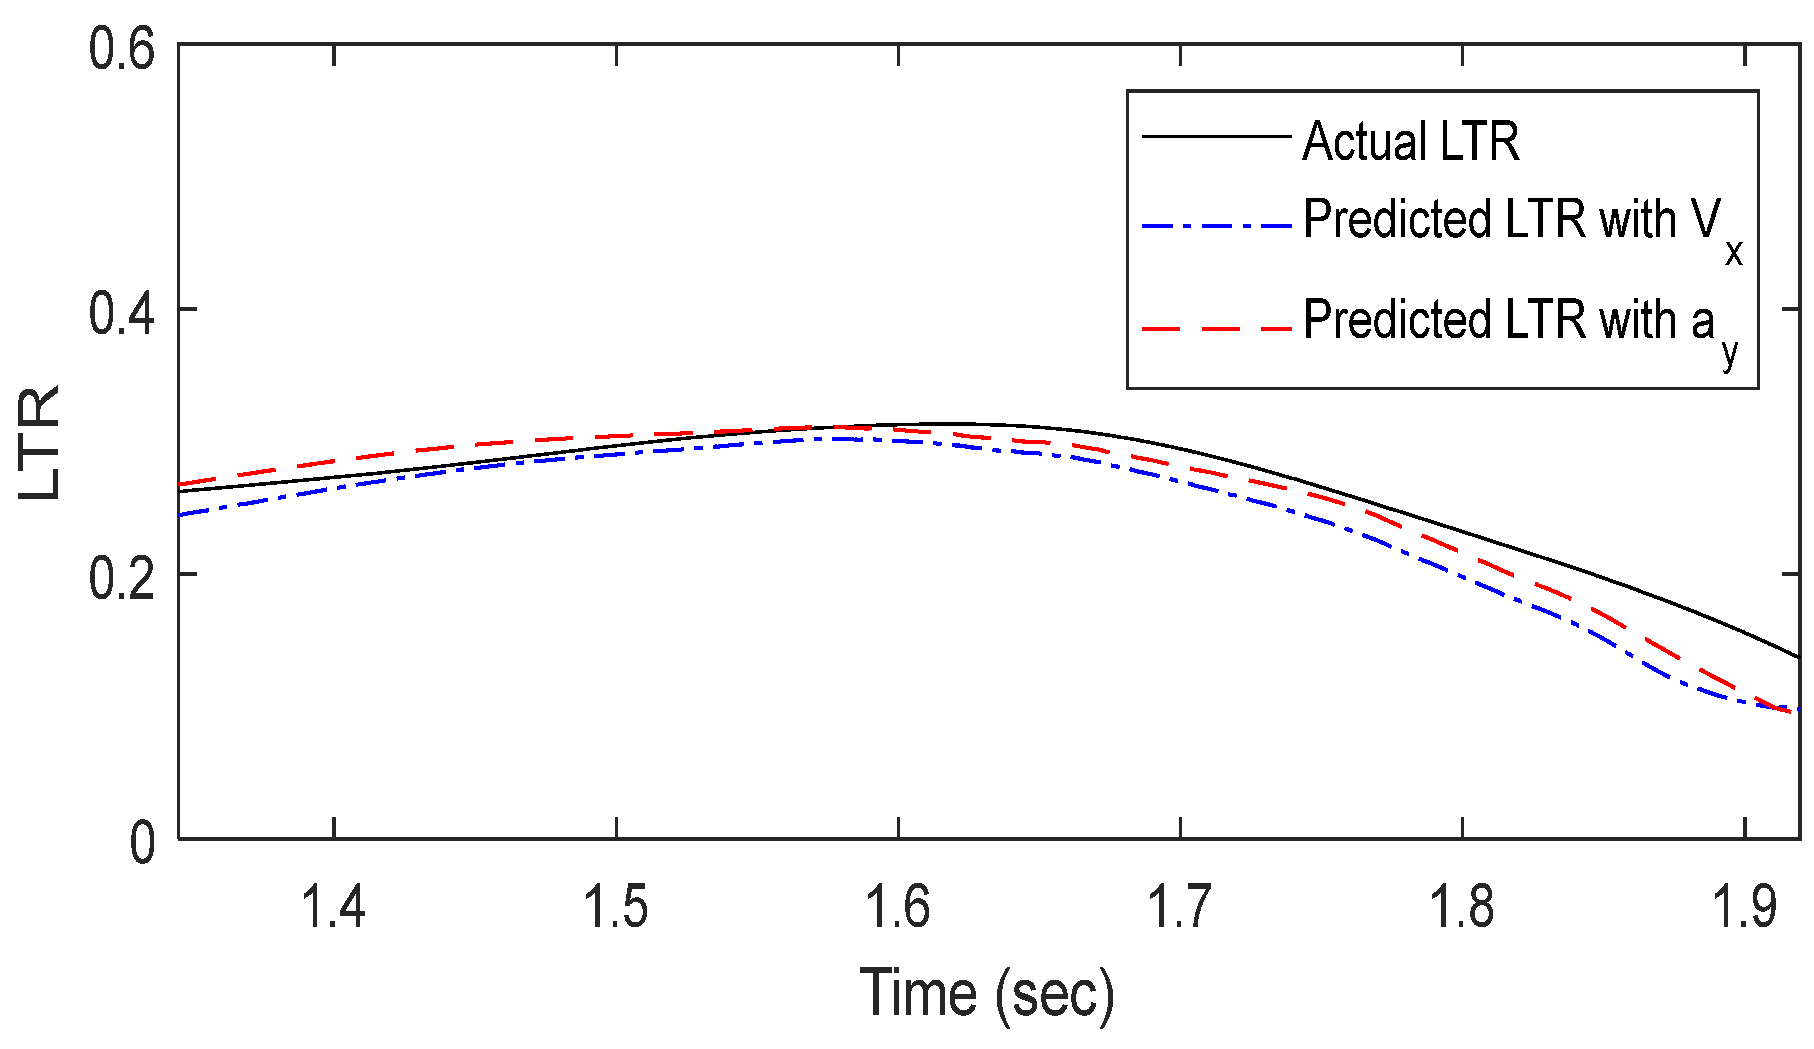
4.1. Rollover Safety Prediction Using Curvature and Speed

The results of training the RNN model using the curvature of the driving path and the vehicle speed as input data are illustrated as blue dashed lines in Figure 9, Figure 10, Figure 11, Figure 12, Figure 13 and Figure 14.
First, the dynamic stability prediction results were analyzed after training the model on DLC simulation data according to vehicle speed. In Figure 9, the predicted values exhibited an average difference of 0.052 and a maximum difference of 0.097 from the actual data after 7.5 s. In Figure 10, the predicted results closely matched the actual data up to 3.6 s but then showed an average underestimation of 0.062 and a maximum underestimation of 0.113. In Figure 11, the predicted results deviated significantly from the actual LTR data, showing completely different values and trends.
Next, the dynamic stability predicted using SWD simulation data was analyzed. In Figure 12, the predicted LTR values exhibited a similar trend to the actual LTR data but were lower by an average of 0.032 and a maximum of 0.068. In Figure 13, the predicted results closely followed the actual LTR index trend, but from approximately 1.65 s, they deviated from the actual data, showing an average difference of 0.014 and a maximum difference of 0.038 from 1.78 s onward. Similarly, in Figure 14, the predicted values were lower than the actual values by an average of 0.022 and a maximum of 0.057 from 1.6 s onward. When curvature and velocity were used as input data, the predicted values closely followed the actual values in scenarios where the LTR changed gradually, such as in SWD tests. However, in scenarios where vehicle stability changed rapidly, such as in DLC tests, large discrepancies occurred between the predicted and actual values. This suggests that the machine learning model fails to capture the nonlinear relationship between road curvature, driving speed, and LTR. To improve the model’s accuracy, lateral acceleration, which can be directly calculated from curvature and velocity, was introduced as an alternative input parameter.

4.2. Prediction of Rollover Safety Using Curvature and Lateral Acceleration

To improve prediction accuracy, the velocity data used in machine learning were converted to lateral acceleration using Equation (2), and the model was retrained. The results are shown as red dotted lines in Figure 9, Figure 10, Figure 11, Figure 12, Figure 13 and Figure 14. The same methodology was applied to analyze the dynamic stability predictions based on DLC simulation data.
In Figure 9, both the predicted values and trends closely matched the actual data, with an average error of 0.004 and a maximum error of 0.016, demonstrating improved accuracy compared to the curvature-velocity model. In Figure 10, the predicted values showed an average error of 0.002 and a maximum error of 0.033, indicating improved accuracy. However, up to 7.75 s, the predictions underestimate the actual values. In Figure 11, despite an average error of 0.008 and a maximum error of 0.044, the model achieved higher accuracy than the curvature-velocity model under the same conditions.
A similar analysis was conducted for the SWD simulation. In Figure 12, the model exhibited lower errors compared to the curvature-velocity case, with an average difference of 0.019 and a maximum difference of 0.037. The mean squared error (MSE) was also lower. However, from 1.55 s onward, the predicted values underestimated the actual LTR index. In Figure 13, the model showed an average error of 0.002 and a maximum error of 0.023, with a lower MSE compared to the curvature-velocity model. Nonetheless, some discrepancies existed in certain regions where the actual LTR changed. In Figure 14, the predicted results closely followed the actual LTR trend, with an average error of 0.007 and a maximum error of 0.067, showing improved accuracy compared to the curvature-velocity model. Overall, for all speed and driving scenarios, the model using curvature and lateral acceleration consistently outperformed the curvature-velocity model under identical conditions.

4.3. Accuracy Comparison Between Velocity-Based and Lateral-Acceleration-Based Predictions

The rollover stability predictions based on curvature and velocity were compared with those based on curvature and lateral acceleration. Here, the lateral acceleration was computed using the planned path curvature and the intended driving speed. Table 5 compares the prediction results of the curvature-velocity model (Model A) and the curvature-lateral acceleration model (Model B) in terms of mean squared error (MSE). The results indicate that across all test scenarios, converting velocity to lateral acceleration leads to improved prediction accuracy.

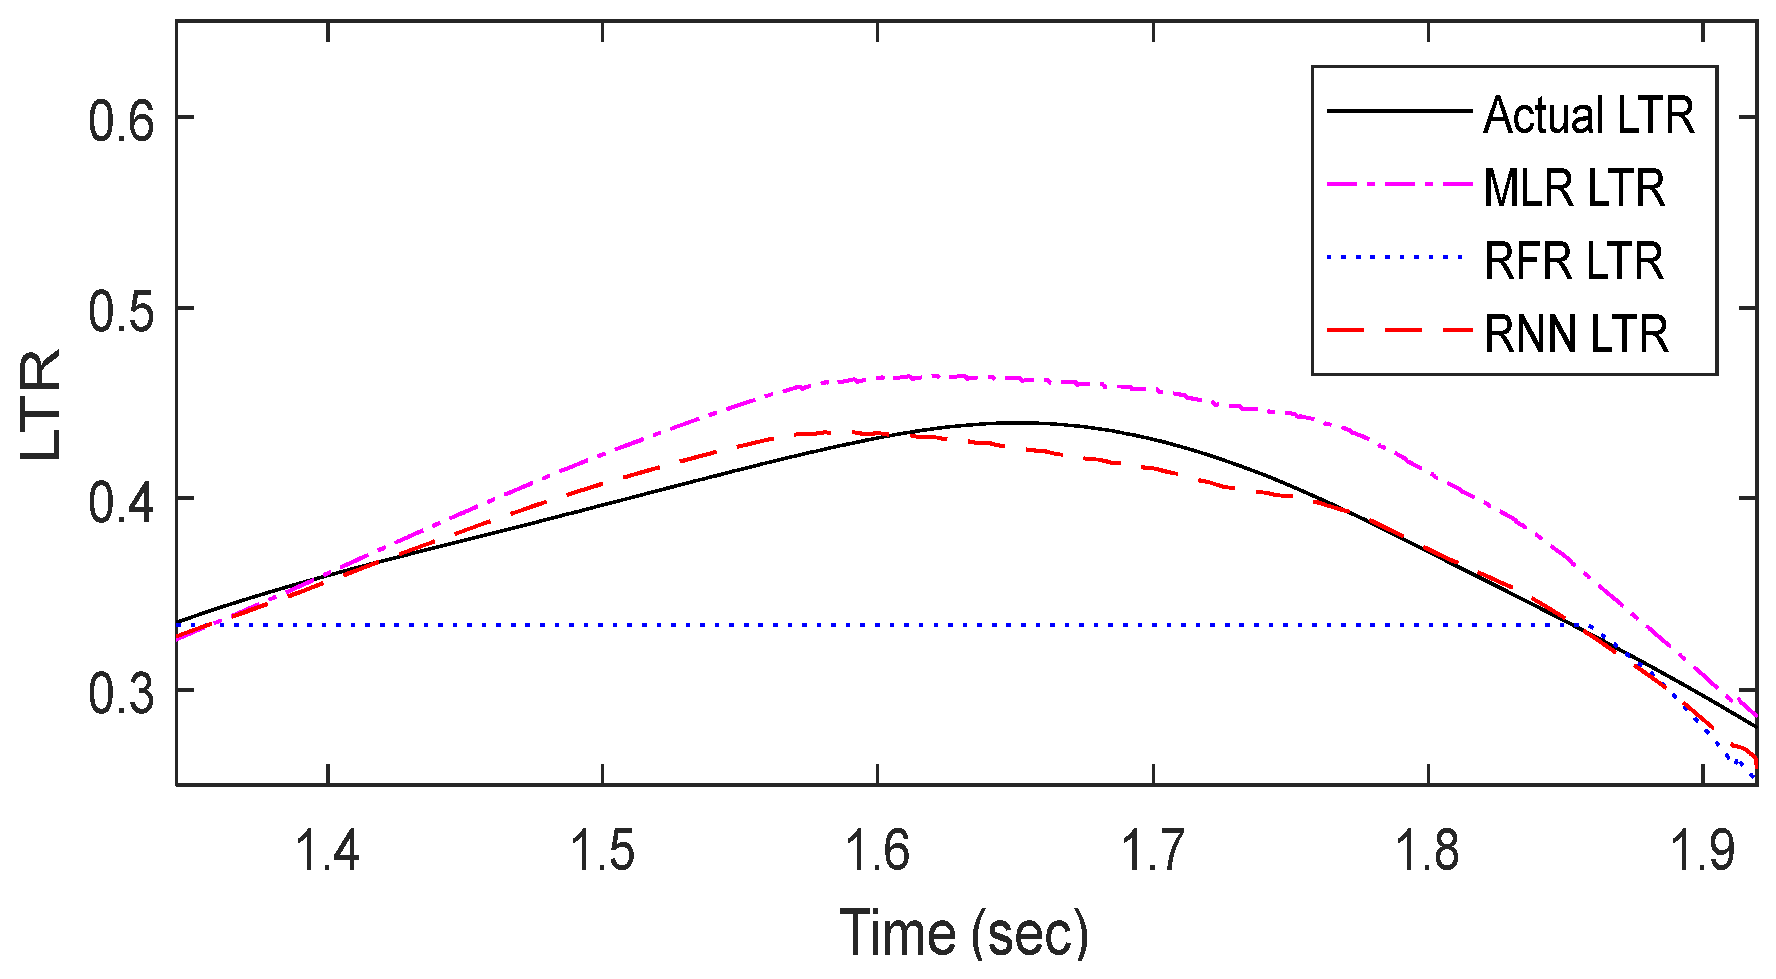
4.4. Comparison of Machine Learning Model Performance

To compare the predictive accuracy of different machine learning models, MLR, random forest, and RNN were employed for training. Figure 15 and Figure 16 illustrate the comparison between actual and predicted data for DLC and SWD simulations at a speed of 80.5 km/h, where the curvature and lateral acceleration data were used for training.
Table 6 presents the MSE values of the rollover stability predictions compared to actual data. Among the models, RNN exhibited the lowest MSE, indicating the highest accuracy in predicting rollover stability.
The MLR model demonstrated the second-lowest error after the RNN model. In Figure 15 and Figure 16, the DLC scenario results were comparable across models. However, in the SWD scenario, from 1.4 s onward, the MLR model overestimated the actual values, with a larger error range than the RNN model. The random forest model, as shown in Figure 17, exhibited minor oscillations in the predicted data between 3.59 and 3.75 s in the DLC scenario, while it completely failed to generate accurate predictions in the SWD scenario.
Based on the combined analysis of MSE values and prediction trends, the RNN model was determined to be the most suitable for predicting the rollover stability of heavy-duty trucks.

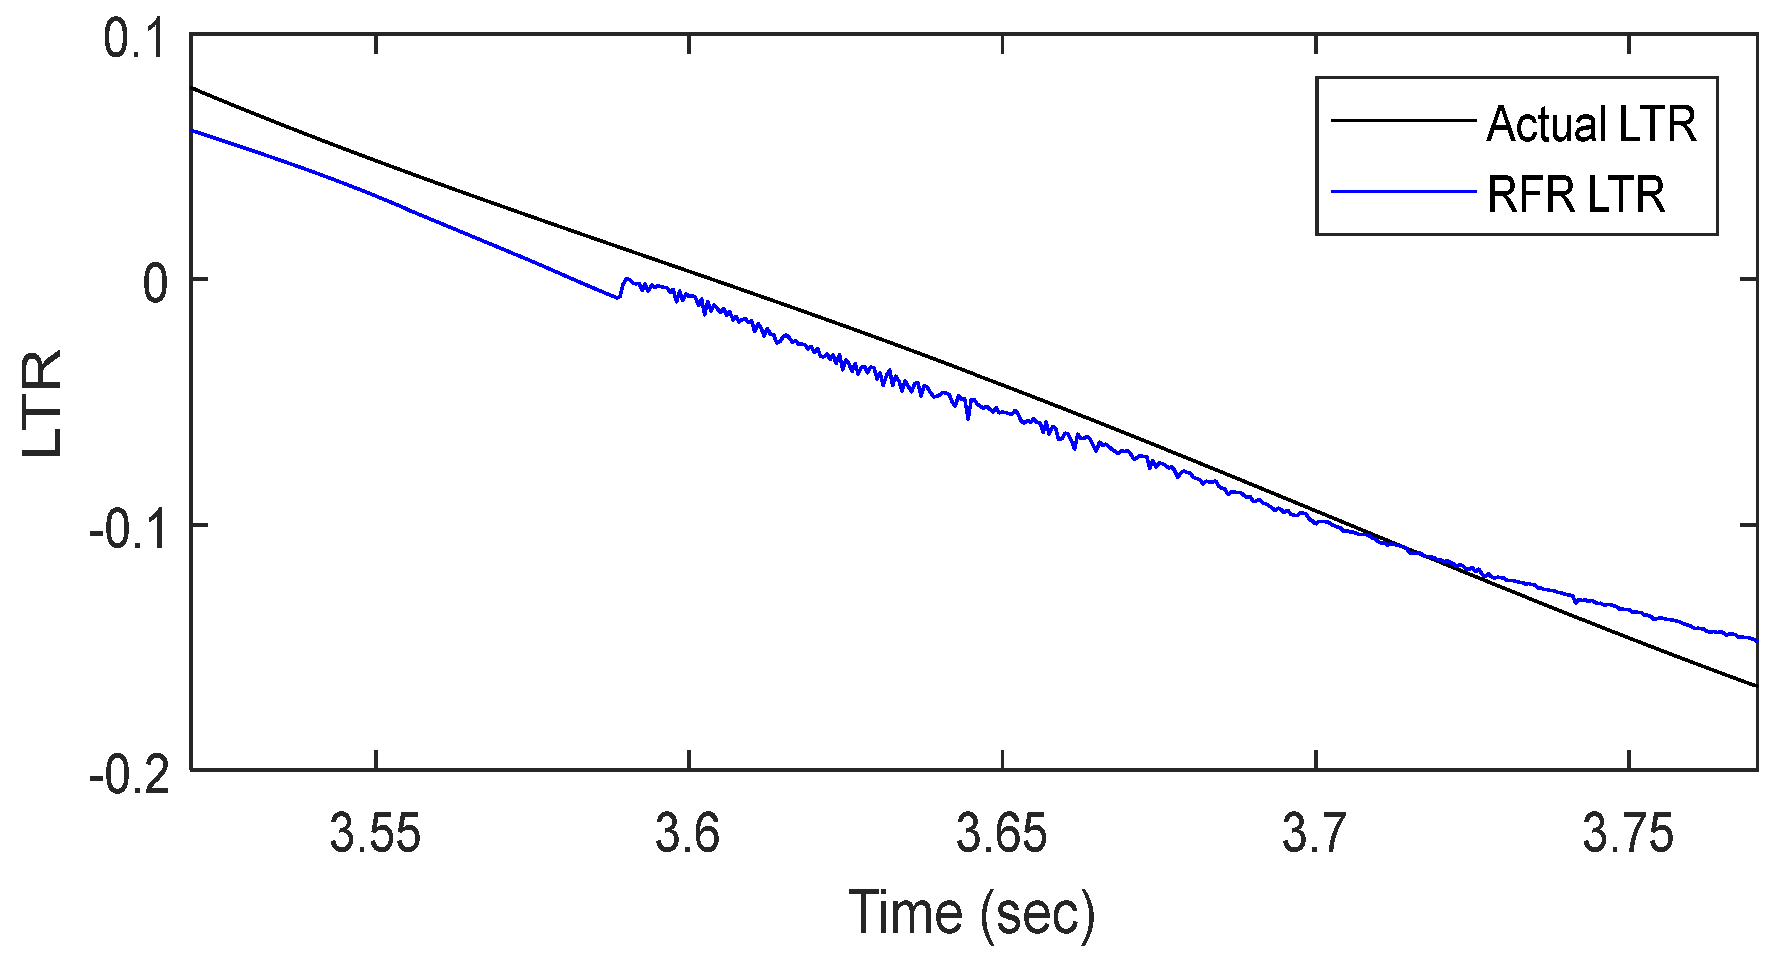
4.5. Error Analysis and Model Performance

Error analysis indicated that RNN underperformed primarily during sudden, highly nonlinear maneuvers—especially at transition points in DLC tests.
Key findings from error analysis include:
  • Underestimation of LTR during rapid steering reversals.
  • Lag effects due to insufficient time window size for capturing delayed load transfer dynamics.
  • Outliers when wheel lift occurred at very low lateral acceleration magnitudes (indicating model overfitting to typical cases).
Future improvements could involve adopting sequence models with longer memory (e.g., bidirectional LSTMs) or attention-based architectures.

4.6. Limitations

Despite the promising findings, this study has several limitations:
  • Simulation-based data: All models were trained and tested exclusively on simulation outputs. Real-world validation is required to assess robustness under diverse road conditions and vehicle aging effects.
  • Simplified vehicle dynamics: Tire and suspension models were simplified; tire wear, road surface variations (e.g., wet or icy conditions), and load shifts were not explicitly modeled.
  • Limited vehicle diversity: Although five vehicle types were analyzed, further expansion to include buses, tankers, and specialty vehicles is necessary for broader applicability.
  • Temporal window constraints: The 10-time-step sequence window may be insufficient for certain high-speed maneuvers. Dynamic window sizing could be explored.
  • Generalizability to different environments: Current models assume standard dry road conditions. Performance under adverse weather or non-uniform terrain remains unknown.

4.7. Future Work

This study contributes to the existing body of knowledge by proposing a simulation-based RNN (recurrent neural network) model for LTR prediction, tailored for autonomous heavy trucks. Unlike traditional ESC evaluation methods or previous ML-based approaches, the proposed framework leverages lateral acceleration—derived from curvature and speed—as a predictive feature to enhance rollover risk assessment. Moreover, this study addresses the need for cost-effective dynamic stability assessments that align with evolving national regulations, particularly in the context of South Korea’s 2023 ESC mandate for heavy trucks. Future studies will focus on the following:
  • Collecting experimental data from full-scale vehicle tests to validate the machine learning models.
  • Integrating sensor noise models to evaluate real-world performance.
  • Exploring hybrid models combining physics-based simulations with data-driven learning.
  • Investigating model explainability to ensure safer integration into autonomous control systems.

5. Conclusions

5.1. Effects of the Maximum Safe Roll Angle on the Dynamic Stability of Heavy Trucks

This study conducted a series of simulations to investigate the influence of the maximum safe roll angle on the dynamic stability of heavy trucks, with a particular focus on the effectiveness of electronic stability control (ESC). Key variables included vehicle type, static stability factor (SSF), ESC presence, and internationally standardized test procedures. The results showed that the maximum safe roll angle increased nearly linearly with SSF. Nevertheless, at identical SSF values, inter-vehicle variability in roll angle was observed to reach up to 7 degrees, indicating that factors beyond SSF—such as vehicle-specific characteristics—play a non-negligible role in rollover dynamics.
Among the six global test procedures analyzed, the J-turn, SWD, and fishhook tests consistently induced rollover in the absence of ESC, limiting their utility for quantitatively assessing LTR (load transfer ratio) reduction. In contrast, the circle, DLC, and SIS tests provided measurable reductions in LTR due to ESC installation, with the following decrease rates: 8.8–45.3% (circle), 43.4–55.5% (DLC), and 22.0–50.9% (SIS). The DLC test demonstrated the most pronounced ESC effect. Additionally, for the same LTR values, the maximum safe roll angle increased by 8–17 degrees when ESC was installed in the circle, DLC, and SIS tests.
As a result, to effectively evaluate the safety range of the maximum safe roll angle with ESC installation, a less stringent version of the J-turn, SWD, and fishhook tests may be required compared to existing regulations. Furthermore, the results indicate that the maximum safe roll angle varies even for the same SSF depending on the truck’s specifications. Thus, a sensitivity analysis is necessary to determine which specific vehicle parameters influence the maximum safe roll angle. In this study, factors such as suspension characteristics, road surface conditions, and tire friction coefficients were held constant. To further explore methods for improving the maximum safe roll angle, additional full-scale vehicle experiments will be required.

5.2. Simulation-Based Driving Data Generation and Performance Verification of a Machine Learning Model for Predicting Truck Rollover Stability

The second phase of this study focused on the prediction of heavy truck rollover stability through simulation-based data generation and machine learning. Recurrent neural network (RNN) models were employed to predict the LTR index using input variables derived from simulated driving data. The major findings are summarized as follows:
  • The LTR index during truck operation can be reliably predicted based on the intended driving path and vehicle speed.
  • Transforming raw input variables—specifically vehicle speed and path curvature—into lateral acceleration significantly enhanced the prediction accuracy of the machine learning model.
  • The proposed LTR prediction model offers the potential to compute optimal driving speeds in real time, thereby improving rollover risk management during operation.
Practical deployment considerations are as follows:
  • The trained RNN models offer real-time rollover risk estimation capabilities, potentially enabling dynamic route planning and speed control for autonomous trucks.
  • Latency issues are minimal due to lightweight RNN architectures, but further optimization is required for deployment on embedded platforms.
  • Interpretability remains a challenge; future work must focus on explainable AI techniques to ensure transparency and regulatory acceptance in safety-critical systems.
  • Sensor noise and real-world environmental variability must be accounted for during system integration.
A notable limitation of the current work lies in the relatively short simulation sequences used for model training, which resulted in varying prediction accuracies across different driving scenarios. To improve model robustness, future studies should incorporate extended driving datasets. Furthermore, ongoing efforts aim to implement the trained model in autonomous heavy truck platforms. In such applications, the system would reverse-calculate the optimal speed along a predefined path by using the predicted LTR, thereby enabling real-time risk mitigation. This approach will require further validation through both advanced simulations and full-scale vehicle testing in subsequent studies. Overall, this research lays a foundational framework for the safe relaxation of regulatory stability margins for ESC-equipped heavy trucks and demonstrates the viability of machine-learning-based dynamic stability prediction in next-generation autonomous freight transport systems.

Funding

This paper was supported by the Joongbu University Research and Development Fund in 2023.

Institutional Review Board Statement

Not applicable.

Informed Consent Statement

Not applicable.

Data Availability Statement

The original contributions presented in the study are included in the article; further inquiries can be directed to the corresponding author.

Conflicts of Interest

The authors declare no conflicts of interest.

Abbreviations

The following abbreviations are used in this manuscript:
LTRlateral load transfer ratio
TTRtime to rollover
MLRmultiple linear regression
CNNconvolutional neural network
RNNrecurrent neural network
LSTMlong short-term memory

References

  1. Wang, D.; Gao, L.; Lan, Z.; Li, W.; Ren, J.; Zhang, J.; Zhang, P.; Zhou, P.; Wang, S.; Pan, J.; et al. An intelligent self-driving truck system for highway transportation. Front. Neurorobot. 2022, 16, 843026. [Google Scholar] [CrossRef] [PubMed]
  2. Korean National Police Agency. 2023 Traffic Accident Statistics. Report No.132002; Korean National Police Agency: Seoul, Republic of Korea, 2023. [Google Scholar]
  3. Hong, M.; Choi, G.; Kim, M. A Worst Vehicle Stability Evaluation Method for Heavy Duty Commercial Vehicles Using an Optimization Technique. Trans. KSAE 2019, 27, 721–726. [Google Scholar] [CrossRef]
  4. Forkenbrock, G.J.; Garrott, W.R.; Heitz, M.; O’Harra, B.C. An experimental examination of J-turn and fishhook maneuvers that may induce on-road, untripped, light vehicle rollover. SAE Trans. 2003, 112, 1112–1127. [Google Scholar]
  5. Kim, S.S. Prediction of ABS Braking Di stance using Simulation Technique. In Proceedings of the 2017 KSAE Annual Conference, Yeosu Expo, Yeosu, Republic of Korea, 15–17 November 2017; pp. 573–577. [Google Scholar]
  6. Kim, J.W.; Cho, J.H. Augmented Forward Collision Warning System Based on Prediction of Vehicle Braking Distance. JKIIT 2018, 16, 21–28. [Google Scholar] [CrossRef]
  7. Rajamani, R. Vehicle Dynamics and Control; Springer Science & Business Media: Berlin, Germany, 2011; pp. 15–240. [Google Scholar]
  8. Antonio, T.; Dimauro, L.; Velardocchia, F.; Paciullo, G.; Velardocchia, M. An Intelligent Predictive Algorithm for the Anti-Rollover Prevention of Heavy Vehicles for Off-Road Applications. Machines 2022, 10, 835. [Google Scholar] [CrossRef]
  9. Chao, P.P.; Zhang, R.Y.; Wang, Y.D.; Tang, H.; Dai, H.L. Warning model of new energy vehicle under improving time-to-rollover with neural network. Meas. Control. 2022, 55, 1004–1015. [Google Scholar] [CrossRef]
  10. Nie, X.; Min, C.; Pan, Y.; Li, K.; Li, Z. Deep-Neural-Network-Based Modelling of Longitudinal-Lateral Dynamics to Predict the Vehicle States for Autonomous Driving. Sensor 2022, 22, 2013. [Google Scholar] [CrossRef] [PubMed]
  11. Koysuren, K.; Keles, A.F.; Cakmakci, M. Online Parameter Estimation using Physics-Informed Deep Learning for Vehicle Stability Algorithms. In Proceedings of the 2023 American Control Conference (ACC), San Diego, CA, USA, 31 May–2 June 2023. [Google Scholar]
  12. Marumo, R.; Molwane, O.B.; Agarwal, A. Numerical Analysis of Rear Spoilers in Improving Vehicle Traction; Springer Proceedings in Materials: Berlin, Germany, 2020; pp. 165–173. [Google Scholar]
  13. Agarwal, A.; Batista, R.C.; Gurung, A. Smart Electric and Hybrid Vehicles: Analyzing the Impact of Bumper Height on Pedestrian Injuries Using Explicit Dynamics; CRC Press: London, UK, 2024; pp. 57–89. [Google Scholar]
  14. Huston, R.L.; Kelly, F.A. Another look at the static stability factor (SSF) in predicting vehicle rollover. Int. J. Crashworthiness 2022, 19, 567–575. [Google Scholar] [CrossRef]
  15. National Highway Traffic Safety Administration. Tractor Semi-Trailer Stability Objective Performance Test Research—Roll Stability; National Highway Traffic Safety Administration: Washington, DC, USA, 2011.
  16. National Highway Traffic Safety Administration. FMVSS No. 136, Electronic Stability Control Systems on Heavy Vehicles; Office of Regulatory Analysis and Evaluation: Washington, DC, USA, 2012.
  17. ISO 3888-1:2018; Passenger Cars—Test Track for a Severe Lane-Change Manoeuvre—Part 1: Double-Lane Change. International Organization for Standardization (ISO): Geneva, Switzerland, 2018.
  18. Ministry of Land, Infrastructure and Transport. Performance and Standards for Automobiles and Automobile Parts Enforcement Regulations. Appendix 1, No. 50, Electronic Stability Control (ESC) Test; Ministry of Land, Infrastructure and Transport: Sejong City, Republic of Korea, 2024.
  19. Hochreiter, S.; Schmidhuber, J. Long Short-term Memory. Neural Comput. 1997, 9, 1735–1780. [Google Scholar] [CrossRef] [PubMed]
Figure 1. Maximum tilt test using TruckSim.
Applsci 15 04886 g001
Figure 2. (a) Circle test track. (b) Double lane change test track.
Applsci 15 04886 g002
Figure 3. TruckSim Simulation: (a) DLC test, (b) SWD test.
Applsci 15 04886 g003
Figure 4. Track specifications for DLC test (m).
Applsci 15 04886 g004
Figure 5. Steering wheel angle for SWD test [16].
Applsci 15 04886 g005
Figure 6. Maximum tilt angle analysis for various heavy vehicle types and SSF.
Applsci 15 04886 g006
Figure 7. Comparative analysis of six dynamic stability cases for heavy trucks.
Applsci 15 04886 g007
Figure 8. The LTR of various heavy vehicles according to maximum tilt angle.
Applsci 15 04886 g008
Figure 9. Actual vs. predicted LTR of 40 km/h with the DLC test.
Applsci 15 04886 g009
Figure 10. Actual vs. predicted LTR of 80.5 km/h with the DLC test.
Applsci 15 04886 g010
Figure 11. Actual vs. predicted LTR of 50–70 km/h with the DLC test.
Applsci 15 04886 g011
Figure 12. Actual vs. predicted LTR of 40 km/h with the SWD test.
Applsci 15 04886 g012
Figure 13. Actual vs. predicted LTR of 80.5 km/h with the SWD test.
Applsci 15 04886 g013
Figure 14. Actual vs. predicted LTR of 50–70 km/h with the SWD test.
Applsci 15 04886 g014
Figure 15. Comparison of LTR prediction results with various machine learning models (driving scenario: DLC test).
Applsci 15 04886 g015
Figure 16. Comparison of LTR prediction results with various machine learning models (driving scenario: SWD test).
Applsci 15 04886 g016
Figure 17. LTR Prediction results with RFR learning models (driving scenario: DLC test).
Applsci 15 04886 g017
Table 1. The specifications of vehicles from manufacturer data sheets and TruckSim simulation model parameters.
Model Name540sArocsNPTPrimaXcient
Number of axles52344
Overall length (mm)12,90011,600759512,82011,575
Overall width (mm)24952495249524902490
Overall height (mm)39953200313033053345
Wheelbase (mm)88506600459076007430
Front track width (mm)20652100205021652080
Rear track width (mm)18301850185018501845
Curb weight (kg)12,155701511,10013,27012,800
Table 2. Variables for dynamic safety test.
Vehicle TypeSSFTest Evaluation MethodESC
540s
Arocs
NPT
Prima
Xcient
0.6
0.7
0.8
0.9
1.0
Circle
DLC
SIS
J-turn
SWD
Fishhook
On
Off
Table 3. RNN architecture.
TypeDescriptionCharacteristics
LayersSequence input
LSTM
Fully connected
10
50
1
Main hyperparametersOptimizer
Epochs
Dropout rate
Batch size
adam
50
0.2
32
Table 4. RNN input and output.
TypeDescriptionUnits
InputRoad curvature
Longitudinal speed
Lateral acceleration
-
km/h
m/s2
OutputLateral-load transfer ratio-
Table 5. Comparison of prediction accuracy for LTR (curvature and speed vs. curvature and lateral acceleration).
TypeSpeed (km/h)Mean Squared Error
Model AModel B
DLC400.00412950.0000168
80.50.00709540.0001994
50~700.00337080.0001438
SWD400.00116640.0004339
80.50.00054280.0000835
50~700.00069620.0003175
Table 6. Comparison of mean squared error with various machine learning models.
TypeMean Squared Error
DLCSWD
MLR0.00032640.0007587
Random forest0.00033540.0044262
RNN0.00019940.0000835
Disclaimer/Publisher’s Note: The statements, opinions and data contained in all publications are solely those of the individual author(s) and contributor(s) and not of MDPI and/or the editor(s). MDPI and/or the editor(s) disclaim responsibility for any injury to people or property resulting from any ideas, methods, instructions or products referred to in the content.

