Article

Numerical Analysis of the Effect of the Rock Particle Size on the Macroscopic Mechanical Properties Under Uniaxial Compression and Shearing

1
School of Resources and Safety Engineering, Central South University, Changsha 410083, China
2
Yunnan Diqing Non-Ferrous Metals Co., Ltd., Shangri-La 674400, China
*
Authors to whom correspondence should be addressed.
Appl. Sci. 2025, 15(9), 4882; https://doi.org/10.3390/app15094882
Submission received: 1 April 2025 / Revised: 23 April 2025 / Accepted: 25 April 2025 / Published: 28 April 2025
(This article belongs to the Special Issue Advances in Geotechnical and Geological Engineering)

Abstract

:
When the distribution characteristics of rock particles are unknown, obtaining reasonable particle size parameters through trial-and-error methods is time-consuming. Therefore, identifying a set of particle size parameters that can accurately reflect the macro-mechanical properties of rock is crucial. In this study, a series of uniaxial compression and direct shear tests were conducted on standard rock models with varying particle sizes and particle size ratios using the discrete element method (DEM). The results indicate that the uniaxial compressive strength, elastic modulus, and shear stiffness increase with decreasing particle size. Conversely, the uniaxial compressive strength, elastic modulus, and shear stiffness decrease as the particle size ratio increases. Based on the simulation results, the accuracy and reliability of numerical simulations can be ensured when the relative average particle size exceeds 50 and the particle size ratio is greater than 1.5. These findings can be applied to other similar numerical studies, thereby reducing the time required for parameter matching and enhancing the efficiency of scientific research.

1. Introduction

With the continuous progress and development of technology, human activities are expanding into increasingly complex environments, including the deep sea and the Earth’s interior. This expansion has led to a significant increase in the number and complexity of underground engineering projects. As a result, the evaluation of the mechanical properties of rock masses has become increasingly crucial [1,2,3]. Rock masses play a dominant role in the performance of engineering structures built on them [4,5,6,7]. Traditionally, field sampling and laboratory tests have been employed to determine the mechanical parameters of rock masses. However, due to the existence of the rock size effect, the test results obtained from rock specimens of different sizes are inconsistent, making it impossible to accurately characterize the actual strength parameters of engineering rock masses using small-scale rock strength [8]. Extensive research on the rock size effect has been conducted by experts, yielding numerous valuable findings. Bandis and Lumsden [9] found that with the increase in joint length, the peak shear strength and dilatation angle gradually decrease, peak shear displacement gradually increases, and the failure mode changes from brittle failure to plastic failure. In addition, the influence of the size effect is weakened with a decrease in joint roughness. Barton and Choubey [10] believe that the shear behavior of small-size specimens is controlled by a small and sharp rough solid on the joint surface, while the shear behavior of large-scale specimens is controlled by a large and non-sharp fluctuation. Yong and Qin [11] reported an innovative method to sample large-size rock with rough joints. Some scholars [12,13,14] pointed out that the size effect only exists in a specific size range, and the mechanical parameters will no longer be affected by size when the size is larger than a certain value. On this basis, the representative sizes of rock under different loading conditions are obtained through numerical simulation [15,16,17,18]. Scholars have made a lot of efforts in the study of the rock size effect and have reached many important and useful conclusions [19,20,21]. However, a key challenge in studying the mechanical behavior of rock while considering the size effect is that large-scale or in situ tests require substantial human and material resources. In this context, numerical simulation emerges as a cost-effective, convenient, and efficient method for investigating the rock size effect. Zhang and Zhu [22] proposed a new method for the relationship between the uniaxial compressive strength and specimen size, and used particle flow simulation to study the influence of the size effect on rock shear strength. Bahaaddini and Hagan [23] used Particle Flow Code (PFC) software to conduct a simulation of rough joint specimens of different sizes, and the results showed that the shear strength and peak dilatancy increased and the shear stiffness decreased with an increase in size, which verified the correctness of the test by Bandis and Lumsden [9]. The degradation mechanism of roughness under different sizes is also studied. It is suggested that the motion of the micro-convex surface of a rough joint is the cause of the size effect. Cheng and Yang [24] studied the influence of microscopic parameters on the direct shear strength of the joint.
In particle flow simulation, the settings of the particle size and particle size ratio are always based on experience or other scholars’ research [25,26,27,28]. For natural rocks with a known particle distribution, Zhu and Dou [29] and Peng and Wong [30], studied the influence of the mineral grain size variation on the macroscopic mechanical properties of rock. Under the condition involving an unknown particle distribution, Ding and Zhang [31] studied the influences of the model size and particle size on the mechanical characteristics of a rock model and indicated that selecting an appropriate particle size is important. Asadi and Fakhimi [32] studied the influence of particle size on rock under static–dynamic loading and found that a change in the particle size only affected the tensile strength. Based on the above, there are still few studies on the macroscopic mechanical properties of rock under the influence of particle size. When the particle size parameters of rock are unknown, how to assign the particle size parameters is the key to ensuring the reliability of numerical simulation results. The most common stress states of rock are uniaxial compression and shear stress. It is undoubtedly important to investigate the influence of particle size parameters on the mechanical properties of rock models under these two stress states. Therefore, based on the average particle size and particle size ratio, uniaxial compression tests and direct shear tests, the two most common static loading experiments, are conducted in this study to explore the influence of particle size on the macroscopic mechanical behavior.

2. Effect of the Average Particle Size on the Model’s Macroscopic Mechanical Behavior

When conducting numerical simulations using Particle Flow Code (PFC2D 5.0, ITASCA international), the contact mesoscopic parameters of the model need to be calibrated to ensure that the macroscopic mechanical properties of the model align with those obtained from physical experiments [33,34]. The flow chart for numerical model generation is depicted in Figure 1. The calibration of mesoscopic parameters in this study is primarily based on the experimental results reported by Chen and Lin [35], as shown in Table 1.
In PFC, the particle radius range is specified by the code, and the generated model particle radius is evenly distributed within the given range. So, the average particle size can be calculated from the given particle radius range. The number of particles in the same size model varies with the particle size. However, for a fixed particle size, the number of particles will still change with the change in the model size. Therefore, linking the model size with the particle size is necessary to make the study universal and applicable. In this study, the variable L/dave used by Ding and Zhang [31] was adopted, where L is the shortest side length of the model and dave is the average particle diameter, so that the model size and particle size are comprehensively considered. The shortest side length L of model in the uniaxial compression test is 50 mm, and that of the model in the direct shear test is 100 mm. In the experiment, the size of the model is not changed, and the value of L/dave is only controlled by the particle size. In PFC, the force applied to the model can be obtained directly. The stress can be calculated by dividing the force by the base area of the specimen. Since the thickness of the model is the unit thickness in PFC2D, the stress is the force divided by the bottom area, which can be expressed by
σ = F / L
where σ represents stress, F represents the force applied on the model, and L represents the bottom length of the model. In this study, L of the model in the uniaxial compression test is 0.05 m (50 mm), and that of the model in the direct shear test is 0.1 m (100 mm).

2.1. Effect of the Average Particle Size on the Model’s Mechanical Behavior

Uniaxial compression tests are carried out on models with different average particle size and analyze the effect of the particle size on the uniaxial compressive strength and elastic modulus. Keeping the particle size ratio unchanged at 1.5, five groups of particle size ranges and corresponding L/dave are set. The five particle size ranges and corresponding L/dave are shown in Table 2. Considering the dispersion of rock materials, carrying out repeated tests is necessary. By changing the random factor, four numerical models with the same particles and different spatial arrangements are generated for each group. This means that the four models have the same macroscopic rock properties but different microscopic distributions of particles and are numbered 01, 02, 03, and 04.
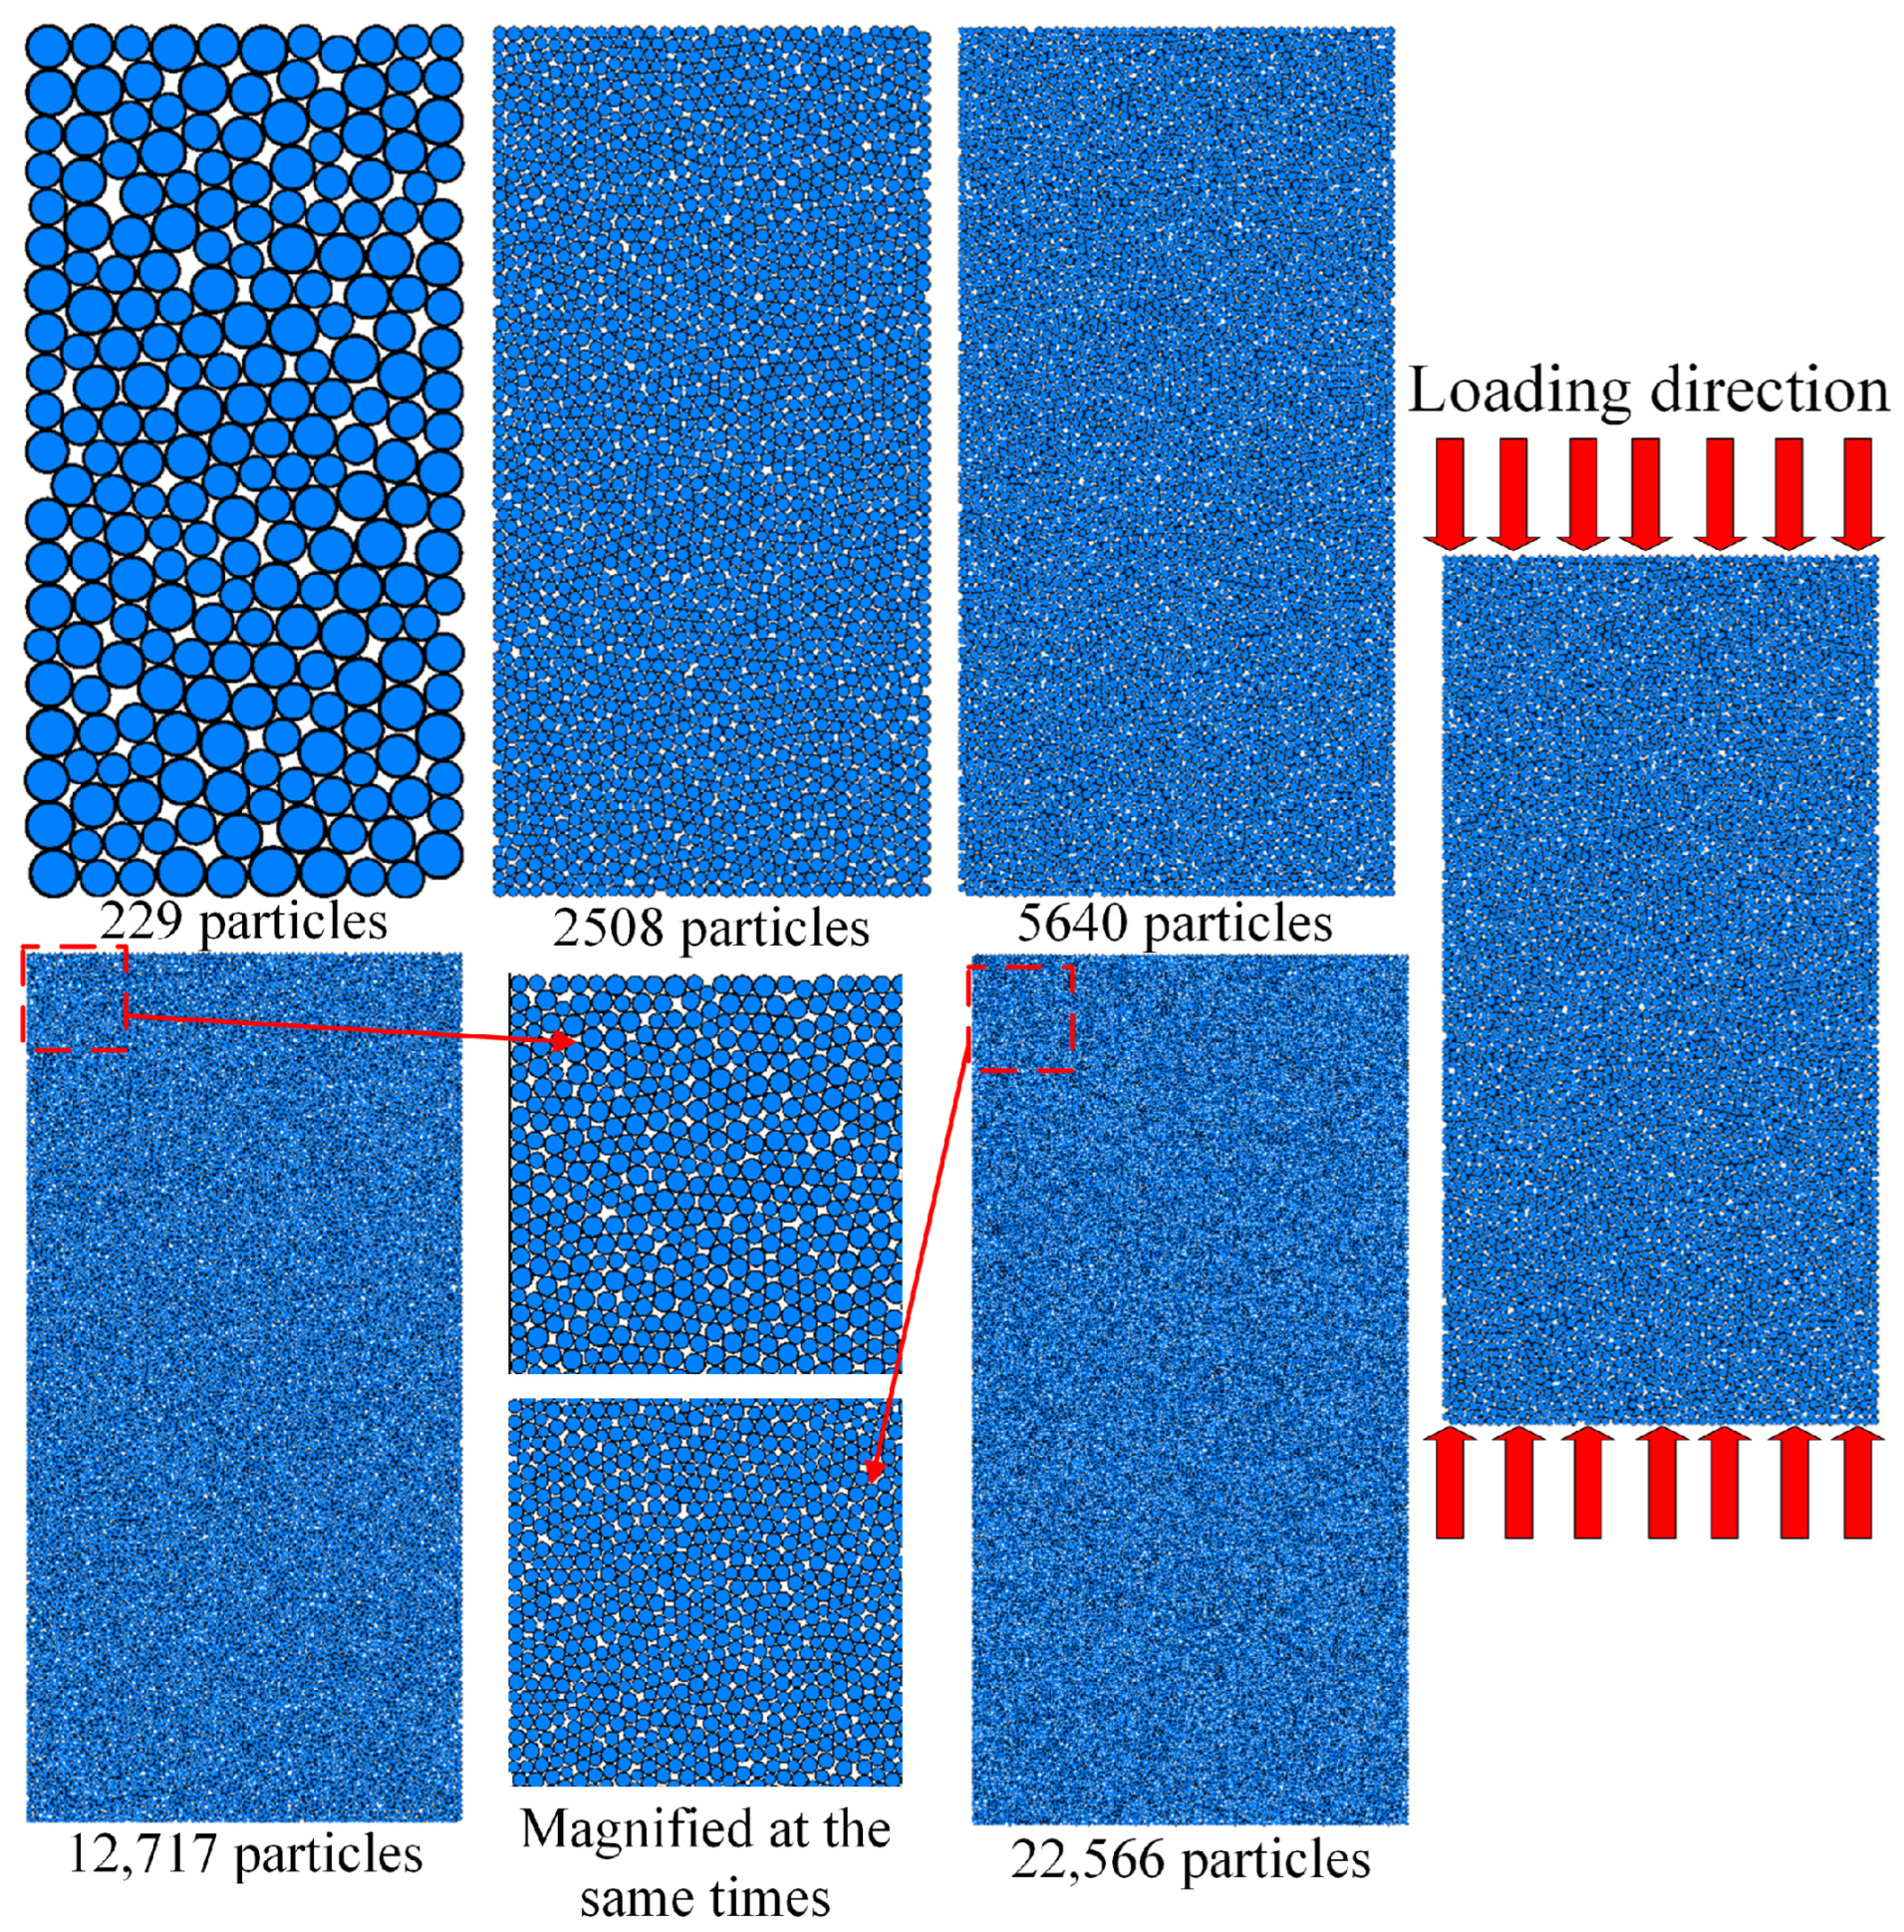
The generated models of different particle sizes are shown in Figure 2. A change in the particle size will directly cause a change in the particle number. The relationship between the particle number and L/dave is shown in Figure 3. It can be seen from Figure 3 that the larger the L/dave, the smaller the particle size and the denser the particles in the model. The number of particles and the increase rate of particle numbers increase with the increase in L/dave.
The quadratic function is used for fitting and the equation is as follows:
y = 5.08 + 0.78 x + 2.25 x 2
where y is the number of particles and x is the corresponding L/dave.
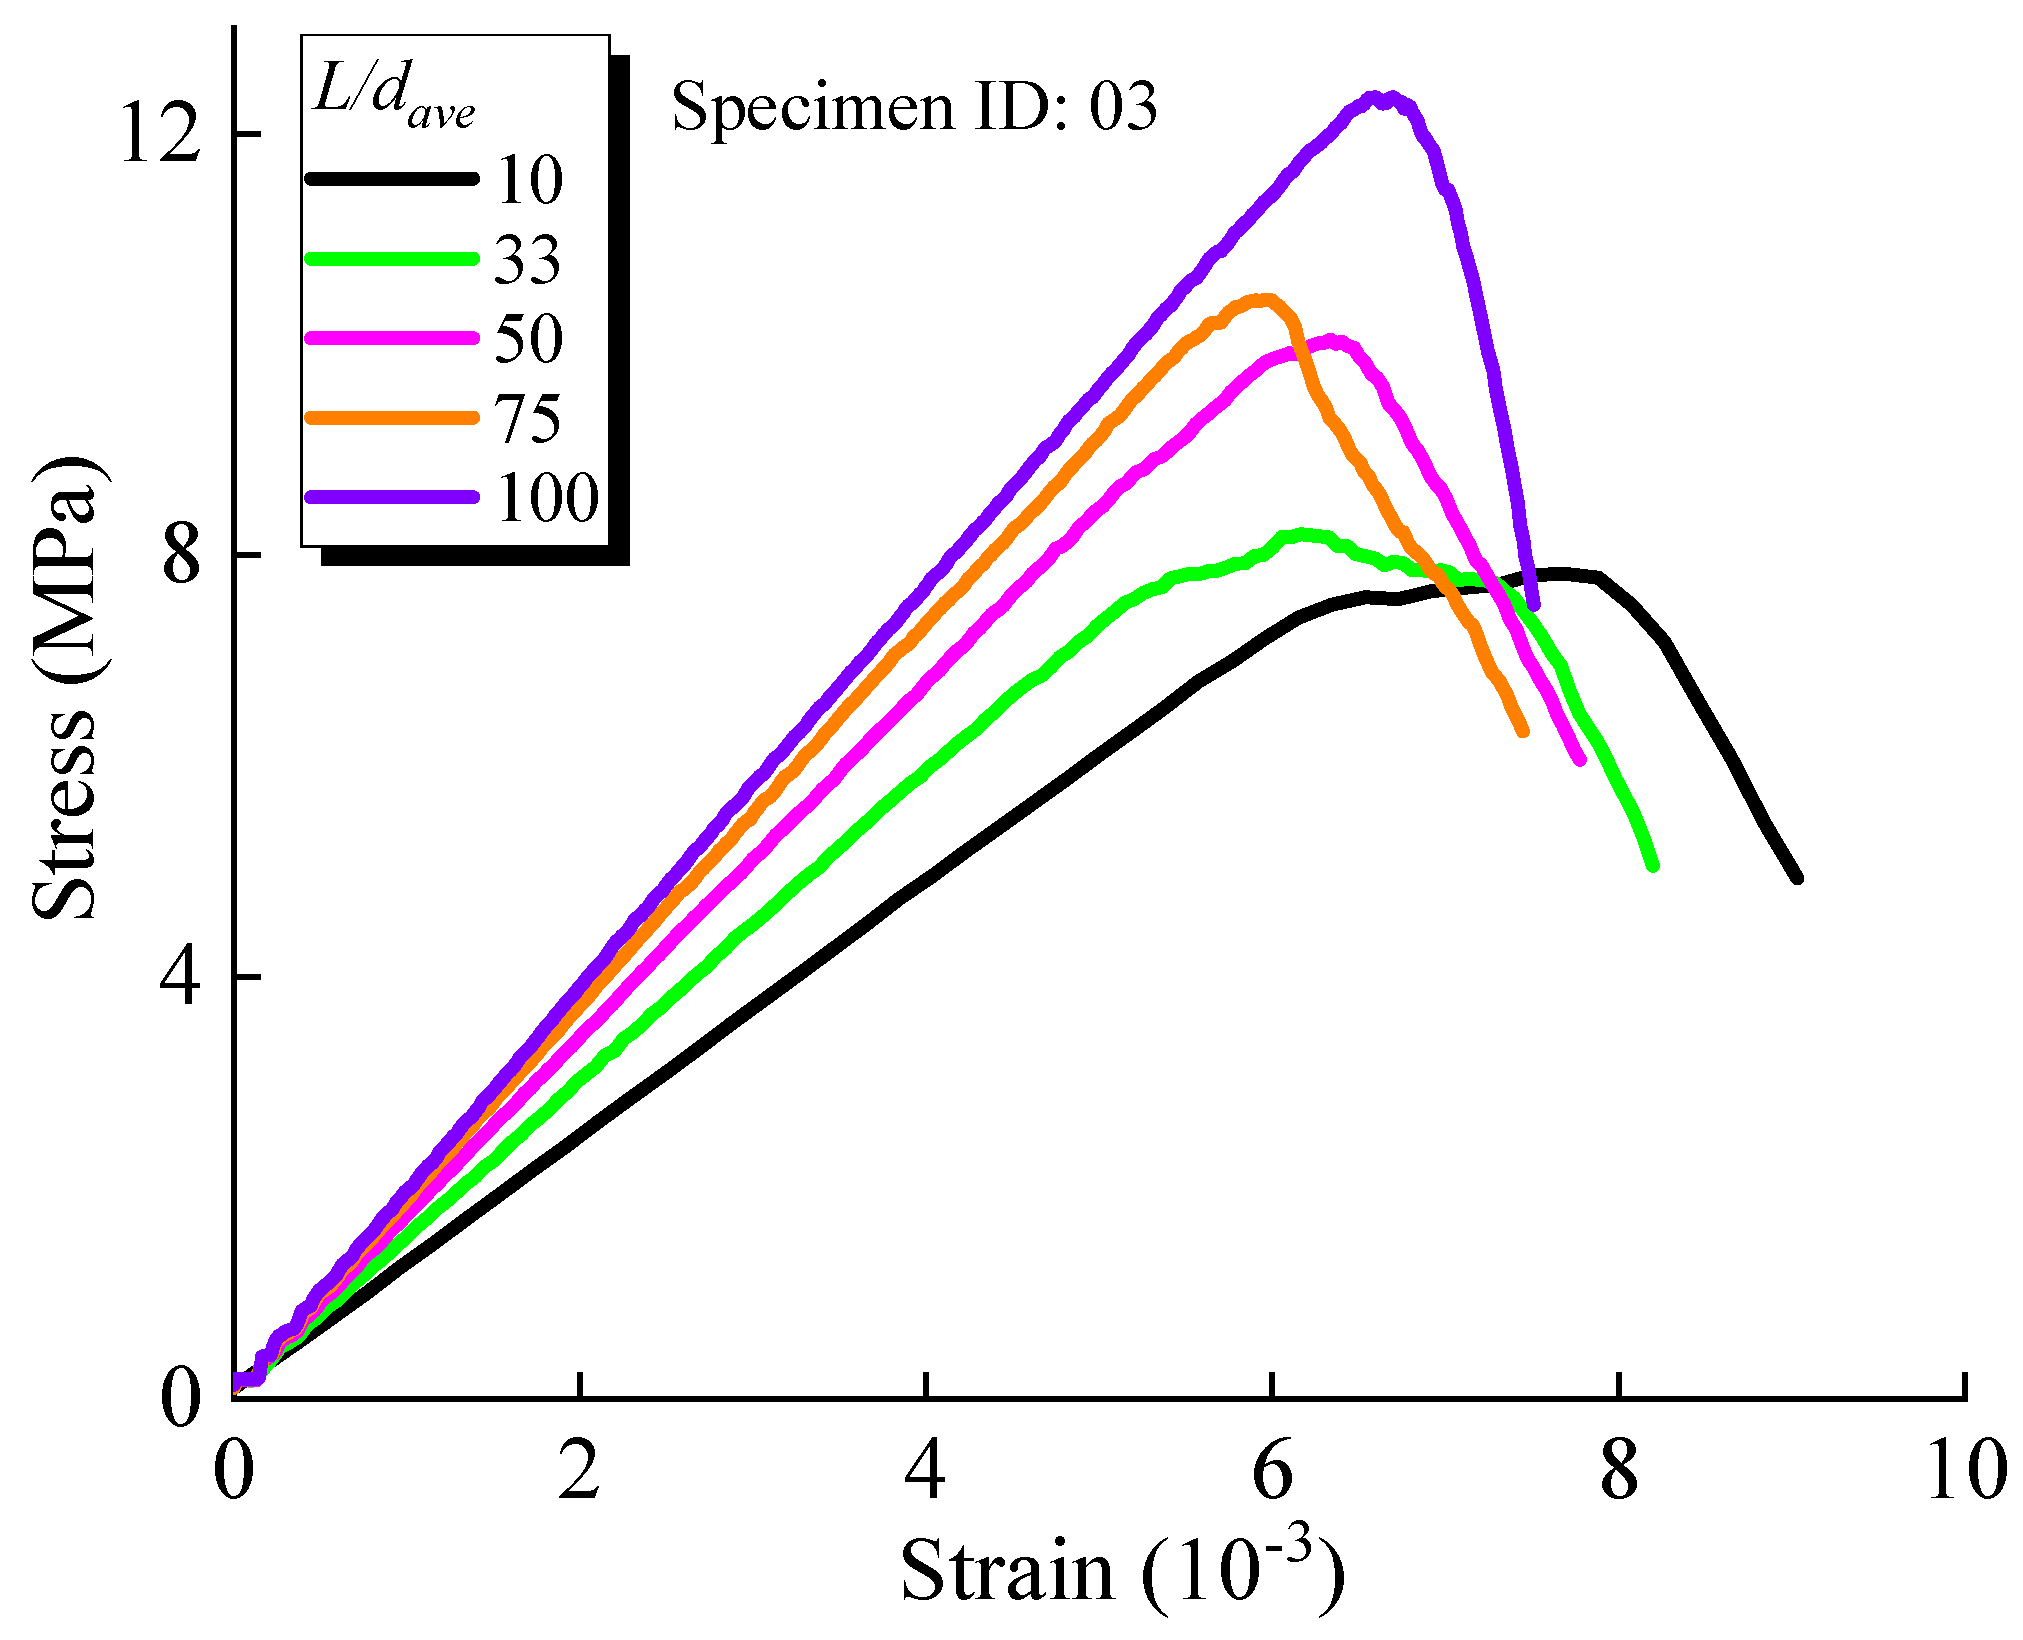
The fitting coefficient R2 is one, indicating that the growth of particle number with L/dave is fully consistent with quadratic polynomial fitting, which can be used to predict the numerical particle number. The effect of the average particle size on the uniaxial compressive strength and elastic modulus are studied by uniaxial compression tests on the four groups of specimens. The stress–strain curves of one group (specimen 03) are shown in Figure 4. The larger the L/dave, the larger the uniaxial compressive strength and the slope of linear part of stress–strain curves before the peak. However, the peak displacement corresponding to different L/dave fluctuates between 6 × 10⁻³ and 8 × 10⁻³. This shows that the smaller and denser the particles, the higher the compressive strength and elastic modulus.

2.2. Effect of the Average Particle Size on the Compressive Strength

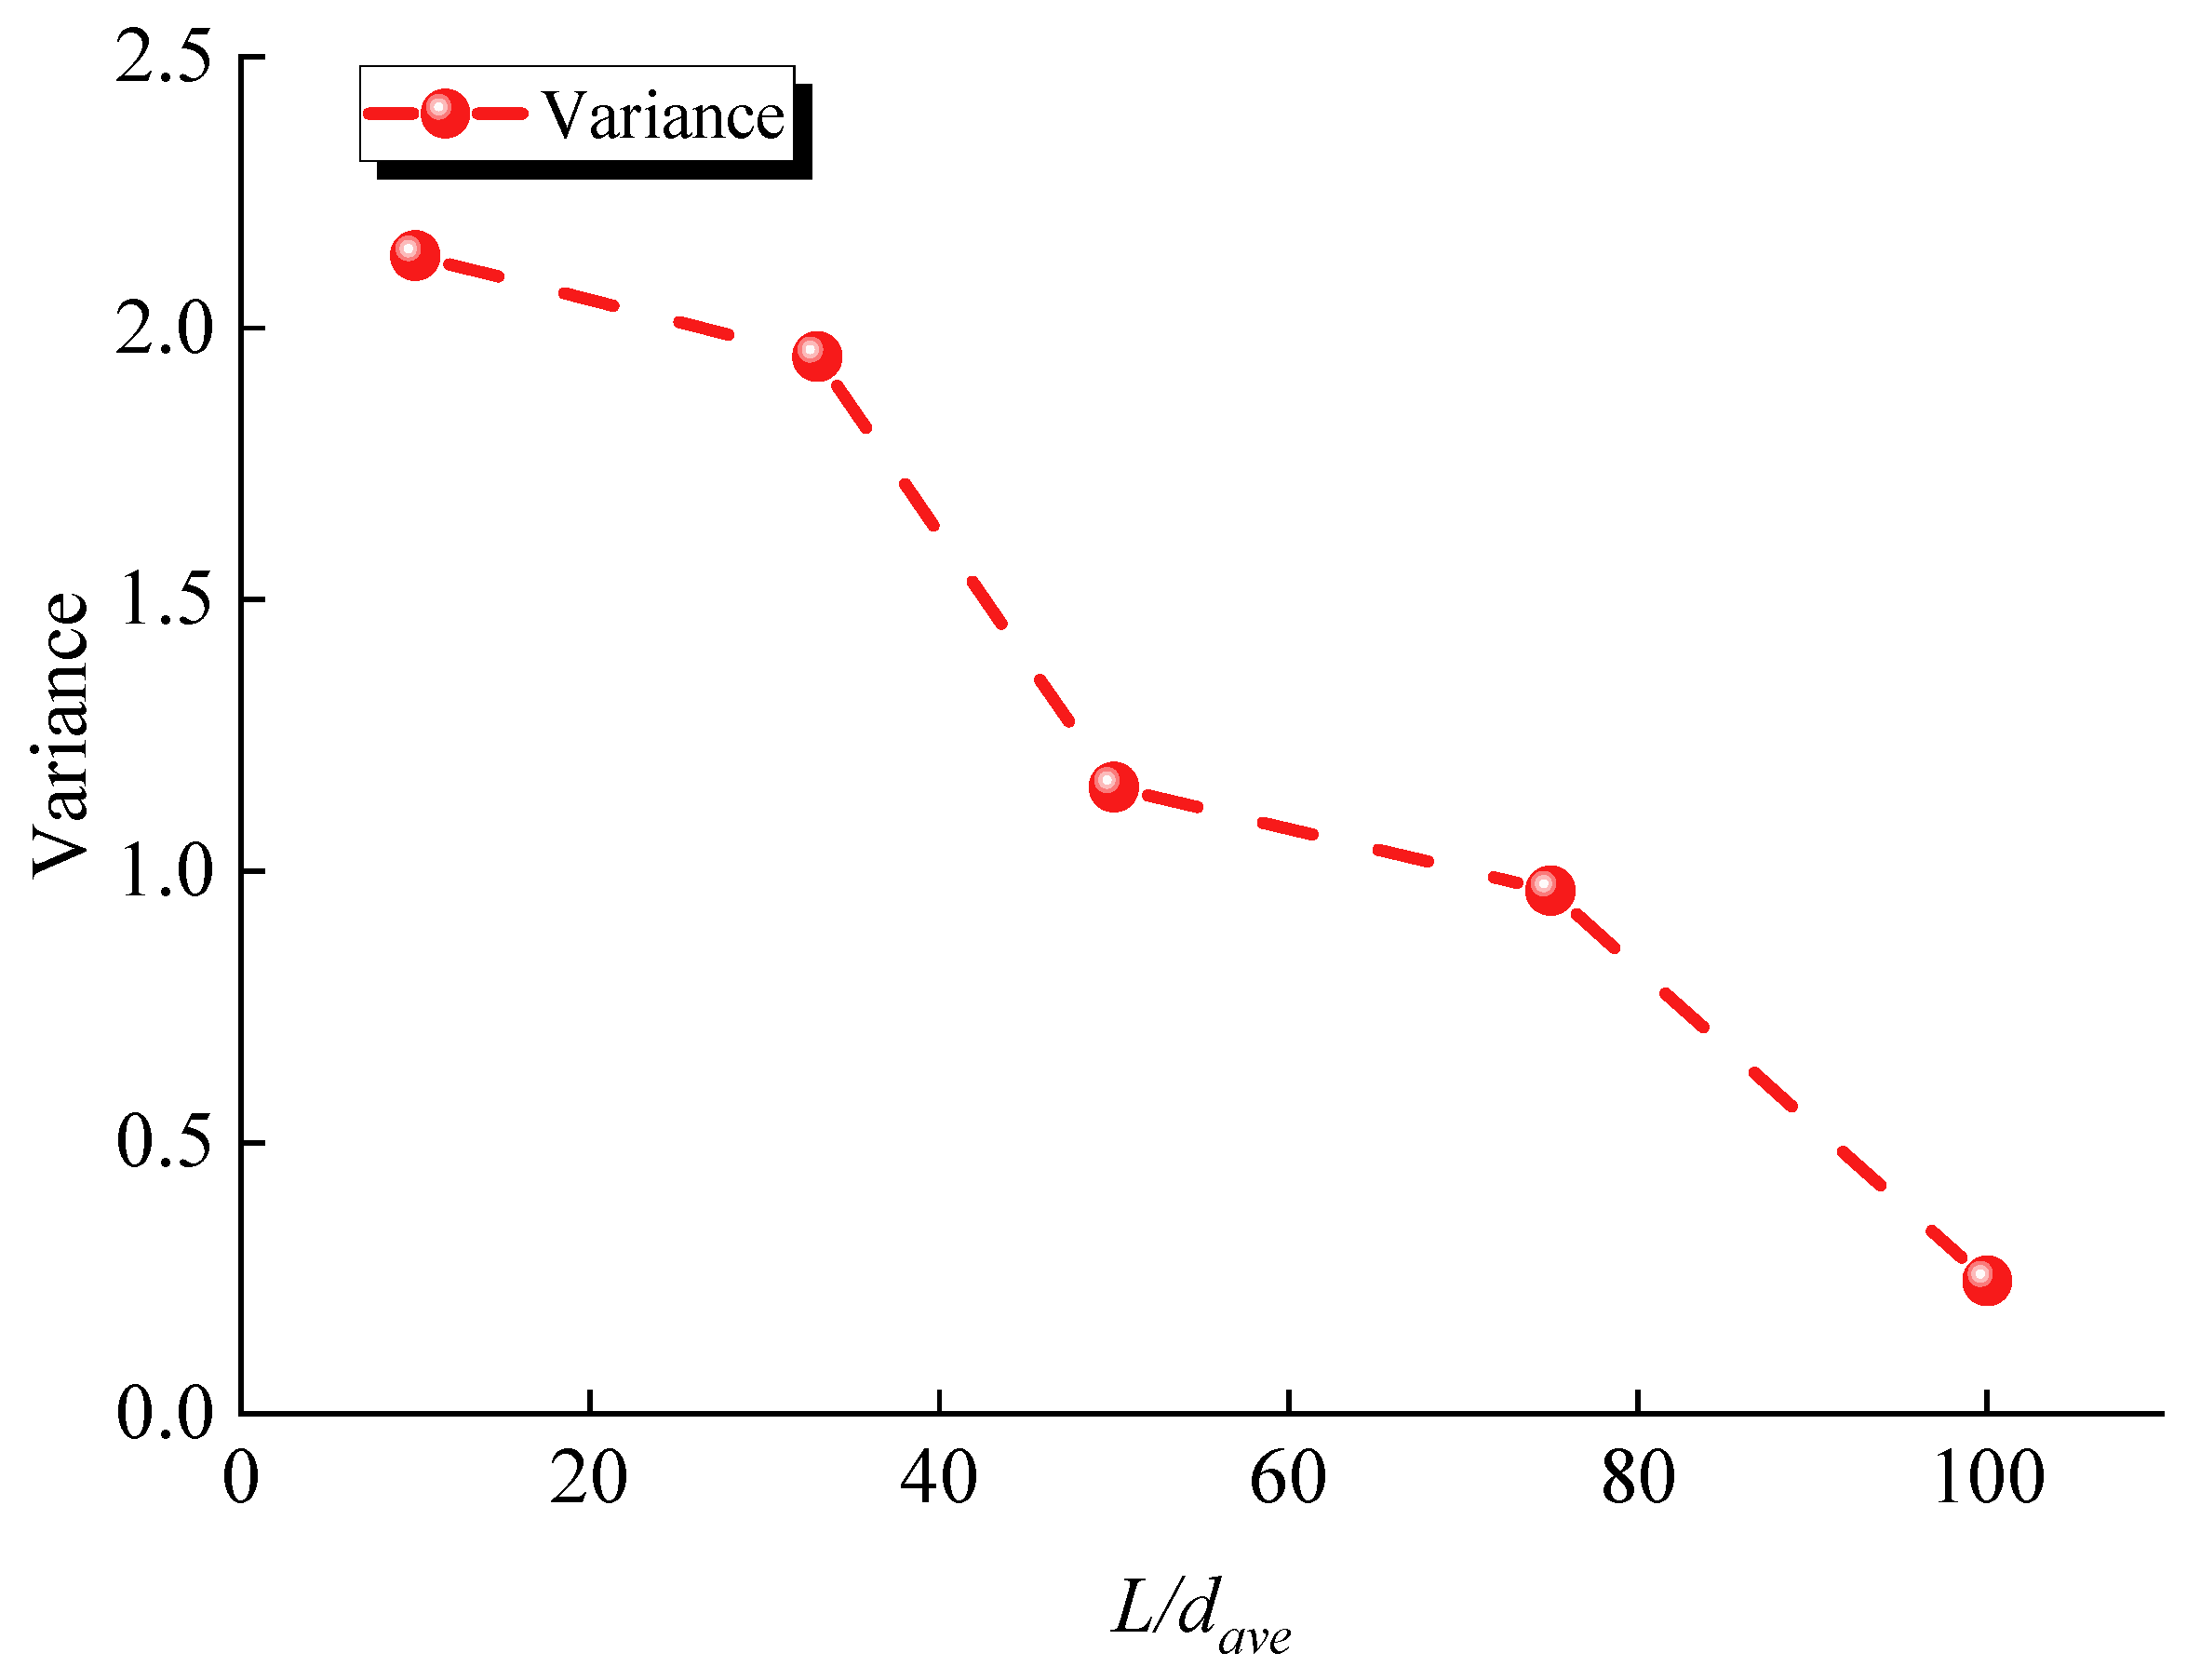
The compressive strength of specimens corresponding to different L/dave is shown in Figure 5. As can be seen from Figure 5, the uniaxial compressive strength increases with a decrease in the particle size, and the average compressive strength increases by 62.7%, from 7.5 MPa to 12.2 MPa. However, the rate of increase gradually decreases when L/dave is greater than 50. In addition, with a decrease in the particle size, the difference in the compressive strength of specimens with different IDs is smaller. This indicates that an increase in L/dave will make the particles denser and more closely related to each other. Figure 6 shows the trend of the compressive strength variance with L/dave. It can be seen that the variance in uniaxial compressive strength gradually decreases with an increase in L/dave. When L/dave increases from 10 to 100, the variance decreases from 2.133 to 0.245, reducing by 88.51%, indicating that the strength dispersion decreases with the increase in L/dave, and specimens tend to be more identical. The compressive strength range corresponding to each L/dave is shown in Table 3. The range decreases with the increase in L/dave, and the percentage of the range of average strength also decreases continuously, falling to 10% when L/dave is 75 and below 5% when L/dave is 100.

2.3. Effect of the Average Particle Size on the Elastic Modulus

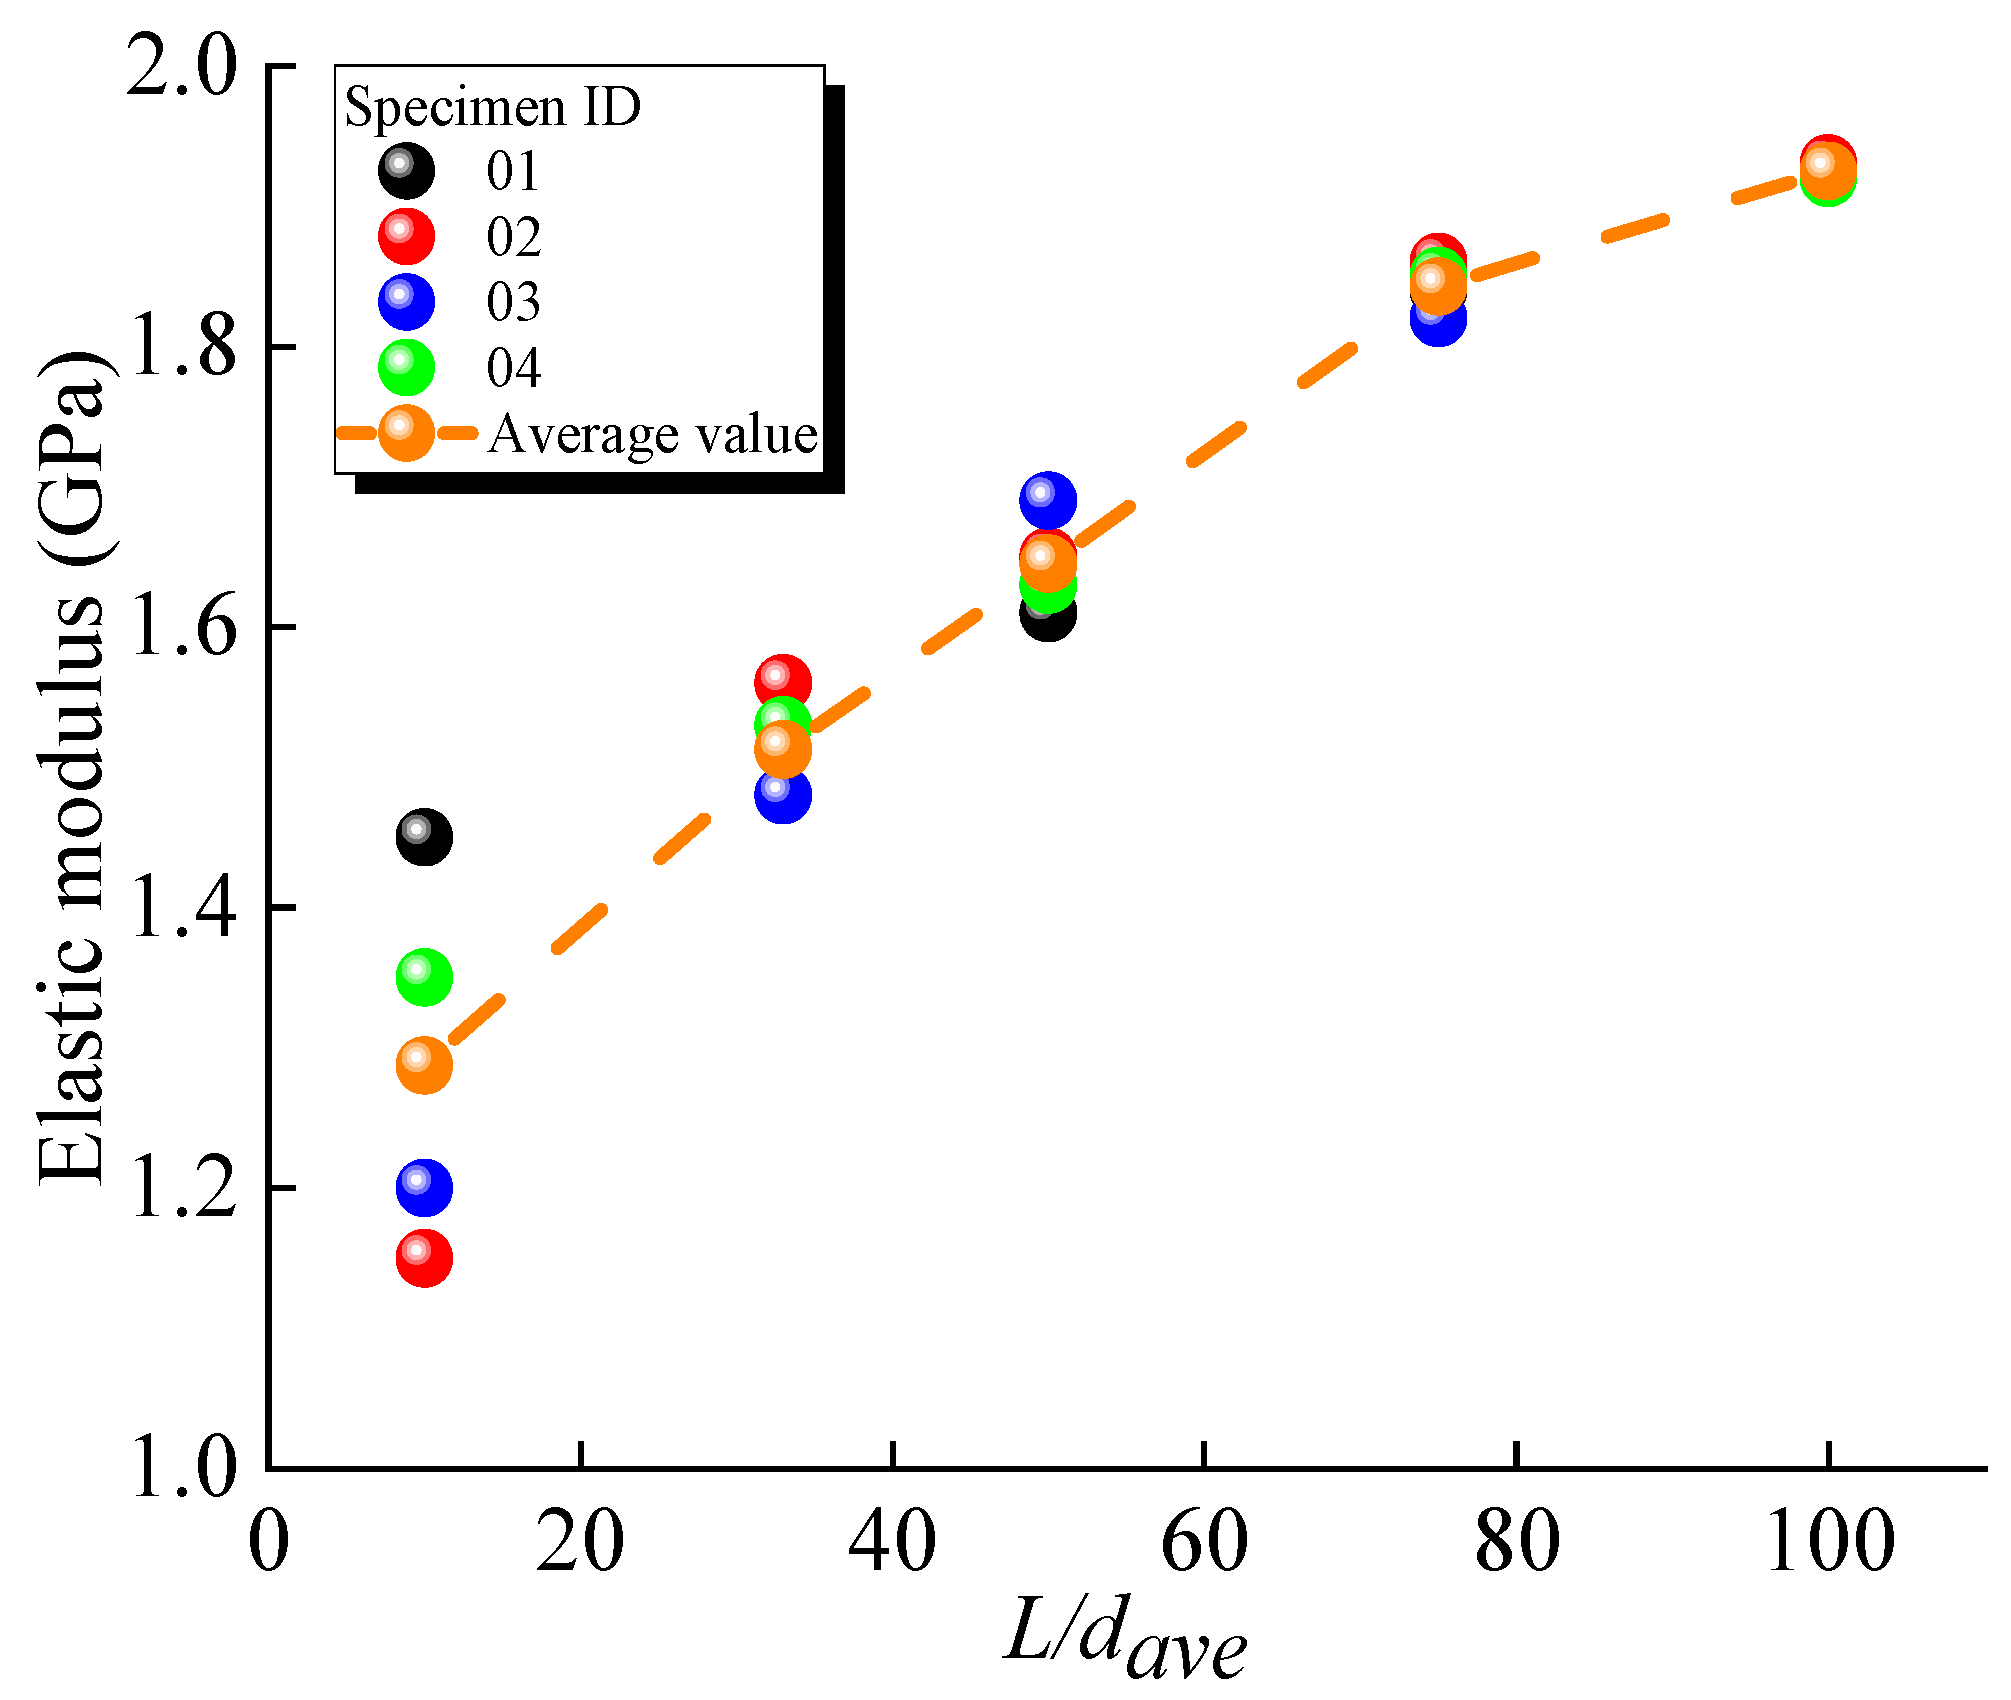
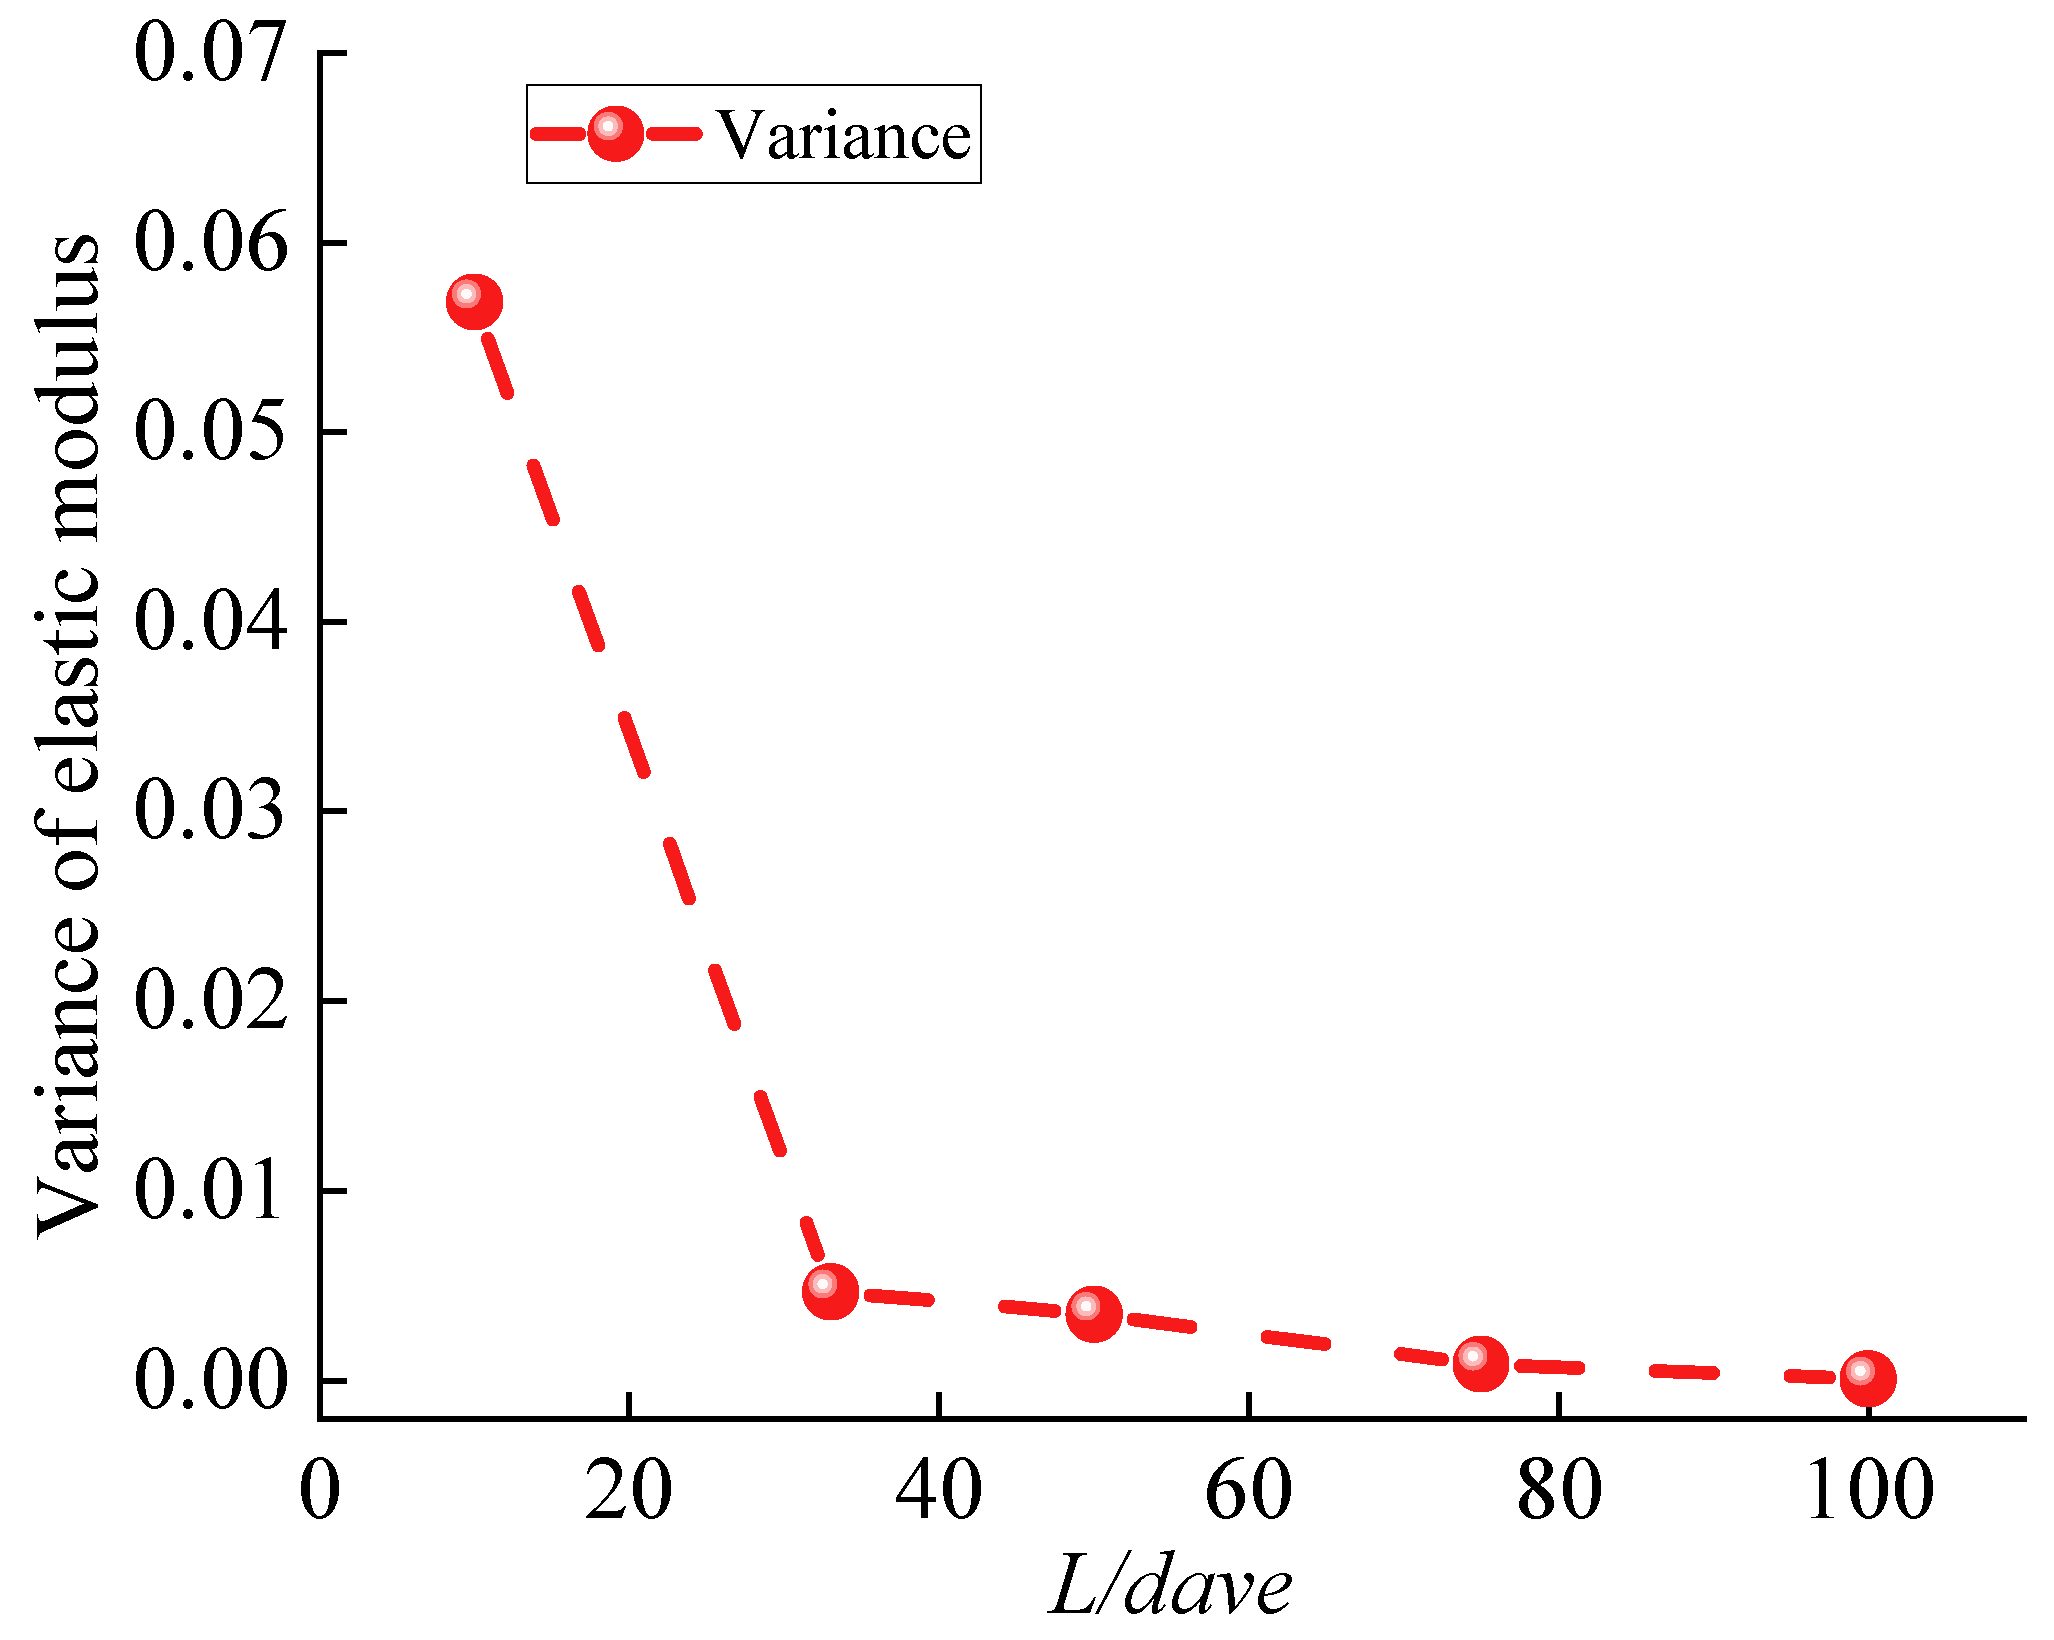
The elastic modulus of each specimen and the relationship between the average modulus and L/dave is shown in Figure 7. The larger the L/dave, the bigger the elastic modulus. When L/dave increases from 10 to 100, the average elastic modulus increases from 1.29 GPa to 1.93 GPa by 49.6. However, the increase rate of the elastic modulus decreases with the increase in L/dave, and the elastic modulus decreases greatly when L/dave is greater than 75. In addition, the larger the L/dave is, the smaller the difference between the elastic modulus of specimens with different IDs. It means that the denser the particles, the smaller the void inside the model, resulting in an increase in the elastic modulus. However, the increase in the elastic modulus is finite. When L/dave is larger, the increase rate of the elastic modulus becomes smaller. Figure 8 shows the variation in the elastic modulus variance with L/dave. It is clear that the larger the L/dave, the smaller the variance in the elastic modulus, and it suddenly decreases to a lower level when L/dave is 33. After that, the variance in the elastic modulus remains at a low level and gradually decreases. The variance in the elastic modulus decreases from the initial 0.057 to 0.0001, indicating that an increase in L/dave will make the specimens gradually tend to be identical, and the influence caused by the particles’ spatial arrangement is gradually weakened. It can be seen in Table 4 that when L/dave is 33, the percentage of range of the average elastic modulus drops to 5%, and when L/dave is 75, it is already lower than 5%, indicating that the larger the L/dave, the smaller the error of the numerical simulation result.
Based on the above analysis, an increase in the particle density leads to an increase in the uniaxial compressive strength and elastic modulus, but the increase speed gradually decreases. This indicates that the contribution of the particle density to the mechanical parameters is limited when the particle density reaches a certain level. The denser the particles, the more the model tends to be uniform and homogeneous, the smaller the dispersion of the test results, and the influence caused by the spatial arrangement of particles gradually decreases. The denser the particles, the more identical the model tends to be. The dispersion of the simulation results become smaller, and the influence caused by the spatial arrangement of particles gradually decreases. In addition, the compressive strength is stable when L/dave is 75, and the corresponding range drops to 10%. In terms of the elastic modulus, when L/dave is 33, the simulation results are relatively stable, and the relevant range drops to 5%. Therefore, considering the simulation accuracy, computer ability, and operation efficiency, when PFC is adopted to carry out uniaxial compression on rock, the L/dave should be greater than 50 as far as possible to obtain universal test results.

2.4. Effect of the Average Particle Size on the Model’s Shear Mechanical Behavior

By changing the random factor, four different numerical models with same particles are generated, which are equivalent to four specimens with the same mechanical properties but different particle spatial arrangements. Four groups of samples numbered 01, 02, 03, and 04 with dimensions of 100 mm × 100 mm are complete rock mass cube samples. After applying different normal stresses (0.5 MPa, 1.0 MPa, 1.5 MPa, 2.0 MPa, and 2.5 MPa) to the four groups of models with different average particle sizes, direct shear tests are carried out. The particle size ratio of model is kept at 1.5, and five different particle size ranges are set, as shown in Table 5.
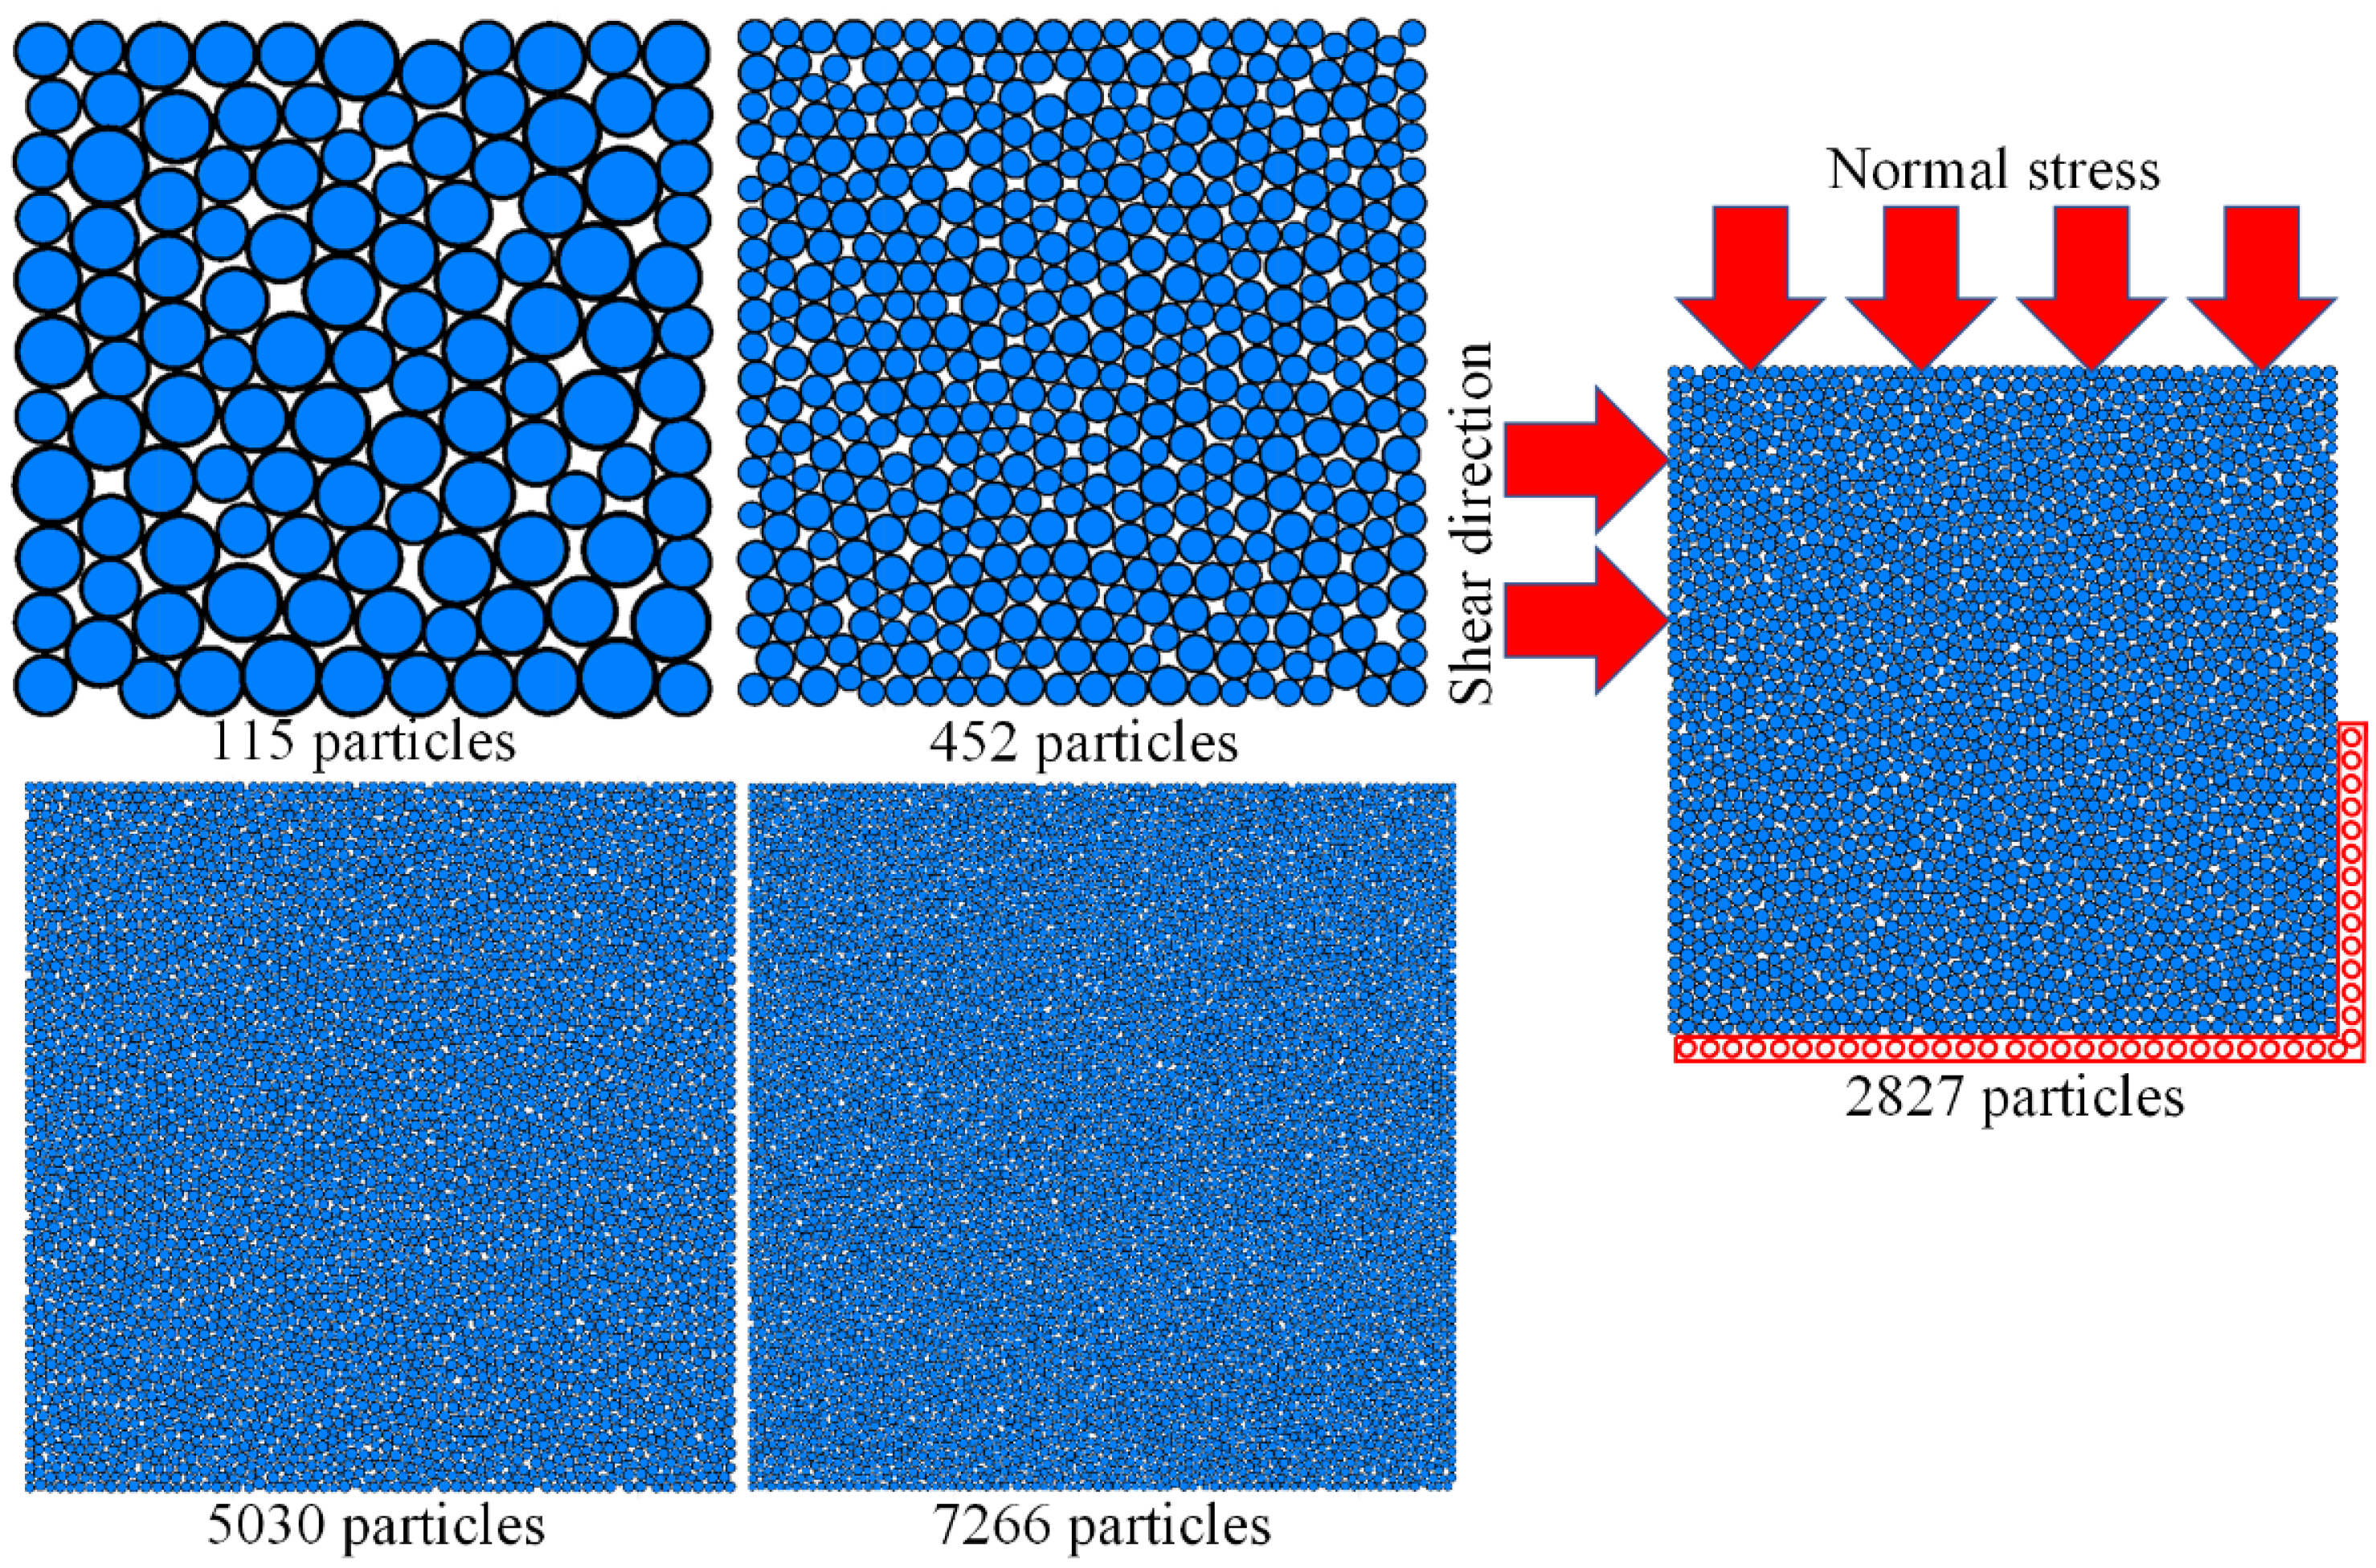
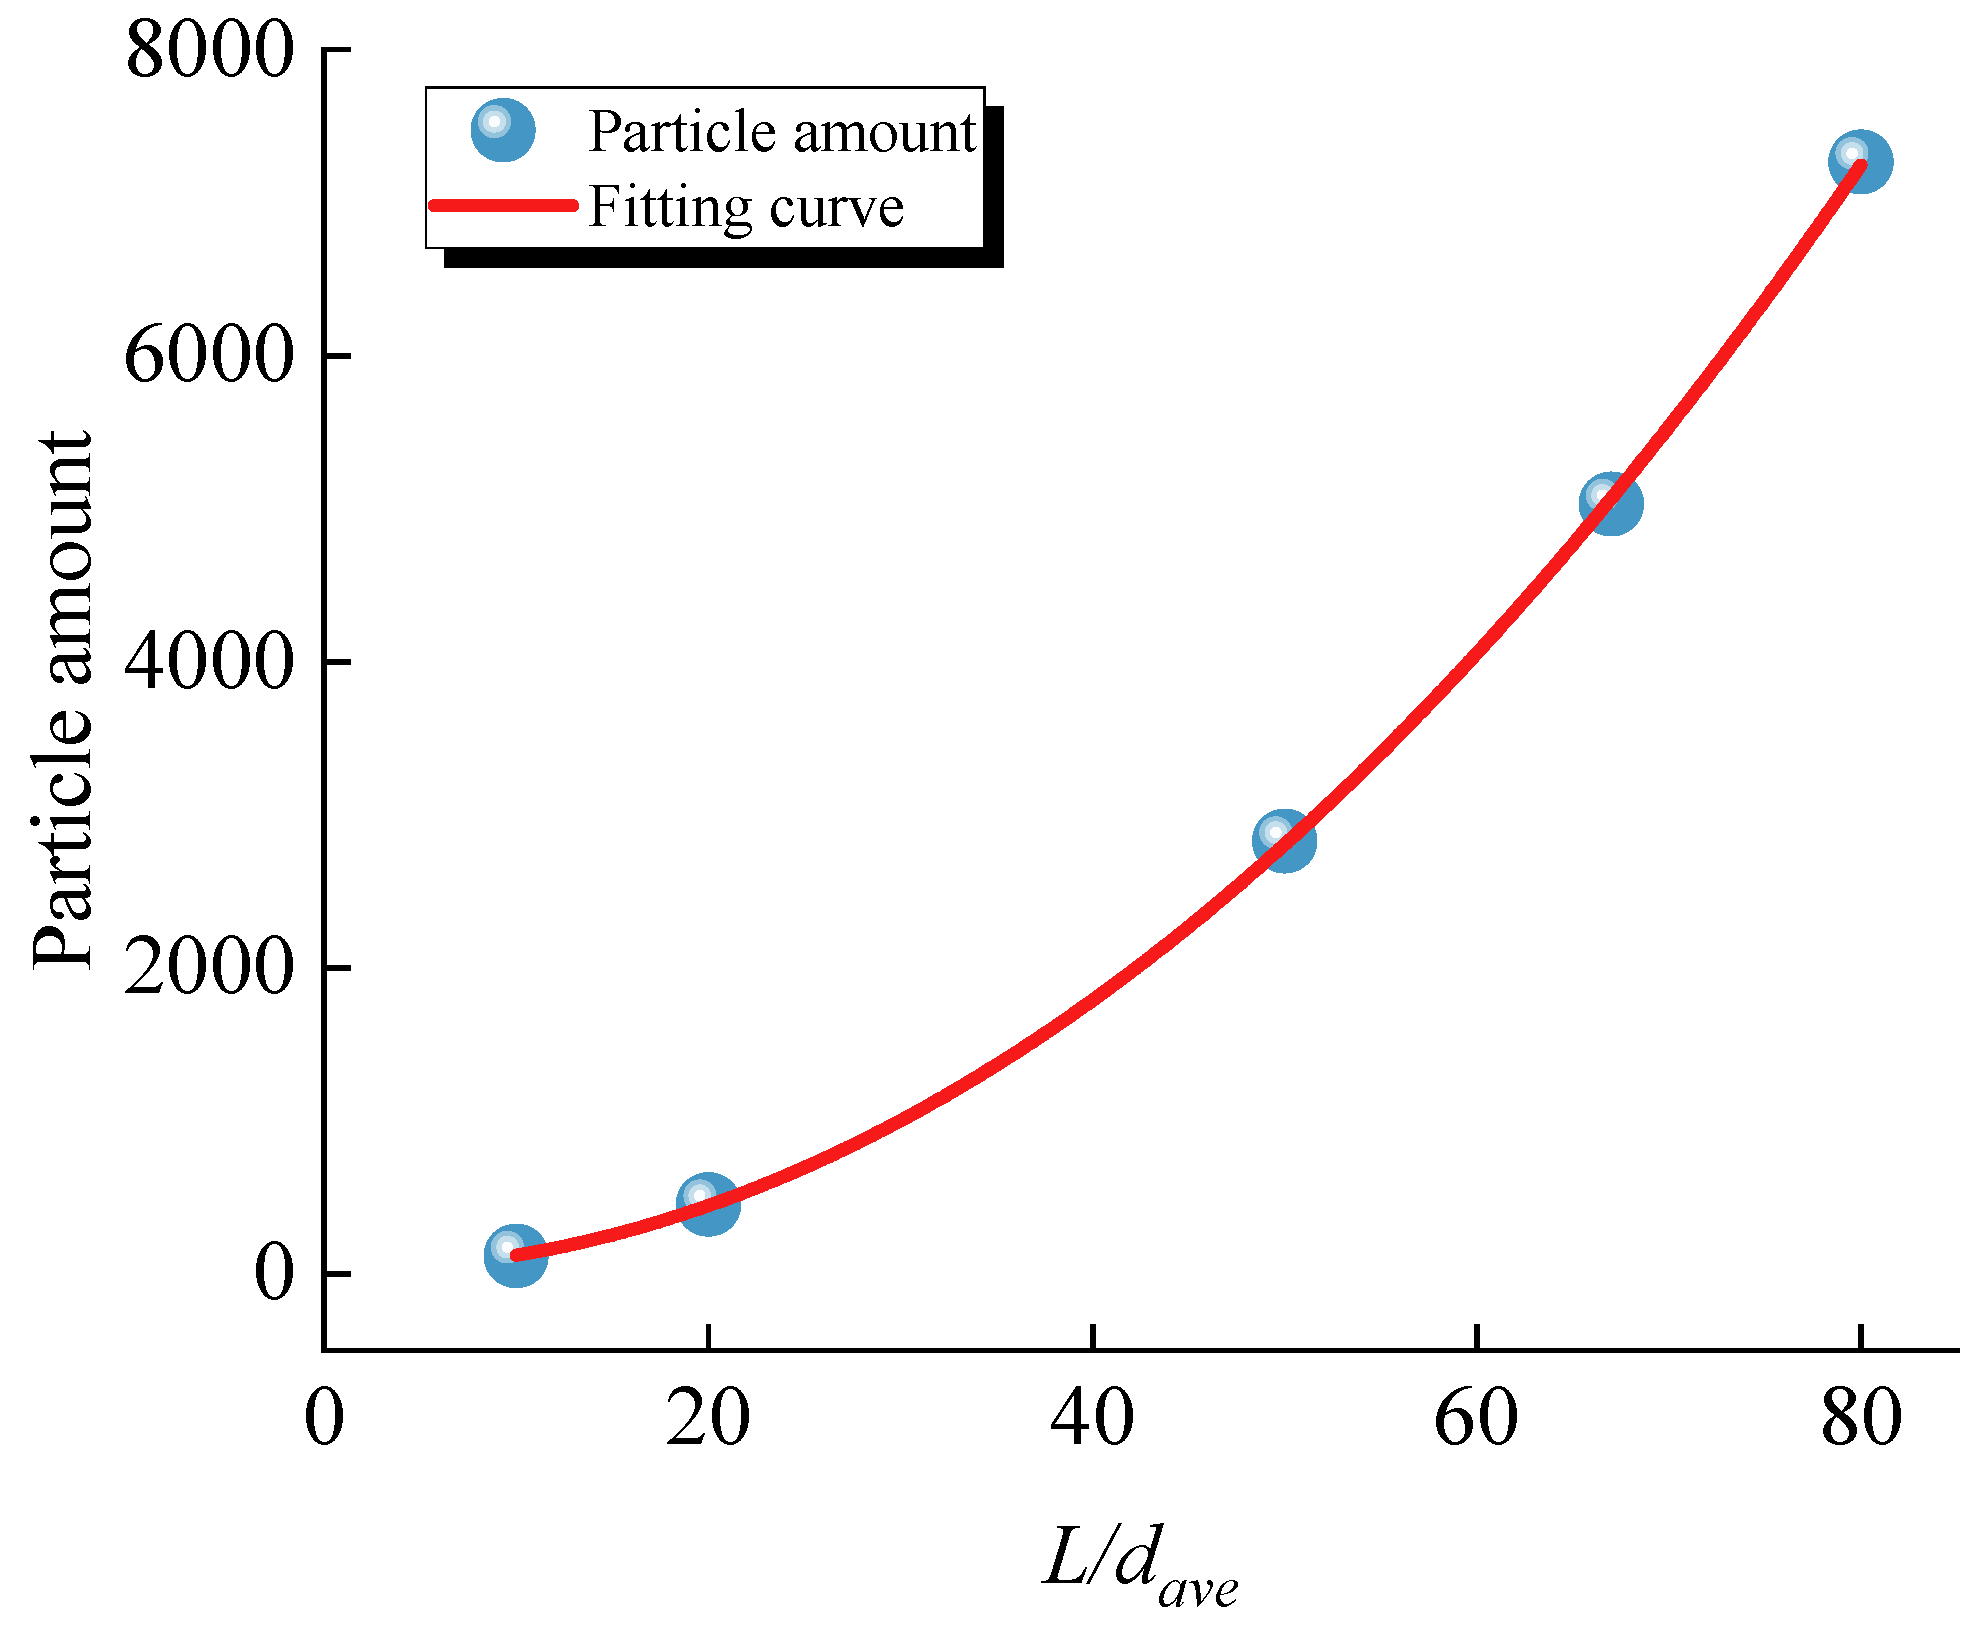
The generated numerical model is shown in Figure 9, and the particle amount corresponding to each L/dave is shown in Figure 10. It can be seen that the amount of particles and the increase speed of the particle amount increase with the increase in L/dave.
The quadratic function is used for fitting and the equation is as follows:
y = 28.5 2.24 x + 1.16 x 2
where y is the number of particles, x is the corresponding L/dave, and the fitting determination coefficient R2 is 0.99994, indicating that the relationship of the particle amount in the cube model with L/dave can be predicted by fitting the quadratic polynomial equation.
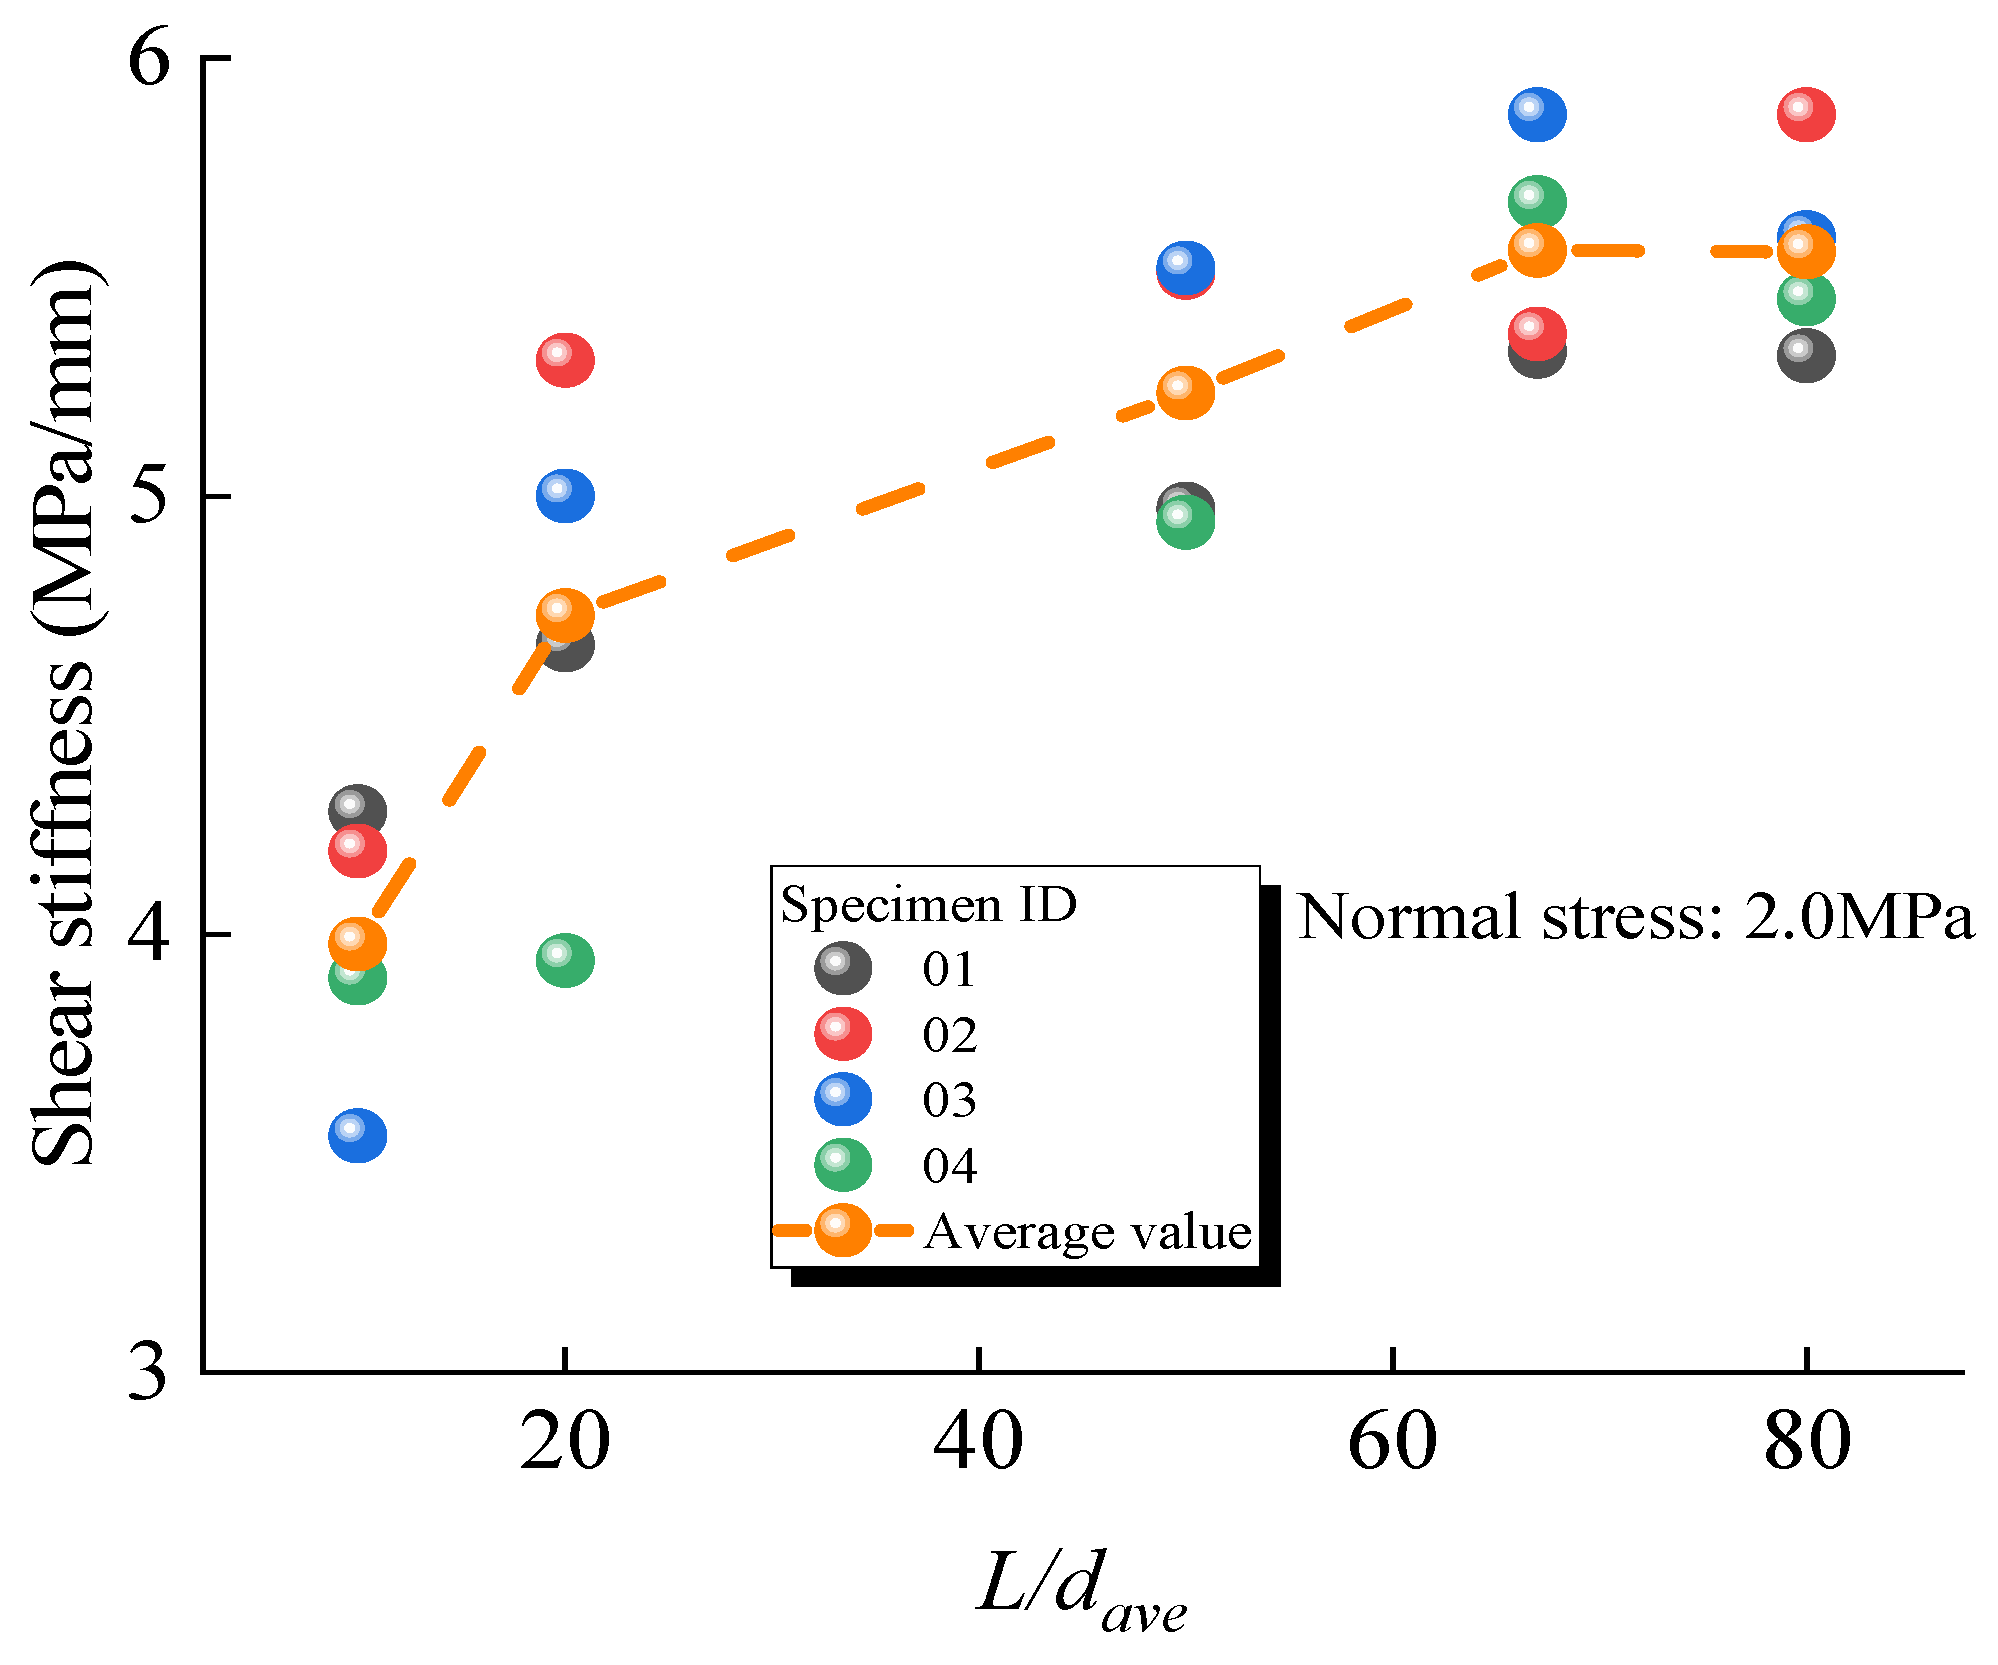
For models under a normal stress of 2.0 MPa, the relationship between their shear stiffness and L/dave is plotted in Figure 11. The average shear stiffness of the four groups of models with different normal stresses and L/dave are shown in Table 6. It can be seen from Figure 11 that under a normal stress of 2.0 MPa, the shear stiffness gradually increases with the increase in L/dave, and the average shear stiffness increases from 3.98 MPa/mm to 5.56 MPa/mm, with a growth rate of 39.7%. The increasing trend of shear stiffness slows down with the increase in L/dave. When L/dave is greater than 67, the shear stiffness basically no longer increases, indicating that the influence of L/dave on shear stiffness is limited. When L/dave reaches a certain value, the shear stiffness will no longer increase. This is because under the premise of a fixed model size, when L/dave is low, the size of the particles is larger, resulting in a higher porosity and a lower shear stiffness under shear loading. With the increase in L/dave and the decrease in the particle size, the internal void ratio decreases, resulting in an increase in shear stiffness. However, the internal void ratio cannot be reduced indefinitely, and so the increasing rate of shear stiffness also gradually decreases, and, finally, it can only increase slightly or even stop increasing with the increase in L/dave. It can be seen from Table 5 that when L/dave increases from 10 to 80, the shear stiffness also increases, and the increasing ratio of average shear stiffness ranges from 30% to 50%.
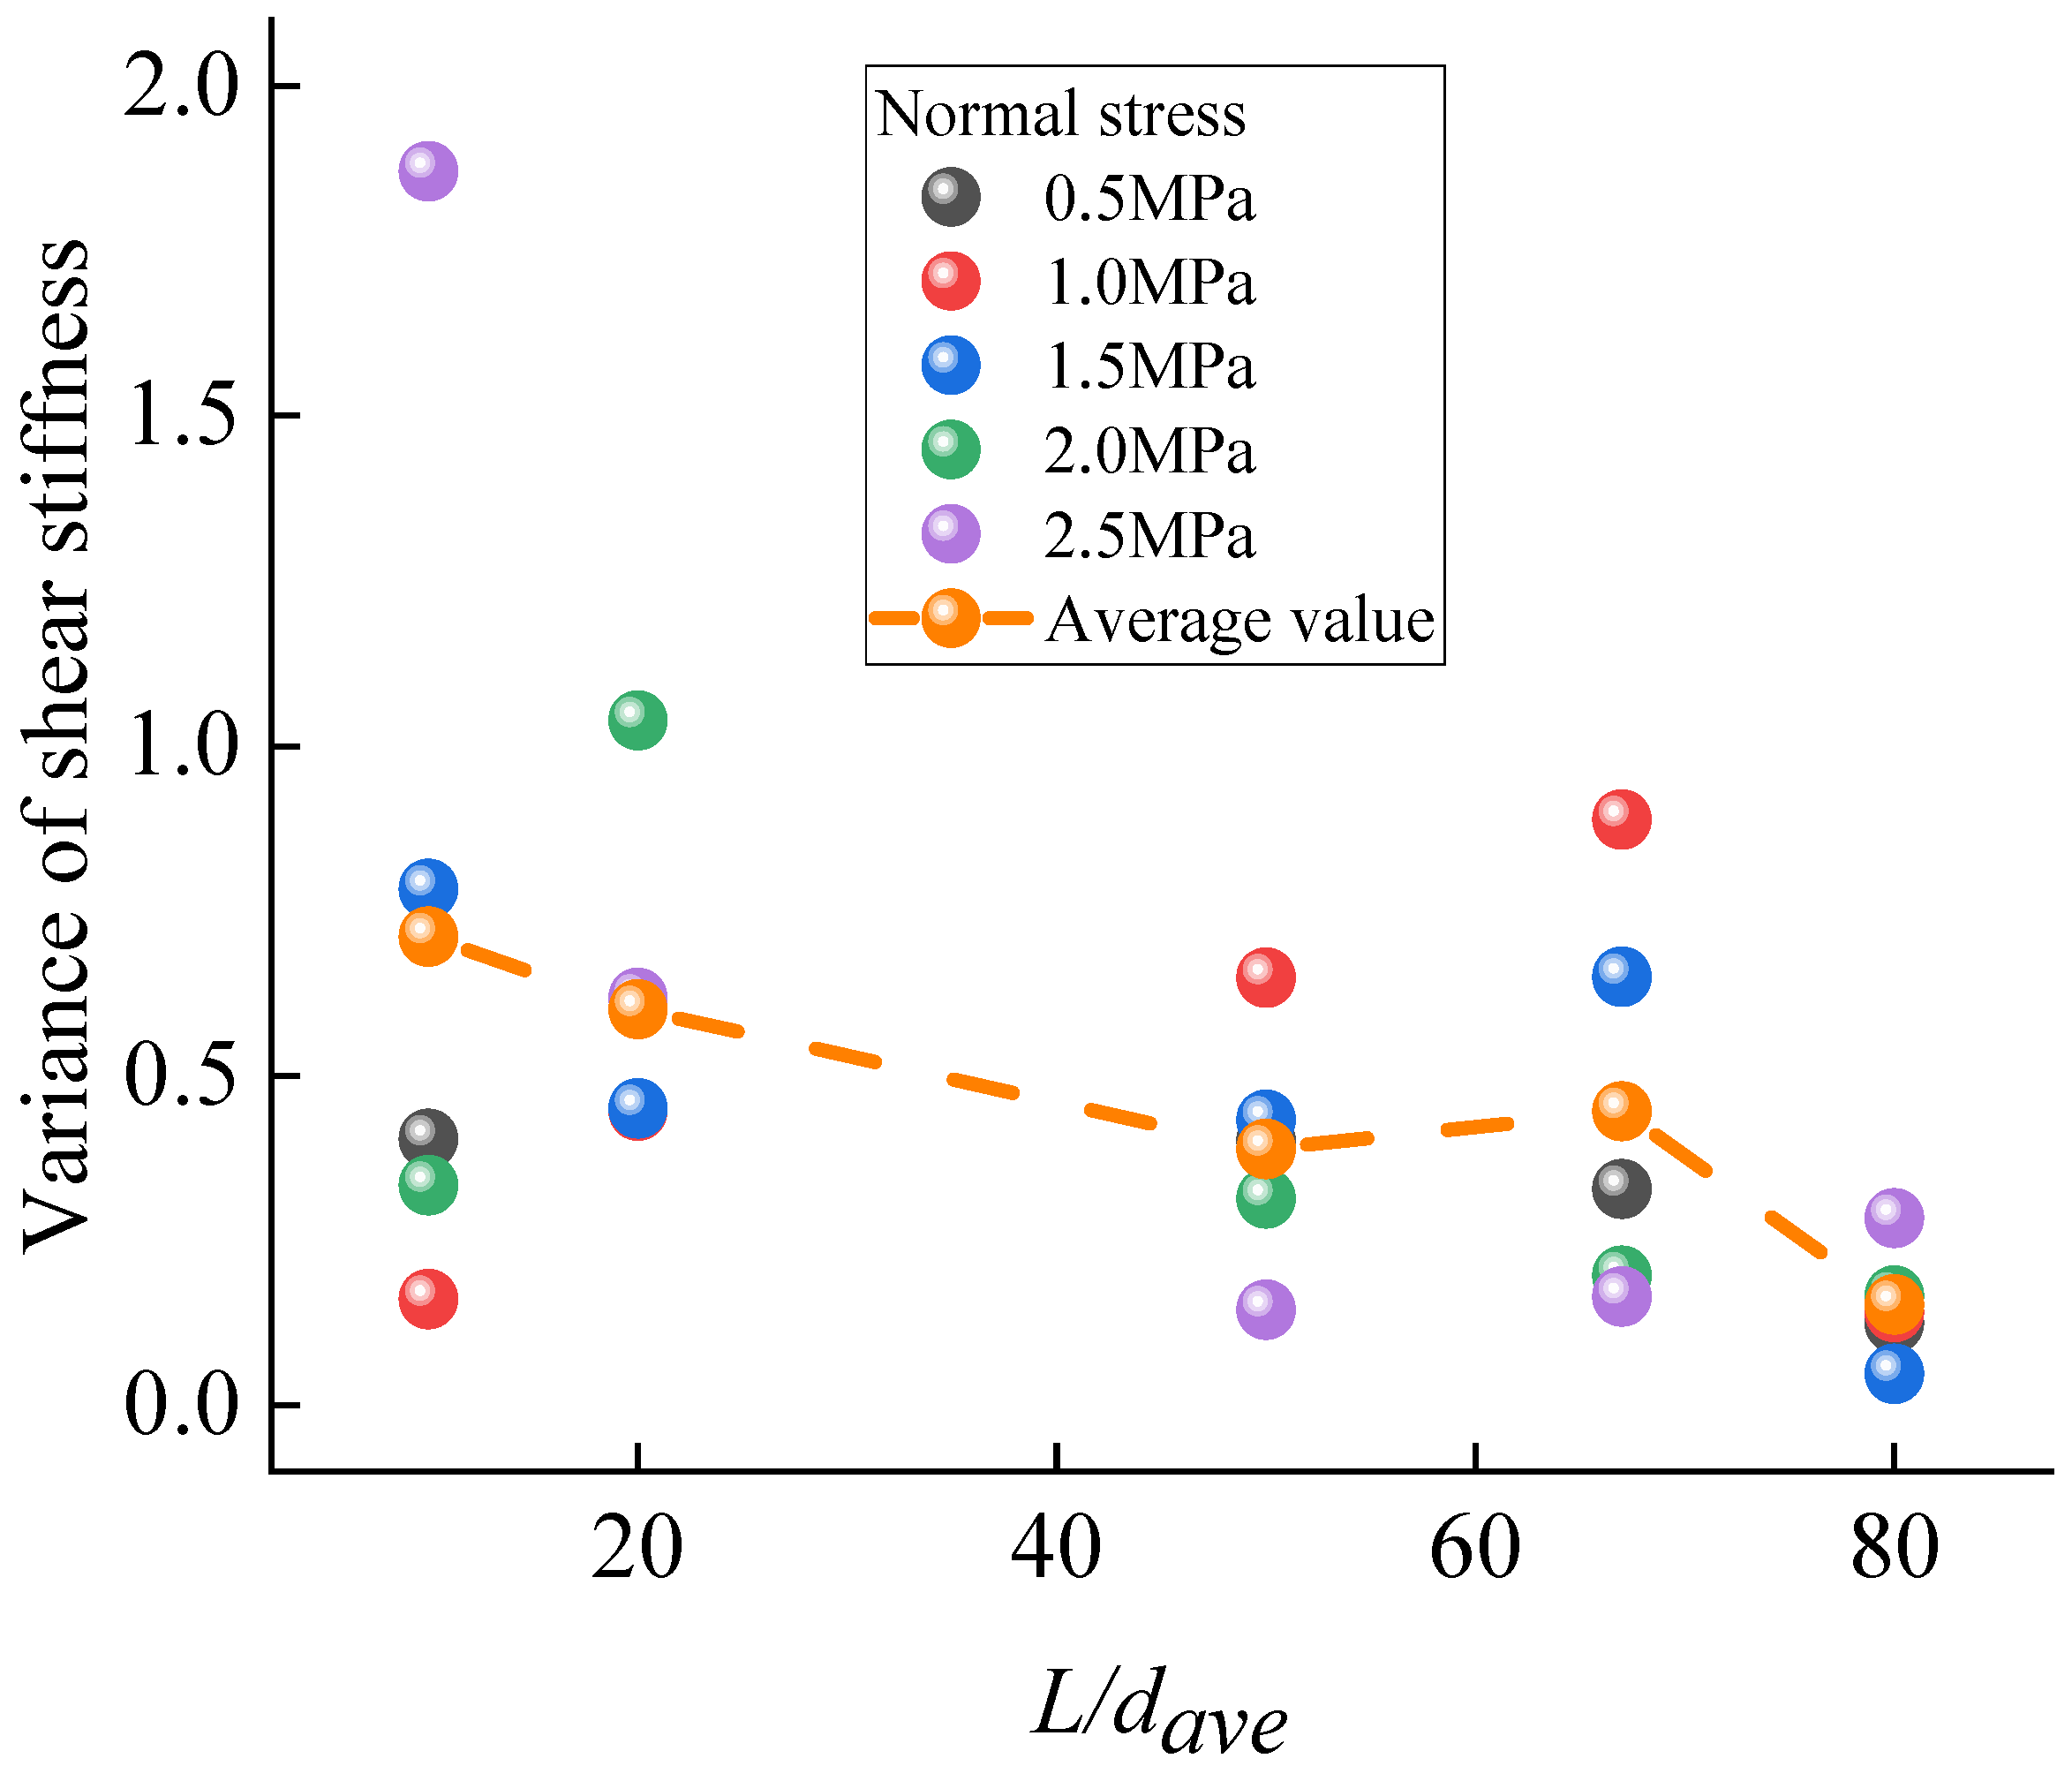
In order to analyze the discretization of the shear stiffness of specimens with different L/dave, the relationship between the shear stiffness variance of specimens under different normal stress levels and L/dave is shown in Figure 12. It is found that the average variance in the shear stiffness decreases gradually with the increase in L/dave, from 0.71 to 0.15, with a decrease of 71.87%. The variance in the shear stiffness of specimens under different normal stress levels fluctuates with the variation in L/dave, but generally shows a decreasing trend. When L/dave equals 10, the variance in the shear stiffness ranges from 0.16 to 1.87. The maximum difference is 1.71, which reflects that normal stress has a strong influence on the dispersion of shear stiffness. However, with the increase in L/dave, the difference in the variance of shear stiffness for specimens under different normal stress levels gradually decreases. When L/dave is 80, the maximum variance difference is only 0.16, indicating that the dispersion decreases gradually. This means that the difference in shear stiffness for specimens with different IDs will be smaller and the results will be more accurate. This is also because when the model size is unchanged, the increase in L/dave reduces the particle size, weakens the influence of the particle spatial distribution difference, and then the model becomes more homogeneous and identical.

2.5. Discussion

The increases in uniaxial compressive strength and elastic modulus with decreasing particle size (increasing L/dave) can be attributed to the denser packing of particles within the model. As the particle size decreases, the number of particles increases, leading to a more uniform and homogeneous distribution of stress within the model. This results in a higher compressive strength and elastic modulus. The underlying mechanism can be explained by the enhanced inter-particle interactions and bonding strength due to the higher surface area-to-volume ratio of smaller particles. Additionally, the denser packing reduces the void ratio within the model, resulting in a more homogeneous microstructure where stress is more evenly distributed. Consequently, the model exhibits higher stiffness and strength. However, the rate of increase in these properties decreases as L/dave exceeds 50, suggesting that beyond a certain level of particle density, the contribution to the mechanical properties becomes limited due to the saturation of inter-particle interactions and the diminishing effect of further reducing the void ratio.
The observed decreases in the dispersion of compressive strength, elastic modulus, and shear stiffness with increasing L/dave indicate that the influence of the particles’ spatial arrangement diminishes as the particle size decreases. Smaller particles can more effectively fill the voids within the model, reducing the variability in mechanical behavior caused by differences in the particle arrangement. This leads to a more uniform stress distribution, resulting in a lower dispersion of the mechanical properties. As the particle size decreases, the model becomes less sensitive to the spatial arrangement of particles, which can adapt to the applied stress more uniformly, reducing the impact of local variations in the particle distribution. When L/dave reaches 75, the compressive strength stabilizes, and the corresponding range drops to 10%. For the elastic modulus, the simulation results become relatively stable when L/dave is 33, with the relevant range dropping to 5%. These findings suggest that setting L/dave greater than 50 can ensure more reliable numerical simulation results.
The increase in shear stiffness with decreasing particle size can be explained by the reduction in the internal void ratio within the model. As the particle size decreases, the model becomes denser, leading to higher shear stiffness. The underlying mechanism involves the enhanced interlocking of smaller particles, which provides greater resistance to shear deformation. Additionally, the denser packing of smaller particles enhances the microstructural stability of the model, reducing the deformation under shear loading. However, the rate of increase in shear stiffness slows down as L/dave exceeds 67, indicating that the effect of the particle size on shear stiffness is limited. This is consistent with the observation that the internal void ratio cannot be reduced indefinitely, and thus the increase in shear stiffness is finite.

3. Effect of the Particle Size Ratio on the Macroscopic Mechanical Behavior

The particle, as the basic unit of the model, and its geometric parameters are affected not only by the particle size range but also by the particle size ratio. As can be seen from the previous section, on the premise of maintaining the model size and particle size ratio, changing the particle size will lead to variations in the mechanical properties of the model. The model size and average particle size are kept unchanged, with an average particle radius of 0.75 mm. Through changing the particle size ratio Rmas/Rmin, the influence of the particle size ratio variation on the macroscopic mechanical behavior of the model is studied. Models with five different particle size ratios are generated, with particle size ratios Rmas/Rmin of 1.0, 1.2, 2.0, 2.5, and 4.0, respectively. The uniaxial compression numerical simulation test and direct shear numerical simulation test are carried out on models with these five particle size ratios.

3.1. Effect of the Particle Size Ratio on the Models’ Uniaxial Compression Mechanical Behavior

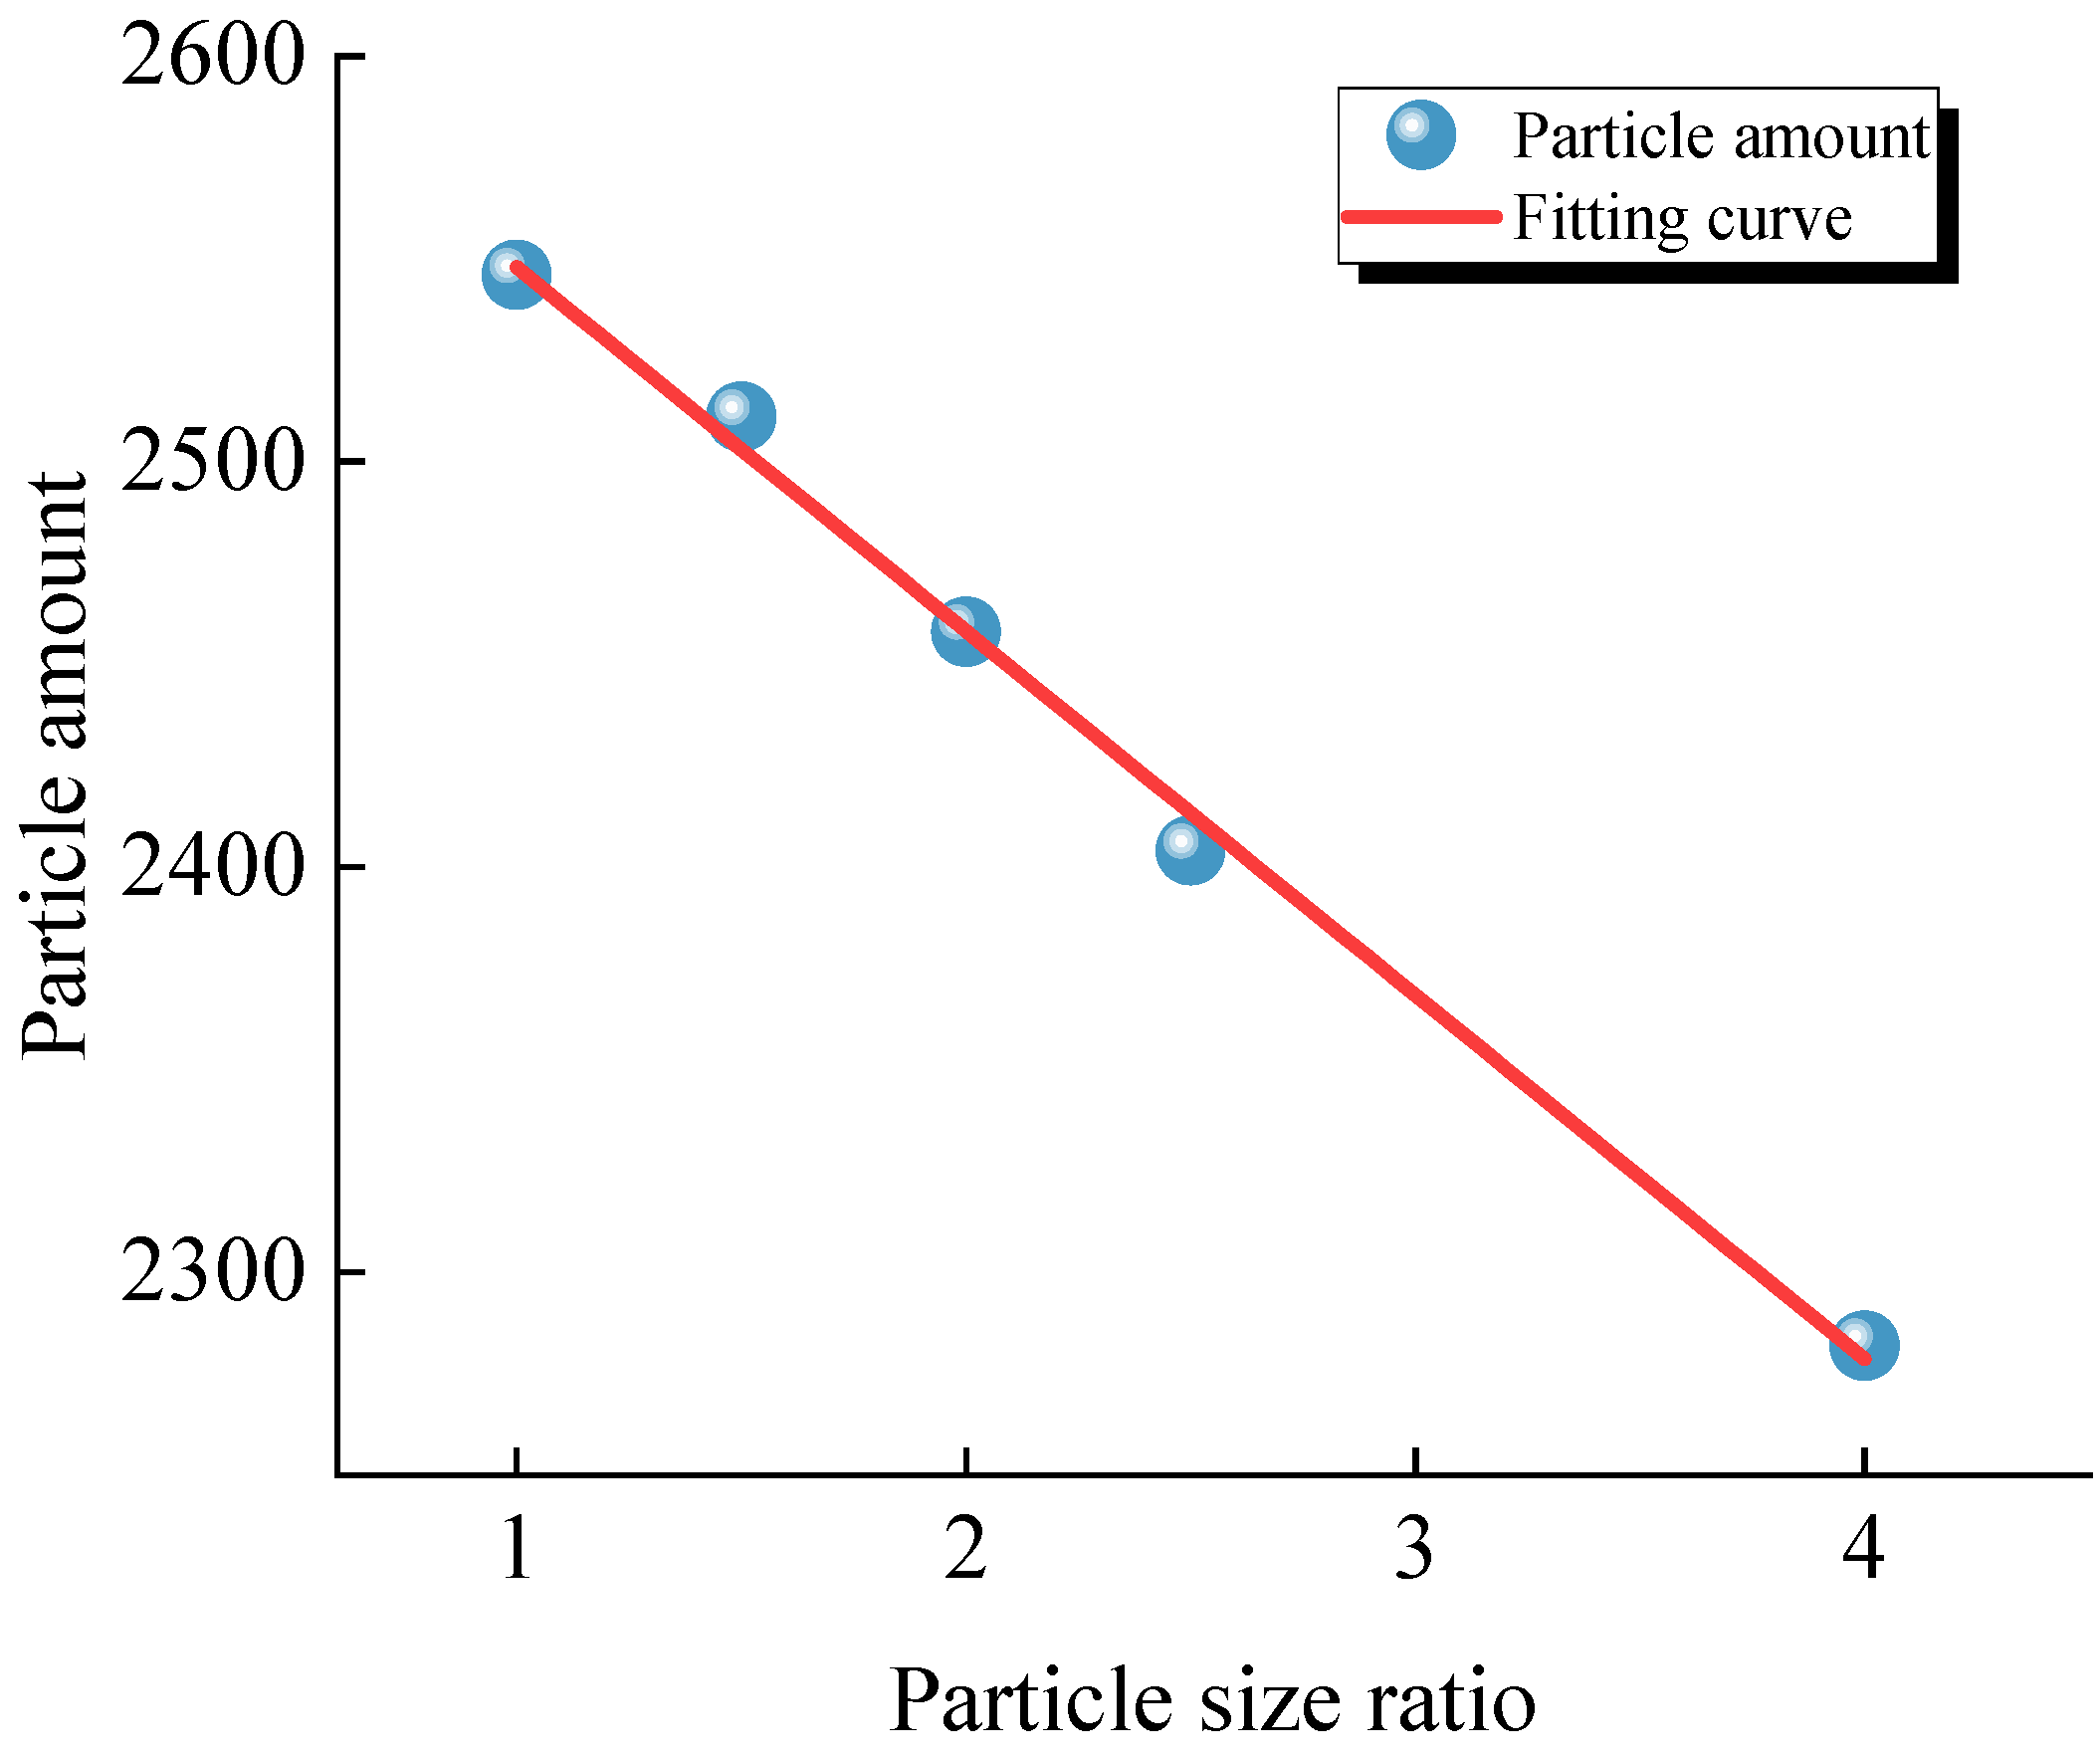
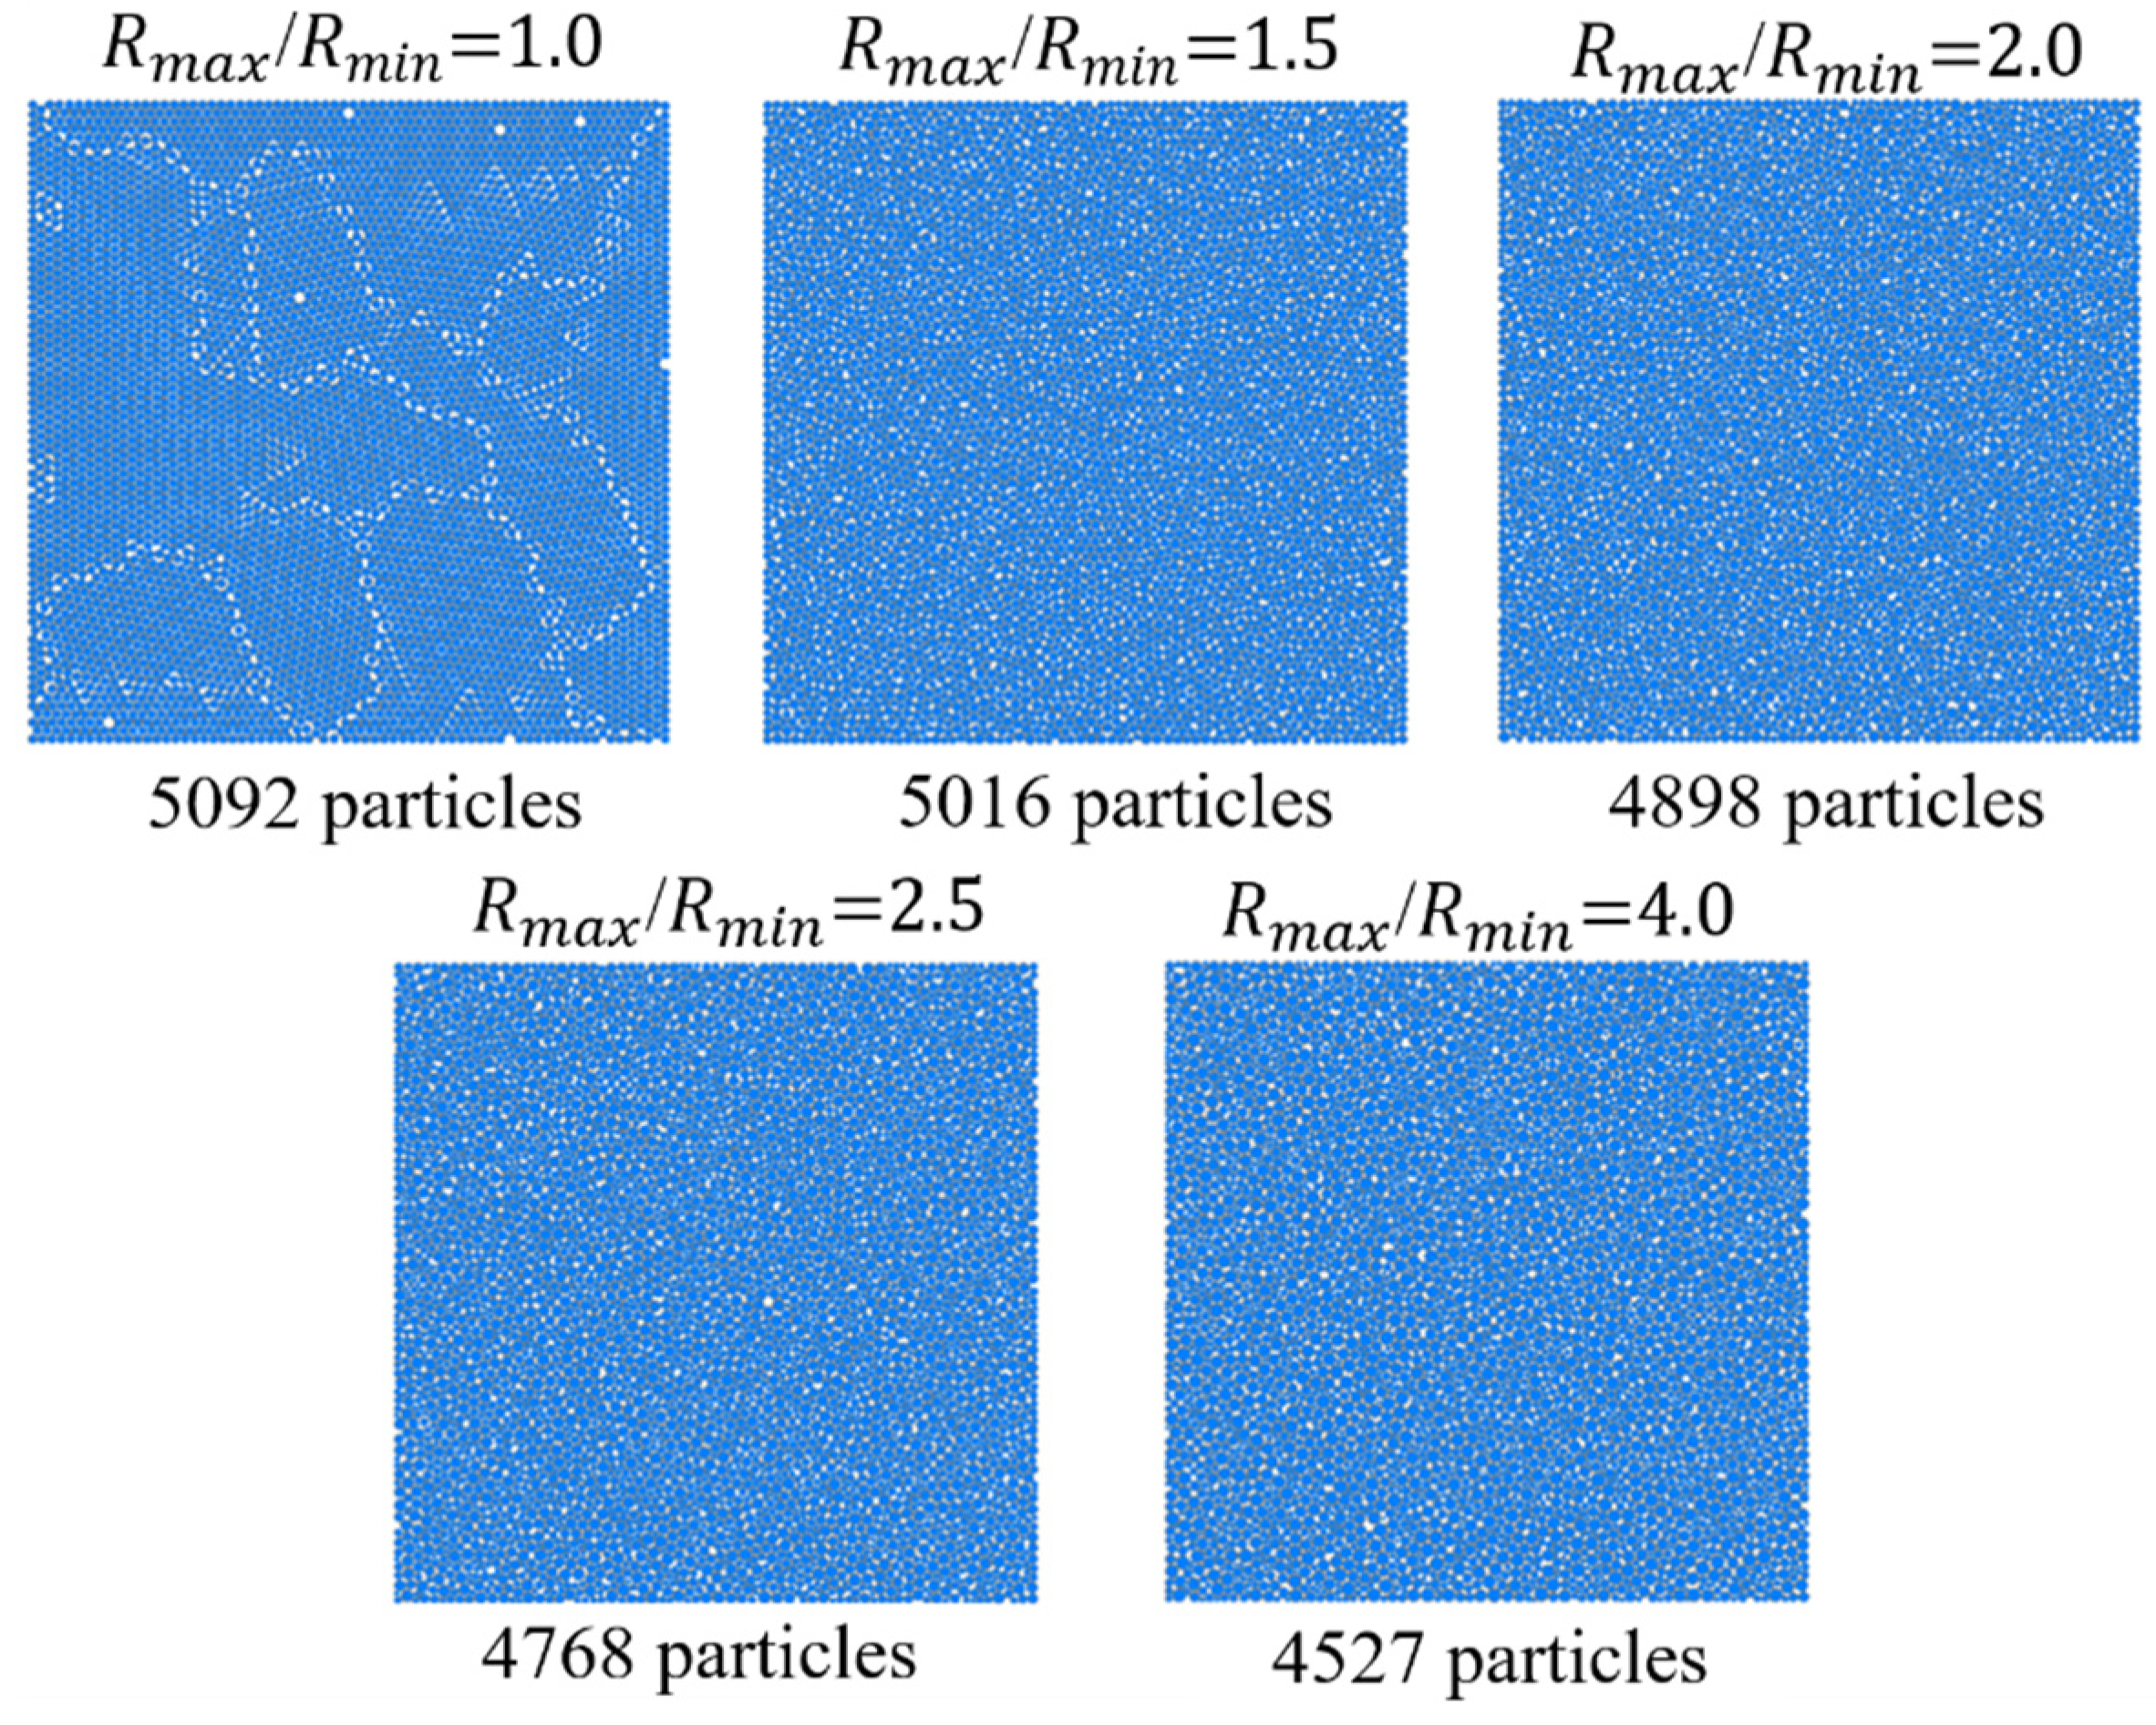
The generated models’ particle size parameters are shown in Table 7, and the generated models are shown in Figure 13. By changing the random factor, four groups of specimens with different particle spatial arrangements and identical contact properties are generated for repeated experiments. The relationship between the particle amount and particle size ratio is shown in Figure 14.
From Figure 13, it can be found that, except for the model with particle size ratio of 1.0, the particle gradation of other models is well graded and can be densely bonded together. When the particle size ratio is 1.0, the particle size is same, which creates large voids during model generation and affects the integrity of the model. Therefore, in most of the models that do not specify the particle gradation, the particle size ratio is generally from 1.5 to 2.0, according to the empirical value.
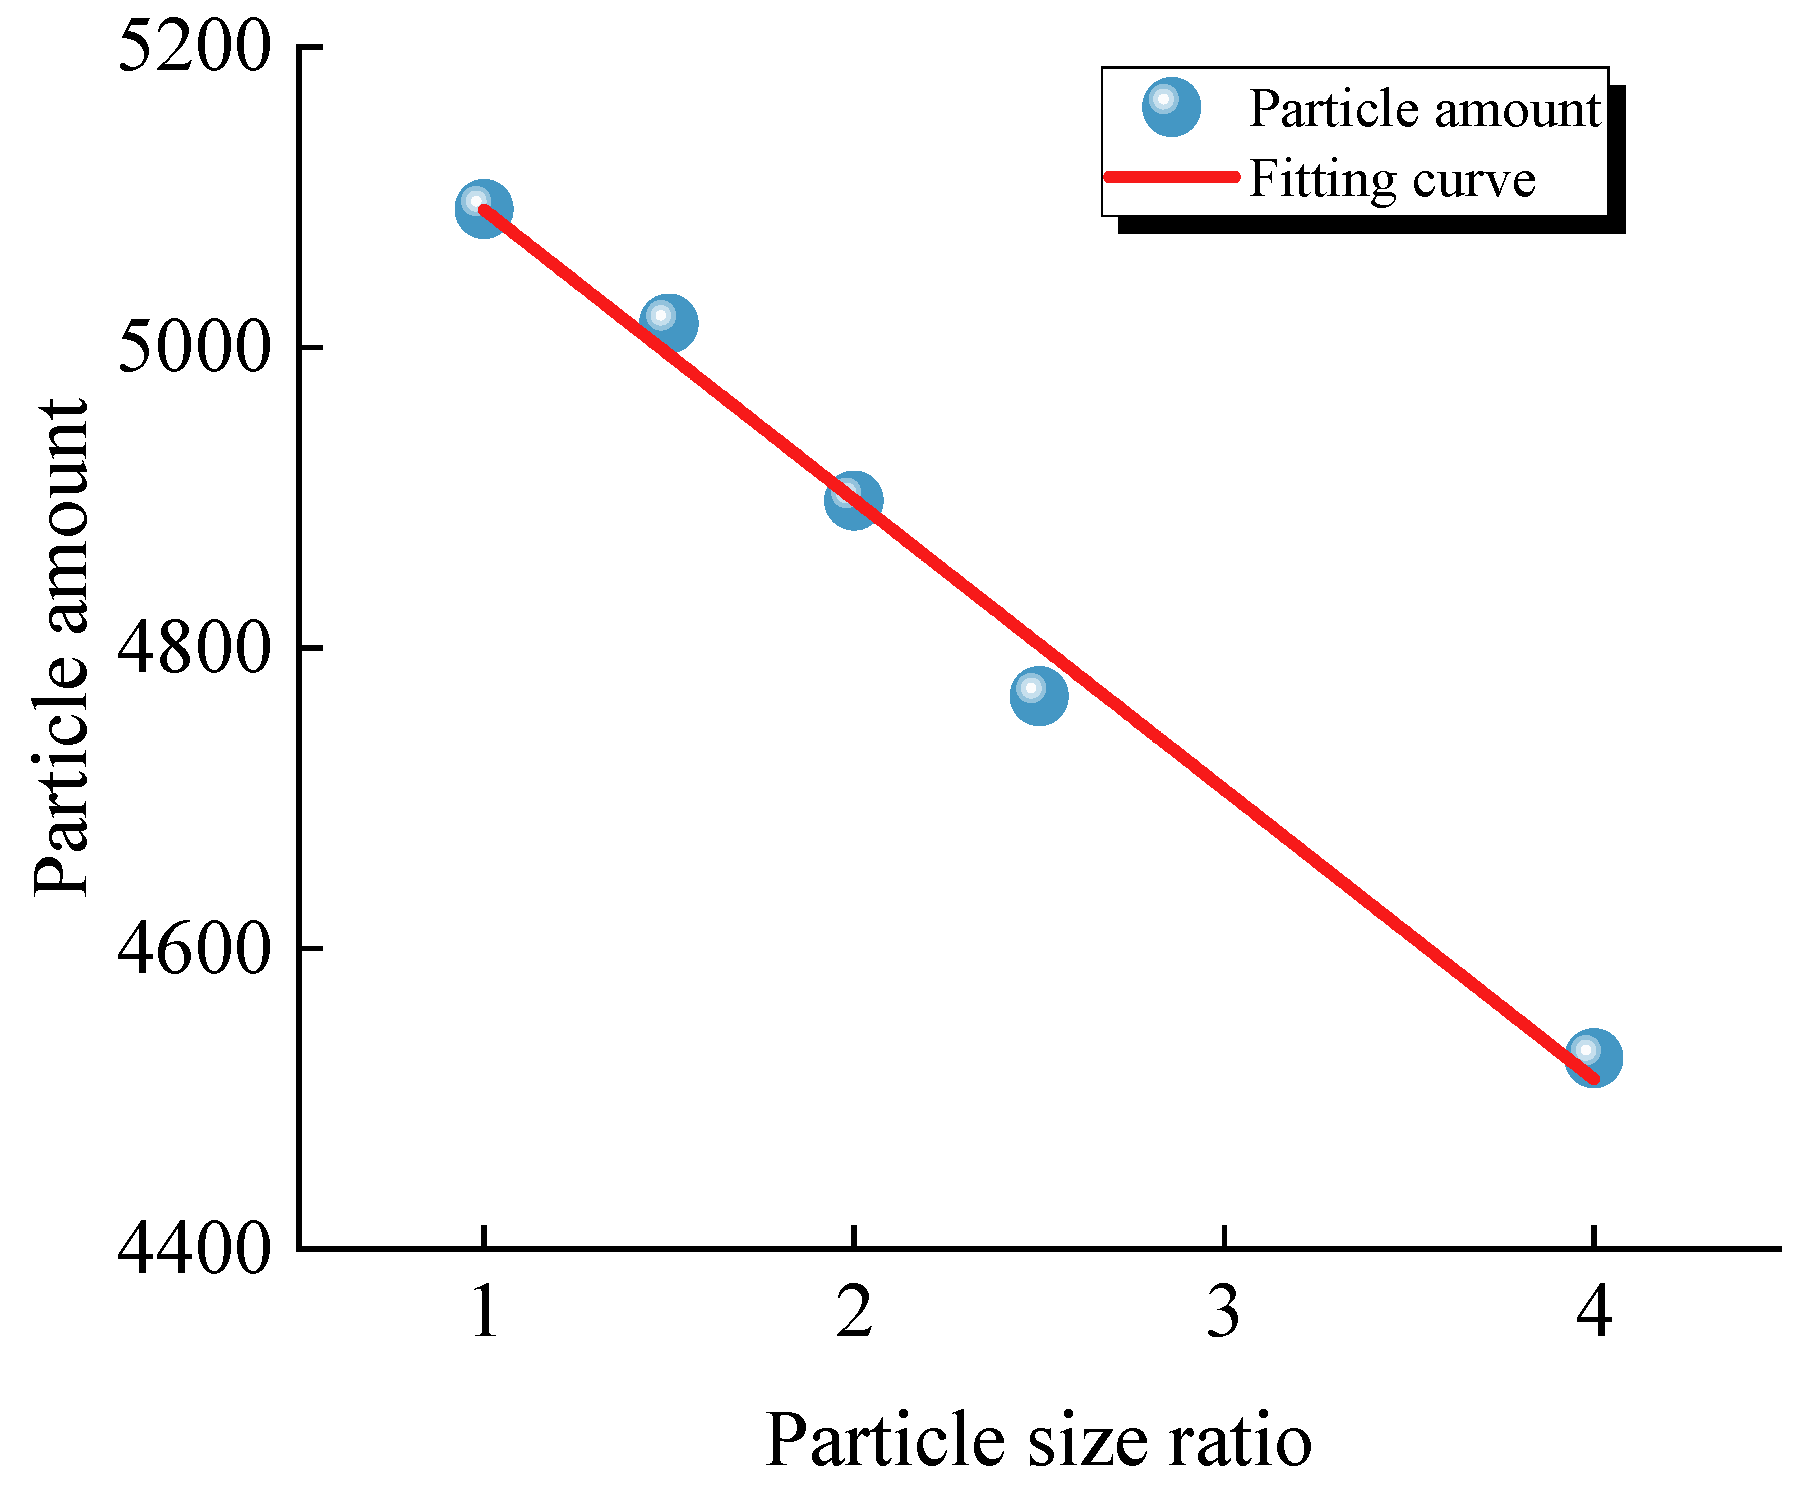
From Figure 14, it can be seen that the particle amount decreases linearly with an increasing particle size ratio. This is because increasing the particle size ratio without changing the average particle radius will increase the maximum particle radius. Large particles take up more space in the model, resulting in a decrease in the number of particles.
A linear equation is used to fit the variation in the particle number with the particle size ratio, and the result is as follows:
y = 2637.66 89.75 x
where y is the number of particles and x is the particle size ratio.
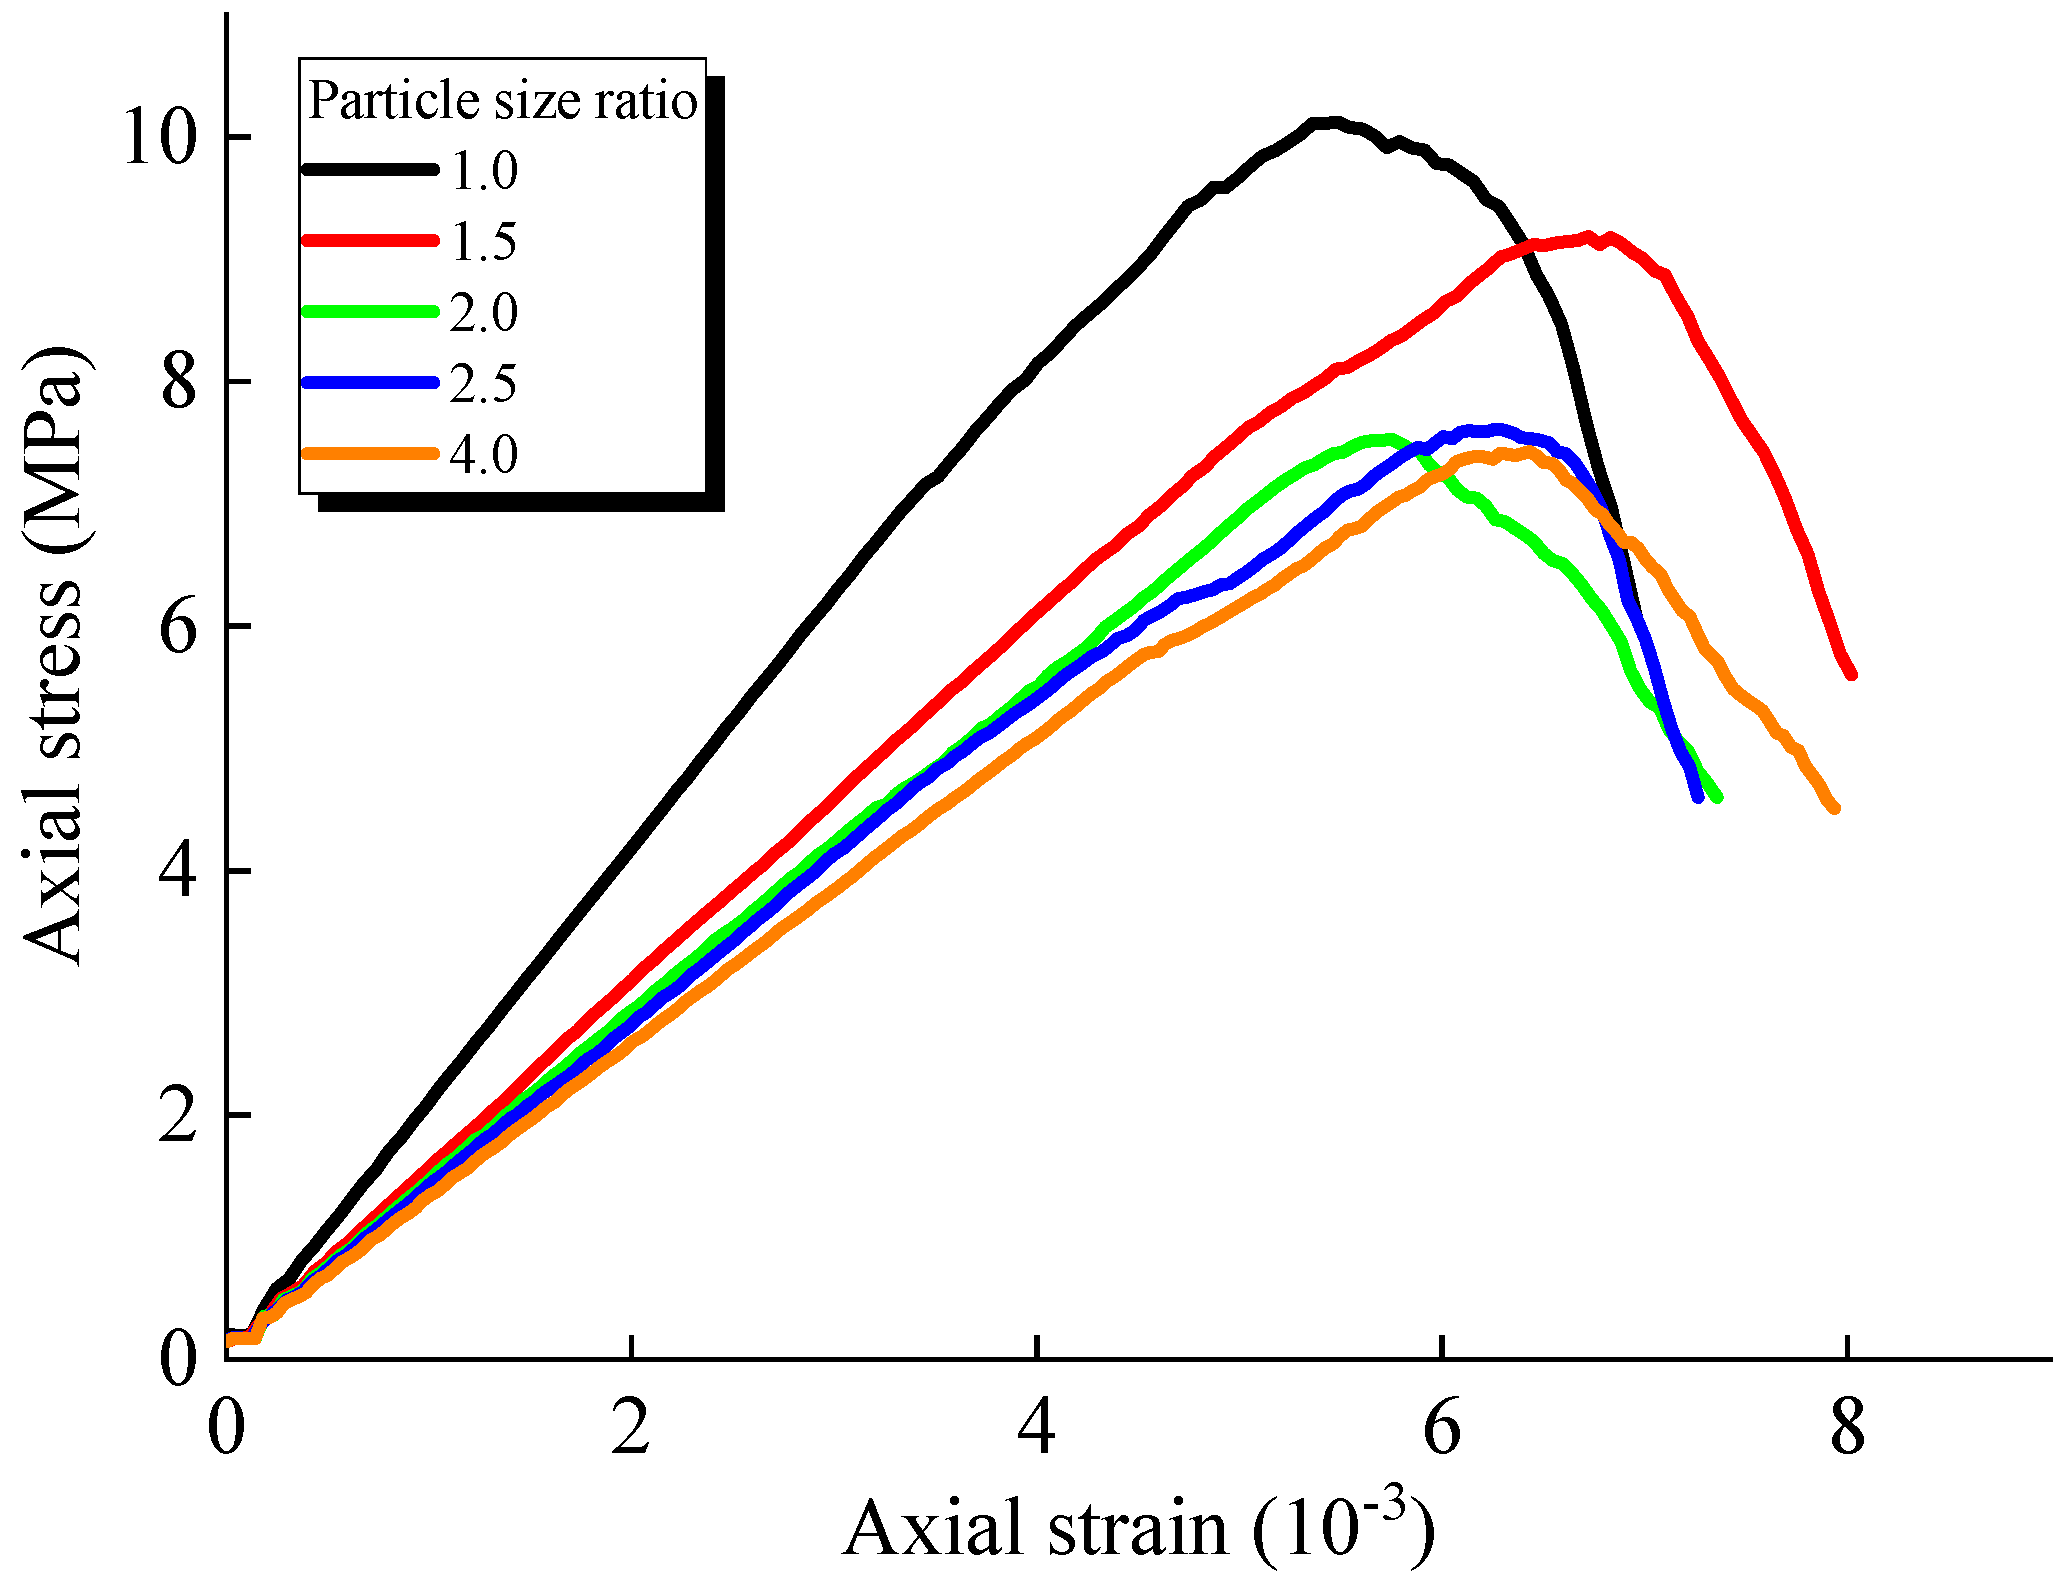
The stress–strain curves of model number 01 with different particle size ratios in the uniaxial compression test are shown in Figure 15. The peak strength decreases gradually with the increase in the particle size ratio, but the decline amplitude becomes small when the particle size ratio reaches 2.0, and the strength is basically the same for models with particle size ratios of 2.0, 2.5, and 4.0. In addition, the slope of the elastic stage also decreases gradually with the increase in the particle size ratio. It should be noted that some stress curves will increase after some point decreases. This is because an increase in the loading force causes the appearance of cracks and the release of stress in rock, but does not destroy the bearing capacity of the rock.
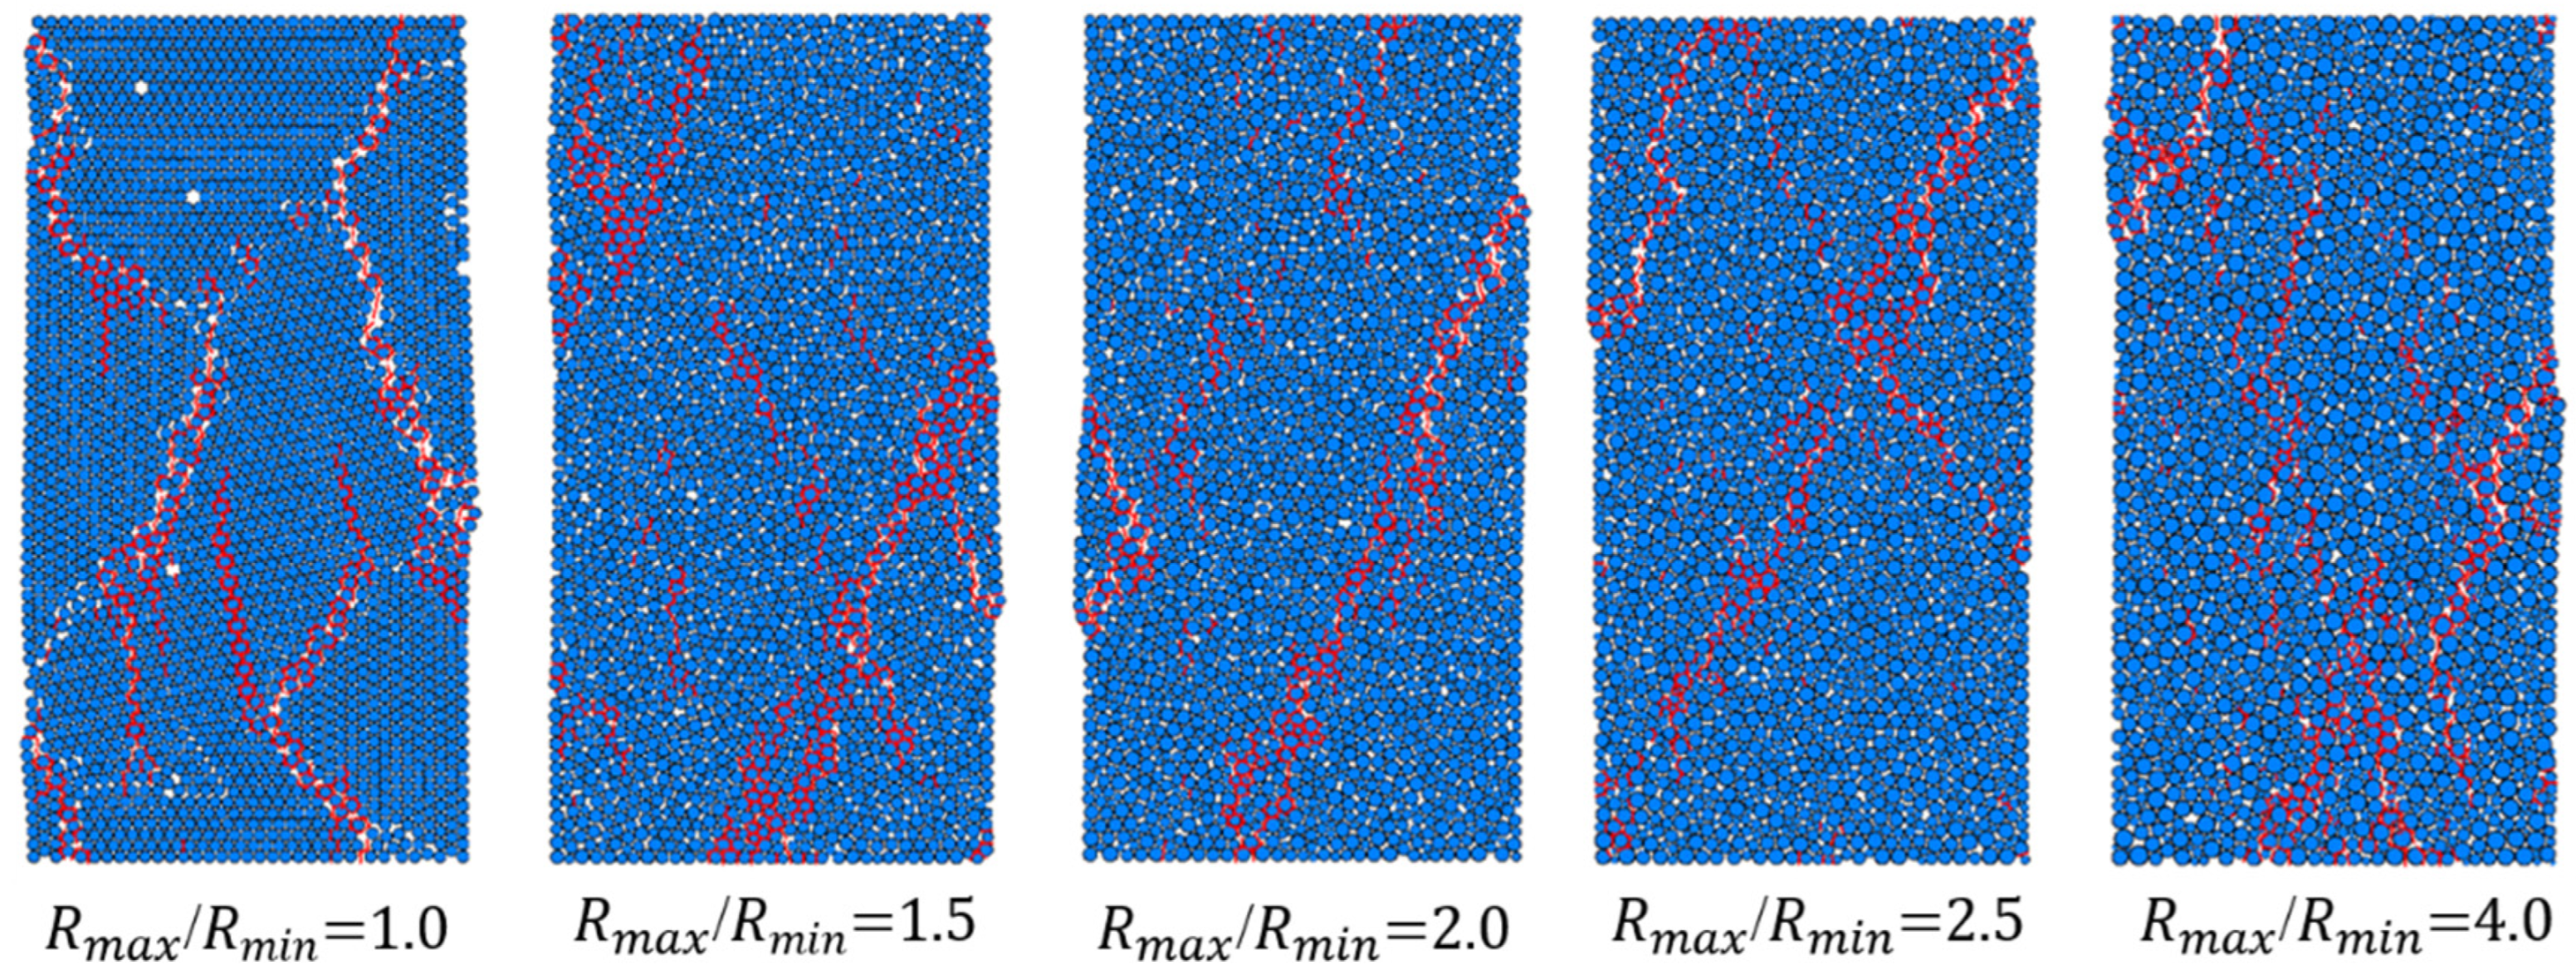
Figure 16 shows the schematic diagram of final failure characteristics for model number 01 with different particle size ratios, where the blue represents particles and the red means microcracks. At a particle size ratio of 1.0, the microcracks propagate along the gaps generated by the particles to the interior of the model. The failure mode of models with other four particle size ratios are similar to those of the laboratory test. This is because when the particle size ratio is 1.0, the model particles are regular in size. When uniaxial loading is applied on the specimen, the particle force transmission path is clear and the particle size is consistent, which can better constrain the particle displacement and timely alter the contact stiffness between particles, resulting in a larger elastic modulus and compressive strength.

3.2. Effect of the Particle Size Ratio on the Uniaxial Compressive Strength

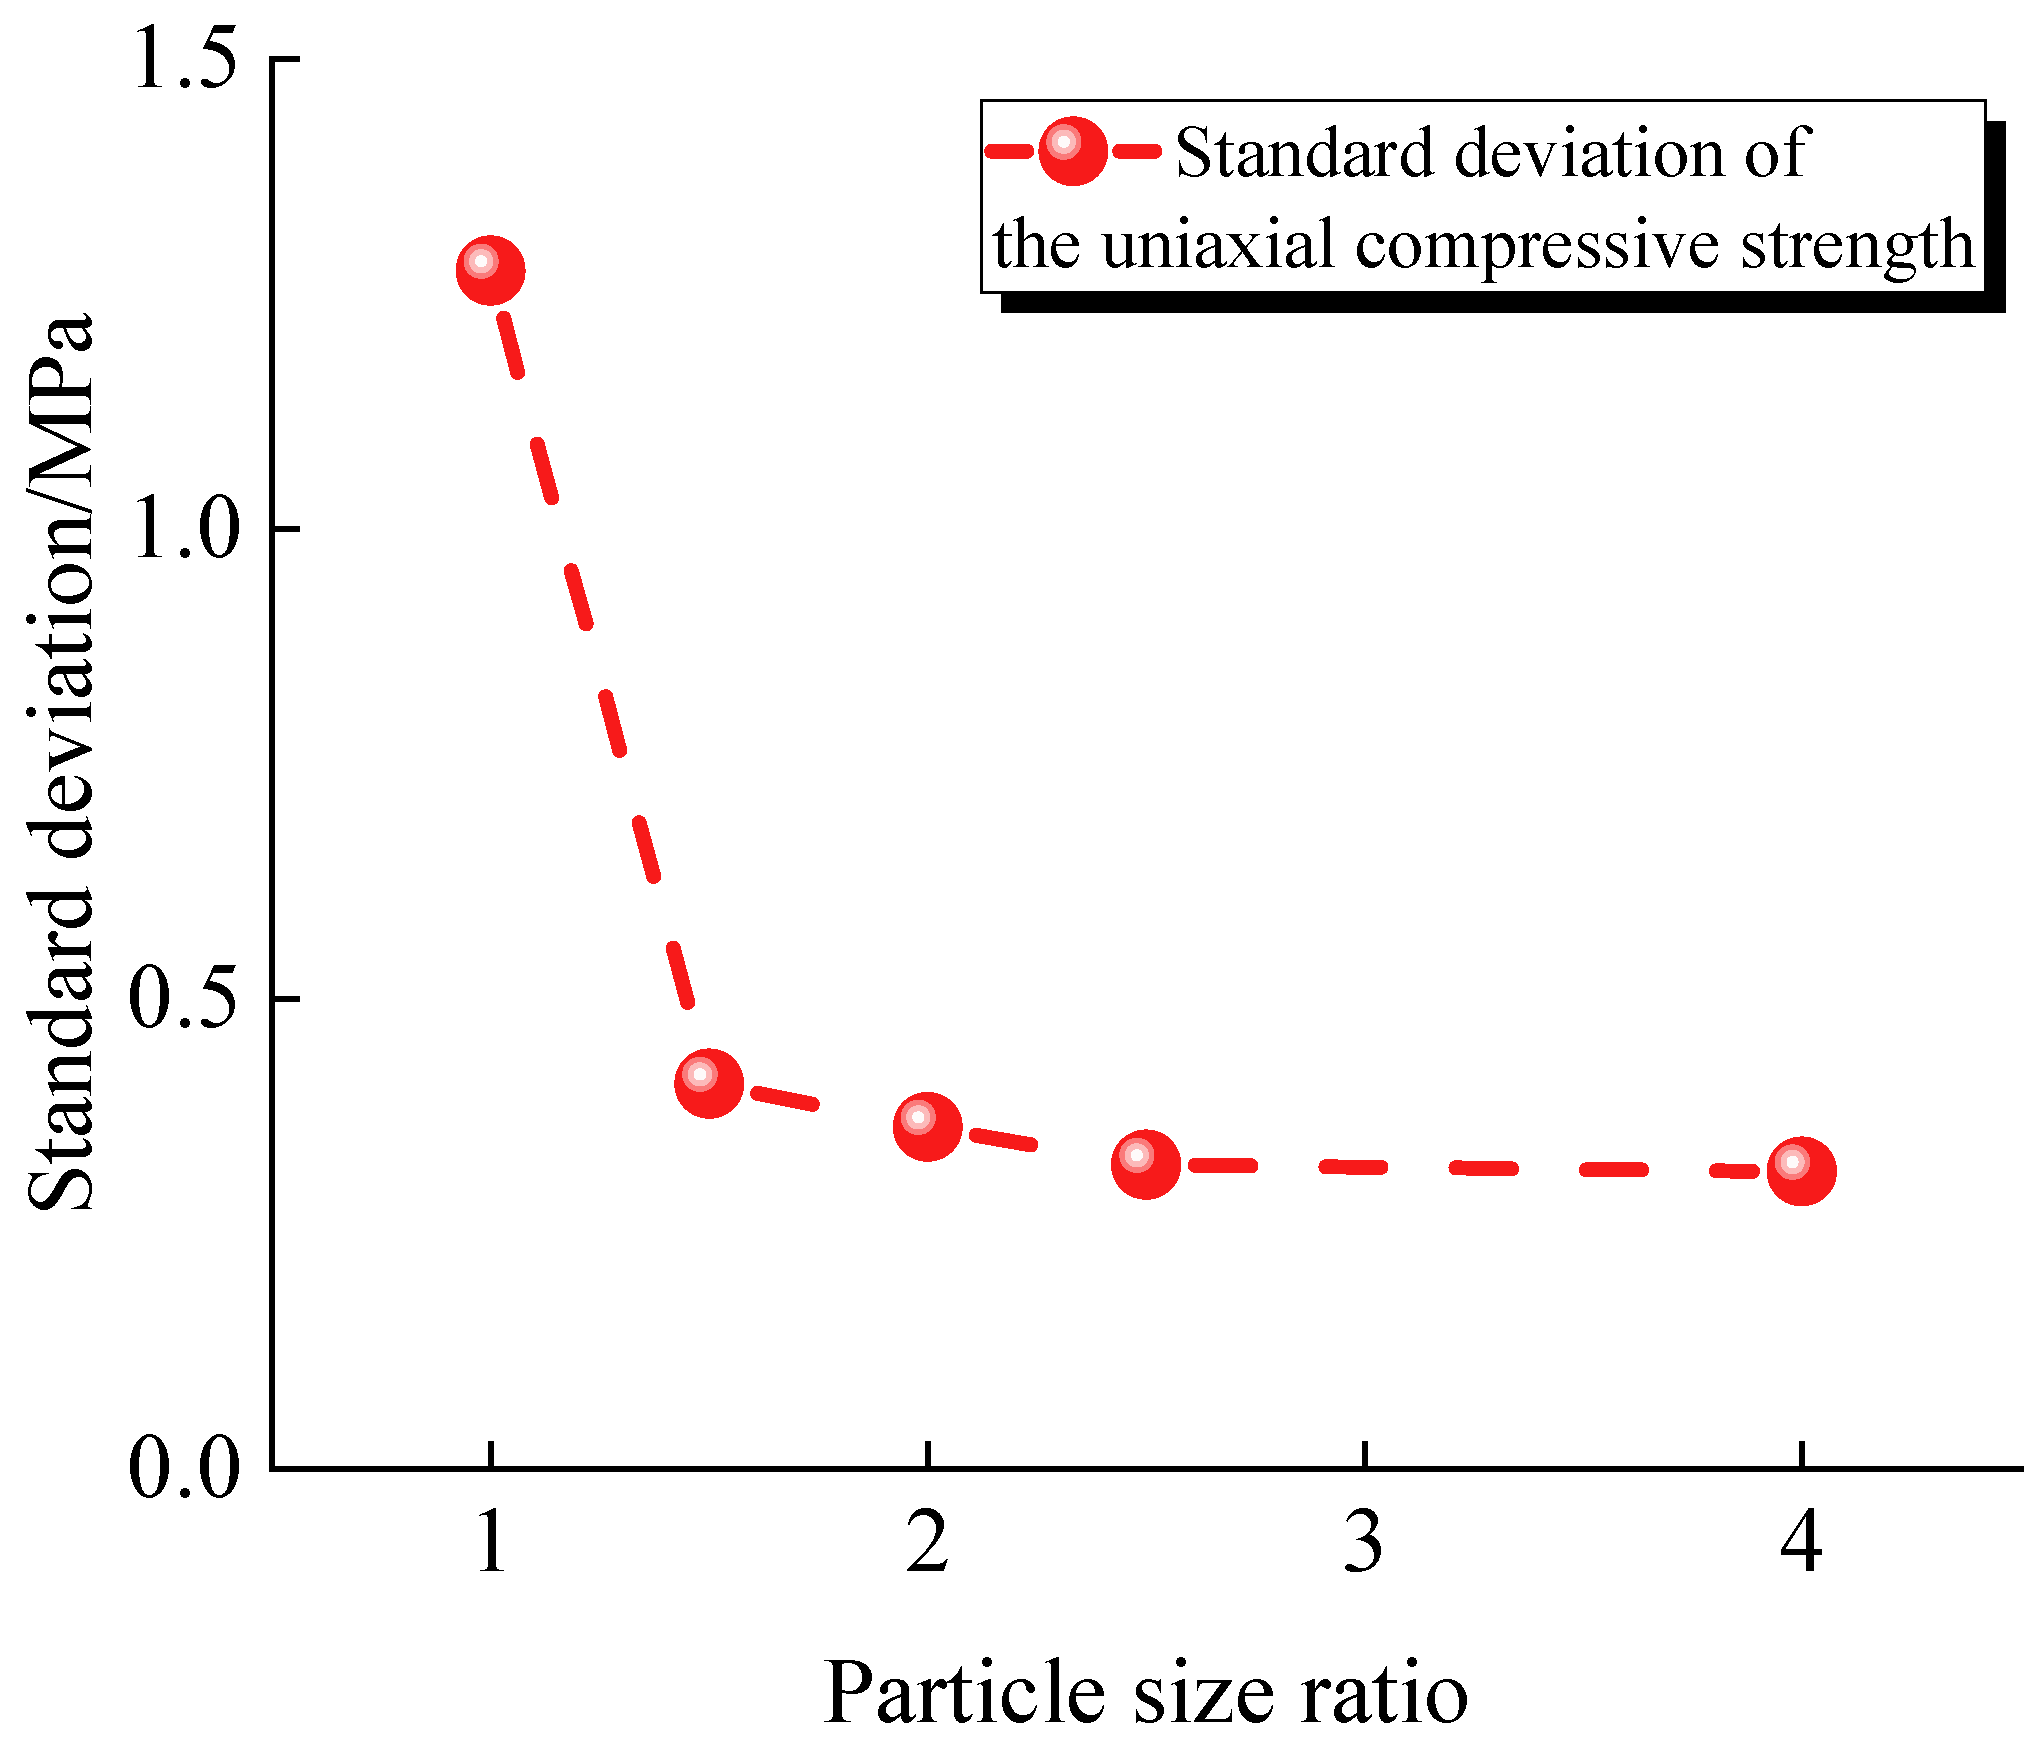
The uniaxial compressive strength of specimens with different particle size ratios are extracted, and the average of the shear strengths of the four groups of specimens at the same particle size ratio is calculated, which is shown in Figure 17. The dispersion of uniaxial compressive strength corresponding to each particle size ratio is analyzed, and the strength standard deviation is shown in Figure 18.
As can be seen in Figure 16, the average uniaxial compressive strength decreases gradually with the increase in the particle size ratio. When the particle size ratio ranges from 1.0 to 4.0, the average compressive strength decreases from 10.16 MPa to 7.21 MPa, with a decline amplitude of 29.10%. The average uniaxial compressive strength decreases faster when the particle size ratio is less than 2.0. When the particle size ratio is 1.0, the uniaxial compressive strength difference between specimens with different IDs is large, and the compressive strength range is around 3 MPa. For specimens with a particle size ratio greater than 1.5, the strength of specimens with different IDs is all roughly close to each other, and the range is within 1 MPa.
From Figure 18, except for the standard deviation that is relatively high when the particle size ratio is 1.0, the standard deviations corresponding to other particle size ratio are maintained at a low level. When the particle size ratio ranges from 1.0 to 4.0, the standard deviation decreases from 1.27 to 0.32, with a decrease ratio of 75.15%. This indicates that when the particle size ratio is 1.0, not only is the uniaxial compressive strength higher but also the dispersion between the uniaxial compressive strength of specimens with different IDs is larger. When the particle size ratio increases to 1.5, the dispersion decreases significantly. This is because when the particle size ratio is 1.0, the space between the particles will be larger. Different particle spatial arrangements will cause different structures of the models, resulting in a large fluctuation of the uniaxial compressive strength and increased dispersion.
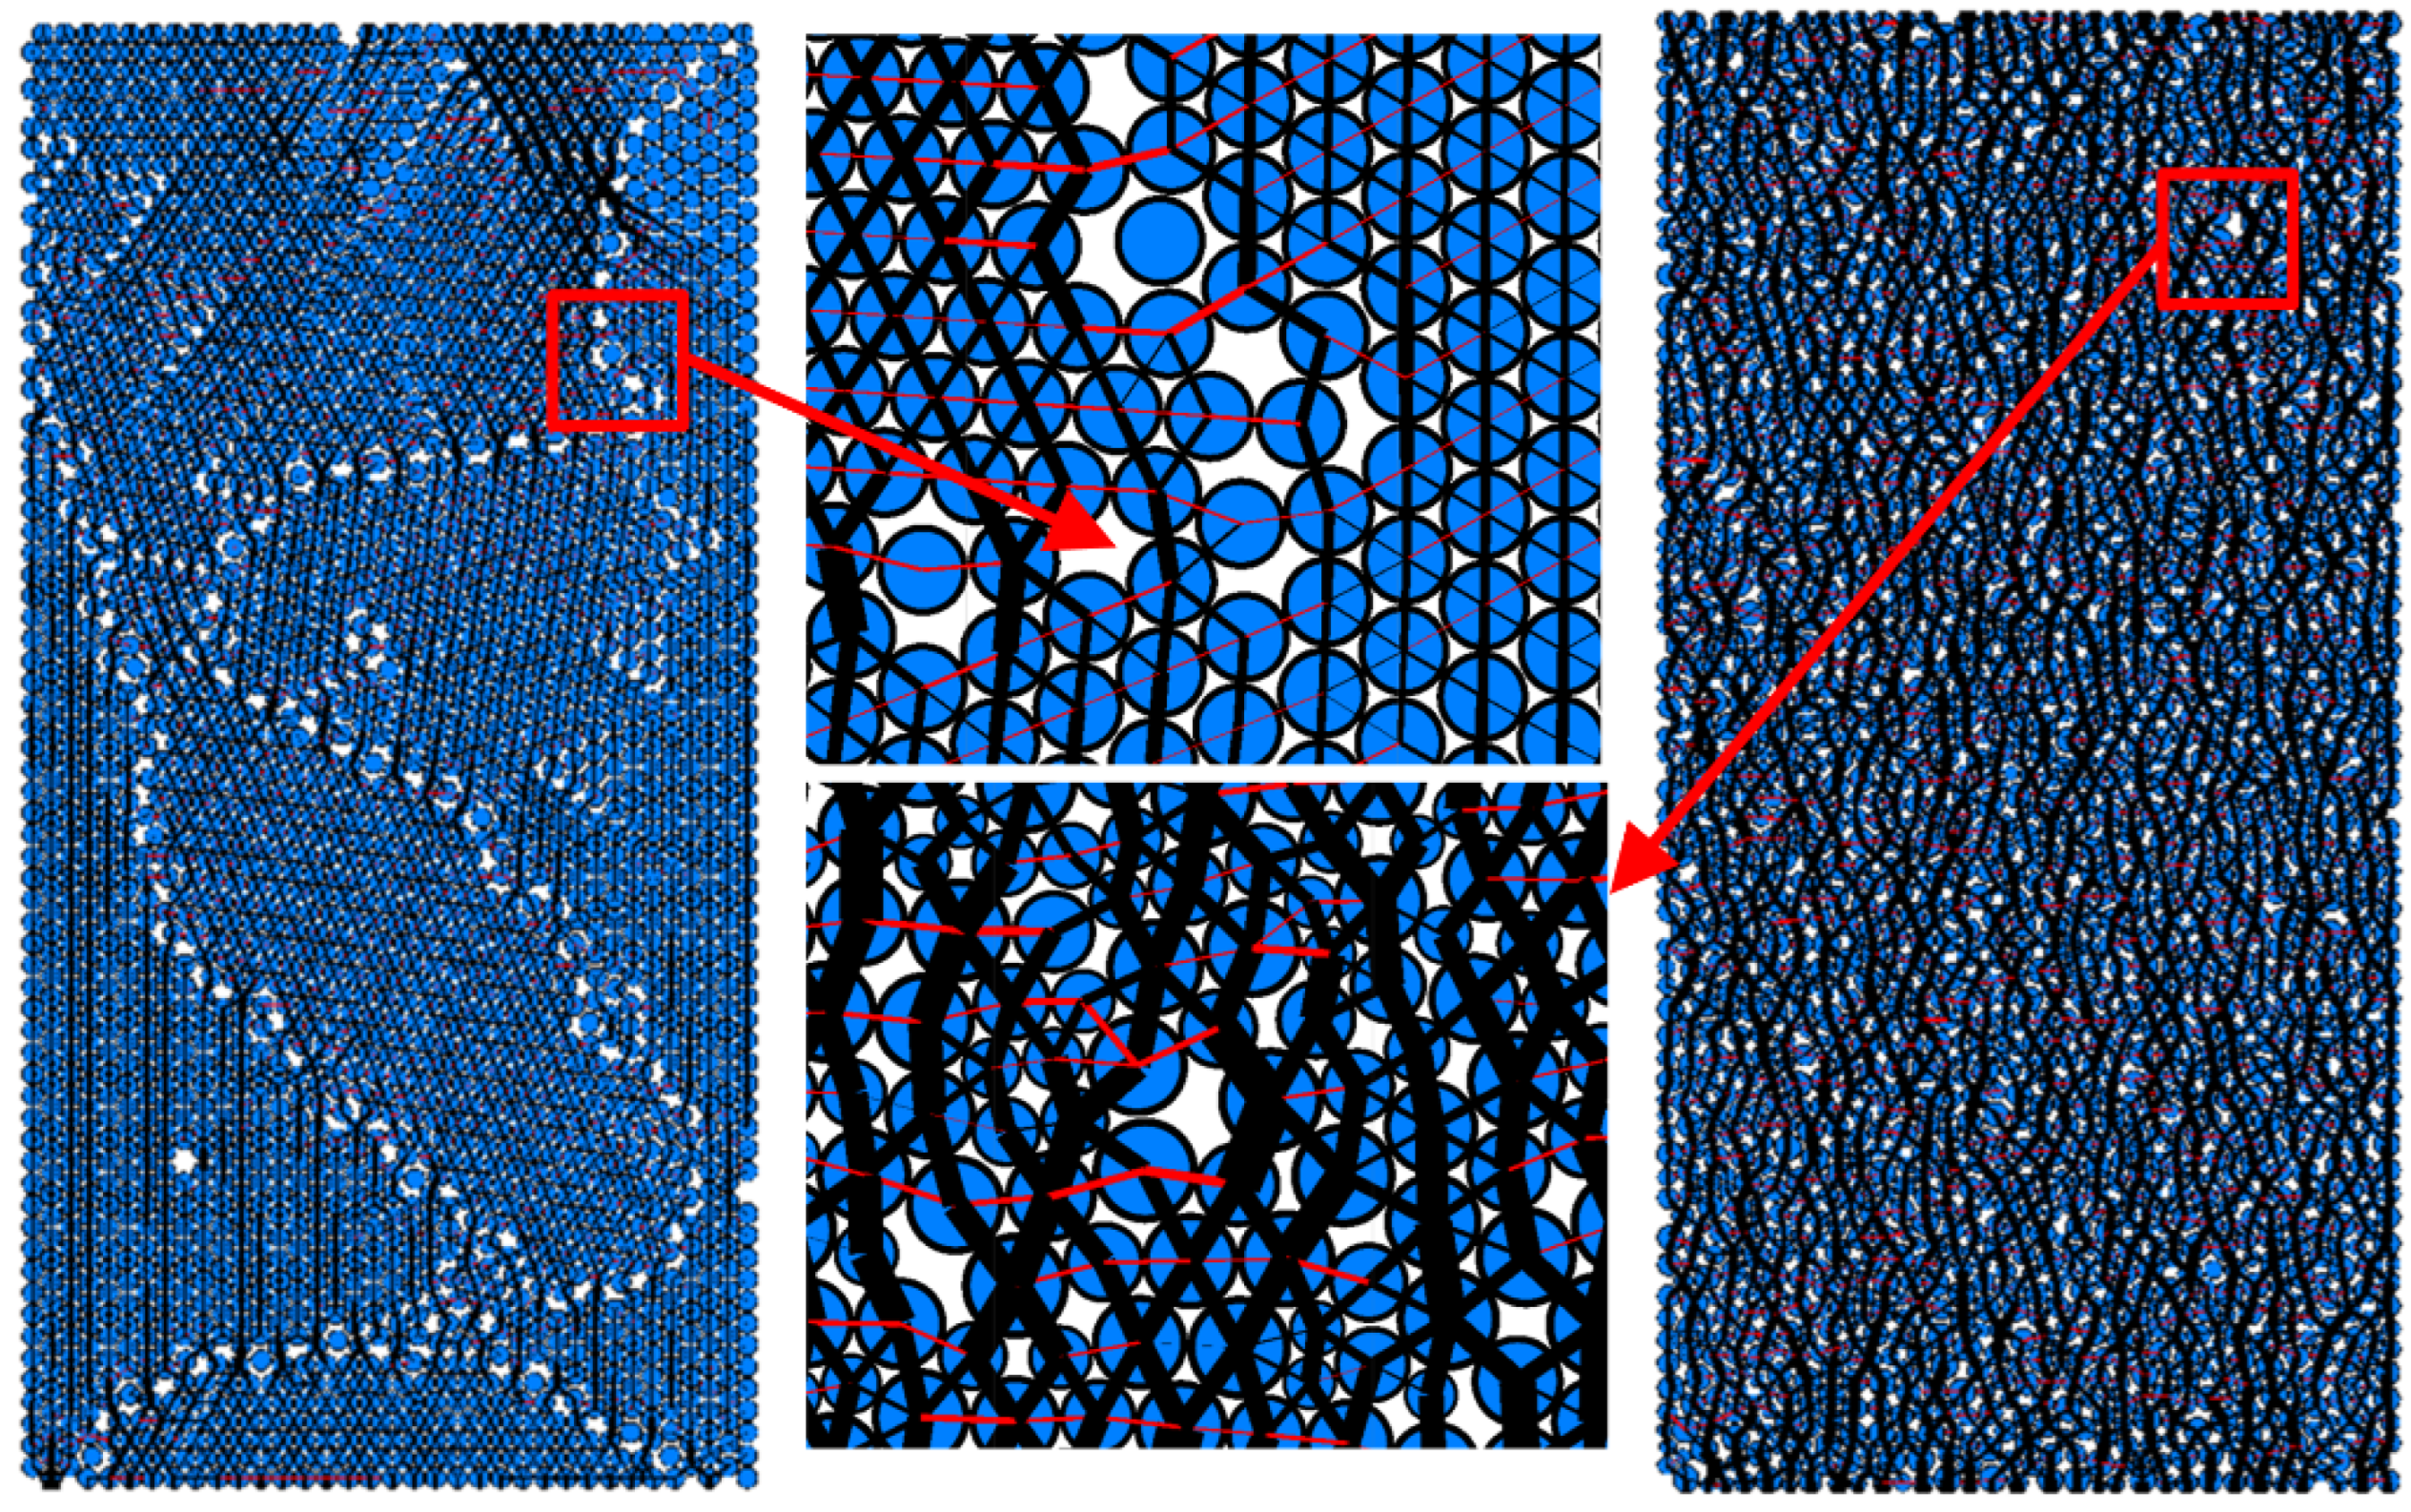
As shown in Figure 19, the black thick line represents the compressive force, and the red line is the tensile force. When the particle size ratio is 1.0, the particles are arranged in a regular way, and the path of force chain is clear and neat, so that the compressive stress can be transmitted from the upper loading plate to the lower loading plate. Additionally, the tensile stress is small because of the clear path of force transmission. On the contrary, for specimen with particle size ratio of 2.0, due to the inconsistent size and irregular arrangement of particles, the path of force transmission is complicated, which results in a compressive stress that cannot be well transmitted to the lower loading plate, and more tensile stresses appear in the particles. The above phenomena finally lead to the largest compressive strength of model with a particle size ratio of 1.0.

3.3. Effect of the Particle Size Ratio on the Elastic Modulus

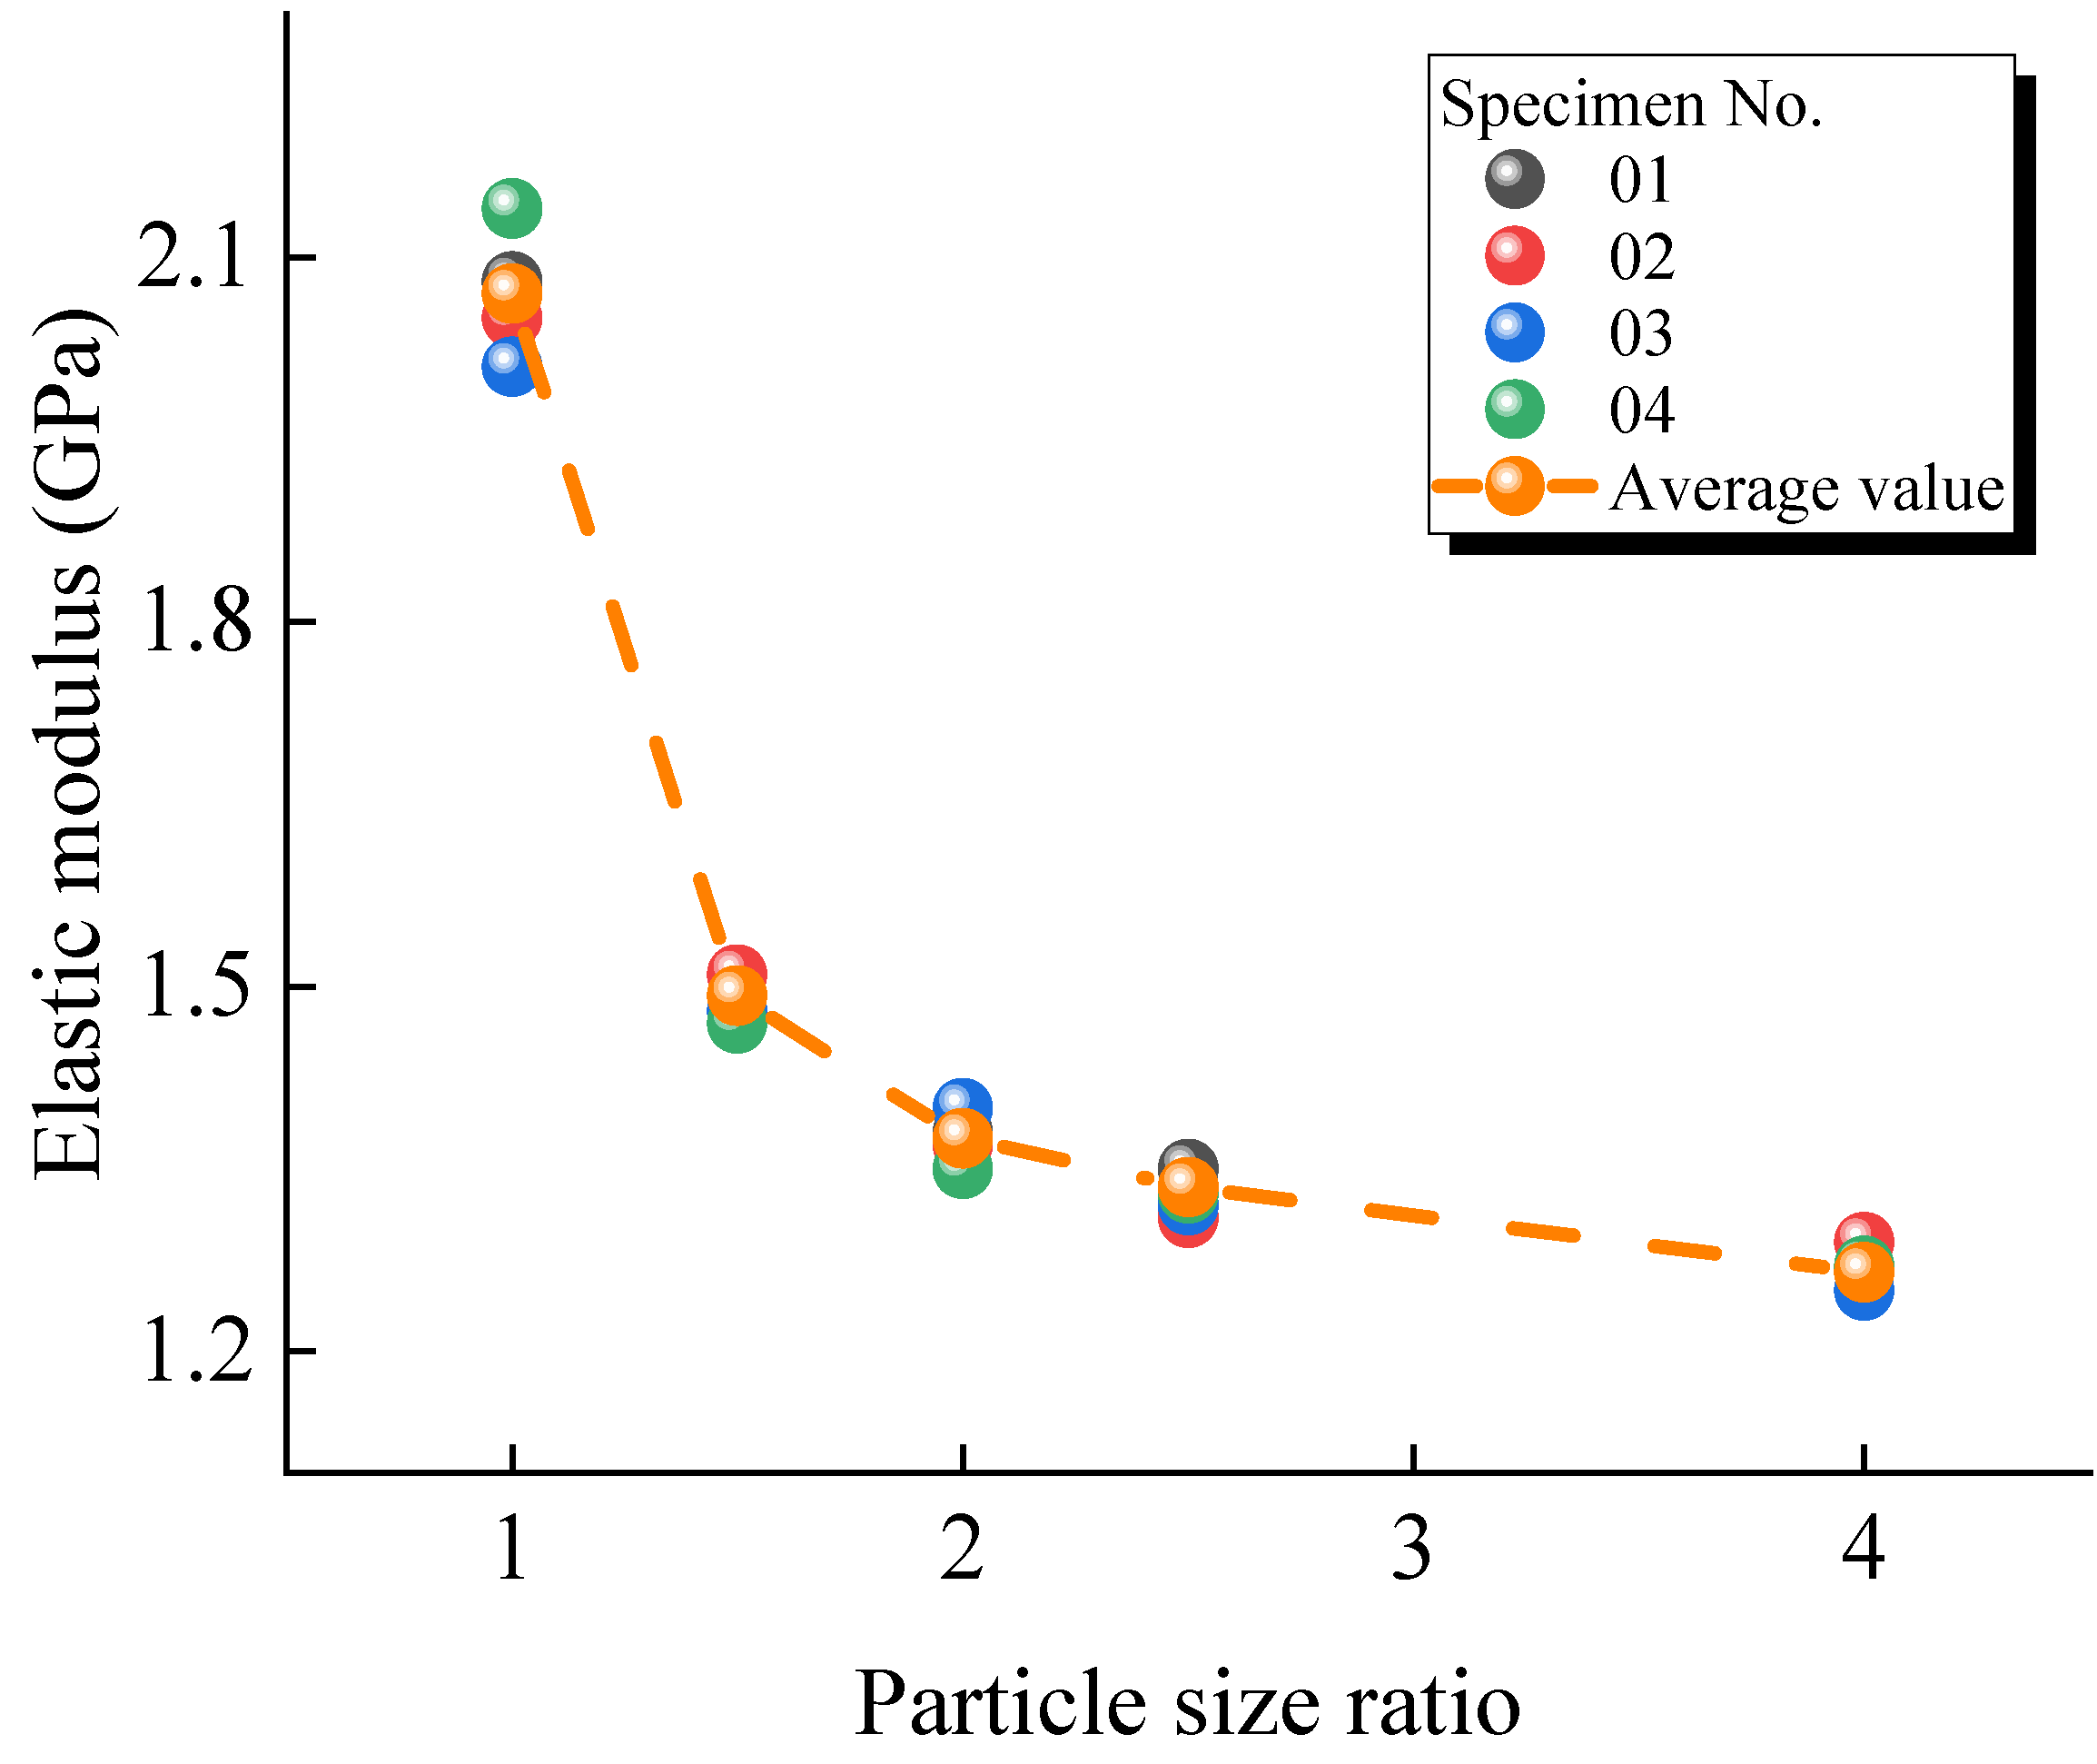
The elastic modulus of models with different particle size ratios are extracted, and the average and standard deviation of the elastic modulus of four specimens with same particle size ratio and different particle arrangements are calculated, as shown in Figure 20 and Figure 21.
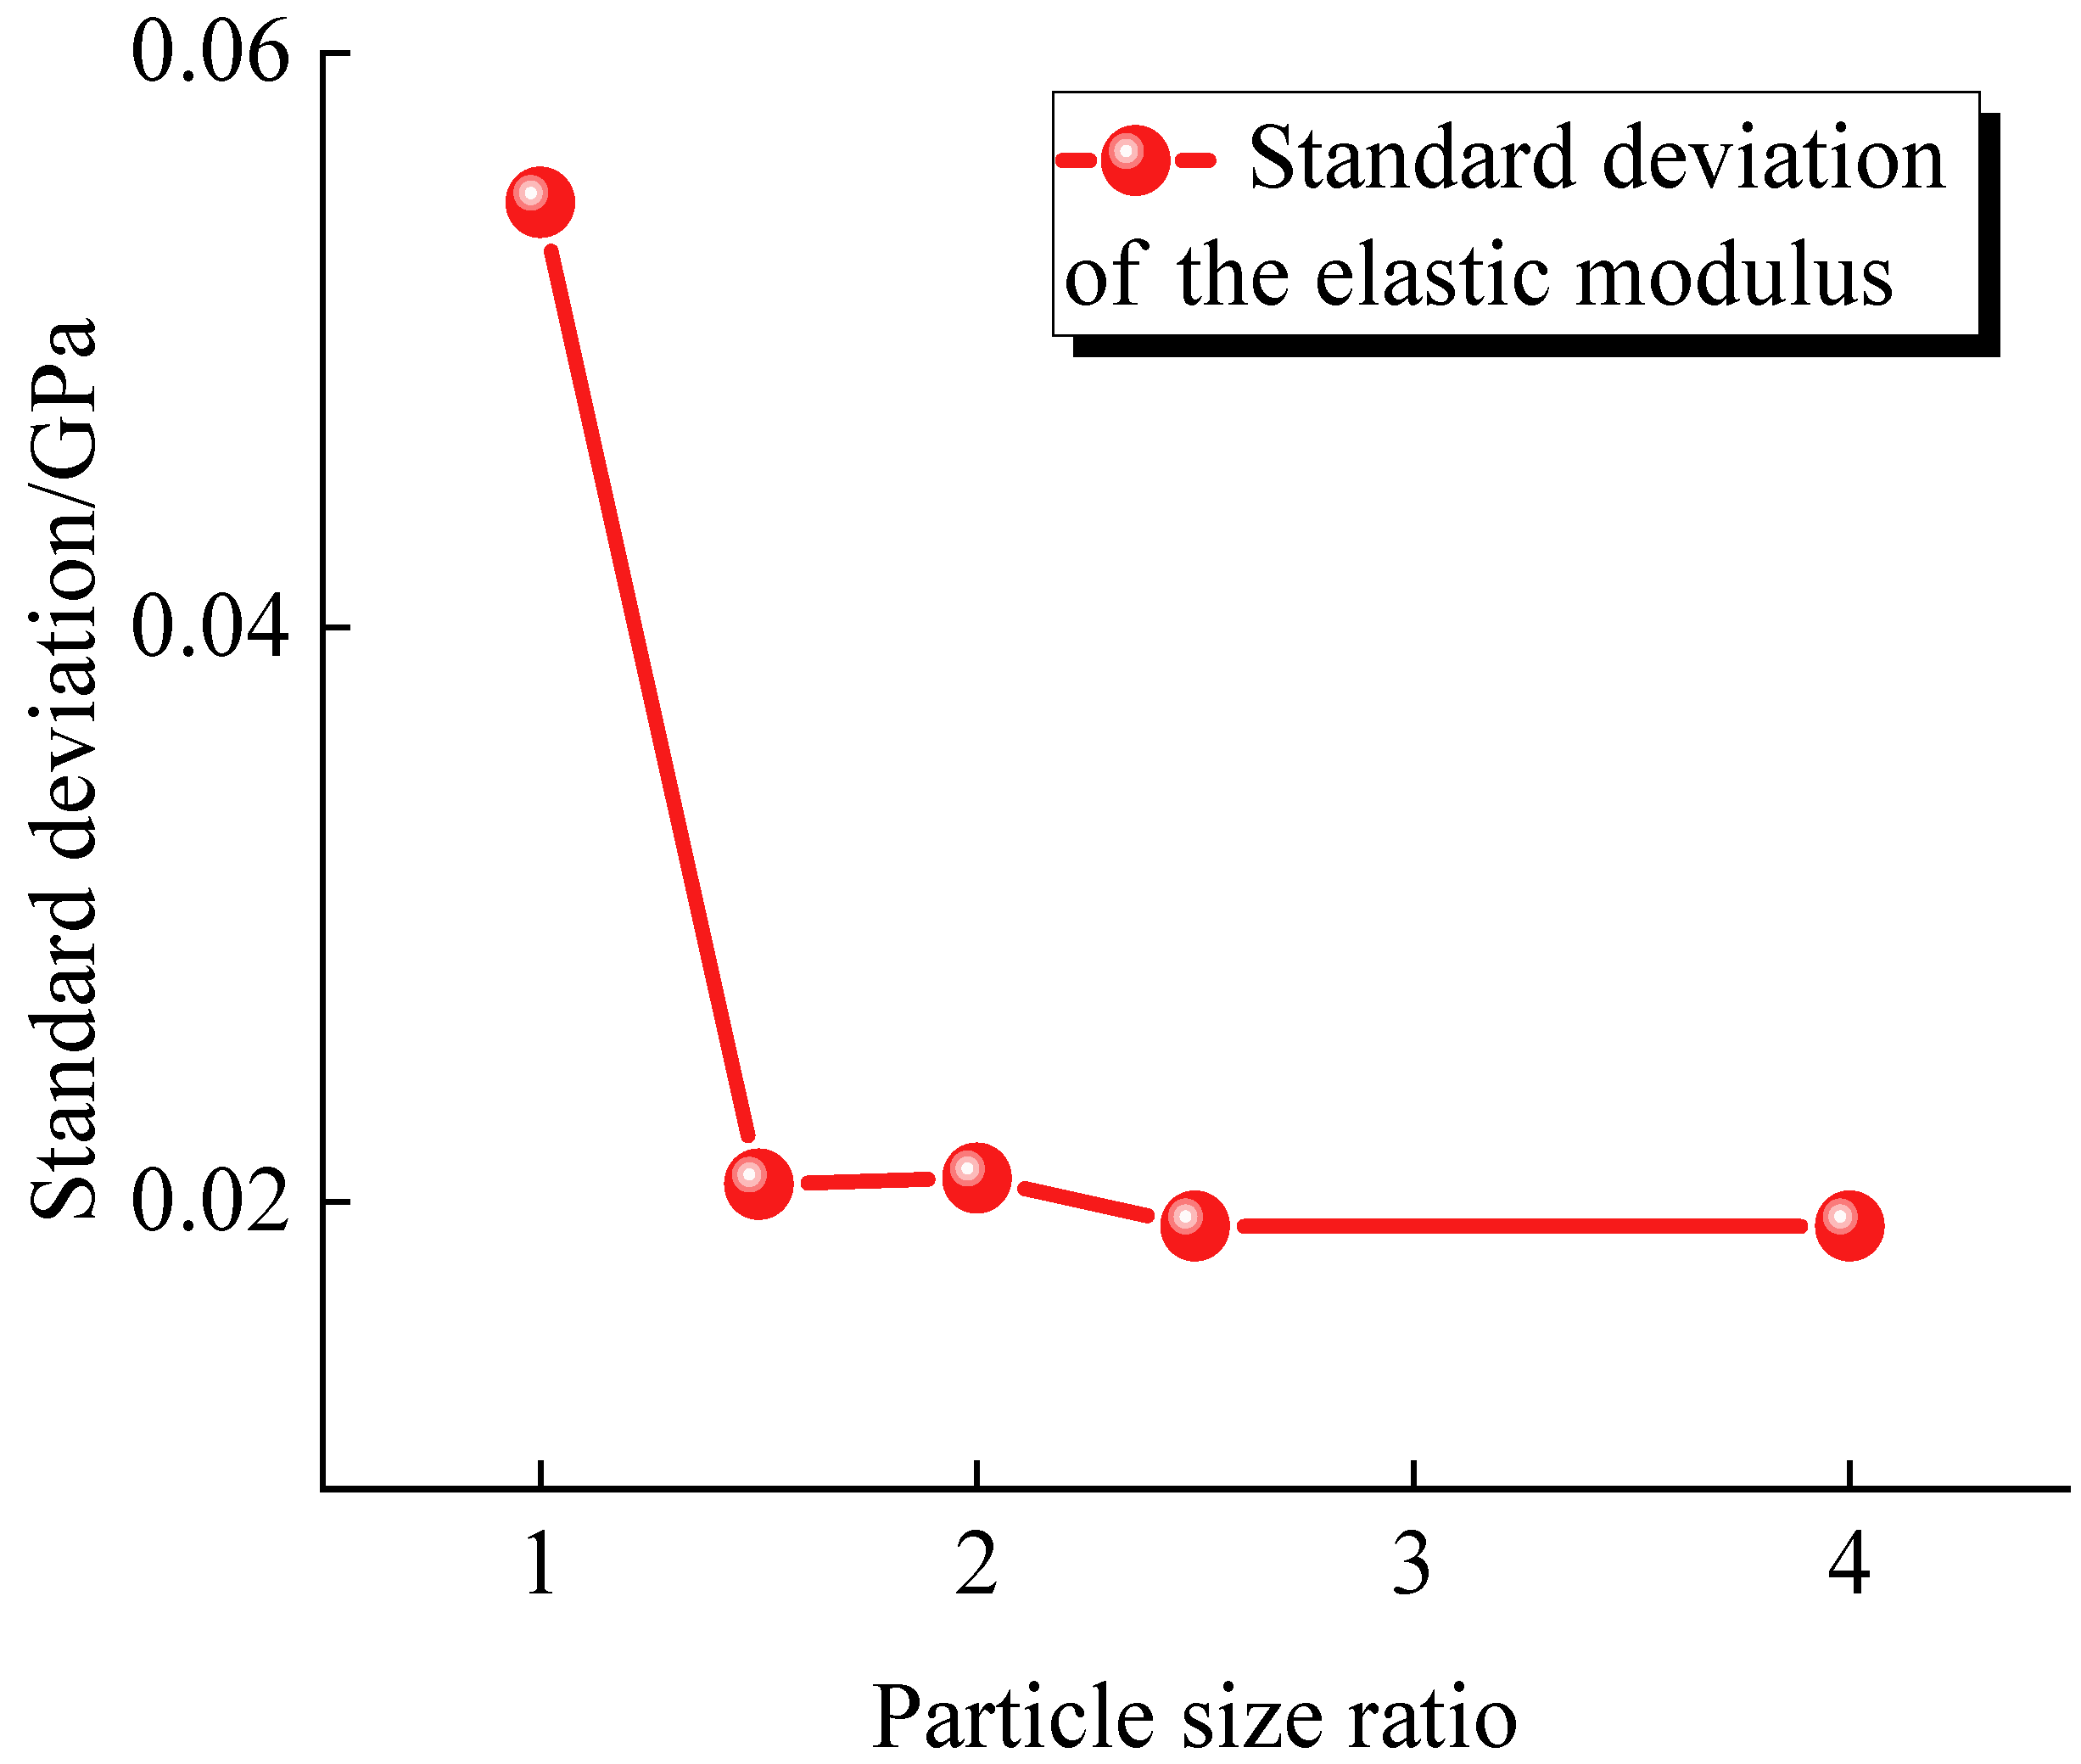
The average elastic modulus decreases with an increase in the particle size ratio, from 2.07 GPa to 1.27 GPa, with a decline amplitude of 38.89%. This is because when the particle size ratio is 1.0, the particles are aligned and pressed against each other. The force conduction between particles is clear and the particles’ displacement is small; so, the model’s deformation is small and the elastic modulus is larger. When the particle size ratio is less than 1.5, the elastic modulus decreases at a fast rate, and the elastic modulus difference of specimens with different IDs is relatively large. When the particle size ratio is greater than 1.5, the rate of the elastic modulus reduction slows down, and the elastic modulus difference of specimens with different IDs is small. For a fixed particle size ratio that is bigger than 1.5, the elastic moduli of specimens with different IDs are closely concentrated near the average value. It can be found from Figure 21 that the standard deviation of the elastic modulus for specimens with other particle size ratios remains at a low level, except for the particle size ratio equal to 1.0. The standard deviation of the elastic modulus is 0.055 for specimens with a particle size ratio of 1.0, and it rapidly decreases to around 0.02 when the particle size ratio equals 1.5, with a decrease of roughly 63.64%. This indicates that the larger the particle size ratio is, the smaller the elastic modulus is. When the particle size ratio is not less than 1.5, the elastic modulus can show lower dispersion. The influence of the particles’ spatial arrangement is rapidly weakened, and the elastic modulus of specimens with different IDs can show stronger consistency, which improves the accuracy and reliability of the numerical simulation results.
In summary, the larger the particle size ratio, the smaller the uniaxial compressive strength and elastic modulus. When the particle size ratio is larger than 1.5, the dispersion of the numerical simulation results can be greatly reduced. The selection of the particle size ratio in a particular numerical simulation study usually needs to consider material grading characteristics. However, in combination with the above analysis, to obtain a more comprehensive, accurate, and reliable numerical simulation of uniaxial compression, the particle size ratio should not be less than 1.5.

3.4. Effect of the Particle Size Ratio on the Models’ Shear Mechanical Behavior

Keeping the average particle size (the average of R m a x and R m i n ) unchanged at 0.75 mm, set five groups of different particle size ranges and corresponding particle size ratios. The relevant particle size parameters are shown in Table 8. For each particle size ratio, four models numbered 01, 02, 03, and 04 with dimension of 100 mm × 100 mm are generated. The schematic diagram of the generated models and the relationship between the particle amount and particle size ratio are shown in Figure 21 and Figure 22, respectively. Direct shear test with different normal stress levels (0.5 MPa, 1.0 MPa, 1.5 MPa, 2.0 MPa, and 2.5 MPa) are carried out on the model.
As can be seen in Figure 22, the particle gradation of other models is better, except for the particle size ratio of 1.0. This is caused by the fact that the particle size is then same when the particle size ratio is 1.0, and there are gaps inside the model after generation, which affects the model’s integrity. From Figure 23, the particle amount decreases with an increasing particle size ratio, which can be expressed by a linear expression
y = 5284.51 192.87 x
where y is the particle amount, x is the particle size ratio, and the fitting coefficient R 2 is 0.99. This indicates that the particle amount decreases linearly with the increase in the particle size ratio.
The average value of shear stiffness of four repeated specimens is calculated, which can be fitted by the nonlinear equation
y s = y 0 + a e x / t
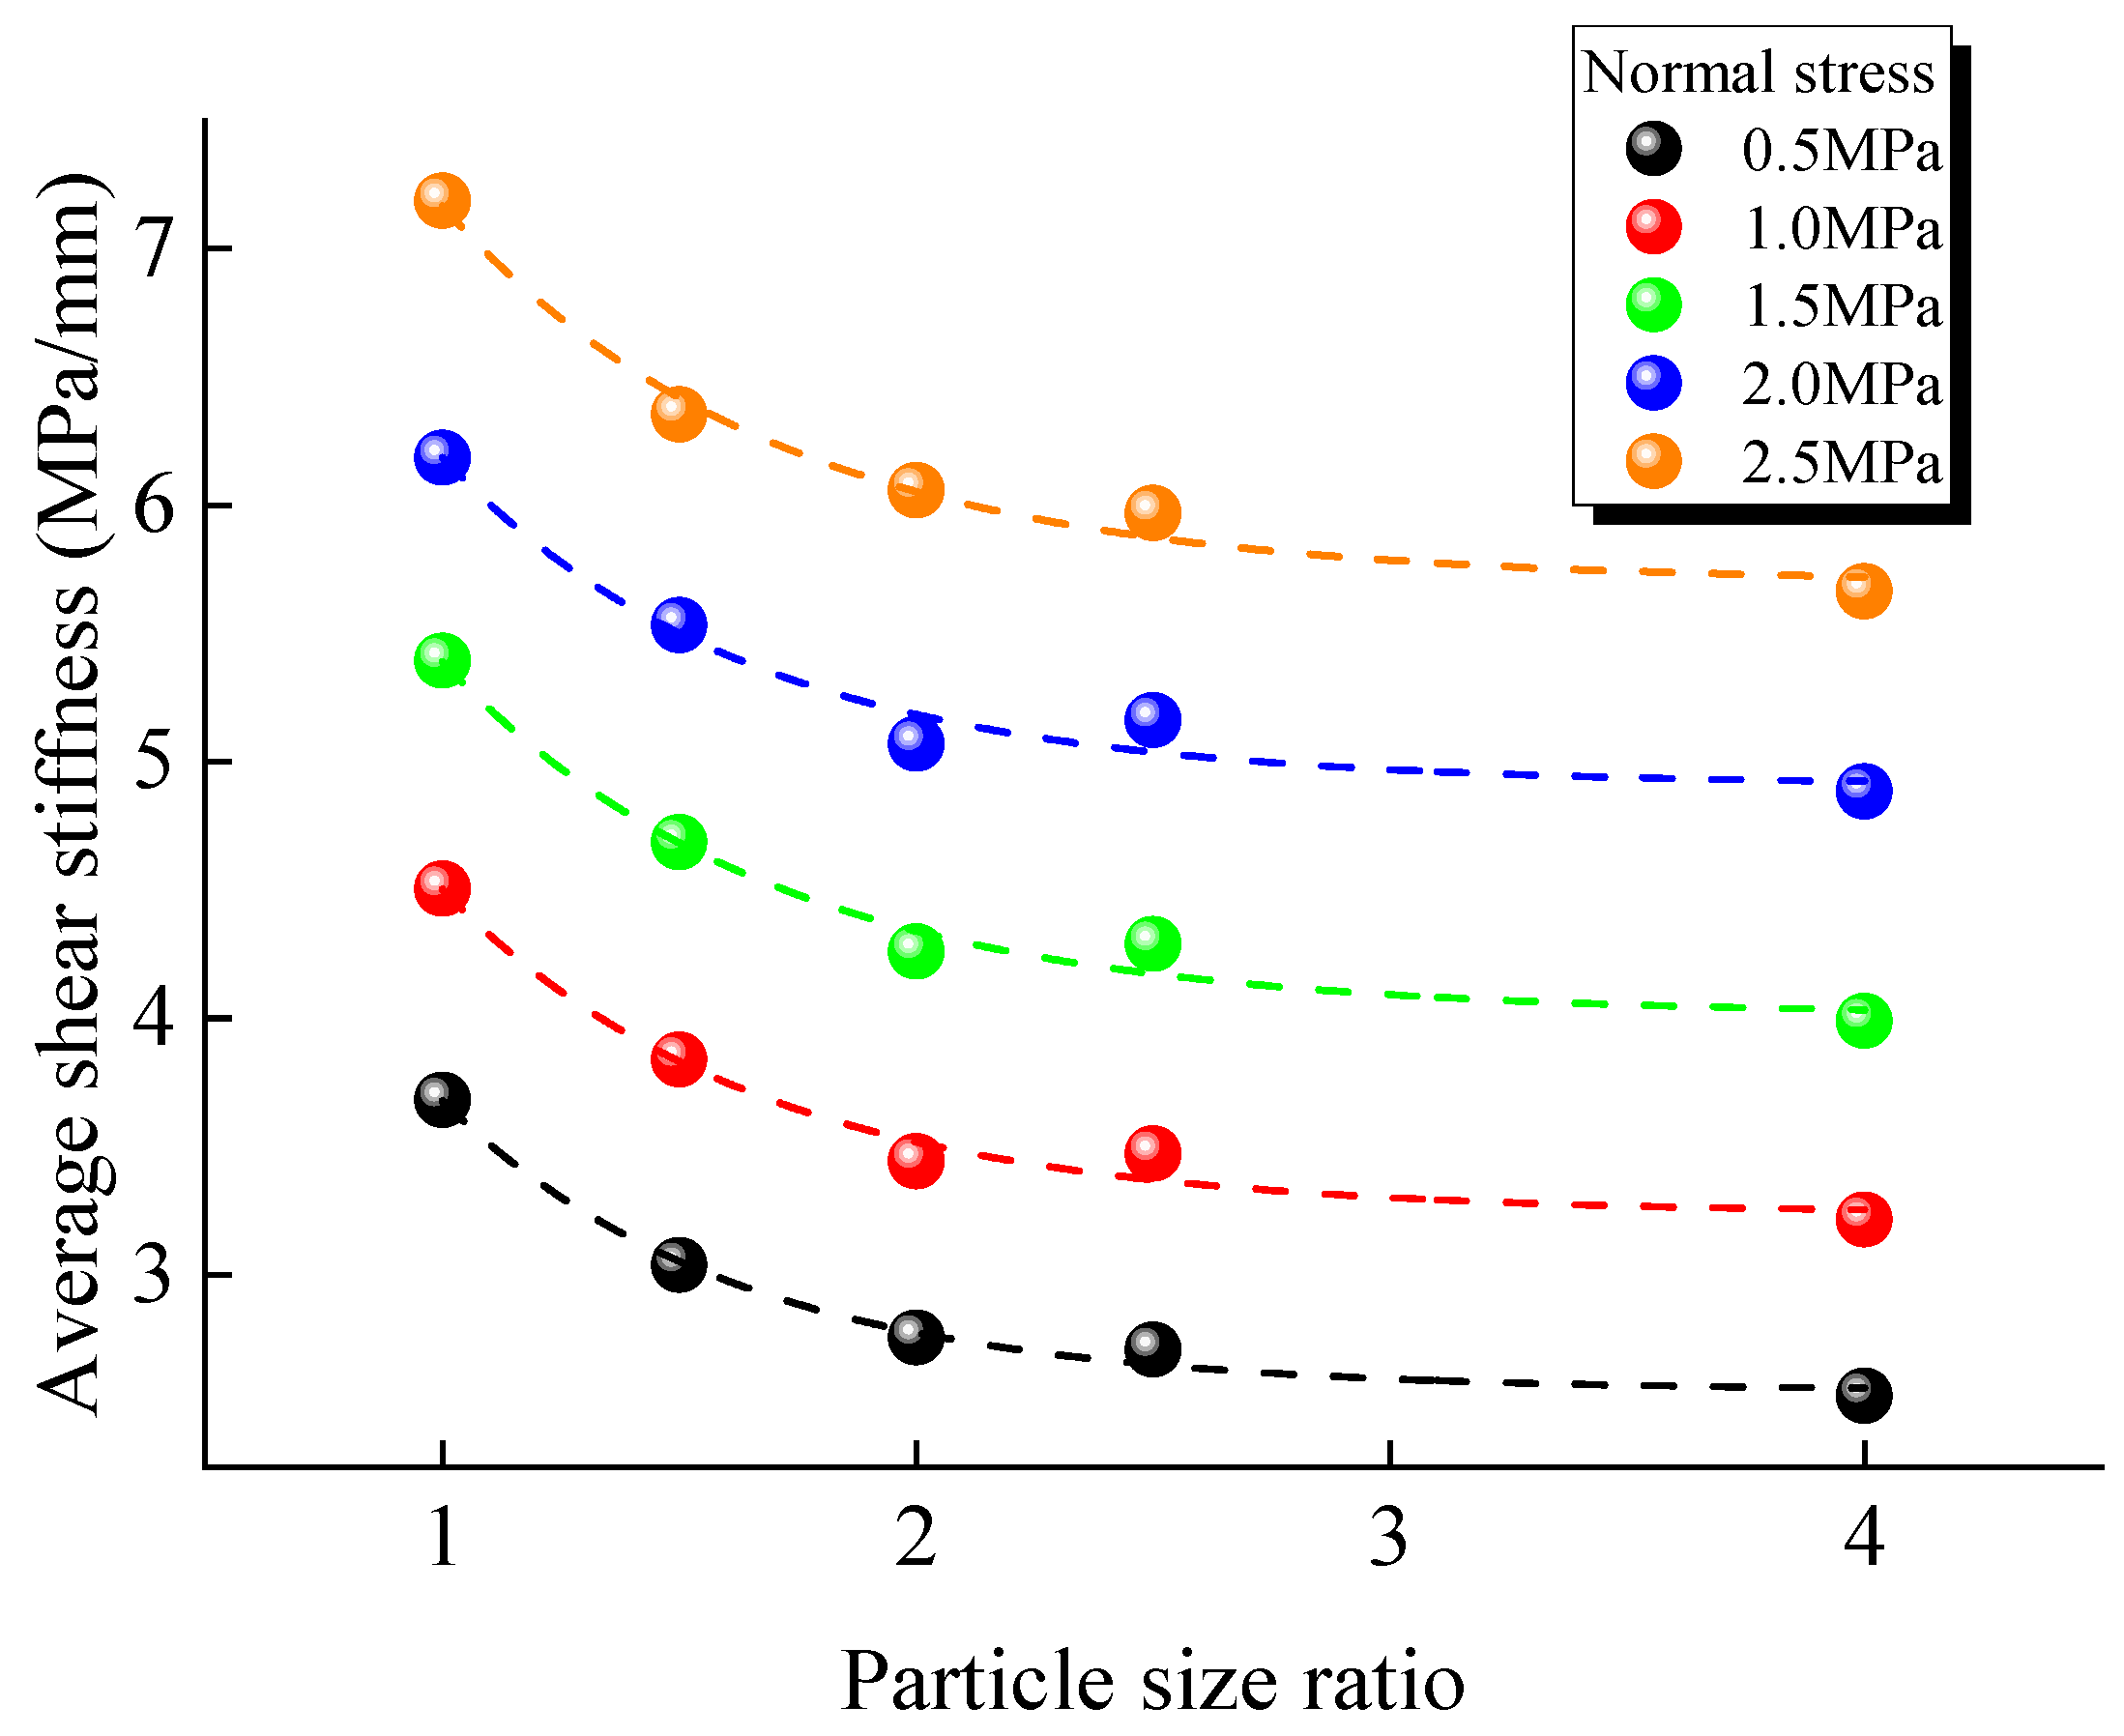
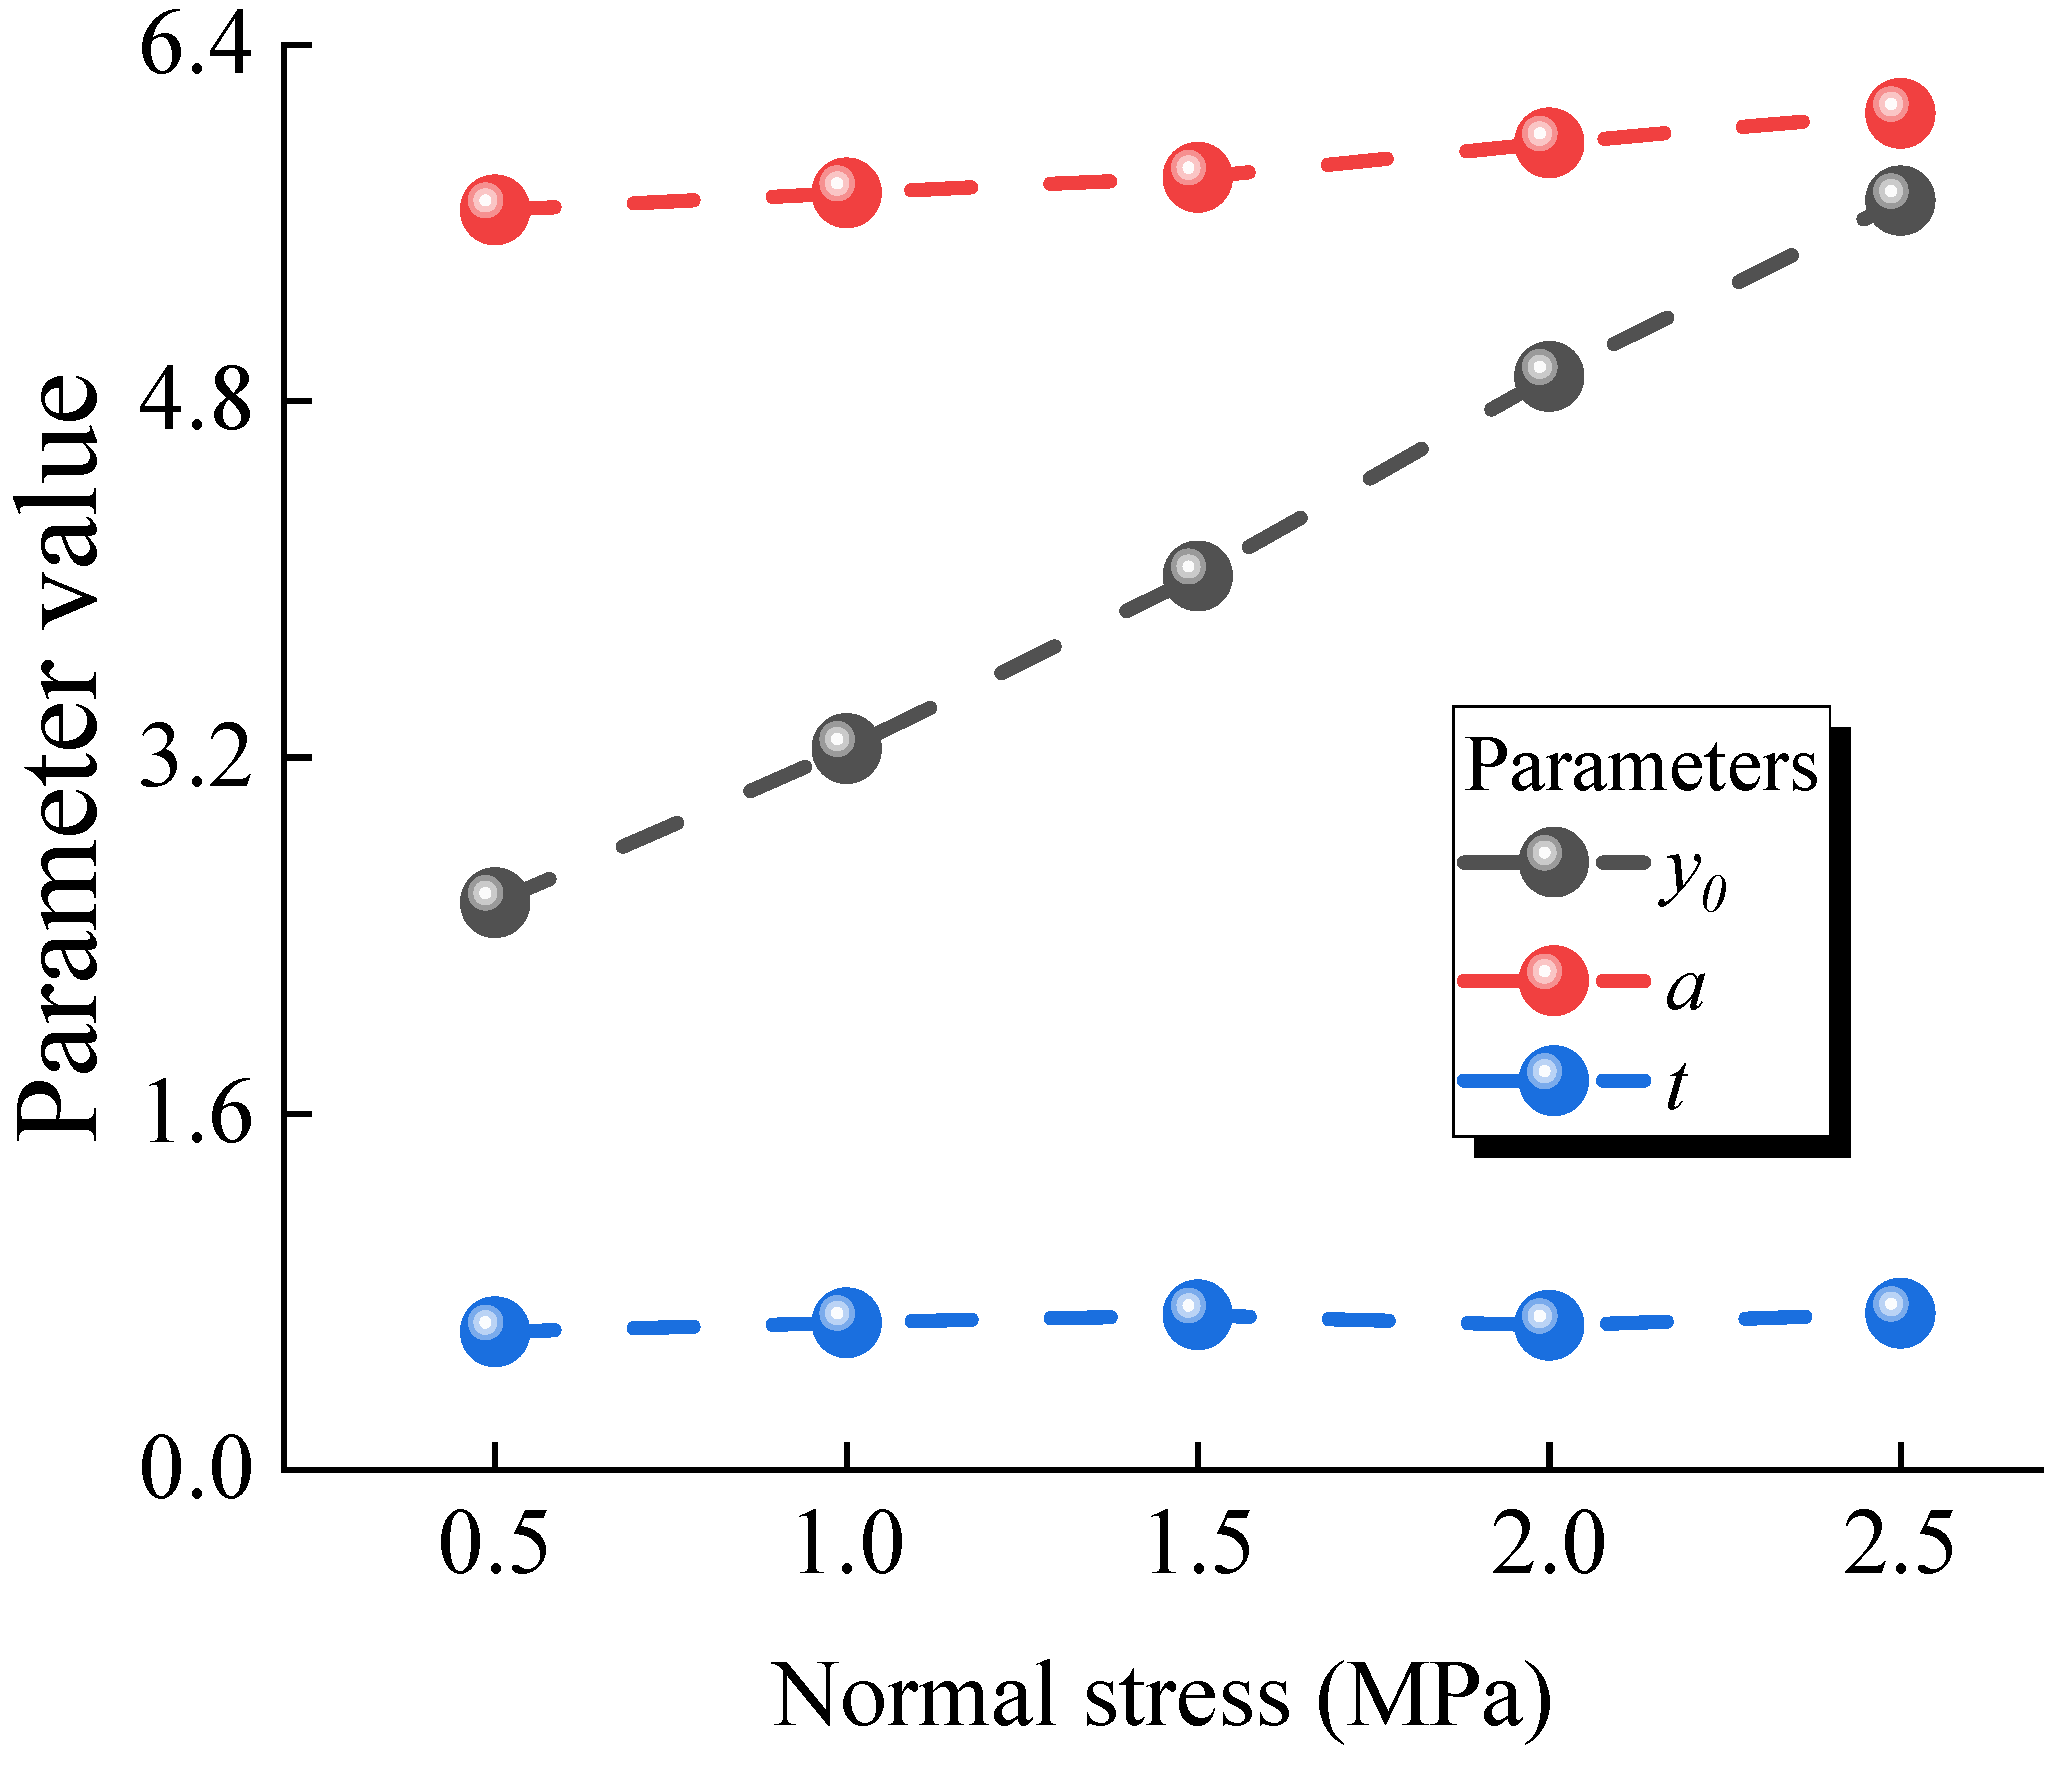
where y s is the shear stiffness and x represents the particle size ratio. y 0 , a , and t all are fitting parameters. The variation curve of the average shear stiffness with the particle size ratio is shown in Figure 24. The obtained function parameters are shown in Table 9 and the variation in the fitted parameters with normal stress is shown in Figure 25.
It can be seen from Figure 24 that the average shear stiffness gradually decreases with the increase in the particle size ratio. With the increase in normal stress, the average shear stiffness decreases by 31.36%, 28.63%, 26.04%, 21.02%, and 21.18%, respectively. The average shear stiffness decreases first at a fast rate and then at a slow rate as the particle size ratio increases, and tends to level off when the particle size ratio is greater than 2.5. This is because the particle size is the same in the model with a particle size ratio of 1.0. They are better able to resist each other’s relative motion, which allows for better conversion of particle contact stiffness to macroscopic shear stiffness. As the particle size ratio increases, the amount of small particles increases, and the small particles in the shear plane cannot resist the movement of other large particles well, so that the deformation increases and the corresponding shear stiffness decreases. Under each normal stress level, the average shear stiffness varies almost the same with the particle size ratio, indicating that the normal stress level has almost no effect on the relationship between shear stiffness and the particle size ratio. It can be found from Table 9 that the nonlinear curves have a good fitting effect, and the coefficients R 2 are above 0.97. From Figure 24, y 0 increases approximately linearly with the growth of normal stress, and its slope is 1.595, and a also increases gradually with the growth of normal stress with a slope of 0.218. This presents that normal stress has effects on both of them. However, t does not change significantly with the variation in normal stress and always fluctuates between 0.62 and 0.7, which indicates that t is not affected by normal stress.

3.5. Discussion

Based on the analysis above, the decreases in the uniaxial compressive strength and elastic modulus with an increasing particle size ratio can be attributed to the changes in particle interactions and microstructural homogeneity. As the particle size ratio increases, the model exhibits a wider range of particle sizes, leading to more significant voids and irregularities in the particle arrangement. This weakens the inter-particle interactions and reduces the overall strength and stiffness. When the particle size ratio is 1.0, all particles are of the same size, resulting in a more uniform and regular arrangement. This enhances the inter-particle interactions and bonding strength, leading to a higher compressive strength and elastic modulus. As the particle size ratio increases, the presence of larger particles creates more significant voids and irregularities in the particle arrangement, weakening the inter-particle interactions and reducing the overall strength and stiffness.
The observed decrease in the dispersion of the compressive strength and elastic modulus with an increasing particle size ratio (beyond 1.5) can be explained by the more effective stress distribution and reduced sensitivity to the particle arrangement. As the particle size ratio increases, the model becomes less sensitive to the spatial arrangement of particles. The presence of a wider range of particle sizes allows for a more effective stress distribution, reducing the impact of local variations in the particle arrangement. This leads to a more uniform stress distribution and lower dispersion of the mechanical properties.
The decrease in shear stiffness with an increasing particle size ratio can be attributed to the reduced interlocking effect and lower microstructural stability. In models with a lower particle size ratio, the smaller particles can interlock more effectively, providing greater resistance to shear deformation. As the particle size ratio increases, the presence of larger particles reduces the interlocking effect, leading to lower shear stiffness. Additionally, a higher particle size ratio results in a more heterogeneous microstructure, with larger particles creating voids that cannot be fully filled by smaller particles. This reduces the microstructural stability of the model, leading to higher deformation under shear loading and lower shear stiffness.
The results suggest that increasing the particle size ratio enhances the particle gradation but reduces the mechanical properties of the model. Therefore, it is crucial to optimize the particle size ratio in numerical simulations to ensure accurate and reliable results. Setting the particle size ratio greater than 1.5 can significantly reduce the dispersion of the numerical simulation results, improving the accuracy and reliability of the simulations.

4. Conclusions

This study employs the Particle Flow Code (PFC) to systematically investigate the influence of particle size parameters on the macroscopic mechanical behavior of rock models under uniaxial compression and direct shear. The findings provide novel insights into the relationships between the particle size, particle size ratio, and the mechanical properties of rock models. The conclusions drawn from this research are summarized as follows:
(1)
Effect of the particle size on the mechanical properties—The results demonstrate that decreasing the particle size (increasing L/dave) leads to a denser packing of particles within the model, thereby enhancing the mechanical properties. Specifically, the uniaxial compressive strength increases by 62.7% and the elastic modulus increases by 49.6% as L/dave increases from 10 to 100. The shear stiffness also increases by approximately 40% as L/dave increases from 10 to 80.
(2)
Reduction in the dispersion of mechanical properties—The dispersion of the compressive strength, elastic modulus, and shear stiffness decreases significantly with increasing L/dave. When L/dave increases from 10 to 100, the dispersion of compressive strength decreases by 88.51%, the dispersion of the elastic modulus decreases by 99.82%, and the dispersion of shear stiffness decreases by 71.87%. This indicates that smaller particle sizes result in more uniform and reliable numerical simulation results. Setting L/dave greater than 50 is recommended to ensure the reliability of the numerical simulations.
(3)
Effect of the particle size ratio on the mechanical properties—Increasing the particle size ratio enhances the particle gradation but reduces the uniaxial compressive strength and elastic modulus. When the particle size ratio increases from 1.0 to 4.0, the uniaxial compressive strength decreases by 29.10% and the elastic modulus decreases by 38.89%. However, the dispersion of mechanical properties is significantly reduced when the particle size ratio is greater than 1.5. This suggests that a particle size ratio greater than 1.5 should be used to ensure the accuracy and reliability of the numerical simulations.

Author Contributions

Conceptualization, C.Y., X.F. and H.L.; methodology, C.Y., S.L. and H.L.; software, X.D., Z.L. and H.L.; formal analysis, S.L.; investigation, S.L. and X.D.; resources, H.L. and X.F.; data curation, C.Y., Z.L. and H.L.; writing—original draft, S.L. and X.D.; writing—review and editing, C.Y., S.L. and H.L. All authors have read and agreed to the published version of the manuscript.

Funding

This paper received funding from Projects 42277175 supported by the National Natural Science Foundation of China; Project 2023JJ30657 supported by the Hunan Provincial Natural Science Foundation of China; the Guizhou Provincial Major Scientific and Technological Program (2023-425); and Yunnan Province Science and Technology Plan Project 202205AD160063. The authors wish to acknowledge this support.

Institutional Review Board Statement

Not applicable.

Informed Consent Statement

Not applicable.

Data Availability Statement

The data used to support the findings of this study are available from the corresponding author upon request.

Conflicts of Interest

Authors Xinglong Feng and Zhengrong Li were employed by the company Yunnan Diqing Non-Ferrous Metals Co., Ltd. The remaining authors declare that the research was conducted in the absence of any commercial or financial relationships that could be construed as a potential conflict of interest.

References

  1. Khosravi, M.; Tabasi, S.; Hossam Eldien, H.; Motahari, M.R.; Alizadeh, S.M. Evaluation and prediction of the rock static and dynamic parameters. J. Appl. Geophys. 2022, 199, 104581. [Google Scholar] [CrossRef]
  2. Walton, G.; Gaines, S. Evaluation of stress path and load rate effects on rock strength using compression testing data for Stanstead Granite. Int. J. Rock Mech. Min. Sci. 2023, 169, 105455. [Google Scholar] [CrossRef]
  3. Liu, J.; Lyu, C.; Lu, G.; Shi, X.; Li, H.; Liang, C.; Deng, C. Evaluating a new method for direct testing of rock tensile strength. Int. J. Rock Mech. Min. Sci. 2022, 160, 105258. [Google Scholar] [CrossRef]
  4. Minakov, A.V.; Pryazhnikov, M.I.; Suleymana, Y.N.; Meshkova, V.D.; Guzei, D.V. Experimental study of nanoparticle size and material effect on the oil wettability characteristics of various rock types. J. Mol. Liq. 2021, 327, 114906. [Google Scholar] [CrossRef]
  5. He, M.; Ren, S.; Xu, H.; Luo, S.; Tao, Z.; Zhu, C. Experimental study on the shear performance of quasi-NPR steel bolted rock joints. J. Rock Mech. Geotech. Eng. 2022, 15, 350–362. [Google Scholar] [CrossRef]
  6. Wang, J.; Li, J.; Shi, Z.; Chen, J.; Lin, H. Fatigue characteristics and fracture behaviour of sandstone under discontinuous multilevel constant-amplitude fatigue disturbance. Eng. Fract. Mech. 2022, 274, 108773. [Google Scholar] [CrossRef]
  7. Li, S.; Lin, H.; Cao, R.; Wang, Y.; Zhao, Y. Mechanical behavior of rock-like specimen containing hole-joint combined flaw under uniaxial loading: Findings from DIC and AE monitoring. J. Mater. Res. Technol. 2023, 26, 3426–3449. [Google Scholar] [CrossRef]
  8. Decký, M.; Remišová, E.; Mečár, M.; Bartuška, L.; Lizbetin, J.; Drevený, I. In situ Determination of Load Bearing Capacity of Soils on the Airfields. Procedia Earth Planet. Sci. 2015, 15, 11–18. [Google Scholar] [CrossRef]
  9. Bandis, S.; Lumsden, A.; Barton, N. Experimental studies of scale effects on the shear behaviour of rock joints. Int. J. Rock Mech. Min. Sci. Geomech. Abstr. 1981, 18, 1–21. [Google Scholar] [CrossRef]
  10. Barton, N.; Choubey, V. The shear strength of rock joints in theory and practice. Rock Mech. 1977, 10, 1–54. [Google Scholar] [CrossRef]
  11. Yong, R.; Qin, J.B.; Huang, M.; Du, S.G.; Liu, J.; Hu, G.J. An Innovative Sampling Method for Determining the Scale Effect of Rock Joints. Rock Mech. Rock Eng. 2018, 52, 935–946. [Google Scholar] [CrossRef]
  12. Fardin, N.; Feng, Q.; Stephansson, O. Application of a new in situ 3D laser scanner to study the scale effect on the rock joint surface roughness. Int. J. Rock Mech. Min. Sci. 2004, 41, 329–335. [Google Scholar] [CrossRef]
  13. Fardin, N.; Stephansson, O.; Jing, L. The scale dependence of rock joint surface roughness. Int. J. Rock Mech. Min. Sci. 2001, 38, 659–669. [Google Scholar] [CrossRef]
  14. Mishaan Lilienthal, G.; Zhong, Y.; Makhnenko, R.Y. Fracture process zone in crystalline rock: Effect of specimen size and shape. Theor. Appl. Fract. Mech. 2023, 128, 104118. [Google Scholar] [CrossRef]
  15. Chen, Y.; Sheng, B.; Xie, S.; Cao, R.; Wang, Y.; Zhao, Y.; Lin, H. Crack propagation and scale effect of random fractured rock under compression-shear loading. J. Mater. Res. Technol. 2023, 23, 5164–5180. [Google Scholar] [CrossRef]
  16. Zhou, Z.; Sun, J.; Lai, Y.; Wei, C.; Hou, J.; Bai, S.; Huang, X.; Liu, H.; Xiong, K.; Cheng, S. Study on size effect of jointed rock mass and influencing factors of the REV size based on the SRM method. Tunn. Undergr. Space Technol. 2022, 127, 104613. [Google Scholar] [CrossRef]
  17. Fakhimi, A.; Alavi Gharahbagh, E. Discrete element analysis of the effect of pore size and pore distribution on the mechanical behavior of rock. Int. J. Rock Mech. Min. Sci. 2011, 48, 77–85. [Google Scholar] [CrossRef]
  18. Wang, J.; Zhang, W.; Tan, C.; Nie, Z.; Ma, W.; Chen, D.; Sun, Q. Multi-dimensional size effects and representative elements for non-persistent fractured rock masses: A perspective of geometric parameter distribution. J. Rock Mech. Geotech. Eng. 2023, 15, 2339–2354. [Google Scholar] [CrossRef]
  19. Sangsefidi, M.; Akbardoost, J.; Zhaleh, A.R. Assessment of mode I fracture of rock-type sharp V-notched samples considering the size effect. Theor. Appl. Fract. Mech. 2021, 116, 103136. [Google Scholar] [CrossRef]
  20. Zhang, S.; Wang, H.; Li, X.; Zhang, X.; An, D.; Yu, B. Experimental study on development characteristics and size effect of rock fracture process zone. Eng. Fract. Mech. 2021, 241, 107377. [Google Scholar] [CrossRef]
  21. Asadi, P.; Ashrafi, M.J.; Fakhimi, A. Physical and numerical evaluation of effect of specimen size on dynamic tensile strength of rock. Comput. Geotech. 2022, 142, 104538. [Google Scholar] [CrossRef]
  22. Zhang, Q.; Zhu, H.; Zhang, L.; Ding, X. Study of scale effect on intact rock strength using particle flow modeling. Int. J. Rock Mech. Min. Sci. 2011, 48, 1320–1328. [Google Scholar] [CrossRef]
  23. Bahaaddini, M.; Hagan, P.C.; Mitra, R.; Hebblewhite, B.K. Scale effect on the shear behaviour of rock joints based on a numerical study. Eng. Geol. 2014, 181, 212–223. [Google Scholar] [CrossRef]
  24. Cheng, Y.; Yang, W.; He, D. Influence of structural plane microscopic parameters on direct shear strength. Adv. Civ. Eng. 2018, 2018, 9178140. [Google Scholar] [CrossRef]
  25. Cao, R.-h.; Yao, R.; Lin, H.; Lin, Q.-b.; Meng, Q.; Li, T. Shear behaviour of 3D nonpersistent jointed rock-like specimens: Experiment and numerical simulation. Comput. Geotech. 2022, 148, 104858. [Google Scholar] [CrossRef]
  26. Cao, R.-h.; Yao, R.; Hu, T.; Wang, C.; Li, K.; Meng, J. Failure and mechanical behavior of transversely isotropic rock under compression-shear tests: Laboratory testing and numerical simulation. Eng. Fract. Mech. 2021, 241, 107389. [Google Scholar] [CrossRef]
  27. Lin, Q.; Cao, P.; Liu, Y.; Cao, R.; Li, J. Mechanical behaviour of a jointed rock mass with a circular hole under compression-shear loading: Experimental and numerical studies. Theor. Appl. Fract. Mech. 2021, 114, 102998. [Google Scholar] [CrossRef]
  28. Zhao, T.; Li, Q.; Yu, B.; Huang, C.; Gao, Z. Mechanical behavior and failure characteristics of rock with double holes. Structures 2023, 54, 38–47. [Google Scholar] [CrossRef]
  29. Zhu, Y.; Dou, L.; Zhang, S.; Cui, X.; Xing, Q.; Li, J. Numerical study of the influence of grain size and heterogeneity on thermal cracking and damage of granite. Geoenergy Sci. Eng. 2024, 233, 212507. [Google Scholar] [CrossRef]
  30. Peng, J.; Wong, L.N.Y.; Teh, C.I. Influence of grain size on strength of polymineralic crystalline rock: New insights from DEM grain-based modeling. J. Rock Mech. Geotech. Eng. 2021, 13, 755–766. [Google Scholar] [CrossRef]
  31. Ding, X.; Zhang, L.; Zhu, H.; Qi, Z. Effect of Model Scale and Particle Size Distribution on PFC3D Simulation Results. Rock Mech. Rock Eng. 2014, 47, 2139–2156. [Google Scholar] [CrossRef]
  32. Asadi, P.; Fakhimi, A. Bonded particle modeling of grain size effect on tensile and compressive strengths of rock under static and dynamic loading. Adv. Powder Technol. 2023, 34, 104013. [Google Scholar] [CrossRef]
  33. Ríos-Bayona, F.; Johansson, F.; Mas-Ivars, D.; Sánchez-Juncal, A.; Bolin, A. Using PFC2D to simulate the shear behaviour of joints in hard crystalline rock. Bull. Eng. Geol. Environ. 2022, 81, 381. [Google Scholar] [CrossRef]
  34. Liu, H.; Zhang, X.; Lin, H.; Chen, Y.; Yang, C.; Ou, K. Shear Mechanical Properties of Rock Joints Under Non-Uniform Load Based on DEM. Appl. Sci. 2025, 15, 4257. [Google Scholar] [CrossRef]
  35. Chen, Y.; Lin, H.; Ding, X.; Xie, S. Scale effect of shear mechanical properties of non-penetrating horizontal rock-like joints. Environ. Earth Sci. 2021, 80, 192. [Google Scholar] [CrossRef]
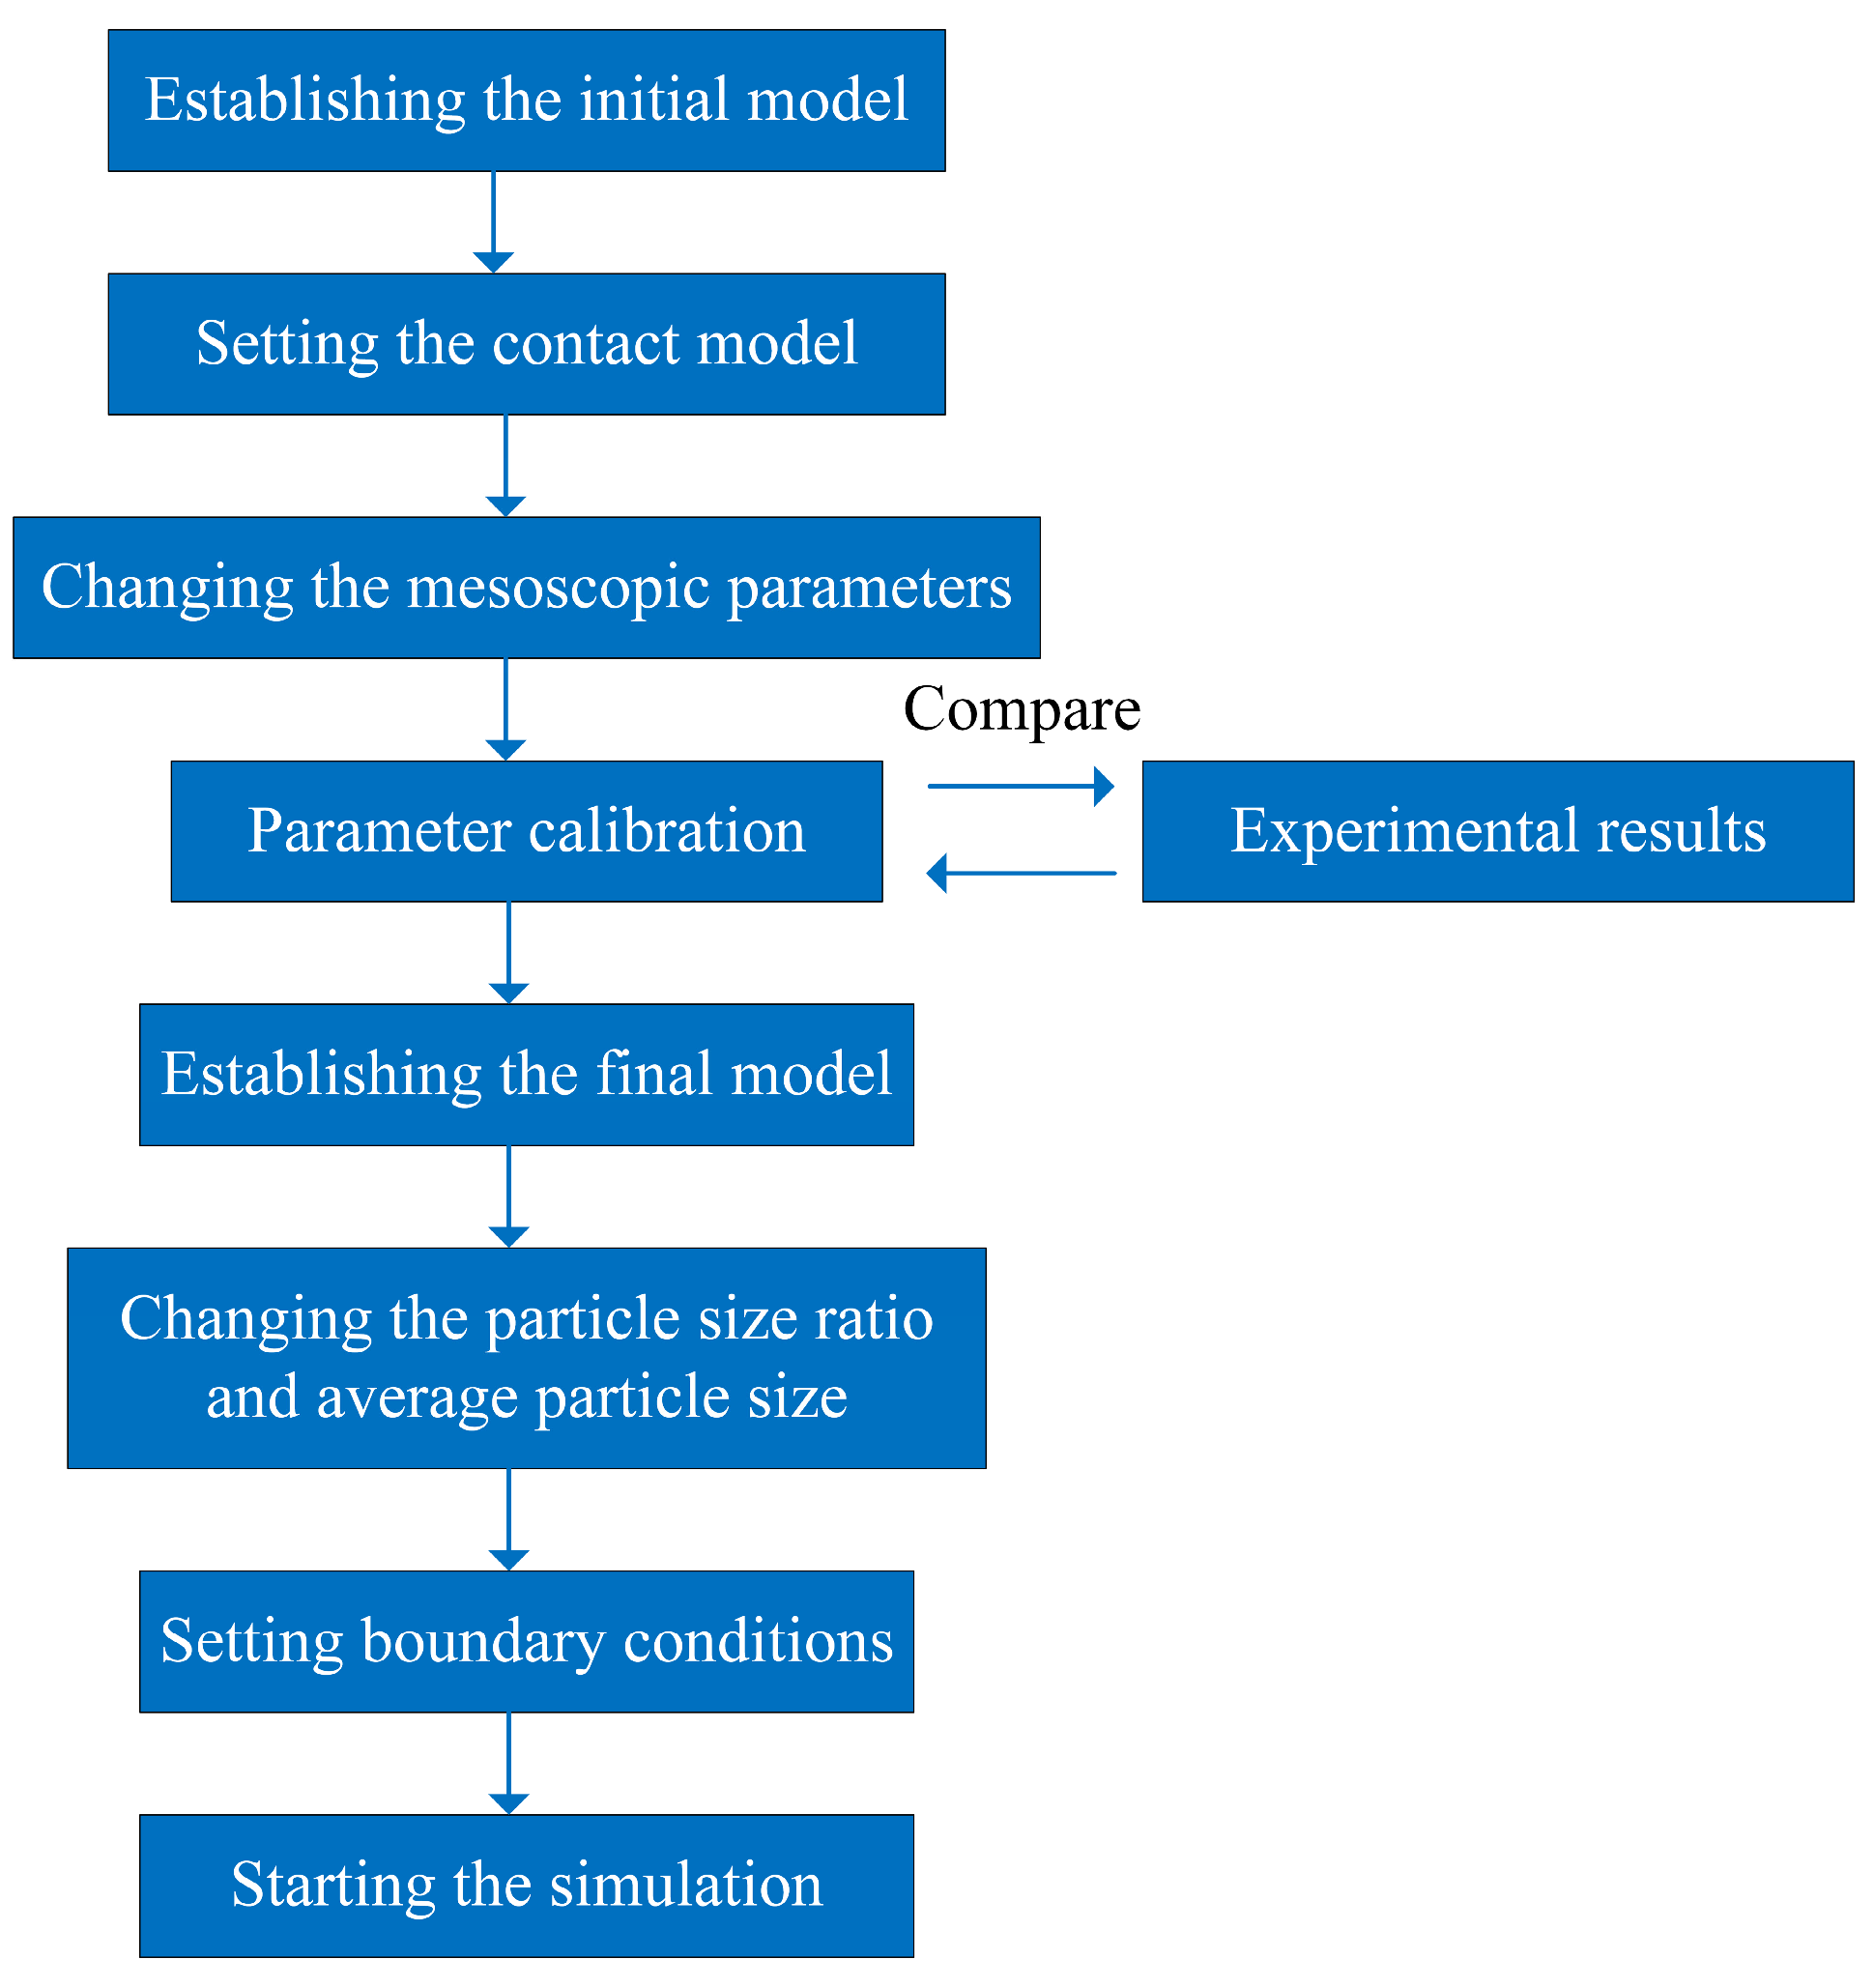
Figure 1. Flow chart of model generation.
Applsci 15 04882 g001
Figure 2. Schematic diagram of the generated uniaxial compression model.
Applsci 15 04882 g002
Figure 3. Relationship between the particle number and L/dave.
Applsci 15 04882 g003
Figure 4. Stress–strain curves of model with different L / d a v e .
Applsci 15 04882 g004
Figure 5. Relationship between the uniaxial compressive strength and L/dave.
Applsci 15 04882 g005
Figure 6. Relationship between the uniaxial compressive strength variance and L/dave.
Applsci 15 04882 g006
Figure 7. Variation in the elastic modulus with L/dave.
Applsci 15 04882 g007
Figure 8. Variation in the elastic modulus variance with L/dave.
Applsci 15 04882 g008
Figure 9. Schematic diagram of the generated model used for the shear test.
Applsci 15 04882 g009
Figure 10. Relationship between the particle amount and L/dave.
Applsci 15 04882 g010
Figure 11. Variation in the shear stiffness with L/dave under a normal stress of 2.0 MPa.
Applsci 15 04882 g011
Figure 12. Relationship between shear stiffness variance and L/dave for specimens under different normal stress levels.
Applsci 15 04882 g012
Figure 13. Schematic diagram of uniaxial compression model generation.
Applsci 15 04882 g013
Figure 14. Relationship between the particle amount and particle size ratio.
Applsci 15 04882 g014
Figure 15. Stress–strain curves of models with different particle size ratios.
Applsci 15 04882 g015
Figure 16. Failure modes of models with different particle size ratios.
Applsci 15 04882 g016
Figure 17. Variation in the uniaxial compressive strength with particle size ratio.
Applsci 15 04882 g017
Figure 18. Standard deviation of the uniaxial compressive strength with the particle size ratio.
Applsci 15 04882 g018
Figure 19. Force chain of models with particle size ratios of 1.0 versus 2.0.
Applsci 15 04882 g019
Figure 20. Variation in the elastic modulus with the particle size ratio.
Applsci 15 04882 g020
Figure 21. Variation in the standard deviation of the elastic modulus with the particle size ratio.
Applsci 15 04882 g021
Figure 22. Schematic diagram of the generated models for the direct shear test.
Applsci 15 04882 g022
Figure 23. Relationship between the particle amount and particle size ratio.
Applsci 15 04882 g023
Figure 24. Variation in the average shear stiffness with the particle size ratio under different normal stress levels.
Applsci 15 04882 g024
Figure 25. Variation in the fitted parameters with normal stress.
Applsci 15 04882 g025
Table 1. Calibrated mesoscopic parameters of the model.
Parameter TypeMesoscopic ParametersValue
Particles’ basic parametersParticle density (kg/m3)2020
Porosity0.1
Particle radius ratio1.5
Contact modulus (GPa)1.95
Stiffness ratio1.5
Friction coefficient5.5
Parallel bonding parametersParallel bonding modulus (MPa) 30
Parallel bonding stiffness ratio 3.0
Parallel bonding normal strength (MPa) 1.6
Parallel bonding cohesion (MPa) 1.68
Parallel bonding internal friction angle (°)55.3
Table 2. Particle size ranges and corresponding L/dave.
Specimen IDParticle Size Range ( R m i n ~ R m a x ) (mm) L / d a v e
01, 02, 03, 042.0~3.010
0.6~0.933
0.4~0.650
0.267~0.475
0.2~0.3100
Table 3. Range analysis of compressive strength.
L/daveCompressive Strength Range (MPa)Percentage of the Range of Average Strength
101.9926.5%
331.7219.3%
501.5115.1%
751.2310.9%
1000.554.5%
Table 4. Range of elastic moduli corresponding to different L/dave.
L/daveElastic Modulus Range (GPa)Percentage of the Range of the Average Elastic Modulus
100.3023.3%
330.085.3%
500.084.9%
750.042.2%
1000.010.5%
Table 5. Particle size ranges and relevant test parameters.
Specimen ID Particle   Size   Range   ( R m i n ~ R m a x ) (mm)L/daveNormal Stress (MPa)
01, 02, 03, 044.0~6.0100.5, 1.0, 1.5,
2.0, 2.5
2.0~3.020
0.8~1.250
0.6~0.967
0.5~0.7580
Table 6. Average shear stiffness corresponding to different L/dave ratios and normal stress.
L/daveNormal Stress
0.5 MPa1.0 MPa1.5 MPa2.0 MPa2.5 MPa
102.522.893.143.984.35
202.703.314.014.735.49
502.863.674.425.246.05
673.013.794.635.566.34
803.323.904.655.566.44
Increasing ratio31.75%34.95%48.09%39.70%48.05%
Table 7. Particle size range and corresponding particle size ratio.
Specimen IDParticle Size Range
( R m i n ~ R m a x ) (mm)
Particle Size Ratio
Rmas/Rmin
01, 02, 03, 040.75~0.751.0
0.6~0.91.5
0.5~1.02.0
0.429~1.07252.5
0.3~1.24.0
Table 8. Particle size ranges and test parameters.
Specimen IDParticle Size Range (mm) R m a x / R m i n Normal Stress (MPa)
01, 02, 03, 040.75~0.751.00.5, 1.0, 1.5, 2.0, 2.5
0.6~0.91.5
0.5~1.02.0
0.429~1.07252.5
0.3~1.24.0
Table 9. Fitting parameters of the average shear stiffness equation y s = y 0 + a × e x / t .
Normal Stress0.5 MPa1.0 MPa1.5 MPa2.0 MPa2.5 MPa
Parameter
y 0 2.553.244.024.915.70
a 5.665.745.815.966.09
t 0.620.660.700.650.70
R 2 (COD)0.9940.9830.9820.9710.987
Disclaimer/Publisher’s Note: The statements, opinions and data contained in all publications are solely those of the individual author(s) and contributor(s) and not of MDPI and/or the editor(s). MDPI and/or the editor(s) disclaim responsibility for any injury to people or property resulting from any ideas, methods, instructions or products referred to in the content.