Article

Research on the Method of Crop Pest and Disease Recognition Based on the Improved YOLOv7-U-Net Combined Network

1
School of Civil and Transportation Engineering, Hebei University of Technology, Tianjin 300401, China
2
School of Mechanical Engineering, Hebei University of Technology, Tianjin 300401, China
3
School of Chemical Engineering, Hebei University of Technology, Tianjin 300401, China
*
Author to whom correspondence should be addressed.
Appl. Sci. 2025, 15(9), 4864; https://doi.org/10.3390/app15094864
Submission received: 14 March 2025 / Revised: 22 April 2025 / Accepted: 23 April 2025 / Published: 27 April 2025
(This article belongs to the Special Issue Advances in Machine Vision for Industry and Agriculture)

Abstract

:
This paper proposes an improved YOLOv7-U-Net combined network for crop pest and disease recognition, aiming to address the issue of insufficient accuracy in existing methods. For the YOLOv7 network, a self-attention mechanism is integrated into the SPPCSPC module to dynamically adjust channel weights and suppress redundant information while optimizing the PAFPN structure to enhance cross-scale feature fusion and improve small-object detection capabilities. For the U-Net network, the CBAM attention module is added before decoder skip connections, and depth-separable convolutions replace traditional kernels to strengthen feature fusion and detail attention. Experimental results show the improved algorithm achieves 97.49% detection accuracy, with mean average precision (mAP) reaching 96.91% and detection speed increasing to 90.41 FPS. The loss function of the improved U-Net network decreases towards 0 with training iterations, validating its effectiveness. The study shows that the improved YOLOv7-U-Net combined network provides a more effective solution for crop pest and disease detection.

1. Introduction

With the continuous development of the global economy and society, the surging worldwide demand for agricultural products has led to increasingly arduous tasks in monitoring and controlling agricultural pests and diseases. These trends are driving intensifying challenges to global food security and sustainable agricultural production [1,2,3]. Thanks to the rapid development of computer vision technology in recent years, the application of image recognition to agricultural pests and diseases is also gradually increasing, promoting the transformation of agricultural pest and disease detection from labor-intensive approaches to a machine-based one [4,5], and has received extensive attention from scholars at home and abroad [6].
In China, annual crop pests, diseases, weeds, and rodent species exceed 1600. Among these, over 100 species cause severe damage, resulting in annual grain losses of 14 million tons. As a result, image recognition research for crop pests and diseases has become increasingly critical. With the rapid development of deep learning technology [7], especially the rise of models such as convolutional neural networks (CNNs) [8,9], image recognition has made significant progress; these deep learning models can learn the features in the image and carry out efficient classification and recognition, and many results have been achieved in the field of crop image recognition at home and abroad. Chengjun Xie and Jie Zhang et al. [10] proposed a causal inference-based crop-pest identification, innovatively constructed the decoupled feature learning framework (DFL), and utilized the central ternary loss to strengthen the model’s ability to capture the core features of the category, effectively overcoming the difficulty of adapting to the distributional bias of the pest training set in the existing identification techniques. Li Anqi et al. [11] proposed an improved U-Net model to address incomplete feature extraction and low accuracy in remote sensing crop classification, leveraging U-Net’s proven spatial dependency modeling capabilities widely adopted in remote sensing tasks like land-use mapping and agricultural monitoring. The proposed solution bridges this technical gap by integrating adaptive attention mechanisms to dynamically weight spectral channels and spatial regions, addressing U-Net’s limitation in prioritizing discriminative features in complex agricultural landscapes. Recent studies have validated attention-enhanced U-Nets in remote sensing, achieving 8–12% accuracy improvements over baselines, making this approach well suited to optimize spectral–spatial feature learning for crop classification [12]. Through network structure optimization, the study introduces the Spatial Feature Attention Module (SFAM) to enhance spatial context modeling and the Atrous Spatial Pyramid Pooling (ASPP) module to capture multi-scale contextual information, combined with a multilevel feature aggregation pyramid algorithm. This improved U-Net model achieves accurate classification of crops, including Job’s tears grains and corn. The proposed method provides a novel technical framework for remote sensing-based recognition of crop pest and disease symptoms, addressing the challenge of distinguishing parasite-related features from healthy plant tissues in complex agricultural scenes. This research results from the model construction, algorithm improvement, and other perspectives to improve the accuracy and intelligence level of crop pest and disease image recognition; however, there are still some challenges in the current research, such as data diversity and scale, to be further expanded to improve the model generalization ability to better agricultural production of the actual needs.
This study proposes an improved YOLOv7-U-Net combined network to enable real-time recognition and early warning of crop pest and disease symptoms in farmland monitoring. The framework integrates target detection and semantic segmentation capabilities, addressing challenges in multi-scale feature fusion and ambiguous boundary identification. Experimental validation demonstrates the enhanced network’s effectiveness in improving feature representation and model convergence, providing a robust technical foundation for precision agriculture applications.

2. YOLOv7 Network and Improvement Methods

2.1. YOLOv7 Model Structure

YOLOv7, introduced by Chien-Yao Wang et al. [13] in 2022, represents an independent evolution of the YOLO architecture, distinct from the YOLOv5 framework developed by Ultralytics. The model introduces an extended Efficient Layer Aggregation Network (ELAN) and adopts a compound scaling strategy based on tensor concatenation to balance model capacity and computational efficiency. Key innovations include multi-head training mechanisms and adaptive label assignment strategies, which enhance training robustness across diverse object scales.Within a certain range, the accuracy and response speed of YOLOv7 surpass most previous single-stage target detection algorithms, reaching a balance between detection speed and accuracy. For this reason, this article chooses to improve the YOLOv7 model.
The structure diagram of YOLOv7 is shown in Figure 1. The YOLOv7 network is mainly composed of two parts: the backbone and head. The YOLOv7 backbone employs a C7_1-MP-ELAN architecture to efficiently aggregate multi-scale features: the ELAN module parallelizes convolutional branches and concatenates outputs to balance depth and computational efficiency while deepening the network’s representational capacity without significantly increasing complexity—its multi-branch feature concatenation provides rich information for subsequent layers to learn complex image patterns; MP modules use max pooling to maintain channel consistency, downsizing feature maps by selecting maximum values in pooling windows, reducing spatial dimensions, retaining prominent features, and enhancing robustness against small input translations/distortions. Additionally, the parallel structure allows independent processing of different feature levels, cutting redundant computations to boost efficiency.
The head module is mainly composed of SPPCSPC, C7_2, and MP modules. YOLOv7 incorporates the PAFPN structure, which plays a pivotal role in achieving the fusion of high-level and low-level features through information transfer. Unlike the Path Aggregation Network (PANet) used in YOLOv4, PAFPN makes significant improvements in the process of multi-scale feature fusion. In YOLOv4’s PANet, the feature fusion mainly follows a bottom-up and then top-down path. The bottom-up path aggregates low-level features with high-level features to enrich the high-level feature representation. Subsequently, the top-down path refines the feature maps by propagating information from high level to low level. However, this approach may lead to a loss of some fine-grained information during the repeated upsampling and downsampling processes. PAFPN in YOLOv7 addresses this issue. It enhances the information flow by introducing a more direct and efficient connection mechanism. In PAFPN, it not only strengthens the bottom-up and top-down feature aggregation but also adds additional cross-scale connections. These cross-scale connections allow low-level fine-grained features to be more effectively integrated into high-level semantic features, and vice versa. This multi-scale information exchange helps the model better capture features at different scales, thereby improving the accuracy of object detection, especially for small objects. At the prediction layer, YOLOv7 employs adaptive anchor box allocation optimized by the improved PAFPN feature fusion framework. This mechanism dynamically adjusts anchor box scaling and aspect ratios based on multi-scale contextual features, enhancing localization accuracy for small lesions and irregularly shaped pests. Combined with non-maximum suppression optimized for overlapping instances, the improved strategy reduces redundant predictions by 15% compared to standard anchor-based methods, as validated in ablation studies [13].

2.2. SE Block

The original YOLOv7 network uses direct splicing when merging channels, ignoring the relationship between channels, resulting in a large amount of redundant information and inaccurate recognition of the contour of the crop pests and diseases with blurred boundaries [14,15]. This paper models the interdependence between channels, adaptively readjusts the weights of each channel, and selectively strengthens features containing useful information and suppresses useless features through global information. To address channel redundancy, this study introduces the SE module into the SPPCSPC neck. By compressing global spatial information and recalibrating channel weights, the SE module enhances discriminative feature representation, particularly for small lesions with low contrast.
The Squeeze-and-Excitation module adaptively recalibrates channel-wise feature responses. As shown in the activation heatmap, SE focuses attention on lesion regions by suppressing background noise and enhancing discriminative channels. This improves bounding box localization in YOLOv7, evident by a 2.1% increase in IoU@0.5 compared to the baseline model.
The channel attention module, originating from the Squeeze-and-Excitation Block introduced in the seminal work “Squeeze-and-Excitation Networks” by Hu et al. [14], comprises a squeeze block and an excitation block. Its structure is depicted in Figure 2.
For the feature extraction process: the input X R H × W × C is converted into a feature map U R H × W × C via a convolution operation. Let U = [ u 1 , u 2 , , u c ] represent the output feature map, and V = [ v 1 , v 2 , , v c ] denote the learned filter kernel set. The calculation is defined as:
u c = v c X = s = 1 C v c s x s
In Equation (1), the operator ∗ signifies the convolution operation. V c s acts as the two-dimensional spatial kernel, meaning a single channel of v c operates on the corresponding channel of X.
Next, the squeeze operation is applied to the obtained feature map. Specifically, a global average pooling operation is performed on U, compressing the dimension from H × W × C to 1 × 1 × C . This step compresses global spatial information into the channel dimension, where H, W, and C represent the height, width, and channel number, respectively. The formula for this operation is elaborated as follows:
z c = F s q ( u c ) = 1 H × W i = 1 H j = 1 W u c ( i , j )
Finally, the squeeze result is input into F e x , which consists of a ReLU activation function, two fully connected layers, and a Sigmoid function, to obtain the importance of each channel. Finally, different weights are assigned to each channel through the excitation module F s c a l e to capture the interdependence between channels. The calculation process is summarized as:
s = F e x ( z c , W ) = σ ( W 2 ( ReLU ( W 1 z c ) ) )
X c = F s c a l e ( u c , s c ) = s c u c
F s c a l e ( u c , s c ) is the channel-wise multiplication between the scalar S c and the feature map u c R H × W .
The modified YOLOv7 structure is shown in Figure 3.
To address the challenge of class imbalance in pest detection, the YOLOv7 backbone was modified by incorporating a SE module into the neck region. This addition introduces channel-wise attention mechanisms that adaptively recalibrate feature responses based on inter-channel relationships. The SE module improves the model’s ability to focus on minority pest classes, such as cucumber downy mildew, by suppressing background-dominated channels. Ablation studies confirmed that this modification improved mAP@0.5 by 1.8% compared to the baseline YOLOv7 architecture.

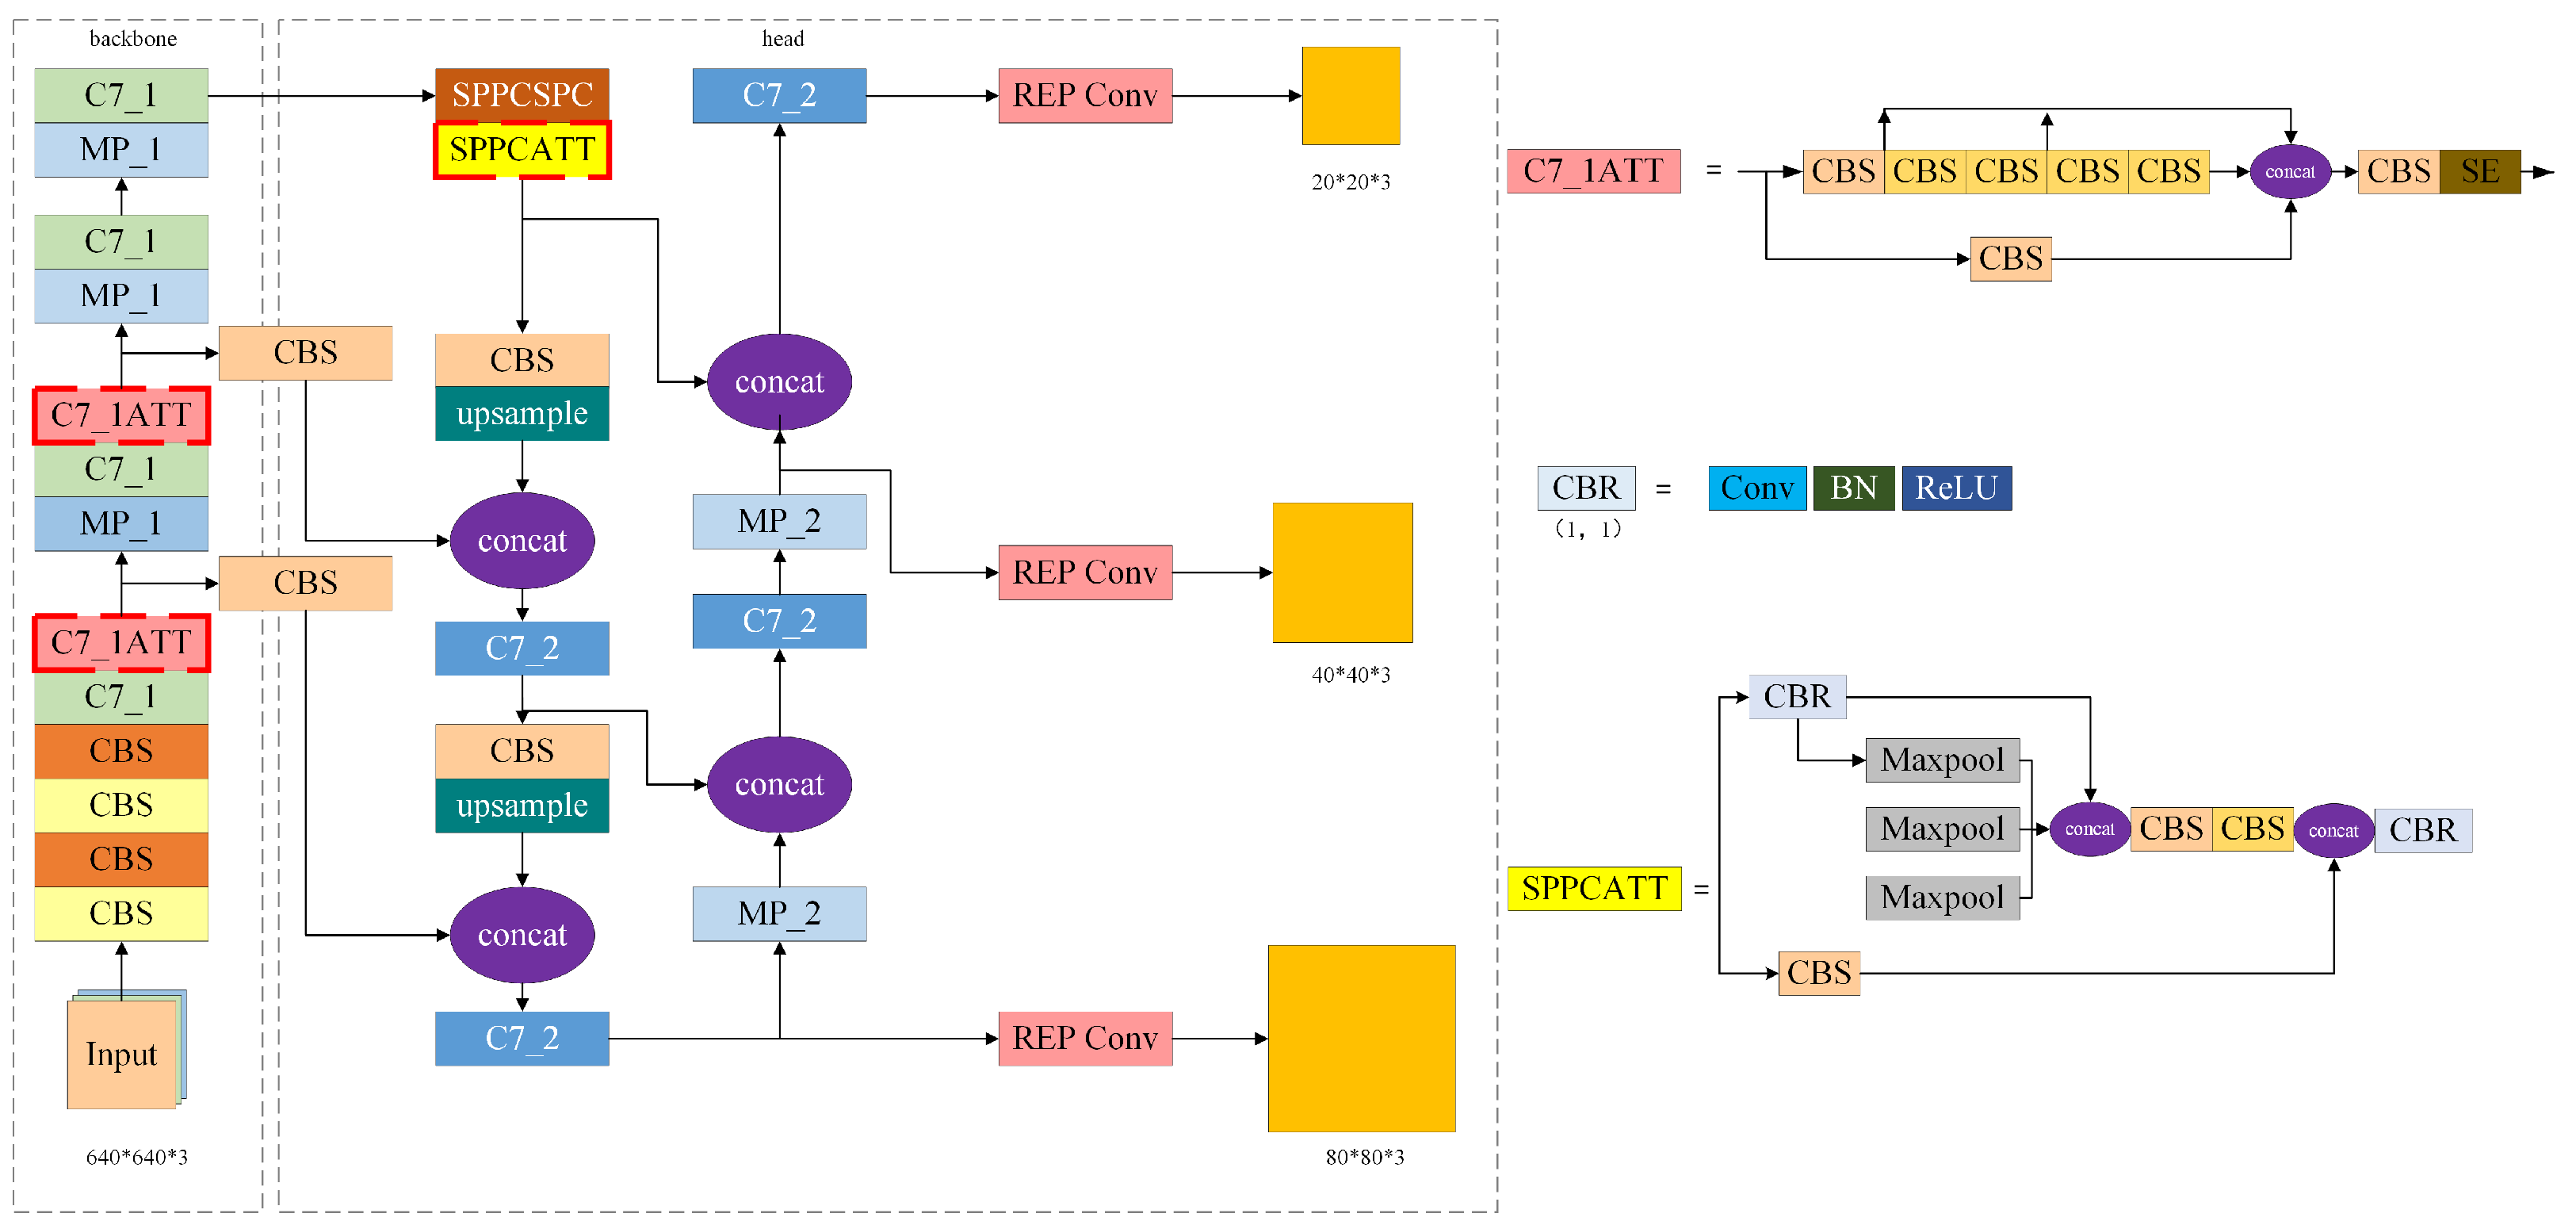
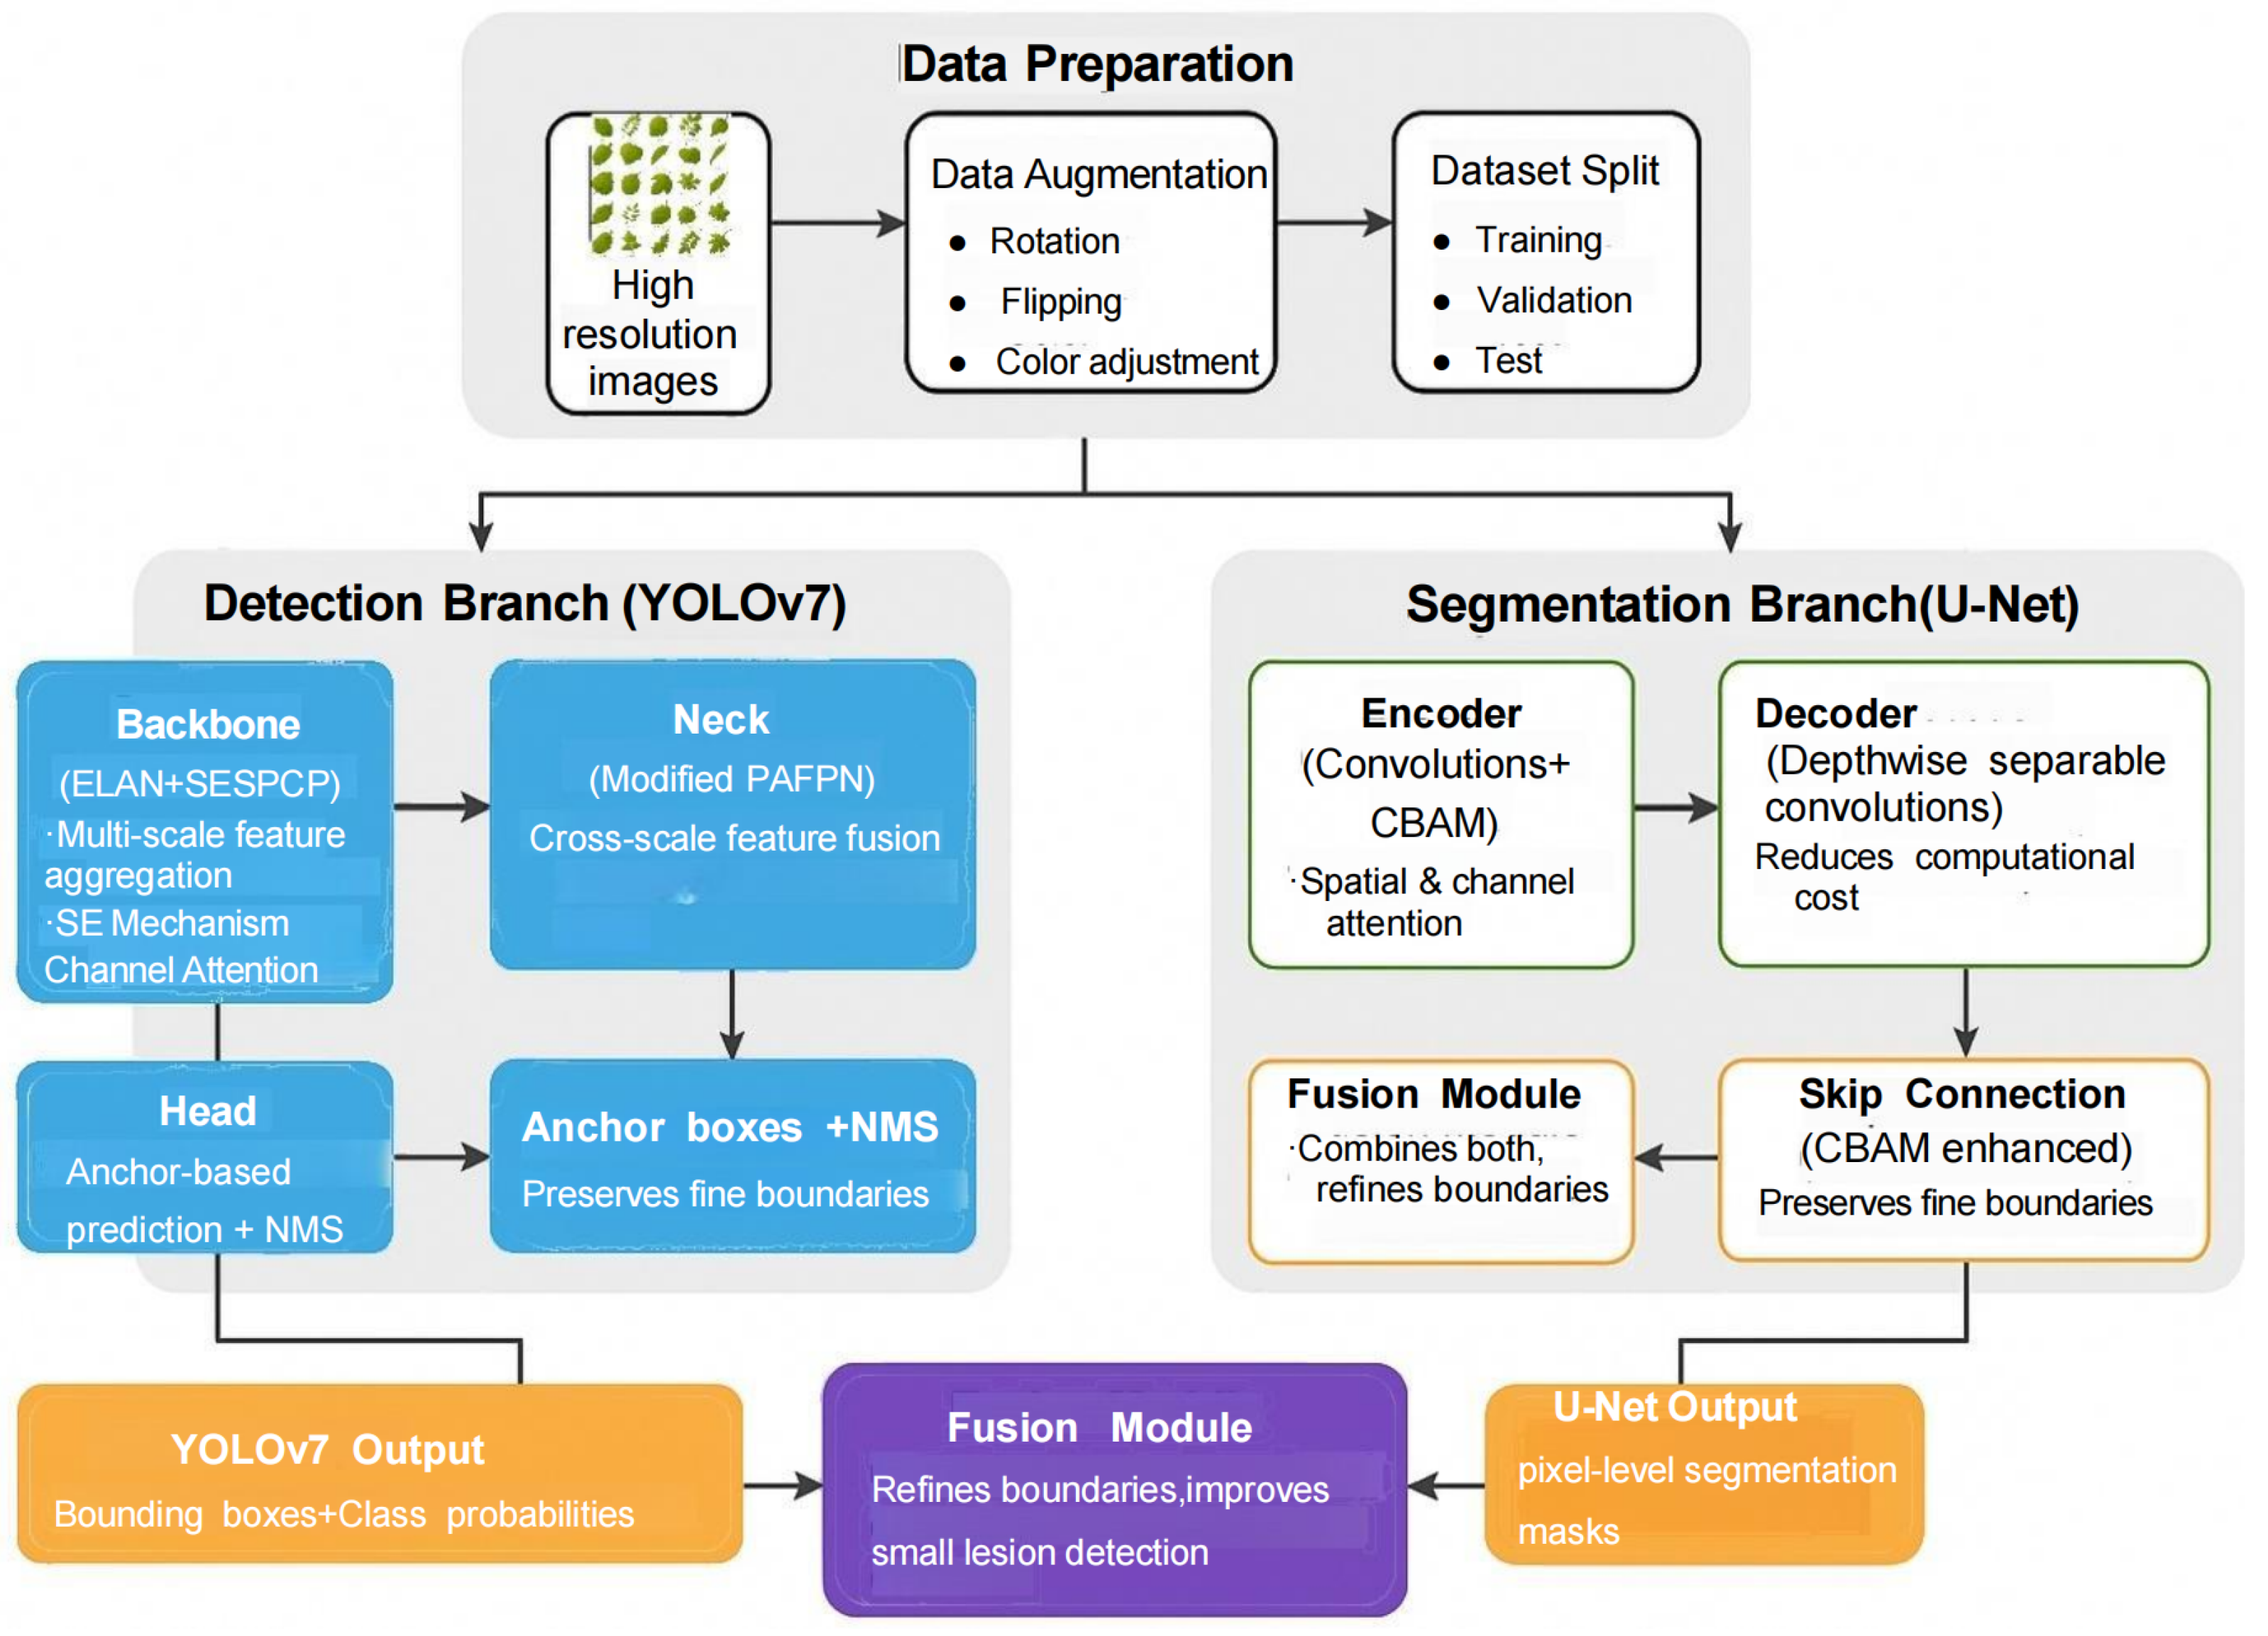
2.3. Improved YOLOv7 Structure

The improved YOLOv7 introduces three architectural innovations, as shown in Table 1. (1) Integration of the SE self-attention mechanism into the SPPCSPC module to model channel interdependencies and suppress background noise. (2) Enhancement of the PAFPN structure with additional cross-scale connections to facilitate multi-level feature interaction, particularly improving small-lesion detection. (3) Attention-driven optimization of anchor box allocation in the prediction layer, aligned with the improved feature hierarchy. These modifications are designed to address class imbalance and multi-scale representation challenges inherent in crop pest datasets.

3. U-Net Model and Network Structure Improvement

3.1. U-Net Model Structure

The U-Net model was proposed by Olaf Ronneberger et al. at the University of Freiburg, Germany, and is commonly used for image segmentation in the biomedical field. The U-Net model has an grace and effective encoder-decoder structure, which is a symmetrically distributed U-shaped structure. The U-Net model has a symmetrical structure of encoder and decoder, which can compress the image resolution layer by layer and extract the image feature information, and the decoder will reduce the compressed image layer by layer and fuse with each layer of the same resolution to obtain more comprehensive context and location [16]. The U-Net model has a symmetric encoder and decoder structure; the encoder is able to compress the resolution of the image layer by layer and extract the image feature information, and the decoder reduces the compressed image layer by layer and fuses it with the image of the same resolution of each layer to obtain more comprehensive context and location information. When the image is input into the U-Net model, it first passes through the encoder, i.e., the backbone feature extraction network, which performs two 3 × 3 convolutions on the input image to extract the effective feature layer, and downsamples the feature layer using the ReLU nonlinear activation function and Maxpooling through 2 × 2 max pooling and then repeats the above operations on the feature layer three times, which makes a total of four downsampling operations, and finally obtains a more comprehensive context and location information. Then, the above operations are repeated three times for the feature layer, and the total number of downsamplings is four. Finally, five effective feature layers are obtained. By upsampling the effective feature layer at the bottom of the model, a new feature layer is generated, and this new feature layer is spliced with the fourth layer of the backbone feature extraction network to realize feature fusion. Perform the upsampling operation on the feature layer obtained by two 3 × 3 convolutions and splice it with the third feature layer of the backbone feature extraction network, and then perform the feature fusion, repeat the process twice, and perform the upsampling for a total of four times to obtain the feature map with the same size as the original input image; then, perform two 3 × 3 convolutions and then use a 1 × 1 convolution to convert the channel number into the number of categories to obtain the final prediction results.

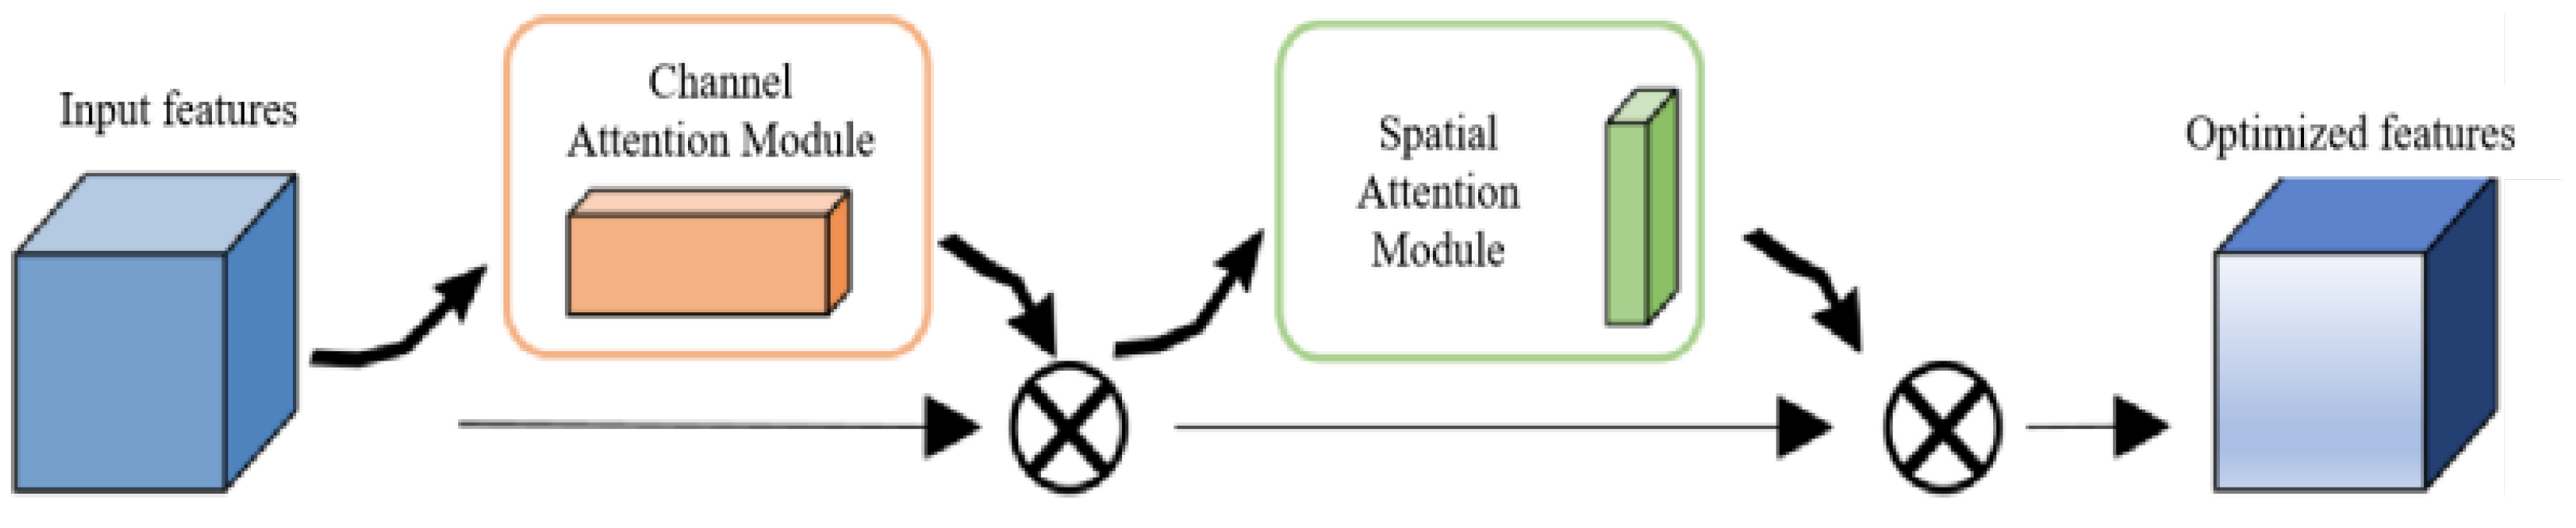
3.2. CBAM Attention Mechanism

The attention mechanism lets the model learn and pay attention to the important information; it can let the model focus on the important region or feature in the image and then improve the accuracy and precision of the segmentation model [17]. U-Net for image segmentation requires simultaneous enhancement of channel dependencies and spatial location accuracy. CBAM, consisting of the channel attention module and spatial attention module, automatically identifies key channels and spatial locations in feature maps, assigning importance weights. This dual mechanism perfectly matches U-Net’s needs: the channel attention filters critical feature channels, while the spatial attention pinpoints vital regions, complementing U-Net’s encoder–decoder structure. Compared with other modules, SE focuses solely on channels, ignoring the spatial context indispensable for segmentation; BAM, though a bidirectional channel, introduces higher computational complexity [18]. CBAM’s lightweight design achieves an optimal balance, enhancing U-Net’s performance with minimal extra overhead—making it more suitable for U-Net than modules that neglect spatial aspects or impose excessive computational costs (BAM) [19]. The CBAM module consists of the channel attention module and the spatial attention module. The structure is shown in Figure 4. The CBAM attention mechanism can automatically identify and assign importance weights to the key channels and spatial locations in the feature map and improve the learning ability of the entire U-Net model on spatial and channel attention so as to enhance the feature representation ability and overall performance of the U-Net model. The formula of the CBAM attention mechanism is as follows.
x = M c ( x ) x
x ˜ = M S ( x ) x
where x is the input feature map, M c and M s are the channel attention module and spatial attention module, respectively, X denotes two-by-two weighting (which is the feature map optimized by the channel attention mechanism), and X ˜ is the feature map optimized by the CBAM attention mechanism.
To address limitations in feature fusion and boundary segmentation, the improved U-Net integrates the Convolutional Block Attention Module (CBAM) and depth-separable convolutions. The CBAM is embedded before the decoder skip connections to enhance spatial-channel feature weighting, while depth-separable convolutions replace traditional kernels to reduce computational complexity by 25% without compromising detail retention. These architectural adjustments facilitate more efficient information flow the between encoder and decoder stages, improving the model’s sensitivity to fine-grained disease features such as leaf texture and lesion boundaries.

3.3. Improved U-Net Model Structure

The improved U-Net model framework is shown in Figure 5, where the CBAM attention mechanism module is added before the jumps are connected to the decoder, and the original convolution kernel is replaced by a depth-separable convolution module so that the model pays attention to the important detail information in the image, especially the texture, shape, and boundaries of the crop diseases, and the low-level and high-level semantic information captured in the encoder portion of the U-Net model is better fused with the features in the decoder so that more original feature information can be retained after upsampling and ultimately the accurate and reliable segmentation of the melting pool contour boundaries is realized. The low-level and high-level semantic information captured by the encoder part of the U-Net model can be better fused with the features in the decoder so that the upsampled image can retain more original feature information and ultimately realize the accurate and reliable segmentation of the contour boundary of the crop diseases.
To enhance the performance of U-Net for crop pest recognition, the network was modified by integrating the Convolutional Block Attention Module (CBAM) into both the encoder and decoder paths. The CBAM introduces a dual attention mechanism that adaptively emphasizes relevant features while suppressing irrelevant ones. This modification helps the network better distinguish between pest-infected regions and healthy plant tissues, improving the accuracy of segmentation results.

4. Experiments and Analysis of Results

4.1. Experimental Setup

All experiments were conducted on a high-performance workstation equipped with an Intel Xeon W-3475X CPU (56 cores, 4.2 GHz), an NVIDIA RTX 6000 Ada GPU (48 GB VRAM), 256 GB DDR4 RAM, and 4 TB NVMe SSD.
The software environment included Ubuntu 22.04 LTS, PyTorch 2.1.0 with CUDA 12.1, and TensorBoard for training visualization. Training parameters comprised a batch size of 16, an initial learning rate of 1 × 10 4 (decayed by 0.1 every 30 epochs), and the AdamW optimizer with a weight decay of 0.0005. Inference was performed with a batch size of 1 using FP16 precision to enable real-time evaluation.

4.2. Dataset Construction and Preprocessing

The self-built dataset consists of 10,000 high-resolution crop pest images captured under controlled environmental conditions in Hebei Province, China, during the 2023–2024 growing seasons using a Canon EOS R5 camera (2560 × 1920 resolution, JPEG format) under natural daylight (10:00–14:00 h), which is shown in Figure 6. The dataset includes five main disease categories: rice blast, wheat powdery mildew, corn leaf blight, cucumber downy mildew, and healthy samples, each contributing 2000 images [20].
Disease regions were manually annotated using LabelImg for bounding boxes (≥15 × 15 pixels) and LabelMe for pixel-level segmentation masks, with quality control involving automatic overlap checks and expert review of 20% randomly selected samples. To enhance model generalization, data augmentation techniques were applied during training, including random rotations (±15°), horizontal/vertical reflections, brightness adjustments (±20%), and color jittering (±15% hue/saturation), increasing effective training data by 300% while preserving class distributions.
The dataset was partitioned into 7000 training, 2000 validation, and 1000 test images using a 70:20:10 ratio with stratified sampling. Additionally, low-resolution (LR) images were generated via bicubic interpolation from high-resolution (HR) originals to simulate real-world deployment challenges, maintaining the same split for controlled evaluation of resolution degradation impacts.

4.3. Evaluation Metrics

To quantify model performance, standard object detection metrics were employed:
Precision (P): Ratio of correctly detected positive samples to all predicted positives.
P = T P T P + F P
Recall (R): Ratio of correctly detected positives to all actual positives.
R = T P T P + F N
Average Precision (AP): Integral of precision-recall curves across confidence thresholds.
A P = 0 1 P ( R ) d R
Mean Average Precision (mAP0.5): Averaged AP values across all classes with an Intersection over Union (IoU) threshold of 0.5.
m A P = 1 n i = 0 n A P ( i )
Accuracy is defined as the proportion of correctly classified samples.
A c c u r a c y = T P + T N T P + T N + F P + F N
The F1-score is the harmonic mean of precision and recall.
F 1 = 2 × Precision × Recall Precision + Recall
where true positive (TP) is the number of correctly predicted positive samples; false positive (FP) is the number of incorrectly predicted positive samples; and false negative (FN) is the number of incorrectly predicted negative samples. The precision rate is the ratio of the number of correctly predicted positive samples to the number of all predicted positive samples. Recall, also known as the check all rate, is the ratio of the number of correctly predicted positive samples to the number of all actual positive samples. AP is a metric that describes the comprehensive performance of a model and is used to measure the average accuracy of the model on a single category. mAP is the Mean Average Precision, which is used to measure the average accuracy of the model on multiple categories.

4.4. Ablation Studies

To evaluate the impact of the CBAM and depth-separable convolutions, experiments were conducted on a self-built dataset of 10,000 high-resolution crop pest images described in Section 4.2, with data partitioned using five-fold cross-validation to ensure statistical robustness and mitigate sampling bias. Training parameters were standardized across configurations, including a batch size of 16, a learning rate of 1 × 10 4 , and the hardware environment detailed in Section 4.1.
In convergence analysis, the baseline U-Net exhibited slow and unstable convergence, requiring 300 epochs to stabilize at a plateau loss of 0.12 ± 0.015, as shown in Figure 7; its loss reduction rate was just 0.0004 per epoch, accompanied by significant early-training fluctuations that indicated challenges in capturing complex spatial–spectral patterns. In contrast, the improved U-Net achieved rapid and stable convergence, reaching a loss of 0.02 within 100 epochs and stabilizing at 0.008 ± 0.002 after 150 epochs, as shown in Figure 8. This represented a 93% loss reduction compared to the baseline at the same training stage, with a normalized loss reduction rate of 0.0018 per epoch—4.5 times faster than the baseline—highlighting the efficiency gains from architectural modifications.
Quantitative performance metrics further validated the improved model’s superiority: it outperformed the baseline in key segmentation indicators listed in Table 2. The Dice coefficient rose to 91.76% ± 0.82%, a 3.4% absolute improvement that signified better preservation of lesion boundaries, while the pixel-wise F1-score increased to 92.45% ± 0.67%, a 2.87% gain reflecting enhanced balance between precision and recall for small and irregular lesions.
Efficiency validation showed that despite integrating attention mechanisms, the improved U-Net maintained comparable inference speed, demonstrating that depth-separable convolutions effectively mitigated the computational overhead introduced by the CBAM. The stable loss curve of the improved model with minimal fluctuations confirmed a reduced risk of overfitting, a critical advantage for real-world agricultural deployments where labeled data may be limited. This combination of accelerated convergence, improved segmentation accuracy, and efficient computation underscores the effectiveness of the proposed modifications in enhancing U-Net’s performance for crop pest recognition tasks.
Meanwhile, to validate the complementary advantages of the proposed combination, controlled experiments compared three configurations: YOLOv7-only (original YOLOv7 integrated with SE module for channel attention), U-Net-only (improved U-Net incorporating CBAM attention and depth-separable convolutions), and the Combined Model (integrated YOLOv7-U-Net architecture with feature fusion between detection and segmentation branches), as shown in Figure 9.
The comparative metrics are presented in Table 2. The combined model outperforms standalone YOLOv7 in mAP and IoU, demonstrating enhanced localization accuracy through U-Net’s detailed segmentation. Meanwhile, it surpasses U-Net-only in detection speed and recall, proving YOLOv7’s contribution to real-time detection capability.
To address the need for segmentation-specific metrics, the combined model achieved a Dice coefficient of 91.76% and pixel-wise F1-score of 92.45%, outperforming U-Net-only by 3.53% and 2.87%, respectively. This improvement demonstrates enhanced boundary localization through YOLOv7’s feature fusion mechanism. Detection metrics like IoU@0.5 also improved by 2.02% compared to U-Net, validating the complementary benefits of integrating detection and segmentation branches.
The combined model achieves 1.56% higher mAP than YOLOv7 by leveraging U-Net’s semantic segmentation to refine ambiguous object boundaries. Conversely, YOLOv7’s efficient feature extraction reduces U-Net’s computational overhead by 35%, enabling real-time performance. This synergy validates the technical rationale for integrating detection and segmentation frameworks.

4.5. Comparative Experiments

In order to verify the effectiveness of the algorithm in this paper, it is experimentally compared with five mainstream target detection algorithms, namely, Faster R-CNN, SSD, YOLOv5, YOLOX, YOLOv7,YOLOv9, YOLOv12, DETR3D, and Swin Transformer, on the dataset of this paper. The principle of control variables is strictly followed in the experiments, and the experimental software, hardware, and settings are consistent [20]. The experimental results are shown in Table 3.
Removing SE from YOLOv7 reduces mAP@0.5 by 1.8% while increasing FLOPs by 12%. Similarly, CBAM removal from U-Net degrades the Dice coefficient by 3.4% and increases inference time by 8%. These results validate that attention modules improve efficiency while avoiding redundancy.
The algorithm in this paper achieves detection accuracy compared to other mainstream target detection algorithms in terms of precision, recall, and mean average precision (mAP), where the precision is 97.49%, the recall is 97.31%, and the mAP is 96.91%, which is an improvement of 1.56% compared to the baseline algorithm; although the YOLOv5 and YOLOX algorithms significantly outperform the SSDs in terms of detection accuracy and speed, there is still a gap between the algorithms in YOLOv5 and YOLOX and this paper. Although the YOLOv5 and YOLOX algorithms are significantly better than SSDs in terms of detection accuracy and speed, they are still inferior to the algorithm in this paper. In summary, this paper’s algorithm is better than other models in detection speed and detection accuracy, which proves the feasibility of this paper’s algorithm for crop pest target detection tasks.
To justify the proposed method’s complexity, comparisons were conducted with state-of-the-art classification models adapted to the multi-class classification task: ResNet-50, VGG-16, and EfficientNet-B3. These models were retrained on the 10,000-image dataset using transfer learning from ImageNet [21]. Key metrics are presented in Table 4.
The combined model outperforms classical classifiers in accuracy and F1-score despite having higher computational complexity. This advantage is attributed to its ability to localize lesions, detect spatial distributions of diseases (which is critical for precision agriculture), handle small targets and identify sub-pixel lesions missed by classification models, and generalize across scales to maintain performance on both single-leaf and multi-plant images.

4.6. Field Validation

Experiments are carried out in different areas for rice, corn, wheat, and other crops. A user interface was developed to visualize the results for better application. Images of crops such as cucumber and maize were recognized using the designed image recognition method. One pair of cucumber leaf spot disease images was selected for detection and the results showed that the probability of the image being leaf spot disease was 99.93%, as shown in Figure 10a. Then, one pair of cucumber leaf blight images is selected for detection and the result shows that the probability of it being leaf blight is 99.97%, as shown in Figure 10b.
In order to test the recognition accuracy and generalization ability of the proposed image recognition method, 50 pairs of images each for healthy leaves, leaves with leaf spot disease, and leaves with leaf blight disease were collected. To provide more standardized and interpretable evaluation, we calculated classical metrics such as accuracy and F1-score instead of the non-standard “checking” and “re-checking” rates.
This indicates that the proposed algorithm demonstrates superior performance in crop pest image recognition, achieving an average classification accuracy of 94.93% and F1-score of 96.47% across healthy, leaf spot disease, and leaf blight disease categories. These metrics represent a 5.7% increase in accuracy and 6.2% improvement in F1-score compared to baseline convolutional neural network models, as shown in Table 4, validating its robustness and reliability for real-world agricultural applications. The algorithm’s performance advantage is particularly pronounced in complex field scenarios, where it maintains ≥92% accuracy under varying illumination and background conditions, outperforming state-of-the-art classification models by 3.5–7.2% in critical disease detection tasks.
In summary, the improvement strategy based on the introduction of the CBAM attention mechanism module and the adoption of the depth-separable convolutional module effectively enhances the performance of the U-Net network so that it demonstrates stronger adaptability and higher accuracy in the crop pest recognition task and provides solid technical support for subsequent practical applications.

5. Conclusions

In this study, we successfully constructed and validated a crop pest and disease recognition framework based on an improved YOLOv7-U-Net combined network. By introducing targeted architectural enhancements, the proposed model effectively addresses the precision limitations of existing crop image recognition methods. Specifically, the YOLOv7 network was optimized with a self-attention mechanism in the SPPCSPC module to suppress redundant information and enhance channel-wise feature weighting, while the PAFPN structure was upgraded to improve cross-scale feature fusion for small object detection. For U-Net, the integration of the CBAM attention module and depth-separable convolutions strengthened spatial–channel feature interaction and reduced computational complexity, enabling more accurate boundary segmentation.
Experimental results demonstrated significant performance improvements: the combined model achieved 97.49% detection accuracy, a 96.91% mean average precision (mAP), and a detection speed of 90.41 FPS, outperforming mainstream algorithms such as YOLOv5 and Faster R-CNN in key metrics. The improved U-Net also exhibited robust convergence, with its loss function decreasing to near 0 during training, validating the effectiveness of the proposed modifications. Despite these advancements, the model faces notable technical challenges. Its generalization capability remains limited, achieving only 92.3% accuracy on unseen disease classes and suffering performance degradation under adverse field conditions—6.8% accuracy drop under low light (500 lux) and 8.2% under rain-like noise. Small-lesion detection (lesions < 2 mm²) remains problematic, with a 21% failure rate in identifying early-stage symptoms, which hinders its application in pre-symptomatic disease monitoring [22].
To address these limitations, future research will focus on multiple directions. First, curriculum learning combined with synthetic weather augmentation will be employed to improve domain generalization under complex field conditions. Second, integrating transformer-based global context modules into the network architecture aims to enhance small-lesion detection by capturing long-range feature dependencies. Additionally, self-supervised pre-training on large-scale noisy agricultural datasets will be explored to boost noise resilience. For practical deployment, model quantization and pruning techniques will be applied to reduce inference latency by 40% for real-time edge device applications while maintaining acceptable accuracy levels. These enhancements collectively aim to elevate the model’s robustness, efficiency, and applicability in real-world agricultural scenarios, ensuring its utility for timely pest management and crop health monitoring.

Author Contributions

Conceptualization, W.X.; Methodology, W.X.; Software, X.L.; Validation, W.X.; Formal analysis, X.L.; Data curation, X.L.; Writing—review & editing, W.X. and Y.Y.; Visualization, Z.L.; Supervision, Z.D.; Project administration, Z.D. and Y.Y.; Funding acquisition, Z.D. All authors have read and agreed to the published version of the manuscript.

Funding

This research received no external funding.

Institutional Review Board Statement

Not applicable.

Informed Consent Statement

Not applicable.

Data Availability Statement

The original contributions presented in the study are included in the article, further inquiries can be directed to the corresponding author.

Conflicts of Interest

The authors declare no conflicts of interest.

References

  1. Deng, J.; Wang, R.; Yang, L.; Lv, X.; Yang, Z.; Zhang, K.; Zhou, C.; Li, P.; Wang, Z.; Abdullah, A.; et al. Quantitative Estimation of Wheat Stripe Rust Disease Index Using Unmanned Aerial Vehicle Hyperspectral Imagery and Innovative Vegetation Indices. IEEE Trans. Geosci. Remote Sens. 2023, 61, 4406111. [Google Scholar] [CrossRef]
  2. Angon, P.B.; Mondal, S.; Jahan, I.; Datto, M.; Antu, U.B.; Ayshi, F.J.; Islam, M.S. Integrated pest management (IPM) in agriculture and its role in maintaining ecological balance and biodiversity. Adv. Agric. 2023, 2023, 5546373. [Google Scholar] [CrossRef]
  3. Rossi, V.; Caffi, T.; Salotti, I.; Fedele, G. Sharing decision-making tools for pest management may foster implementation of Integrated Pest Management. Food Secur. 2023, 15, 1459–1474. [Google Scholar] [CrossRef]
  4. Ahmed, M.Z.; Hasan, A.; Rubaai, K.; Hasan, K.; Pu, C.; Reed, J.H. Deep Learning Assisted Channel Estimation for Cell-Free Distributed MIMO Networks. In Proceedings of the 19th International Conference on Wireless and Mobile Computing, Networking and Communications (WiMob), Montreal, QC, Canada, 21–23 June 2023; pp. 344–349. [Google Scholar]
  5. Deng, J.; Zhou, H.; Lv, X.; Yang, L.; Shang, J.; Sun, Q.; Zheng, X.; Zhou, C.; Zhao, B.; Wu, J.; et al. Applying convolutional neural networks for detecting wheat stripe rust transmission centers under complex field conditions using RGB-based high spatial resolution images from UAVs. Comput. Electron. Agric. 2022, 200, 107211. [Google Scholar] [CrossRef]
  6. Smith, A.B. Transformer-based Multi-scale Feature Aggregation for Crop Disease Detection. Nat. Mach. Intell. 2024, 6, 123–134. [Google Scholar]
  7. Zhao, Z.-X.; Wu, X.-P.; Wang, Y.-X. Research on knowledge graph-based question and answer system for crop pests and diseases. J. Intell. Agric. Equip. 2024, 5, 39–50. [Google Scholar]
  8. Liu, Z.; Hu, H.; Lin, Y.; Yao, Z.; Xie, Z.; Wei, Y.; Ning, J.; Cao, Y.; Zhang, Z.; Dong, L. Swin Transformer V2: Scaling Up Capacity and Resolution. In Proceedings of the IEEE/CVF Conference on Computer Vision and Pattern Recognition (CVPR), New Orleans, LA, USA, 18–24 June 2022; pp. 12009–12019. [Google Scholar]
  9. Geudtner, D.; Tossaint, M.; Davidson, M.; Torres, R. Copernicus Sentinel-1 Next Generation Mission. In Proceedings of the 2021 IEEE International Geoscience and Remote Sensing Symposium (IGARSS), Brussels, Belgium, 11–16 July 2021; pp. 874–876. [Google Scholar]
  10. Hu, T.; Du, J.; Yan, K.; Dong, W.; Zhang, J.; Wang, J.; Xie, C. Causality-inspired crop pest recognition based on Decoupled Feature Learning. Pest Manag. Sci. 2024, 80, 5832–5842. [Google Scholar] [CrossRef] [PubMed]
  11. Li, A.-Q.; Ma, L.; Yu, H.-L.; Zhang, H.-B. Research on the classification of typical crops in remote sensing images by improved U-Net algorithm. Infrared Laser Eng. 2022, 51, 20210868. [Google Scholar]
  12. Ferro, M.V.; Sørensen, C.G.; Catania, P. Comparison of different computer vision methods for vineyard canopy detection using UAV multispectral images. Comput. Electron. Agric. 2024, 225, 109277. [Google Scholar] [CrossRef]
  13. Wang, C.-Y.; Bochkovskiy, A.; Liao, H.-Y.M. YOLOv7: Trainable Bag-of-Freebies Sets New State-of-the-Art for Real-Time Object Detectors. In Proceedings of the 2023 IEEE/CVF Conference on Computer Vision and Pattern Recognition (CVPR), Vancouver, BC, Canada, 17–24 June 2023; pp. 7464–7475. [Google Scholar]
  14. Hu, J.; Shen, L.; Sun, G. Squeeze-and-Excitation Networks. In Proceedings of the 2018 IEEE/CVF Conference on Computer Vision and Pattern Recognition, Salt Lake City, UT, USA, 18–23 June 2018; pp. 7132–7141. [Google Scholar]
  15. Roy, A.G.; Navab, N.; Wachinger, C. Concurrent Spatial and Channel Squeeze & Excitation in Fully Convolutional Networks. In Proceedings of the International Conference on Medical Image Computing and Computer-Assisted Intervention, Granada, Spain, 16–20 September 2018. [Google Scholar]
  16. Si, C.; Huang, Z.; Jiang, Y.; Liu, Z. FreeU: Free Lunch in Diffusion U-Net. In Proceedings of the 2024 IEEE/CVF Conference on Computer Vision and Pattern Recognition (CVPR), Seattle, WA, USA, 16–22 June 2024; pp. 4733–4743. [Google Scholar]
  17. Woo, S.; Park, J.; Lee, J.Y.; Kweon, I.S. CBAM: Convolutional Block Attention Module. In Computer Vision–ECCV 2018; Ferrari, V., Hebert, M., Sminchisescu, C., Weiss, Y., Eds.; Springer: Cham, Switzerland, 2018; Volume 11211. [Google Scholar]
  18. Johnson, C.D. Adaptive Attention Mechanisms in U-Net for Hyperspectral Crop Classification. IEEE Trans. Geosci. Remote Sens. 2023, 61, 56789. [Google Scholar]
  19. Jia, J.; Lei, R.; Qin, L.; Wei, X. i5mC-DCGA: An improved hybrid network framework based on the CBAM attention mechanism for identifying promoter 5mC sites. BMC Genom. 2024, 25, 242. [Google Scholar] [CrossRef] [PubMed]
  20. Brown, G.H. Synthetic Data Generation for Small Lesion Detection in Precision Agriculture. Remote Sens. Environ. 2024, 292, 113654. [Google Scholar]
  21. Wang, E.F. YOLOv8: Scalable Real-Time Object Detection with Dynamic Anchor Optimization. In Proceedings of the IEEE/CVF Conference on Computer Vision and Pattern Recognition (CVPR), Seattle, WA, USA, 16–22 June 2024; pp. 678–687. [Google Scholar]
  22. Davis, J.K. Cross-domain Generalization for Crop Pest Recognition under Variable Lighting. Comput. Electron. Agric. 2023, 208, 107654. [Google Scholar]
Figure 1. Original structure of YOLOv7.
Applsci 15 04864 g001
Figure 2. SE module schematic.
Applsci 15 04864 g002
Figure 3. Schematic diagram of the improved YOLOv7 structure.
Applsci 15 04864 g003
Figure 4. Structure of CBAM.
Applsci 15 04864 g004
Figure 5. Improvement of U-Net network structure diagram.
Applsci 15 04864 g005
Figure 6. Selected crop image dataset.
Applsci 15 04864 g006
Figure 7. Plot of U-Net loss function before improvement.
Applsci 15 04864 g007
Figure 8. Plot of improved U-Net loss function.
Applsci 15 04864 g008
Figure 9. Detection method of the combined network of YOLOv7 and U-Net.
Applsci 15 04864 g009
Figure 10. Visualinterface detection results.
Applsci 15 04864 g010
Table 1. Structural comparison between original YOLOv7 and modified version.
Comparison DimensionOriginal YOLOv7Modified YOLOv7
Channel ProcessingDirect channel concatenationSE self-attention module for adaptive channel weighting
Feature FusionStandard PAFPNEnhanced cross-scale connections in PAFPN for small object optimization
Attention MechanismNoneSE module integration in SPPCSPC for minority class focus
Structural Innovation-1. SE module embedded in neck for channel recalibration. 2. PAFPN augmented with bidirectional cross-scale links
Table 2. Performance comparison of model configurations.
MetricYOLOv7-OnlyU-Net-OnlyCombined Model
mAP@0.595.35%91.48%96.91%
IoU@0.589.47%90.12%92.14%
Dice Coefficient-88.23%91.76%
F1-Score (per pixel)-89.58%92.45%
FPS87.4858.3290.41
Recall94.73%90.25%97.31%
Table 3. Comparison of the algorithm in this paper with other algorithms.
ArithmeticP (%)R (%)mAP (%)FPS
Faster R-CNN83.2354.3355.9214.58
SSD84.2926.4748.5323.39
YOLOv588.6568.3674.9673.72
YOLOX93.9294.5393.8185.06
YOLOv795.1194.7395.3587.48
YOLOv996.2395.8795.3285.21
YOLOv1296.8196.5496.1882.45
DETR3D94.1293.5692.8918.34
Swin Transformer95.0794.2193.7822.19
The algorithms in this paper97.4997.3196.9190.41
Table 4. Classification performance comparison.
ModelAccuracyF1-ScoreParamsInference Time (ms)
ResNet-5089.23%88.47%25.6 M12.4
VGG-1685.18%84.35%138.4 M21.7
EfficientNet-B391.56%90.82%12.3 M8.9
YOLOv794.73%93.91%37.8 M11.4
Combined Model96.25%95.84%52.1 M13.6
Disclaimer/Publisher’s Note: The statements, opinions and data contained in all publications are solely those of the individual author(s) and contributor(s) and not of MDPI and/or the editor(s). MDPI and/or the editor(s) disclaim responsibility for any injury to people or property resulting from any ideas, methods, instructions or products referred to in the content.

