Article

Effects of Different Drying Methods on Structural Characterization, Rheological Properties, Antioxidant and Hypolipidemic Activities of Polysaccharides from Fig (Ficus carica L.)

1
School of Food Science and Engineering, Qilu University of Technology (Shandong Academy of Sciences), Jinan 250353, China
2
Economic Forest Institute, Shandong Academy of Forestry, Jinan 250014, China
*
Author to whom correspondence should be addressed.
Appl. Sci. 2025, 15(8), 4215; https://doi.org/10.3390/app15084215
Submission received: 27 February 2025 / Revised: 30 March 2025 / Accepted: 8 April 2025 / Published: 11 April 2025
(This article belongs to the Section Food Science and Technology)

Abstract

:
In this study, figs were dried by hot air drying (HD), vacuum freeze-drying (FD), vacuum drying (VD) and far-infrared drying (FID). Four fig polysaccharides (FPs) were extracted from different dried figs, and the corresponding names were FPH, FPF, FPV and FPFI. The effects of different drying methods on the structural properties, rheological properties and biological activities of FPs were compared. The result shows that the extraction rate of polysaccharides after FD (2.49%) treatment was 58.60%, 50% and 28.35% higher than that of HD (1.57%), VD (1.66%) and FID (1.94%), respectively. Drying methods result in varying molar ratios of monosaccharides. FPFI has more stable gel properties. HD, VD and FID caused damage to the surface structure of the polysaccharides. FPF exhibited the highest uronic acid content (25.56%), along with relatively low apparent viscosity and molecular weight (1.45 × 10⁵ Da), which contributed to its superior antioxidant and lipid-lowering activities. Therefore, FD is a drying method to obtain fig polysaccharide with high antioxidant and hypolipidemic activity. The results provided a scientific basis for the drying process of fig polysaccharide and a reference for the development of potential hypolipidemic products of fig polysaccharide.

1. Introduction

Fig (Ficus carica L.) is a highly nutritious, medicinal and economically valuable mulberry plant, belonging to the second generation of fruits in the world [1]. Fig is one of the world’s oldest cultivated fruit trees, native to the Mediterranean coast, now cultivated all over the world [2]. Figs are rich in polysaccharides, minerals, amino acids, phenols and other nutrients, and have been used for food and medicine from ancient times to the present [3,4]. The Compendium of Materia Medica and Yunnan Materia Medica recorded that figs were commonly used by ancient civilizations to treat loss of appetite, stomach and intestines, sore throat [5]. Early studies suggest that many of the effects of figs may be related to fig polysaccharides [6]. Modern studies have shown that fig polysaccharides possess a variety of biological activities, such as antioxidant, hypoglycemic, hypolipidemic, antibacteria and anti-tumor [7,8,9]. Therefore, fig polysaccharides have potential applications in the fields of food, healthcare and medicine.
Figs are a seasonal fruit with a very short storage period. It is highly susceptible to spoilage due to microbial contamination and mechanical damage [10]. Drying technology can extend the storage period by reducing the water content of figs, and it is the commonly used method for deep processing of figs [11]. Wang et al. [12] studied the biological activity of fresh fig polysaccharide extraction assisted by ultrasound. The study showed that fresh fig polysaccharide was mainly composed of glucose, glucuronic acid, galactose, galacturonic acid, rhamnose, mannose, arabinose and xylose, with a Mw of 4.224 × 10⁴ Da and DPPH radical scavenging capacity of 72.74%. It has been shown that different drying techniques affect polysaccharides to undergo changes in physicochemical properties and biological activities [13], such as monosaccharide composition, glyoxylate content, surface structure, antioxidant activity [14]. Therefore, appropriate drying techniques are important for retaining the activity of fig polysaccharides, which is important for the development of fig deep processing and storage.
Various artificial drying methods have been widely used for fruits and vegetables. Different drying methods have their own advantages in terms of drying conditions, drying quality, and ease of drying [15]. Hot air drying (HD) is the most common drying method. It is a low-cost and easy-to-control drying process, but it is prone to irreversible changes in the structure and properties of polysaccharides [16]. Vacuum drying (VD) is a method of drying materials under vacuum conditions, which reduces the oxidation and decomposition of materials and can reduce color change in polysaccharides [17]. Far-infrared drying (FID) is an effective technique to dry food products by far-infrared radiation, which is fast and has become one of the methods to dry high-quality food products in recent years [18]. Vacuum freeze-drying (FD) is a method of drying foodstuffs by sublimation of water under vacuum and low-temperature conditions. It can protect the biological activity of polysaccharides, but the drying time is long and the equipment cost is relatively high [19]. However, the effects of different drying methods on the physicochemical properties and structural characterization of fig polysaccharides are not known. The effects of different drying methods on the rheological properties, antioxidant activity and hypolipidemic activity of fig polysaccharides were also not reported.
Therefore, in order to achieve a deeper understanding of the effect of different drying techniques on fig polysaccharides (FPs), four drying techniques (HD, VD, FID and FD) were used to dry the figs. The effects of different drying methods on the physicochemical properties, structural characterization, rheological properties, antioxidant activity and hypolipidemic activity of fig polysaccharides were investigated. The results of this study provide a scientific basis for selecting suitable drying methods to obtain high-quality fig polysaccharides and provide a reference for the exploration of fig polysaccharides.

2. Materials and Methods

2.1. Material and Reagents

The figs used in this study were of the Bojihong variety, and fresh ripe figs were purchased from the Xiuyuan Fig Ecological Garden in Jinan City, Shandong Province, China. All figs used in the study were from the same batch and were subjected to drying treatments immediately after purchase. Monosaccharide standards, glucuronic acid, galacturonic acid, trifluoroacetic acid (TFA), 1-phenyl-3-methyl-5-pyrazolone (PMP), 1,1-diphenyl-2-picrylhydrazyl (DPPH), 2,2′-azino-bis (3-ethylbenzthiazoline-6-sulphonic acid) diammonium salt (ABTS), ferric reducing antioxidant power (FRAP) and vitamin C (Vc) were bought from Sigma-Aldrich (St. Louis, MO, USA). All other chemicals and solvents were of analytical grade.

2.2. Drying Experiments

Fresh figs (8.0 kg) were selected from the same raw material batch and weighed accurately on an electronic balance. The fresh figs were divided into four groups (2.00 ± 0.05 kg each) using a randomized block design. Samples of each group were cut by a food-grade stainless steel slicer (with blade spacing calibrated to 0.5 cm), and fruit slices with uniform thickness were obtained. Each group was dried by a different drying method. Four drying methods are used: hot air drying (HD), vacuum drying (VD), far infrared drying (FID) and vacuum freeze-drying (FD). Briefly, the hot air drying group was dried in an electrically heated blast drying oven (DHG-9030A, Shanghai Bailuda Instrument Co., Ltd., Shanghai, China) [20], and kept at 80 °C and an air velocity of 2 m/s for 6 h. The vacuum drying group was dried in a vacuum drying oven (Shanghai Jinghong Experimental Instrument Co., Ltd., Shanghai, China) at 60 °C for 8 h [21]. The far-infrared drying group was dried in a far-infrared dryer (HWG-2, Beijing Zhongxing Weiye Century Instrument Co., Ltd., Beijing, China) with a power of 2.4 kW and a wavelength of 2–15 µm, kept at 80 °C for 5 h [22]. The vacuum freeze-drying group was dried for 48 h in a vacuum freeze-dryer (SCIENTZ-10ND, Ningbo Kanda Biotechnology Co., Ltd., Ningbo, China) with a vacuum of less than 50 Pa and an absolute pressure of 10 Pa in the drying bin [23]. Pre-vacuum drying, fig slices were pre-frozen in a −30 °C refrigerator (DW-40L278J, Qingdao Haier Biomedical Co., Ltd., Qingdao, China) for 12 h. The moisture content of all four dried figs was less than 10% (g/g), which was determined using a moisture meter.

2.3. Extraction Procedure of FPs

The preparation of FPs was based on the method reported by Du et al. [24] with slight modifications. The four types of dried figs were ground into powder and defatted twice with 95% ethanol, followed by centrifugation at 5000× g for 15 min using a centrifuge (CR21N, Eppendorf Himac Technologies Co., Ltd. Tokyo, Japan) to collect the precipitate. The precipitate was mixed with distilled water at a ratio of 1:20 (g/mL), homogenized using a homogenizer (PRO250D, PRO Scientific Inc., Oxford, CT, USA) and extracted twice at 85 °C for a total of 8 h. The extract was then centrifuged to collect the supernatant. The supernatant was concentrated to one-fifth of its initial volume by rotary evaporation at 48 °C. Anhydrous ethanol was added to the concentrate until the final ethanol concentration reached 80%, and the mixture was left overnight at 4 °C. The precipitate was collected by centrifugation, dissolved in distilled water, and treated with Sevage reagent approximately 4–5 times to remove proteins. The solution was then transferred into dialysis bags (MD55) and dialyzed against distilled water (replaced every 8 h) at 4 °C for 6 days. Finally, the solution inside the dialysis bags was freeze-dried to obtain crude fig polysaccharides prepared from HD, VD, FID and FD, which were correspondingly named FPH, FPV, FPFI and FPF.

2.4. The Chemical Compositions of FPs

2.4.1. Sugar, Protein and Glucuronic Acid Analysis

Total sugar content was determined by the phenol–sulfate acid method with glucose as the standard [25]. Protein content was determined by BSA as the standard and the method of Bradford [26]. The glucuronic acid content was determined by the carbazole sulfate method with GalA as the standard [27].

2.4.2. Monosaccharide Analysis

The monosaccharide composition of FPs was determined by the HPLC method. The assay is based on previous reports with minor modifications [12]. FPs (50 mg) were hydrolyzed in a sealed glass vessel with 1 mL of trifluoroacetic acid (2 M) solution at 110 °C for 4 h. They were cooled to room temperature, blown dry with nitrogen and dissolved with an equal amount of water. A total of 1 mL of NaOH (0.3 M) and 1 mL of PMP methanol solution (0.5 M) were added and placed in a water bath at 70 °C for 70 min. After cooling, 1 mL of HCI (0.3 M) was added to be neutralized. The resulting solution was extracted three times with 1 mL of trichloromethane. The aqueous layer was taken through a 0.45 μm filter membrane, and then analyzed using a HPLC (Shimadzu LC-20A, Shimadzu Corporation, Tyoto, Japan) equipped with a C18 (4.6 × 250 mm, 5 µm) column and a UV detector. The column temperature was 40 °C and the absorbance was 245 nm. PMP derivatives were eluted with a mixture of A (50 mmol/L KH2PO4) and B (acetonitrile) according to 82:18 (v/v) at a flow rate of 1.0 mL/min. The standard curve method was used for quantitative analysis, and the concentration of monosaccharide standard products of 5, 10, 20, 50 and 100 mg/L was configured, and the peak area–concentration curve was established according to the above procedure.

2.4.3. Molecular Weight Analysis

The molecular weight of FPs and their distribution were determined using the technique of high-performance size exclusion chromatography equipped with a multi-angle laser light scattering instrument and a refractive index detector (HPSEC-MALLS-RI, WYATT Company, Santa Barbara, CA, USA) [28]. FPs were prepared as a 5 mg/mL solution and passed through a 0.22 µm filter membrane. A 0.15 mol/L NaCl solution containing 0.02% NaN3 (filtered through a 0.22 µm membrane and degassed by ultrasonication) was used as the mobile phase. Shodex OHpak SB-806 HQ and Shodex OHpak SB-804 HQ (Showa Denko Scientific Instruments Shanghai Co., Ltd., Shanghai, China) were used as the columns for chromatographic separation. The injection volume was 100 µL and the flow rate was 0.5 mL/min. The data were collected and processed by ASTRA 6.

2.5. Characterizations of FPs

2.5.1. Fourier-Transform Infrared (FT-IR) Spectrum Analysis

FT-IR was used to detect the FPs using the potassium bromide (KBr) pressing method. The dried FPs and potassium bromide were mixed and ground well, then the tablets were pressed in a tablet press to make samples [29]. A Nicolet 10 FT-IR spectrometer (Thermo Fisher Scientific Shier Technology Company, Waltham, MA, USA) was used for detection, and the wave number range was 500–4000 cm−1. The data were collected and processed by Thermo Scientific OMNIC.

2.5.2. X-Ray Diffraction (XRD) Analysis

XRD is a method used to characterize the crystal structure and to determine the degree of crystallinity of polysaccharides [30]. XRD patterns of FPs were recorded at a rate of 2°/min over a 2θ range of 5°–70° using an Ultima IV (Rigaku Corporation, Tokyo, Japan) set to a current and voltage of 40 kV and 40 mA.

2.5.3. Scanning Electron Microscopy (SEM) Analysis

SEM is often used to analyze the morphological structure and interfacial conditions of polysaccharides [31]. FPs were immobilized on a conductive support using a conductive adhesive, and after sputtering with gold, the surface morphology was observed using a Gemini SEM 500 scanning electron microscope (Carl Zeiss Group, Jena, Germany) at a magnification of 10.0 K.

2.6. Rheological Characterization

Measurements for the rheological characterization of FPs were based on previous reports with minor modifications [28]. A rheometer (Anton Paar MCR92, Anton Paar Co., Ltd., Graz, Austria) equipped with a parallel steel plate (50 mm diameter, 0.1 mm gap) was used to determine the rheological properties of FPs. FPs solution concentration was 25 mg/mL. Apparent viscosity was determined at shear rates ranging from 0.1 to 100 s−1 at 25 °C. Dynamic rheological properties were determined at 25 °C by scanning at 2% strain, 0.1–100 rad/s angular frequency. The heating (cooling) temperature range for the variable temperature experiments was 20–80 °C (80–20 °C) and the heating (cooling) rate was 10 °C/min.

2.7. Antioxidant Studies In Vitro

2.7.1. DPPH Radical Scavenging Activity

The free radical scavenging capacity of FPs was determined using 1,1-diphenyl-2-picrylhydrazy (DPPH) according to the method of Hou et al. [20] with minor modifications. A total of 20 µL of FPs at different concentration gradients (0.05, 0.10, 0.20, 0.40, 0.80, 1.6, 3.2 mg/mL) and 180 µL of DPPH–ethanol solution (2 × 10⁻⁴ M) were added to a 96-well microplate. After shaking and reacting in the dark for 30 min, the absorbance was measured at a wavelength of 517 nm using a multifunctional microplate reader. The formula for the scavenging rate of DPPH radicals was calculated as follows:
DPPH free radical scavenging rate (%) = [1 − (A1 − A2)/A0] × 100%
where A1 is sample solution + DPPH–ethanol solution, A2 is sample solution + anhydrous ethanol, A0 is blank system for the starting concentration of DPPH radicals.

2.7.2. ABTS Radical Scavenging Activity

The ABTS radical scavenging capacity of FPs was based on the method of Deng et al. [30]. The ABTS working solution was prepared in advance at 4 °C and stored away from light. A total of 20 µL of FPs solution of different concentrations was mixed with 180 µL of ABTS solution, and the absorbance values were measured at 734 nm after a 6 min reaction at room temperature protected from light. The formula for the scavenging rate of ABTS radicals was calculated as follows:
ABTS free radical scavenging rate (%) = [1 − (A3 − A4)/A5] × 100%
where A3 is the sample solution + ABTS working solution, A4 is the sample solution and A5 is the blank control solution (without sample solution).

2.7.3. Ferric Reducing Antioxidant Power

Ferric reducing antioxidant power (FRAP) was slightly modified according to the method of Ayimbila et al. [32]. After preparation of the acetate buffer (30 mM, pH = 3.6), 2,4,6-tris(2-pyridyl)-s-triazine working solution (TPTZ, 10 mM) and FeCl3 solution (20 mM), the FRAP working solution was obtained by mixing in the ratio of 10:1:1. FPs (50 µL) and FRAP (250 µL) were added to the FPs (50 µL), and FRAP (250 µL) was added to 96-well enzyme labeling plate and mixed well, and the absorbance value was measured at 593 nm after 10 min in 37 °C water bath.

2.8. Hypolipidemic Activity In Vitro

2.8.1. Cholesterol Binding Capacity Assay

The cholesterol binding capacity of FPs was based on the methods reported in the literature with minor modifications [33]. The cholesterol standard curve was first plotted by the O-Phthalaldehyde method (OPA), and the cholesterol standard curve was plotted by standard cholesterol solutions of 0.05, 0.1, 0.15, 0.2, 0.25 and 0.3 mg/mL. The measured cholesterol standard curve was y1 = 4.5331x1 + 0.0615, R12 = 0.9989. An amount of 5 mL of different concentrations of polysaccharide solution (2, 4, 6, 8, 10 mg/mL) was taken, and mixed with 10 mL of a 1 mol/L standard cholesterol solution. The pH was adjusted to 7 and shaken at 37 °C, 120 r/min for 2 h. Then, 0.4 mL of the mixed solution was taken and the cholesterol binding capacity was determined by OPA. Carboxymethyl cellulose (CMC) was used as a positive control. The cholesterol binding capacity was calculated as follows:
Binding amount (mg/g) = (A6 − A7)/M1
where A6 indicates the amount of cholesterol added, mg, A7 shows the amount of cholesterol remaining, mg, and M1 indicates the sample mass, g.

2.8.2. Cholate Binding Capacity Assay

The in vitro hypolipidemic activity of FPs was determined using the bile salt binding assay based on the method reported by Li et al. [33]. Four FPs and a solution of oxalic and sodium bile salts were prepared at 2 mg/mL. Artificial gastric fluid (1 mL) was mixed with the FPs and incubated for 1 h at 37 °C with shaking. The pH was adjusted to 6.3 with NaOH, then 4 mL of trypsin (10 mg/mL) was added and the reaction was carried out at 37 °C with shaking for 1 h. The pH was adjusted to 6.3 with NaOH, then 4 mL of trypsin (10 mg/mL) was added. Then, 4 mL of sodium taurocholate solution was added and reacted at 37 °C for 1 h. After centrifugation at 5000 r/min for 10 min, the supernatant was taken, and the absorbance value was measured at 387 nm. Simvastatin was used as a positive control. The cholate content (unbound cholate content) in the supernatant was calculated from the standard curve. Standard curve for sodium taurocholate: y2 = 1.943x2 + 0.0332, R22 = 0.9969. The bile acid salt binding rate was calculated using the following formula:
Sodium taurocholate binding ratio (%) = (m0 − m1)/m0 × 100%
where m0 is the amount of sodium taurocholate added; m1 is the amount of sodium taurocholate remaining.

2.9. Statistical Analysis

Each test was repeated at least three times, and the data were expressed as mean ± SD. The experimental data were analyzed for significant differences using SPSS 26 (Chicago, IL, USA) through Kruskal–Wallis variance (ANOVA) and Duncan’s multiple-range test, with p < 0.05 considered statistically significant. Graphs were plotted using Origin 2018 (Microcal Software, Inc., Northampton, MA, USA).

3. Results and Discussion

3.1. Yield, Neutral Sugar, Glucuronic Acid and Protein Content of FPs

The extraction rate, total sugar content and protein content of FPs were analyzed, and the results are shown in Table 1. The extraction rates of FPs after FD, VD, FID and HD were 2.49%, 1.66%, 1.94% and 1.57%, respectively. The results showed that there were significant differences in the extraction rate of FPs after four drying methods, and the extraction rate of freeze-drying was the highest. This result is in consist with An et al. [16], who reported the highest extraction rate of polysaccharides after freeze-drying lychee pulp. Ma et al. [34] also reported that the extraction rate of polysaccharides from freeze-dried mulberry leaves was higher than that of hot air and air-dried. The extraction rate of polysaccharides is closely related to the tissue structure of the sample itself [14]. The increase in temperature tends to cause aggregation of the tissue structure of figs. Therefore, the low-temperature environment of the FD process allows figs to maximally maintain their tissue structure state, leading to the highest extraction rate compared to HD, VD and FID.
As shown in Table 1, the neutral sugar and uronic acid contents of different FPs varied significantly (p < 0.05). FPH had the highest neutral sugar content (63.29%), followed by FPV (62.84%), FPF (60.04%) and FPFI (58.09%). The contents of uronic acid in FPF, FPV, FPFI and FPH were 25.56%, 14.34%, 19.84 and 13.51%, respectively. This indicates that FPF has the highest content of uronic acid and FPH has the lowest. The uronic acid content of FPF was 12.05% higher than that of FPH, showing a significant difference (p < 0.05). The total sugar content of FPF was 85.6%, which was higher than that of FPFI (77.93%), FPV (77.18%) and FPH (76.80%). According to previous reports, the sugar and uronic acid contents are influenced by environmental temperature and oxygen concentration during the drying process, as well as by the activity of certain polysaccharide hydrolases and uronic acid enzymes [16,35]. It can be inferred that the activity of polysaccharide hydrolase and glucuronidase in figs may have been suppressed by the low-temperature and low-oxygen environment during the freeze-drying process, leading to the highest retention of total sugar and glucuronic acid content.
FPH had the highest protein content at 1.33%, while the protein contents of the other three FPs ranged from 0.96% to 1.13%, showing no significant differences, as shown in Table 1. Our results are consistent with the previous report by Xiang et al. [36], which indicated that tea polysaccharides treated with the Sevage method still retained detectable protein content. It is speculated that natural polysaccharides are often bound to proteins to exhibit biological activity, and the Sevage method denatures free proteins in polysaccharides, but cannot remove bound proteins.

3.2. Monosaccharide Composition of FPs

The monosaccharide composition of FPs based on HPLC analysis is shown in Table 2 and Figure 1. The four types of FPs obtained through drying consist of six monosaccharides: mannose, rhamnose, galacturonic acid, glucose, galactose and arabinose, with no detection of glucuronic acid or xylose. Among these six monosaccharides, arabinose, galacturonic acid and galactose are the predominant components, and all polysaccharides are classified as heteropolysaccharides. Although the four types of FPs share an identical monosaccharide composition, they exhibit significant differences in molar ratios, highlighting the substantial influence of drying methods on the monosaccharide composition and content of FPs. The molar ratio of galactose follows the order: FPF < FPFI < FPH < FPV. Variations in drying methods also lead to FPV having the highest arabinose content and the lowest levels of rhamnose and glucose. In contrast, the molar ratio of mannose in FPH and FPFI is elevated compared to FPF and FPV. Furthermore, analysis of uronic acids in the FPs revealed that galacturonic acid is the predominant uronic acid present.
Du et al. [24] conducted monosaccharide composition analysis on polysaccharides from Xinjiang figs, revealing that fig polysaccharides are heteropolysaccharides composed of rhamnose, arabinose, galactose, glucose, and mannose, with arabinose and galactose being the primary monosaccharides. This finding aligns closely with our research. The sequential decrease in the molar ratio of galactose under FD, FID, HD and VD treatments may be attributed to variations in drying temperatures, as elevated temperatures tend to increase the molar ratio of galactose. An et al. [16] reported that the molar ratios of galactose and arabinose in litchi pulp polysaccharides increased with rising drying temperatures. However, the increase in temperature did not result in differences in the molar ratio of arabinose between FPF and FPFI, possibly due to changes in arabinose content or related to heat transfer methods and rates. Although FID involves higher temperatures, its rapid heat transfer rate may mitigate the impact of temperature on arabinose. The higher molar ratio of mannose in FPH and FPFI compared to FPF and FPV might be due to the vacuum environment during the drying process of FPF and FPV, which results in lower oxygen concentrations and thus alters the molar ratio of mannose. Chen et al. [37] reported that dried bamboo shoot polysaccharides with four different methods, which contained different molar ratios of arabinose, galactose and glucose. Shang et al. [35] reported that different drying methods altered the hydroxyl groups and intermolecular hydrogen bonding of polysaccharides through changes in temperature and oxygen concentration, resulting in different molar ratios of monosaccharides.

3.3. Molecular Weight of FPs

The molecular weight of polysaccharide is closely related to the biological activity, and the drying process will cause the difference in molecular weight of polysaccharide. The polydispersity index (Mw/Mn) is used to measure the breadth of molecular weight distribution of the polymer, and the larger the value, the wider the molecular weight distribution. The molecular weight and Mw/Mn results of the four FPs detected by HPSEC-MALLS-RI are shown in Table 3. The difference in drying methods resulted in the difference in the weight average molecular weight (Mw) of the four FPs, which ranged from 8.473 × 10⁴ to 1.79 × 10⁵ Da. FPH has the largest Mw (1.798 × 10⁵ Da), followed by FPV (1.66 × 10⁵ Da) and FPF (1.457 × 10⁵ Da) and FPFI has the smallest Mw (8.473 × 10⁴ Da). The Mp of FPF and FPFI was not significantly different and smaller than that of FPH and FPV, indicating that the relatively major chain segments of FPF and FPFI were shorter. The Mw/Mn size of the four FPs is FPF > FPFI > FPH > FPV. The molecular weight distribution of FPF and FPFI is wider than that of FPH and FPV.
Our study was somewhat different from the Mw of fig polysaccharide reported by Du et al. [24] at 8.28 × 10⁴ Da to 1.21 × 10⁵ Da. The main reasons for the difference in Mw were the treatment methods before extraction of fig polysaccharide and the difference in fig origin and variety. The formation of the protein–polysaccharide complex and the change in temperature are important factors affecting molecular weight [16]. The protein content of FPH is the highest among the four FPs. With the long-term drying of hot air, the structure of FPH is destroyed and aggregation occurs, and protein–polysaccharide complexes are formed, so FPH has the largest Mw. Ma et al. [38] reported that hot air drying of Inonotus obliquus polysaccharide disrupted the hydration layer and structure of the polysaccharides and induced aggregation, resulting in elevated molecular weights of the polysaccharide. It is inferred that the Mw/Mn of FPH and FPV is small and the molecular weight distribution is narrow due to the phenomenon of heat aggregation and surface hardening. Fu et al. [39] observed lower Mw/Mn ratios and narrower molecular weight distributions in loquat leaf polysaccharides processed by HD and vacuum drying VD compared to FD. These trends align with our experimental findings.

3.4. FT-IR Spectroscopy of FPs

The FT-IR spectra of four kinds of FPs are shown in Figure 2A. FPs obtained by different drying methods showed absorption peaks at 3407 cm−1, 2938 cm−1, 1743 cm−1, 1639 cm−1, 1423 cm−1, 1018 and 1101 cm−1. The broad absorption peak at about 3407 cm−1 is attributed to O-H stretching vibration, while the narrow weak absorption peak at about 2938 cm−1 is attributed to C-H stretching vibration. Chen et al. [6] also found these two bands when studying the extraction optimization of fig polysaccharides, which are considered to be the characteristic peak groups of polysaccharides. In addition, the relatively weak 1743 cm−1 and 1639 cm−1 are asymmetric and symmetric telescopic vibrations with C=O. Du et al. [24] also reported that these two spectra were considered to be the characteristic peak groups of uronic acid in the structural characterization of fig polysaccharide. The absorption peak at 1423 cm−1 is the variable angular vibration of C-H, which is attributed to the molecular modification of polysaccharides by drying. The bands at 1018 cm−1 and 1101 cm−1 are C-O-C glycosidic bond stretching vibrations, indicating that the polysaccharide is in the form of pyranose. Based on FT-IR spectroscopy analysis, the four FPs have similar chemical groups, indicating that different drying methods have no obvious influence on the skeleton structure of FPs. Yan et al. [40] studied the effects of different drying methods on bitter gourd polysaccharides and the results showed that different dried polysaccharides have similar structural characteristics. This is consistent with our findings.

3.5. XRD Examination of FPs

X-ray diffraction (XRD) is a technique widely used to analyze the crystal structure of substances and structural information on polysaccharides can be obtained through the diffraction effect of X-rays in polysaccharide [30]. The common structures of polysaccharides are amorphous images. The XRD patterns of four FPs are shown in Figure 2B. The peaks of the four polysaccharides are similar in the range of 5°–70°. All of them form broad and weak diffraction peaks around 23°, with low overall crystallinity. This shows that all four kinds of FPs are amorphous. It can be seen from Figure 2B that the diffraction peak of FPF has a lower peak intensity than the other three, indicating that the change in temperature has a certain influence on the crystallinity. With the increase in drying temperature, more thermal aggregation of polysaccharides may occur, leading to an increase in the overall crystallinity. Our results are consistent with previous reports that the polysaccharide from lychee pulp after drying is amorphous and the crystallinity of polysaccharide after lyophilization is the lowest [16].

3.6. SEM Analysis of FPs

The surface microstructure of FPs by different drying methods was observed under scanning electron microscope, as shown in Figure 3. There is a significant difference in the surface of the FPs after treatment with different drying methods. FPF(A) has a smooth surface with no bumps or aggregates. The surface of the FPFI(B) shows a few bumps and aggregates. The surfaces of both FPH(C) and FPV(D) appeared to be densely raised and aggregated, which caused varying degrees of damage to the surface structure of the polysaccharides.
The surface microstructure of FPs is related to temperature, humidity and other conditions during the drying process. The FD process removes water from the material by sublimation under vacuum and low-temperature conditions [23]. The low-temperature environment gives the FPF a stable structure and a smooth surface without agglomeration. FID process through far infrared radiation, moisture evaporates rapidly in a short time [22]. The rapid discharge of evaporated moisture from the drying box was hindered, and a high-humidity vapor film was formed above the material, leading to the induction of a small amount of polysaccharide aggregation. HD exchanges moist heat with figs by strong convection of hot air [20]. Prolonged high temperatures cause severe shrinkage and hardening of the surface structure of FPH. For VD under vacuum conditions, the fig’s own water evaporates and boils at the same time, and the accumulation of bubbles in the boiling process causes the polysaccharides to accumulate and agglomerate together. According to the SEM results, our inference was also confirmed that the increase in temperature and evaporation of water during the drying of figs easily led to the surface structure shrinkage and surface hardening of FPs, resulting in the phenomenon of heat accumulation. FD treatment could keep the microstructure of FPs stable.

3.7. Rheological Characterization of FPs

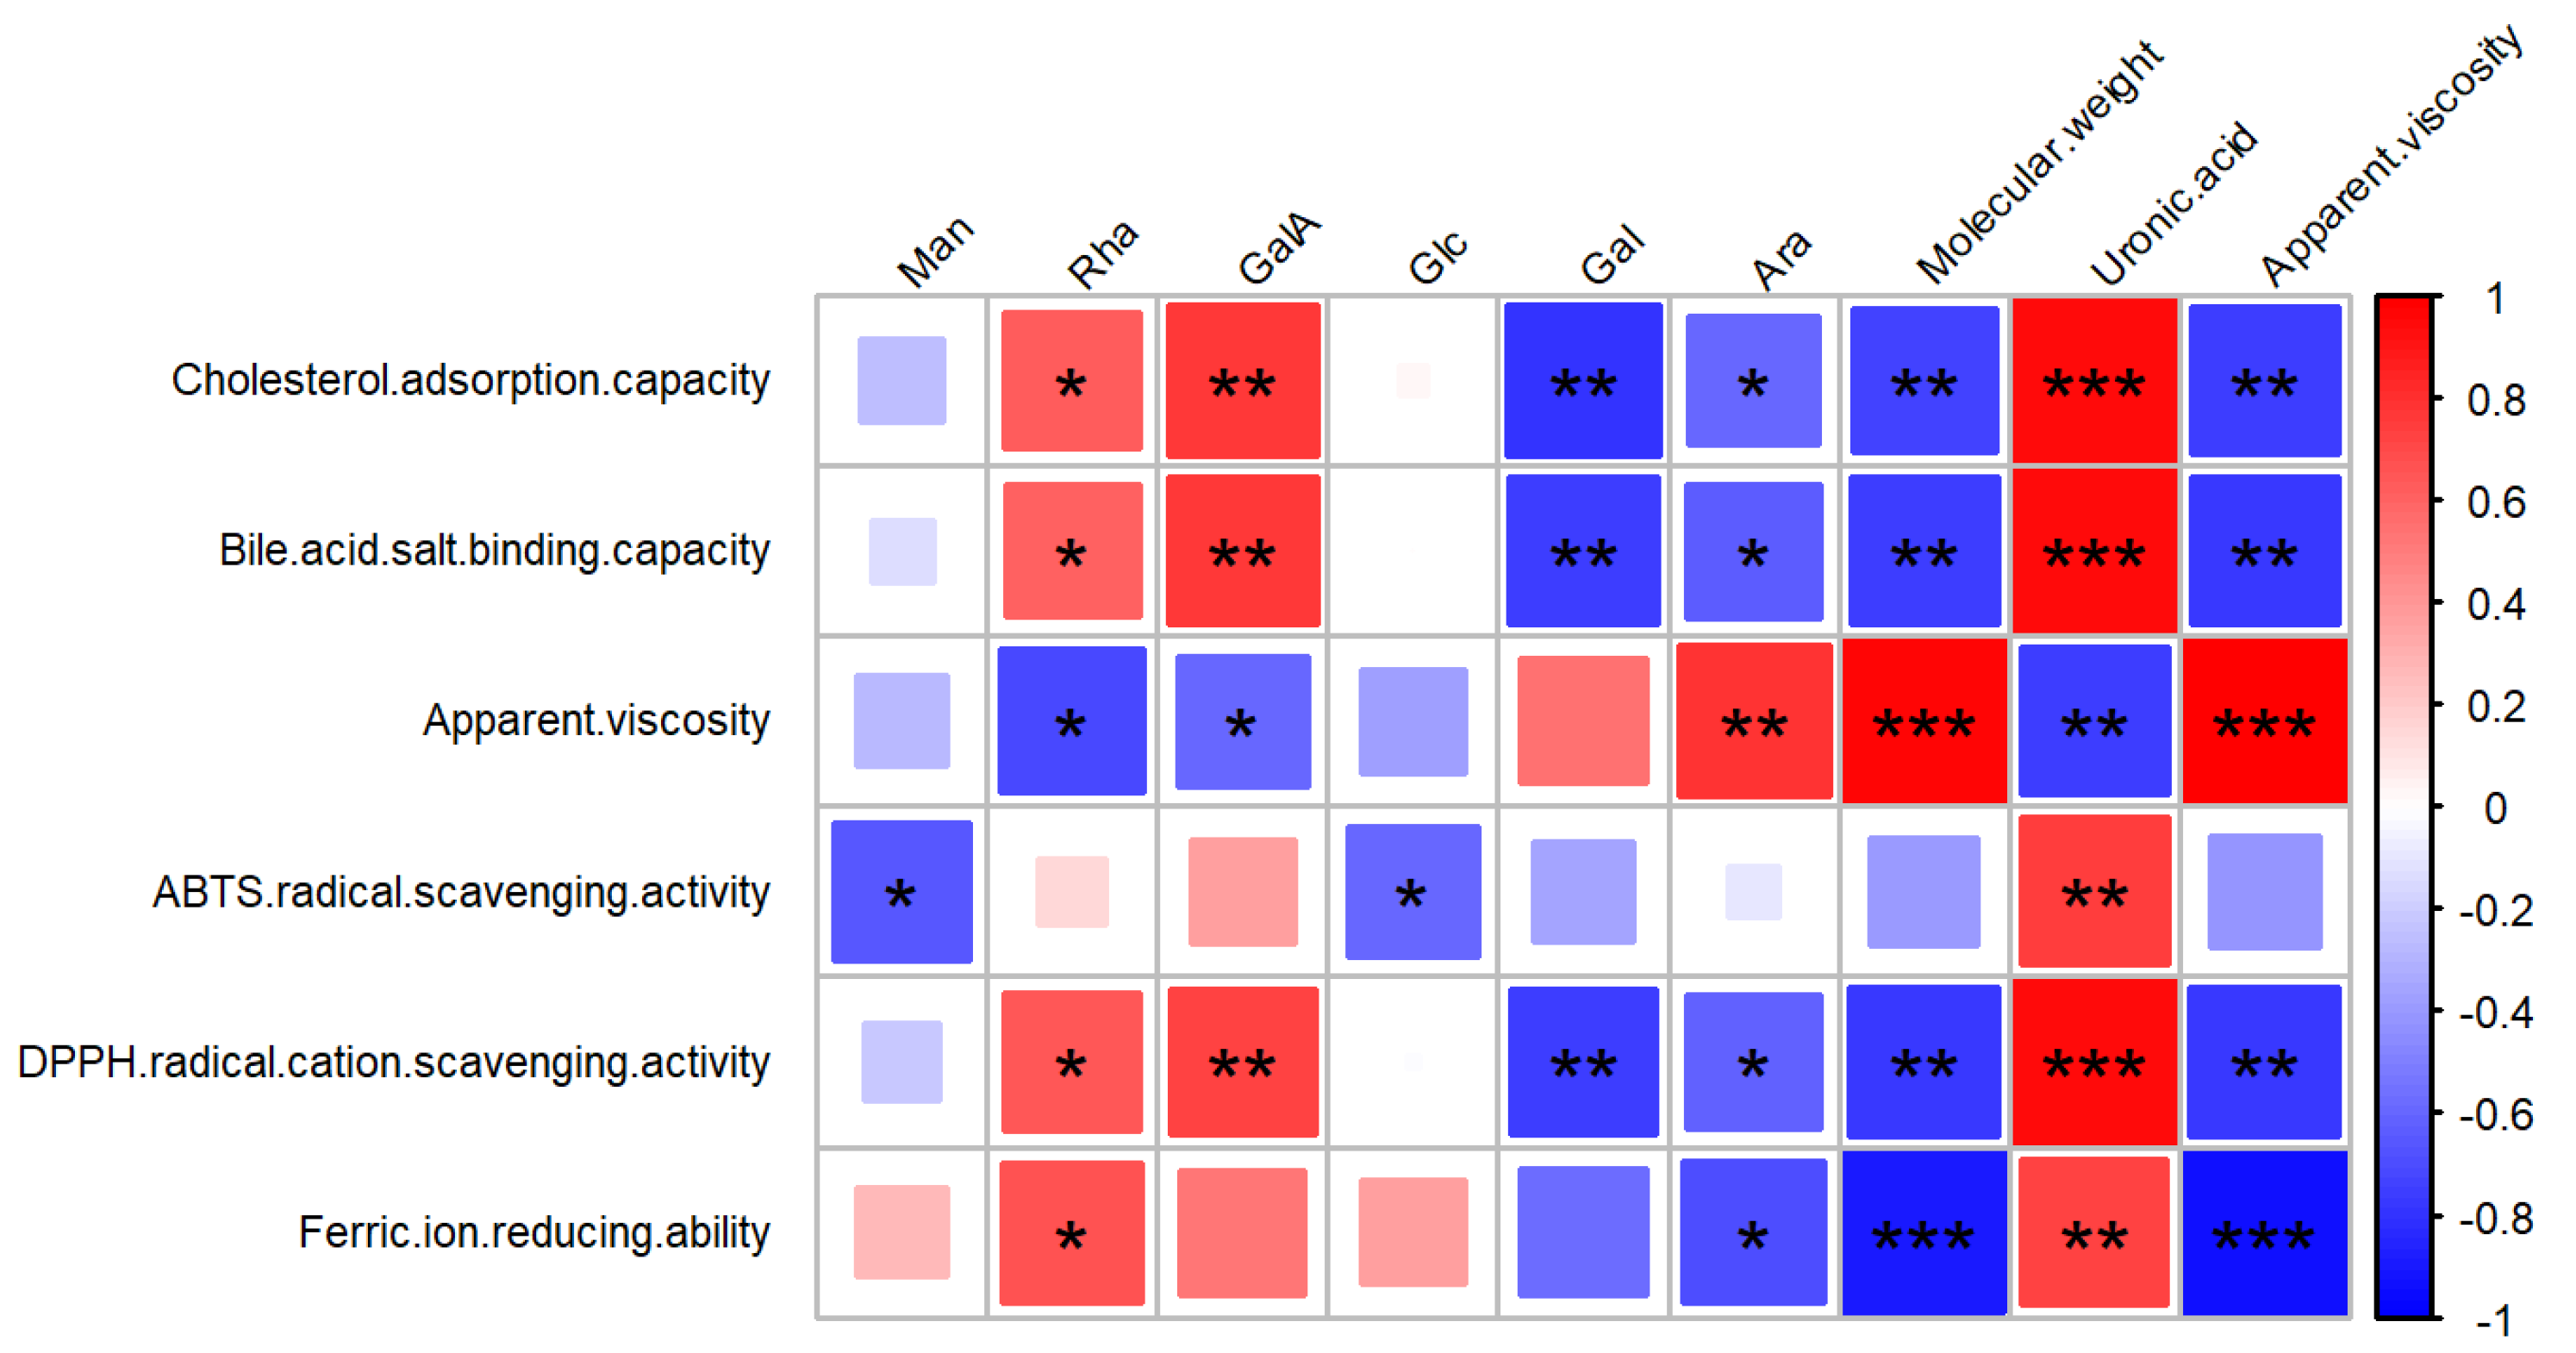
The effect of different drying methods on the apparent viscosity of FPs solution are shown in Figure 4. The apparent viscosity of FPs decreases rapidly with increasing shear rate (0.1–100 s−1), indicating that the FPs are pseudoplastic fluids with non-Newtonian shear thinning. The order of apparent viscosity of FPs is FPH > FPV > FPF > FPFI. As can be seen from Figure 5 the apparent viscosity of FPs is significantly positively correlated with molecular weight (***) and Ara (**). Previous studies have shown that the apparent viscosity of polysaccharide is closely related to its molecular weight [39]. The maximum apparent viscosity of FPH corresponds to its maximum molecular weight. FPV has a higher apparent viscosity than FPF and FPFI due to the highest Ara molar ratio and higher molecular weight. It is speculated that the apparent viscosity is affected by changing the molecular weight of FPs and molar ratio of Ara.
Natural polysaccharides are inherently viscoelastic, and their dynamic rheological properties can be determined by frequency scanning [41]. In the linear viscoelastic region with 2% constant strain, the energy storage film volume (G′) and loss film volume (G″) of the four FPs are shown in Figure 6. Both G′ and G″ of the four FPs increase with frequency and G′ is always higher than G″. This indicates that in the range of 0.1–100 rad/s, all the four polysaccharides show elastic behavior and exhibit gel nature. With the increase in frequency, the G′ of FPFI(B), FPV(C) and FPH(D) is always much higher than G″, but the G′ of FPF(A) is increasingly close to G″. It is inferred that the increase in temperature intensifies the thermal motion of polysaccharide molecules and enhances the intermolecular force, resulting in the increase in G′ and the enhancement of the gel properties of FPFI, FPV and FPH. The G′ and G″ of FPFI continue to maintain equilibrium and G′ is greater than G″, showing the most stable gel properties. It can be inferred that a higher concentration of FPFI can form a better gel network.
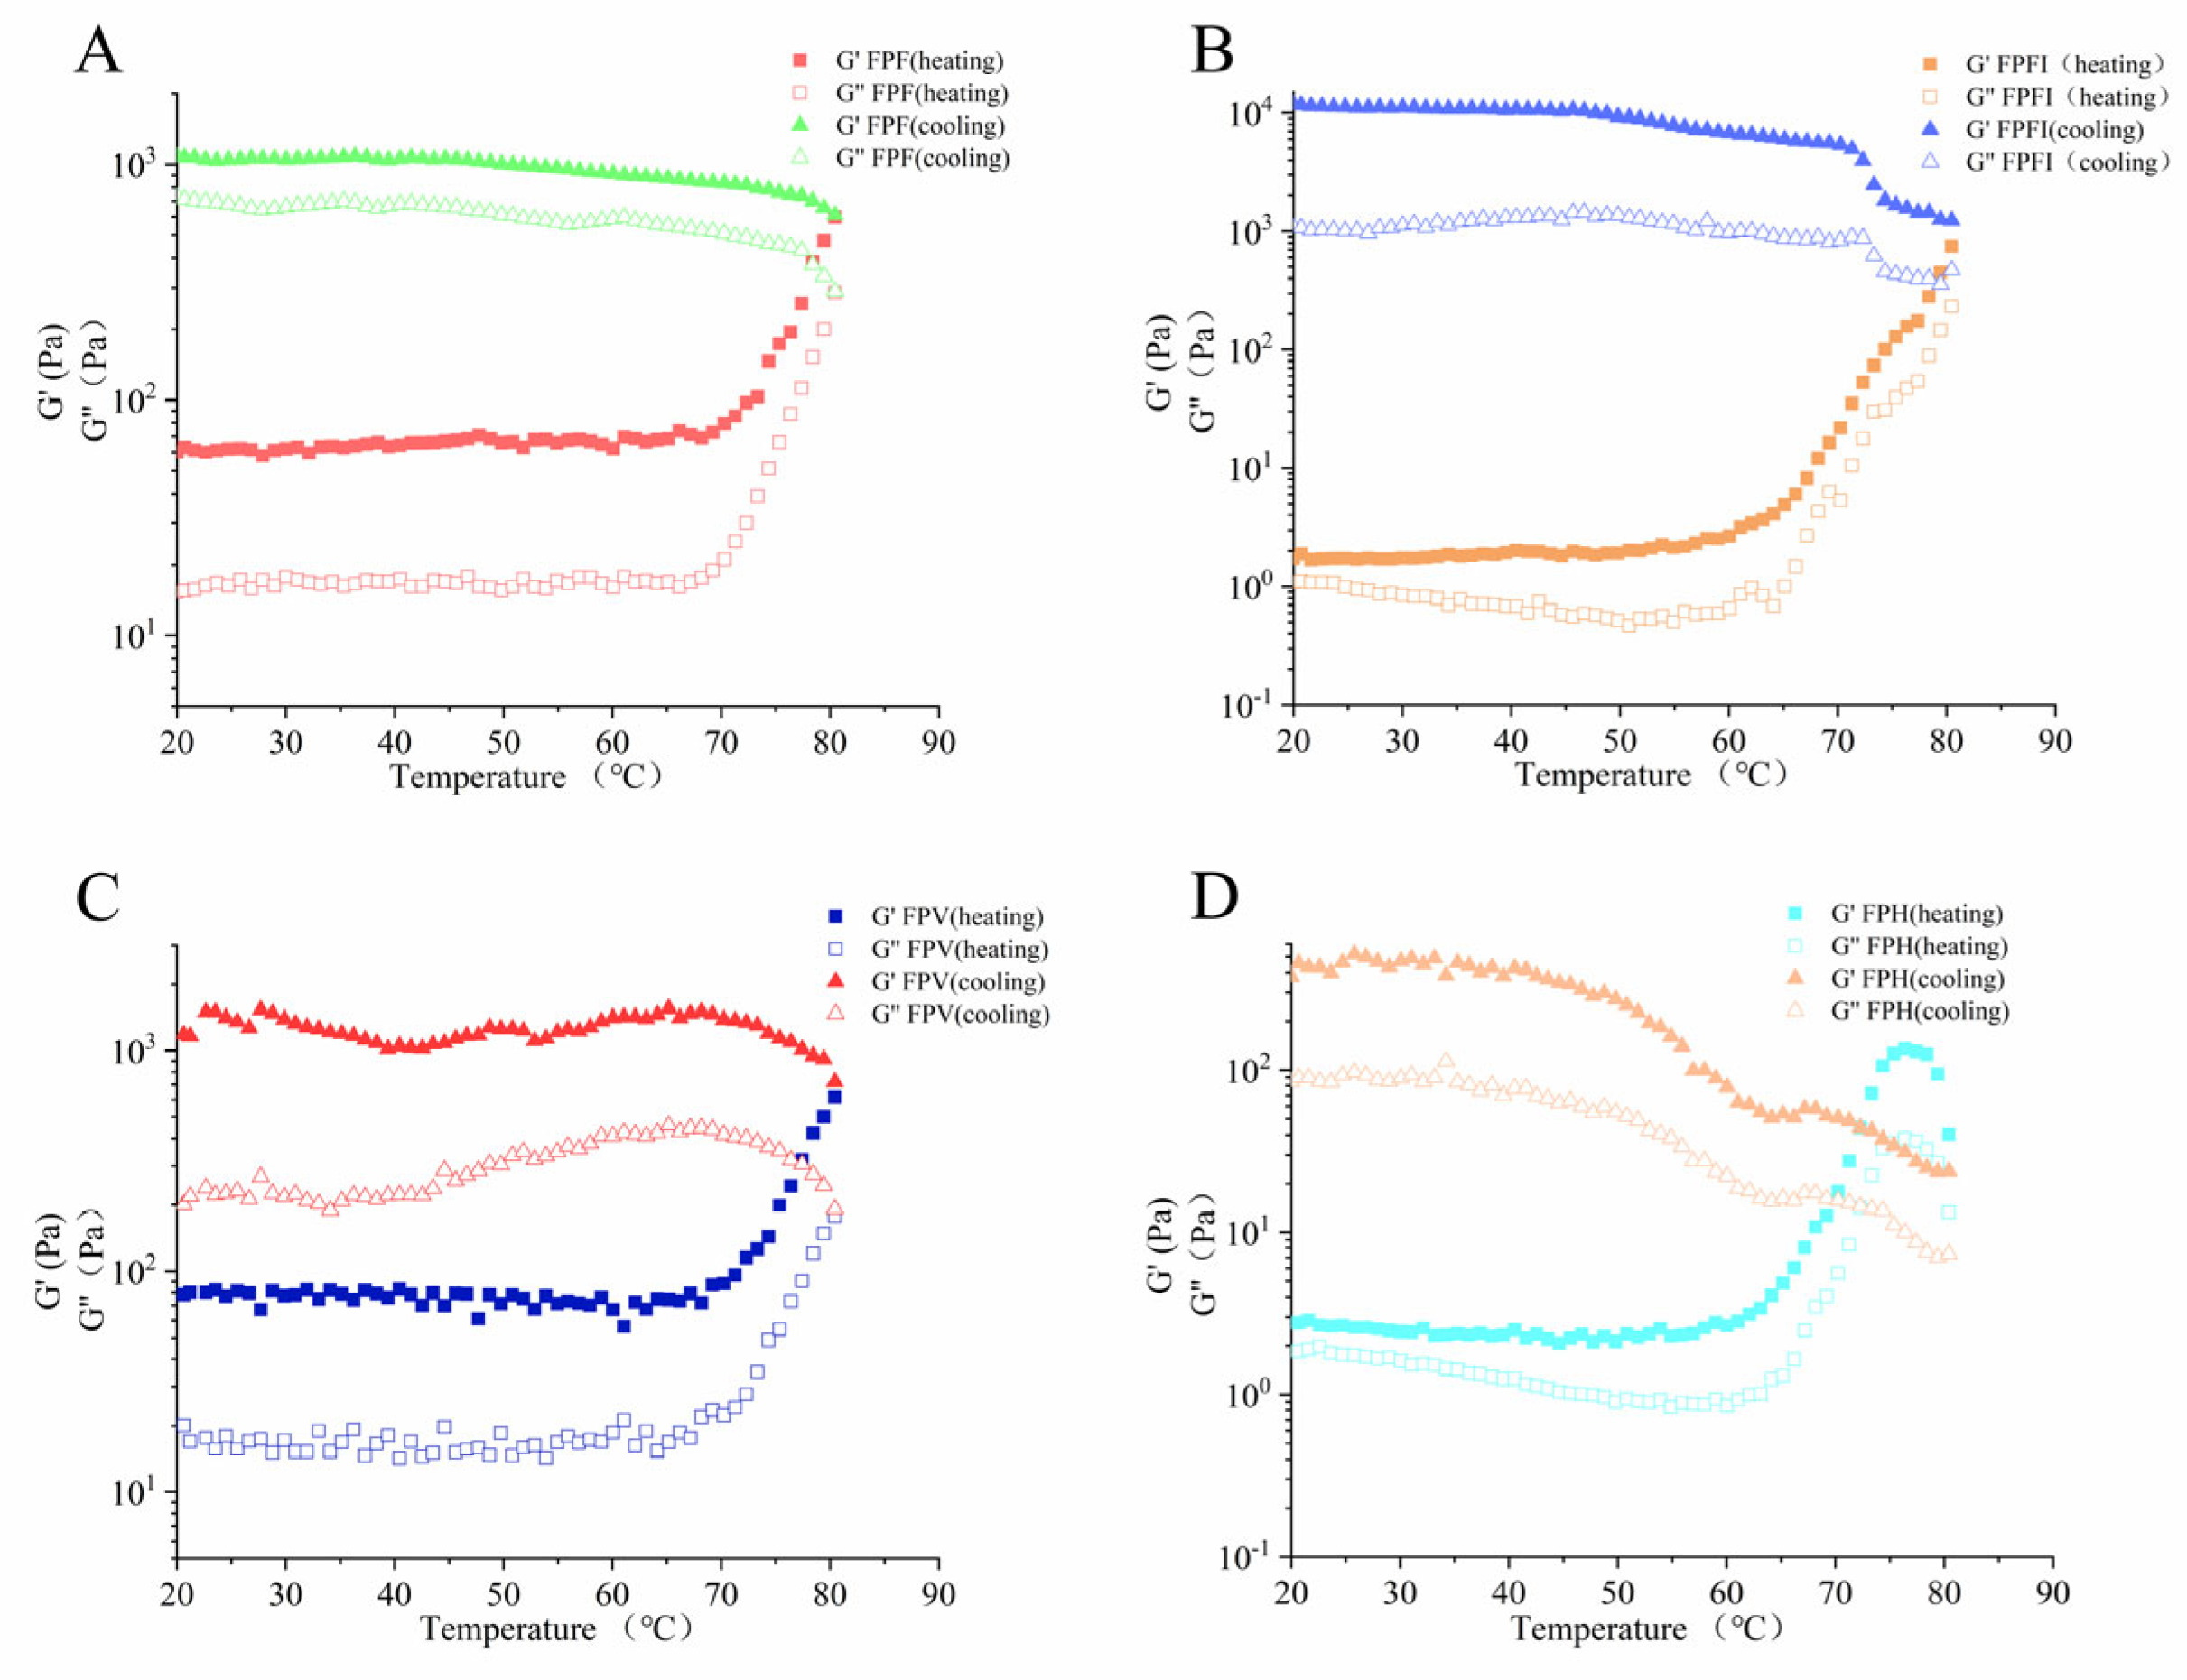
As shown in Figure 7, the thermal stability of the heating and cooling processes of different FPs was tested. During heating, the G′ of all FPs was higher than G″ and the polysaccharides showed a typical gel-like system. During the heating process from 20 to 60 °C, the G′ of the four FPs remained unchanged, the G″ of FPF(A) and FPV(C) remained unchanged and FPFI(B) and FPH(D) showed a decreasing trend. The G′ and G″ of all four polysaccharides increased rapidly during the warming process at 60 to 80 °C. During the cooling process from 80 to 20 °C, the G′ and G″ values of all four FPs increased and G′ was greater than G″. The polysaccharides showed a stable gel-like system. Combining the apparent viscosity, dynamic rheological properties and temperature scans of the four FPs, the results show that different drying methods can affect the rheological properties of FPs. All polysaccharides exhibit good gel properties and they can be used as thickeners and stabilizers in the food industry.

3.8. Antioxidant Activity of FPs

Polysaccharides can be used as natural free radical scavengers with potential antioxidant activity [20]. The scavenging capacity of DPPH free radicals is widely used to determine the antioxidant capacity of polysaccharides [42]. Figure 8A shows the scavenging ability of the four polysaccharides and Vc on DPPH radicals. All FPs had DPPH radical scavenging ability and the scavenging ability was positively related to their concentrations. The results showed that the DPPH radical scavenging rates of FPF, FPV, FPH and FPFI were 70.12%, 63.47%, 57.41% and 60.45%, respectively. In addition, the IC50 values of DPPH radical scavenging (Figure 8B) by FPF, FPV, FPH and FPFI were 0.403 mg/mL, 0.592 mg/mL, 0.934 mg/mL and 0.709 mg/mL, respectively. It is proved that FPF can achieve better DPPH free radical scavenging effect with a relatively low dose. All polysaccharides were less effective than Vc in scavenging free radicals, and the order of their scavenging ability was FPF > FPV > FPFI > FPH.
Polysaccharides and ABTS radicals are scavenged by hydrogen-donating scavenging and combine into stable ABTS molecules to achieve scavenging of ABTS radicals [43]. As shown in Figure 8C, FPF, FPV, FPH and FPFI all had scavenging ability for ABTS radicals and the scavenging ability increased with increasing polysaccharide concentration. The clearance of FPH and FPV was significantly lower than that of FPF and FPFI when the concentration range was 0.5–1.5 mg/mL. FPF, FPV, FPH and FPFI all reached their maximum clearance after 1.6 mg/mL, which was 67.81%, 53.48%, 47.96% and 63.71%, respectively. The IC50 for clearance of ABTS (Figure 8D) by FPF, FPV, FPH and FPIR were 0.563, 1.242, 2.013 and 0.678 mg/mL, respectively. It was proven that FPF and FPFI were effective in scavenging ABTS radicals.
FRAP reduction capacity is the reduction in trivalent iron ions (Fe3+) to ferrous ions (Fe2+) by polysaccharides by providing electrons [44]. The stronger reducing power of FRAP indicates the stronger antioxidant activity of polysaccharides. Figure 8E shows the FRAP reduction capacity of the four polysaccharides. All polysaccharides showed reduction capacity and lower reduction power than Vc. Among the four FPs samples, FPFI had the strongest reducing power followed by FPF and FPV, and FPH had the worst reducing power.
It has been reported that the antibody oxidation activity of natural polysaccharides is closely related to its structural composition [35]. Pearson correlation coefficient was used to analyze the correlations among molecular weight, monosaccharide composition, uronic acid, apparent viscosity and antioxidant capacity of FPs, and the results were normalized by column, as shown in Figure 5 The DPPH radical scavenging activity of FPs was significantly positively correlated with the content of uronic acid (**), and significantly negatively correlated with Glc (*) and Man (*). The ABTS radical scavenging activity of FPs was positively correlated with uronic acid content (***) and GalA (**), and negatively correlated with molecular weight (**), apparent viscosity (**) and Gal (**). The iron reduction capacity of FPs was positively correlated with uronic acid content (**) and Rha (*), and negatively correlated with molecular weight (***), apparent viscosity (***) and Ara (*). The results were consistent with the previously reported correlation between antioxidant activity of polysaccharides and low molecular weight and high content of uronic acid [40]. Lo et al. [45] reported that the content of rhamnose in lentinan was positively correlated with that of antioxidant, but the content of glucose and arabinose was negatively correlated. The highest DPPH and ABTS radical clearance rates of FPF were attributed to its elevated uronic acid content, increased galacturonic acid molar ratio and reduced galactose molar ratio, combined with lower molecular weight and apparent viscosity, as inferred from Pearson correlation analysis. Meanwhile, the optimal iron reduction capacity was observed in FPFI, which was associated with its minimal molecular weight, low apparent viscosity, and substantial uronic acid content.

3.9. Sodium Taurocholate Binding Capacity In Vitro

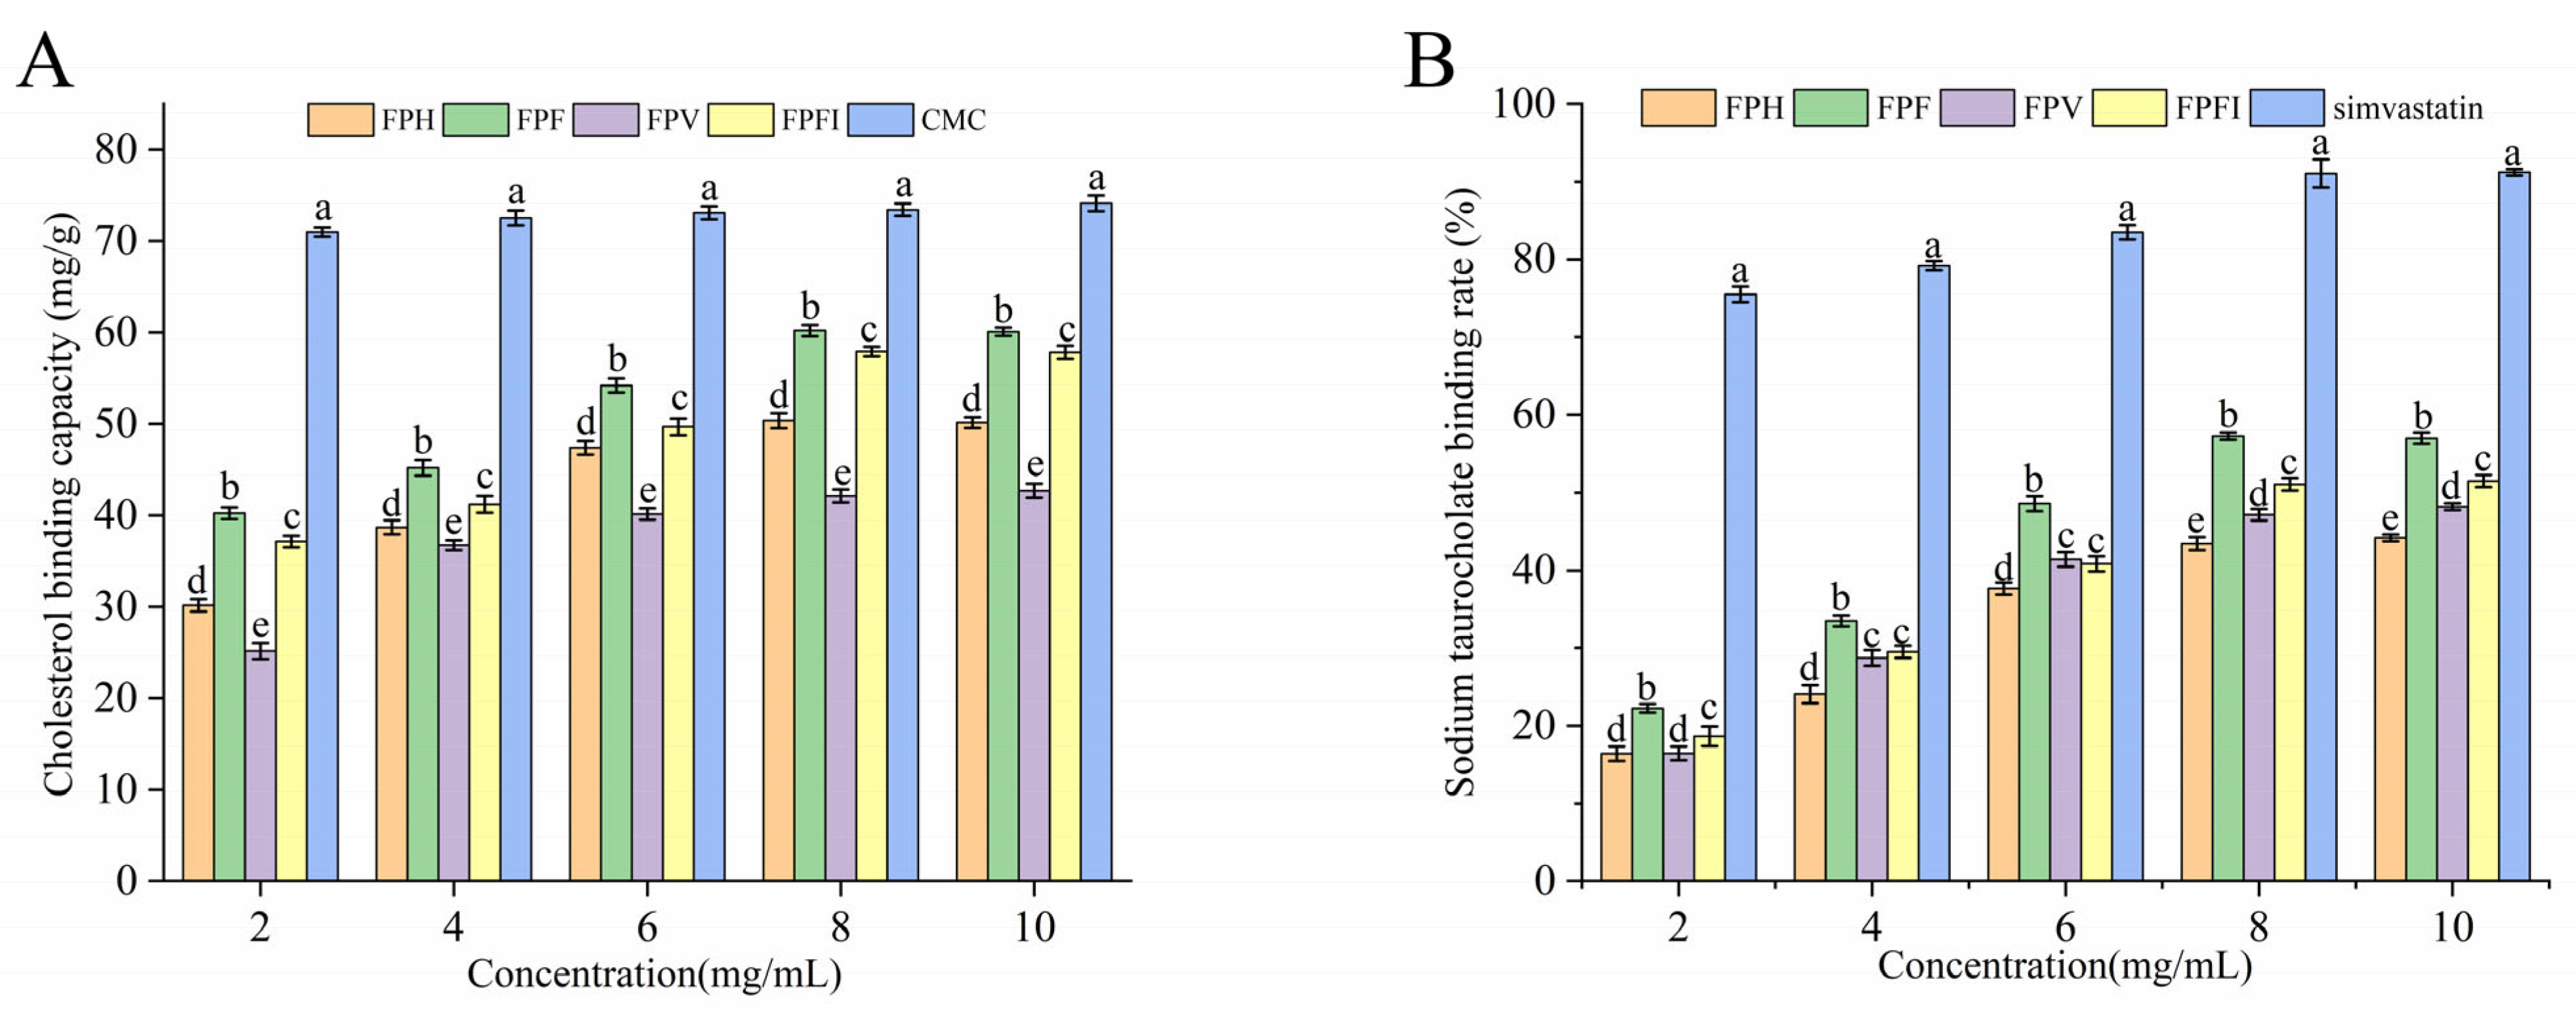
Cholesterol is an important cause of hyperlipidemia. Research has demonstrated that natural polysaccharides have the ability to bind cholesterol. Figure 9A demonstrates the cholesterol binding capacity of the four FPs. The cholesterol binding capacities of FPF, FPFI, FPV, FPH and CMC were 60.08, 57.86, 42.72, 50.14 and 74.13 mg/g at a concentration of 10 mg/mL, respectively. FPF has the highest cholesterol binding capacity. The cholesterol binding capacity of FPF was 40.64% higher than that of FPV, equivalent to 81.05% of CMC.
In the liver, cholesterol is oxidatively degraded to produce bile acids in the form of bile salts. Polysaccharides reduce the reabsorption of bile acid salts by binding with bile acid salts, preventing the accumulation of bile acid salts in the intestinal and hepatic circulation, and also promote the conversion of cholesterol to bile acid salts, exerting the efficacy of lowering blood lipids [41]. Sodium taurocholate is the most difficult bile acid salt to bind, and is commonly used to assess lipid-lowering levels. The sodium taurocholate binding capacity of the four FPs is shown in Figure 9B. They all exhibited sodium taurocholate binding capacity which was lower than that of the positive control. The binding capacity of all four FPs to sodium taurocholate increased with increasing concentration. In the range of 2.0–10.0 mg/mL, the maximum binding of FPF, FPH, FPV and FPFI was 57.02%, 44.19%, 48.17% and 51.50%, respectively. It can be seen that FPF has the strongest bile salt binding capacity, followed by FPFI, and FPH has the weakest bile salt binding capacity.
The difference in binding ability of polysaccharides with cholesterol and bile acids may be due to their different uronic acid, molecular weight, monosaccharide composition and apparent viscosity [46]. Pearson correlation coefficient analysis of cholesterol, bile acid binding ability and polysaccharide structure was shown in Figure 5. Cholesterol adsorption capacity and bile acid binding capacity were significantly positively correlated with uronic acid content (***), GalA (**) and Rha (*), and significantly negatively correlated with molecular weight (**), apparent viscosity (**), Gal (**) and Ara (*). The content of glucuronic acid of FPF was 12.05%, 11.22% and 5.72% higher than that of FPH, FPV and FPFI, respectively, and the molar ratio of GalA was higher than that of the other three polysaccharides, which made it easier for FPF to capture cholesterol and sodium taurine cholate. Due to their high molecular weight and apparent viscosity, FPH and FPV have poor fluidity and limit the absorption of cholesterol and bile acids. Ma et al. [47] reported that polysaccharides from fruiting bodies of Lentinula edodes had the best cholesterol and bile acid binding capacity, possibly due to their highest polysaccharide content, lower viscosity, and average viscosity molecular weight. In addition, the surface structure of FPF is smooth and stable, which can provide more binding sites to bind cholesterol and cholate. In summary, FPF has the highest hypolipidemic activity compared with FPH, FPV and FPFI.

4. Conclusions

In this study, the structure characterization, antioxidant and hypolipidemic activities of fig polysaccharides prepared by different drying methods were compared. The results showed that drying method had great influence on physicochemical properties, structure, rheological properties and biological activities of fig polysaccharide. Specifically, FPF has less surface aggregation and more uniform molecular distribution than FPFI, FPH, and FPV. In addition, FPF has the highest extraction rate, the highest content of uronic acid, the lowest content of Gal, a large proportion of available monosaccharides, a low molecular weight and the highest antioxidant and lipid-lowering activities. In conclusion, high uronic acid content, high GalA ratio, low molecular weight, low apparent viscosity and low Gal ratio have a good effect on cholesterol and bile acid binding. Generally, vacuum freeze-drying is more beneficial to obtain fig polysaccharide with higher hypolipidemic ability.

Author Contributions

Methodology, G.Z.; software, G.Z. and J.W.; validation, M.J.; formal analysis, G.Z.; investigation, G.Z., J.W. and J.L.; data curation, G.Z.; writing—original draft preparation, G.Z.; writing—review and editing, G.Z., R.S. and L.S.; visualization, M.J. and M.Y.; supervision, R.S.; funding acquisition, R.S. All authors have read and agreed to the published version of the manuscript.

Funding

This research was funded by the 2021 Taishan Industry Leading Talent Project (NO. tscx202211079), Shandong Province Natural Science Foundation, China (ZR2022MC130), The Jinan 20 Rules of High School (2020GXRC024) and Qilu University of Technology 2022 major innovation project of the pilot of integration of science, education and industry (2022JBZ01-08).

Institutional Review Board Statement

Not applicable.

Informed Consent Statement

Not applicable.

Data Availability Statement

The original contributions presented in the study are included in the article, further inquiries can be directed to the corresponding author. This study did not involve human studies.

Acknowledgments

Authors would like to acknowledge the Natural Science Foundation of Shandong Province, the Taishan Industry Leading Talents Project, the Jinan 20 Rules of High School and the Qilu University of Technology 2022 major innovation project for the pilot of integration of science, education and industry for their financial support of this research.

Conflicts of Interest

The authors declare no conflict of interest.

References

  1. Teruel-Andreu, C.; Issa-Issa, H.; Noguera-Artiaga, L.; Sendra, E.; Hernández, F.; Cano-Lamadrid, M. Volatile profile of breba and fig fruits (peel and pulp) from different Ficus carica L. varieties. Sci. Hortic. 2024, 328, 112892. [Google Scholar] [CrossRef]
  2. Lansky, E.P.; Paavilainen, H.M.; Pawlus, A.D.; Newman, R.A. Ficus spp. (fig): Ethnobotany and potential as anticancer and anti-inflammatory agents. J. Ethnopharmacol. 2008, 119, 195–213. [Google Scholar] [CrossRef]
  3. Ayuso, M.; Carpena, M.; Taofiq, O.; Albuquerque, T.G.; Simal-Gandara, J.; Oliveira, M.B.P.P.; Prieto, M.A.; Ferreira, I.C.F.R.; Barros, L. Fig “Ficus carica L.” and its by-products: A decade evidence of their health-promoting benefits towards the development of novel food formulations. Trends Food Sci. Technol. 2022, 127, 1–13. [Google Scholar] [CrossRef]
  4. Solomon, A.; Golubowicz, S.; Yablowicz, Z.; Grossman, S.; Bergman, M.; Gottlieb, H.E.; Altman, A.; Kerem, Z.; Flaishman, M.A. Antioxidant Activities and Anthocyanin Content of Fresh Fruits of Common Fig (Ficus carica L.). J. Agric. Food Chem. 2006, 54, 7717–7723. [Google Scholar] [CrossRef]
  5. Thangavel, P.; Saravanakumar, I.; Sundaram, M.K.; Rathinam, B.; Muthuvijayan, V. Preparation and characterization of a jelly fig (Ficus awkeotsang Makino) polysaccharide-based bioactive 3D scaffold for improved vascularization and skin tissue engineering applications. Int. J. Biol. Macromol. 2024, 259, 129199. [Google Scholar] [CrossRef]
  6. Chen, R.; Li, H.; Li, S.; Jin, C.; Lu, J. Extraction optimization, preliminary characterization and immunological activity of polysaccharides from figs. Int. J. Biol. Macromol. 2015, 72, 185–194. [Google Scholar] [CrossRef]
  7. Chen, H.-H.; Shyu, Y.-T.; Wu, S.-J. Physicochemical characteristics and retardation effects on in vitro starch digestibility of non-starch polysaccharides in jelly-fig (Ficus pumila L. var. awkeotsang). LWT 2023, 180, 114688. [Google Scholar] [CrossRef]
  8. Yang, Q.; Liu, Y.; Guo, Y.; Jiang, Y.; Wen, L.; Yang, B. New insights of fig (Ficus carica L.) as a potential function food. Trends Food Sci. Technol. 2023, 140, 104146. [Google Scholar] [CrossRef]
  9. Zhang, Z.; Li, D.; Ma, X.; Li, X.; Guo, Z.; Liu, Y.; Zheng, S. Carboxylated nanodiamond-mediated NH2-PLGA nanoparticle-encapsulated fig polysaccharides for strongly enhanced immune responses in vitro and in vivo. Int. J. Biol. Macromol. 2020, 165, 1331–1345. [Google Scholar] [CrossRef]
  10. Wang, C.; Jing, S.; Hou, D.; Zhu, B.; Yang, Y.; Yu, J.; Liu, L.; Bai, J.; Xu, H.; Kou, L. X-rays irradiation maintains redox homeostasis and regulates energy metabolism of fresh figs (Ficus carica L. Siluhongyu). Food Chem. 2024, 438, 138067. [Google Scholar] [CrossRef]
  11. Çavdaroğlu, E.; Yemenicioğlu, A. Utilization of stalk waste separated during processing of sun-dried figs (Ficus carica) as a source of pectin: Extraction and determination of molecular and functional properties. LWT 2022, 154, 112624. [Google Scholar] [CrossRef]
  12. Wang, W.; Liu, X.; Wang, L.; Song, G.; Jiang, W.; Mu, L.; Li, J. Ficus carica polysaccharide extraction via ultrasound-assisted technique: Structure characterization, antioxidant, hypoglycemic and immunomodulatory activities. Ultrason. Sonochem. 2023, 101, 106680. [Google Scholar] [CrossRef] [PubMed]
  13. Panza, O.; Conte, A.; Del Nobile, M.A. Recycling of fig peels to enhance the quality of handmade pasta. LWT 2022, 168, 113872. [Google Scholar] [CrossRef]
  14. Yuan, Q.; He, Y.; Xiang, P.-Y.; Huang, Y.-J.; Cao, Z.-W.; Shen, S.-W.; Zhao, L.; Zhang, Q.; Qin, W.; Wu, D.-T. Influences of different drying methods on the structural characteristics and multiple bioactivities of polysaccharides from okra (Abelmoschus esculentus). Int. J. Biol. Macromol. 2020, 147, 1053–1063. [Google Scholar] [CrossRef]
  15. Sun, W.; Li, M.; Zhang, Y.; Ai, Z.; Lei, D.; Pei, Y.; Liu, Y. Effect of different drying techniques on drying characteristics, physical quality, and active components of Citri reticulatae pericarpium, and the correlation between physiochemical quality. Ind. Crops Prod. 2023, 204, 117350. [Google Scholar] [CrossRef]
  16. An, K.; Wu, J.; Xiao, H.; Hu, T.; Yu, Y.; Yang, W.; Xiao, G.; Xu, Y. Effect of various drying methods on the physicochemical characterizations, antioxidant activities and hypoglycemic activities of lychee (Litchi chinensis Sonn.) pulp polysaccharides. Int. J. Biol. Macromol. 2022, 220, 510–519. [Google Scholar] [CrossRef]
  17. Wang, Y.; Li, X.; Zhao, P.; Qu, Z.; Bai, D.; Gao, X.; Zhao, C.; Chen, J.; Gao, W. Physicochemical characterizations of polysaccharides from Angelica Sinensis Radix under different drying methods for various applications. Int. J. Biol. Macromol. 2019, 121, 381–389. [Google Scholar] [CrossRef]
  18. Yao, L.; Fan, L.; Duan, Z. Effect of different pretreatments followed by hot-air and far-infrared drying on the bioactive compounds, physicochemical property and microstructure of mango slices. Food Chem. 2020, 305, 125477. [Google Scholar] [CrossRef]
  19. Liu, Y.; Luo, M.; Liu, F.; Feng, X.; Ibrahim, S.A.; Cheng, L.; Huang, W. Effects of freeze drying and hot-air drying on the physicochemical properties and bioactivities of polysaccharides from Lentinula edodes. Int. J. Biol. Macromol. 2020, 145, 476–483. [Google Scholar] [CrossRef]
  20. Hou, S.; Tan, M.; Chang, S.; Zhu, Y.; Rong, G.; Wei, G.; Zhang, J.; Zhao, B.; Zhao, Q.-S. Effects of different processing (Paozhi) on structural characterization and antioxidant activities of polysaccharides from Cistanche deserticola. Int. J. Biol. Macromol. 2023, 245, 125507. [Google Scholar] [CrossRef]
  21. Han, L.-C.; Jin, T.-X. Effects of combined vacuum and heat pump drying on drying characteristics and physicochemical properties of pineapple. LWT 2024, 192, 115727. [Google Scholar] [CrossRef]
  22. Chao, E.; Li, J.; Fan, L. Influence of combined freeze-drying and far-infrared drying technologies on physicochemical properties of seed-used pumpkin. Food Chem. 2023, 398, 133849. [Google Scholar] [CrossRef] [PubMed]
  23. Zhang, L.; Liao, L.; Qiao, Y.; Wang, C.; Shi, D.; An, K.; Hu, J. Effects of ultrahigh pressure and ultrasound pretreatments on properties of strawberry chips prepared by vacuum-freeze drying. Food Chem. 2020, 303, 125386. [Google Scholar] [CrossRef] [PubMed]
  24. Du, J.; Li, J.; Zhu, J.; Huang, C.; Bi, S.; Song, L.; Hu, X.; Yu, R. Structural characterization and immunomodulatory activity of a novel polysaccharide from Ficus carica. Food Funct. 2018, 9, 3930–3943. [Google Scholar] [CrossRef]
  25. Li, Y.; He, Y.; Zhang, H.; Ma, X. Effects of ultrasonic-enzymatic-assisted ethanol precipitation method on the physicochemical characteristics, antioxidant and hypoglycemic activities of Tremella fuciformis polysaccharides. Ultrason. Sonochem. 2023, 101, 106682. [Google Scholar] [CrossRef]
  26. Tepsongkroh, B.; Thaihuttakij, C.; Supawong, S.; Jangchud, K. Impact of high pressure pre-treatment and hot water extraction on chemical properties of crude polysaccharide extract obtained from mushroom (Volvariella volvacea). Food Chem. X 2023, 19, 100864. [Google Scholar] [CrossRef]
  27. Zhang, Z.-f.; Lv, G.-y.; Song, T.-t.; Xu, Z.-w.; Wang, M.-y. Effects of different extraction methods on the structural and biological properties of Hericium coralloides polysaccharides. Food Chem. 2024, 445, 138752. [Google Scholar] [CrossRef]
  28. Qiao, Y.; Shen, Y.; Jiang, H.; Li, D.; Li, B. Structural characterization, antioxidant and antibacterial activity of three pectin polysaccharides from blueberry. Int. J. Biol. Macromol. 2024, 262, 129707. [Google Scholar] [CrossRef]
  29. Jiang, X.-Y.; Wang, C.-W.; Zhang, J.; Xu, P.-P.; Xue, Y.-T.; Wang, Q. Effects of different extraction methods on physicochemical characteristics and bioactivities of fig (Ficus carica L.) leaves polysaccharides. Arab. J. Chem. 2023, 16, 105319. [Google Scholar] [CrossRef]
  30. Deng, J.; Min, J.; Zhang, Y.; You, R.; Zhang, Z.; Hu, Y.; Chen, X.; Cheng, S.; Ma, X.; Zhang, S. Preparation, characterization and cytotoxicity assessment of a novel selenized polysaccharide from Morchella sextelata. Int. J. Biol. Macromol. 2024, 265, 131100. [Google Scholar] [CrossRef]
  31. Akbal, A.; Şahin, S.; Güroy, B. Optimization of ultrasonic-assisted extraction of polysaccharides from Ulva rigida and evaluation of their antioxidant activity. Algal Res. 2024, 77, 103356. [Google Scholar] [CrossRef]
  32. Ayimbila, F.; Siriwong, S.; Chaiyama, V.; Srihanant, N.; Keawsompong, S. Comparative study of bio-functional profile and bioactivities of polysaccharides from Ganoderma lucidum and Ganoderma neo-japonicum. Biocatal. Agric. Biotechnol. 2023, 53, 102875. [Google Scholar] [CrossRef]
  33. Li, X.-G.; Zhang, F.-Y.; Jiang, C.-X.; Jiang, J.; Hou, Y.-H.; Zhang, J.-W. Structural analysis, in vitro antioxidant and lipid-lowering activities of purified Tremella fuciformis polysaccharide fractions. Process Biochem. 2023, 133, 99–108. [Google Scholar] [CrossRef]
  34. Ma, Q.; Santhanam, R.K.; Xue, Z.; Guo, Q.; Gao, X.; Chen, H. Effect of different drying methods on the physicochemical properties and antioxidant activities of mulberry leaves polysaccharides. Int. J. Biol. Macromol. 2018, 119, 1137–1143. [Google Scholar] [CrossRef]
  35. Shang, H.; Cao, Z.; Zhang, H.; Guo, Y.; Zhao, J.; Wu, H. Physicochemical characterization and in vitro biological activities of polysaccharides from alfalfa (Medicago sativa L.) as affected by different drying methods. Process Biochem. 2021, 103, 39–49. [Google Scholar] [CrossRef]
  36. Xiang, G.; Sun, H.; Chen, Y.; Guo, H.; Liu, Y.; Li, Y.; Lu, C.; Wang, X. Antioxidant and hypoglycemic activity of tea polysaccharides with different degrees of fermentation. Int. J. Biol. Macromol. 2023, 228, 224–233. [Google Scholar] [CrossRef]
  37. Chen, G.-J.; Hong, Q.-Y.; Ji, N.; Wu, W.-N.; Ma, L.-Z. Influences of different drying methods on the structural characteristics and prebiotic activity of polysaccharides from bamboo shoot (Chimonobambusa quadrangularis) residues. Int. J. Biol. Macromol. 2020, 155, 674–684. [Google Scholar] [CrossRef]
  38. Ma, L.; Chen, H.; Zhu, W.; Wang, Z. Effect of different drying methods on physicochemical properties and antioxidant activities of polysaccharides extracted from mushroom Inonotus obliquus. Food Res. Int. 2013, 50, 633–640. [Google Scholar] [CrossRef]
  39. Fu, Y.; Feng, K.-L.; Wei, S.-Y.; Xiang, X.-R.; Ding, Y.; Li, H.-Y.; Zhao, L.; Qin, W.; Gan, R.-Y.; Wu, D.-T. Comparison of structural characteristics and bioactivities of polysaccharides from loquat leaves prepared by different drying techniques. Int. J. Biol. Macromol. 2020, 145, 611–619. [Google Scholar] [CrossRef]
  40. Yan, J.-K.; Wu, L.-X.; Qiao, Z.-R.; Cai, W.-D.; Ma, H. Effect of different drying methods on the product quality and bioactive polysaccharides of bitter gourd (Momordica charantia L.) slices. Food Chem. 2019, 271, 588–596. [Google Scholar] [CrossRef]
  41. Wu, B.; Qiu, C.; Guo, Y.; Zhang, C.; Li, D.; Gao, K.; Ma, Y.; Ma, H. Comparative Evaluation of Physicochemical Properties, Microstructure, and Antioxidant Activity of Jujube Polysaccharides Subjected to Hot Air, Infrared, Radio Frequency, and Freeze Drying. Agriculture 2022, 12, 1606. [Google Scholar] [CrossRef]
  42. Jiang, F.; Sheng, Y.; Wang, F.; Pan, H.; Chen, W.; Kong, F. Characterization and biological activity of acidic sugarcane leaf polysaccharides by microwave-assisted hot alkali extraction. Food Biosci. 2023, 54, 102852. [Google Scholar] [CrossRef]
  43. Fimbres-Olivarria, D.; Carvajal-Millan, E.; Lopez-Elias, J.A.; Martinez-Robinson, K.G.; Miranda-Baeza, A.; Martinez-Cordova, L.R.; Enriquez-Ocaña, F.; Valdez-Holguin, J.E. Chemical characterization and antioxidant activity of sulfated polysaccharides from Navicula sp. Food Hydrocoll. 2018, 75, 229–236. [Google Scholar] [CrossRef]
  44. Ghosh, S.; Abdullah, M.F. Extraction of polysaccharide fraction from cadamba (Neolamarckia cadamba) fruits and evaluation of its in vitro and in vivo antioxidant activities. Int. J. Biol. Macromol. 2024, 279, 135564. [Google Scholar] [CrossRef]
  45. Lo, T.C.-T.; Chang, C.A.; Chiu, K.-H.; Tsay, P.-K.; Jen, J.-F. Correlation evaluation of antioxidant properties on the monosaccharide components and glycosyl linkages of polysaccharide with different measuring methods. Carbohydr. Polym. 2011, 86, 320–327. [Google Scholar] [CrossRef]
  46. Gao, J.; Lin, L.; Sun, B.; Zhao, M. A comparison study on polysaccharides extracted from Laminaria japonica using different methods: Structural characterization and bile acid-binding capacity. Food Funct. 2017, 8, 3043–3052. [Google Scholar] [CrossRef]
  47. Ma, Y.; Liao, Z.; Kang, X.; Li, C.; Hu, G. Physicochemical properties, structural characterization, and in vitro binding capacity of polysaccharide fractions from the fruiting bodies of Lentinula edodes. J. Food Meas. Charact. 2024, 18, 6858–6871. [Google Scholar] [CrossRef]
Figure 1. HPLC chromatograms of FPs obtained by different dry methods.
Applsci 15 04215 g001
Figure 2. (A) FT-IR spectra of FPs, (B) X-ray diffraction curves of FPs.
Applsci 15 04215 g002
Figure 3. Scanning electron micrographs of the FPs: (A) FPF, (B) FPFI, (C) FPH, (D) FPV, 1 μm*: indicates the scale in this figure, all at magnifications of 10,000×.
Applsci 15 04215 g003
Figure 4. The apparent viscosity of FPs.
Applsci 15 04215 g004
Figure 5. Pearson correlation analysis of molecular weight, monosaccharide composition, apparent viscosity, uronic acid content and antioxidant and hypolipidemic activity. Note: *: p < 0.05; **: p < 0.01; ***: p < 0.001.
Applsci 15 04215 g005
Figure 6. Variation in storage modulus (G′) and loss modulus (G″) against frequency for four FPs under frequency scanning (AD). (AD) represent FPF, FPFI, FPV and FPH, respectively.
Applsci 15 04215 g006
Figure 7. Variation in storage modulus (G′) and loss modulus (G″) of FPs during the heating and cooling process (AD). A-D represent FPF, FPFI, FPV and FPH, respectively.
Applsci 15 04215 g007
Figure 8. Antioxidant activities in vitro of FPF, FPFI, FPH and FPV: (A) scavenging ability on DPPH, (B) IC50 of DPPH scavenging ability, (C) scavenging ability on ABTS, (D) IC50 of ABTS scavenging ability, (E) reducing ability of ferric ion. Note: Different superscript lowercase letters (a–d) are significantly different (p < 0.05).
Applsci 15 04215 g008
Figure 9. In vitro lipid-lowering activity of FPF, FPFI, FPH and FPV: (A) Cholesterol binding capacity in vitro, (B) sodium taurocholate binding capacity in vitro. Note: Different superscript lowercase letters (a–e) are significantly different (p < 0.05).
Applsci 15 04215 g009
Table 1. Effects of different drying methods on the chemical properties.
ItemFPFFPVFPFIFPH
Extraction yields (%)2.49 ± 0.16 a1.66 ± 0.13 c1.94 ± 0.12 b1.57 ± 0.21 c
Neutral sugar (%)60.04 ± 0.80 b62.84 ± 0.93 a58.09 ± 0.94 c63.29 ± 0.97 a
Uronic acid (%)25.56 ± 0.54 a14.34 ± 0.49 c19.84 ± 0.29 b13.51 ± 0.34 c
Protein (%)0.96 ± 0.18 b0.98 ± 0.10 b1.13 ± 0.07 b1.33 ± 0.04 a
Note: Data are expressed as means ± SD (n = 3). Different superscript lowercase letters (a–c) are significantly different (p < 0.05).
Table 2. Effects of different drying methods on monosaccharide composition.
Monosaccharides Composition (Molar Ratio, %)FPFFPVFPFIFPH
Mannose2.84 ± 0.17 c2.87 ± 0.21 c4.03 ± 0.12 a3.29 ± 0.18 b
Rhamnose8.35 ± 0.11 a6.86 ± 0.03 c8.38 ± 0.09 a7.64 ± 0.14 b
Glucuronic acidndndndnd
Galacturonic acid24.35 ± 0.14 a11.32 ± 0.12 d18.69 ± 0.15 b16.26 ± 0.21 c
Glucose9.55 ± 0.13 c8.55 ± 0.15 d13.46 ± 0.18 a12.44 ± 0.09 b
Galactose17.64 ± 0.05 d21.30 ± 0.12 a18.37 ± 0.06 c20.47 ± 0.11 b
Xylosendndndnd
Arabinose37.26 ± 0.15 c49.10 ± 0.07 a37.07 ± 0.18 c39.89 ± 0.17 b
Note: Data are expressed as means ± SD (n = 3). Different superscript lowercase letters (a–d) are significantly different (p < 0.05). nd: No detection.
Table 3. Effects of different drying methods on molecular weight distribution.
Molecular Weight (Da)FPFFPVFPFIFPH
Number average molecular weight (Mn)8.572 × 10⁴ (±0.959%) c1.088 × 105 (±1.982%) b5.047 × 104 (±1.145%) d1.124 × 105 (±1.245%) a
Peak molecular weight (Mp)4.240 × 10⁴ (±1.036%) b6.484 × 104 (±0.805%) a4.711 × 104 (±1.621%) b6.792 × 104 (±1.005%) a
Weight average molecular weight (Mw)1.457 × 10⁵ (±1.456%) c1.664 × 105 (±1.749%) b8.473 × 104 (±2.034%) d1.798 × 105 (±1.469%) a
Mw/Mn1.700 ± 0.01 a1.530 ± 0.02 b1.679 ± 0.02 a1.599 ± 0.03 b
Note: Data are expressed as means ± SD (n = 3). Different superscript lowercase letters (a–d) are significantly different (p < 0.05).
Disclaimer/Publisher’s Note: The statements, opinions and data contained in all publications are solely those of the individual author(s) and contributor(s) and not of MDPI and/or the editor(s). MDPI and/or the editor(s) disclaim responsibility for any injury to people or property resulting from any ideas, methods, instructions or products referred to in the content.