Abstract
Limited financial resources significantly impact the ability of distribution system operators to prioritize maintenance, upgrade infrastructure, and integrate advanced technologies. To optimize resource allocation, a structured and detailed analysis is essential for maximizing reliability improvements within budget constraints. This paper presents a methodology for enhancing the reliability performance of semi-urban and rural distribution networks by identifying optimal investment strategies under financial limitations. Investment options are categorized into three groups: (1) installing new components where none previously existed, (2) replacing aging, higher-failure-rate equipment with new components, and (3) upgrading both network components and operational strategies. To determine the most effective investments, the selection process aims to minimize the System Average Interruption Duration Index (SAIDI) and Energy Not Supplied (ENS), while also considering an economic metric that quantifies reliability in monetary terms. The methodology was tested on networks with diverse consumer types, incorporating Monte Carlo simulation to account for uncertainties in component reliability indices and node loads. An optimization algorithm was developed, implemented, and validated using representative test networks, demonstrating its effectiveness in guiding investment decisions for improved distribution system reliability.
1. Introduction
A fundamental objective in developing distribution networks is ensuring a stable, cost-effective, and secure electricity supply. Achieving this goal requires a structured and strategic planning approach, which serves as a core operational process for distribution system operators. In the long run, enhancing the distribution system should facilitate a reliable and economically viable power supply while improving overall power quality [1].
A critical aspect of distribution network development is ensuring high reliability, as power supply interruptions can lead to significant economic and operational challenges. Proper assessment of reliability indicators plays a key role in network planning, allowing for the identification of system vulnerabilities and guiding investment decisions aimed at reducing outages. In power distribution, reliability refers to a system’s ability to consistently deliver electricity under predefined conditions over a given period without interruptions to consumers [2].
However, maintaining a high level of reliability is particularly challenging in semi-urban and rural areas. Limited financial resources, aging infrastructure, and network design constraints often slow down improvements in system performance. While smart grid technologies are widely deployed in developed networks, in many regions where power systems are still developing and in the early stages of modernization, improving basic infrastructure in semi-urban and rural networks remains a prerequisite before large-scale automation and smart grid functionalities can be introduced.
The liberalization of the electricity market has heightened the urgency of reducing economic losses caused by power outages. These evolving demands, alongside regulatory changes in electricity supply, have shaped the framework for tariff structures that incorporate reliability-based pricing or impose financial penalties on distribution network operators failing to meet reliability standards. Prevailing regulatory models in various countries, including Spain and Finland, incentivize investments to improve system reliability, as reliability performance directly influences operators’ revenues [3]. Compensation for unsupplied electrical energy varies across countries, depending on their respective regulatory frameworks, laws, and distribution system regulations and practices [4,5]. In regions where such mechanisms exist, distribution system operators (DSOs) are responsible for compensating consumers when unsupplied energy results from faults in the distribution network, power outages, or insufficient equipment maintenance. It is also important to note that many countries do not explicitly regulate the price of unsupplied electrical energy. Instead, it is negotiated individually between consumers and suppliers upon request. From the perspective of DSOs, improving reliability is crucial, as it enhances consumer trust and reputation, reduces compensation costs, and strengthens competitiveness in the market.
The electric system reliability metrics defined in [2] identify four key indicators for evaluating electric system reliability: System Average Interruption Duration Index (SAIDI), System Average Interruption Frequency Index (SAIFI), Customer Average Interruption Duration Index (CAIDI), and Momentary Average Interruption Frequency Index (MAIFI). These metrics are widely recognized and used by electric utilities in the United States to measure and report system reliability. In European countries, SAIDI and SAIFI are the primary reliability indicators for performance assessment [4,5]. Their values vary significantly across different DSOs, and improving these indicators is one of their primary objectives.
According to the DSO Annual Business Report in Serbia, SAIDI and SAIFI are included among the non-financial performance indicators, where their annual values are compared to those from the previous year. However, rather than being used for regulatory adjustments or strategic planning, the results are merely accompanied by a statement indicating whether reliability has improved or worsened [6,7]. In neighboring countries, some regulatory methodologies set to take effect in 2026 will link SAIDI to the calculation of approved revenues for distribution system operators [8]. Other methodologies use SAIDI as a parameter for assessing investments in network maintenance and development [9].
SAIDI has been a fundamental reliability indicator for decades, widely applied in power system analysis to evaluate supply continuity and guide network improvements. Its application extends across various aspects of distribution system performance improvement, from assessing routine operational reliability to supporting long-term planning decisions. Over time, different methodologies have been developed to enhance SAIDI values, adapting to changes in system design, load dynamics, and the increasing integration of automation. SAIDI is frequently used as a key performance indicator in research analyzing various aspects of distribution network reliability. Recently, it has been applied in studies that examined the impact of renewable portfolio standards on grid reliability [10] and explored fault elimination techniques that do not require opening the faulty line [11]. Improvements in SAIDI values have also been observed in studies examining fault restoration times in substations, where the implementation of remote-controlled equipment significantly enhanced outage restoration processes [12]. Additionally, network operation analyses have identified several technical measures for SAIDI improvement, including upgrading communication infrastructure, accelerating fault isolation with fault detection, isolation, and restoration modules, optimizing switching point placement, increasing network redundancy, and strengthening resilience to external disturbances [13]. A method for assessing and improving the reliability of power distribution systems has been proposed in [14], where the evaluation process begins with a Monte Carlo simulation to determine system reliability based on SAIFI and SAIDI indices, followed by the development of a novel risk priority index. Primary substation failures can significantly increase SAIDI due to their widespread impact. In [15], a SAIDI-optimized service restoration algorithm for meshed MV grids has been proposed to address this issue. In [16], machine learning regression methods have been applied to predict SAIDI and SAIFI based on technical, financial, and customer data collected from Swedish DSOs between 2010 and 2021.
Energy Not Supplied (ENS) is one of the adequacy indices used in distribution system evaluation [4]. While SAIDI measures the duration of supply interruptions, ENS quantifies the total amount of lost electrical energy, providing a more comprehensive assessment of outage impact. ENS is often used alongside cost analyses to evaluate the economic consequences of unserved energy.
In recent reliability assessments, Expected Energy Not Supplied (EENS) has been used in studies analyzing the optimal placement of sectionalizers in medium-voltage (MV) distribution networks [17]. It has also been applied in developing a resilience indicator, Transmission Lines’ Contribution to Energy Not Supplied (TLENS), quantifying the impact of specific transmission line failures [18]. Moreover, ENS has been one of the key indicators in a study evaluating the effects of protection system performance and miscoordination in reliability assessment [19]. Further research has considered integrating distributed energy sources to improve reliability indicators, with ENS and Average Energy Not Supplied (AENS) included as key metrics [20]. Additionally, AENS has been used alongside other indicators to assess the impact of smart grid functionalities on system reliability [21].
Given its significance in reliability assessment, ENS has been widely used as a key indicator in studies focused on network optimization, distributed energy resource integration, and system reconfiguration. An approach proposed in [22] focuses on optimally placing micro-phasor measurement units (uPMUs) to improve distribution system reliability. It determines the optimal number and placement of uPMUs, with reliability evaluation based on SAIDI and ENS. The optimal allocation of photovoltaic (PV) and battery energy storage (BES) systems in distribution networks is proposed in [23]. The aim is to minimize energy losses and ENS under normal conditions while mitigating load interruptions during emergencies, considering practical constraints that include the associated costs of PV and BES. A study in [24] addresses distribution network reconfiguration (DNR) alongside the placement and sizing of distributed generators (DGs). Reliability improvement is a key objective achieved through ENS reduction for end-users. The reliability of rural distribution systems with integrated microgrids (MGs) has been analyzed in [25], considering different penetration levels of renewable and nonrenewable distributed generation and the rated energy storage power, with ENS serving as the key reliability indicator. Research in [26] examines the impact of control techniques on DG placement and sizing, considering technical, economic, and reliability factors. One aim was to minimize the ENS parameter and reduce the costs associated with the optimal installation of DG units. The integration of renewable energy sources into microgrids in the mining sector has been analyzed in [27], considering energy cost, emissions, and reliability. Reliability was assessed using the ENS indicator.
Several studies have addressed reliability improvement by focusing on cost minimization during problem-solving. The approach for determining the optimal number, type, and location of automation devices installed in the network and identifying the new locations of existing devices has been presented in [28]. The problem is addressed by minimizing the costs related to new devices or the relocation of existing ones to achieve the target values of reliability indices. The study in [29] focuses on selecting protective devices strategically distributed in distribution networks. The selection process is based on minimizing the total cost of reliability, considering the costs related to equipment installation and the expected customer interruption costs. The study also indirectly includes a constrained budget for reliability improvement, achieved by defining the available quantity of fuses and switches for installation. The paper in [30] proposes a multi-criteria decision-making approach for the optimal placement of switches and protective devices in distribution networks to generate possible solutions with varying investment and reliability levels. These solutions are evaluated based on the distribution operator’s preferences using a multiple-criteria decision-making strategy. A method for optimizing the placement of reclosers and sectionalizers while ensuring protection coordination is proposed in [31]. The approach minimizes ENS and quantifies the financial benefits for distribution companies resulting from reduced unserved energy. In [32], the proposed model determines the optimal allocation of manual switches, remote-controlled switches (RCSs), and field circuit breakers (FCBs) to minimize costs and EENS in the objective function while also considering the possibility of malfunctions in RCSs and FCBs.
While numerous studies have investigated strategies for improving reliability indicators, the economic feasibility of these improvements remains largely unaddressed. Some studies assess reliability improvements without considering the cost of implementation. In contrast, others focus on cost minimization [22,23,26,28,29,30,31,32] without accounting for limited financial resources, which is especially important for developing countries. In [33], the ENS indicator was minimized while considering the constraints of limited financial resources available for investment. The analyzed test networks assumed that consumption was exclusively residential. Strategies for ENS improvement were defined, and their selection was carried out to achieve the most significant possible reduction in ENS within the given financial constraints.
Studies [10,11,12,13,14,15,16,17,18,19,20,21,22,23,24,25,26,27,28,29,30,31,32,33] focus on optimizing reliability indicators, whereas other research has examined reliability from different perspectives, which are particularly applicable in advanced systems. These perspectives include the optimization of energy trading under uncertainty [34] and a resilience-oriented strategy for coordinating maintenance and reconfiguration to support post-failure recovery in integrated energy systems [35]. In [36], a coordinated model for multi-energy ship microgrids (MESMs) has been developed. This model introduces load-shedding and energy curtailment schemes to improve the reliability of the MESM. In [37], a P2P outage insurance mechanism has been proposed, facilitating effective risk sharing and fair cost allocation, indirectly enhancing system reliability. Additionally, many methodologies are tailored to developed power systems with advanced regulatory frameworks, leaving a gap in methodologies applicable to developing countries, where semi-urban and rural networks require substantial infrastructure upgrades before deploying advanced technologies on a larger scale.
In [5,12], the importance of tailoring strategies and investments to regional conditions for improving network reliability is emphasized. Serbia is a developing country with a semi-urban and rural distribution network that requires significant improvements in infrastructure, equipment, and reliability before advanced grid technologies can be implemented. It also lacks a regulatory framework for compensating consumers for unsupplied electrical energy. Motivated by these factors, this study proposes a methodology for enhancing network reliability, particularly applicable to distribution networks in developing countries. Building on previous research [33], this study expands the approach by proposing a probabilistic investment optimization methodology that accounts for financial constraints while improving reliability indicators in semi-urban and rural distribution networks serving diverse consumer types.
The main objective of this paper is to propose a methodology for enhancing reliability performance in semi-urban and rural distribution networks using Monte Carlo simulation (MCS) to account for uncertainties in input data, ensuring the selection of optimal investment options. While MCS has been widely used in reliability studies due to its ability to capture stochastic uncertainties [4,14,16], previous studies have primarily focused on reliability optimization without explicitly considering budget constraints. In contrast, this study incorporates a budget constraint and integrates MCS with Mixed-Integer Linear Programming (MILP) to obtain a more realistic solution and ensure cost-effective reliability improvements.
In this study, in comparison to [33], the reliability assessment includes not only the ENS indicator but also the analysis of SAIDI, thereby ensuring the practical application of the methodology, as SAIDI is a key indicator within the regulatory framework of most countries. Furthermore, a cost indicator has been introduced as the third minimized indicator compared to [33]. It represents an economic measure associated with supply interruptions, designed for practical use in developing countries. The uncertainties of reliability indices and consumer load were incorporated into the analysis using MCS. The semi-urban and rural test networks used for algorithm testing and verification included different consumer types. Compared to [33], this work expands by incorporating test networks with nodes that include industrial and commercial consumers in addition to residential ones. This aspect further reinforces the significance of the study, as the results confirm that the position of different consumer types within the network affects the decision-making process when determining the sequence of actions required to maximize reliability improvement.
For each analyzed network, predefined strategies and individual options for improving reliability indices were established, as well as the different levels of available investment funds. The strategies defined for each network included (1) installing new components, (2) replacing old components with new ones, and (3) upgrading both components and network functionality. The second strategy, which involves proactive replacement of components with an increased failure rate before they cause an outage, is not addressed in other works, particularly in [11,12,13,14,17,20,21,22,23,26,28,29,30,31,32]. An optimization algorithm was developed to address the problem formulated in this study. It is described in the paper, tested, and verified.
The key aspects of reliability improvement are listed below, and Table 1 provides a comparison with the relevant literature that examines these aspects. The aspects are categorized as follows:

Table 1.
Comparison of the proposed approach with previous literature.
- Reliability:
(R1) Assessment of the impact of different measures using reliability indicator(s);
(R2) Optimization of reliability indicators.
- Investments:
(I1) Explicit incorporation of financial constraints in the consideration of the limited financial resources available to the DSO for investment;
(I2) Minimization of investment in improvement measures, regardless of the DSO’s available limited financial resources.
- Strategies:
(S1) Strategy of installation of new components;
(S2) Strategy of replacement of old components with new ones;
(S3) Strategy of upgrading existing components.
- Input data:
(ID1) Consideration of different types of consumption
(ID2) Consideration of uncertainties.
The authors’ study extends prior research by presenting the following key contributions:
- Applying optimization of reliability indicators while considering limited investment funds, simultaneously incorporating strategies S1-S3 into the methodology, and taking into account ID1-ID2.
- A distinct contribution of the authors’ study is the consideration of I1 and the application of strategy S2 alongside other strategies.
- An advancement of this study compared to [33] is:
- (i)
- The reliability assessment is based on multiple indicators;
- (ii)
- Consideration of different types of consumption, which has proven important for investment decision-making;
- (iii)
- Accounting for uncertainties in input data to obtain a more realistic representation, as the calculations do not rely solely on fixed values.
- The methodology can be effectively applied in selecting investment options for both lower and higher available budgets.
The methodology’s effectiveness has been successfully demonstrated for different levels of DSO investment funds. In addition to selecting investment options for each considered funding level, the results demonstrate how each option individually contributes to improving the three observed indicators. This enables the implementation of a sequence that prioritizes options with a greater impact on reliability improvement. The proposed methodology provides a structured investment prioritization framework that helps distribution system operators make data-driven decisions on reliability improvements while optimizing their limited funds.
In the remainder of this paper, the theoretical framework is presented in Section 2, followed by a detailed formulation of the optimization problem in Section 3. Section 4 is dedicated to the description of medium-voltage distribution test networks, the overview of input data, specific investment options within strategies for each network, and associated costs. Section 5 presents the results and discussion, while Section 6 concludes the study.
2. Theoretical Framework
2.1. Reliability Indicators
This paper analyzes SAIDI and ENS, two widely used reliability indicators. SAIDI is a standardized metric applied globally, enabling comparisons between distribution systems. It aligns with regulatory requirements, as many countries use it as a reference for assessing the performance of distribution companies and often define annual improvement targets to ensure service reliability. SAIDI quantifies the average duration of power supply interruptions, indicated in minutes or hours per customer [2,4]:
where Ui represents the annual outage time for location i, Ni is the number of customers in location i, and NT is the total number of customers served.
ENS represents the total amount of energy not supplied to consumers due to supply interruptions, directly quantifying their impact. While SAIDI reflects the duration of interruptions, ENS quantifies the unserved energy, making it particularly relevant for assessing both the operational and, with certain extensions, the economic consequences of reliability issues. ENS calculates annual energy not supplied to customers in the considered network due to long supply interruptions [4]:
where Pai is the average load of a customer (in kW) connected to load point i.
In addition to SAIDI and ENS, this paper introduces and analyzes a cost indicator, an economic metric used to quantify the financial impact of power supply interruptions. Economic impact analysis has received significant attention in the literature, with various indicators used to quantify economic effects [4]. Moreover, many studies rely on variable outage cost data, which differ based on consumer type and interruption duration [4,37,38,39]. Additionally, some studies aim to provide highly accurate estimations of these costs [40,41], requiring extensive input data that are often difficult to obtain.
This paper performs a reliability assessment and an optimization of investment options that consider both higher and lower available financial resources. When the investment budget is limited, allocating significant time and resources to collecting input data is unjustified. Moreover, such data may not exist in developing countries, as compensation for supply interruptions is either not implemented or is determined through individual agreements between consumers and the DSO. In some cases, the price is typically negotiated individually with industrial and commercial consumers. Regardless of whether a country formally incorporates this aspect, it is preferable and wise to consider the economic effects. This paper proposes a simplified approach based on a fixed unit monetary value of unserved energy per consumer type, which is independent of interruption duration. This method is suitable for developing countries where detailed data on interruption costs by consumer type may not be available. It is also useful for planning small-scale investments while providing a reliable economic assessment.
The paper analyzes the value of the cost indicator (COST), which quantifies the economic impact of power supply interruptions by expressing the reliability of the distribution system in monetary terms:
where ci is the unit monetary value of unserved energy, reflecting the financial impact of supply interruptions per kilowatt-hour [EUR/kWh] of energy not supplied.
2.2. Uncertainty in Component Reliability Data
2.2.1. Component Failure Rate
A component’s failure rate varies over its operational lifespan, following three distinct periods: initial development, exploitation, and aging (Figure 1). In the early stage, latent defects from design, transportation, assembly, or installation may lead to failures. Once these issues are resolved, the failure rate stabilizes and remains approximately constant for a significant period. However, as the component ages, failures become more frequent, marking the onset of the final phase, where the failure rate progressively increases. The technical service life ends when the component is irreparable or when its maintenance and repair costs approach the expense of acquiring a replacement [42].
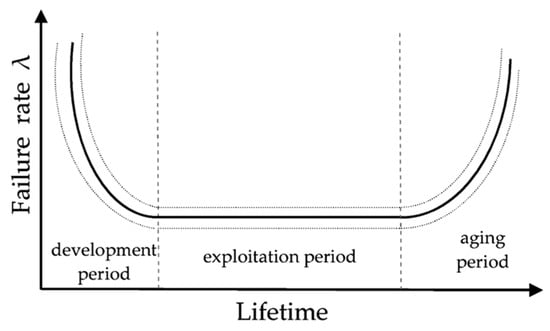
Figure 1.
Variation in failure rate over the component’s lifespan.
This study takes into account that certain components within the network have reached the aging period. Their age will be reflected in an increased failure rate, and potential network reliability improvements will be explored by assessing the feasibility of replacing these old components with new ones.
The Weibull distribution is widely used in reliability engineering and failure rate analysis due to its flexibility in modeling the failure characteristics of electrical power system components. The failure rate is generated as a Weibull-distributed random variate [4,42]. Considering the failure rate characteristic, typical shapes of the Weibull distribution can be observed in each lifetime period by adjusting the shape parameter (β): β < 1 models the development period, β = 1 models the exploitation period, and β > 1 models the aging period. In this study, β = 1 is used for components in the exploitation period, and β = 4 is used for components in the aging period [42]. The failure rate value will be varied within predefined ranges, depending on the life phase of each specific component, and this uncertainty will be incorporated into the MCS.
2.2.2. Component Repair Time
A component’s repair time represents the time required to restore a component to operational status after a failure. In 10 kV distribution networks, this parameter varies significantly depending on several factors, including the location’s accessibility, the type of component, the availability of spare parts and personnel, and the complexity of the repair. This study defined a specific range for each component, within which the repair time value was varied. Since repair time directly influences network reliability, incorporating it as a stochastic parameter in the MCS ensures a more accurate assessment of reliability indicators in the 10 kV distribution network.
2.3. Reliability Improvement Strategies for Analyzed Medium-Voltage Networks
Various strategies were explored in the analyzed MV semi-urban and rural distribution networks to enhance reliability performance while considering financial constraints. These strategies are categorized into three main groups:
- Installation of new components, which includes:
- Construction of new power lines to form semi-rings on single-fed lines;
- Installation of new reclosers (REC).
- Replacement of outdated components with new ones, ensuring that aging infrastructure does not compromise reliability.
- Upgrading both components and network operations, including:
- Replacement of overhead lines (OHLs) with underground cable lines (UCLs);
- Installation of remotely operated disconnectors (RODs) with fault indicators to enable faster fault detection and sectionalizing. This upgrade improves response time.
For each analyzed network, specific investment options and the necessary financial resources for their implementation were defined. By selecting the most effective measures from the defined options, investments would be directed toward maximizing improvements in reliability indicators, significantly enhancing the overall stability and efficiency of the distribution system.
3. Optimization Problem Formulation
3.1. Objective Function Terms
This study aims to minimize one of the reliability indicators defined in Equations (1)–(3) by optimally allocating limited investment funds among predefined improvement measures. Given that DSOs have financial constraints when planning investment strategies to enhance grid reliability, the optimization problem is formulated as follows:
where xi is a binary decision variable indicating whether the investment option i is selected (xi = 1) or not (xi = 0); SAIDIi, ENSi, and COSTi represent the reduction in SAIDI, ENS, and COST achieved by implementing investment option i; and S is the set of available investment options.
The objective is to minimize each of the Equations (4)–(6) separately, subject to the constraint:
where Ci is the cost of implementing investment option i, and Cmax is the maximum available investment budget.
Individual minimization of (4)–(6) allows the DSO to clearly understand the trade-offs between different reliability aspects and select the most suitable investment strategy based on specific priorities. Additionally, this method avoids potential biases that could arise from normalizing or weighting the objectives, ensuring a more objective evaluation of each reliability criterion.
This optimization problem belongs to the class of MILP problems, where all decision variables are binary, meaning they can take only the values 0 or 1. A variable set to 1 indicates that a given component has been replaced with a new one or that a new power line has been built. MILP has been widely used in reliability studies for distribution networks due to its ability to handle discrete decision-making and linear constraints effectively. In [11,15,32], the application of MILP in improving distribution network reliability demonstrates effectiveness in addressing complex reliability optimization problems.
3.2. The Algorithm
The reliability indicators (1)–(3) are calculated using a tree-based representation of the distribution system, establishing parent–child relationships between network sections. This allows for the precise identification of consumers affected by faults, as well as the sections located upstream and downstream of the fault location. To account for uncertainty in component reliability data (failure rate and repair time) and demand variability, an MCS is integrated into the optimization framework. This ensures a probabilistic assessment of investment decisions, reflecting real-world operating conditions.
Figure 2 shows the flow chart of the algorithm. Below is a step-by-step description of the enhanced probabilistic algorithm for selecting investment options that maximize reliability improvements, outlined as follows:
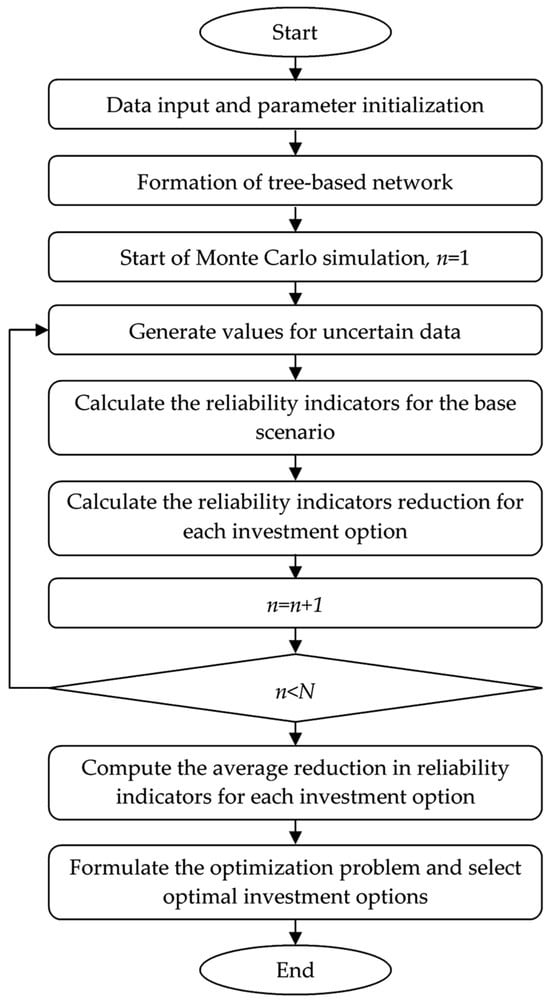
Figure 2.
The algorithm for selecting the optimal investment options.
- Step 1:
- Data input and parameter initialization.
- Load network topology and consumer data, including the number of customers, their loads, and prices for unserved energy.
- Incorporate uncertainty in component reliability data, defining probability distributions for failure rate and repair time.
- Incorporate demand uncertainty, defining probabilistic distributions for consumer load fluctuations over time.
- Define a set of potential investment options (e.g., component replacements, network reinforcements, automation upgrades) and their associated costs.
- Set MCS parameters—the number of iterations (N), which in this study is set to 2500.
- Step 2:
- Construct a tree-based network representation, establishing parent–child relationships between sections to facilitate fault impact assessment.
- Step 3:
- Initiate the MCS and set the iteration counter to 1.
- Step 4:
- Randomly generate values for failure rates, repair times, and consumer demand.
- Step 5:
- Calculate the reliability indicators (SAIDI, ENS, and COST) for the current MCS iteration for the baseline scenario.
- Step 6:
- Calculate the expected reduction in reliability indicators for each investment option relative to the baseline scenario.
- Step 7:
- Increase the iteration count by 1.
- Step 8:
- If the counter is less than or equal to the set number of iterations N, go to Step 4; otherwise, go to Step 9.
- Step 9:
- Compute the average reduction in reliability indicators across all Monte Carlo iterations to obtain an expected improvement for each investment option.
- Step 10:
- Formulate the optimization problem under the given total investment budget constraint. Select investment options that contribute the most to the reduction in reliability indicators.
- Step 11:
- Display the optimal set of investments and conclude the algorithm.
4. Model Description
4.1. Medium-Voltage Distribution Test Networks
The first analyzed network is an MV semi-urban distribution test network. The scheme of the studied part of this semi-urban system is presented in Figure 3. The model assumes that the supply points, the normally open circuit breaker (CB), and all transformers (TRs) in the 10 kV/0.4 kV transformer stations (TSs) are ideally reliable. The entire network consists of underground cable lines, with each section having an equal length of 0.3 km. The dashed lines indicate power lines that do not exist in the baseline scenario. A disconnector is positioned at both ends of every section. In total, the network includes 40 TSs. Figure 3 highlights the nodes with different consumption types: nodes with 100% commercial load, mixed nodes with both commercial and residential consumption, and industrial nodes. All other nodes in the network are classified as residential.
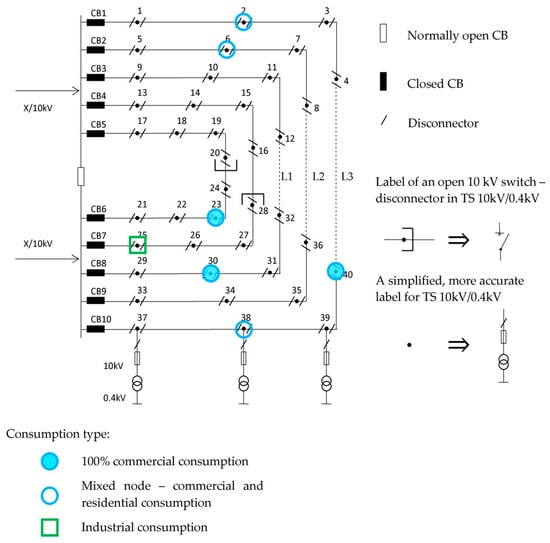
Figure 3.
MV semi-urban test network configuration.
The second analyzed network is an MV rural distribution test network. Consumer nodes, representing 10 kV/0.4 kV TSs, are marked with arrows. The network consists of 29 consumer nodes in total. All lines are overhead and numbered from 1 to 49, with their lengths provided in Figure 4. The dashed lines indicate power lines and automatic reclosers that do not exist in the baseline scenario. Figure 4 highlights the nodes with different consumption types, specifically marking nodes with 100% commercial consumption and mixed nodes with both commercial and residential consumption. All other nodes in the network are classified as residential.
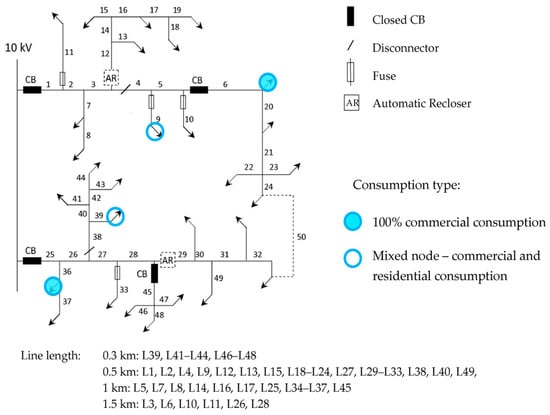
Figure 4.
MV rural test network configuration.
An overview of the consumer distribution in both the MV semi-urban and rural test networks, including consumption type, node locations, total load supplied by each TS 10 kV/0.4 kV, and the number of connected consumers, is presented in Table 2 and Table 3, respectively.
Table 2.
Consumer data in the semi-urban test network.
Table 3.
Consumer data in the rural test network.
4.2. Modeling Uncertainty in Component Data
In 10 kV distribution networks, load demand at consumer nodes is subject to variations due to fluctuations in consumption patterns. To account for this in the model, load values at consumer nodes are adjusted within predefined ranges for four consumer types. The variation ranges for the three considered consumer types in the analyzed test networks are presented in Table 4. In the table, Pind, Pcomm, and Pres correspond to the load demand of industrial, commercial, and residential consumers, respectively. The reference load values for each consumer type are provided in Table 2 and Table 3.
Table 4.
Load variation ranges for different consumer types.
Reliability indicators provided by the DSO are based on long-term statistical observations of multiple components of the same type. Since such data inherently includes a degree of uncertainty, this aspect is incorporated into the model by allowing reliability indicators to vary within defined limits. Table 5 presents the values of reliability indicators of components. The mean values of failure rate and repair time are sourced from Serbian DSO statistics. Based on these mean values, upper and lower limits were defined to establish the variation range of reliability indicators in the MCS. The table also includes the variation ranges for the failure rate of old components, which are set between two and five times the mean failure rate of the corresponding component. A list of old components with increased failure rates is provided in Table 6.
Table 5.
Values of reliability indicators of components.
Table 6.
Components that exhibit higher failure rates in semi-urban and rural networks.
The time required for fault localization and the reconnection of operational sections was set to 1 h. The same duration was applied to switching operations for semi-ring closure and supply restoration from an alternative source. In calculating the SAIDI, ENS, and COST for both networks, faults on all initially installed equipment, including lines, circuit breakers, disconnectors, fuses, and reclosers, were analyzed.
4.3. Investment Strategies and Associated Costs
To improve the reliability of the analyzed semi-urban and rural distribution networks, specific investment strategies were implemented to reduce SAIDI, ENS, and COST indicators. These strategies include the construction of additional power lines, the replacement of old components, and network upgrades through the installation of automated switching devices. The investment options and their estimated costs, based on average market prices in Serbia, are provided in Table 7.
Table 7.
Investment options and associated costs.
Investment strategies for the semi-urban network:
- Construction of new power lines to form semi-rings at critical points in the network, specifically between nodes 12–32 (L1), 8–36 (L2), and 4–40 (L3), ensuring alternative supply paths. It was assumed that new lines are ideally reliable after installation.
- Replacement of old components listed in Table 6.
- Installation of remotely operated disconnectors (RODs) with fault indicators in all TSs on Feeder 3 and Feeder 7 to enable faster fault isolation.
Investment strategies for the rural network:
- Formation of a semi-ring by constructing a new power line between the endpoints of lines 24 and 32 (L50) and installing a recloser at the beginning of line L29.
- Replacement of old components listed in Table 6.
- Replacement of overhead lines with underground cable lines for L1, L2, L3, L25, L26, and L27 to improve reliability.
- Installation of a recloser at the beginning of line L12 to enhance switching operations.
Based on the assumption that in many energy markets, particularly in developing countries, there is no explicit regulation defining the cost of unsupplied electrical energy, leaving it to be determined through agreements between customers and suppliers, fixed unit monetary values of unserved energy are adopted: 30 EUR/kWh for industrial consumers, 15 EUR/kWh for commercial consumers, and 2 EUR/kWh for residential consumers. For practical implementation, the determination of fixed values is left to the respective DSO, which can define them based on the specific network segment being assessed for reliability and the values agreed upon with consumers in that area.
5. Simulation Results and Discussion
The minimization of SAIDI, ENS, and COST indicators was carried out for scenarios considering the maximum available investment funds, as presented in Table 8.
Table 8.
Maximum available investment funds.
This section is organized as follows: Section 5.1 and Section 5.2 present the simulation results and their discussion for the semi-urban network, respectively, while Section 5.3 and Section 5.4 present the simulation results and their discussion for the rural network, respectively. Section 5.5 addresses the study limitations and future research.
5.1. Simulation Results for the Semi-Urban Network
The reduction in SAIDI, ENS, and COST indicators due to implementing the considered options is shown in Figure 5 and Figure 6 for the semi-urban network. Two figures are provided to represent different value ranges of the indicators. Based on the obtained results (Figure 5 and Figure 6), the following list presents the reduction in the SAIDI and ENS indicators, sorted in descending order from the highest to the lowest reduction, for the considered options in the semi-urban network:
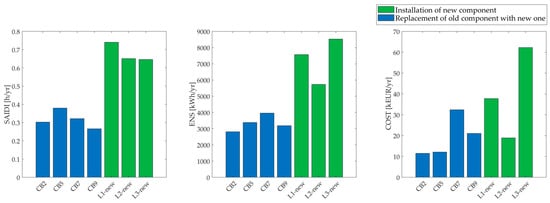
Figure 5.
Reduction in the reliability indicators for the considered options in the semi-urban network—Part 1.
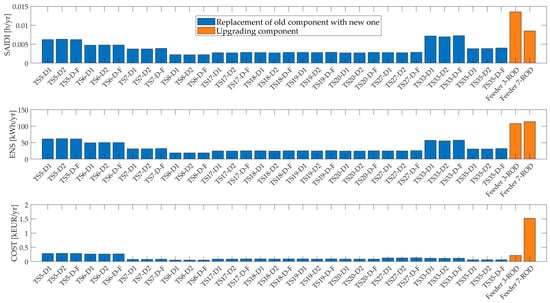
Figure 6.
Reduction in the reliability indicators for the considered options in the semi-urban network—Part 2.
- Construction of new lines L1, L2, and L3;
- Replacement of old CBs;
- Installation of remotely operated disconnectors with fault indicators; and
- Replacement of old disconnectors and fuses.
This sequence also applies to the reduction order of the COST indicator, although some individual options within items 1 and 2 of the previous list do not strictly follow this order. In the case of the COST indicator, the impact of the location of commercial and industrial consumers within the network is more pronounced, leading to a preference for improvement strategies applied to their feeders. This is most noticeable in the greater reduction in the COST indicator when replacing CB7 at the beginning of Feeder 7.
Table 9, Table 10 and Table 11 display the selection of investment options for minimizing SAIDI, ENS, and COST in the semi-urban network, respectively. The results are presented for all four analyzed maximum available funds. Each of these tables, in addition to the selected investment options, also presents the available and allocated funds. The values of SAIDI, ENS, and COST indicators for the baseline scenario and after applying minimization are presented in Table 12 for the semi-urban network.
Table 9.
Selected investment options for SAIDI minimization for the semi-urban network model.
Table 10.
Selected investment options for ENS minimization for the semi-urban network model.
Table 11.
Selected investment options for COST minimization for the semi-urban network model.
Table 12.
Reliability assessment results for the semi-urban network model.
The ratio of the benefits of improving the reliability indicator COST (ΔCOST) to the invested DSO funds for the considered options is calculated for each considered investment option:
where ΔCOSTi is the improvement of the COST indicator for option i, and Cinvop_i is the investment option cost (Table 7).
By calculating Ratioi (8), a value is obtained that indicates the annual reduction in economic losses for each unit of money invested in the considered option i. Table 13 shows the values of Ratio for the components in the semi-urban network. For all components not listed in the table, the obtained values are less than 0.15 [1/yr]. The highest values of the Ratio are associated with replacing circuit breakers CB2–CB9 at the beginning of the feeders. Among these, circuit breaker CB7, located at the beginning of the feeder supplying the industrial consumer, has the highest value.
Table 13.
Value of Ratio for the semi-urban network options.
5.2. Discussion of Results for the Semi-Urban Network
The results show that the proposed methodology successfully selected investment options for different levels of DSO investment funds (Table 9, Table 10 and Table 11). In addition to selecting investment options for each considered funding level, the results demonstrate how each option individually improves the three observed indicators (Figure 5 and Figure 6). Based on the reduction in the indicators, sorted from the highest to the lowest reduction, a sequence of option implementation can be applied. This sequence can prioritize options with a more significant impact on reliability improvement, ensuring that investments are directed toward the most effective strategies first.
The analysis demonstrates that forming semi-rings through the construction of new lines has the most significant effect on reducing reliability indicators (SAIDI, ENS, and COST). Given the financial constraints, these options will be considered first if they fit within the available investment resources. Establishing semi-rings enables dual-sided supply, effectively minimizing outage duration for customers connected to the affected feeders.
Calculations show that replacing old circuit breakers at the feeder’s starting point, particularly those on feeders forming part of the semi-ring (CB5 and CB7), results in the next most significant improvement in the SAIDI and ENS indicators. However, when minimizing the COST indicator, priority is given to circuit breakers CB7 and CB9, which are located on the 10 kV busbar section supplying feeders with a higher concentration of industrial and commercial consumers.
The third most significant reduction in the analyzed indicators is achieved by installing remotely operated disconnectors with fault indicators. These devices allow for faster fault localization and network reconfiguration, significantly shortening the time needed to isolate the affected section. As a result, improved fault detection and isolation lead to a considerable decrease in interruption duration for end users. However, due to their higher implementation costs, the algorithm did not prioritize these investments when optimizing for SAIDI and ENS. Instead, allocating the budget to multiple lower-cost solutions resulted in a greater overall reduction in these indicators. When considering the COST indicator, the installation of RODs on the feeder leads to a more noticeable improvement in the indicator. As a result, in the case of the highest analyzed investment of EUR 250,000 (Table 11), the installation of RODs on Feeder 7, which supplies an industrial consumer, was selected as one of the implementation choices.
The replacement of old disconnectors and fuses results in the smallest improvement in the analyzed indicators when considering all defined investment strategies. However, from the perspective of smaller investment planning, it is crucial to identify the transformer stations where replacing outdated equipment will lead to the most noticeable enhancement of reliability indicators.
For the semi-urban network, Figure 7 presents the graphical results of the calculations assuming a maximum available budget of EUR 200,000. The figure shows that, when replacing old equipment listed in Table 6, all three indicators select the replacement of old circuit breakers, as well as the replacement of disconnectors in the line bays (D1 and D2) of the first substation, TS5, as optimal options. Furthermore, the selected options for SAIDI and ENS include the replacement of disconnectors in the line bays (D1 and D2) of the first substation TS33, located at the beginning of Feeder 9, while COST indicator prioritizes the replacement of disconnectors in the line bay of TS6, which supplies both residential and commercial consumers.
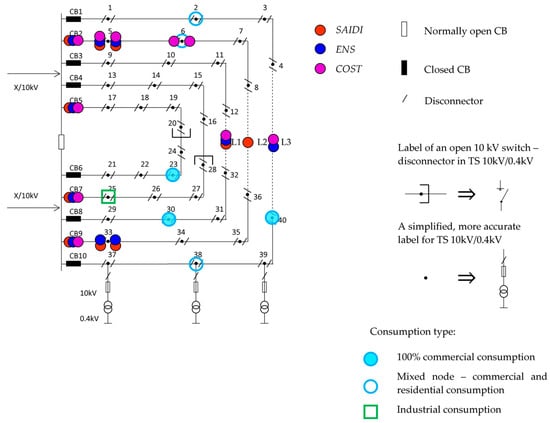
Figure 7.
Applied investment options for the semi-urban network with a maximum budget of EUR 200,000.
5.3. Simulation Results for the Rural Network
For the rural network, the reduction in SAIDI, ENS, and COST indicators resulting from the implementation of the considered options is shown in Figure 8 and Figure 9. The results obtained for the rural network indicate that the reduction sequence for SAIDI, ENS, and COST follows a similar pattern. The corresponding list, sorted in descending order from the highest to the lowest reduction, is provided below:
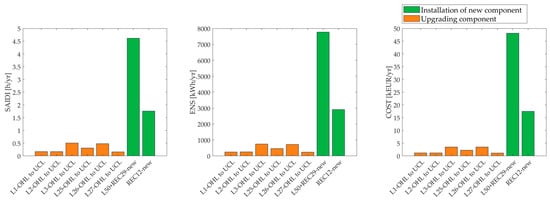
Figure 8.
Reduction in the reliability indicators for the considered options in the rural network—Part 1.
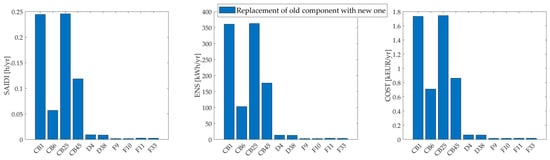
Figure 9.
Reduction in the reliability indicators for the considered options in the rural network—Part 2.
- Simultaneous construction of a new line and the installation of the recloser REC29;
- Installation of the new recloser REC12;
- Replacement of OHLs with UCLs;
- Replacement of old CBs, with a greater effect when the CB is located at the beginning of the feeder; and
- Replacement of old disconnectors and fuses.
The selected investment options for minimizing SAIDI, ENS, and COST are the same for all three indicators and are presented in Table 14. In addition to the selected investment options, Table 14 also includes the available and allocated funds. The values of the indicators for the baseline scenario and after minimization are provided in Table 15 for the rural network.
Table 14.
Selected investment options for SAIDI, ENS, and COST minimization for the rural network model.
Table 15.
Reliability assessment results for the rural network model.
For the components in the rural network, the values of Ratio (8) are shown in Table 16, indicating the annual reduction in economic losses per unit of money invested in the considered option. The highest values are obtained for the installation of a new recloser REC12, followed by the simultaneous construction of a new line L50 and installation of a recloser REC29, which has a lower value compared to REC12 due to the significant financial resources required for the construction of the new line. Furthermore, the circuit breakers CB1 and CB25 at the beginning of the feeders have the next highest values. For all components not listed in the table, the obtained values are less than 0.05 [1/yr].
Table 16.
Value of Ratio for the rural network options.
5.4. Discussion of Results for the Rural Network
The results show that the proposed methodology successfully selected investment options for different levels of DSO investment funds (Table 15). The priority list, sorted by indicator reduction from the highest to the lowest, is provided in Section 5.3. This ordering allows for strategic investment planning, ensuring that the most impactful options for reliability improvement are addressed first.
The greatest reduction in the analyzed indicators (SAIDI, ENS, and COST) for the rural network is achieved by the simultaneous construction of a new line and the installation of recloser REC29. This measure forms a semi-ring, improving supply flexibility and reducing interruption duration by enabling an alternative supply path. Given its impact, this option is prioritized when investment resources allow. A further reduction is achieved by installing recloser REC12, which enhances network segmentation and speeds up fault isolation. Replacing overhead lines with underground cables improves reliability due to lower failure rates. As indicated by the results, replacing overhead lines with underground cables was not selected due to higher installation costs. However, it should be noted that although underground cables require a higher initial investment, their lower maintenance costs can lead to long-term savings by reducing overall expenditures. The next indicator reduction is achieved by replacing old circuit breakers with new ones, with the greatest effect when the circuit breaker is positioned at the beginning of the feeder. Finally, replacing old disconnectors and fuses provides the smallest impact among the analyzed options.
For the rural network, Figure 10 presents the graphical results of the calculations assuming a maximum available budget of EUR 50,000. The explanation of the symbols in Figure 10 corresponds to the explanation provided for Figure 4.
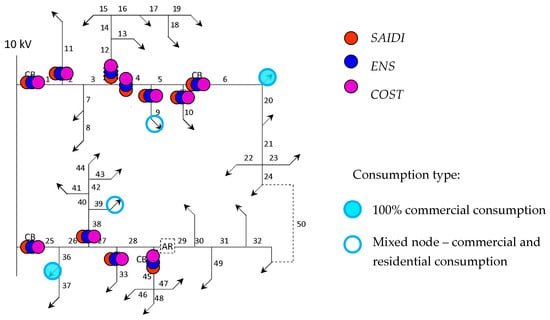
Figure 10.
Applied investment options for the rural network with a maximum budget of EUR 50,000.
5.5. Study Limitations and Future Research
The proposed methodology performs independent minimization of the selected indicators. This approach allows the DSO to prioritize a specific indicator based on its needs and the availability of relevant data. However, using the cost indicator is a practical challenge when applying this methodology. In some cases, the DSO may lack data on the unit monetary value of unserved energy (ci), as compensation for supply interruptions is not implemented within the regulatory framework.
The cost indicator, applied with a fixed unit monetary value of unserved energy per consumer type, independent of interruption duration, is intended for use in developing countries where detailed data on interruption costs by consumer type may not be available. While the proposed methodology is based on a fixed ci, making it less applicable to advanced networks with compensation schemes that account for interruption duration, this limitation can be addressed by extending the algorithm.
For more complex systems, future research could focus on optimizing a composite objective function that accounts for the sum of all three indicators, normalized relative to their baseline values. This approach could be refined by introducing weighting factors to adjust the influence of each normalized indicator. Furthermore, a methodology could be developed to help the DSO manage these weighting factors.
Given the rapid expansion of prosumer integration in recent years, particularly in developing countries, future research could focus on reliability assessment that accounts for the presence of prosumers in the distribution network. Additionally, the influence of energy storage systems on reliability could be further examined. A potential research direction is the integration of machine learning with a Monte Carlo simulation to improve reliability assessment by enabling more efficient analysis of prosumer-driven uncertainties in distribution networks.
6. Conclusions
This paper presents a methodology for selecting optimal investment strategies in semi-urban and rural distribution networks while considering financial constraints. The proposed approach incorporates a Monte Carlo simulation to account for uncertainties in reliability indices and consumer load, ensuring a more realistic assessment of investment effectiveness. The approach focuses on minimizing SAIDI and ENS, as well as the COST indicator, which quantifies reliability in monetary terms, ensuring that available resources are directed toward the most effective improvements.
The methodology was applied to networks with industrial, commercial, and residential consumers, considering their varying impact on reliability indicators. The results highlight the importance of a structured investment prioritization process, demonstrating how different consumer types influence the selection of reliability enhancement measures. The methodology ensures that financial resources, regardless of their amount, are allocated to maximize improvements in reliability indicators.
The proposed methodology is particularly suited for developing countries, where financial limitations often constrain investment planning. Structuring the selection of reliability improvement measures enables efficient allocation of available funds, ensuring that investments are directed toward the most effective strategies.
The developed algorithm can be applied to more complex networks. It can also be extended to include additional reliability indicators. In cases where the application of economic reliability indicators requires the use of variable pricing, an algorithm upgrade can be easily implemented to incorporate varying unit monetary values of unserved energy based on interruption duration, further refining the economic evaluation of investment strategies. Future research could focus on upgrading the objective function to integrate multiple normalized indicators, incorporating weighting factors and providing a framework for DSOs to adjust them based on operational needs. Additionally, future studies could explore reliability assessments that account for the presence of prosumers and energy storage systems.
Author Contributions
Conceptualization, J.K. and J.S.T.; methodology, J.K. and J.S.T.; software, J.K. and J.S.T.; validation, J.K. and J.S.T.; formal analysis, J.K. and J.S.T.; investigation, J.K. and J.S.T.; resources, J.K. and J.S.T.; data curation, J.K. and J.S.T.; writing—original draft preparation, J.K.; writing—review and editing, J.K. and J.S.T.; visualization, J.K. and J.S.T.; supervision, J.K. and J.S.T.; project administration, J.K. and J.S.T.; funding acquisition, J.K. and J.S.T. All authors have read and agreed to the published version of the manuscript.
Funding
The authors would like to thank the European Union’s HORIZON WIDERA-2021-ACCESS-03 project SUNRISE, under grant agreement No. 101079200, for its financial support of this research, and the APC was supported by the same project. Also, this work was financially supported by the Ministry of Science, Technological Development and Innovation of the Republic of Serbia under contract number: 451-03-137/2025-03/200103.
Institutional Review Board Statement
Not applicable.
Informed Consent Statement
Not applicable.
Data Availability Statement
The data presented in this study are available on request from the corresponding authors.
Acknowledgments
The authors would like to thank the European Union’s HORIZON WIDERA-2021-ACCESS-03 project SUNRISE, under grant agreement No. 101079200, for its financial support of this research. Also, this work was financially supported by the Ministry of Science, Technological Development and Innovation of the Republic of Serbia under contract number: 451-03-137/2025-03/200103.
Conflicts of Interest
The authors declare no conflicts of interest.
References
- EPS Distribucija. Rules on the Operation of the Electricity Distribution System of the Distribution System Operator; EPS Distribucija d.o.o.: Belgrade, Serbia, 2017. [Google Scholar]
- IEEE Guide for Electric Power Distribution Reliability Indices; IEEE 1366-2022; IEEE: New York, NY, USA, 2022.
- Royal Decree 1048/2013. Methodology for the Calculation of the Remuneration of the Electric Power Distribution Activity; Spanish Ministry of Industry, Energy and Tourism: Madrid, Spain, 2013. [Google Scholar]
- Billinton, R.; Li, W. Reliability Assessment of Electric Power Systems Using Monte Carlo Methods; Springer Science+Business Media: Berlin/Heidelberg, Germany; Plenum Press: New York, NY, USA, 1994. [Google Scholar]
- Prettico, G.; Marinopoulos, A.; Vitiello, S. Guiding electricity distribution system investments to improve service quality: A European study. Util. Policy 2022, 77, 101381. [Google Scholar] [CrossRef]
- Elektrodistribucija Srbije. DSO Annual Business Report for the Year 2022; Elektrodistribucija Srbije d.o.o.: Belgrade, Serbia, 2023. [Google Scholar]
- Elektrodistribucija Srbije. DSO Annual Business Report for the Year 2023; Elektrodistribucija Srbije d.o.o.: Belgrade, Serbia, 2024. [Google Scholar]
- Kovačević, K.; Ognjenović, U. Assessment of the impact of system reliability indices on regulatory approved revenue. In Proceedings of the 14th Conference on Electricity Distribution with Regional Participation, CIRED Serbia, Kopaonik, Serbia, 16–20 September 2024; pp. 1–7. [Google Scholar] [CrossRef]
- Elektro Celje. Annual Report of Elektro Celje for 2022; Elektro Celje d.d.: Celje, Slovenia, 2023. [Google Scholar]
- Singh, S.B.; Alsabhan, T.H.; Alshagri, R. Evaluating the Policy Implications of Renewable Portfolio Standards on Grid Reliability in the United States: An Instrumental Variable Quantile Analysis. Energies 2024, 17, 6065. [Google Scholar] [CrossRef]
- Gonzalez, M. Improvement of SAIDI and SAIFI reliability indices using a shunt circuit-breaker in ungrounded MV networks. In Proceedings of the 22nd International Conference and Exhibition on Electricity Distribution, CIRED 2013, Stockholm, Sweden, 10–13 June 2013. [Google Scholar] [CrossRef]
- Sánchez-Ixta, C.; Vázquez-Abarca, J.R.; López-Sosa, L.B.; Golpour, I. Analysis of the Restoration of Distribution Substations: A Case Study of the Central–Western Division of Mexico. Energies 2024, 17, 4154. [Google Scholar] [CrossRef]
- Janiszewski, P.; Sawicki, J.; Kurpas, J.; Mróz, M. Practical ways to improve SAIDI and SAIFI power supply reliability indicators in an MV grid. Acta Energ. 2018, 1, 45–50. [Google Scholar]
- Dechgummarn, Y.; Fuangfoo, P.; Kampeerawat, W. Reliability assessment and improvement of electrical distribution systems by using multinomial Monte Carlo simulations and a component risk priority index. IEEE Access 2022, 10, 111923–111935. [Google Scholar] [CrossRef]
- Sperr, F.; Stai, E.; Venkatraman, A.; Krause, T.; Hug, G. Service restoration in the medium voltage grid minimizing the SAIDI contribution after primary substation failures. IEEE Trans. Power Syst. 2024, 39, 66–82. [Google Scholar] [CrossRef]
- Weiss, X.; Hilber, P.; Žarković, S.D.; Nordström, L. Predicting distribution reliability indices based on exogenous data. In Proceedings of the 2024 IEEE PES Innovative Smart Grid Technologies Europe (ISGT Europe), Dubrovnik, Croatia, 14–17 October 2024; pp. 1–6. [Google Scholar] [CrossRef]
- Qawaqzeh, M.; Al Issa, H.A.; Buinyi, R.; Bezruchko, V.; Dikhtyaruk, I.; Miroshnyk, O.; Nitsenko, V. The assess reduction of the expected energy not-supplied to consumers in medium voltage distribution systems after installing a sectionalizer in optimal place. Sustain. Energy Grids Netw. 2023, 34, 101035. [Google Scholar] [CrossRef]
- Chivunga, J.N.; Longatt, F.G.; Lin, Z.; Blanchard, R. Transmission line redundancy for grid resilience enhancement: The concept of Transmission Lines contributing to Energy Not Supplied (TLENS) on Malawi’s transmission grid. Energy Rep. 2024, 12, 4670–4685. [Google Scholar] [CrossRef]
- Todorović, M.; Krstivojević, J. New approach in distribution system reliability analysis considering protection system miscoordination. In Proceedings of the 2023 IEEE Belgrade PowerTech, Belgrade, Serbia, 25–29 June 2023; pp. 1–6. [Google Scholar] [CrossRef]
- Makandar, M.; Atla, C.S.R.; Velamuri, S. Reliability assessment of distribution system with renewable Distributed Generation. In Proceedings of the 2016 Biennial International Conference on Power and Energy Systems: Towards Sustainable Energy (PESTSE), Bengaluru, India, 21–23 January 2016; pp. 1–5. [Google Scholar] [CrossRef]
- Wu, M.Y.; Ridzuan, M.I.; Djokic, S.Z. Smart grid functionalities for improving reliability of rural electricity networks. In Proceedings of the Mediterranean Conference on Power Generation, Transmission, Distribution and Energy Conversion (MedPower 2016), Belgrade, Serbia, 6–9 November 2016; pp. 1–7. [Google Scholar] [CrossRef]
- Agudo, M.P.; Franco, J.F.; Tenesaca-Caldas, M.; Zambrano-Asanza, S.; Leite, J.B. Optimal placement of uPMUs to improve the reliability of distribution systems through genetic algorithm and variable neighborhood search. Electr. Power Syst. Res. 2024, 236, 110910. [Google Scholar] [CrossRef]
- Ettehad, M.T.; Chabanloo, R.M.; Ameli, M.T. Improving power distribution resilience through optimal PV and BES allocation with a cost-based optimization framework for normal and emergency conditions. IEEE Access 2025, 13, 36436–36450. [Google Scholar] [CrossRef]
- Raza, A.; Zahid, M.; Chen, J.; Qaisar, S.M.; Ilahi, T.; Waqar, A. A novel integration technique for optimal location & sizing of DG units with reconfiguration in radial distribution networks considering reliability. IEEE Access 2023, 11, 123610–123624. [Google Scholar] [CrossRef]
- López-Prado, J.L.; González-Sánchez, J.W.; Vélez, J.I.; Garcia-Llinás, G.A. Reliability assessment in rural distribution systems with microgrids: A computational-based approach. IEEE Access 2022, 10, 43327–43340. [Google Scholar] [CrossRef]
- Soni, Y.P.; Fernandez, E. A novel approach for techno-economic reliability-oriented planning and assessment of droop-control technique for DG allocation in islanded power distribution systems. Electr. Power Syst. Res. 2024, 234, 110601. [Google Scholar] [CrossRef]
- Islam, S.M.M.; Ranjbar, H.; Pourmousavi, S.A.; Soong, W.L. Sustainable and cost-effective microgrid sizing methodology for mining operations considering reliability and energy not-served. In Proceedings of the 2024 IEEE PES Innovative Smart Grid Technologies Europe (ISGT Europe), Dubrovnik, Croatia, 14–17 October 2024; pp. 1–6. [Google Scholar] [CrossRef]
- Popović, Ž.; Brbaklić, B.; Knežević, S. A mixed integer linear programming-based approach for optimal placement of different types of automation devices in distribution networks. Electr. Power Syst. Res. 2017, 148, 136–146. [Google Scholar] [CrossRef]
- Heidari, A.; Dong, Z.Y.; Zhang, D.; Siano, P.; Aghaei, J. Mixed-integer nonlinear programming formulation for distribution networks reliability optimization. IEEE Trans. Ind. Informat. 2018, 14, 1952–1961. [Google Scholar] [CrossRef]
- Costa, M.M.; Bessani, M.; Batista, L.S. A multiobjective and multicriteria approach for optimal placement of protective devices and switches in distribution networks. IEEE Trans. Power Deliv. 2022, 37, 2978–2985. [Google Scholar] [CrossRef]
- Safari, M.; Haghifam, M.-R.; Zangiabadi, M. A hybrid method for recloser and sectionalizer placement in distribution networks considering protection coordination, fault type, and equipment malfunction. IET Gener. Transm. Distrib. 2021, 15, 2176–2190. [Google Scholar] [CrossRef]
- Jooshaki, M.; Karimi-Arpanahi, S.; Millar, R.J.; Lehtonen, M.; Fotuhi-Firuzabad, M. On the MILP modeling of remote-controlled switch and field circuit breaker malfunctions in distribution system switch placement. IEEE Access 2023, 11, 40905–40915. [Google Scholar] [CrossRef]
- Krstivojević, J.; Stojković Terzić, J. Improvement of reliability performance in distribution network by optimal investment selection. In Proceedings of the 14th Mediterranean Conference on Power Generation, Transmission, Distribution and Energy Conversion (MedPower 2024), Athens, Greece, 3–6 November 2024; pp. 1–6. [Google Scholar]
- Zou, Y.; Xu, Y.; Li, J. Aggregator-network coordinated peer-to-peer multi-energy trading via adaptive robust stochastic optimization. IEEE Trans. Power Syst. 2024, 39, 7124–7137. [Google Scholar] [CrossRef]
- Wang, K.; Xue, Y.; Shahidehpour, M.; Chang, X.; Li, Z.; Zhou, Y. Resilience-oriented two-stage restoration considering coordinated maintenance and reconfiguration in integrated power distribution and heating systems. IEEE Trans. Sustain. Energy 2025, 16, 124–137. [Google Scholar] [CrossRef]
- Fei, Z.; Yang, H.; Du, L.; Guerrero, J.M.; Meng, K.; Li, Z. Two-stage coordinated operation of a green multi-energy ship microgrid with underwater radiated noise by distributed stochastic approach. IEEE Trans. Smart Grid 2025, 16, 1062–1074. [Google Scholar] [CrossRef]
- Wang, H.; Yang, J.; Li, G.; Wu, F.; Lin, Y.; Liao, F.; Jia, L. Outage risk management for residential users considering distribution network reliability assessment: A P2P outage insurance approach. Electr. Power Syst. Res. 2025, 245, 111590. [Google Scholar] [CrossRef]
- Dzobo, O.; Gaunt, C.; Herman, R. Investigating the use of probability distribution functions in reliability-worth analysis of electric power systems. Int. J. Electr. Power Energy Syst. 2012, 37, 110–116. [Google Scholar] [CrossRef]
- Majid, S.N.A.A.; Salim, N.A.; Mohamad, H.; Yasin, Z.M. Assessment of Expected Customer Interruption Cost Due to Power System Contingency by Sensitivity Analysis. In Proceedings of the 2020 IEEE International Conference on Power and Energy (PECon), Penang, Malaysia, 7–8 December 2020; pp. 171–175. [Google Scholar] [CrossRef]
- Huda, A.S.N.; Živanović, R. An efficient method with tunable accuracy for estimating expected interruption cost of distribution systems. Int. J. Electr. Power Energy Syst. 2019, 105, 98–109. [Google Scholar] [CrossRef]
- Bhattarai, S.; Karki, R. Interruption cost estimation for value-based reliability investment in emerging smart grid resources. Appl. Sci. 2024, 14, 8651. [Google Scholar] [CrossRef]
- Billinton, R.; Allan, R.N. Reliability Evaluation of Engineering Systems: Concepts and Techniques, 2nd ed.; Springer Science+Business Media, LLC.: Berlin/Heidelberg, Germany, 1992. [Google Scholar]
Disclaimer/Publisher’s Note: The statements, opinions and data contained in all publications are solely those of the individual author(s) and contributor(s) and not of MDPI and/or the editor(s). MDPI and/or the editor(s) disclaim responsibility for any injury to people or property resulting from any ideas, methods, instructions or products referred to in the content. |
© 2025 by the authors. Licensee MDPI, Basel, Switzerland. This article is an open access article distributed under the terms and conditions of the Creative Commons Attribution (CC BY) license (https://creativecommons.org/licenses/by/4.0/).