Abstract
Macroalgae are rich in bioactive compounds with potential therapeutic applications, including antioxidant, antimicrobial, and nutritional properties. In this study, the biochemical composition of three seaweed species—Ulva sp., Gracilaria multipartita, and Sargassum muticum—was analysed, focusing on their mineral content and macronutrient profile. The ash, protein, fibre, lipid, and carbohydrate contents ranged from (dw) 26.56 to 33.53 g/100 g, 10.13 to 18.43 g/100 g, 0.11 to 0.19 g/100 g, 5.83 to 10.88 g/100 g, and 42.48 to 53.27 g/100 g, respectively. The findings indicate that the species studied are excellent sources of essential minerals, particularly magnesium, potassium, calcium, sodium, and trace elements, such as iron, zinc, copper, and manganese. Sargassum muticum exhibited the highest mineral content and thus holds significant promise for further exploration in biomedical and therapeutic contexts. FTIR, FT-RAMAN, and FT-NIR analysis highlight the presence of proteins, lipids, carbohydrates, including cell wall phycocolloids, and phenolic compounds. These results underscore the potential of macroalgae as natural sources of bioactive compounds for health-related applications, highlighting their value beyond traditional dietary supplementation.
1. Introduction
The oceans are a crucial source of oxygen for the planet, primarily due to the presence of cyanobacteria, microalgae, and seaweeds. Through photosynthesis, these organisms play a vital role in the global oxygen cycle and are responsible for approximately 50 per cent of the Earth’s oxygen production, a figure that highlights their importance in maintaining the balance of atmospheric gases. Seaweeds are macroscopic marine algae that mainly inhabit coastal habitats, from the intertidal zone to depths of 250 m [1]. They are primary producers and complex multicellular organisms, which exhibit a relatively simple structure compared to terrestrial plants [2]. Seaweeds belong to two different kingdoms, namely, Archaeplastida (green and red algae) and Stramenopila (brown algae). Based on their dominant colour, green, red, or brown, they are grouped into three taxonomic groups, Chlorophyta (class Ulvophyceae), Rhodophyta, and Ochrophyta (class Phaeophyceae), respectively [3,4].
Seaweeds are well-known for their high nutritional value [5], the carbohydrate, protein, lipid, and ash content of which varies between approximately 33 and 75%, 10 and 15%, 1.5 and 4%, and 3 and 47% respectively, while the dry weight varies between 10 and 20% [5,6]. However, their chemical composition can vary depending on the species, life cycle phase, geographical, area and environmental conditions [7], such as the concentration of dissolved gases (CO2 and O2), light intensity, mineral content (salinity and nutrients), temperature, ultraviolet radiation, various pollutants, pathogenic agents (fungi, viruses, and bacteria) and herbivory [2]. In order to adapt to these environments, the cells of these organisms produce bioactive compounds that often have beneficial effects on human health [8,9]. These organisms are therefore being studied for their abundance of compounds with diverse biological properties, including primary and secondary metabolites [10].
The high concentration of minerals in algae is also worth mentioning, including both macro nutrients, such as calcium (Ca), phosphorus (P), magnesium (Mg), sulphur (S), sodium (Na), chloride (Cl), and potassium (K), and micro minerals, including iron (Fe), zinc (Zn), copper (Cu), iodine (I), selenium (Se), manganese (Mn), chromium (Cr), molybdenum (Mo), fluorine (F), boron (B), cobalt (Co), silicon (Si), aluminium (Al), arsenic (Ar), tin (Sn), lithium (Li), and nickel (Ni) [11]. Seaweeds normally contain these elements in quantities between 15 and 25 per cent of their dry weight. Normally, the Na/K ratio is low, which has been shown to confer benefits to humans, such as reducing hypertension [12].
Ulva spp. (Chlorophyta, Ulvophyceae, Ulvales, Ulvaceae) is a cosmopolitan taxon [13], commonly known as sea lettuce, forming a frond or blade and a small disc that allows it to attach to the substrate (Figure 1) [14]. The genus is found in a wide variety of coastal environments, including tidal pools, intertidal rocks and reefs, brackish water, and even freshwater, where nutrient concentrations are high [15]. Ulva spp. is a rich source of essential polysaccharides, including ulvans, and oligosaccharides, which can account for approximately 40 per cent of its dry weight (dw) [6].
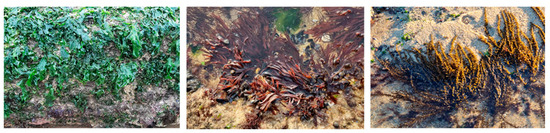
Figure 1.
From left to right, Ulva sp., Gracilaria multipartita, and Sargassum muticum, in January 2024, Portugal.
Gracilaria spp. (Rhodophyta, Florideophyceae, Gracilariales, Gracilariaceae) is one of the most valuable marine red algae in the world [16]. Nutritionally rich, the Gracilaria genus contains proteins, vitamins, carotenoids (including beta-carotene, lutein, and zeaxanthin), pigments, dietary fibre, and omega-3 and omega-6 fatty acids [16,17]. It is regarded as a source of agar, a phycocolloid used in the manufacture of consumer products, including food, pharmaceuticals, and cosmetics, among others [18,19]. Gracilaria multipartita (Clemente) Harvey 1846 (Figure 1) is a European species that grows in high temperatures and light, with a high mineral content [20,21]. This species has been underrepresented in the literature, with very little information available on its nutrient and mineral content, except for the species’ agar content [22].
Sargassum spp. (Ochrophyta, Phaeophyceae, Fucales, Sargassaceae) contains polysaccharides, proteins, polyphenols, lipids, sterols, carotenoids, and other bioactive compounds with therapeutic properties [23]. Studies have demonstrated that brown seaweeds possess protein values ranging from 5 to 15% of their dry weight, with an average ash content between 13 and 30% of the dw [24]. The species Sargassum muticum (Yendo) Fensholt 1955 (Figure 1) is characterised by numerous spherical aerocysts, which serve to maintain the organism’s vertical position in the water column and facilitate its growth towards the surface, where it forms floating masses [2,13]. The seaweed is native to the north-west Pacific region, from China to Japan and south-east Russia [25,26], and it is an invader in Europe and North America [27].
Fourier transform infrared spectroscopy (FTIR), near-infrared spectroscopy (NIR), and Raman spectroscopy are powerful analytical techniques for many different natural products, including macroalgae. These methods provide valuable insights into the biochemical composition and structural characteristics of algae biomass, helping with species identification, quality control, and research into bioactive compounds, as they enable key macromolecules, such as lipids, proteins, and carbohydrates, to be analysed [28]. FTIR and NIR are particularly effective for studying functional groups and molecular vibrations, providing critical information on the quality of algal biomass. FTIR spectroscopy is commonly used to analyse the polysaccharide content, such as carrageenan in red and alginate in brown seaweeds, and identifying characteristic functional groups, such as sulphate esters and carboxylate ions. NIR spectroscopy has been used for a rapid and non-destructive assessment of the moisture, protein, and carbohydrate content of macroalgae. Raman spectroscopy complements these methods by providing detailed structural information, proving especially valuable for studying pigments and cell wall components under stress conditions induced by variations in light or nutrient availability [28,29].
NIR, FTIR, and Raman are therefore complementary spectroscopic techniques for characterising seaweed biomass [30]. Together, these spectroscopic techniques facilitate advances in macroalgal research for their characterisation or differentiation [29,31,32,33,34,35].
While previous studies have extensively analysed the nutritional composition of various algae species, our research provides new data specific to algae species collected in Portugal in 2024. This is of key interest as the composition of seaweed can vary greatly depending on environmental conditions and location. Additionally, the characterisation of Gracilaria multipartita is relatively novel, with very limited data available regarding its nutritional and mineral composition. Hence, our hypothesis is that the studied species of seaweeds from central Portugal exhibit an interesting nutritional and mineral composition for the food sector and that the algae species collected from different locations exhibit significant variations due to environmental factors.
The aims of this paper are to characterise the nutritional and mineral composition of Ulva sp., Gracilaria multipartita, and Sargassum muticum from Buarcos and San Marcos beaches in central Portugal, to assess differences between taxa, and, for the latter, regional variations. We also aim to evaluate the effectiveness of vibrational spectroscopy techniques (NIR, FTIR, and Raman) in identifying and differentiating the biochemical profiles of the algae species.
2. Materials and Methods
2.1. Experimental Layout
2.1.1. Sampling Collection
The biomass of three species of seaweed was collected in January 2024, at low tide, on the rocky, sandy beach of Buarcos in Figueira da Foz (40°10′17.22″ N–8°53′40.98″ W), Portugal. Later, in February 2024, the species Sargassum muticum was collected on the San Marcos beach, near Peniche, Portugal (39°19′01″ N, 9°21′02″ W) (Figure 2). The quantities of the four collected samples were, in fresh weight, 597 g of Ulva sp., 1650 g of G. multipartita, 2150 g of S. muticum (Buarcos), and 1334 g of S. muticum (San Marcos).
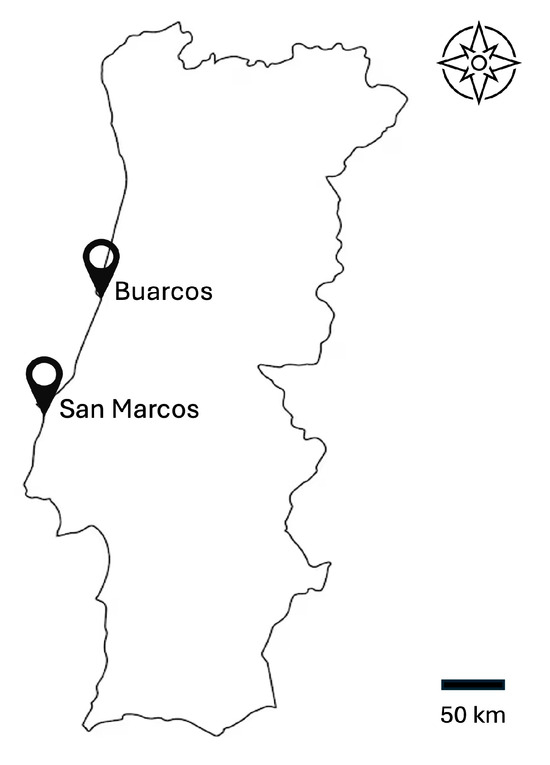
Figure 2.
Location of Buarcos and San Marcos beaches in central Portugal.
Both Buarcos and San Marcos beaches are located on the Atlantic coast of central Portugal, where winters are relatively mild with occasional showers. San Marcos experiences average winter air temperatures between 10 °C and 16 °C, with water temperatures around 14 °C. To the north, Buarcos is cooler, with average air temperatures ranging from 8 °C to 15 °C and water temperatures around 13 °C during the same period.
2.1.2. Sample Preparation
The raw material was quickly taken to the laboratory in dark bags, where the samples were first washed with seawater at room temperature to prevent the loss of mineral salts as a result of thermal shock and to remove most of the debris, sand, and epiphytes. To determine the initial moisture and prepare the biomass for subsequent analysis, seaweeds were dried in an oven (FD115, Binder, Tuttlingen, Germany) at 60 °C for 24 h. The samples were then powdered (A10 basic, IKA, Staufen, Germany) and stored in sterile airtight bags before weighting. The seaweeds were then stored at −20 °C until further use.
2.2. Chemical Analysis
2.2.1. Determination of Moisture and Dry Matter Content
The moisture content (residual moisture) was determined by drying the samples according to the official AOAC standard method [36]. Approximately 1.0 g of the sample was weighed for porcelain capsules and dried in an oven (UL 60, Memmert, Büchenbach, Germany) at 103 ± 2 °C for 24 h until it reached a constant weight. The results were expressed as a percentage of the moisture in dry weight (dw).
2.2.2. Determination of Ash and Organic Matter Content
The ash content was obtained by subjecting the samples from the determination of the second moisture content to complete incineration in a muffle furnace (L15 C6, Nabertherm, Lilienthal, Germany) at a temperature of 550 ± 50 °C for 7 h [36]. When the furnace reached a stable temperature, the capsules were removed and placed in the desiccator to cool. The results of the ash in the dry matter were expressed as a percentage in g/100 g.
2.2.3. Determination of Crude Fat Content
The crude fat (CF) content of the algae samples was determined using a Soxtec system HT and the 1043 extraction unit (Foss Tecator, Höganäs, Sweden). Petroleum ether was used as the solvent in the crude fat extraction process [36]. A quantity of approximately 2.5 g of the dry sample was weighed and placed in the extraction apparatus. Then, 50 mL of petroleum ether were poured into a previously weighed aluminium beaker, which was used as a solvent to extract the fat from the samples and placed in the equipment. Once the extraction process was complete, the crude fat content of the samples was obtained, and the solvent was recovered for reuse. The results were expressed as a percentage of CF, as follows (Equation (1)):
where W1 represents the weight of the empty flask (g), W2 is the weight of the flask with the extracted fat (g), and S is the weight of the sample (g).
The following equation was used to determine the percentage of crude fat in dry matter (CFDM) (Equation (2)). The same adjusted formula was used to calculate the percentage of crude fibre and crude protein in dry weight.
where CF represents the percentage of crude fat and DM the percentage of dry matter.
2.2.4. Determination of Crude Fibre Content
The crude fibre (CFi) content of the samples was determined using the Weende method combined with the Fibertec 1020 System M6 Hot Extractor extraction unit (Foss Tecator, Höganäs, Sweden). A quantity of approximately 1.0 g of celite and a similar quantity of the sample were weighed into previously weighed crucibles, which were introduced into the hot extraction unit equipped with boiling columns. The samples were then hydrolysed with 150 mL of sulphuric acid (H2SO4, 0.26 N) for 30 min after the temperature reached boiling point. After washing off the acid with boiling distilled water, a second hydrolysis was performed with a basic sodium hydroxide solution (NaOH, 0.32 N) for 30 min. Finally, a Kitasato pump was used in a vacuum filtration system to wash with acetone (NP-2029/1983, 1983). The crucibles were heated in an oven (UL 60, Memmert, Germany) at 103 ± 2 °C for two hours and then weighed (W1). The crucibles were then incinerated in a muffle furnace at 550 ± 5 °C for 3 h and then weighed (W2). The CFi was calculated using Equation (3):
where W1 represents the weight of the crucible after drying (g), W2 is the weight after the crucible was incinerated (g), and S is the weight of the sample (g).
2.2.5. Determination of the Total Nitrogen and Crude Protein Content
Total nitrogen (TN) and crude protein (CP) were determined through the Kjeldahl method [37] using an estimated conversion factor for seaweeds of 5.00 [38]. Approximately 0.5 g of each sample was digested with 12 mL of sulphuric acid (H2SO4), and two Kjeltabs catalyst tablets were employed to enhance both the speed of digestion and the boiling point for 60 min at 420 °C in a digestor system (DS6 1007 Digester, Tecator, Höganäs, Sweden). In the next step, the samples were automatically distilled with Na hydroxide (NaOH) under alkaline conditions (UKD 139 Semi-Automatic Kjeldahl Distillation unit, Velp, Usmate Velate, Italy). The distillate resulting from the distillation process was collected in a 4% boric acid solution and titrated with 0.1 mol/L of hydrochloric acid (HCl). The total nitrogen content (TN) was determined using Equation (4).
where Vs represents the volume of hydrochloric acid (HCl) used to titrate the samples (mL), Vw is the volume of HCl used to titrate the blank test (mL), 0.1 is the molarity (mol/L) of the HCl used in the titration, 14.008 is the molecular weight of nitrogen, and S is the weight of the samples.
To ascertain the crude protein content (CP), Equation (5) was used.
where TN is the total nitrogen content and 5.00 is the conversion factor used for seaweeds [38].
CP (%) = TN × 5.00
2.2.6. Determination of Carbohydrates
The carbohydrate content was determined through subtraction, as stated by Macloughlin et al. [39], using Equation (6). The carbohydrate content of the samples was calculated in dry matter (CHDM):
where ADM is the percentage of the ash in dry matter, CPDM is the percentage of the crude protein in dry matter, CFDM is the percentage of the crude fat in dry matter, and CFiDM is the percentage of the crude fibre in dry matter.
CHDM (%) = 100 – (ADM + CPDM + CFDM + CFiDM)
2.2.7. Determination of Energy
Energy is an essential component acquired through human and animal nutrition, as it is needed for all kinds of processes and body functions [40,41]. The energy content of a diet can be determined using the following formulae [42] (Equations (7) or (8)):
Energy (kcal) = (CH × 4) + (CP × 4) + (CF × 9) + (CFi × 2)
Energy (kJ) = (CH × 17) + (CP × 17) + (CF × 37) + (CFi × 8)
CH stands for carbohydrate content in percentage, CP is the percentage of the crude protein, CF is the percentage of the crude fat, and CFi is the percentage of the crude fibre.
To determine the energy in dry matter, the values of all of the nutrients used were previously converted into dry matter.
2.3. Mineral Analysis
2.3.1. Samples’ Digestion
Each capsule containing the previously determined ash samples was placed on a manual hotplate with 3 mL of hydrochloric acid (HCl, 20%) until they reached their boiling point. The preparation of samples for the dilutions consisted of filtering the residue with a Whatmann n° 41 filter paper and boiling ultra-pure water into previously prepared 50 mL volumetric flasks.
2.3.2. Determination of Mineral Content Through Flame Atomic Absorption Spectrometry
The macrominerals (Ca, K, Mg, and Na) and microminerals (Fe, Zn, Cu, and Mn) in the ash samples obtained earlier were quantified through flame atomic absorption spectrometry (iCE 3000, Thermo Fisher Scientific, Waltham, MA, USA) using specific wavelength detection. The respective wavelengths were 422.7, 766.5, 285.3, 589.0, 248.3, 213.9, 324.8, and 279.5 nm. Phosphorus (P) absorbance readings were determined using molecular absorption spectrophotometry (Evolution 300 LC, Thermo Fisher Scientific, Waltham, MA, USA) at a wavelength of 470 nm. The results are expressed in milligrams per gram (mg/g).
2.4. Vibrational Spectroscopic Techniques
In this study, Fourier transform near-infrared spectroscopy (FT-NIR), Fourier transform infrared spectroscopy with attenuated total reflectance (FTIR-ATR), and Fourier transform Raman spectroscopy (FT-Raman) were used to differentiate between samples. The objective was to evaluate and compare these techniques to determine which one is the most effective at distinguishing the samples and providing deeper insight into their characteristics.
2.4.1. FT-NIR Spectroscopy
FT-NIR analyses spectral data by measuring the absorption of light from the sample in the near infrared region, including overlapping fundamental vibrations and their combinations. The near-infrared spectra of the samples were obtained with a near-infrared spectroscope (MPA, Bruker Optik GmbH, Ettlingen, Germany). The samples were measured with a spectral resolution of 4 cm−1, with 64 scans in the wavenumber from 12,000 cm−1 to 4000 cm−1. The background was performed before each sample was analysed. A glass cell designed for spectroscopy, which was 2 cm in diameter, was used, and measurements were performed in transmission mode.
2.4.2. FTIR-ATR Spectroscopy
FTIR-ATR was used to quickly and accurately identify the different samples using a diamond crystal. A small portion of the material was carefully placed directly on the FTIR-ATR (ALPHA, Bruker Optik GmbH, Ettlingen, Germany) and, between each analysis, the crystal was thoroughly cleaned with isopropanol to remove any residual sample. The spectra were taken with 128 scans per sample with a resolution of 2 cm−1 and a spectra acquisition region between 4000 cm−1 and 400 cm−1. The background spectrum was recorded before each sample was analysed to ensure accurate measurements.
2.4.3. FT-Raman Spectroscopy
FT-Raman spectroscopy is an analytical technique used to identify molecular structures and characterise materials based on their vibrational energy modes. The Raman spectra of the samples were acquired using an FT-Raman spectrometer (Bruker Optik GmbH, Ettlingen, Germany). The spectra acquisition region ranged from 4000 cm−1 to 100 cm−1, allowing for a wide range of vibrational modes to be analysed. A resolution of 4 cm−1 was used, with 64 scans per sample, according to the methodology previously defined for plant material [43]. A specific sample holder was used to place the solid samples, which was designed to ensure proper alignment and stability during the analysis, allowing for accurate spectral data collection. After each measurement, the sample holder was thoroughly cleaned to prevent contamination from previous analyses, ensuring consistent results across all measurements.
In this case, no additional depigmentation treatment was applied to the samples before the FT-Raman analysis, as the objective was to compare the three techniques using the material in the same unaltered state.
2.5. Multivariate Analysis
A standardised biplot was generated from the principal component analysis (PCA) to examine the overall correlation between algae species and chemical data. This biplot il-lustrates the standardised component scores alongside the projections of the standardised variables. The PCA with analytical data was performed using Statistics® software, version 7.0.
For PCA with spectral data, various mathematical transformation techniques were applied, including standard normal variate transformation (SNV), multiplicative scatter correction (MSC), Savitzky–Golay first and second derivatives, and combinations of these methods. The analysis of the spectra was performed using Unscrambler® X software, version 10.5.46461.632 (CAMO Software AS, Oslo, Norway).
These approaches allowed for the identification of key spectral and chemical features, facilitating a deeper understanding of the factors that distinguish algae species.
For the nutritional composition, a one-way analysis of variance (ANOVA), followed by Tukey’s HSD post hoc test, were used to assess significant differences between samples. Statistical significance was determined at a p-value < 0.05. Results are presented as mean ± standard deviation. Statistical analyses were conducted using SPSS Statistics® 29 (IBM Corporation, New York, NY, USA).
3. Results and Discussion
3.1. Nutritional Analysis
The nutritional composition, with measurements of moisture, ash, protein, fat, fibre, carbohydrates, and energy, is shown in Table 1.

Table 1.
Nutritional composition (g/100 g dw) of the samples of three species of seaweed of Ulva sp., Gracilaria multipartita, and Sargassum muticum from Buarcos beach and S. muticum from San Marcos beach. The results are expressed as mean values ± standard deviation. Different letters (a,b,c,d) represent statistical differences between species.
All of the seaweed species harvested from Buarcos beach exhibited a high moisture content, including 89.5% for Ulva sp., 95.5% for Gracilaria multipartita, and 91.7% for Sargassum muticum, whereas S. muticum from San Marcos had a lower moisture content of 86.87%.
The second moisture content and dry matter of the samples were determined after drying. Among the Buarcos species, S. muticum (7.77 ± 0.10 g/100 g) had the highest second moisture value, followed by Ulva sp. (7.58 ± 0.03 g/100 g) and G. multipartita (6.07 ± 0.30 g/100 g), while the moisture content of the S. muticum from Buarcos was higher than that of the sample from San Marcos (5.56 ± 0.10 g/100 g). This seaweed therefore showed the greatest dry matter, with a value of 94.44 ± 0.10 g/100 g.
As for the organic matter, the highest value was found in G. multipartita (73.44 ± 0.02 g/100 g dw), which was significantly higher than all of the other species, whereas Ulva sp. had the lowest value (66.47 ± 0.09 g/100 g dw). Regarding the ash content, Ulva sp. had the significantly highest value (33.53 ± 0.09 g/100 g dw), while S. muticum (Buarcos) and G. multipartita had lower amounts of ash, with 28.42 ± 0.06 g/100 g dw and 26.56 ± 0.02 g/100 g dw, respectively. Additionally, for S. muticum from San Marcos, a significantly different ash content was found (30.17 ± 0.30 g/100 g dw) when compared to the sample from Buarcos (28.42 ± 0.06 g/100 g dw).
According to the studies by Taboada et al. [44] and Tirgui et al. [45], the ash content of wild species of Ulva sp. ranged from 14 to 31 per cent in dry weight (dw), with the maximum value close to our result. As for S. muticum, Rodrigues et al. [37] presented a lower value than ours (22.94%). Furthermore, the higher ash content in the San Marcos species indicates lower organic matter (OM) content compared to the Buarcos sample. The lack of data on G. multipartita from the Portuguese coast in previous studies precludes any comparison. However, studies with other species of the same genus, such as Gracilaria gracilis collected from Buarcos beach, have reported ash contents ranging from 18.96% [46] to 24.8% [37]. Thus, G. multipartita seems to contain greater ash content than G. gracilis. The ash content of seaweeds varies between locations due to differences in environmental factors, such as salinity, temperature, nutrient availability, and the presence of minerals, such as heavy metals in the water, making seaweeds’ biomass less suitable for further biorefinery development [47].
The crude fat (CF) content is always very low, revealing a range between 0.11 g/100 g dw for Ulva sp. and 0.19 ± 0.01 g/100 g dw for S. muticum from Buarcos, with the latter showing minimal differences compared to the San Marcos sample (0.19 ± 0.05 g/100 g dw). Meanwhile, the fat content for G. multipartita was 0.14 ± 0.00 g/100 g dw. The CF content in macroalgae is naturally minimal. Several studies stated higher fat content, namely, those by Soares et al. [48], Kumari et al. [49], and Paiva et al. [50], who reported a range between 0.23 and 2.0 g/100 g. Despite these variations, the low-fat content in seaweeds is well-documented, and fluctuations are likely due to environmental conditions.
The crude fibre content of the three species exhibits a range of values, with the lowest observed at 5.83 + 0.02 g/100 g, followed by 6.17 ± 0.35 g/100 g dw, 6.24 ± 1.34 g/100 g dw, and 10.88 ± 0.20 g/100 g dw for the Ulva sp., G. multipartita, and S. muticum species from San Marcos and Buarcos, respectively, with the latter’s values being significantly higher than those of the other three samples. The CFi values presented by Paiva [51] (52.20%) and Milinovic et al. [52] (14–18% in dry weight) for red seaweeds and 22–32% dw for brown seaweeds are much higher than the concentrations found in this study. A similar pattern was observed for Ulva sp., with the crude fibre value indicated by Milinovic et al. [52] (21%) and Patarra et al. [53] (41.16%) being higher than that of the present study. These discrepancies may be due to potential inaccuracies or methodological errors in the procedure used to quantify crude fibre [54].
The crude protein content of the samples ranged from 10.13 ± 0.07 g/100 g dw in S. muticum (San Marcos) to 18.43 ± 0.07 g/100 g dw in G. multipartita (Buarcos), closely followed by Ulva sp., with a protein content of 18.05 ± 0.10 g/100 g dw. Despite being harvested in different regions, the two populations of S. muticum exhibit minimal variation between them and have a comparable protein value. The proportion of crude protein present in macroalgae varies considerably depending on the species. Red and green algae typically exhibit high levels of CP, ranging from 3 to 47 per cent [55,56] and 10 to 30 per cent [2,57], respectively. In contrast, brown macroalgae generally display a relatively lower proportion of CP, ranging from 5 to 15 per cent [37,58]. The findings of this study corroborate the claims made by the aforementioned authors, indicating that the green Ulva sp. (18.05 ± 0.10 g/100 g) and the red G. multipartita (18.43 ± 0.07 g/100 g) exhibited higher CP values than the brown S. muticum from San Marcos (10.13 ± 0.07 g/100 g) and Buarcos (10.25 ± 0.35 g/100 g). It can thus be concluded that green and red macroalgae have the potential to serve as an alternative source of protein for human food and animal feed. In addition, there are seasonal shifts in the protein content, with macroalgae containing higher amounts of protein during the late winter and early spring and lower amounts during the late summer and early autumn periods [56,59].
The carbohydrate (CH) content of the seaweeds ranged from 42.48 ± 0.15 g/100 g to 53.27 ± 1.11 g/100 g in dw for the species Ulva sp. and S. muticum from San Marcos, respectively. The findings of this study indicate that the sample from San Marcos contains a significantly higher amount of carbohydrates than all of the other samples from Buarcos.
Finally, the energy values (kJ/kcal) of the taxa analysed showed small differences between samples. G. multipartita (1195.75 ± 5.94 kJ/100 g dw and 282.12 ± 1.37 kcal/100 g dw) had the highest energy value, followed by S. muticum from Buarcos (1134.75 ± 10.84 kJ/100 g dw and 267.79 ± 2.44 kcal/100 g dw) and S. muticum from San Marcos with the lowest values (1122.74 ± 0.36 kJ/100 g dw and 265.51 ± 0.07 kcal/100 g dw) and Ulva sp. (1079.72 ± 0.39 kJ/100 g dw and 254.77 ± 0.09 kcal/100 g dw), which presented the lowest values. Thus, G. multipartita provides the highest energy value for an adult but was closely followed by S. muticum, whereas Ulva sp. shows significantly less carbohydrates and energy content.
Table 2 shows the main results obtained for the mineral composition. The results support previous studies showing that the mineral content of macroalgae varies depending on the taxon, and it can also change within the same species due to factors like its location, environmental conditions, health, and life cycle [60].
Table 2.
Mineral composition (mg/g dw) of samples of three species of seaweed, Ulva sp., Gracilaria multipartita, and Sargassum muticum, from Buarcos beach and S. muticum from San Marcos beach. The results were expressed as mean values ± standard deviation. Different letters (a,b,c,d) represent statistical differences between the samples.
The K content of the San Marcos brown macroalga revealed the highest concentration (86.19 ± 9.06 mg/g dw), being the most prevalent mineral among the macrominerals examined and even surpassing Na concentration. The concentration of K is much lower in the other taxa and lower than the concentration of Na. The results also show that Na was the highest in Ulva sp. (73.80 ± 0.45 mg/g dw), followed by S. muticum (73.52 ± 6.93 mg/g dw) and G. multipartita (64.07 ± 5.96 mg/g dw). S. muticum from San Marcos was the species with the lowest Na content (29.36 ± 3.82 mg/g dw). Seaweeds therefore have a very diverse Na:K ratio, with the lowest Na:K ratio value being obtained in S. muticum (4.9 mg/g dw) and Ulva sp. (10.5 mg/g dw). The World Health Organisation (WHO) recommends a Na intake of less than 2000 mg per day and a K intake of more than 3510 mg per day, i.e., a Na:K ratio of ≤1.0, which is considered optimal for maintaining cardiovascular health [61]. The best result was thus obtained for S. muticum from San Marcos, which presents a value of less than 1, as recommended by the WHO [61]. The ratio between the elements Na and K provides a means of counterbalancing the effects of modern Western diets, which are characterised by high intake of Na and low intake of K, concerning hypertension and associated cardiovascular diseases [62].
The Na concentration was significantly higher than that reported by several authors cited by Circuncisão et al. [63], and it was only comparable to that of the brown seaweed Undaria pinnatifida. In the literature, concentrations of Na ranged from 11 to 24 mg/g in Ulva spp. and from 10 to 16 mg/g in Gracilaria spp., while in Sargassum spp., 27 mg/g was found [64]. The two S. muticum harvesting sites differed significantly, with the San Marcos sample being closer to the values reported by Thadhani et al. [64], who also registered a large variation between sites. Conversely, the K concentration in Buarcos was lower than those reported in the literature [63,64]. Thus, all of the samples from Buarcos had very high Na content. Environmental conditions, such as temperature and salinity, may be a contributing factor, as algae tend to absorb more Na from water with higher salinity [65].
The highest concentrations of Ca were observed in S. muticum (21.22 ± 1.48 mg/g dw), while the lowest levels were detected in Ulva sp. (8.99 mg/g dw). The Mg values were higher in the San Marcos species, which exhibit a concentration of 17.21 ± 0.86 mg/g dw, and in Ulva sp. (15.47 ± 0.96 mg/g dw). The lowest Mg value obtained was found in the G. multipartita from Buarcos (7.89 ± 0.21 mg/g dw). Furthermore, P was the least representative of the macronutrients, with values ranging from 1.07 ± 0.02 to 2.17 mg/g dw in S. muticum from Buarcos to 2.17 ± 0.07 mg/g dw observed in G. multipartita.
Ca and P, the two main minerals in the human body, along with Mg, Na, and K, make up a significant proportion of the chemical constituents of algae [62,65]. Regarding Ca and P, our results align with those reported by Circuncisão et al. [63] and Thadhani et al. [64]. Among the Buarcos species, the highest Mg values were found to be lower in the green and brown algae compared to the red macroalgae [66], as observed by Rodrigues et al. [37]. Seaweeds are rich in these minerals, making them valuable food sources of essential nutrients. There is strong evidence that Ca from seaweeds enhances bone density, muscle strength, and nerve function [67,68].
Brown macroalgae are also an excellent source of Mg, as noted by MacArtain et al. [69]. Mg is crucial for numerous biochemical reactions in the human body, including energy production and muscle function [69], while P is essential for DNA and RNA formation, energy production, and bone health in humans. In seaweeds, P is necessary for energy transfer and storage [70].
In this study, Fe, Zn, Mn, and Cu were the most important trace elements in the four types of macroalgae analysed. The levels of Fe and Zn varied significantly between sites for S. muticum but were within the values reported in the literature [63]. Fe was the most common trace element, with the highest levels found in the three Buarcos species, ranging from 221.21 to 279.52 μg/g dw. The lowest levels of Fe were found in the brown seaweed from San Marcos, with 116.30 μg/g dw. Fe is essential for the functioning of numerous proteins, including enzymes and haemoglobins in blood cells, and it is indispensable for the binding and transportation of oxygen through the tissues [71,72].
As for Zn and Mn, the highest levels were found in the species from Buarcos beach, with Zn ranging from 8.37 to 28.90 μg/g dw and Mn from 1.04 to 71.06 μg/g. S. muticum from Buarcos had the highest levels of Zn and Mn, which were significantly higher than those of the other samples. Lastly, G. multipartita had the highest level of Cu (22.8 μg/g dw), while the brown algae from San Marcos had the lowest (17.86 μg/g dw). The Cu levels in our study were higher than those reported by Circuncisão et al. [63] and Thadhani et al. [64]. High levels of Cu in seaweeds can indicate pollution in marine environments, as seaweeds can accumulate heavy metals from their surroundings [73]. However, Cu levels are below the maximum concentration allowed for human consumption in the European Union, which has set a maximum limit of 1 mg/day dry weight in seaweed [56].
The mineral content of seawater is therefore crucial to the growth and nutritional value of seaweeds, as it directly influences the accumulation of essential minerals in seaweed biomass, making it a rich source of nutrients for various applications [74].
3.2. Data Analysis
The PCA biplot in Figure 3, with two principal components (PC1 and PC2), accounts for 73.7 per cent of the total variance observed. The distribution of the samples in the PCA plot suggests a distinct differentiation of nutrients among the samples. Principal component 1 (PC1) shows a positive correlation with protein, Cu, Na, and Fe and a negative correlation with carbohydrates, fat, and K. In contrast, principal component 2 (PC2) is positively correlated with ash, fibre, and Mg and negatively correlated with P, Zn, Ca, and Mn.
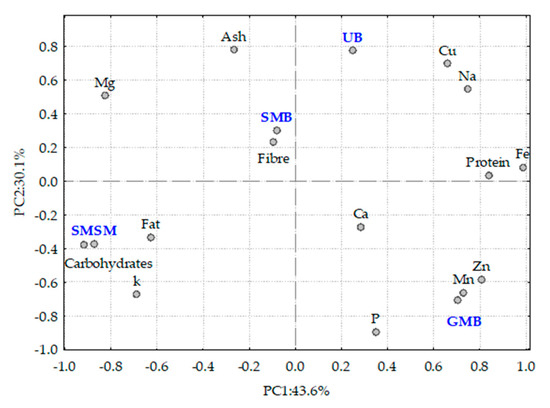
Figure 3.
Projection of the algae analysed and the analytical parameters measured in the space defined by the first two principal components. UB—Ulva sp., GMB—Gracilaria multipartita, SMB—Sargassum muticum from Buarcos beach, SMSM—Sargassum muticum from San Marcos beach.
Ulva sp. is strongly associated with ash, Cu, and Na content, while S. muticum from Buarcos is associated with higher fibre content and, to a lesser extent, with ash content, suggesting its potential use in dietary fibre supplements. G. multipartita is linked to higher Zn, Mn, and P content, highlighting its role as a source of trace elements. S. muticum from San Marcos is strongly correlated with carbohydrate, fat, and K content, indicating that its value is suitable for applications requiring energy-dense biomaterials. This analysis could be useful for bioresource applications, such as identifying species with specific nutritional profiles for food or industrial uses. Regional variations (UB—Ulva sp., GMB—Gracilaria multipartita, SMB—Sargassum muticum, all from Buarcos beach; SMSM—Sargassum muticum from San Marcos beach) may reflect environmental influences, which should be further investigated in future work [75].
The results show a clear difference between the samples, whether due to taxonomic differences or environmental conditions. The S. muticum sample from San Marcos appears to have been exposed to less nutrient-rich waters, resulting in lower protein and mineral content compared to the Buarcos sample.
3.3. Label Analysis
Seaweeds offer a variety of nutrients in concentrations that can meet nutritional needs, even allowing for some nutritional claims. However, there are no data on the daily intake of seaweed for the Portuguese population or other European countries. In contrast, the average daily intake of seaweed in Asian countries is about 8 g of seaweed dry matter [37,60]. Table 3 shows a label with the contribution of analysed nutrients in the macroalgae to the recommended daily intake for an adult.
Table 3.
Contributions of the macroalgae samples Ulva sp., Gracilaria multipartita, and Sargassum muticum from Buarcos and S. muticum collected from San Marcos to the recommended daily intake (RDI) for an adult.
Firstly, all seaweeds are extremely low in calories, with 8 g a day providing just 1.02–1.13% of the recommended daily intake (RDI). Algae are also very low in fat, with 8 g representing 0.01 to 0.02% of the RDI [76]. As for carbohydrates, proteins, and fibres, the concentrations are equally low in all taxa. Polysaccharides act as dietary fibres, promoting gut health by serving as prebiotics for beneficial gut bacteria. Despite representing a relatively small proportion of the daily nutrient intake, seaweed contains a considerable amount of minerals, largely due to the high availability and diversity of these elements in the ocean [69] and a healthy, low concentration of salt.
In spite of the variations between the taxa analysed, as far as trace elements are concerned, values of Mg, Ca, and Fe are exceptionally high, representing very interesting dietary sources of these elements. However, the high concentrations of sodium and copper in all taxa could be worrying in terms of cardiovascular health risks in the case of the former and bioaccumulation of heavy metals in the case of the latter [11].
As stated above, Sargassum muticum from Buarcos has higher levels of Ca, Fe, Na, and Cu than the biomass harvested from San Marcos beach. For instance, 8 g of dried seaweed from Buarcos provides the recommended daily intake (%RDI) of these minerals for an adult, with concentrations of 21.20%, 12.60%, 29.40%, and 16.60%, respectively. With regard to Mg, our findings also indicated that the RDI of Mg in S. muticum from San Marcos (36.7%) was higher than in all of the Buarcos species. Furthermore, Rodrigues et al. [37] confirmed that the S. muticum species is also capable of providing substantial quantities of Mg (40.1%), as we did in our study (36.7%). K was another crucial mineral found in the brown macroalgae of San Marcos, with 8 g providing 19.7 per cent of the recommended daily intake for an adult. Among the Buarcos species, the highest values for the recommended daily intake of sodium and magnesium were observed in Ulva sp. (29.5% and 33.0%), followed by S. muticum (29.4% and 29.1%) and G. multipartita (25.6% and 16.8%) in 8 g of dried algae. The values for P, Zn, and Mn are very low in RDI. P was the most prevalent in G. multipartita (2.30%), exhibiting a higher of RDI percentage than the other seaweeds. Mn and Zn are the trace elements with the highest concentration in brown seaweeds, but they represent only 1.48 per cent and 0.45 per cent of the RDI, respectively.
Seaweeds are therefore ultiparti as a valuable source of nutrients and minerals for human health. These compounds are essential for the growth, survival, and adaptation of seaweeds to various environmental stressors, playing a critical role for algae and enabling them to withstand adverse environmental conditions [77].
3.4. Spectroscopy Analysis
3.4.1. FT-NIR
The FT-NIR spectra obtained from the algae samples analysed are represented in Figure 4. The bands shown in the FT-NIR region contain information about the hydrogen-containing organic constituents (e.g., N-H, C-H, O-H) present in the sample. The NIR region encompasses wavelengths between 12,500 and 4000 cm−1 [78,79,80].
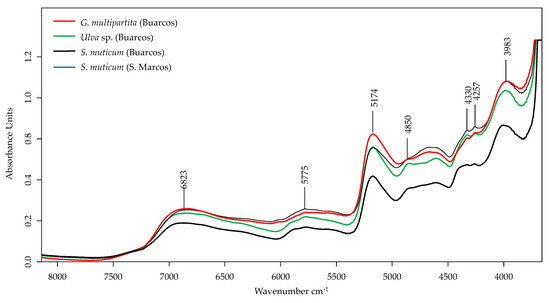
Figure 4.
FT-NIR spectra of selected macroalgae samples Gracilaria multipartita, Ulva sp., and Sargassum muticum (from Buarcos and San Marcos).
The most crucial signature of the near-infrared (NIR) spectra was the sensitive region of 6000–5500 cm−1, combined with the bands situated around 4350–4250 cm−1 within a broad band at 5775 cm−1, and two small sharp bands at 4330 and 4257 cm−1. The combined bands depict the absorption of saturated fatty acids, with C-H groups adjacent to C=C double bonds [81].
There are broad absorption regions around 5174 cm−1 and 6923 cm−1. These findings indicate the presence of alcohols and organic acids, both containing O-H functionality, the second most important signature after the C-H bond, while the O-H bond is highly influenced by C-H that are typical of hydrocarbon mixtures [79].
Furthermore, the absorption bands at 4760–4450 cm−1 and the sensitive region at 4000–3800 cm−1 (peak at 3983 cm−1) are due to aromatic C-H groups, appearing as combined bands [46,48]. The ester group C=O also makes a weak appearance as the second overtone at around 4650 cm−1; however, there is an overlap of aromatic C-H features [81].
Figure 5 represents the score plot of the PCA performed on all samples (left side). PC1 and PC2 account for 96% of the total variation and can discriminate between different genera of algae samples.
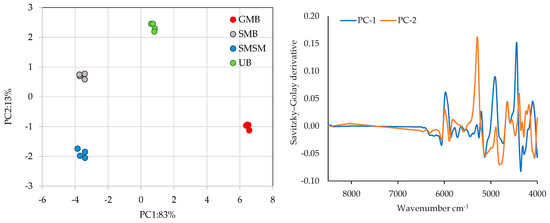
Figure 5.
Principal component analysis to discriminate between the different samples analysed using FT-NIR spectral information (left side) and the corresponding loadings of spectral information (right side) using the Savitzky–Golay derivate transform with 15 smoothing points. GMB—Gracilaria multipartita, UB—Ulva sp., SMB—Sargassum muticum from Buarcos beach, SMSM—S. muticum from San Marcos beach.
PC1 discriminates between the three different species G. multipartita, Ulva sp., and S. muticum and explains 83 per cent of the total variance. PC2, which explains 13 per cent of the total variance, is responsible for the clear distinction between S. muticum from San Marcos and Buarcos. This analysis therefore highlights the variations between species, with G. multipartita, Ulva sp., and S. muticum separated, while S. muticum collected in different sites shows distinct differentiation.
The most important region for discriminating between samples for PC1 and PC2 is the region between 6500 cm−1 and 4000 cm−1 (Figure 5, right side). Another promising region for PC2, accounting for 13 per cent of the total variation and effectively distinguishes S. muticum species collected in different regions, is the peak at 5174 cm−1. This peak corresponds to the water absorption band of the first and second vibrational overtones of the -OH stretch and is also associated with carbohydrates, starch, and proteins. Supporting the above, the different taxa and locations are clearly identified through the FT-NIR spectral analysis.
3.4.2. FTIR-ATR
The algae samples were also analysed using FTIR-ATR spectroscopy as a rapid method for chemical characterisation. The spectra obtained (Figure 6) are similar to those obtained by other authors who have analysed algae and plant material [82,83].
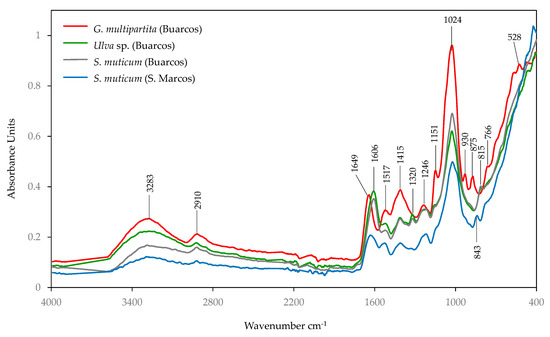
Figure 6.
FTIR-ATR spectra of species of macroalgae samples selected: Gracilaria multipartita, Ulva sp., and Sargassum muticum (from Buarcos and San Marcos).
The most characteristic bands were seen in the spectral range of 1700~800 cm−1 and 3500~2800 cm−1 due to the absorbance of the peptide backbone and the methyl and methylene groups [31]. The 1200–950 cm−1 regions of the spectra were associated with the stretching (C-O-C) vibrations of the polysaccharides [84], with a most intense band at 1024 cm−1. This band exhibited varying intensities from G. multipartita, followed by S. muticum and a smaller peak in Ulva sp. These features were attributed to different polysaccharide components: agar in red algae, guluronic acid, which is part of alginate acid in brown algae, and glycosidic C-O-C vibrations form (1,4)-β-D-mannans, which is the primary component of the skeletal cell wall polysaccharides in green algae [85]. The more pronounced peak in G. multipartita indicates a high concentration of phycocolloids, which in this species corresponds to high agar content. In the brown seaweeds, the presence of alginate was also confirmed by a peak at 1320 cm−1, corresponding to the C-O stretching vibrations in this linear copolymer of β-D-mannuronic acid and α-L-guluronic acid [86].
The medium intensity absorbance peaks around 1517 cm−1 (associated with N-H and C-H stretching) and 1649~1606 cm−1 (linked to C=O) can be attributed to the amide II and amide I groups, respectively, which are characteristic of protein groups [84]. The Amide I band (~1649 cm−1) provided a robust marker for protein quantification. Its higher intensity in G. multipartita compared to Ulva sp. suggests higher protein content in the red seaweed [77,87], which is consistent with our biochemical analysis.
The peaks in the 1600–1500 cm−1 range corresponded to aromatic compounds (such as flavonoids, phenolic acids, and polyphenols) and are linked to antioxidant properties and secondary metabolites [84]. These peaks were more pronounced in G. multipartita, suggesting that it is a potential source of bioactive compounds in response to oxidative stress and UV damage.
The band at 1415 cm−1 was associated with hydroxyl deformation, carbon–oxygen stretching of phenolic hydroxyl groups, and symmetrical C-H bending vibrations in CH2 or CH3 groups [88], with greater intensity in G. multipartita.
The peaks in the 1320–1200 cm−1 region indicate polysaccharide structures in S. muticum attributed to C-H bending vibrations in sugars [37], indicating the presence of mannuronic acid, another key component of the alginate commonly found in brown seaweeds [89]. The presence of alginate in S. muticum was also confirmed by a peak at 1320 cm−1, corresponding to the C-O stretching vibrations.
The anomeric region (950–700 cm−1) includes a significant peak at 930 cm−1 in red seaweeds, which is attributed to 3,6-anhydro-L-galactose, a key component of agar in Gracilaria species [37]. In biological samples, the peak at 2910 cm−1 is often related to CH2 stretching vibrations in lipids or long-chain fatty acids [90]. Finally, the band centred at 3420 cm−1 is assigned to the —OH groups (water, phenolic, alcoholic, and carboxylic), present in the cell wall of the algae [91].
Figure 7 presents the principal component analysis (PCA) plot showing the distribution of samples from different species and locations based on PC1 and PC2, which together explain 91 per cent of the total variance. To perform this spectral analysis, baseline corrections, the standard normal variate (SNV), and a derivative Savitzky–Golay transformation with 15 smoothing points were applied.
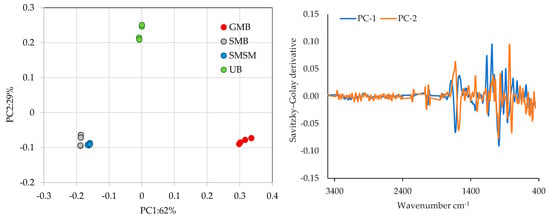
Figure 7.
Principal component analysis to discriminate between different samples analysed using FTIR-ATR spectral information (left side) and the corresponding loads of spectral information (right side) using derivative Savitzky–Golay transformation with 15 smoothing points. GMB—Gracilaria multipartita, UB—Ulva sp., SMB—Sargassum muticum from Buarcos, SMSM—S. muticum from San Marcos.
The PCA score plot highlights a clear differentiation between species, with some level of similarity observed between the two groups of S. muticum (SMB and SMSM), possibly due to their shred taxon. PC1, which accounts for 62 per cent of the total variance, is the primary axis distinguishing GMBU (located on the far right) from the other groups, primarily SMB and SMSM. Meanwhile, PC2, which explains 29 per cent of the total variance, separates UB (located in the upper region of the biplot) from the other species.
Figure 7 (right side) depicts the PCA loadings with the Savitzky–Golay derivative for two principal components (PC-1 and PC-2). This plot shows variations in the spectral data, highlighting the differences and trends taken by the two principal components where the most representative regions for achieving the differentiation between species are between the 1600–600 cm−1 wavenumber regions. These findings are crucial for the development of future calibrated models to predict algae nutrient composition.
3.4.3. FT-RAMAN
While Raman spectroscopy often complements FTIR by providing more detailed vibrational data, the samples in this study gave weaker Raman signals compared to FTIR-ATR due to their dark colour. The FT-Raman spectra obtained from the algae analysed are presented in Figure 8.
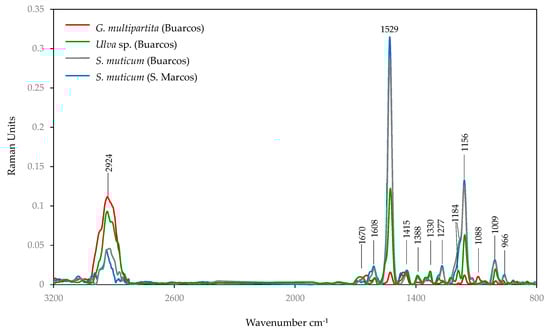
Figure 8.
FT-Raman spectra of the species of macroalgae samples selected: Gracilaria multipartita, Ulva sp., and Sargassum muticum (from Buarcos and San Marcos).
The sharp and well-defined band at 1529 cm−1 is attributed to C=C in the plane band attributed to carotenoids [92,93] and is particularly abundant in S. muticum from S. Marcos beach, closely followed by S. muticum from Buarcos. This is not surprising given the high content of fucoxanthin in this taxon.
The large band at 1156 cm−1 in Raman is typically associated with C–O–C stretching vibrations of glycosidic bonds in polysaccharides, such as cellulose, pectins, agar, alginate, fucoidan, ulvan, or other phycocolloids. This is corroborated by the small band at 1088 cm−1, which is a specific polysaccharide signature and, in G. multipartita, indicates the presence of agar. Furthermore, the 966 cm−1 band can also be linked to S=O stretching in sulphated polysaccharides [93,94].
In FT-RAMAN, the wavenumber of 1608 cm−1 is again characteristic of C=C stretching vibrations in aromatic rings, which in algae is often associated with phenolic compounds, flavonoids, and aromatic amino acids present in proteins [94]. The wavenumber at 1277 cm−1 also indicates the C-H bending or C-C stretching of phenolic compounds. The small band at 1009 cm−1 is often associated with amide linkages and C-N spatial stretching in proteins and peptides. The band at 2924 cm−1 is commonly associated with the C-H stretching vibrations in aliphatic hydrocarbons, which indicates the presence of methylene (CH2) and methyl (CH3) groups. The Raman bands at 1340 and 1346 cm−1 have been assigned to CCH, COH, and OCH deformations in the plane of pyranoid rings with CH2 and CH3, a contribution of galactose and fucose, respectively [94]. The small bands at 1445 cm−1, 1388 cm−1, and 1277 cm−1 are commonly attributed to the presence of lipids and fatty acids [30].
Figure 9 shows the PCA plot, where the samples of different species and locations are distributed according to two principal components that together explain 99% (97% for PC1 and 2% of PC2) of the total variation. Although PC2 makes a much smaller contribution, Ulva sp., separated by both PC1 and PC2, indicates distinct characteristics compared to the other species. The two S muticum samples show only a slight separation between locations along the PC1, suggesting some degree of chemical similarity between them.
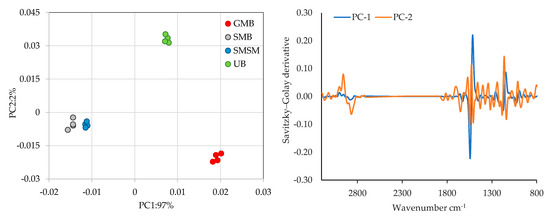
Figure 9.
Principal component analysis for discrimination of the different samples analysed using FT-Raman spectral information (left side) and FT-Raman absorption spectra of data processed with Savitzky–Golay derivative (right side). GMB—Gracilaria multipartita, UB—Ulva sp., SMB—Sargassum muticum from Buarcos, SMSM—S. muticum from San Marcos.
Despite the higher values observed for the variation explained by PC1+PC2, the peaks that contribute most to discrimination in the PCA are located at 1529 cm−1 and 1156 cm−1 for PC1 and at 1156 cm−1 and 2924 cm−1 for PC2 (representing only 2 per cent of the total variance) (Figure 9, right side). This weak contribution from the spectral regions, combined with the low signal strength, indicate that for the same material, FT-Raman spectroscopy appears to be the least effective technique for distinguishing between the algae species studied. In this case, additional pre-treatment may be necessary as long as it does not interfere with the analysis of this matrix or its chemical composition. This will be the aim of future research in this area.
As with the FT-NIR and FTIR-ATR analyses, the PCA analyses for FT-Raman highlight the differences between species, with little overlap observed between the same species collected in different regions. This emphasises the importance of geographical distribution and environmental factors in the chemical composition of species.
4. Conclusions
The growing interest in the unique characteristics of seaweed and its bioactive compounds has led to its recognition as a valuable superfood across various industries. The findings of this study indicate the high nutritional value of seaweeds, particularly with regard to protein. Specifically, Ulva sp. and Gracilaria multipartita had more than 18 per cent protein. Regarding dietary fibre, the values obtained in this study were lower than those previously reported in the literature, ranging from 5.83 ± 0.02 g/100 g dw to 6.24 ± 1.34 g/100 g dw. Another key attribute of these macroalgae is their extremely low fat content, measuring less than 0.19 ± 0.01 g/100 g dw, a characteristic that is highly sought after by health-conscious consumers, particularly women and the elderly. Additionally, these seaweeds exhibit rich mineral content, including potassium, sodium, calcium, magnesium, phosphorus, iron, zinc, manganese, and copper, which play significant roles in human health. For instance, potassium levels ranged from 7.05 ± 0.53 mg/g dw in Ulva sp. (Buarcos) to 86.19 ± 9.06 mg/g dw in Sargassum muticum (San Marcos), while iron levels ranged from 116.30 ± 6.68 μg/g dw in S. muticum (San Marcos) to 279.52 ± 5.65 μg/g dw in S. muticum (Buarcos). Spectroscopic analyses (FTIR-ATR, FT-Raman, and FT-NIR) further revealed the complex biochemical composition of these macroalgae, encompassing sugars, lipids, proteins, aromatic phenolic compounds, carotenoids, structural polysaccharides, and sulphated polysaccharides. These components underscore the potential use of seaweeds for applications in various sectors, including food, feed, pharmaceuticals, cosmetics, and other industries.
Author Contributions
Conceptualisation T.M. and O.A.; methodology, T.M. and O.A.; validation, T.M., O.A. and A.M.R.; formal analysis, M.M.A., T.M., O.A., F.I.P. and C.V.; investigation, M.M.A., F.I.P. and C.V.; resources, T.M. and O.A.; data curation, M.M.A., T.M., O.A., O.A., F.I.P. and C.V.; writing—original draft preparation, T.M. and M.M.A.; writing—review and editing, T.M., O.A. and A.M.R.; visualisation, T.M. and O.A.; supervision, T.M., O.A. and A.M.R.; project administration, T.M. and O.A.; funding acquisition, T.M. and O.A. All authors have read and agreed to the published version of the manuscript.
Funding
This work was funded by national funds through FCT, Fundação para a Ciência e a Tecnologia, I.P., within the scope of the projects MARE, Centro de Ciências do Mar e do Ambiente, UID/04292/MARE, ARNET, Aquatic Research Network, LA/P/0069/2020 (DOI:10.54499/LA/P/0069/2020), and CERNAS UIDB/00681 (DOI:10.54499/UIDB/00681).
Institutional Review Board Statement
Not applicable.
Informed Consent Statement
Not applicable.
Data Availability Statement
The original contributions presented in this study are included in the article. Further inquiries can be directed to the corresponding authors.
Conflicts of Interest
The authors declare no conflicts of interest.
References
- Akila, N.; Jeyadoss, T. The Potential of Seaweed Liquid Fertilizer on the Growth and Antioxidant Enhancement of Helianthus annuus L. Orient. J. Chem. 2010, 26, 1353. [Google Scholar]
- Notowidjojo, L. Seaweed as Novel Food for Prevention and Therapy for Life Style Related Disease. World Nutr. J. 2021, 5, 1–5. [Google Scholar] [CrossRef]
- Pereira, L. Guia Ilustrado Das Macroalgas: Conhecer e Reconhecer Algumas Espécies Da Flora Portuguesa; Imprensa da Universidade de Coimbra: Coimbra, Portugal, 2009. [Google Scholar]
- Burki, F.; Roger, A.J.; Brown, M.W.; Simpson, A.G.B. The New Tree of Eukaryotes. Trends Ecol. Evol. 2020, 35, 43–55. [Google Scholar] [CrossRef] [PubMed]
- Afonso, C.; Correia, A.P.; Freitas, M.V.; Baptista, T.; Neves, M.; Mouga, T. Seasonal Changes in the Nutritional Composition of Agarophyton vermiculophyllum (Rhodophyta, Gracilariales) from the Center of Portugal. Foods 2021, 10, 1145. [Google Scholar] [CrossRef]
- Queirós, A.S.; Circuncisão, A.R.; Pereira, E.; Válega, M.; Abreu, M.H.; Silva, A.M.S.; Cardoso, S.M. Valuable Nutrients from Ulva rigida: Modulation by Seasonal and Cultivation Factors. Appl. Sci. 2021, 11, 6137. [Google Scholar] [CrossRef]
- McHugh, D.J. A Guide to the Seaweed Industry; FAO Fisheries Technical Paper 441; Food and Agriculture Organisation of the United Nations: Rome, Italy, 2003. [Google Scholar]
- Dixit, D.C.; Reddy, C.R.K.; Balar, N.; Suthar, P.; Gajaria, T.; Gadhavi, D.K. Assessment of the Nutritive, Biochemical, Antioxidant and Antibacterial Potential of Eight Tropical Macro Algae Along Kachchh Coast, India as Human Food Supplements. J. Aquat. Food Prod. Technol. 2018, 27, 61–79. [Google Scholar] [CrossRef]
- Lomartire, S.; Gonçalves, A.M.M. An Overview of Potential Seaweed-Derived Bioactive Compounds for Pharmaceutical Applications. Mar. Drugs 2022, 20, 141. [Google Scholar] [CrossRef]
- Biris-Dorhoi, E.S.; Michiu, D.; Pop, C.R.; Rotar, A.M.; Tofana, M.; Pop, O.L.; Socaci, S.A.; Farcas, A.C. Macroalgae—A Sustainable Source of Chemical Compounds with Biological Activities. Nutrients 2020, 12, 3085. [Google Scholar] [CrossRef]
- Farag, M.A.; Abib, B.; Qin, Z.; Ze, X.; Ali, S.E. Dietary Macrominerals: Updated Review of Their Role and Orchestration in Human Nutrition throughout the Life Cycle with Sex Differences. Curr. Res. Food Sci. 2023, 6, 100450. [Google Scholar] [CrossRef]
- Mohamed, S.; Hashim, S.N.; Rahman, H.A. Seaweeds: A Sustainable Functional Food for Complementary and Alternative Therapy. Trends Food Sci. Technol. 2012, 23, 83–96. [Google Scholar] [CrossRef]
- Guiry, M.D.; Guiry, G.M. AlgaeBase. World-Wide Electronic Publication. 2024. Available online: https://www.algaebase.org/ (accessed on 22 January 2025).
- Paopun, Y.; Thanomchat, P.; Roopkham, C.; Umroong, P.; Pan-Utai, W.; Satmalee, P.; Kosawatpat, P.; Thongdang, B.; Tamtin, M. Structural Development of Marine Green Alga (Ulva rigida C. Agardh, 1823) during Cultivation. Trends Sci. 2023, 20, 6747. [Google Scholar] [CrossRef]
- Womersley, H.B.S. The Marine Benthic Flora of Southern Australia Part I. In Flora of Australia Supplementary Series; State Herbarium South Australia: Adelaide, Australia, 1984; p. 533. ISBN 064256826X. [Google Scholar]
- Freitas, M.V.; Inácio, L.G.; Martins, M.; Afonso, C.; Pereira, L.; Mouga, T. Primary Composition and Pigments of 11 Red Seaweed Species from the Center of Portugal. J. Mar. Sci. Eng. 2022, 10, 1168. [Google Scholar] [CrossRef]
- Cotas, J.; Leandro, A.; Pacheco, D.; Gonçalves, A.M.M.; Pereira, L. A Comprehensive Review of the Nutraceutical and Therapeutic Applications of Red Seaweeds (Rhodophyta). Life 2020, 10, 19. [Google Scholar] [CrossRef] [PubMed]
- Samaraweera, A.M.; Vidanarachchi, J.K.; Kurukulasuriya, M.S. Industrial Applications of Macroalgae. In Handbook of Marine Macroalgae: Biotechnology and Applied Phycology; John Wiley & Sons: Hoboken, NJ, USA, 2011. [Google Scholar] [CrossRef]
- World Bank Group. Seaweed Aquaculture for Food Security, Income Generation and Environmental Health in Tropical Developing Countries; World Bank: Washington, DC, USA, 2016. [Google Scholar]
- Rodríguez-Prieto, C.; Freshwater, D.W.; Hommersand, M.H. Gracilaria corallicola and G. multipartita (Gracilariales, Rhodophyta), Two Related Flattened European Species. Eur. J. Phycol. 2016, 51, 444–460. [Google Scholar] [CrossRef]
- Mouradi, A.; Chikhaoui, M.; Fekhaou, M.; Akallal, R.; Guessous, A.; Givernaud, T. Variabilité Interspécifique de Trois Algues Rouges: Hypnea Musciformis, Gracilaria multipartita et Gelidium sesquipedale (Rhodophycées) de La Côte Atlantique Marocaine. Afr. Sci. Rev. Int. Des. Sci. Technol. 2010, 2, 365–389. [Google Scholar] [CrossRef][Green Version]
- Givernaud, T.; El Gourji, A.; Mouradi-Givernaud, A.; Lemoine, Y.; Chiadmi, N.; Givernaud, T.; El Gourji, A.; Mouradi-Givernaud, A.; Lemoine, Y.; Chiadmi, N. Seasonal Variations of Growth and Agar Composition of Harvested along the Atlantic Coast of Morocco. HyBio 1999, 398–399, 167–172. [Google Scholar] [CrossRef]
- Yende, S.; Harle, U.; Chaugule, B. Therapeutic Potential and Health Benefits of Sargassum species. Pharmacogn. Rev. 2014, 8, 1. [Google Scholar] [CrossRef]
- Zhang, L.; Liao, W.; Huang, Y.; Wen, Y.; Chu, Y.; Zhao, C. Global Seaweed Farming and Processing in the Past 20 Years. Food Prod. Process. Nutr. 2022, 4, 23. [Google Scholar] [CrossRef]
- Milledge, J.J.; Nielsen, B.V.; Bailey, D. High-Value Products from Macroalgae: The Potential Uses of the Invasive Brown Seaweed, Sargassum muticum. Rev. Environ. Sci. Biotechnol. 2016, 15, 67–88. [Google Scholar] [CrossRef]
- Englen, A.H.; Serebryakova, A.; Ang, P.; Simmons, K.B. Climate-Driven Trophic Cascades Affecting Seabirds around the British Isles. In Oceanography and Marine Biology; Oxford University Press: Oxford, UK, 2015. [Google Scholar]
- Blanco, A.; Larrinaga, A.R.; Neto, J.M.; Troncoso, J.; Méndez, G.; Domínguez-Lapido, P.; Ovejero, A.; Pereira, L.; Mouga, T.M.; Gaspar, R.; et al. Spotting Intruders: Species Distribution Models for Managing Invasive Intertidal Macroalgae. J. Environ. Manag. 2021, 281, 111861. [Google Scholar] [CrossRef]
- Shefer, S.; Israel, A.; Golberg, A.; Chudnovsky, A. Carbohydrate-Based Phenotyping of the Green Macroalga Ulva fasciata Using near-Infrared Spectrometry: Potential Implications for Marine Biorefinery. Bot. Mar. 2017, 60, 219–228. [Google Scholar] [CrossRef][Green Version]
- Power, A.; Chapman, J.; Hoffman, L.; Cozzolino, D. Shining Light on Seaweed-the Utilization of Vibrational Spectroscopy and Machine Learning in the Seaweed Industry. Int. J. Food Sci. Technol. 2025, 60, vvaf012. [Google Scholar] [CrossRef]
- Ptak, S.H.; Sanchez, L.; Fretté, X.; Kurouski, D. Complementarity of Raman and Infrared Spectroscopy for Rapid Characterization of Fucoidan Extracts. Plant Methods 2021, 17, 130. [Google Scholar] [CrossRef] [PubMed]
- Mayers, J.J.; Flynn, K.J.; Shields, R.J. Rapid Determination of Bulk Microalgal Biochemical Composition by Fourier-Transform Infrared Spectroscopy. Bioresour. Technol. 2013, 148, 215–220. [Google Scholar] [CrossRef]
- Cebi, N.; Bekiroglu, H.; Erarslan, A. Nondestructive Metabolomic Fingerprinting: FTIR, NIR and Raman Spectroscopy in Food Screening. Molecules 2023, 28, 7933. [Google Scholar] [CrossRef]
- Vandanjon, L.; Burlot, A.-S.; Zamanileha, E.F.; Douzenel, P.; Ravelonandro, P.H.; Bourgougnon, N.; Bedoux, G. The Use of FTIR Spectroscopy as a Tool for the Seasonal Variation Analysis and for the Quality Control of Polysaccharides from Seaweeds. Mar. Drugs 2023, 21, 482. [Google Scholar] [CrossRef]
- Domenighini, A.; Giordano, M. Fourier Transform Infrared Spectroscopy of Microalgae as a Novel Tool for Biodiversity Studies, Species Identification, and the Assessment of Water Quality. J. Phycol. 2009, 45, 522–531. [Google Scholar] [CrossRef]
- Laurens, L.M.L.; Wolfrum, E.J. Feasibility of Spectroscopic Characterization of Algal Lipids: Chemometric Correlation of NIR and FTIR Spectra with Exogenous Lipids in Algal Biomass. BioEnergy Res. 2010, 4, 22–35. [Google Scholar] [CrossRef]
- AOAC. Official Methods of Analysis, 20th ed.; Association Official Analytical: Gaithersburg, MA, USA, 2016. [Google Scholar]
- Rodrigues, D.; Freitas, A.C.; Pereira, L.; Rocha-Santos, T.A.P.; Vasconcelos, M.W.; Roriz, M.; Rodríguez-Alcalá, L.M.; Gomes, A.M.P.; Duarte, A.C. Chemical Composition of Red, Brown and Green Macroalgae from Buarcos Bay in Central West Coast of Portugal. Food Chem. 2015, 183, 197–207. [Google Scholar] [CrossRef]
- Angell, A.R.; Mata, L.; de Nys, R.; Paul, N.A. The Protein Content of Seaweeds: A Universal Nitrogen-to-Protein Conversion Factor of Five. J. Appl. Phycol. 2016, 28, 511–524. [Google Scholar] [CrossRef]
- McLoughlin, C.; McKie, V.A.; McCleary, B. V Validation of the Test Method—Determination of Available Carbohydrates in Cereal and Cereal Products, Dairy Products, Vegetables, Fruit, and Related Food Products and Animal Feeds: Collaborative Study, Final Action 2020.07. J. AOAC Int. 2023, 106, 370–383. [Google Scholar] [CrossRef] [PubMed]
- Velayudhan, D.E.; Kim, I.H.; Nyachoti, C.M. Characterization of Dietary Energy in Swine Feed and Feed Ingredients: A Review of Recent Research Results. Asian-Australas. J. Anim. Sci. 2015, 28, 1–13. [Google Scholar] [CrossRef] [PubMed]
- Shurson, G.C.; Hung, Y.T.; Jang, J.C.; Urriola, P.E. Measures Matter—Determining the True Nutri-Physiological Value of Feed Ingredients for Swine. Animals 2021, 11, 1259. [Google Scholar] [CrossRef] [PubMed]
- Regulation (EU) No 1169/2011 of the European Parliament and of the Council on the provision of food information to consumers, of 25 October 2011. Of. J. Eur. Union 2011, 304, 16–83.
- Pedro, S.I.; Fernandes, T.A.; Luís, Â.; Antunes, A.M.M.; Gonçalves, J.C.; Gominho, J.; Gallardo, E.; Anjos, O. First Chemical Profile Analysis of Acacia Pods. Plants 2023, 12, 3486. [Google Scholar] [CrossRef]
- Taboada, C.; Millán, R.; Míguez, I. Composition, Nutritional Aspects and Effect on Serum Parameters of Marine Algae Ulva rigida. J. Sci. Food Agric. 2010, 90, 445–449. [Google Scholar] [CrossRef]
- Trigui, M.; Gasmi, L.; Zouari, I.; Tounsi, S. Seasonal Variation in Phenolic Composition, Antibacterial and Antioxidant Activities of Ulva rigida (Chlorophyta) and Assessment of Antiacetylcholinesterase Potential. J. Appl. Phycol. 2013, 25, 319–328. [Google Scholar] [CrossRef]
- Freitas, M.V.; Mouga, T.; Correia, A.P.; Afonso, C.; Baptista, T. New Insights on the Sporulation, Germination, and Nutritional Profile of Gracilaria gracilis (Rhodophyta) Grown under Controlled Conditions. J. Mar. Sci. Eng. 2021, 9, 562. [Google Scholar] [CrossRef]
- Paiva, L.; Lima, E.; Neto, A.I.; Marcone, M.; Baptista, J. Nutritional and Functional Bioactivity Value of Selected Azorean Macroalgae: Ulva Compressa, Ulva rigida, Gelidium microdon, and Pterocladiella capillacea. J. Food Sci. 2017, 82, 1757–1764. [Google Scholar] [CrossRef]
- Soares, C.; Sousa, S.; Machado, S.; Vieira, E.; Carvalho, A.P.; Ramalhosa, M.J.; Morais, S.; Correia, M.; Oliva-Teles, T.; Domingues, V.F.; et al. Bioactive Lipids of Seaweeds from the Portuguese North Coast: Health Benefits versus Potential Contamination. Foods 2021, 10, 1366. [Google Scholar] [CrossRef]
- Kumari, P.; Bijo, A.J.; Mantri, V.A.; Reddy, C.R.K.; Jha, B. Fatty Acid Profiling of Tropical Marine Macroalgae: An Analysis from Chemotaxonomic and Nutritional Perspectives. Phytochemistry 2013, 86, 44–56. [Google Scholar] [CrossRef] [PubMed]
- Paiva, L.; Lima, E.; Neto, A.I.; Marcone, M.; Baptista, J. Health-Promoting Ingredients from Four Selected Azorean Macroalgae. Food Res. Int. 2016, 89, 432–443. [Google Scholar] [CrossRef] [PubMed]
- Paiva, L.S. Development of Extraction and Quantification Technologies for the Main Nutritional Components of Macroalgae from the Azores Coast with a View to Their Utilisation as Food Supplements; Universidade dos Açores: Açores, Portugal, 2014. [Google Scholar]
- Milinovic, J. Nutritional Benefits of Edible Macroalgae from the Central Portuguese Coast: Inclusion of Low-Calorie ‘Sea Vegetables’ in Human Diet. Int. J. Environ. Sci. Nat. Resour. 2021, 28, 556250. [Google Scholar] [CrossRef]
- Patarra, R.F.; Paiva, L.; Neto, A.I.; Lima, E.; Baptista, J. Nutritional Value of Selected Macroalgae. J. Appl. Phycol. 2011, 23, 205–208. [Google Scholar] [CrossRef]
- Salman, A.; Ferreira, A.; Soares, J.; Souza, J. Methodologies for Evaluating Feed for Domestic Ruminants, 1st ed.; Embrapa: Porto Velho, Brazil, 2010. [Google Scholar]
- Kadam, S.U.; Álvarez, C.; Tiwari, B.K.; O’Donnell, C.P. Extraction and Characterization of Protein from Irish Brown Seaweed Ascophyllum nodosum. Food Res. Int. 2017, 99, 1021–1027. [Google Scholar] [CrossRef]
- Vieira, E.F.; Soares, C.; Machado, S.; Correia, M.; Ramalhosa, M.J.; Oliva-teles, M.T.; Paula Carvalho, A.; Domingues, V.F.; Antunes, F.; Oliveira, T.A.C.; et al. Seaweeds from the Portuguese Coast as a Source of Proteinaceous Material: Total and Free Amino Acid Composition Profile. Food Chem. 2018, 269, 264–275. [Google Scholar] [CrossRef]
- Peñalver, R.; Lorenzo, J.M.; Ros, G.; Amarowicz, R.; Pateiro, M.; Nieto, G. Seaweeds as a Functional Ingredient for a Healthy Diet. Mar. Drugs 2020, 18, 301. [Google Scholar] [CrossRef]
- Zhou, A.Y.; Robertson, J.; Hamid, N.; Ma, Q.; Lu, J. Changes in Total Nitrogen and Amino Acid Composition of New Zealand Undaria Pinnatifida with Growth, Location and Plant Parts. Food Chem. 2015, 186, 319–325. [Google Scholar] [CrossRef]
- Pangestuti, R.; Kim, S.K. Seaweed Proteins, Peptides, and Amino Acids. In Seaweed Sustainability: Food and Non-Food Applications; Academic Press Inc.: Cambridge, MA, USA, 2015. [Google Scholar]
- Mišurcová, L.; Machů, L.; Orsavová, J. Seaweed Minerals as Nutraceuticals. In Advances in Food and Nutrition Research; Academic Press Inc.: Cambridge, MA, USA, 2011; Volume 64. [Google Scholar]
- World Health Organization. Sodium Intake for Adults and Children; World Health Organization: Geneva, Switzerland, 2012. [Google Scholar]
- Circuncisão, A.R.S. Analysing the Nutritional Profile of Ulva rigida Cultivated under Different Conditions in an Integrated Multi-Trophic Aquaculture System; University of Aveiro: Aveiro, Portugal, 2017. [Google Scholar]
- Circuncisão, A.R.; Catarino, M.D.; Cardoso, S.M.; Silva, A.M.S. Minerals from Macroalgae Origin: Health Benefits and Risks for Consumers. Mar. Drugs 2018, 16, 400. [Google Scholar] [CrossRef]
- Thadhani, V.M.; Lobeer, A.; Zhang, W.; Irfath, M.; Su, P.; Edirisinghe, N.; Amaratunga, G. Comparative Analysis of Sugar and Mineral Content of Sargassum Spp. Collected from Different Coasts of Sri Lanka. J. Appl. Phycol. 2019, 31, 2643–2651. [Google Scholar] [CrossRef]
- Gamero-Vega, G.; Palacios-Palacios, M.; Quitral, V. Nutritional Composition and Bioactive Compounds of Red Seaweed: A Mini-Review. J. Food Nutr. Res. 2020, 8, 431–440. [Google Scholar] [CrossRef]
- Cardoso, S.; Carvalho, L.; Silva, P.; Rodrigues, M.; Pereira, O.; Pereira, L. Bioproducts from Seaweeds: A Review with Special Focus on the Iberian Peninsula. Curr. Org. Chem. 2014, 18, 896–917. [Google Scholar] [CrossRef]
- Adluri, R.S.; Zhan, L.; Bagchi, M.; Maulik, N.; Maulik, G. Comparative Effects of a Novel Plant-Based Calcium Supplement with Two Common Calcium Salts on Proliferation and Mineralization in Human Osteoblast Cells. Mol. Cell Biochem. 2010, 340, 73–80. [Google Scholar] [CrossRef] [PubMed]
- Jose, J.; Xavier, J. Study of Mineral and Nutritional Composition of Some Seaweeds Found along the Coast of Gulf of Mannar, India. Plant Sci. Today 2020, 7, 631–637. [Google Scholar] [CrossRef]
- MacArtain, P.; Gill, C.I.R.; Brooks, M.; Campbell, R.; Rowland, I.R. Nutritional Value of Edible Seaweeds. Nutr. Rev. 2007, 65, 535–543. [Google Scholar] [CrossRef]
- Lomartire, S.; Marques, J.C.; Gonçalves, A.M.M. An Overview to the Health Benefits of Seaweeds Consumption. Mar. Drugs 2021, 19, 341. [Google Scholar] [CrossRef]
- Contreras-Porcia, L.; Meynard, A.; López-Cristoffanini, C.; Latorre, N.; Kumar, M. Marine Metal Pollution and Effects on Seaweed Species. In Systems Biology of Marine Ecosystems; Springer: Cham, Switzerland, 2017. [Google Scholar] [CrossRef]
- Yates, A.A.; Schlicker, S.A.; Suitor, C.W. Dietary Reference Intakes for Vitamin A, Vitamin K, Arsenic, Boron, Chromium, Copper, Iodine, Iron, Manganese, Molybdenum, Nickel, Silicon, Vanadium, and Zinc; National Academies Press: Washington, DC, USA, 2001; ISBN 978-0-309-07279-3. [Google Scholar]
- Baghel, R.S.; Choudhary, B.; Pandey, S.; Pathak, P.K.; Patel, M.K.; Mishra, A. Rehashing Our Insight of Seaweeds as a Potential Source of Foods, Nutraceuticals, and Pharmaceuticals. Foods 2023, 12, 3642. [Google Scholar] [CrossRef]
- Leandro, A.; Pacheco, D.; Cotas, J.; Marques, J.C.; Pereira, L.; Gonçalves, A.M.M. Seaweed’s Bioactive Candidate Compounds to Food Industry and Global Food Security. Life 2020, 10, 140. [Google Scholar] [CrossRef]
- Hagen Rødde, R.S.; Vårum, K.M.; Larsen, B.A.; Myklestad, S.M. Seasonal and Geographical Variation in the Chemical Composition of the Red Alga Palmaria palmata (L.) Kuntze. Bot. Mar. 2004, 47, 125–133. [Google Scholar] [CrossRef]
- Trigueros, E.; Amaro, F.; de Pinho, P.G.; Oliveira, A.P. Comprehensive Analysis of Dehydrated Edible Macroalgae: Volatile Compounds, Chemical Profiles, Biological Activities, and Cytotoxicity. J. Appl. Phycol. 2025, 37, 597–615. [Google Scholar] [CrossRef]
- Yang, Y.; Zhang, M.; Alalawy, A.I.; Almutairi, F.M.; Al-Duais, M.A.; Wang, J.; Salama, E.S. Identification and Characterization of Marine Seaweeds for Biocompounds Production. Environ. Technol. Innov. 2021, 24, 101848. [Google Scholar] [CrossRef]
- Campbell, M.; Ortuño, J.; Koidis, A.; Theodoridou, K. The Use of Near-Infrared and Mid-Infrared Spectroscopy to Rapidly Measure the Nutrient Composition and the in Vitro Rumen Dry Matter Digestibility of Brown Seaweeds. Anim. Feed. Sci. Technol. 2022, 285, 115239. [Google Scholar] [CrossRef]
- Manley, M. Near-Infrared Spectroscopy and Hyperspectral Imaging: Non-Destructive Analysis of Biological Materials. Chem. Soc. Rev. 2014, 43, 8200–8214. [Google Scholar] [PubMed]
- Agelet, L.E.; Hurburgh, C.R. A Tutorial on near Infrared Spectroscopy and Its Calibration. Crit. Rev. Anal. Chem. 2010, 40, 246–260. [Google Scholar] [CrossRef]
- Simpson, M.B. Near-Infrared Spectroscopy for Process Analytical Chemistry: Theory, Technology and Implementation. In Process Analytical Technology; Blackwell Publishing: Oxford, UK, 2005. [Google Scholar]
- Nunes, N.; Rosa, G.P.; Ferraz, S.; Barreto, M.C.; de Carvalho, M.A.A.P. Fatty Acid Composition, TLC Screening, ATR-FTIR Analysis, Anti-Cholinesterase Activity, and in Vitro Cytotoxicity to A549 Tumor Cell Line of Extracts of 3 Macroalgae Collected in Madeira. J. Appl. Phycol. 2020, 32, 759–771. [Google Scholar] [CrossRef]
- Xia, L.; Li, H.; Song, S. Cell Surface Characterization of Some Oleaginous Green Algae. J. Appl. Phycol. 2016, 28, 2323–2332. [Google Scholar] [CrossRef]
- Dean, A.P.; Sigee, D.C.; Estrada, B.; Pittman, J.K. Using FTIR Spectroscopy for Rapid Determination of Lipid Accumulation in Response to Nitrogen Limitation in Freshwater Microalgae. Bioresour. Technol. 2010, 101, 4499–4507. [Google Scholar] [CrossRef]
- Cesário, M.T.; da Fonseca, M.M.R.; Marques, M.M.; de Almeida, M.C.M.D. Marine Algal Carbohydrates as Carbon Sources for the Production of Biochemicals and Biomaterials. Biotechnol. Adv. 2018, 36, 798–817. [Google Scholar]
- Pereira, L.; Amado, A.M.; Critchley, A.T.; van de Velde, F.; Ribeiro-Claro, P.J.A. Identification of Selected Seaweed Polysaccharides (Phycocolloids) by Vibrational Spectroscopy (FTIR-ATR and FT-Raman). Food Hydrocoll. 2009, 23, 1903–1909. [Google Scholar] [CrossRef]
- Niemi, C.; Mortensen, A.M.; Rautenberger, R.; Matsson, S.; Gorzsás, A.; Gentili, F.G. Rapid and Accurate Determination of Protein Content in North Atlantic Seaweed by NIR and FTIR Spectroscopies. Food Chem. 2023, 404, 134700. [Google Scholar] [CrossRef]
- Querido, W.; Kandel, S.; Pleshko, N. Applications of Vibrational Spectroscopy for Analysis of Connective Tissues. Molecules 2021, 26, 922. [Google Scholar] [CrossRef] [PubMed]
- Michalak, I.; Mironiuk, M.; Marycz, K. A Comprehensive Analysis of Biosorption of Metal Ions by Macroalgae Using ICP-OES, SEM-EDX and FTIR Techniques. PLoS ONE 2018, 13, e0205590. [Google Scholar] [CrossRef]
- Al-Shikaili, T.Y.; Thomasson, J.A.; Ge, Y.; Brown, L.; Brown, J. FTIR Transmission Spectroscopy for Measurement of Algae Neutral Lipids. Agric. Eng. Int. CIGR J. 2022, 24, 111–118. [Google Scholar]
- Yalçın, S.; Sezer, S.; Apak, R. Characterization and Lead(II), Cadmium(II), Nickel(II) Biosorption of Dried Marine Brown Macro Algae Cystoseira barbata. Environ. Sci. Pollut. Res. 2012, 19, 3118–3125. [Google Scholar] [CrossRef] [PubMed]
- Adar, F. Carotenoids-Their Resonance Raman Spectra and How They Can Be Helpful in Characterizing a Number of Biological Systems. Spectroscopy 2017, 32, 12–20. [Google Scholar]
- Rodrigues, D.; Costa-Pinto, A.R.; Sousa, S.; Vasconcelos, M.W.; Pintado, M.M.; Pereira, L.; Rocha-Santos, T.A.P.; Da Costa, J.P.; Silva, A.M.S.; Duarte, A.C.; et al. Sargassum Muticum and Osmundea Pinnatifida Enzymatic Extracts: Chemical, Structural, and Cytotoxic Characterization. Mar. Drugs 2019, 17, 209. [Google Scholar] [CrossRef]
- Ertani, A.; Francioso, O.; Tinti, A.; Schiavon, M.; Pizzeghello, D.; Nardi, S. Evaluation of Seaweed Extracts from Laminaria and Ascophyllum nodosum spp. As Biostimulants in Zea mays L. Using a Combination of Chemical, Biochemical and Morphological Approaches. Front. Plant Sci. 2018, 9, 428. [Google Scholar] [CrossRef]
Disclaimer/Publisher’s Note: The statements, opinions and data contained in all publications are solely those of the individual author(s) and contributor(s) and not of MDPI and/or the editor(s). MDPI and/or the editor(s) disclaim responsibility for any injury to people or property resulting from any ideas, methods, instructions or products referred to in the content. |
© 2025 by the authors. Licensee MDPI, Basel, Switzerland. This article is an open access article distributed under the terms and conditions of the Creative Commons Attribution (CC BY) license (https://creativecommons.org/licenses/by/4.0/).