1. Introduction
1.1. Main Features of the OC_Identifier Software
The functions of the OC_Identifier (Version 1.0.0, Release date 29 January 2025) primarily involve utilising pre-trained AI models for the cell identification of osteoclasts throughout their formation and maturation process. It is necessary to be able to insert the AI models into the OC_Identifier as easily as possible in order to be able to implement further developments without any programming effort. Furthermore, the OC_Identifier enables (1) the classification and recognition of four cell types (classes), (2) the calculation of the relative abundance of each cell type, (3) the user-friendly adjustment of the AI models, the selection and batch processing of the microscopy images and the selection of the analysis parameters, and (4) the output of the results in graphical and numerical form. The latter includes the separate storage of the analysed images with the labels of the identified cells of the different classes.
The software presented here was already used to examine osteoclasts that were cultured under different conditions (by varying the addition of differentiation factors or using pre-conditioned medium from a culture of mesenchymal stem cells). This work shows evidence of the comparability of morphological cell parameters (of the four classes mentioned) and biochemical analyses [
1].
1.2. Alternative Software for Cell Sorting and Identification
Certainly, the hype surrounding AI-based systems has led many researchers worldwide to consider the application of such systems in cell culture analysis. On the one hand, this is about the significant acceleration of data analysis, but on the other hand, it is also about the exclusion of human error or bias, which can arise from any individual observer. We have provided an overview of more or less established software alternatives in
Table 1 and will discuss the range of functions in comparison to OC_Identifier in particular. Furthermore, the advantages and limitations of these software are listed in
Table 2. It should be noted that the strong focus on osteoclast development, i.e., a specific but rapidly changing cell morphology, does not do justice to other software that may offer a much broader (cell) spectrum for analysis but would deliver poorer results in this specific case. This overview is not intended to discredit the individual programmes. OC_Identifier is specifically designed to focus on the developmental process of osteoclasts, meaning it is particularly suited to analyzing the cell culture process leading to mature osteoclasts. During this process, the AI model is trained to focus on the following: Monocytes in their initial state, early-stage osteoclasts with 1–2 nuclei, mature multinucleated osteoclasts, and unwanted cell types that may emerge during the culture process.
1.2.1. OC_Finder: An AI-Based Software for Osteoclast Classification
OC_Finder is an AI specifically designed for the classification of osteoclasts. It categorizes cells into two groups, namely Osteoclasts and Non-osteoclasts, labelling them with 0 and 1. In addition, the software is capable of counting both cell types. OC_Finder employs segmentation (a task in computer vision) that enables pixel-level analysis. Compared to object detection (which is utilized in OC_Identifier), segmentation involves higher computational complexity, longer processing times, and greater hardware requirements under the same conditions.
1.2.2. ImageJ: A Traditional Software for Cellular Analysis
ImageJ is a very powerful software for analyzing microscopic images. However, when applied to the classification and counting of osteoclasts at different maturation stages in optical microscopy images, its efficiency is even lower than manual counting. This limitation stems from the intricate morphological characteristics of osteoclasts. It is difficult to classify their maturation stage using conventional size and circularity filters (e.g., osteoclasts with 1–2 nuclei and those with ≥3 nuclei may exhibit similar sizes). Additionally, unstained living osteoclasts have low contrast against the background due to minimal differences in grayscale values, making it challenging to separate cells from the background using threshold adjustment (Image > Adjust > Threshold). Furthermore, ImageJ requires the use of the Watershed plugin (Process > Binary > Watershed) to manually split overlapping cells for accurate counting. Without this step, ImageJ may mistakenly merge multiple adjacent cells into a single cell, resulting in counting errors.
1.2.3. Cellpose
Cellpose is a cell segmentation software designed for biological microscopy images, particularly for fluorescence microscopy and brightfield microscopy. Additionally, Cellpose can be used as a plugin for ImageJ, allowing users to perform cell segmentation directly within the ImageJ environment. Cellpose excels at segmenting various types of cells in both 2D and 3D images. When analyzing cells with similar morphological characteristics, Cellpose demonstrates exceptional performance. However, due to algorithmic constraints, Cellpose primarily extracts areas, perimeters, and roundness as key features during AI analysis for image segmentation. Irregularly shaped osteoclasts are inherently difficult to classify accurately based solely on these features.
Moreover, Cellpose also employs segmentation (similar to OC_Finder), which is better suited to the morphological analysis of cells. When the primary goal is cell classification and counting, object detection (as used in OC_Identifier) operates at a significantly faster speed. Furthermore, Cellpose does not inherently display specific cell names or perform proportion calculations. Users must modify and adjust these functionalities at the code level. As a result, it has a certain threshold for use.
1.2.4. DeepCell
DeepCell is a high-precision cell segmentation software that is particularly distinguished for the morphological analysis and dynamic tracking of live cells, making it a leading tool in live-cell research. Its powerful capabilities come with high computational demands. DeepCell also employs segmentation, and due to its advanced dynamic tracking functionality, it requires even higher system specifications than Cellpose. Some functions even require an internet connection, as data must be uploaded to the DeepCell server (DeepCell.org) to complete processing, which may raise concerns about data privacy.
Moreover, DeepCell utilizes various APIs to provide different functionalities, instead of a standalone GUI: (Segmentation API: Automatically segments cells and outputs masks. Tracking API: Tracks the movement of live cells. Feature Extraction API: Extracts cellular properties such as area and roundness. Bioinformatics API: Performs data analysis on cellular attributes.) These functionalities pose a high barrier to entry. Users must be proficient in the Python API or Jupyter Notebook (V6.4.12.) and modify the code according to their specific requirements to fully utilize DeepCell’s capabilities. Additionally, DeepCell does not inherently support osteoclast recognition or proportion calculations, requiring users to implement these functionalities at the code level.
1.3. Workflow for Using the OC_Identifier
The procedure is described briefly as follows. Initially, the settings must be made. First, an AI model is selected (loaded), a folder with the images to be analysed is opened and the desired confidence value is set. Second, the selected images can be checked in the preview using the arrow keys. The AI analysis of the images is started by clicking on ‘Start AI test’. When the status changes to ‘finished’, the results can be checked. The visual representation can be seen in the large image window and the numerical results in the text box. Finally, the analysis results should be saved for later use.
2. Materials and Methods
The software was developed with YOLOv5 [
10] and PyQt [
11] (Ultralytics, YOLOv5, Riverbank Computing, PyQt, 2022) and created as an executable file (OC_Identifier_EN.exe of the Max Bergman Center for Biomaterials, YOLOv5 EXE version 1.0.0, 2025,
https://opara.zih.tu-dresden.de/handle/123456789/1247, Release date 29 January 2025 and accessed on 11 March 2025). Python was used for deep learning and the GUI application [
12,
13]. The software provided includes a pre-trained AI model named Demo_OC_Identifier.pt, which can be used directly for osteoclast identification. The AI training process is described elsewhere [
1] and summarised here briefly.
The AI model Demo_OC_Identifier.pt was trained using 5150 labelled images of osteoclasts and 1000 background images, collected between day 6 and day 10 of an OC culture. A two-stage training strategy was applied: firstly, an overfitting phase where identical images were used for training and validation was performed, ensuring the model captured dataset-specific features. Then, in the generalization phase, a separate validation set with new images was introduced to improve its performance on unseen data. Training was based on the YOLOv5m architecture, using pre-trained weights, an image size of 640 × 640, and the Stochastic Gradient Descent (SGD) optimizer. The process included 300 training epochs per phase, with additional fine-tuning iterations at 350, 500, and 600 epochs. Standard YOLOv5 data augmentation techniques—such as mosaic augmentation, HSV colour transformation, random cropping, scale jittering, and horizontal flipping—were applied to enhance robustness. Training followed YOLOv5’s standard workflow, using train.py for initial training and train_continue.py for iterative refinements. Regular evaluations, including confusion matrices and precision–recall curves, guided the training progress.
The minimum system requirements for the software are Windows 10, Intel i5 and 8 GB RAM (CPU only) (Intel Corporation, Santa Clara, CA, USA), whereas a GPU RTX 3060 (NVIDIA Corporation, Santa Clara, CA, USA), 16 GB RAM and CUDA 11.8 is recommended. In addition, at least 10 GB of free hard drive space should be available (the software itself requires approx. 4.6 GB, plus space for runtime and results files). The software was tested with these parameters and used successfully in routine operation. The AI model for osteoclast identification is to be regarded as a trial model and is undergoing continuous further development.
To use the software, unzip it after downloading. The folder contains the following files and directories:
_internal/ → Contains internal system files for the software.
ui/ → Contains the user interface files.
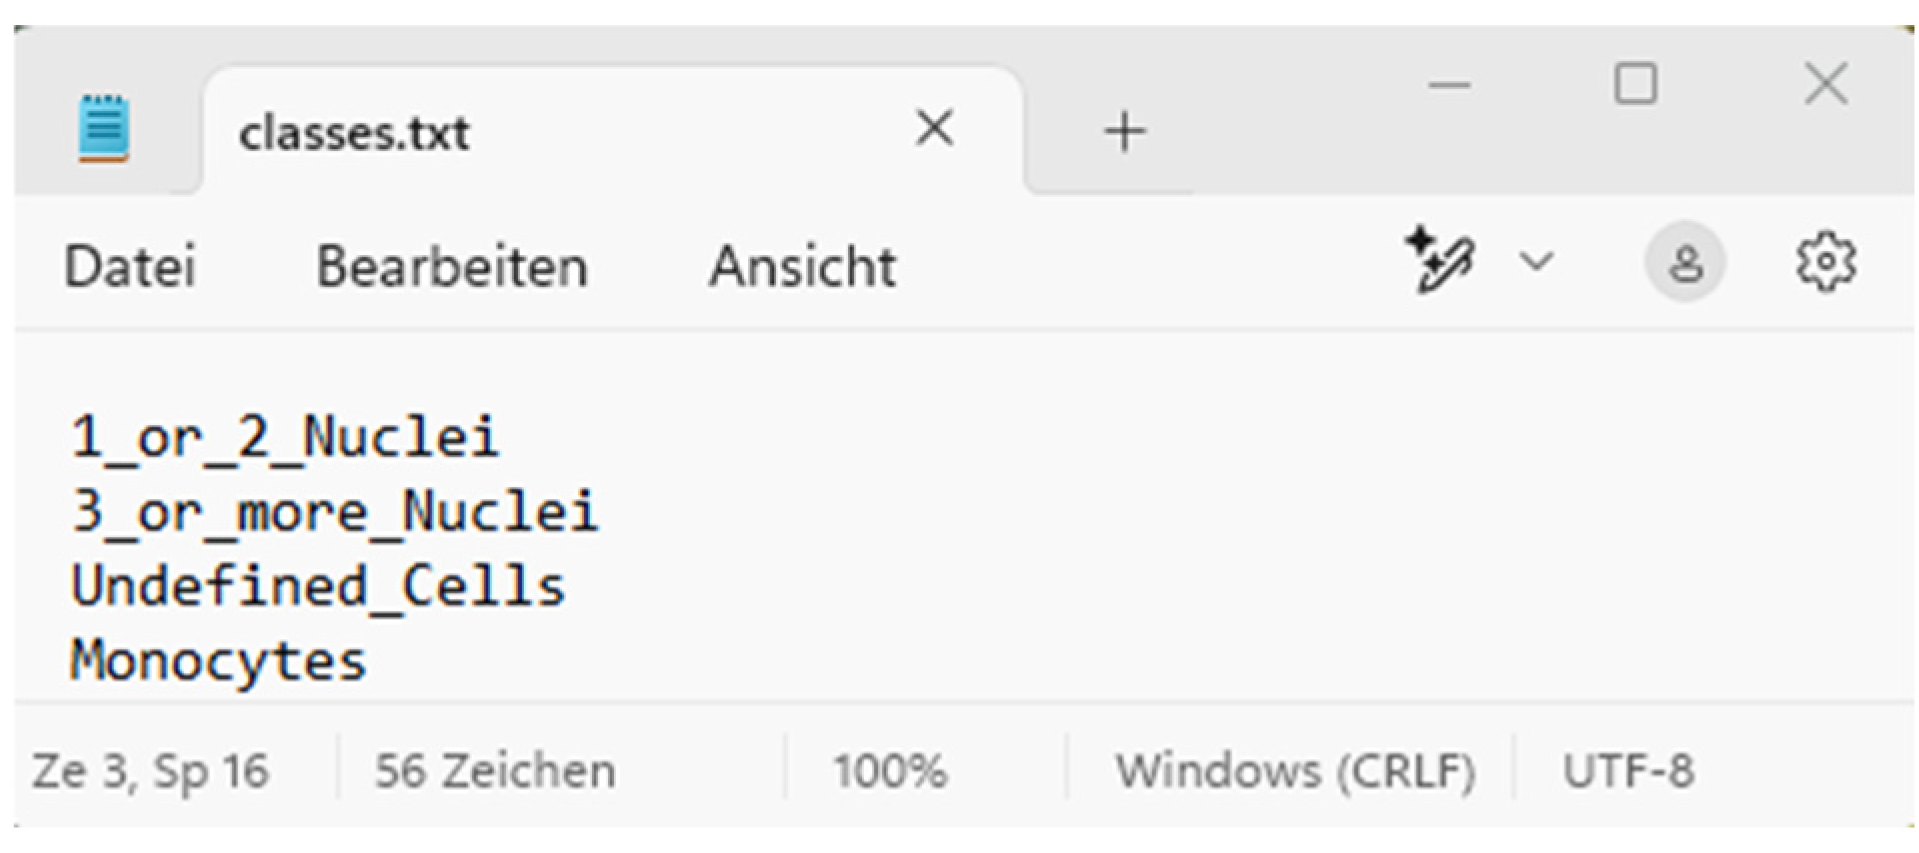
classes.txt → Provides a list of classes for object recognition.
OC_Identifier_EN.exe [
14] → Provides the executable file for using the software (please ensure the integrity of these documents). After starting the software for the first time, the following files and folders are also created:
debug.log → Contains logs for error analysis.
runs/ → Saves the results of the image analysis, including recognised objects and associated files. (You can delete them as required).
3. Results—The User Interface
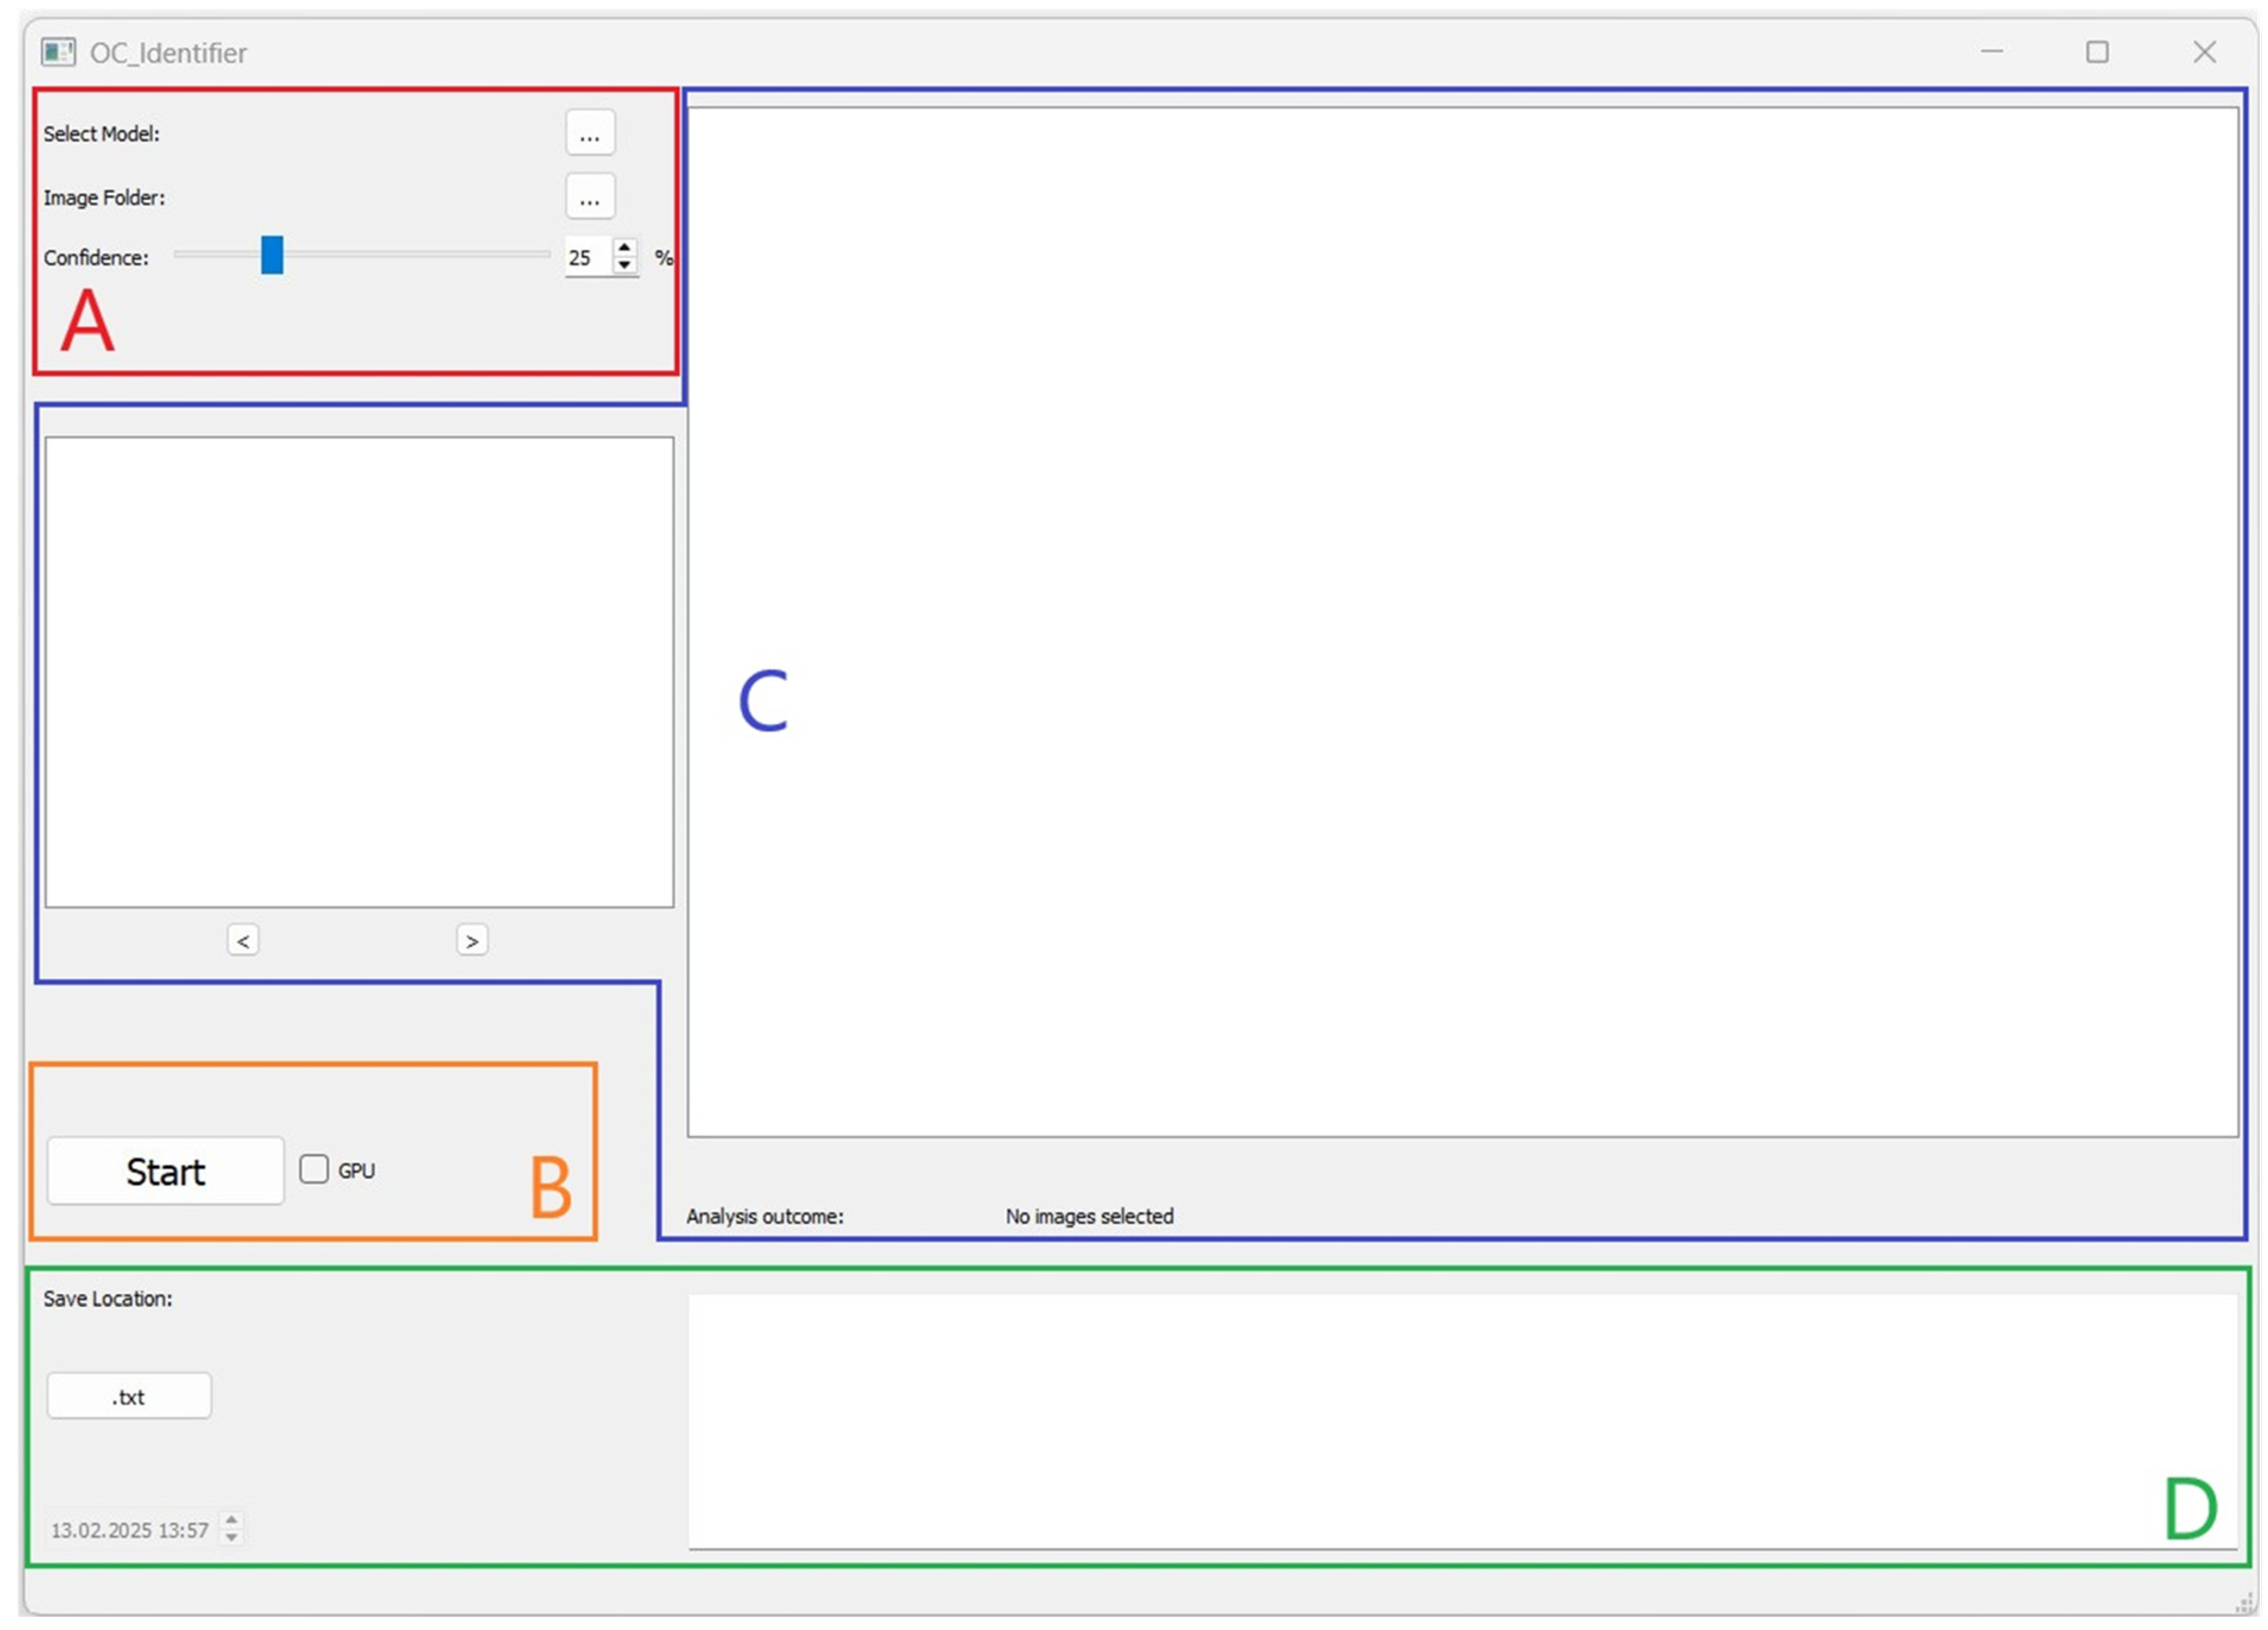
After starting the software, a user interface will open (
Figure 1). The user interface is divided into four areas (A, B, C, D), which are explained below, to structure the software’s operation.
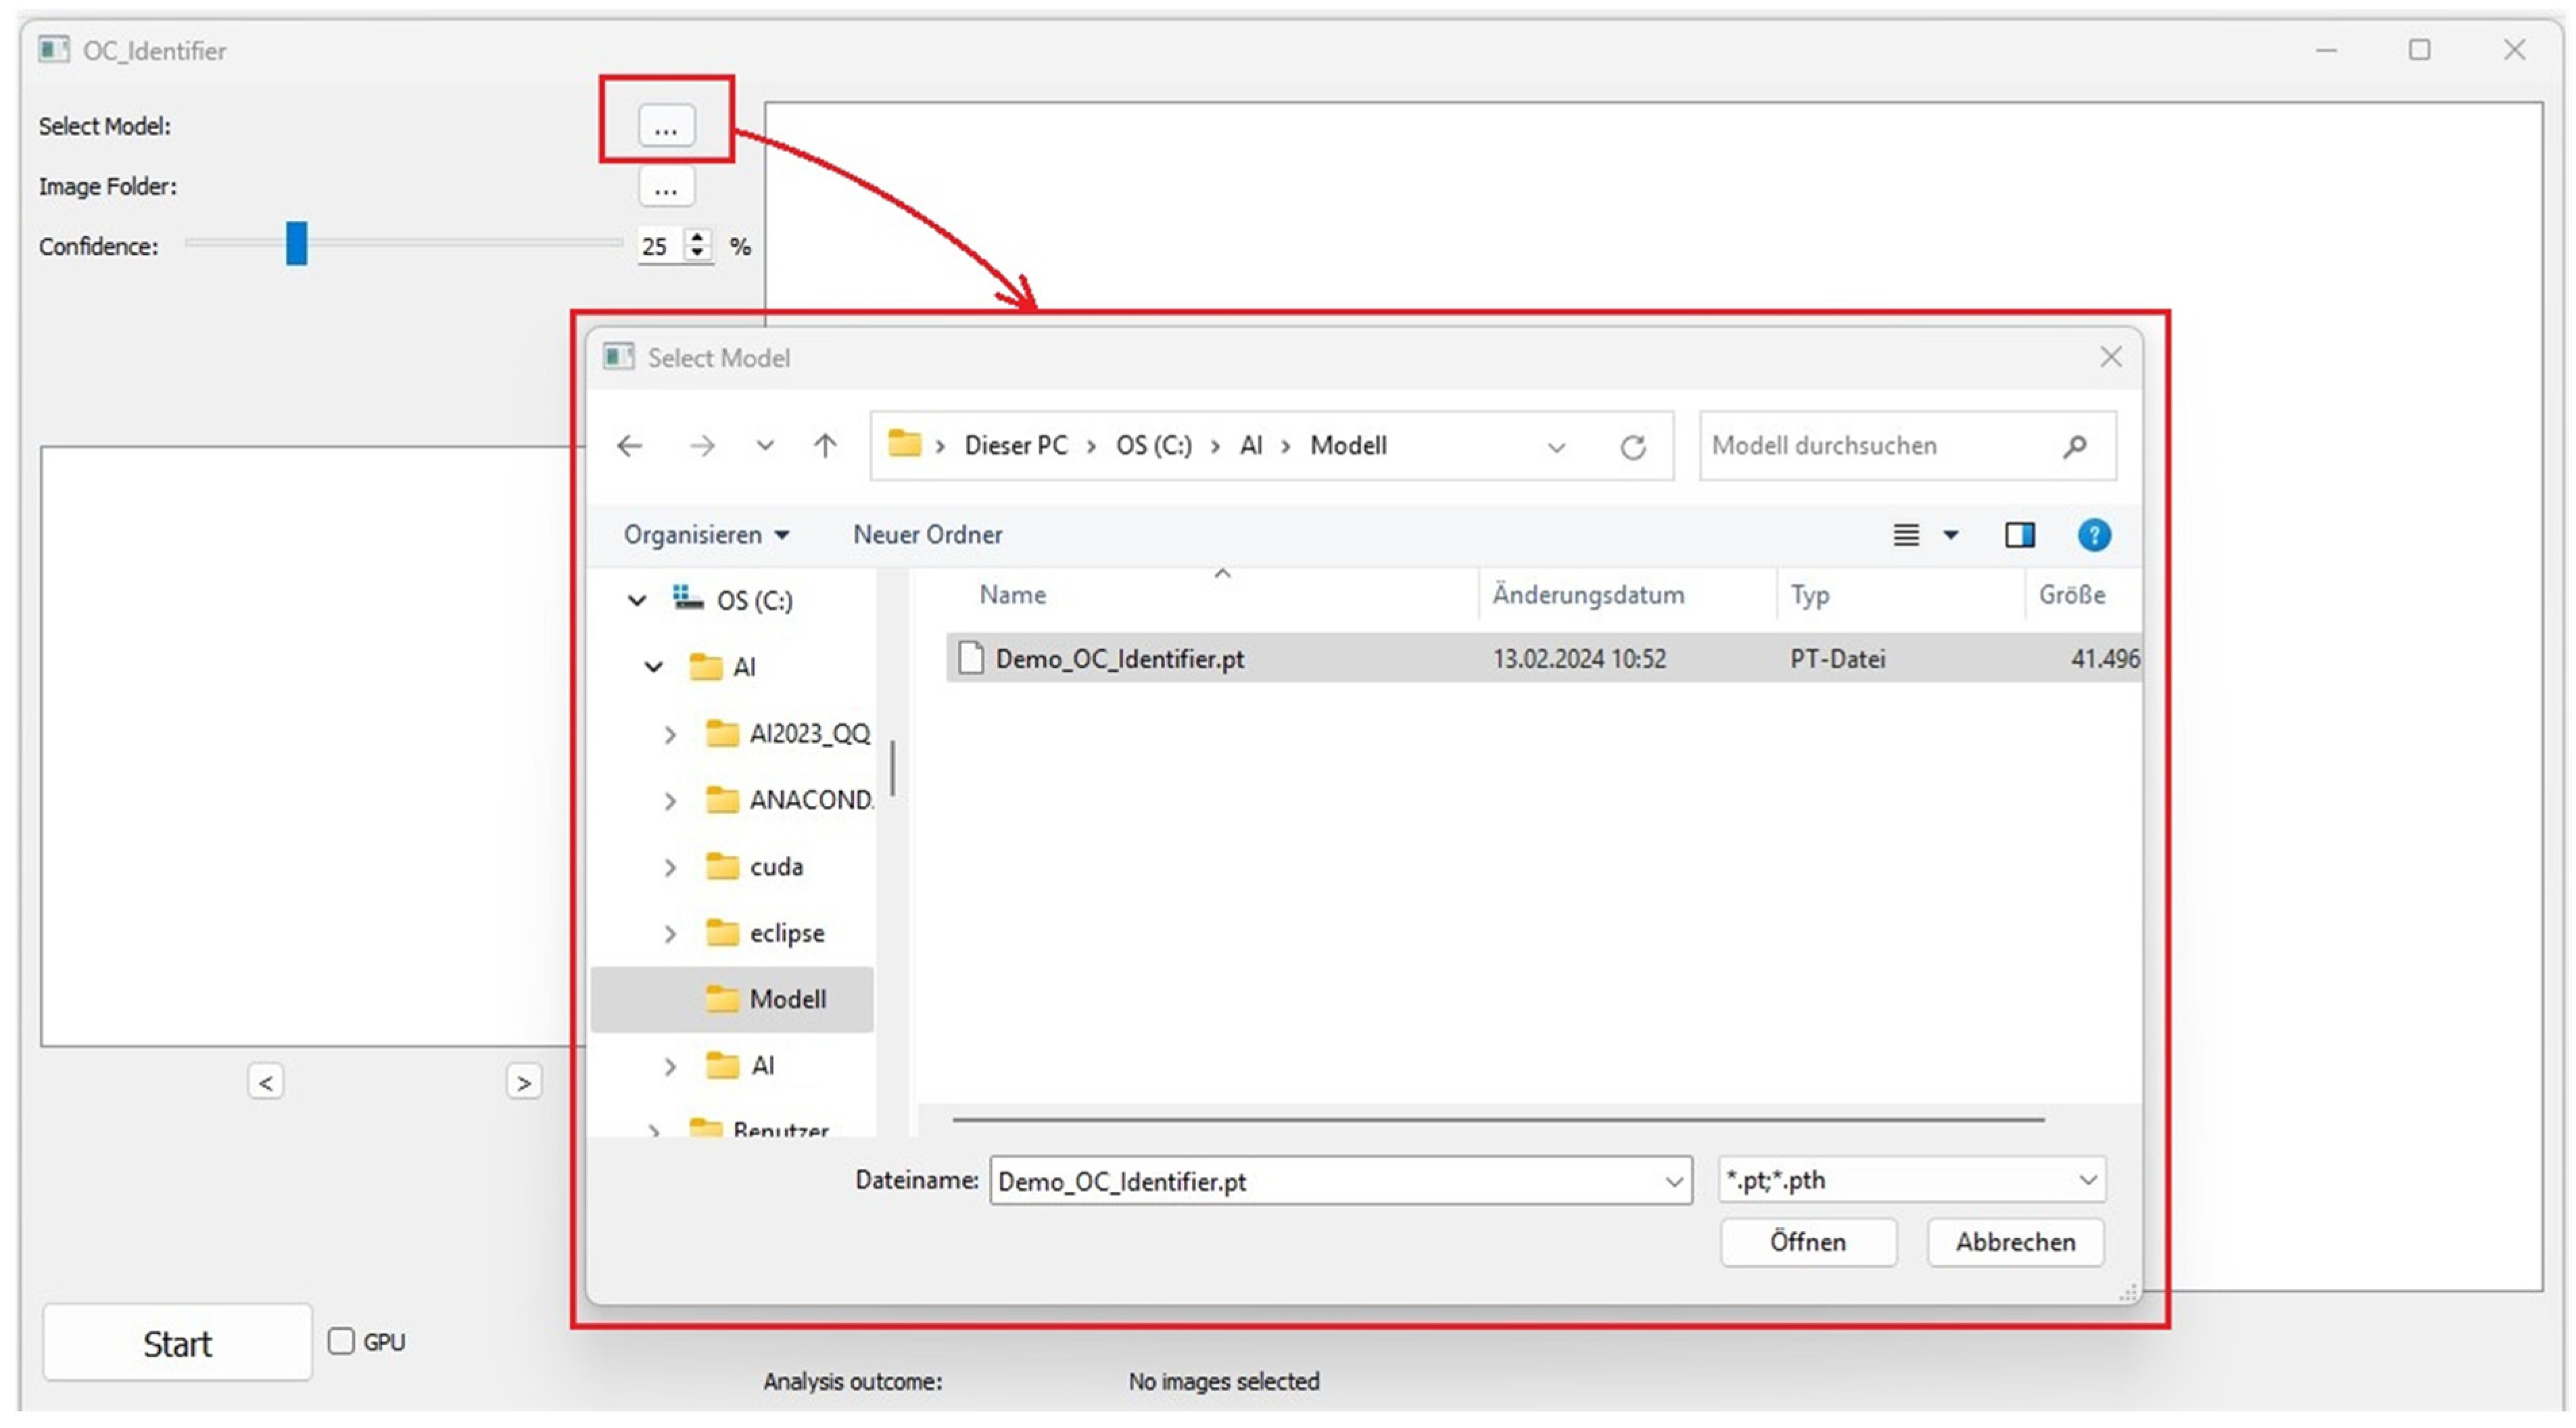
3.1. Area A: Selection and Settings
This section contains the buttons for selecting the AI model (
Figure 2). A test version of the AI model (Demo_OC_Identifier.pt) is included in the download [
7]. Additionally, users can further train this model by incorporating their own osteoclast images from their laboratory to develop a more tailored AI model suited to their specific research needs. The Demo_OC_Identifier.pt model supports the identification of four different cell types, which was recently shown [
1].
Alternatively, other AI model files in the format ‘.pt’ or ‘.pth’ can be loaded, allowing the differentiation of the four cell types (Classes: 1_or_2_Nuclei, 3_or_more_Nuclei, Undefined Cells, Monocytes). Please select the desired AI model for classification.
The image folder containing the images to be analysed in the *.jpg, *.bmp or *.png format is then selected in the same way.
The confidence value is then set (in %). Low confidence values can lead to the false positive identification of objects in the image, while a very high confidence value can result in very few cells being assigned to one of the four classes (high false negative result). We therefore generally recommend a confidence level of 25% for image analysis.
3.2. Area B: Starting the Test and Progress Status
Once the settings are complete, image classification begins by clicking the button ‘Start’. During the analysis, the status displayed next to the button is ‘processing. As soon as the analysis is complete, the status changes from ‘progressing’ to ‘Done’. Once the AI test has been completed, the test results are displayed on the right-hand side of the user interface.
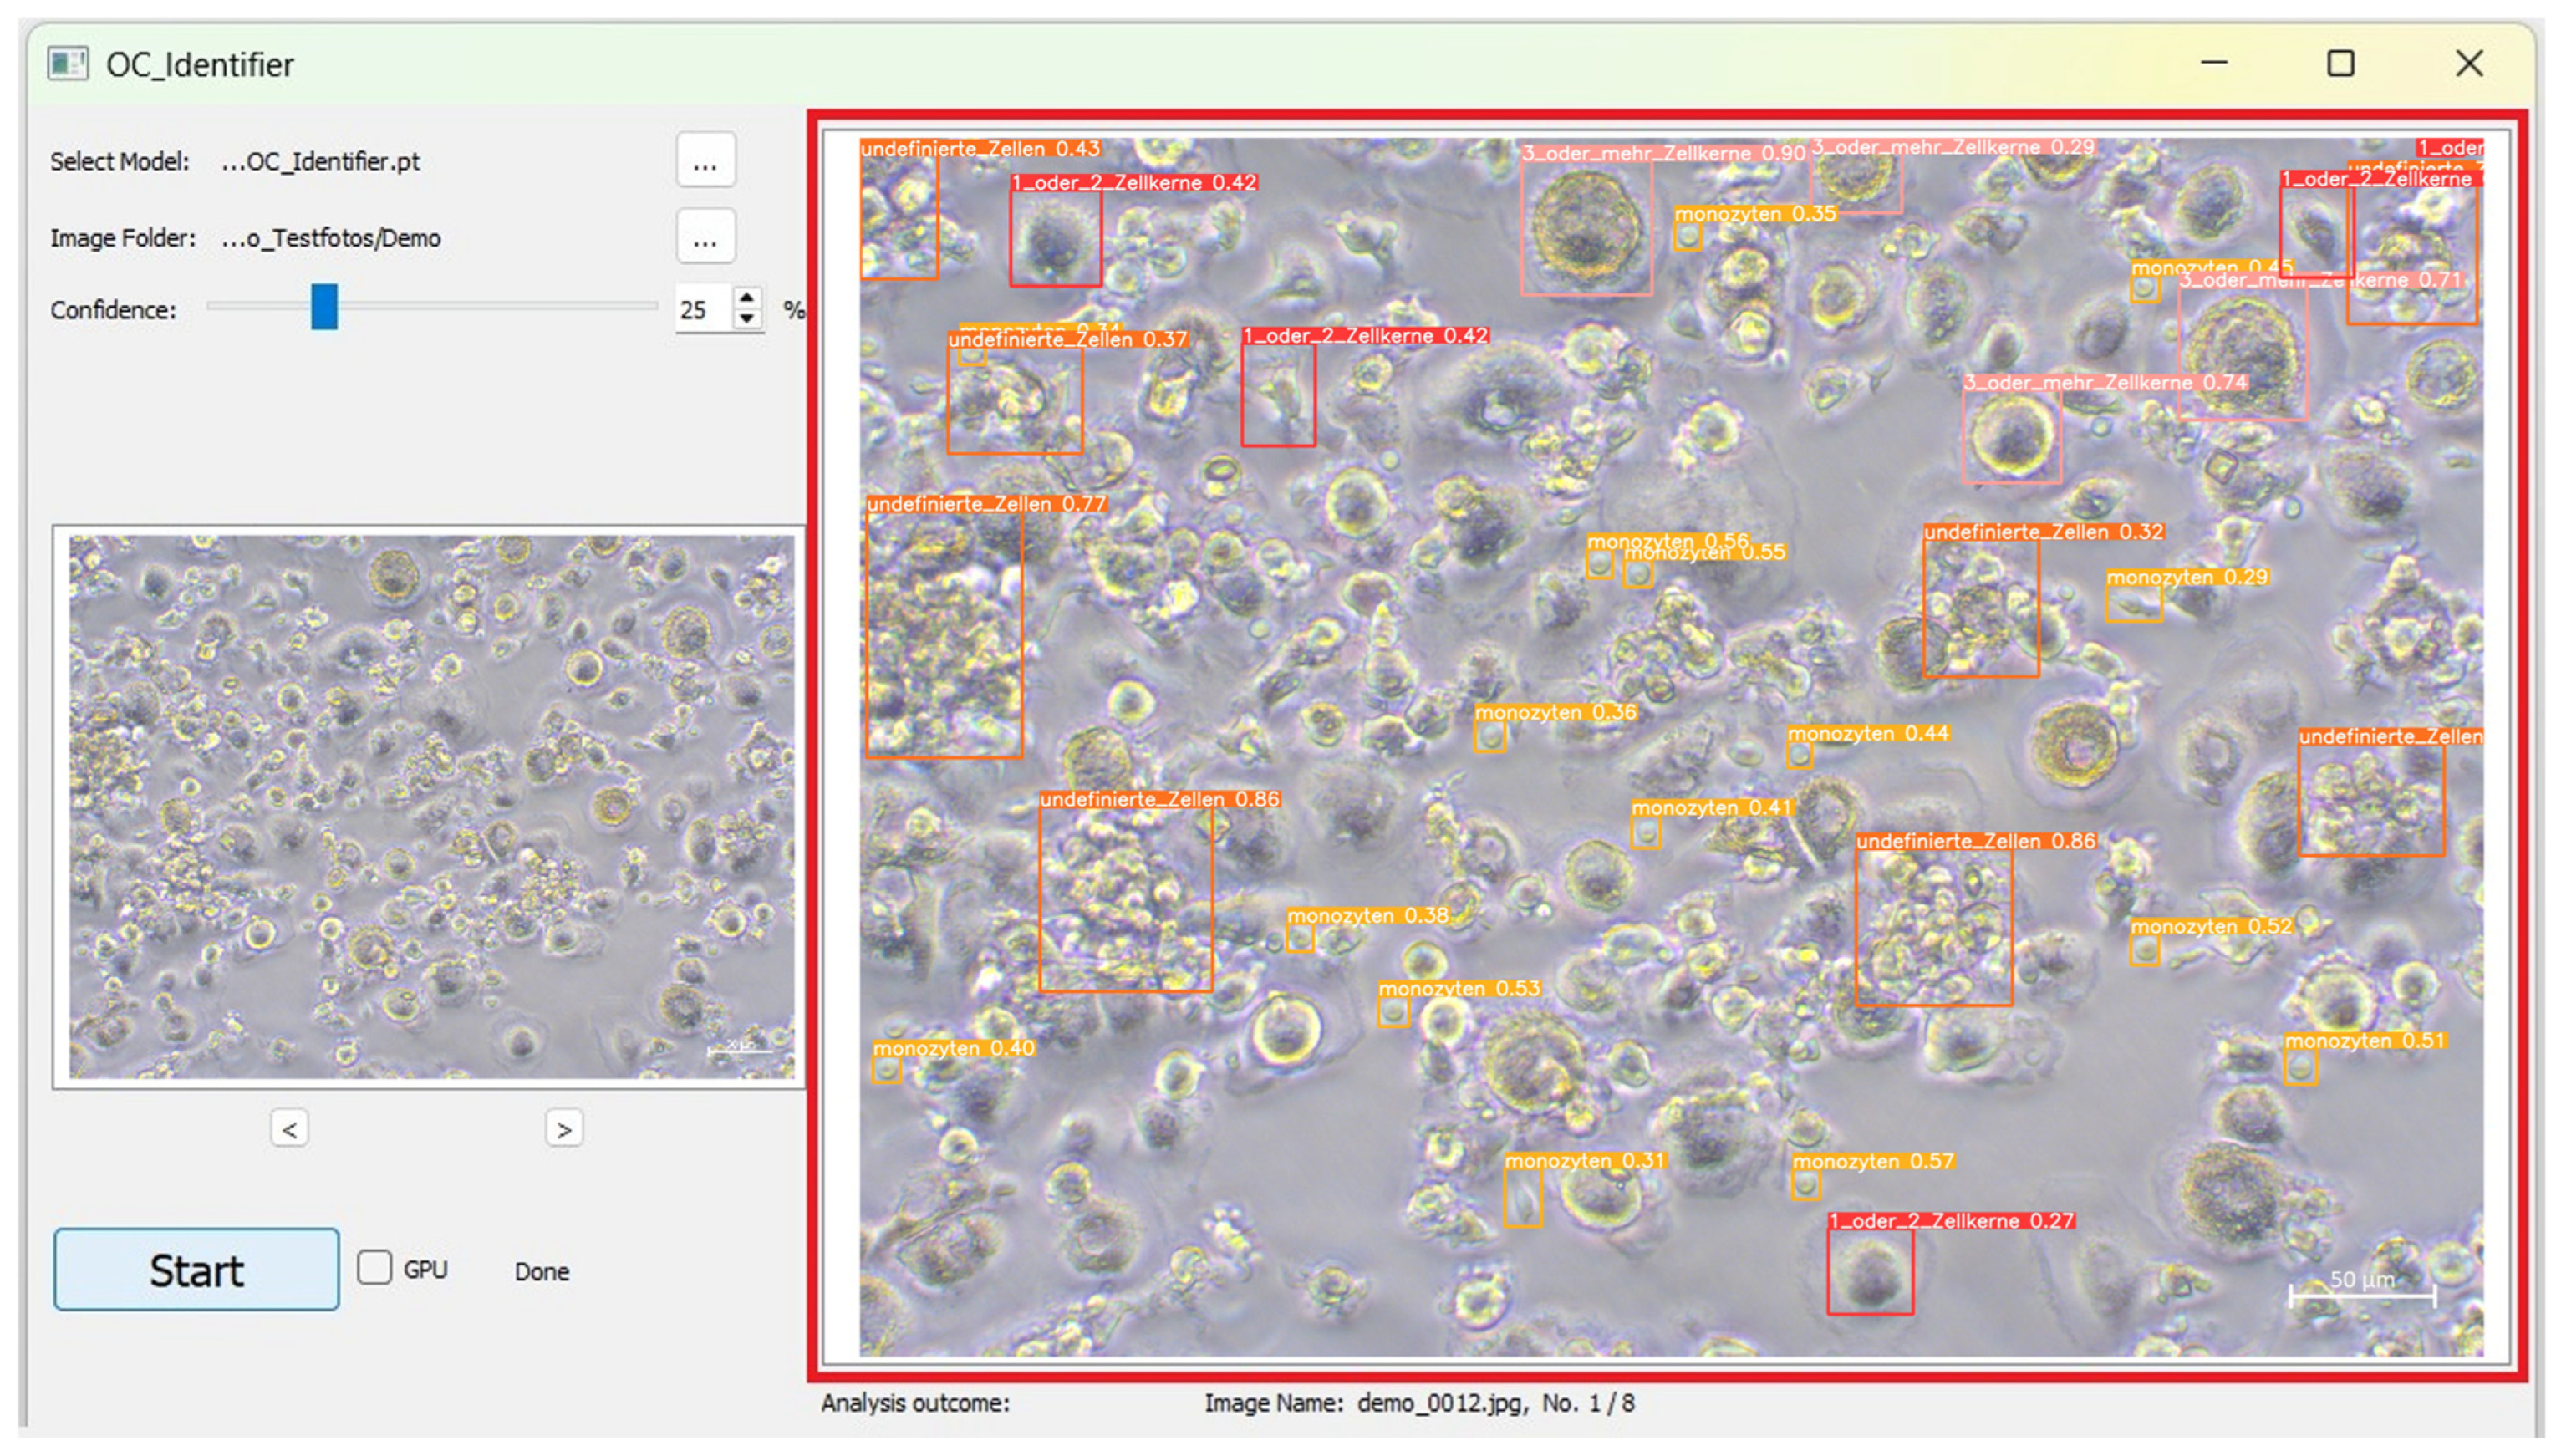
3.3. Area C: Graphical Display and Navigation
Area C is the visualisation area that allows the user to intuitively understand how the AI processed the images. The numerical evaluation is also based on the cells of the four classes marked in the images. These classes ranging from 0 to 3 are, namely, (0) 1_or_2_Nuclei, (1) 3_or_more_Nuclei, (2) Monocytes, and (3) Undefined Cells (
Figure 3).
The two arrows below the preview image (‘<’ and ‘>’,
Figure 4) can be used to scroll through the original images and the images evaluated by the AI simultaneously. This makes it possible to navigate between the images in the folder and to subjectively evaluate the dependence of the AI cell identification on the image quality (exposure, contrast, cell density, etc.). Text information containing details about the image (e.g., file name, metadata) appears below the large image window. When changing the image, the text information is automatically updated.
After completing the AI Test process, the analysed image with the identified cells and their categories are displayed in the large image window. The coloured frames correspond to the cell classes and the respective confidence value for each individual cell identification is displayed directly in the frame surrounding the cell (
Figure 5). This number represents the confidence score, indicating how confident the AI is in its identification.
3.4. Area D: Results of Cell Classification
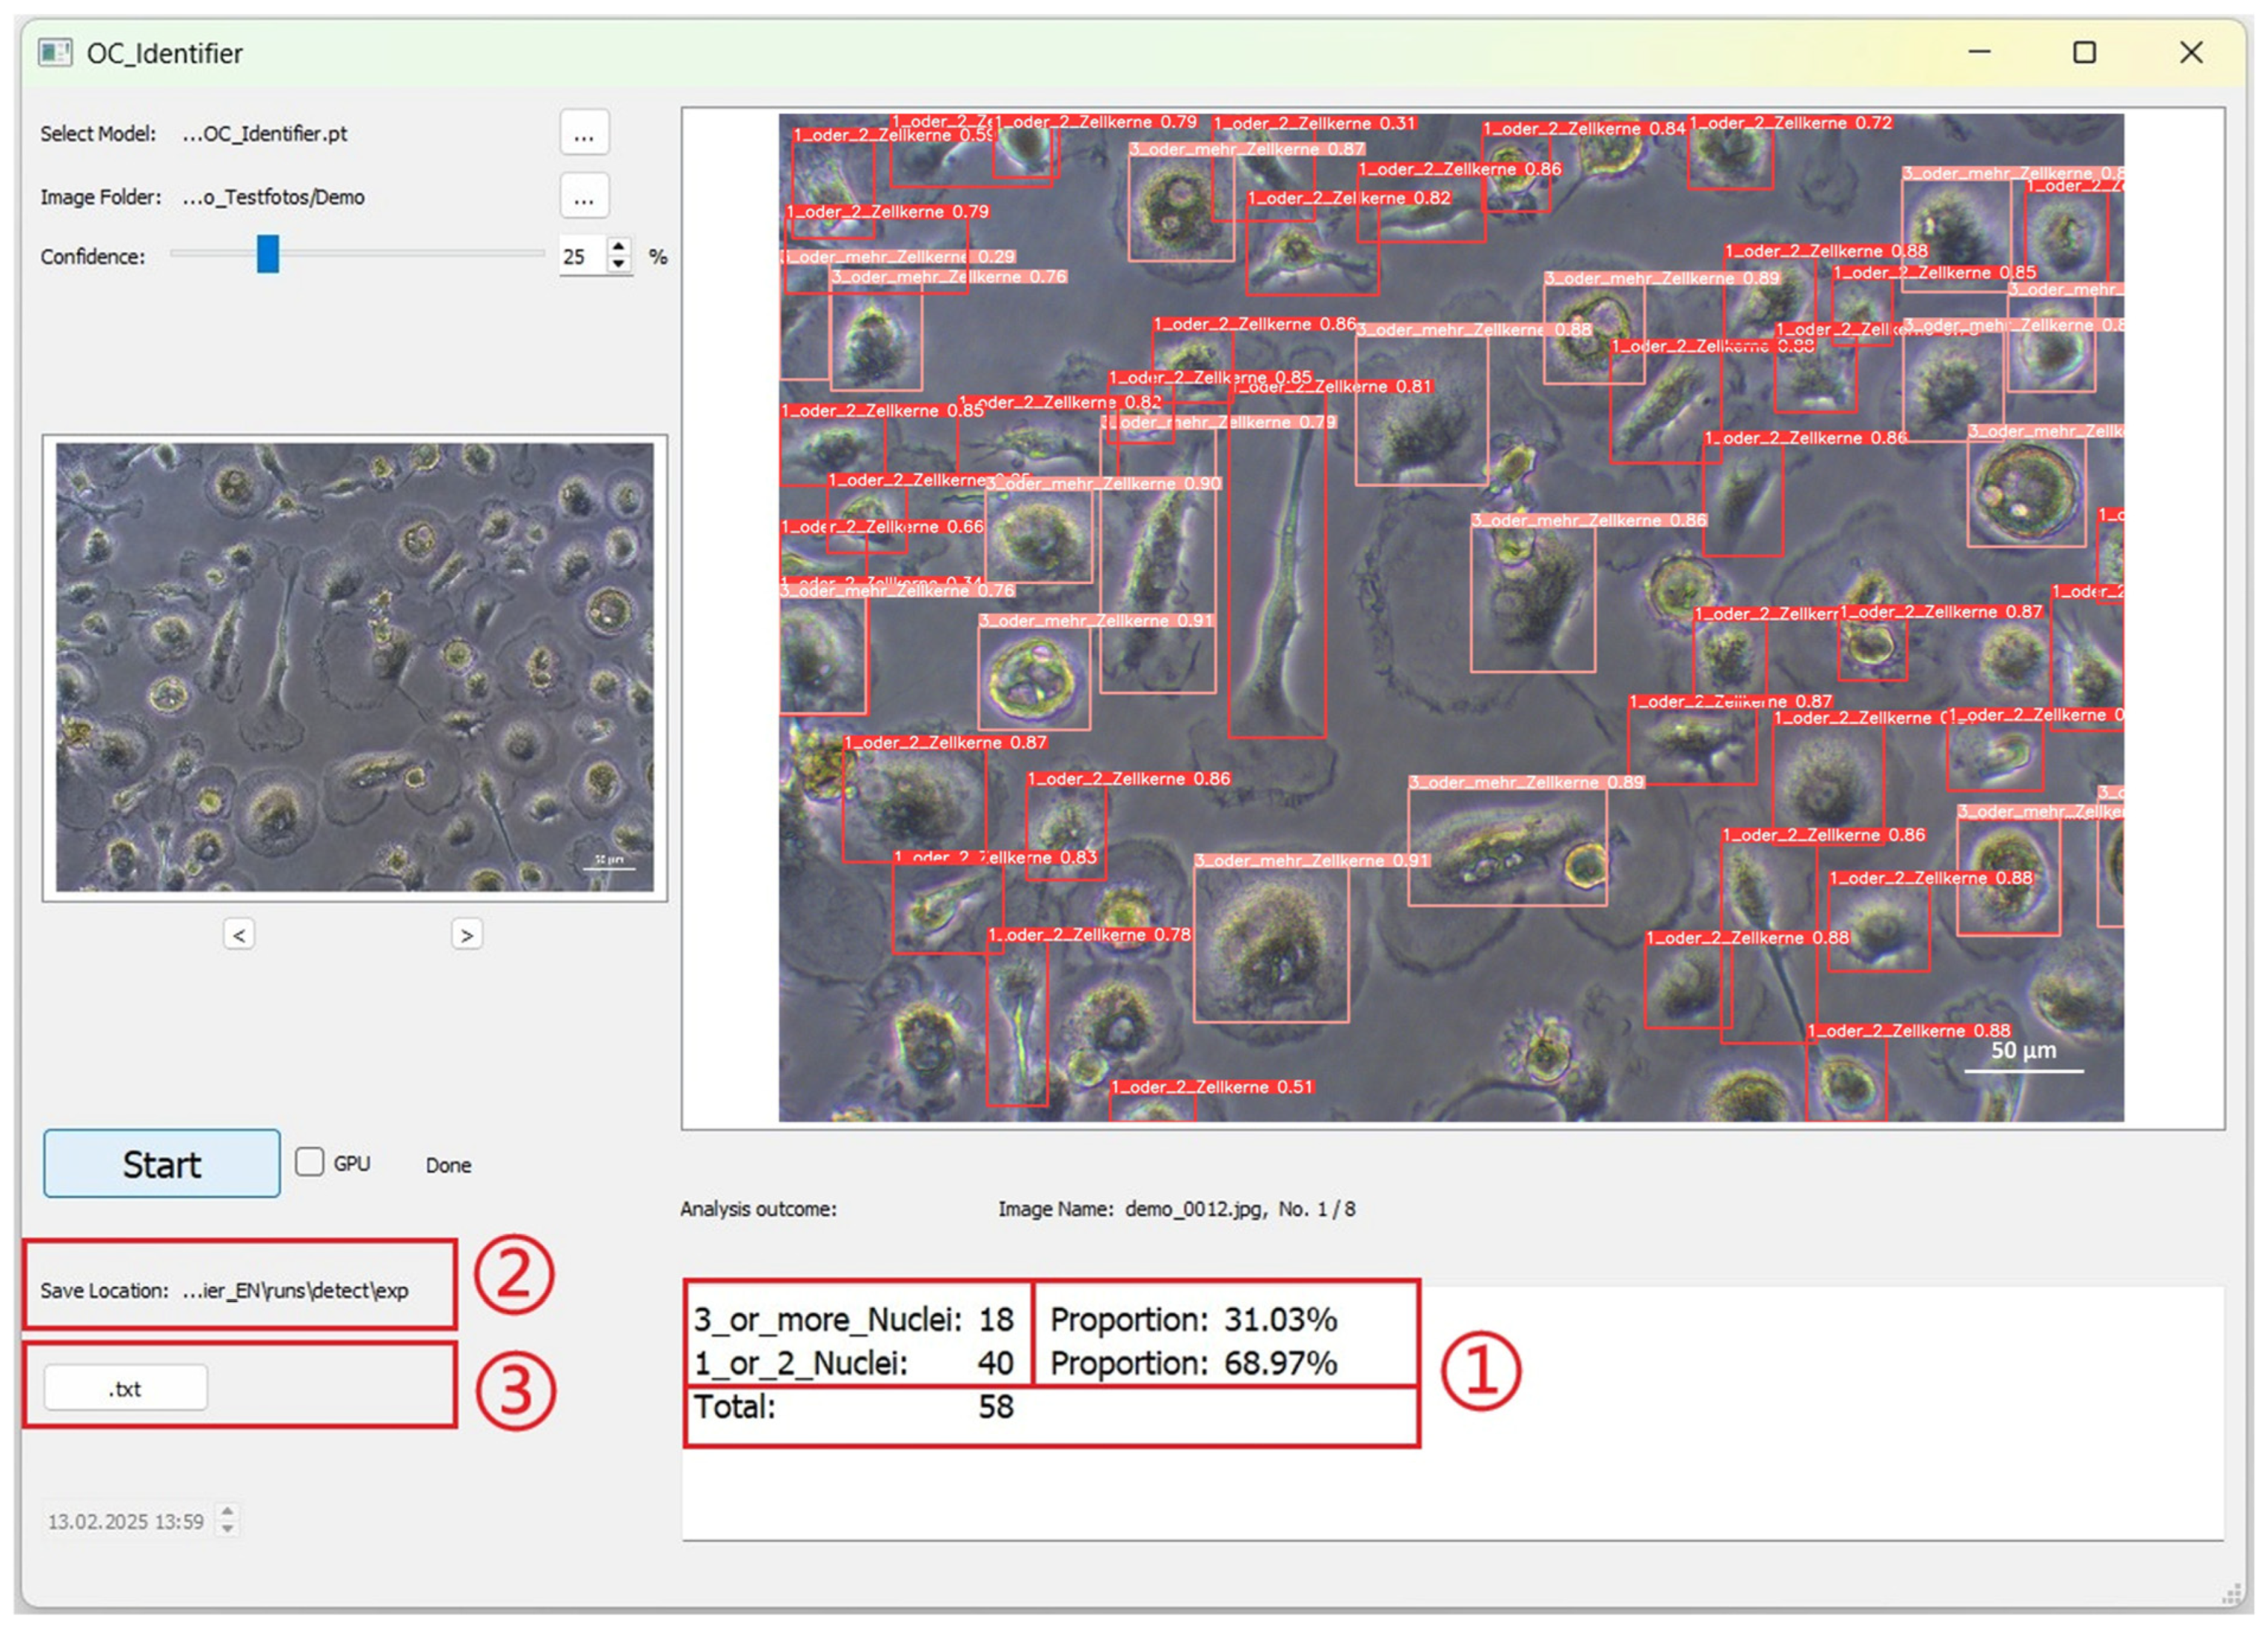
The data obtained by AI image analysis are displayed as shown in
Figure 6. (1) The statistical results are displayed in the text box below the large image area: Each cell class is displayed according to the class number defined during training (the numbering of the statistical results is automatically based on the definition of the new model). The number, percentage and total number of cells are displayed. (2) The images and documents generated by the AI test are automatically saved in this path. (3) Click the ‘.txt’ button to open the TXT file for the current image. The TXT file contains the position information and confidence values of the detected cells.
3.5. Adjusting Confidence Threshold
OC_Identifier provides an interactive confidence threshold adjustment feature, allowing users to fine-tune the confidence level via a slider (
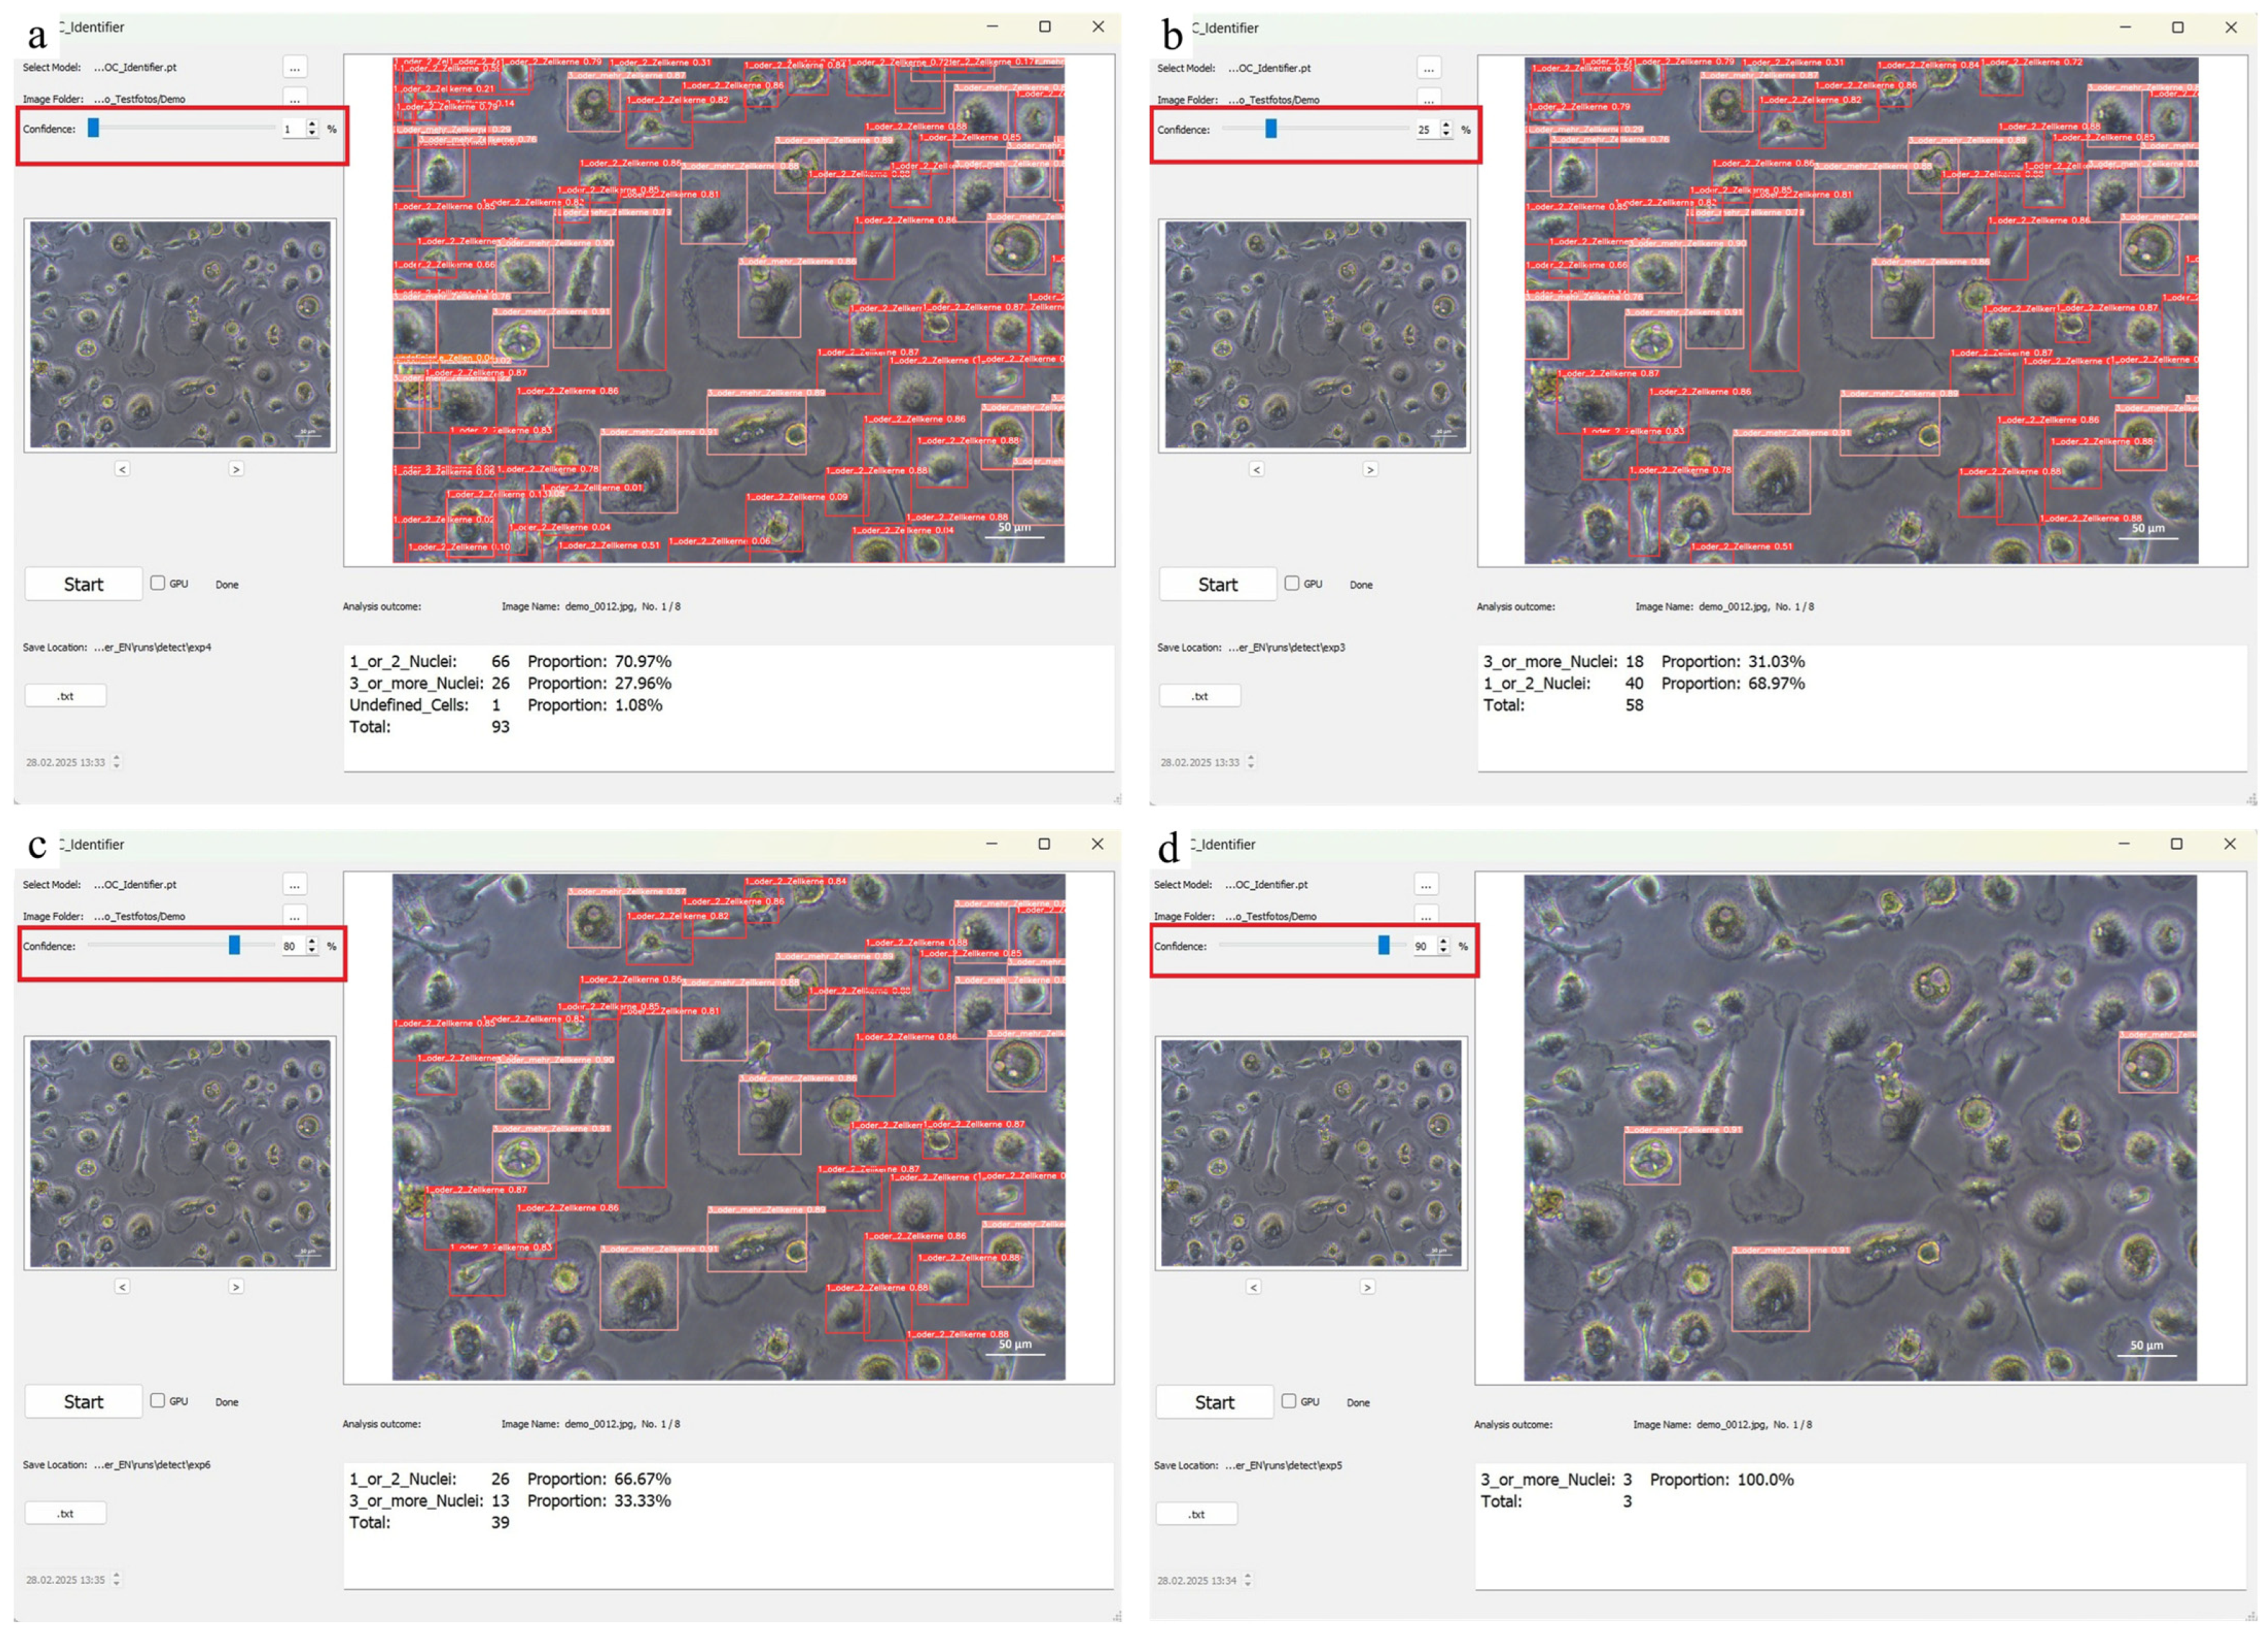
Figure 1A) to optimize the osteoclast detection results. Adjusting the confidence threshold appropriately helps balance false negatives (FN) and false positives (FP), ensuring accurate and reliable detection. The choice of the confidence threshold has a significant influence on the accuracy and sensitivity of cell identification in the OC_Identifier. A low threshold leads to more potential cells being recognised, but carries the risk of an increased number of false positives. On the other hand, if the threshold is set too high, the precision of the classification increases. However, at the same time, relevant cells may not be detected.
The following instruction for handling should be followed: if the number of correctly detected cells is too low, the confidence threshold should be lowered to increase sensitivity and reduce false negatives. If, on the other hand, the same cell is detected by several boundaries (boxes) of different classes, it is recommended that the threshold is raised in order to improve the specificity of the classification and to avoid overlapping detections. After starting the software and loading the image, the confidence threshold is adjusted using the slider. Moving the slider to the left lowers the threshold and causes more cells to be detected, but this can increase the number of false positives. Moving the slider to the right raises the confidence threshold, reducing the number of false positives but increasing the risk that some cells will not be detected. The effects of different confidence values are illustrated in
Figure 7 by comparing different settings (1%, 25%, 80% and 90%).
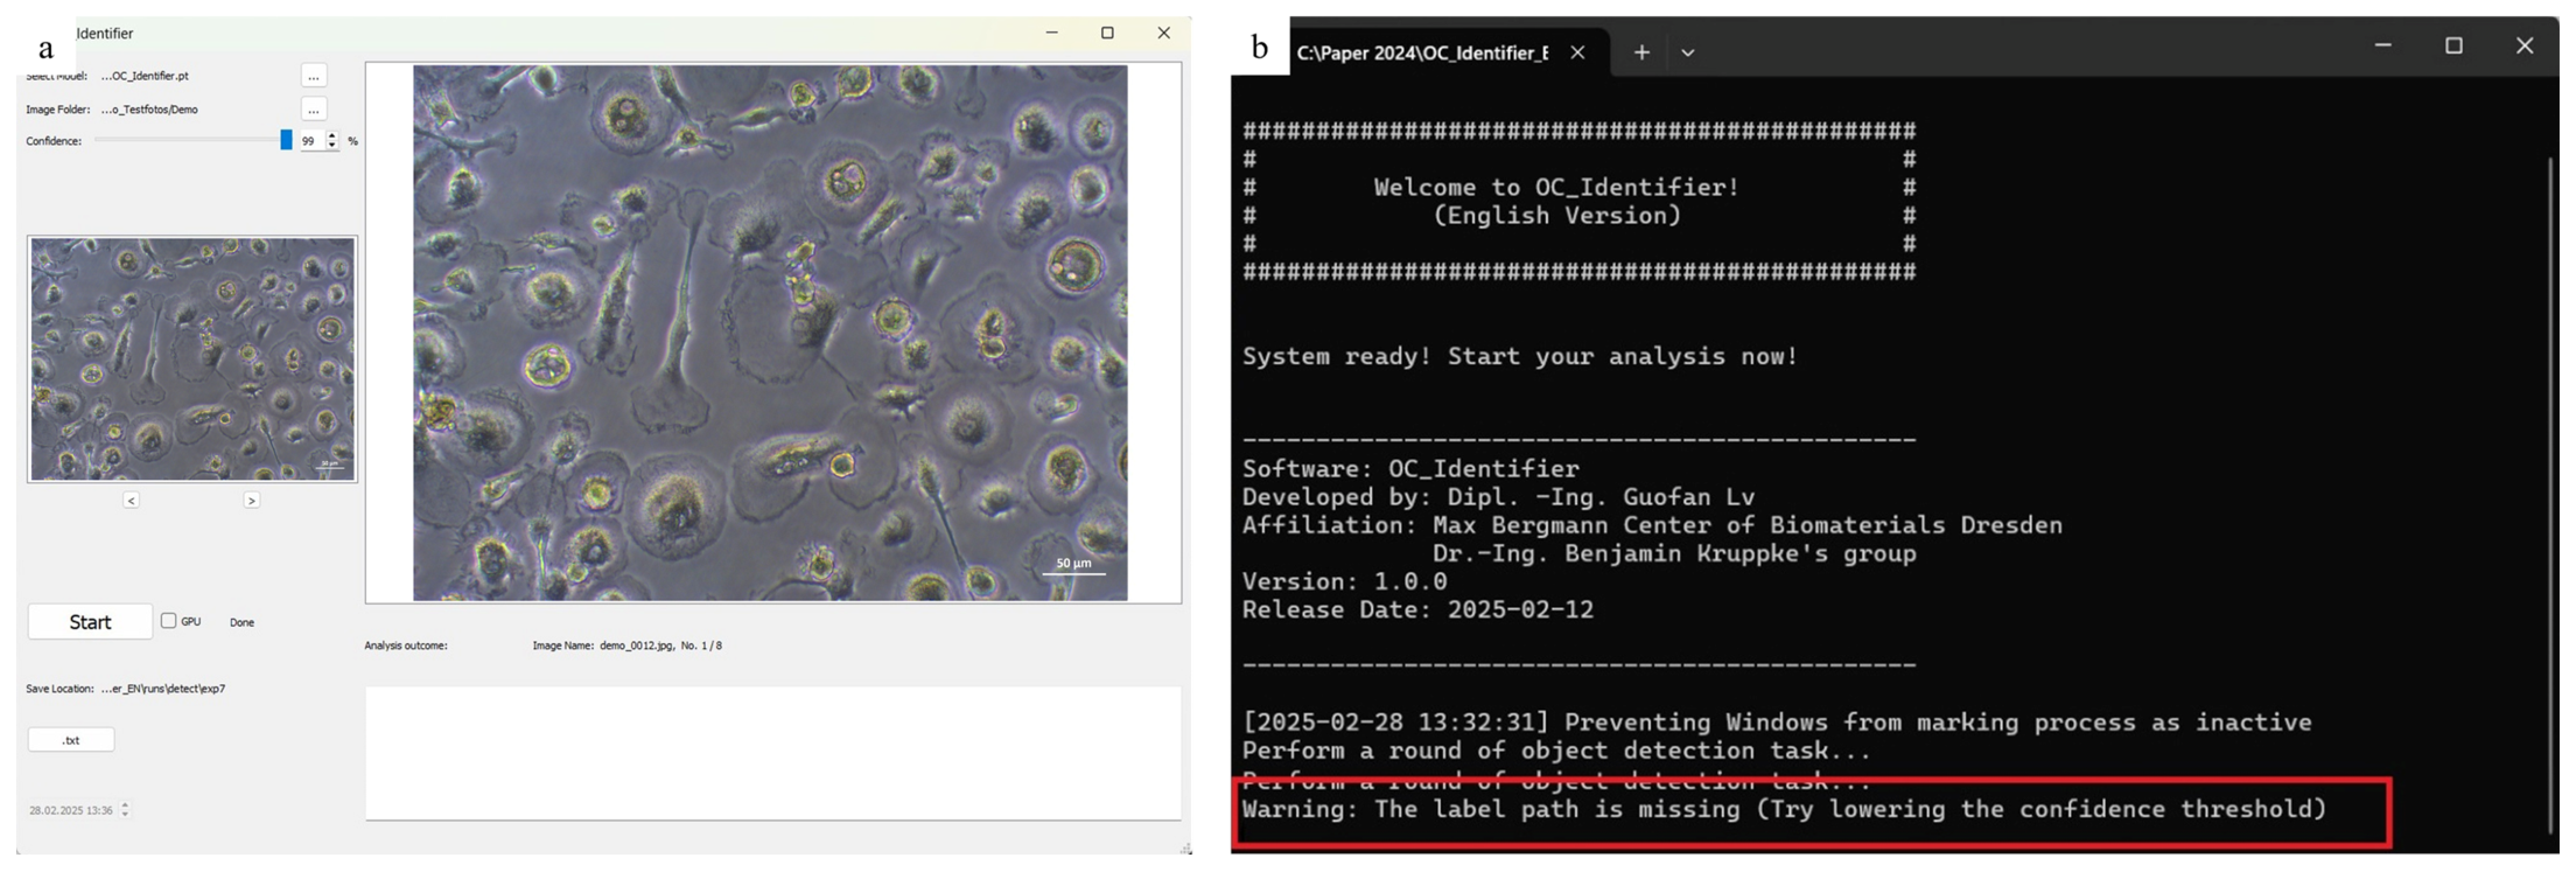
If the confidence threshold is too high, it is possible that no cells will be detected. In this case, a warning message appears in the console window, advising the user to ‘Try lowering the confidence threshold’. This situation is illustrated in
Figure 8, where no cells were detected and the corresponding message is displayed.
The precision of our publicly available Demo_OC_Identifier.pt model is 0.927 for 1_or_2_Nuclei and 0.921 for 3_or_more_Nuclei., when running val.py for evaluation. In practical applications, precision is highly influenced by the quality of cell images. Image resolution and clarity play a crucial role in detection accuracy. High-resolution, clear cell images where cell boundaries and nuclei are well defined allow the model to accurately identify osteoclasts, thereby improving precision
4. Discussion
The software presented is a tool that is under continuous development. This user guide is intended to make it easy to use. The key parameters of the characterisation of osteoclast maturation from the state of mononuclear monocytes to multinuclear osteoclasts can be found in the assignment of the four classes in the software. The development of an evaluation system that no longer relies primarily on the experience of the user of microscopy software or on the experience of laboratory specialists or physicians, but instead enables rapid and reliable evaluation - from cell culture images to radiographs—[
15,
16,
17], is often sought and described in the literature. Inspired by various YOLO-based AI models [
18,
19], we want to provide our AI model as simple and understandable as possible.
The identification of mature osteoclasts is based on their multi nucleation, since they originate from the fusion of monocytes, resulting in multiple nuclei, whereas other cell types, such as monocytes or osteoblasts, are typically mononuclear. Osteoclasts are generally large and irregular in shape, often displaying ruffled borders or pseudopodia (podosomes), while other cell types tend to be smaller and more regularly shaped. There are a number of morphological parameters that can be used to identify osteoclasts, such as shape, size, the number of nuclei, etc. In this specific case, we decided to use the number of nuclei because the fusion process is a clear indicator of osteoclast maturation and most clearly distinguishes it from other cells of the bone metabolism. This is particularly relevant for further planned co-culture analyses.
To identify the osteoclasts in cell culture experiments and simple microscopy images, the selection of the confidence level, which can be used to adjust the assignment probability to the four classes, is an important means of analysing your images according to your own requirements. In our opinion, a confidence level of 25% has proven to be particularly suitable. It is important to note that the absolute number of detected cells has only a limited influence on the accuracy of the ratio calculations. This is mainly because a valid evaluation of the cell culture results should not be based on a single image and the cell ratios shown in it. Rather, it is important that many images of a cultivation state (in dublicates, triplicates, or even more) are taken and examined using the integrated batch processing in the OC_Identifier. Only then is it possible to average the cell ratios in an acceptable way. This should always include a large number of cells, so that the confidence interval is initially less important for the cell ratio. As long as the cells are correctly classified, the relative proportions remain largely stable, even if the total number of detected cells changes slightly. Depending on the experimental requirements, the confidence threshold should be adjusted accordingly. In exploratory studies, a lower threshold may be useful to enable the most comprehensive detection possible. For quantitative analyses, a medium threshold is recommended to ensure a balance between the recognition rate and precision. In highly precise classification tasks, the threshold should be set as high as possible to minimise the number of false positives and achieve more precise identification.
The software offers additional value by displaying the images with the labelled cells and also storing the txt files with the label information. This means that proprietary information can be processed universally. The specification of the values determined for each photo (absolute and percentage) of the four classes enables the experimental data to be analysed and compared with other analytical methods of osteoclast culture in the future. We would like to provide an impetus for this and make our software available as universally as possible.
5. Conclusions
With the development and provision of the OC_Identifier software, we have created a user-friendly solution for the AI-assisted analysis of osteoclast development. Through the flexible integration and customisation of AI models, the tool enables the easy and reproducible identification and classification of cell types. The intuitive user interface allows the rapid analysis of large image datasets, while the graphical and numerical presentation of results supports comprehensive evaluation.
The software is an efficient complement to conventional biochemical and molecular biological analysis methods, and may provide a fast and cost-effective alternative in the future. The software and the new cell characterisation options for osteoclasts are expected to contribute to the further characterisation of biomaterials. Future enhancements, such as co- and triple-culture models, will further improve the application possibilities and enable a more precise evaluation of cell–material interactions. We hope that OC_Identifier will facilitate access to AI-based cell image analysis for a broad scientific community and contribute to the further development of methods for cell morphology-based biomaterial assessment.
Author Contributions
Conceptualization, B.K. and H.-P.W.; methodology, G.L.; software, G.L.; validation, B.K.; formal analysis, G.L.; investigation, G.L.; resources, B.K.; data curation, G.L.; writing—original draft preparation, G.L.; writing—review and editing, B.K.; visualization, G.L.; supervision, B.K.; project administration, B.K. and H.-P.W.; funding acquisition, B.K. All authors have read and agreed to the published version of the manuscript.
Funding
This research was funded by German Research Foundation for the research project Osteoclast activation by radiolytic degradation of organic/inorganic double hybrid materials (DHM) for controlled enhanced degradation of bone substitute materials (Project number 497439310).
Institutional Review Board Statement
Not applicable.
Informed Consent Statement
Not applicable.
Data Availability Statement
Acknowledgments
We acknowledge assistance from Christiane Heinemann for her support in cell culture of osteoclasts.
Conflicts of Interest
The authors declare no conflicts of interest.
Abbreviations
The following abbreviations are used in this manuscript:
| OC | Osteoclast |
| CPU | Central processing unit |
| GPU | Graphics processing unit |
| RAM | Random access memory |
References
- Lv, G.; Heinemann, C.; Wiesmann, H.-P.; Kruppke, B. Artificial intelligence for image-based identification of osteoclasts and assessment of their maturation—Using the OC_Identifier. Appl. Sci. 2025, 15, 4159. [Google Scholar] [CrossRef]
- Wang, X.; Kittaka, M.; He, Y.; Zhang, Y.; Ueki, Y.; Kihara, D. OC_Finder: Osteoclast segmentation, counting, and classification using watershed and deep-learning. Front. Bioinform. 2022, 2, 819570. [Google Scholar] [CrossRef] [PubMed]
- Kiharalab. OC_Finder. Available online: https://github.com/kiharalab/OC_Finder (accessed on 12 February 2025).
- Schneider, C.A.; Rasband, W.S.; Eliceiri, K.W. NIH ImageJ: A powerful open-source software for scientific image analysis. Nat. Methods 2012, 9, 671–675. [Google Scholar] [CrossRef] [PubMed]
- National Institutes of Health (NIH). ImageJ. Available online: https://imagej.net/ij/ (accessed on 12 February 2025).
- Stringer, C.; Wang, T.; Michaelos, M.; Pachitariu, M. Cellpose: A generalist algorithm for cellular segmentation. Nat. Methods 2021, 18, 100–106. [Google Scholar] [CrossRef] [PubMed]
- MouseLand. “Cellpose”. Available online: https://github.com/mouseland/cellpose (accessed on 12 February 2025).
- Moen, E.; Bannon, D.; Kudo, T.; Graf, W.; Covert, M.; Van Valen, D. Deep learning for cellular image analysis. Nat. Methods 2019, 16, 1233–1246. [Google Scholar] [CrossRef] [PubMed]
- Vanvalenlab. “deepcell-tf”. Available online: https://github.com/vanvalenlab/deepcell-tf (accessed on 12 February 2025).
- Ultralytics. YOLOv5: An Improved Version of YOLO for Object Detection. Available online: https://github.com/ultralytics/yolov5 (accessed on 12 February 2025).
- Riverbank Computing. PyQt: Python Bindings for Qt. Available online: https://www.riverbankcomputing.com/software/pyqt/ (accessed on 12 February 2025).
- Chollet, F. Deep Learning with Python; Manning Publications: Shelter Island, NY, USA, 2018. [Google Scholar]
- Fitzpatrick, M. Create GUI Applications with Python & Qt5, 5th ed.; Independently Published: Amersfoort, The Netherlands, 2022. [Google Scholar]
- Lv, G. OC_Identifier (A YOLOv5 GUI for Object Detection); Version 1.0.0; TUD Dresden University of Technology: Dresden, Germany, 2024; Available online: https://opara.zih.tu-dresden.de/handle/123456789/1247 (accessed on 12 February 2025).
- Malik, H.; Idris, A.S.; Toha, S.F.; Idris, I.M.; Daud, M.F.; Azmi, N.L. A review of open-source image analysis tools for mammalian cell culture: Algorithms, features and implementations. PeerJ Comput. Sci. 2023, 9, e1364. [Google Scholar] [CrossRef] [PubMed]
- Namireddy, S.R.; Gill, S.S.; Peerbhai, A.; Kamath, A.G.; Ramsay, D.S.C.; Ponniah, H.S.; Salih, A.; Jankovic, D.; Kalasauskas, D.; Neuhoff, J.; et al. Artificial intelligence in risk prediction and diagnosis of vertebral fractures. Sci. Rep. 2024, 14, 30560. [Google Scholar] [CrossRef] [PubMed]
- Liu, R.W.; Ong, W.; Makmur, A.; Kumar, N.; Low, X.Z.; Shuliang, G.; Liang, T.Y.; Ting, D.F.K.; Tan, J.H.; Hallinan, J.T.P.D. Application of Artificial Intelligence Methods on Osteoporosis Classification with Radiographs—A Systematic Review. Bioengineering 2024, 11, 484. [Google Scholar] [CrossRef] [PubMed]
- Beser, B.; Reis, T.; Berber, M.N.; Topaloglu, E.; Gungor, E.; Kılıc, M.C.; Duman, S.; Çelik, Ö.; Kuran, A. YOLO-V5 based deep learning approach for tooth detection and segmentation on pediatric panoramic radiographs in mixed dentition. BMC Med. Imaging 2024, 24, 172. [Google Scholar] [CrossRef]
- Song, X.; Tang, H. Blood cell target detection based on improved YOLOv5 algorithm. Electronics 2024, 13, 4992. [Google Scholar] [CrossRef]
| Disclaimer/Publisher’s Note: The statements, opinions and data contained in all publications are solely those of the individual author(s) and contributor(s) and not of MDPI and/or the editor(s). MDPI and/or the editor(s) disclaim responsibility for any injury to people or property resulting from any ideas, methods, instructions or products referred to in the content. |
© 2025 by the authors. Licensee MDPI, Basel, Switzerland. This article is an open access article distributed under the terms and conditions of the Creative Commons Attribution (CC BY) license (https://creativecommons.org/licenses/by/4.0/).


