Article

Structural Optimization and Airflow Uniformity Evaluation of Bag Filter Based on Different Diversion Schemes

1
School of Environmental Science and Engineering, Tianjin University, Tianjin 300072, China
2
School of Energy and Safety Engineering, Tianjin Chengjian University, Tianjin 300192, China
*
Author to whom correspondence should be addressed.
Appl. Sci. 2025, 15(8), 4174; https://doi.org/10.3390/app15084174
Submission received: 23 February 2025 / Revised: 2 April 2025 / Accepted: 8 April 2025 / Published: 10 April 2025
(This article belongs to the Section Applied Industrial Technologies)

Abstract

:

Featured Application

The insights gained from this study offer a practical, experimentally validated solution for enhancing the efficiency and lifespan of bag filters in similar applications through strategic, multi-stage optimization.

Abstract

To address issues such as uneven airflow distribution, reduced dust collection efficiency, and different filter bag lifespans in multi-chamber bag filters, computational fluid dynamics (CFD) simulations were employed to analyze the internal flow field and propose optimization strategies. The results revealed that, although there were differences in velocity and pressure fields across the chambers, the overall distribution patterns showed certain similarities. In the original filter model, disordered airflow from the high-velocity inlet led to significant discrepancies in airflow distribution, especially along the chamber sidewalls, top corners, and central regions, resulting in considerable variation in the airflow handled by individual filter bags. Furthermore, high velocities at the bottom of the filter bags caused severe wear, complicating bag detection and replacement. Therefore, an optimization approach involving three vertical descending deflectors in the hopper was proposed. Five optimization schemes were developed to improve airflow organization before it reached the filtration area. To validate the feasibility of the proposed design and the accuracy of the numerical model, experiments were conducted using a 1:10 scaled-down model. According to the simulation results, the optimal scheme reduced the inlet and outlet pressure drop by 11.2%, while improving airflow uniformity by 40–50%, leading to a more balanced airflow distribution and increased operational efficiency.

1. Introduction

Industrialization and urbanization have led to increased industrial emissions. Waste incineration, for example, has become the primary method for managing municipal waste, replacing traditional landfill practices. However, this process generates significant atmospheric pollutants, posing direct health risks such as respiratory and cardiovascular diseases [1,2,3]. Currently, bag filters are used to treat the dust-laden gases from waste incineration, with the core filtration component consisting of filter bags made from organic or inorganic fibers [4]. This method efficiently captures solid particulates and other harmful substances, ensuring environmental safety during the incineration process [5].
The filtration efficiency of bag filters is closely related to the uniformity of airflow distribution within the filter chamber [6]. In practice, uneven airflow results in varying air volumes processed by each filter bag, which shortens bag lifespan and reduces dust collection efficiency, leading to higher operational costs [7]. Therefore, optimizing the filter structure and setting appropriate operating parameters tailored to specific industrial applications are crucial for stable operation and optimal performance [8]. Researchers have focused on identifying key factors affecting performance, aiming to enhance efficiency and reduce energy consumption through innovations in cleaning systems, filtration materials, and structural design.
Numerous studies have explored the pulse cleaning mechanism of bag filters. For example, Zhang et al. [9,10] examined the effects of pulse velocity, pressure, duration, and injection settings on the cleaning process. Li et al. [11] found that installing a cone in pleated filter cartridges helps extend cleaning intervals and reduce dust emissions. Aroussi et al. [12] developed a CFD-based (computational fluid dynamics) simulation method to predict the growth trend of the dust cake on filter surfaces, providing a basis for determining cleaning intervals. Huachang et al. [13,14,15] focused on optimizing nozzle structures in pulse cleaning systems, including nozzle geometry, installation position, and angle, and proposed several innovative designs.
Research on filter element optimization can be categorized into two levels. The first focuses on the microscopic level, particularly material optimization, including composition and fiber structure. For instance, Chen et al. [16,17] achieved synergistic removal of multiple pollutants by loading catalysts onto filtration materials. Gao et al. [18,19,20,21] studied the effects of porosity, fiber diameter, length, and arrangement on pressure drop and filtration efficiency. The second level focuses on the macroscopic scale, exploring how the geometric dimensions and spatial arrangement of filter elements affect overall airflow distribution. For example, Subrenat et al. [22] investigated the impact of the number of pleats in filter elements on aerodynamic performance, while Yu et al. [23] compared the performance of star-shaped and horizontal array filter bag arrangements.
The structural design of bag filters significantly influences airflow characteristics and particle trajectories. Fu et al. [24] found that uneven airflow distribution in bag filters leads to increased operating resistance and bag breakage. High-velocity inlet airflow, on the other hand, is the main cause of uneven airflow distribution. Optimizing airflow organization is therefore essential for improving bag filter structure. Through detailed numerical simulations, the performance of bag filters can be systematically assessed, and different optimization strategies can be compared, providing a platform for preliminary design efforts [25,26,27,28,29]. Pereira et al. [30,31] addressed defects in the original design by adjusting the positions of the inlet and outlet to achieve more favorable airflow distribution. Zhang et al. [32] discovered that introducing flow distribution devices suppresses jetting within the bag filter and reduces dust accumulation on the filter surface. For example, Lima et al. [33] used flow distribution deflectors to modify airflow direction and velocity. Chen et al. [34,35] designed three sets of distributors with different numbers and angles in the hopper to organize the airflow. These studies demonstrate that adding flow distribution devices is the most effective approach for optimizing airflow. Thus, this study proposes the addition of deflectors in the hopper to optimize the existing flow field distribution.
Despite advancements in optimizing bag filters, several key limitations remain in current research. First, many studies focus on individual chambers or neglect the impact of filter bags on overall airflow distribution. Second, the localized effects of airflow on filter bag abrasion and dust scouring are often underexplored, leading to an incomplete understanding of wear mechanisms. Third, optimization strategies typically lack comprehensive, multi-dimensional evaluation, limiting their practical effectiveness. Additionally, while CFD methods offer valuable insights, most studies fail to experimentally validate optimization measures due to operational challenges. These gaps underscore the need for more robust and validated optimization approaches that address both airflow dynamics and practical performance across multi-chamber systems.
This study introduces a novel optimization strategy for improving airflow distribution in bag filters by incorporating descending deflectors. The proposed optimization measures are validated through both scaled-down model experiments and full-scale CFD simulations, ensuring the robustness and scalability of the results. By using a multi-dimensional airflow uniformity evaluation system, this research offers a more precise and comprehensive approach to assessing airflow uniformity and filter performance. These innovations not only enhance the understanding of airflow dynamics in bag filters but also provide a practical solution for improving filtration efficiency and operational performance in industrial applications. Additionally, by providing quantifiable indicators of pressure drop and airflow distribution, the study can solve key technical problems such as uneven airflow and inconsistent filter bag life, which are common problems in industrial dust removal systems. The proposed solution can provide theoretical guidance for the structural optimization of multi-chamber filters and has important engineering application value.

2. Method and Materials

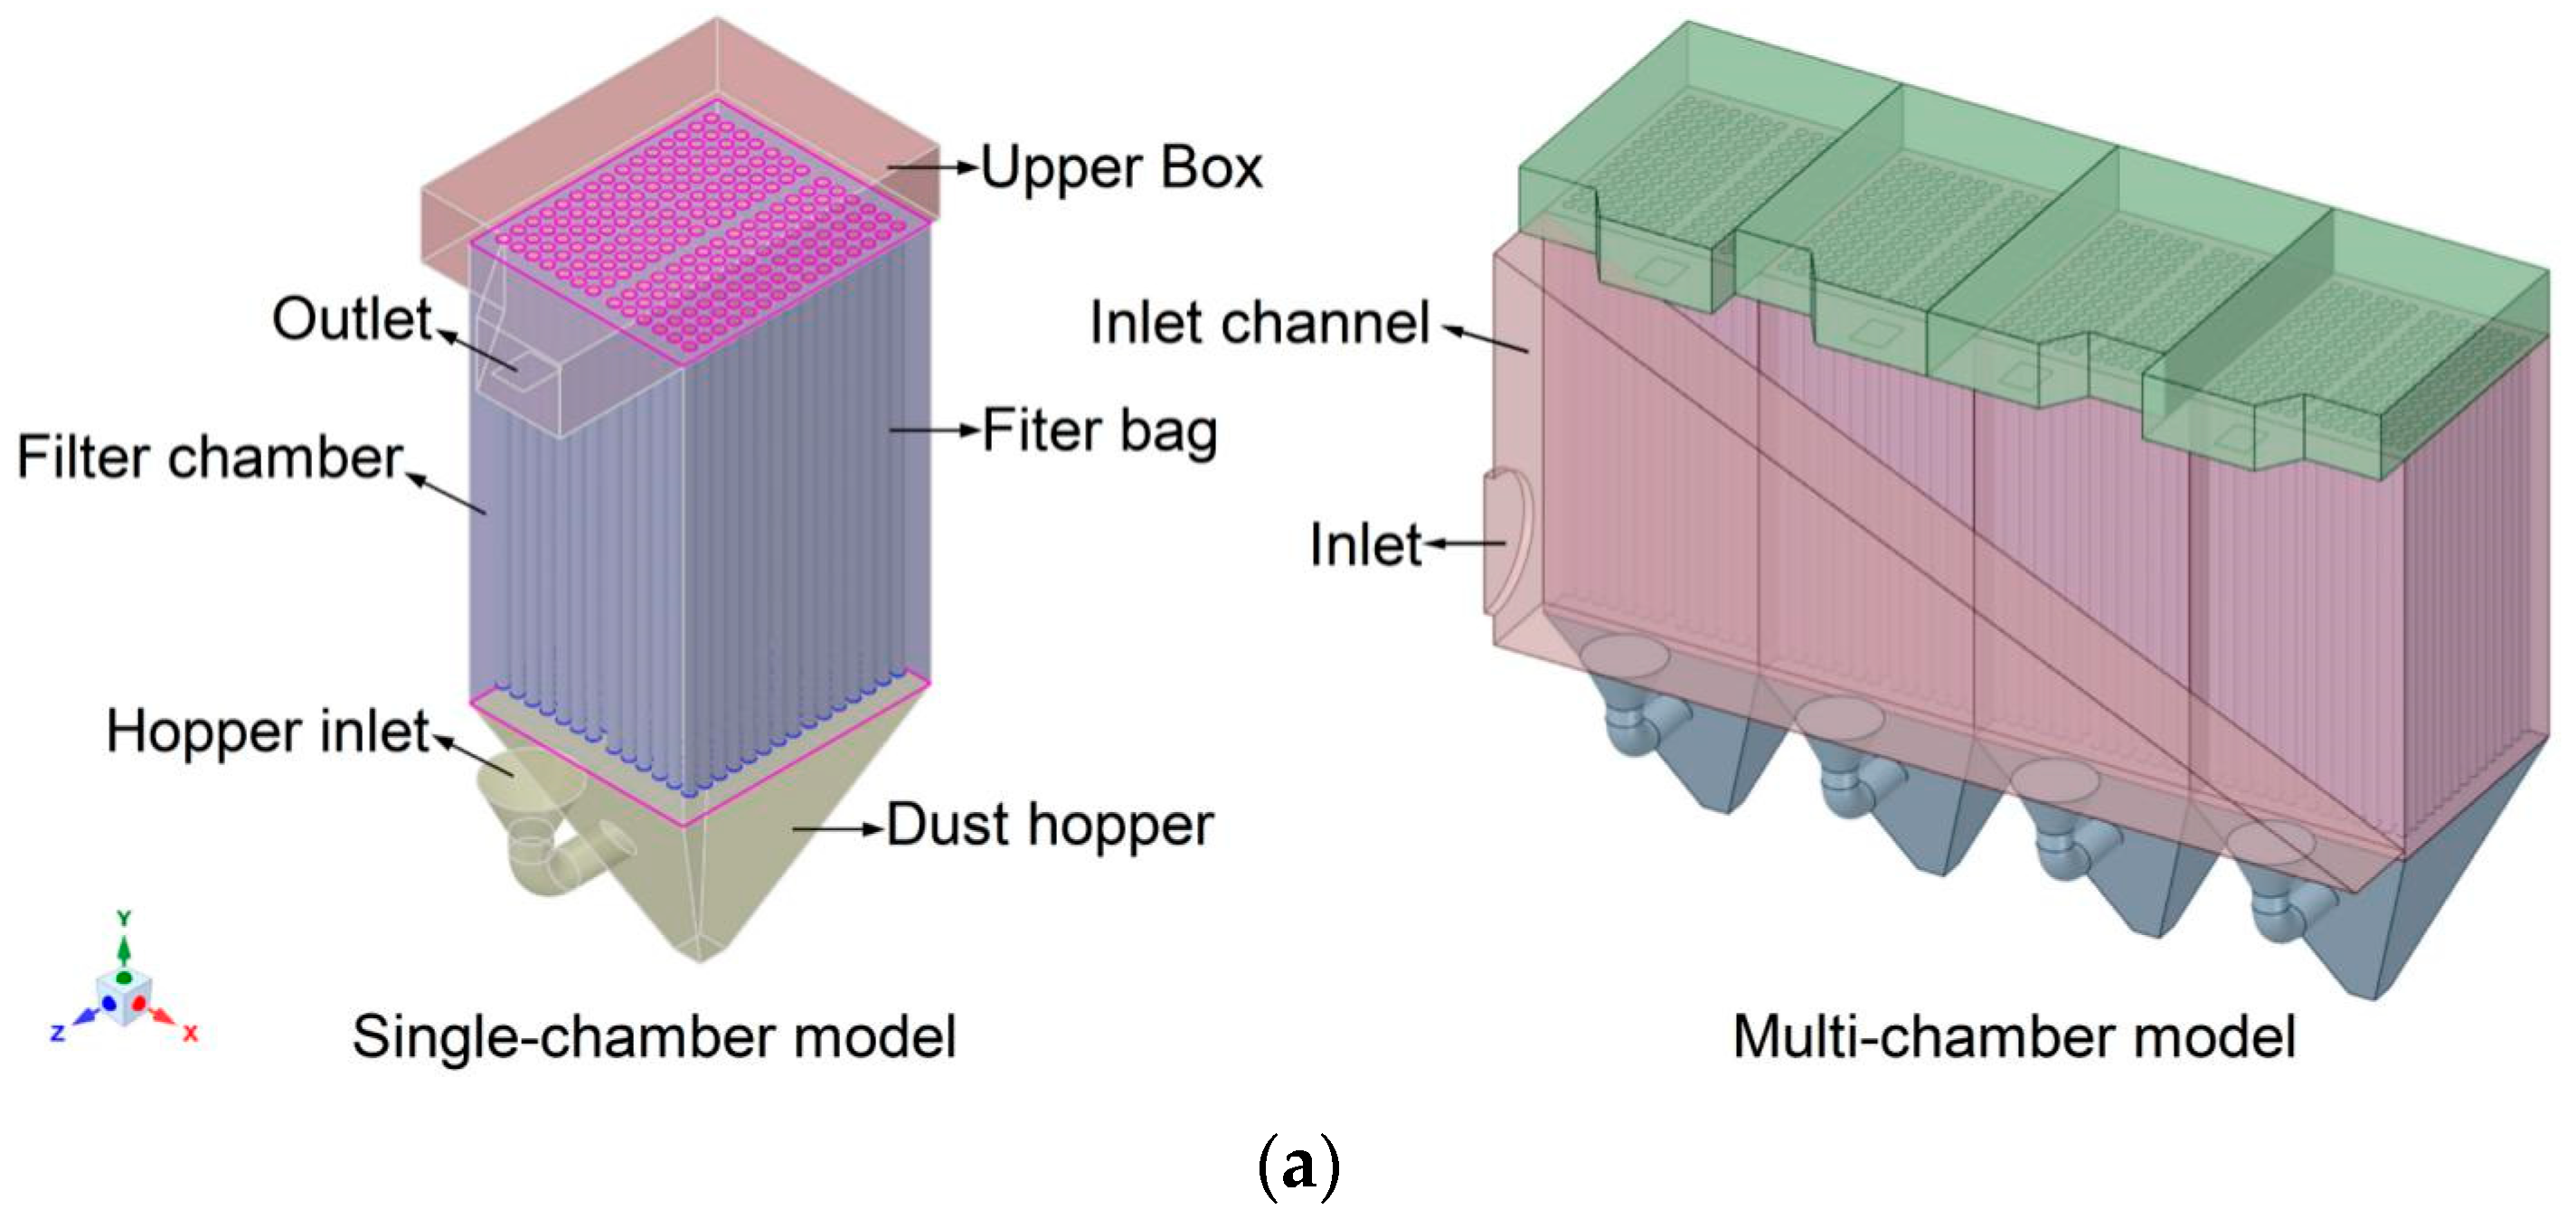
2.1. Case Study and Modelling

This study was based on a 600 t/day bag filter used in a practical project in Hebei Province, China. The filter consists of eight chambers and a total of 1560 filter bags. The chamber dimensions are 3860 × 3330 × 6200 mm, the height of the upper box is 1000 mm, and the inlet and outlet dimensions are Ø2212 × 6 mm. The filter bags have specifications of Ø160 × 6000 × 1.5 mm, and the hopper inlet size is Ø1195 mm. The total flue gas handling capacity is 116,900 Nm3/h.
For the simulation, SpaceClaim 2022 R2 software was used to geometrically model the fluid region, constructing both multi-chamber and single-chamber models of the bag filter. In developing the multi-chamber model, four chambers were selected as the computational domain, based on the symmetry of the actual filter structure, the complexity of mesh generation, and computational efficiency. The 3D models of the bag filter are shown in Figure 1a. To provide a crucial reference for the optimization design, it is important to analyze the airflow distribution within the chamber and across the individual filter bags. For ease of subsequent discussion, Figure 1b presents the numbering of the different cross-sections (R1–R10 and L1–L10) and filter bags (XiZi) inside the bag filter.

2.2. Establishment of the Numerical Simulation Models

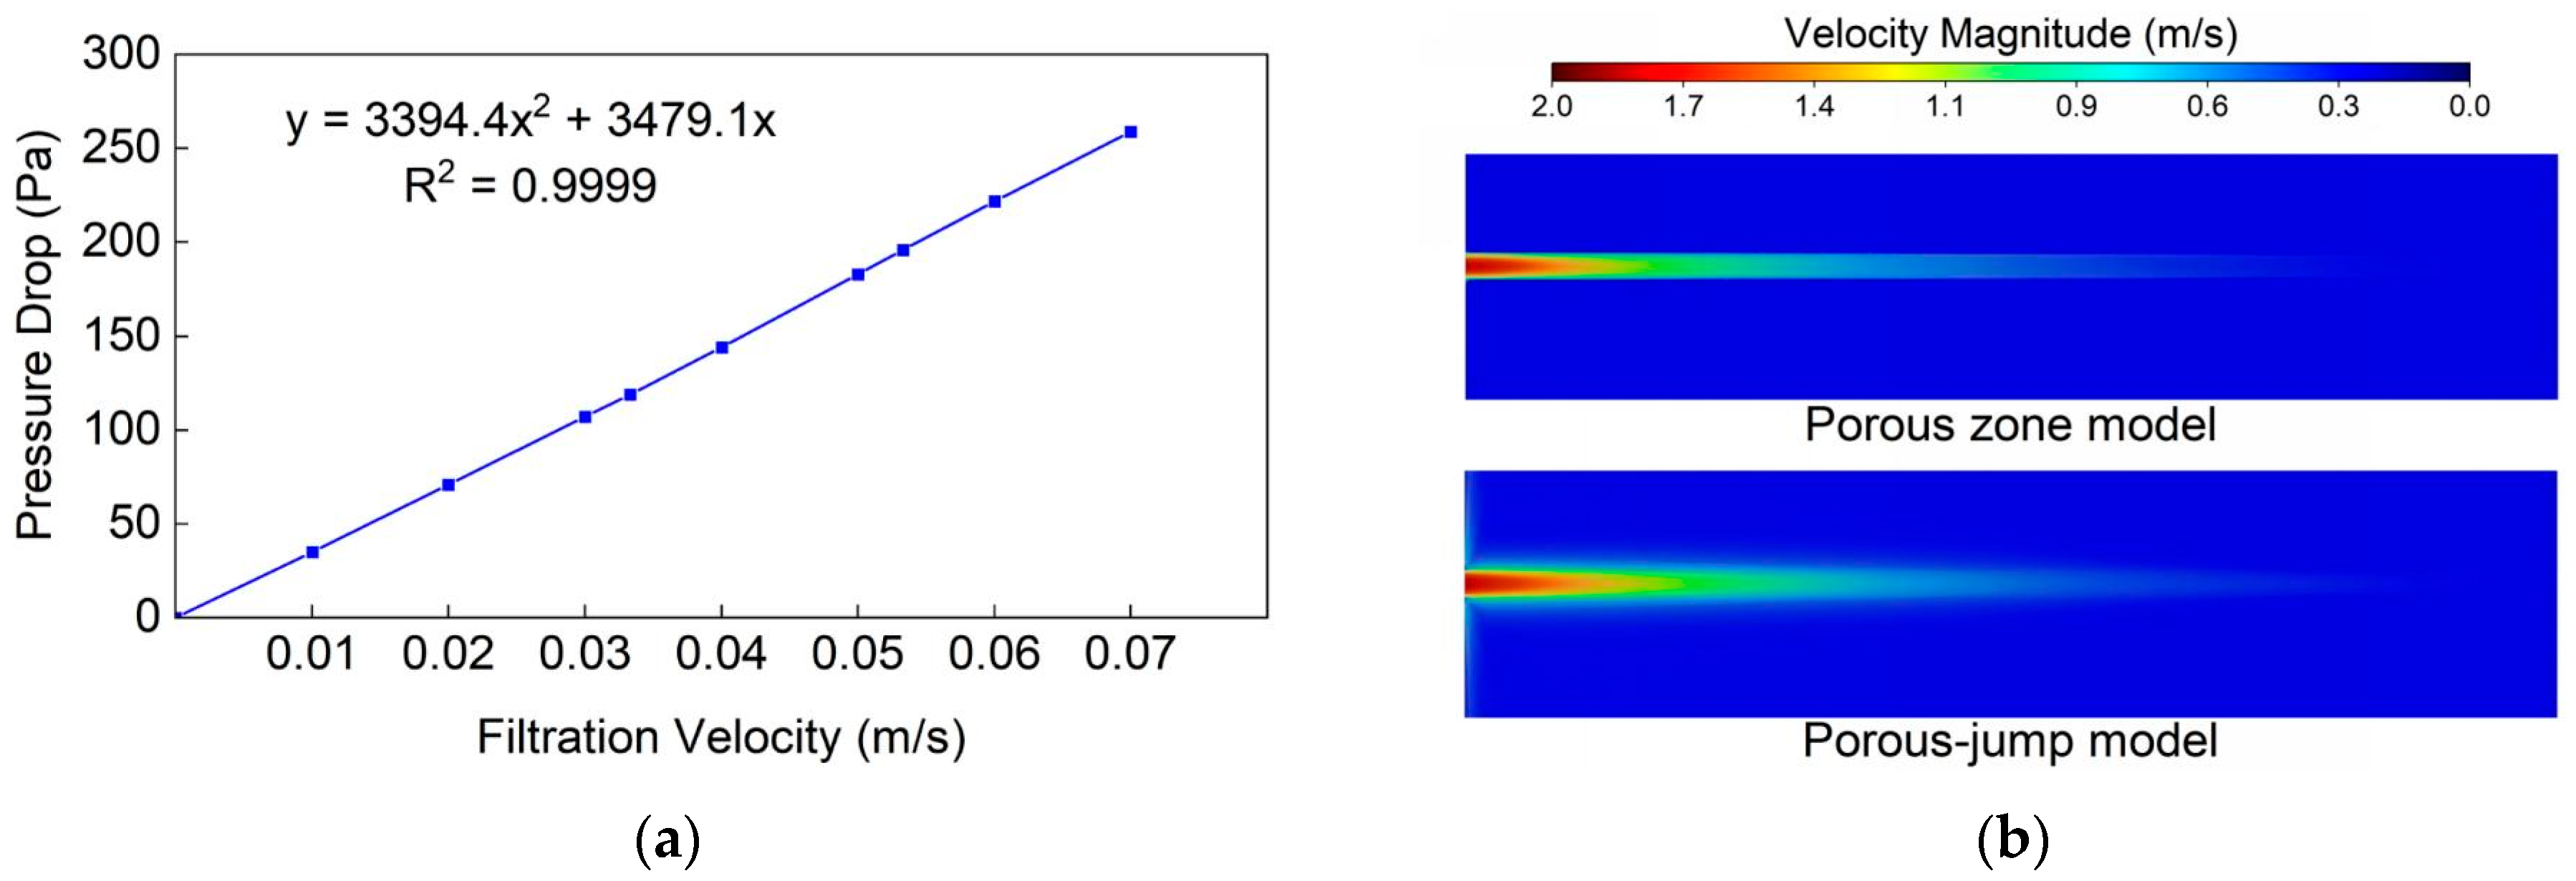
2.2.1. Mathematical Models

Due to the high-velocity inlet flow and the complex structure of the bag filter, turbulence is present in both the inlet and internal flow field. The Reynolds number (Re) at the hopper inlet reaches 201,900 and approximately 306,935 in the porous medium, which indicates turbulent flow. For this reason, the standard k-ε turbulence model is employed to simulate the turbulent flow. The continuous phase of the flue gas is treated as isothermal, incompressible, and steady. Considering the objective of this study is to analyze the airflow distribution within the bag filter, to simplify the process, the discrete phase model (DPM) uncoupled method in Fluent 2022 R2 software was used for simulation, where the interaction between the discrete and continuous phases is neglected. The particle sizes of 2.5 μm and 5 μm were modeled as discrete sources.
The key governing equations of continuous phase simulation are outlined below.
Continuity equation:
u x + v y + w z = 0   ,
Momentum conservation equation:
( ρ u i ) t + ( ρ u i u j ) x j = p x i + μ 2 u i x j 2 + ρ f i ,
where ρ is the density of the fluid (kg/m3), ui is the velocity component in the i-direction (m/s), p is the static pressure (Pa), μ is the dynamic viscosity (kg/m∙s), fi is the external force in the i-direction (N), xj is the spatial coordinate in the j-direction (m).
To solve for the turbulent kinetic energy (k) and dissipation rate (ε), the corresponding transport equations are as follows:
Turbulent kinetic energy (k) equation:
( ρ k ) t + ( ρ k u i ) x i = x j μ + μ t σ k k x j + G k ρ ε + S k ,
Turbulence dissipation rate (ε) equation:
( ρ ε ) t + ( ρ ε u i ) x i = x j μ + μ t σ ε ε x j + C 1 ε ε k G k C 2 ε ρ ε 2 k + S ε ,
where Gk is the generation term of the turbulent kinetic energy caused by the average velocity gradient, σk and σε are Prandtl numbers, C1ε and C2ε are empirical constants, and Sk and Sε are user-defined source items. The values used are σk = 1.1, σε = 1.3, C1ε = 1.44, C2ε = 1.92, and Sk = Sε = 0.
The turbulent viscous coefficient μt is related to k and ε, and its expression is shown in Equation (5):
μ t = ρ C μ k 2 ε .
Additionally, the hydraulic diameter (ϕ) and turbulence intensity (I) were calculated based on various models and operating conditions [36]:
ϕ = R e μ ρ v ,
I = 0.16 R e 1 / 8 ,
where v is the airflow velocity (m/s) and μ is the kinematic viscosity of the fluid (m2/s).

2.2.2. Boundary Conditions and Solution Setup

The resistance characteristics of the porous media were determined using the surface permeability (α) and the pressure jump coefficient (C2). These parameters were derived experimentally based on Darcy’s law for fluid flow through porous media, with a quadratic polynomial used to relate pressure drop to velocity. The relevant equations are provided in Equations (8) and (9) [37]:
p = μ α v + C 2 1 2 ρ v 2 Δ n = a v 2 + b v ,
D = 1 α .
The filter bag used in this study is a PTFE membrane filter bag, commonly applied in practical engineering. The hydrodynamic viscosity at the time of the test was μ = 1.81 × 10⁻⁵ Pa·s, the air kinematic viscosity was ν = 1.5 × 10⁻⁵ m2/s, and the density was ρ = 1.205 kg/m3. These values were used as the basis for subsequent CFD numerical simulations of the fluid parameters. The results of the resistance performance test are shown in Figure 2a. Based on these results, the following calculations were made:
C 2 = 2 a ρ Δ n = 3.76 × e 6   m 1 ,
D = 1 α = b μ Δ n = 1.28 × e 12   m 2 .
Given the significant difference in scale between the filter bag thickness and the filter geometry, using the porous zone model requires a large grid count, leading to high computational costs. In contrast, the porous-jump model approximates the filter bag as a thin membrane, requiring fewer grids and offering higher efficiency and robustness. Both models were used to simulate the airflow through a single filter bag, with the velocity contours shown in Figure 2b. The porous zone model accurately captures the filter bag boundary, while the porous-jump model lacks a distinct boundary but provides similar velocity distributions on both sides of the bag boundary. This indicates that the porous-jump model reliably represents the overall flow field and velocity profile along the filter length. Therefore, the porous-jump model was chosen for the simulations in this study.
In the simulation, the inlet boundary is defined as a velocity inlet, the outlet as an outflow boundary, and the walls as no-slip stationary surfaces. The filter bag boundaries are modeled with the porous-jump method. Upon implementing the discrete phase model, the injection source was defined at the dust hopper inlet, with the filter bag surface and hopper walls designated as collection boundaries, assuming a 100% capture efficiency. The remaining chamber walls and deflectors were assigned as reflective boundaries. The model was configured to maintain consistent particle densities across all groups, with gravity effects incorporated. The solver employed a steady-state, three-dimensional, pressure-based approach with fully implicit coupling, using a second-order upwind scheme for convective terms.

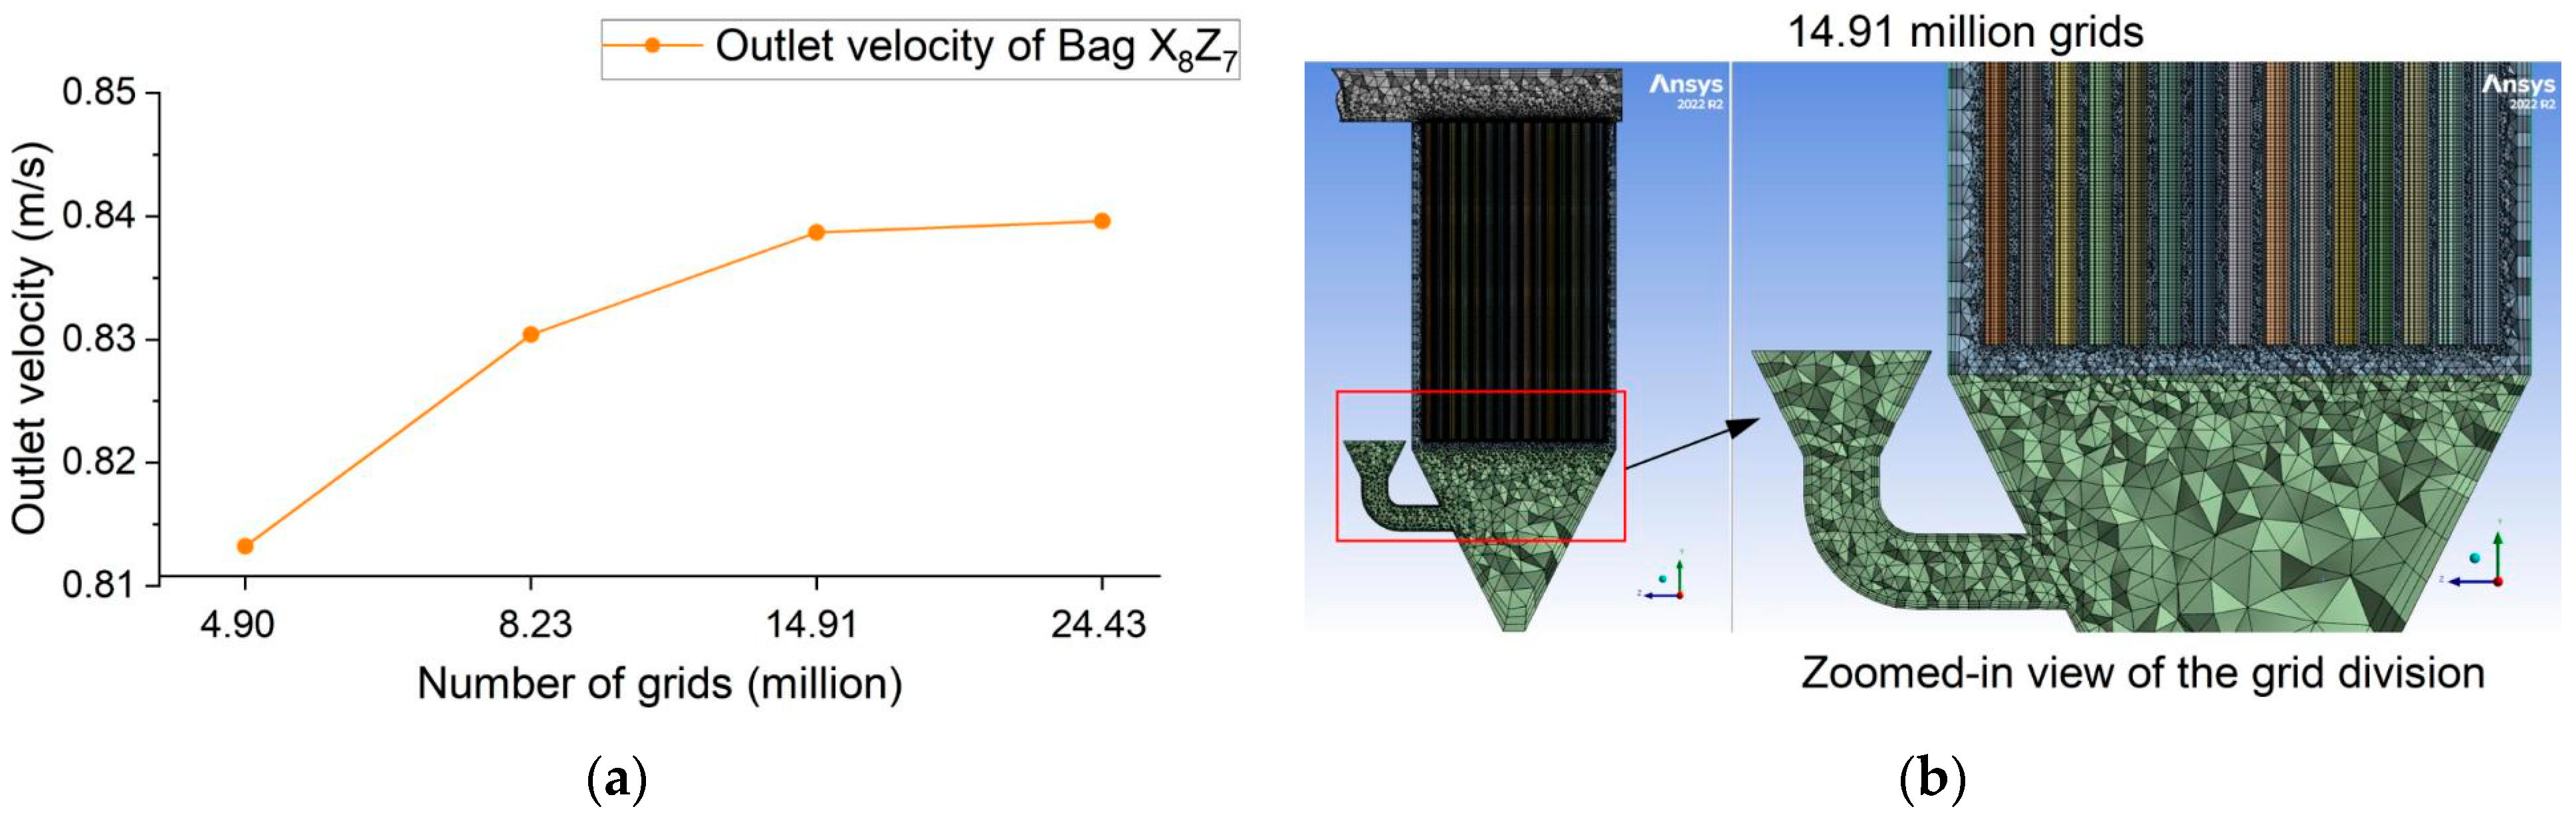
2.2.3. Meshing and Grid Validation

ANSYS Meshing 2022 R2 software was employed to generate the mesh for the model. The sweep meshing method was applied to the filter bags and filtered gas, while the tetrahedron meshing method was used for the chambers, inlet channels, and hopper. To improve the accuracy of the numerical simulation, local refinement was applied to the inlet, outlet, and filter bag surfaces, and three layers of expansion were added to the wall boundaries.
Taking the single-chamber model as an example, the base mesh consisted of 8.23 million grids. Mesh refinement and coarsening were subsequently performed, resulting in four configurations with varying mesh densities and grid counts. Numerical simulations were conducted under constant boundary conditions and simulation parameters. Since the primary focus of this study is the uniformity of airflow within the filter chamber, the outlet velocity of filter bag X8Z7 was selected as the evaluation metric for comparison, as shown in Figure 3a. The results indicate that when the grid count reaches 14.91 million, the outlet velocity simulation results for bag X8Z7 stabilize, indicating that further increases in the number of grids have a negligible effect on simulation accuracy. Therefore, considering mesh quality, computational accuracy, and efficiency, 14.91 million grids were selected for the subsequent simulations. The mesh division of the single-chamber model and a zoomed-in view of the grid division are shown in Figure 3b.

2.3. Evaluation Indices

To quantitatively assess the airflow uniformity within bag filters, the following four evaluation indices were selected.
  • Flow distribution coefficient
The flow distribution coefficient (Kqi) for each filter bag can be calculated using the following formula:
K q i = Q i Q ¯ ,
where Qi represents the actual processed air volume of the i-th filter bag, and Q ¯ is the average processed air volume across all filter bags, m3/s. Additionally, ∆Kqi represents the maximum flow rate uneven amplitude, calculated as the difference between the maximum and minimum flow coefficients:
Δ K q i = K q i max K q i min .
Under ideal conditions, where airflow distribution is perfectly uniform, Kqi = 1.0, and ∆Kqi = 0. In cases of non-uniform airflow distribution, Kqi will fluctuate between 0 and 1, and ∆Kqi ≠ 0. A larger value of ∆Kqi indicates poorer airflow uniformity, while a smaller value suggests a more uniform distribution. Typically, if the relative deviation of the processed air volume does not exceed 15%, the airflow distribution is considered relatively uniform.
2.
Integrated flow uneven amplitude
The integrated flow uneven amplitude Δ K ¯ ξ is the average of the absolute differences between the flow distribution coefficients of all filter bags and the ideal uniformity coefficient of 1.0, as expressed by the following formula:
Δ K ¯ ξ = K q i 1.0 / N ,
where N is the total number of filter bags in the model. This parameter provides a comprehensive assessment of flow deviation across all filter bags, offering a more accurate evaluation of the overall airflow uniformity.
3.
Relative root mean square values (RMS)
The RMS value (σ) of the filtration air volume of the bags is used to assess the airflow uniformity across the entire bag filter, calculated as follows:
σ = i = 1 n Q i Q ¯ Q ¯ 2 N .
From a statistical perspective, the RMS value reflects the degree of deviation between the airflow velocity at each filter bag and the average flow velocity. A larger RMS value indicates poorer uniformity in the airflow distribution. The following criteria are used to classify the uniformity: σ ≤ 0.25 (acceptable), σ ≤ 0.15 (satisfactory), and σ ≤ 0.10 (excellent). These criteria also allow the analysis of uniformity in the updraft along the filter bags.
4.
Relative standard deviation
The relative standard deviation (Cv) is calculated using the exit center-axis velocity of each filter bag, where s represents the standard deviation. A smaller Cv indicates a more uniform velocity distribution. Generally, the flow distribution is considered uniform when the relative standard deviation of the processed air volume does not exceed 15%:
C v = s v ¯ × 100 % ,
s = v i v ¯ 2 / N 1 1 2 .

2.4. Experimental Verification of the Model

To verify the accuracy of the numerical simulation model and the feasibility of the optimization measures, a 1:10 scaled-down single-chamber model was constructed, and a flow field distribution experimental platform was designed and built. Since this study focuses on optimizing the bag filter structure, particularly the airflow organization before entering the filter chamber, the experimental model does not include the filter bags. Instead, the tubesheet holes are used to represent the positions of the filter bags. The impact of the upper box is neglected to facilitate the measurement of airflow velocity at the outlet of each filter bag. Moreover, by replacing the deflectors in the hopper, different optimization models can be experimentally validated.
The flow field distribution experiment is based on the principle of similarity. Therefore, it is crucial that the model maintains geometric consistency with the actual device, and that the fluid within the model operates in the second self-similarity region. Before conducting the formal experiment, the airflow was gradually adjusted using a flow control valve to determine the critical velocity at which the Euler number (Eu) remains approximately constant relative to the Reynolds number, ensuring that the experimental process meets the necessary requirements.
The experimental procedure is as follows: First, the CF-11-2A frequency conversion fan provides the required system airflow. Once the flow field distribution within the model stabilizes, the wireless thermal anemometer Testo 405i is used to measure the airflow velocity at the outlets of each filter bag at the top of the experimental model’s tubesheet. The experimental setup and the corresponding simulation model are shown in Figure 4.
Given that the experimental model is scaled down and simplified, and no particulate matter is introduced in the experiment, numerical simulations were also conducted under the same conditions for comparison and analysis. This ensures logical consistency and accuracy between the two methods. A flow field distribution experiment and corresponding simulation were conducted on the original scaled-down single-chamber model. Airflow uniformity evaluation indices were calculated based on both experimental and simulation data, and the results are shown in Table 1.
As shown in Table 1, the relative error between the simulation and experimental results for the maximum flow rate uneven amplitude (∆Kqi) in the original model is relatively large, at 11.7%. The primary reason for this discrepancy is that ∆Kqi is sensitive to extreme values. In contrast, the relative errors for ∆ K ¯ ζ , σ, Cv, and the average outlet air velocity ( v ¯ o u t ) are all less than 10%. These four indices, which consider the flow distribution across all filter bags, mitigate the influence of extreme values, making them more suitable for quantitative comparison and analysis between the numerical simulation and the experiment. In conclusion, the relative errors are within a reasonable range, confirming that the CFD model design and numerical simulation settings for the bag filter are valid. The numerical simulation results can accurately reflect the actual flow field distribution, and the results can serve as a reference for the optimization design of the bag filter.

3. Results and Discussion

3.1. Flow Field Analysis for Multi-Chamber Model

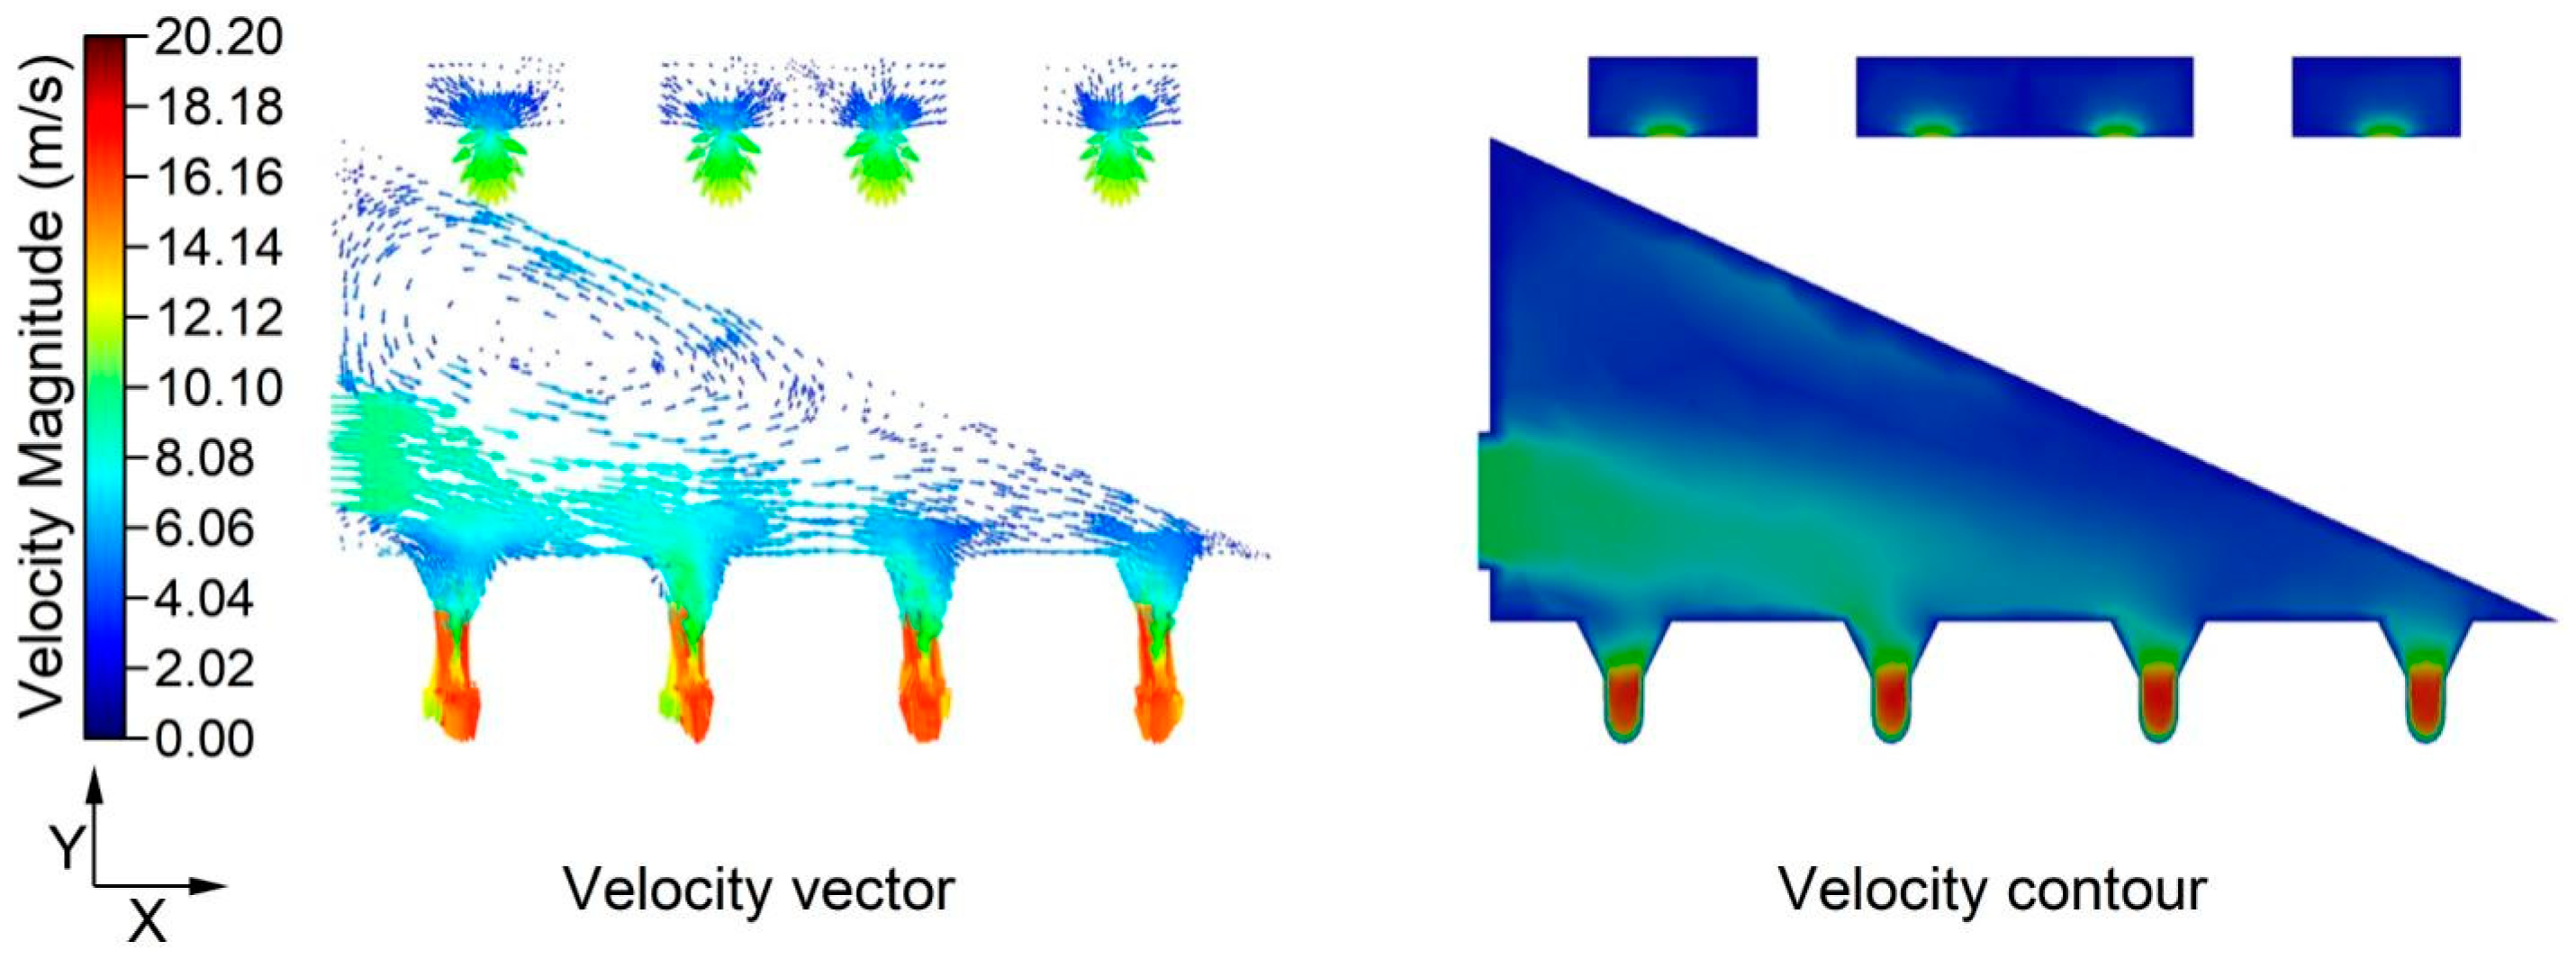
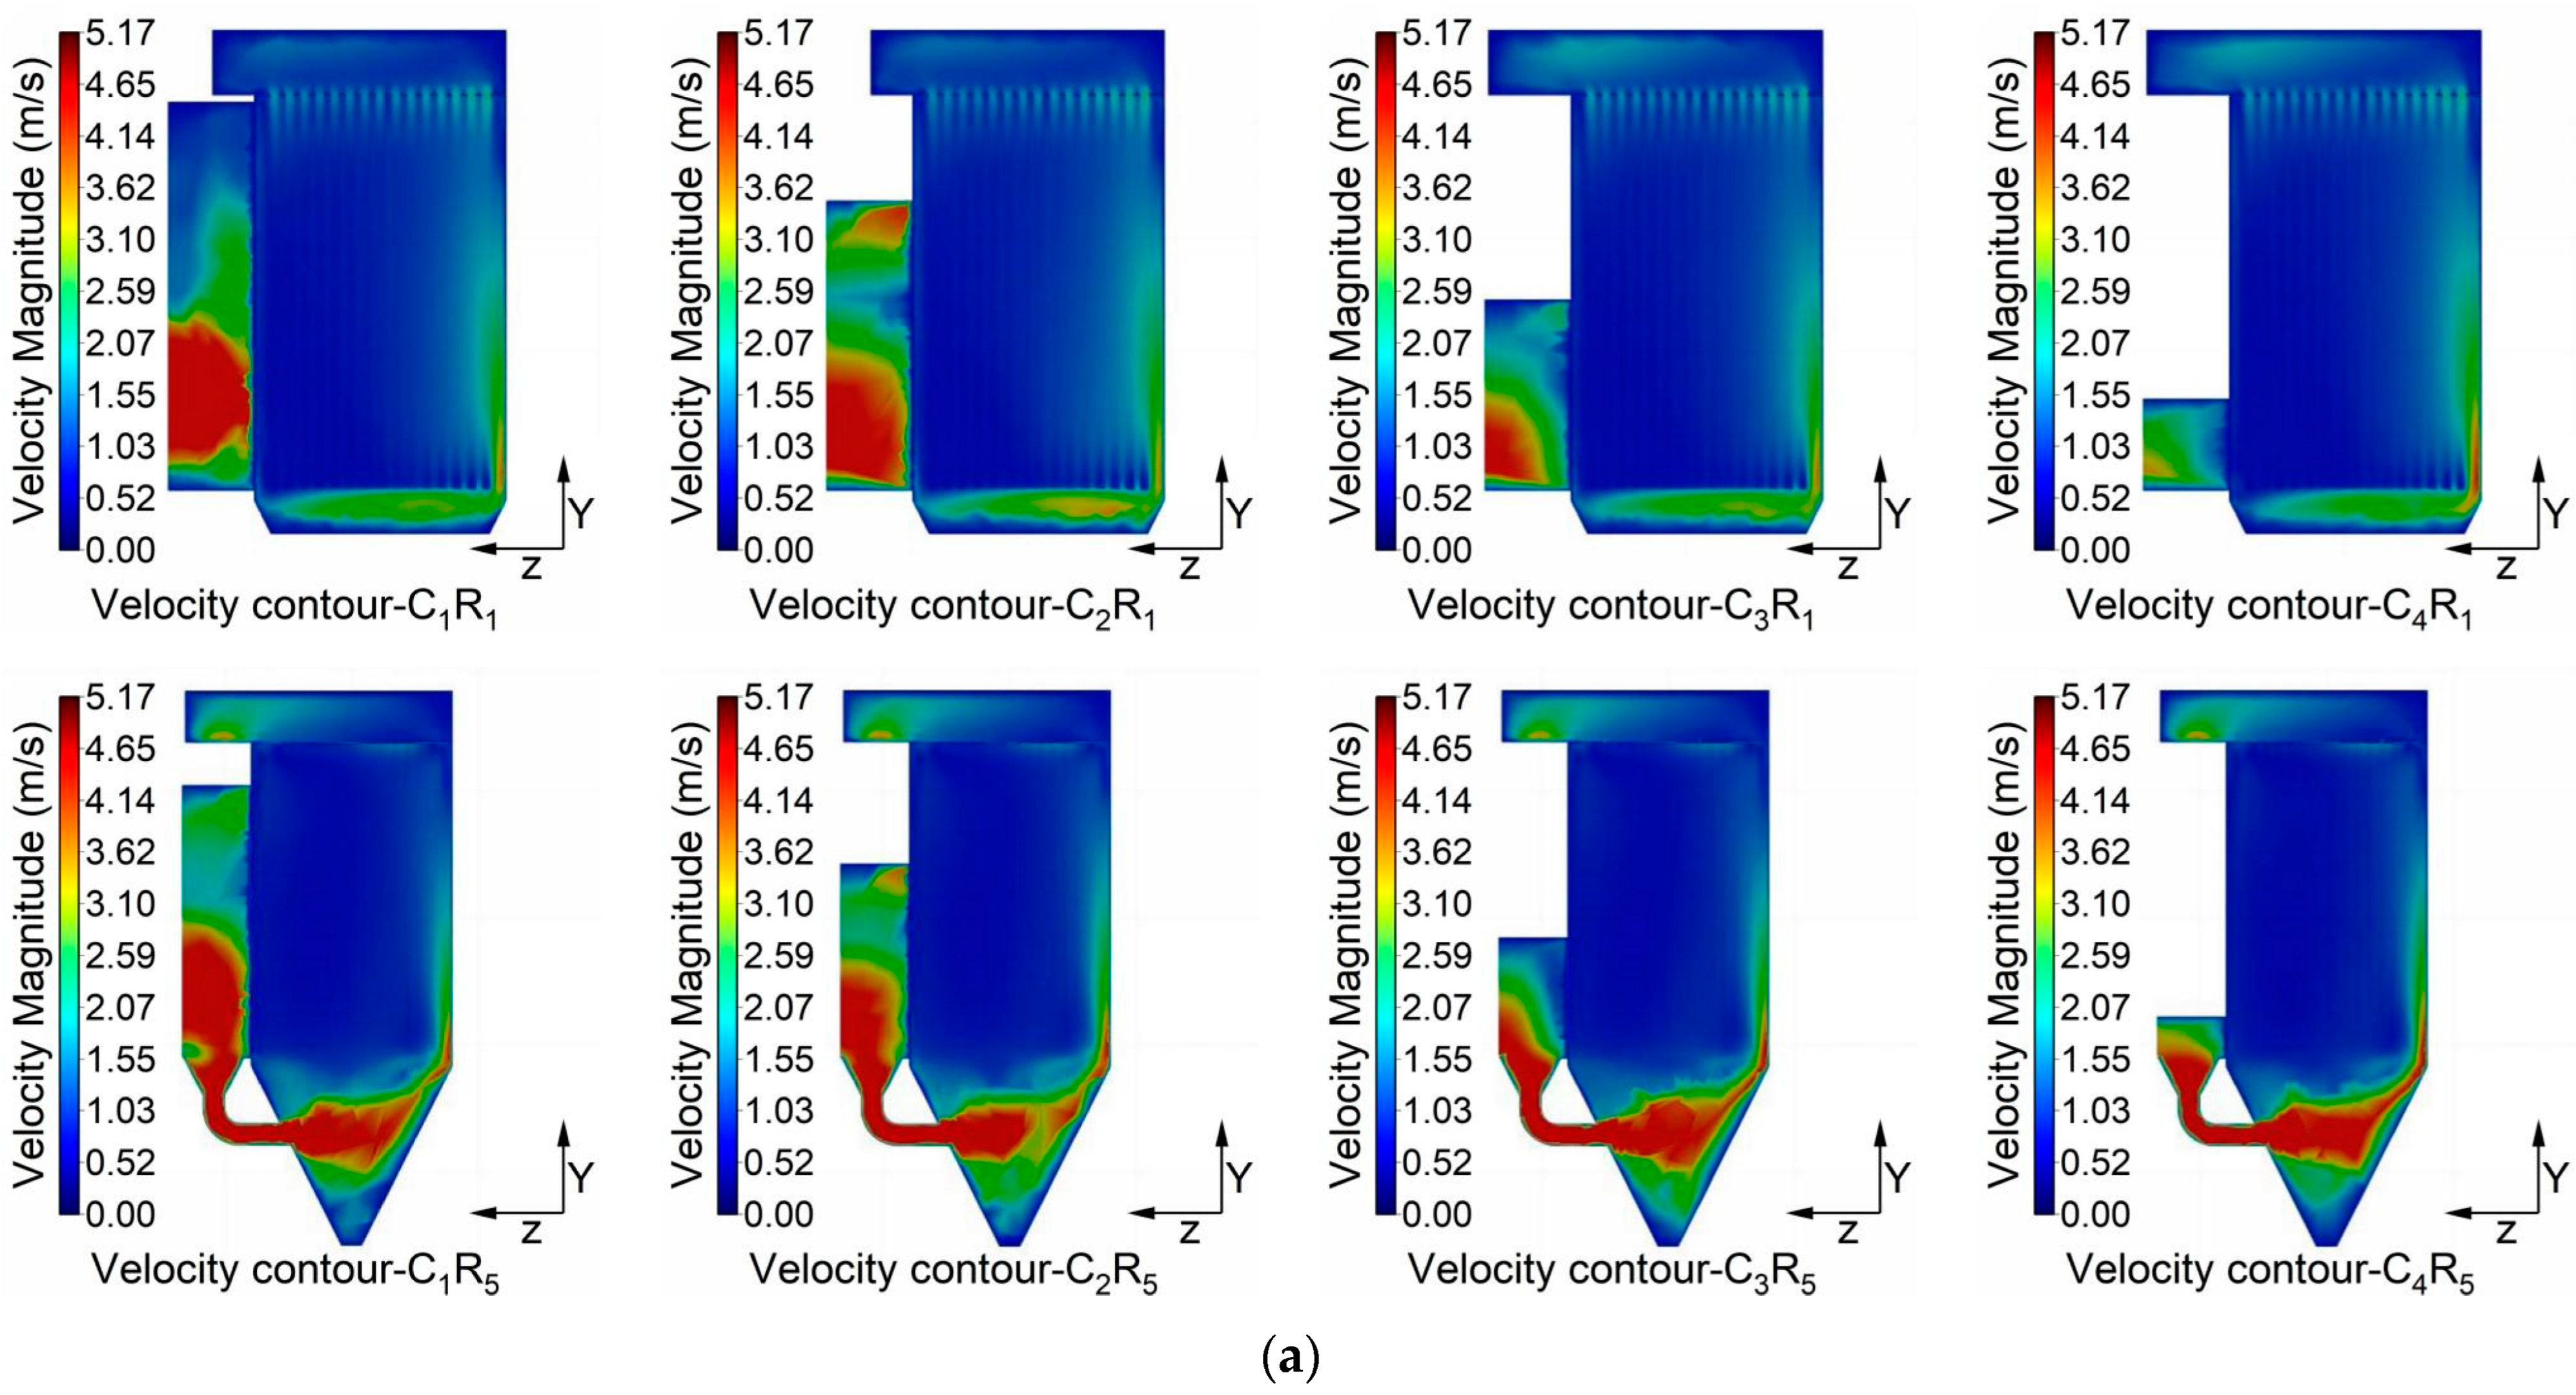
3.1.1. Overall Flow Field Distribution

A CFD simulation was conducted on the multi-chamber model to analyze flow field distribution under typical operating conditions. The bag filter used in this study has a total air handling capacity of 116,900 m3/h and a total filtration area of 4702 m2. Based on these parameters, it can be deduced that the average velocity through the filter is 0.414 m/min, so the average filtration air velocity in the simulation was set to 0.414 m/min. Figure 5 illustrates the velocity vectors and velocity contours at the cross-section of the air inlet channel.
As shown, the airflow enters the inlet channel of the multi-chamber bag filter at a velocity of 8.45 m/s. As the inlet channel narrows, the inclined deflector directs the airflow, with most of it flowing through the hopper and into the individual filter chambers. Above the inlets of hoppers 1 and 2, some of the airflow is compressed, creating vortices, while the remainder moves forward under the influence of the deflector, eventually reaching hoppers 3 and 4.
In order to further analyze the airflow distribution within each chamber, the velocity and pressure distribution contours at key cross-sections of the multi-chamber model were examined, as shown in Figure 6 and Figure 7.
From the velocity contours at the R5 cross-section of each chamber shown in Figure 6a, it is evident that after the airflow enters the hopper’s trumpet-shaped inlet, it accelerates and is injected at high velocity due to the constriction and guidance of the channel walls. Upon impact with the hopper wall, part of the airflow rises rapidly along the wall, while another portion forms a distinct vortex within the hopper. This vortex can easily re-entrain settled dust, which then adheres to the filter bag surface, resulting in a rapid increase in filtration resistance. The velocity contours at the R1 cross-section, which represents the section passing through the filter bags, reveal that higher airflow velocities near the bottom of the filter bags in each chamber contribute to more severe wear, potentially causing bag rupture and significantly reducing dust collection efficiency. Furthermore, the airflow near the filter bags at the inlet is substantially lower than near the outer walls. As a result, the outer filter bags are more likely to be overloaded, while those closer to the inlet hardly bear any load. This imbalance in airflow distribution is primarily caused by the high inlet velocity, which does not allow sufficient time for the airflow to be evenly distributed across the filter bags. Consequently, strong airflow develops in certain areas, leading to the channeling phenomenon, where specific filter bags handle more of the airflow while others remain underutilized. This uneven loading results in a significant reduction in the overall filtration efficiency of the system.
The pressure contours shown in Figure 6b indicate that the pressure near the outermost wall along the air inflow in each chamber is higher, as the kinetic energy of the high-velocity airflow is converted into pressure energy upon impacting the wall. The pressure in Chamber 1 is the lowest, followed by Chambers 4, 3, and 2. Despite variations in internal pressure, the inlet-outlet pressure drops for the chambers are nearly identical: PC1 = 105.02 Pa, PC2 = 104.83 Pa, PC3 = 104.31 Pa, and PC4 = 105.15 Pa. These results suggest that the inlet–outlet pressure drops are consistent, despite the internal pressure variations across the chambers.
To investigate airflow distribution in different regions of each chamber along the direction of the inlet airflow, cross-sections along the Z-axis were analyzed, with the results shown in Figure 7.
It can be observed that the airflow velocity near the filter bag bottom and close to the walls is higher, leading to accelerated wear in these regions. In the central section of the filter chamber, both velocity and pressure distributions are relatively uniform, indicating that airflow within the middle section of the filter bag remains stable. At the outlet end near the tubesheet, the internal–external pressure difference of the filter bags is larger compared to the middle section, resulting in an increase in airflow velocity. This is due to the upward airflow encountering the tubesheet, causing the conversion of kinetic energy into pressure energy. The internal–external pressure difference across the filter bag shows a distinct pressure jump, reflecting the resistance characteristics of the filter bag as a porous medium.
A comprehensive analysis of the flow field distribution at various cross-sections of the multi-chamber model reveals several consistent patterns across the chambers. In the filter chamber, the central region exhibits a relatively uniform velocity field, while the areas near the bag bottoms and chamber walls experience higher flow velocities. This variation is primarily due to the high-velocity jet entering the hopper, which encounters obstruction by the outer hopper walls. This causes the jet to diffuse laterally, generating an upward vortex that increases the flow velocity near the side walls. Meanwhile, the central region of the chamber maintains lower velocities. This uneven flow field leads to non-uniform airflow between the filter bags, resulting in varying degrees of wear on each bag. Additionally, lateral vortices may form beneath the bags, accelerating their deterioration and complicating the detection of damaged bags. This makes it more difficult to determine the optimal time for bag replacement, further affecting the overall performance and longevity of the filter system.

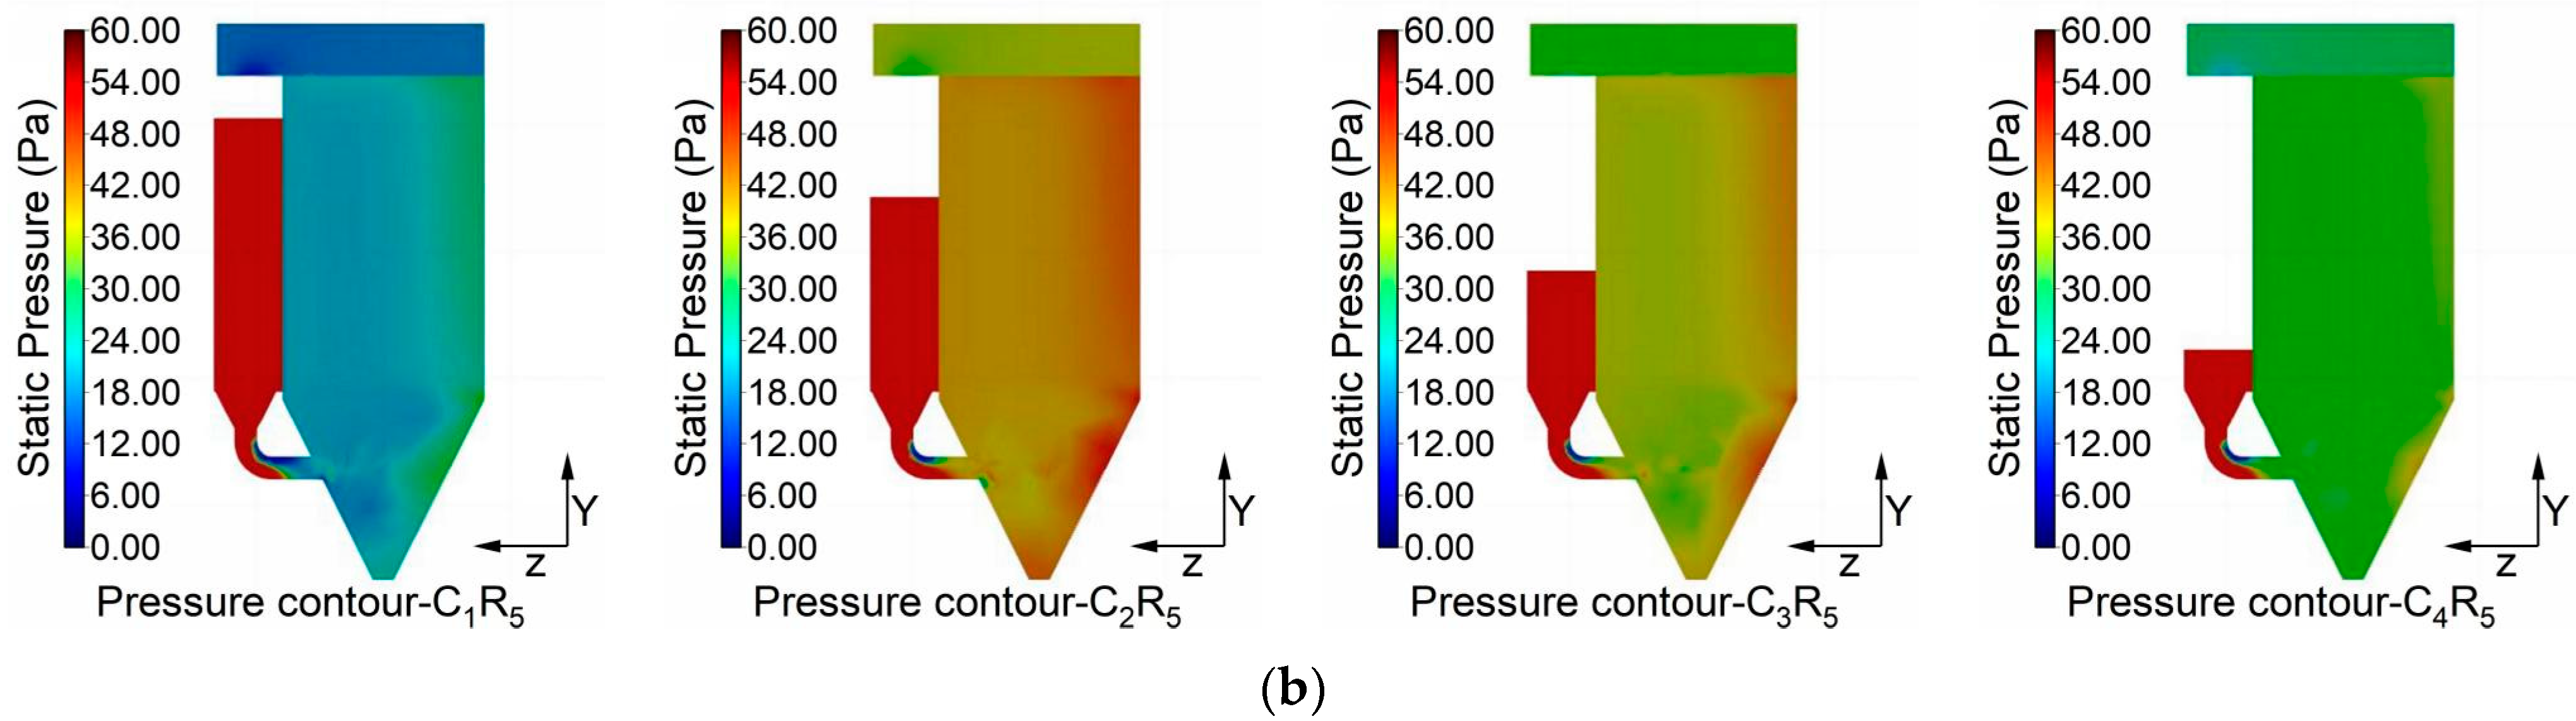
3.1.2. Filtration Flow Distribution of Filter Bags

To examine the flow distribution characteristics of filter bags within different chambers of the multi-chamber model, this study analyzed nine filter bags located at positions Z1-X1, Z1-X7, Z1-X13, Z8-X1, Z8-X7, Z8-X13, Z15-X1, Z15-X7, and Z15-X13 in each chamber. These filter bags were selected from both regions near the chamber walls and the central area of the filter chamber, enabling a comparison of flow distribution variations at various locations within the chamber. Figure 8 illustrates the variation curves of the center axis velocity along the Y-axis for each filter bag.
As shown, the center axis velocities of the filter bags fluctuate significantly along their length, reflecting differences in filtration velocity and wear across different lengths of the bags. Specifically, a sharp increase in velocity is observed for all filter bags within the range of −1 m to 0 m. This is primarily due to the conversion of kinetic energy into pressure energy as the upward airflow encounters resistance from the tubesheet, allowing a substantial volume of air to enter the filter bags. Furthermore, the velocity distribution trends along the center axis of filter bags at the same position within different chambers remain generally consistent, with only minor variations. These differences are most pronounced in the middle section of the filter bags (from −5 m to −1 m), while the velocity distribution in the inlet section (−6 m to −5 m) and outlet section (−1 m to 0 m) shows little variation.
Through comparative analysis, it is evident that the center axis velocity curves of filter bags at different positions within the same filter chamber exhibit notable discrepancies, particularly along the Z-axis (the airflow inlet direction). The velocity fluctuations are most significant for the filter bags in the Z1 row, while the velocities of the filter bags in the Z8 and Z15 rows remain relatively stable in the −5 m to −1 m range. This indicates a considerable degree of unevenness in the flow distribution near the outer chamber walls along the airflow inlet direction.
In conclusion, the flow field distribution in each chamber of the multi-chamber bag filter shows a similar pattern, but all chambers exhibit uneven flow near the outer walls. The high-velocity inlet airflow, upon colliding with the walls, diffuses laterally, significantly affecting the internal flow field distribution within the filter chamber. This distribution pattern primarily arises from the fact that, upon entering the hopper, part of the high-velocity airflow ascends along the hopper walls and enters the filter chamber. As a result, higher airflow velocities are observed near the outer chamber walls, and the airflow moves laterally along the walls, leading to uneven flow distribution at the upper corners of the chamber. This phenomenon results in increased scouring of the filter bags located near the walls and top corners, significantly reducing their lifespan compared to those positioned in the central regions. Consequently, the wear on the filter bags is uneven, making it difficult to identify the identification of damaged bags and increasing the costs associated with bag replacement.

3.2. Optimization Design of the Bag Filter

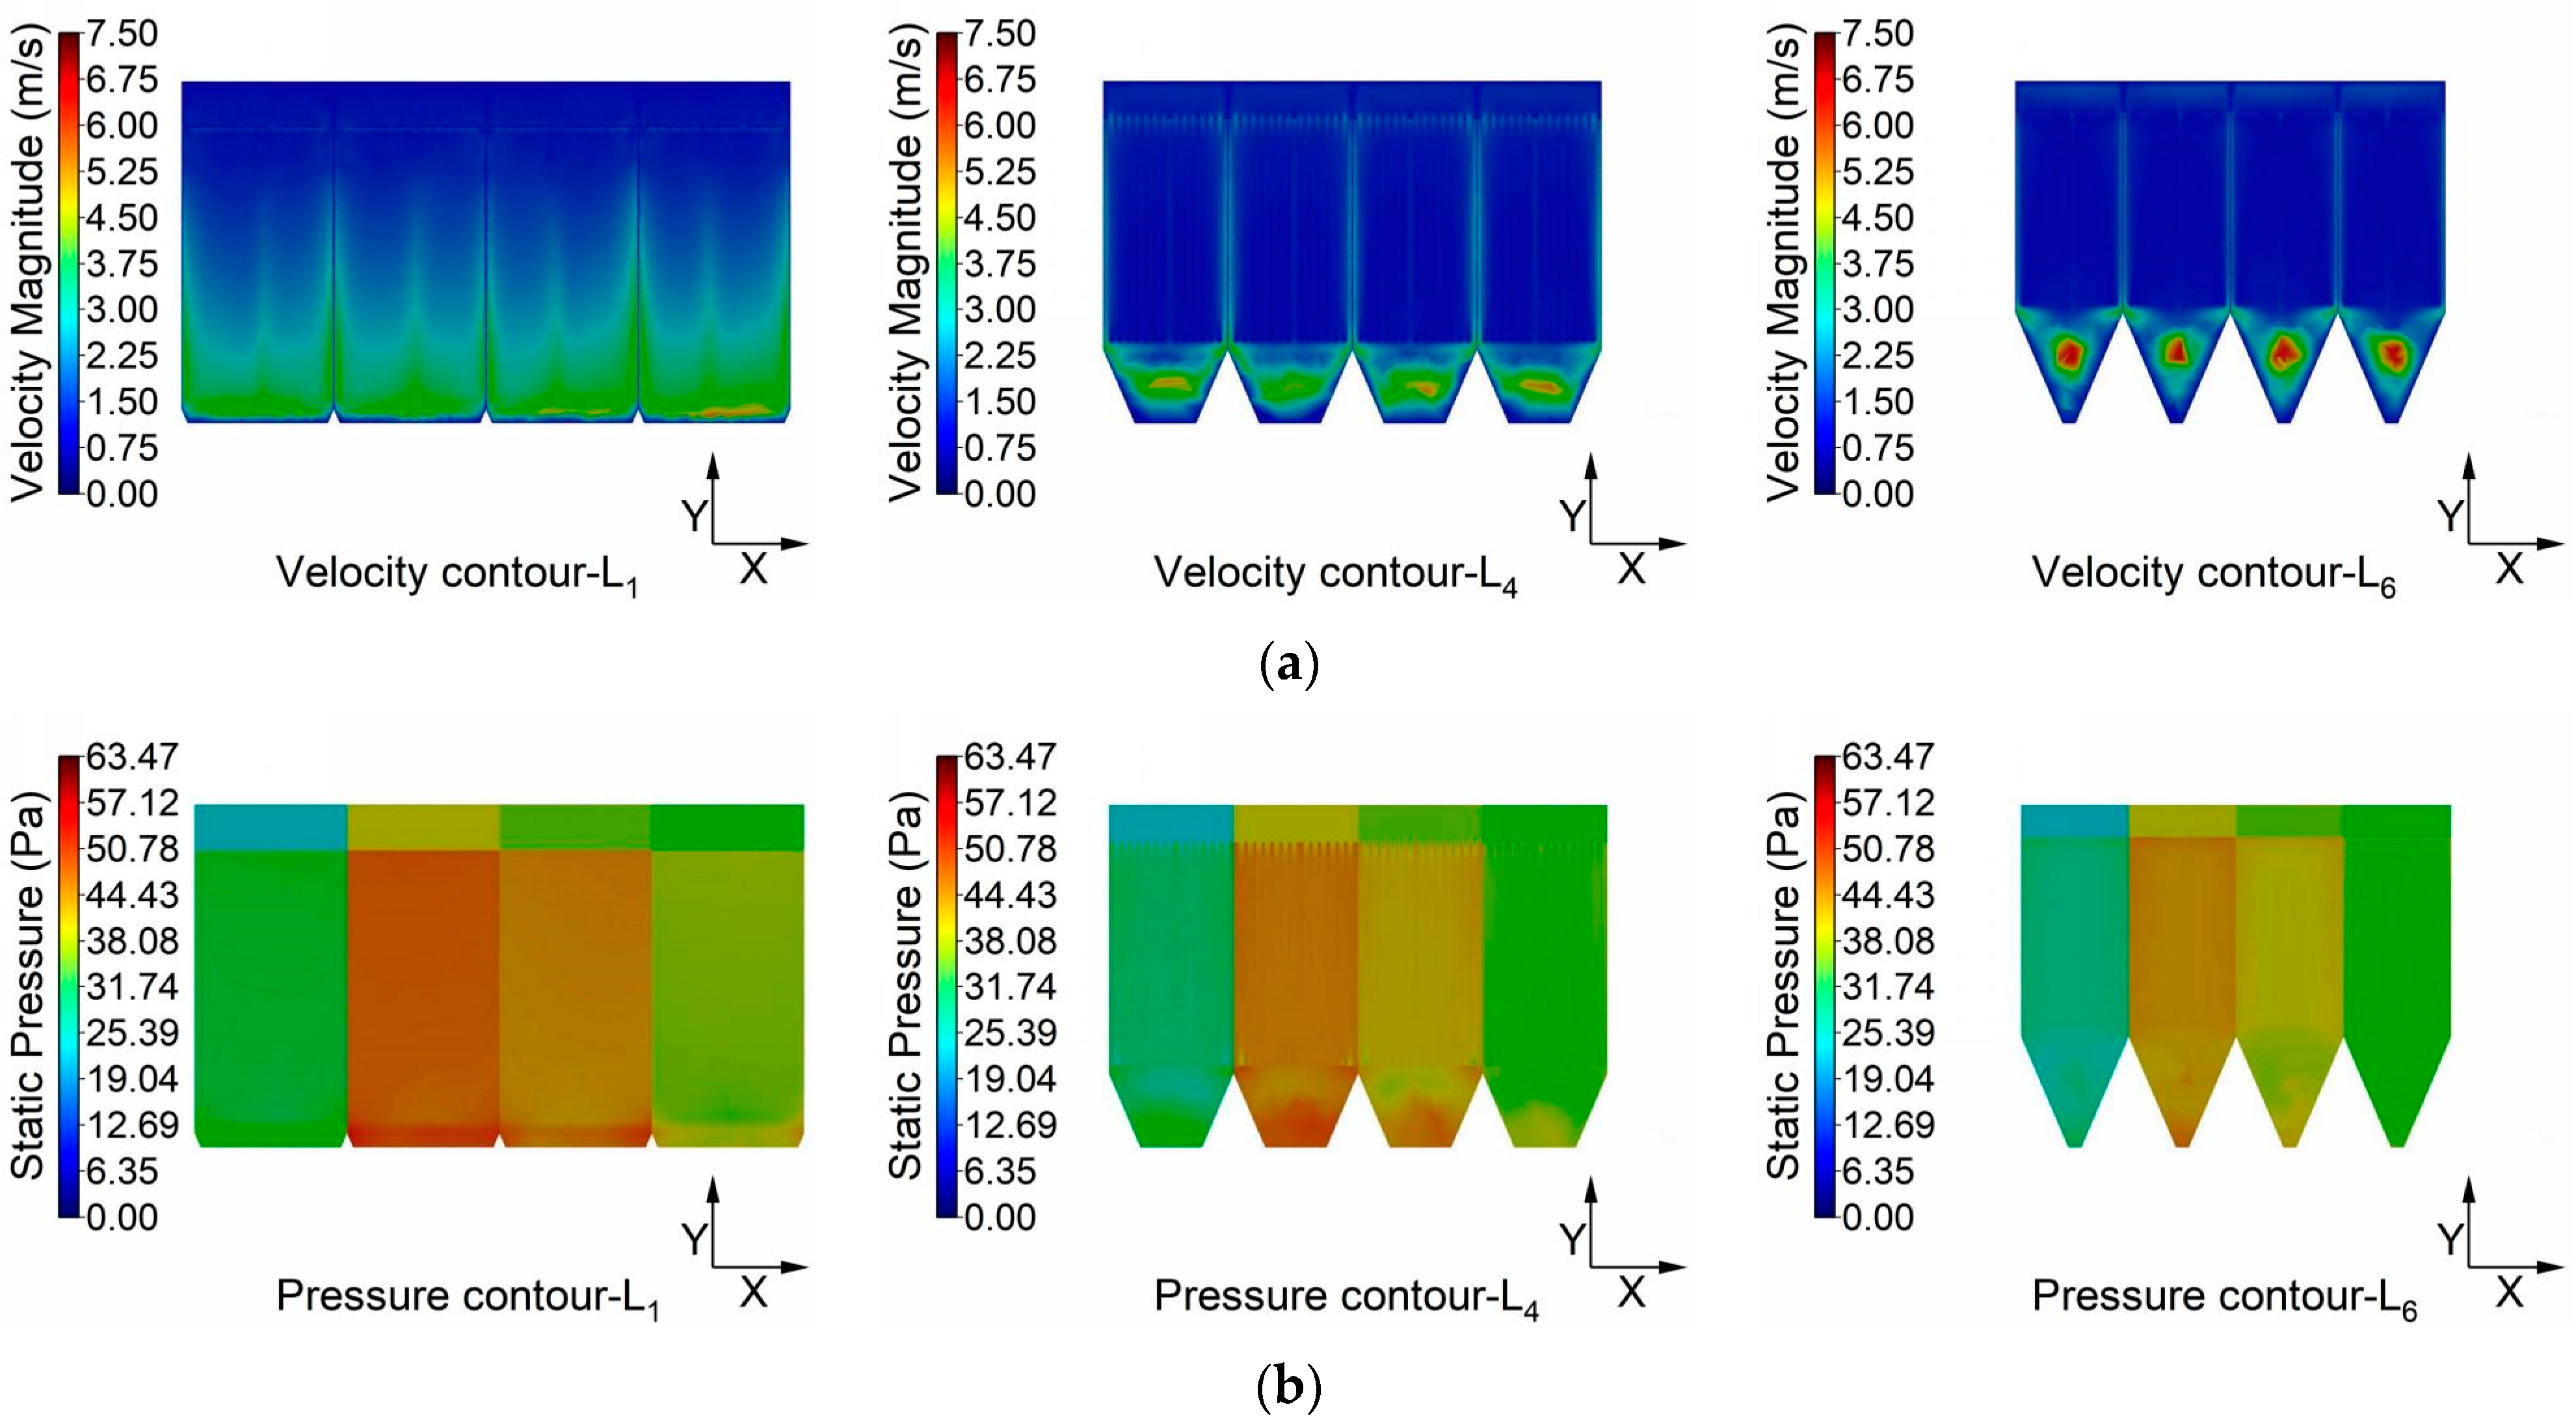
3.2.1. Structural Optimization Design

The numerical simulation results for the multi-chamber bag filter model indicate that the flow field distribution near the chamber walls, away from the hopper inlet, is less uniform in each chamber, with a higher overall flow velocity. As a result, the filter bags in this region experience more severe wear. To improve the airflow distribution before entering the filter chamber, this study proposes an optimization measure that incorporates three vertical descending deflectors within the hopper.
Initially, three sets of models were developed, each featuring different deflector lengths with fixed spacing between the deflectors (Schemes 1–3). Additionally, three other sets of models were created with fixed deflector lengths and varying spacing between the deflectors (Schemes 1, 4, 5). Subsequent optimization results will guide the adjustment of combinations of different deflector lengths and spacings. The intake channel of the hopper has a diameter of 500 mm, and the 1304 mm long deflector is aligned with the center axis of the inlet channel at its bottom end. Detailed information about each optimization model with added deflectors is provided in Table 2. A schematic representation of Three Deflectors Scheme 1 is shown in Figure 9.

3.2.2. Validation Based on Scaled-Down Simplified Models

To validate the effectiveness of the proposed optimization measures, flow field distribution experiments were conducted on five sets of 1:10 scaled-down simplified models, each incorporating three vertical descending deflectors. The experimental setup and parameters were consistent with those used in the flow field distribution experiments for the original model, as outlined in Section 2.4. Corresponding CFD simulations were also performed under the same scale and operating conditions. The results are summarized in Table 3.
As shown in the table, the relative errors between the simulated and experimental values of ∆ K ¯ ξ , σ, Cv, and v ¯ o u t for each optimization model are all less than 10%. This confirms that the model design for all optimization schemes is both reasonable and feasible for practical operation.
By comparing the airflow uniformity indices of each scaled-down simplified model with three vertical descending deflectors, it can be seen that Scheme 3 achieves a notable optimization effect among the models with varying deflector lengths (Schemes 1, 2, and 3). Meanwhile, Scheme 4 shows a more effective optimization among the models with varying deflector spacings (Schemes 1, 4, and 5). Moreover, by comparing the airflow uniformity evaluation indices of the original model from Table 2, it is clear that adding deflectors results in an improvement in airflow uniformity.
CFD simulations were performed under the same experimental conditions to generate internal flow field distribution contours for the different scaled-down simplified models, as shown in Figure 10. R5 represents the vertical cross-section at the center of the bag filter along the air inflow direction, displaying the distribution of high-velocity inlet air after interacting with the deflector plates. Y1 represents the cross-section at the outlet of the filter bag, showing the velocity distribution of the filtered air from each bag. Y2 corresponds to the bottom cross-section of the filter bag, illustrating the airflow distribution before entering the filtration area.
From Figure 10a, it is evident that the high-velocity airflow entering the dust hopper from the inlet channel sequentially impacts the three deflectors. After the collision, the airflow splits into two parts: one part rises along the deflector surfaces into the middle chamber, while the other part moves downward from the bottom edge of the deflectors at a specific angle, forming a vortex at the bottom of the hopper. As seen in Figure 10c, the velocity at the 130.4 mm deflector (with its bottom aligned with the center axis of the intake channel) is significantly higher, indicating its effectiveness in guiding the airflow.
The velocity distribution contours of three optimized models, each with different deflector lengths (Schemes 1, 2, and 3), were compared. From Figure 10a, it can be observed that both Scheme 1 and Scheme 3 generate significant vortex phenomena at the bottom of the dust hopper. In contrast, Scheme 2 exhibits a more uniform velocity distribution in this region, reducing the likelihood of secondary dust lifting. However, as shown in Figure 10b, the outlet airflow distribution in Scheme 2 is more uneven. Furthermore, Figure 10c reveals more pronounced scouring at the outer walls and top corners of the filter chamber in Scheme 2. In contrast, Scheme 3 demonstrates a more organized airflow distribution before entering the filter bag area, with a more uniform flow velocity distribution at the outlets of each filter bag.
In the present study, the velocity distribution contours for the three optimized models with varying deflector spacings (Schemes 1, 4, and 5) were compared. Notably, the 130.4 mm deflectors in both Scheme 1 and Scheme 5 are positioned identically, while the 130.4 mm deflector in Scheme 4 is placed closer to the inlet. As shown in Figure 10b, the velocity field distribution patterns at the 130.4 mm deflector location are similar in Schemes 1 and 5. However, in Scheme 4, the airflow impacts the deflector at a higher velocity, resulting in a significant increase in airflow velocity near the side wall. Further observation reveals that the outlet air velocities from the filter bags in Scheme 5 exhibit the greatest variability, while those in Schemes 1 and 4 show less variation.
Based on the comparative analysis of the flow field and airflow uniformity evaluation indices for each optimization scheme in the scaled-down simplified models, it can be preliminarily concluded that, for the two designs with different deflector lengths and different deflector spacings, respectively, the flow field distribution patterns of Scheme 3 and Scheme 4 are more reasonable, with relatively better optimization effects.

3.2.3. Comparative Analysis of Full-Scale Optimization Models

To obtain a more accurate representation of the internal flow field distribution and particle movement, as well as to more precisely compare the optimization effects of different schemes, CFD simulations were conducted on the full-scale model of each optimization scheme under typical operating conditions. The continuous phase velocity contours are shown in Figure 11, while the particle trajectory plots are presented in Figure 12.
By comparing the continuous phase velocity contours of the R5 cross-section of each model in Figure 11, it is evident that the dust-laden air enters the hopper from the inlet channel and impacts the descending deflectors. After the collision, part of the airflow rises along the deflector into the filter chamber, while another portion continues forward, and eventually strikes the hopper wall. Some of the airflow then moves upward along the wall, while the remainder flows downward, forming a vortex at the bottom of the hopper. Vortices are also observed between the deflectors and between the deflectors and the hopper walls.
A closer examination of the velocity contours of the R5 cross-section reveals that after the high-velocity dust-laden air enters the hopper via the inlet channel, the 804 mm long descending deflector (the first deflector in Scheme 2) has minimal impact on the continuous phase flow. Similarly, the 1054 mm long deflector (the first deflector in Schemes 1, 4, and 5 and the second deflector in Scheme 2) shows limited guiding effect. However, after the dust-laden air collides with the 1304 mm long descending deflector, there is a noticeable shift in the flow direction. In Schemes 1, 3, 4, and 5, it is observed that, under the guidance of the 1304 mm deflector, the subsequent descending deflectors (1554 mm and 1804 mm) have little impact on guiding the continuous phase flow. The impact of the high-velocity inlet flow on the hopper walls is significantly reduced in Schemes 3 and 4, which is consistent with the results from the flow field simulations of the scaled-down simplified models.
The differing effects of deflectors with varying lengths on the inlet airflow can be explained as follows: If the dust-laden air entering the hopper is viewed as a cylindrical jet, the bottom edge of the 1054 mm long deflector is tangent to the surface of the cylindrical jet. As a result, the dust-laden air does not directly collide with the 804 mm long deflector after entering the hopper. Instead, only a small portion of the jet is influenced by the edge of the 1054 mm long deflector, altering its flow direction. The 1304 mm long deflector divides the jet into two parts: one rises along the deflector, while the other is directed downward at an inclined angle. Due to the inclined airflow, only a small portion of air along the edges collides with the 1554 mm and 1804 mm long deflectors, while the majority of the airflow moves directly toward the hopper wall.
Velocity contour analysis of the R1 cross-section from the different models shows that in Schemes 1, 2, and 5, the airflow velocity near the bottom of the filter bags is higher near the outer walls. In contrast, in Scheme 3, the airflow velocity near the inlet is higher at the bottom of the filter bags. This indicates that the four deflector designs do not adequately address the channeling phenomenon within the bag filter. By comparison, Scheme 4 demonstrates better consistency in the airflow velocity near the surfaces of the filter bags on both the inner and outer sides, allowing for a more uniform distribution of airflow across the filter bag area. This configuration helps to alleviate the channeling phenomenon more effectively.
From the particle trajectory plots in Figure 12, it is evident that when the dust-laden air encounters the deflectors, some particles alter their trajectories due to collisions and rebounds, while most particles flow along with the airflow. Some particles move upward along the deflector into the filter chamber, where they are captured by the filter bags, while others continue forward until they impact the hopper wall. Simultaneously, particles are influenced by the vortices within the hopper, preventing direct capture by the hopper wall and resulting in longer residence times within the hopper. It should be noted that the addition of deflectors alters the particle trajectories, which can lead to more severe wear on certain areas of the filter bags. For instance, larger particles, influenced by gravity settling, may cause more concentrated wear on the lower regions of the filter bags. This study, however, focuses on a limited range of particle sizes.
In the models of Schemes 1, 3, 4, and 5, particles experience prolonged residence times in the region between two deflectors, particularly between the 1304 mm long deflector and its adjacent deflectors. This occurs because the deflector boundaries are set to reflect the particles, with the 1304 mm long deflector having the most significant blocking effect, causing particles to collide with and rebound off its surface. Additionally, as shown in Figure 11, the area between this deflector and the front and rear walls is highly prone to vortex formation. Consequently, particles are influenced by the vortex, continuously rebounding and remaining trapped between the 1304 mm long deflector and its adjacent deflectors for extended periods. In contrast, in the Scheme 2 model, the prolonged residence of particles due to continuous rebound between the deflectors is less pronounced. This is because, in this model, the 1304 mm long deflector is positioned closer to the hopper’s outer wall, where vortices mainly form near the outer wall.
Further analysis of Figure 12 reveals a significant difference in the degree of wear along the Z-axis for Scheme 2 and Scheme 3 with the introduction of descending deflectors in the dust hopper, compared to the other models. This is evidenced by the observation that, in both scenarios, particles do not pass through certain areas of the filter bag. This suggests that the deflector arrangements in these two schemes are not conducive to the uniform distribution of particulate matter once it enters the filter area.
To assess the optimization effectiveness of each scheme compared to the original model, airflow uniformity was evaluated for all models. First, in order to highlight the differences in airflow distribution among the models, the bag flow distribution coefficients for each model were plotted based on the simulation results, as shown in Figure 13.
Upon examining the filter bag flow distribution coefficient plots for each model in Figure 13, it is evident that the airflow handled by each filter bag in the original model varies significantly, with these differences closely linked to the filter bag’s location. In the Z-direction, the highest flow distribution coefficient is observed for the filter bag near the outermost sidewall of the filter chamber (row Z1), which then gradually decreases, followed by a slight increase near the air inlet. The flow distribution coefficients of the bags located at the chamber’s center are generally lower than those near the surrounding sidewalls, with the highest and lowest values occurring at positions X1Z1 and X7Z7, respectively. In contrast, in the optimization models with deflectors, the flow distribution coefficients exhibit less fluctuation compared to the original model, with the Kqi values approaching 1. This suggests that the addition of deflectors significantly improves the airflow distribution within the filter chamber, resulting in more consistent airflow across the filter bags. Among these models, the flow distribution coefficient curve of Scheme 3 is the smoothest, indicating the most uniform internal airflow distribution. The flow distribution of Scheme 4 is also improved considerably, but the Kqi is slightly larger for the filter bags (row Z1) in the region close to the outer chamber wall.
Additionally, the airflow uniformity indices and pressure drop between the inlet and outlet for the original single-chamber model and each optimized model were calculated, as summarized in Table 4.
As shown in Table 4, the original model exhibits a relatively high standard deviation of the filtered air volume, with a Cv value of 25.33%, which significantly exceeds the expected standard of 15%. Additionally, the RMS value σ is greater than 0.25, indicating poor airflow distribution uniformity and highlighting substantial potential for optimization. In comparison, the airflow distribution in each of the optimized models shows improvement. Among the three models with different deflector lengths, the overall optimization order is as follows: Scheme 2 < Scheme 1 < Scheme 3. For the models with varying deflector spacings, the optimization order is as follows: Scheme 5 < Scheme 1 < Scheme 4. Notably, as the deflector lengths increase, the airflow distribution improves significantly compared to the original model. On the other hand, adjusting the spacing between the deflectors has a relatively minor impact on the overall flow field distribution.
Following a comprehensive analysis of the flow field distribution in each model, a combination of deflector designs from Schemes 3 and 4 was considered, resulting in the Three Deflectors Scheme 6 model. This model features deflector lengths of 1304–1554–1804 mm, with deflector spacings of 905–945–985–1025 mm. Numerical simulation results, as shown in Table 4, revealed that, except for the ∆Kqi index, other performance indices did not show significant improvement compared to Scheme 4.
While Scheme 3 outperforms Scheme 4 in terms of the airflow uniformity evaluation indices (∆Kqi, Δ K ¯ ξ , σ, and Cv), the results of previous studies on discrete-phase motion indicate considerable inconsistency in particulate abrasion within the filter bags in Scheme 3. Furthermore, Table 4 shows that the modeled inlet and outlet pressure drop for Scheme 4 decreased compared to the original model, whereas the pressure drop in Scheme 3 was even higher than that of the original model.
Based on the evaluation of airflow uniformity and particulate matter trajectory analysis, it can be observed that the Three Deflectors Scheme 4 model demonstrates notable improvements compared to the other models analyzed. This model achieves a more balanced airflow distribution, with a 40.3% improvement in the ∆Kqi index, a 47.4% improvement in the Δ K ¯ ξ index, a 51.8% improvement in σ, and a 51.6% reduction in the Cv index, compared to the original model. Additionally, the inlet and outlet pressure drop decreased by 11.2%, leading to reduced energy consumption.

4. Conclusions

This study utilized CFD methods to simulate and analyze the airflow distribution within the multi-chamber bag filter in a practical engineering project. An optimization strategy involving the addition of three descending deflectors was proposed, with five different schemes designed. Scaled-down flow field distribution experiments were also conducted to validate feasibility and accuracy. Multi-dimensional indices were developed to evaluate the optimization effects of each scheme. Based on the research findings, the following conclusions can be drawn:
  • Although there are numerical differences in airflow velocity and pressure across the chambers of the bag filter, they all share similar distribution characteristics. Uneven airflow distribution, primarily caused by high-velocity inlet airflow colliding with the hopper walls, leads to higher velocities near the bag bottom and sidewalls. This results in inconsistent airflow handling by the filter bags, varying levels of dust scouring due to vortex formation, and significant differences in wear and filter bag lifespan.
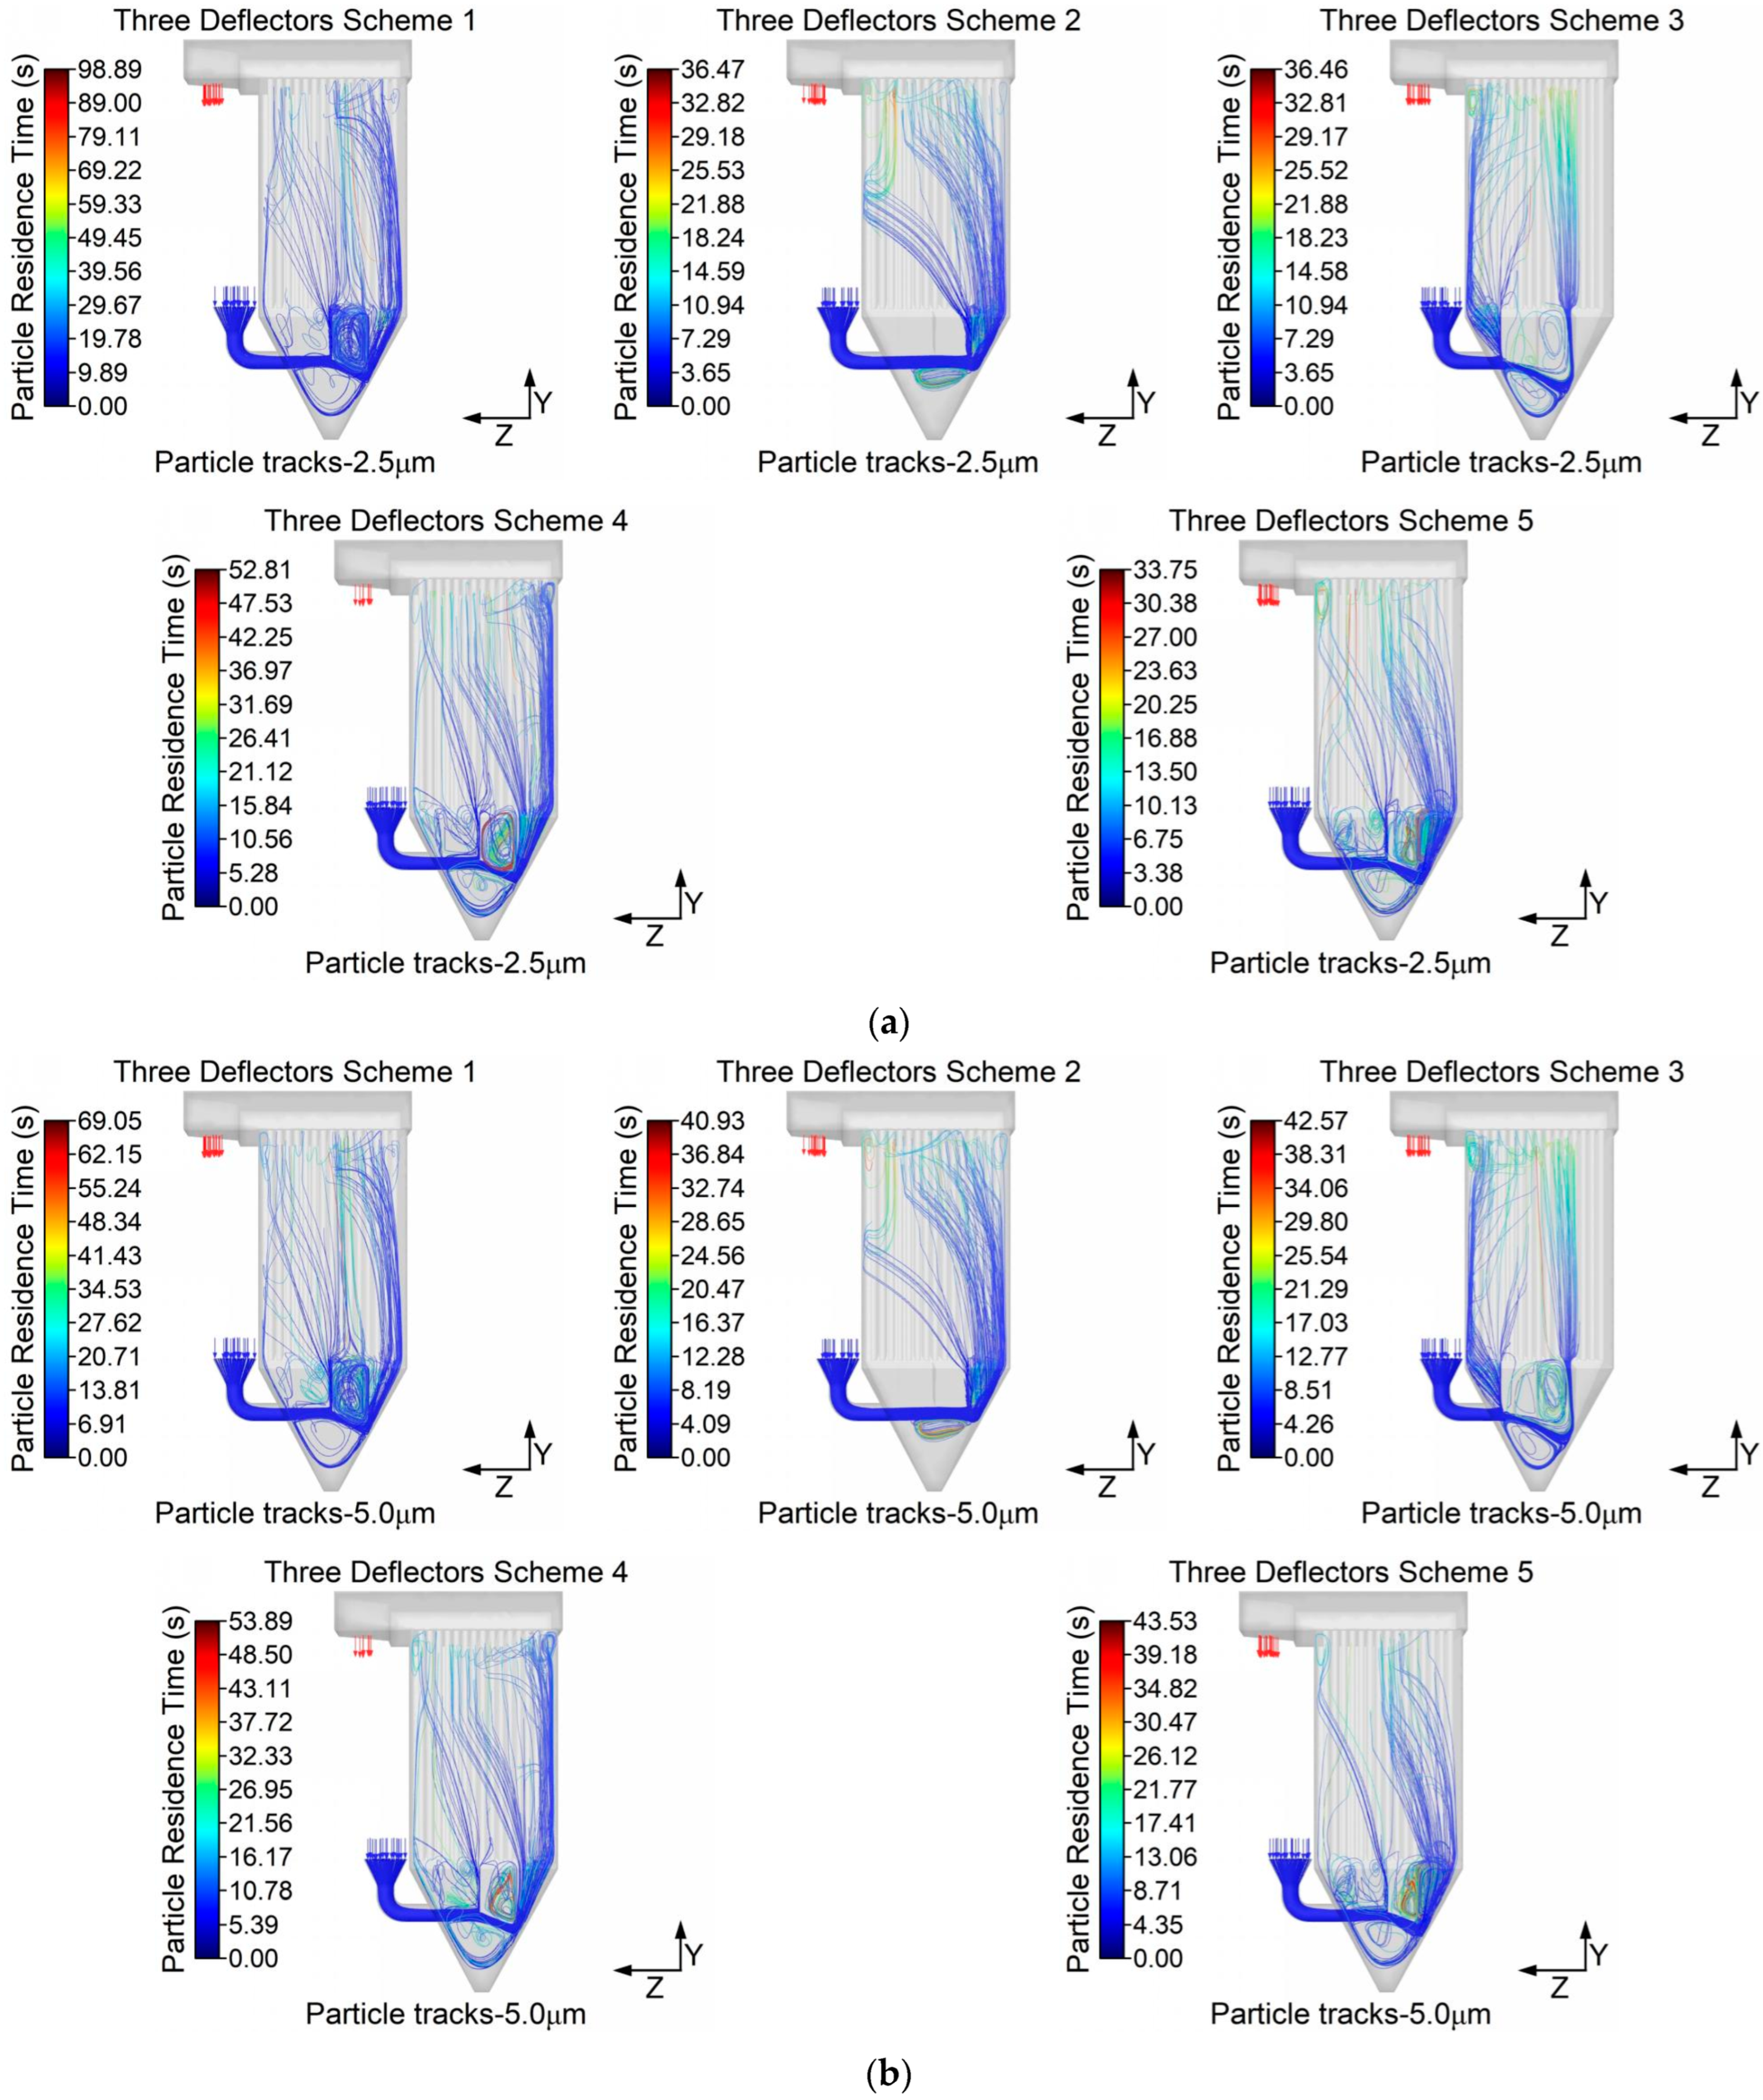
  • The addition of deflectors enhances airflow organization by guiding dust-laden air to collide with the deflectors, causing coarse particles to settle more efficiently and reducing excessive velocity, ensuring a more uniform flow into the filtration area. However, potential negative effects, such as increased abrasion and particle adhesion, should be addressed. Future research should focus on deeper investigation into the interactions between particles and deflectors to better understand their impact on filter performance.
  • Three Deflectors Scheme 4 demonstrates relatively superior optimization, achieving improvements of 40.3% in ∆Kqi, 47.4% in ∆ K ¯ ζ , 51.8% in RMS σ, and 51.6% in Cv compared to the original model. It also reduced pressure drops by 11.2%, leading to lower energy consumption. This design minimizes channeling, resulting in more uniform airflow and significantly enhanced filtration efficiency. Furthermore, it effectively guides particle movement within the filter chamber, ensuring overall improved system performance.
  • The optimization measures have currently only been applied to the single-chamber model, and the results are valid for relatively low levels of fine particulate air pollution. Future research will focus on applying these measures to multi-chamber models and generalizing the results for industrial applications. Additionally, this study derives an optimal condition within a limited range of design structures. More deflector sizes and combinations will be explored, and more accurate experimental validation based on full-scale models will be considered.

Author Contributions

Software, formal analysis, writing—original draft preparation, H.H.; writing—review and editing, S.M.; validation, Y.W.; conceptualization, resources, funding acquisition, H.M. All authors have read and agreed to the published version of the manuscript.

Funding

This research was funded by the National Key Research and Development Program of China, grant number 2022YFC3902300. The APC was funded by Hongting Ma.

Institutional Review Board Statement

Not applicable.

Informed Consent Statement

Not applicable.

Data Availability Statement

The raw data supporting the conclusions of this article will be made available by the authors on request.

Conflicts of Interest

The authors declare no conflicts of interest.

References

  1. Ottaviano, G.; Pendolino, A.L.; Marioni, G.; Crivellaro, M.A.; Scarpa, B.; Nardello, E.; Pavone, C.; Trimarchi, M.V.; Alexandre, E.; Genovois, C.; et al. The Impact of Air Pollution and Aeroallergens Levels on Upper Airway Acute Diseases at Urban Scale. Int. J. Environ. Res. 2022, 16, 42. [Google Scholar] [CrossRef]
  2. Huang, W.; Fang, J.; Song, X.; Xu, H.; Wu, R.; Song, J.; Xie, Y.; Xu, X.; Zeng, Y.; Wang, T. Associations of ultrafine and fine particles with childhood emergency room visits for respiratory diseases in a megacity. Thorax 2022, 77, 391–397. [Google Scholar]
  3. Di, Q.; Dai, L.; Wang, Y.; Zanobetti, A.; Choirat, C.; Schwartz, J.D.; Dominici, F. Association of Short-term Exposure to Air Pollution with Mortality in Older Adults. JAMA J. Am. Med. Assoc. 2017, 318, 2446. [Google Scholar] [CrossRef]
  4. Richard, L. Filter media surface modification technology: State of the art. Filtr. Sep. 2004, 41, 20–21. [Google Scholar] [CrossRef]
  5. Deuschle, T.; Janoske, U.; Piesche, M. A CFD-model describing filtration, regeneration and deposit rearrangement effects in gas filter systems. Chem. Eng. J. 2008, 135, 49–55. [Google Scholar] [CrossRef]
  6. Liu, M.; Li, Y.; Xu, Y.; Chen, L.; Wang, Q.; Ma, Q.; Yuan, X. A multi-criteria group decision making framework for sustainability evaluation of sintering flue gas treatment technologies in the iron and steel industry. J. Clean. Prod. 2023, 389, 136048. [Google Scholar] [CrossRef]
  7. Zheng, C.; Kanaoka, C. Recent advances in dust collection technology and ISO standardization in bag filtration. J. Zhejiang Univ.-Sci. A 2018, 19, 21–33. [Google Scholar] [CrossRef]
  8. Wen, Z.; Di, J.; Liu, S.; Han, J.; Lee, J.C.K. Evaluation of flue-gas treatment technologies for municipal waste incineration: A case study in Changzhou, China. J. Clean. Prod. 2018, 184, 912–920. [Google Scholar] [CrossRef]
  9. Zhang, Q.; Liu, D.; Hu, A.J.; Xu, H.L.; Chen, H.Y. Flow field and pressure characteristics in pulse-jet dust cleaning. Int. J. Environ. Sci. Technol. 2023, 20, 6735–6746. [Google Scholar] [CrossRef]
  10. Ji, Z.; Shi, M.; Ding, F. Transient flow analysis of pulse-jet generating system in ceramic filter. Powder Technol. 2004, 139, 200–207. [Google Scholar] [CrossRef]
  11. Li, J.; Li, S.; Zhou, F. Effect of cone installation in a pleated filter cartridge during pulse-jet cleaning. Powder Technol. 2015, 284, 245–252. [Google Scholar] [CrossRef]
  12. Aroussi, A.; Simmons, K.; Pickering, S.J. Particulate deposition on candle filters. Fuel 2001, 80, 335–343. [Google Scholar] [CrossRef]
  13. Huachang, C.; Liang, Y.; Joo-Hong, C. Optimization of Nozzle Design for Pulse Cleaning of Ceramic Filter. Chin. J. Chem. Eng. 2008, 16, 306–313. [Google Scholar]
  14. Shim, J.; Joe, Y.; Park, H. Influence of air injection nozzles on filter cleaning performance of pulse-jet bag filter. Powder Technol. 2017, 322, 250–257. [Google Scholar] [CrossRef]
  15. Qian, Y.; Bi, Y.; Zhang, Q.; Chen, H. The optimized relationship between jet distance and nozzle diameter of a pulse-jet cartridge filter. Powder Technol. 2014, 266, 191–195. [Google Scholar] [CrossRef]
  16. Chen, J.; Wang, B.; Yuan, K.; Kang, Y.; Feng, S.; Han, F.; Wu, H.; Zhou, R.; Zhong, Z.; Fan, Y. One-pot in situ synthesis of Cu-SAPO-34/SiC catalytic membrane with enhanced binding strength and chemical resistance for combined removal of NO and dust. Chem. Eng. J. 2021, 420, 130425. [Google Scholar] [CrossRef]
  17. Zhang, B.; Lu, Y.; Luo, X.; Wang, W.; Huang, J.; Lai, Y.; Wang, Y.; Zhang, Y.; Cai, W. Integration of dedusting and denitration in V2O5-WO3/TiO2/PTFE-based catalytic bag-filter materials: Lab- and pilot-scale testing and development of SCR models. J. Clean. Prod. 2023, 407, 137122. [Google Scholar] [CrossRef]
  18. Gao, D.; Zhou, G.; Liu, R.; Li, S.; Kong, Y.; Wang, Y. CFD investigation on gas–solid two-phase flow of dust removal characteristics for cartridge filter: A case study. Environ. Sci. Pollut. Res. 2021, 28, 13243–13263. [Google Scholar] [CrossRef]
  19. Li, W.; Shen, S.; Li, H. Study and optimization of the filtration performance of multi-fiber filter. Adv. Powder Technol. Int. J. Soc. Powder Technol. Jpn. 2016, 27, 638–645. [Google Scholar] [CrossRef]
  20. Wang, H.; Zhao, H.; Wang, K.; He, Y.; Zheng, C. Simulation of filtration process for multi-fiber filter using the Lattice-Boltzmann two-phase flow model. J. Aerosol Sci. 2013, 66, 164–178. [Google Scholar] [CrossRef]
  21. Qian, F.; Huang, N.; Zhu, X.; Lu, J. Numerical study of the gas–solid flow characteristic of fibrous media based on SEM using CFD–DEM. Powder Technol. 2013, 249, 63–70. [Google Scholar] [CrossRef]
  22. Subrenat, A.; Bellettre, J.; Cloirec, P.L. 3-D numerical simulations of flows in a cylindrical pleated filter packed with activated carbon cloth. Chem. Eng. Sci. 2003, 58, 4965–4973. [Google Scholar] [CrossRef]
  23. Yu, X.G.; Chen, J. Research on Removal Equipment for Industrial Dust Emissions with the Finite Element Method for the Manner of Filter Board and Filter Bag Layout. Appl. Mech. Mater. 2013, 345, 576–580. [Google Scholar] [CrossRef]
  24. Fu, H.M.; Zhao, Y.J. Experimental Study on Flow Field Characteristic of Bag Filter. Adv. Mater. Res. 2012, 508, 254–258. [Google Scholar] [CrossRef]
  25. Lo, L.; Hu, S.; Chen, D.; Pui, D.Y.H. Numerical study of pleated fabric cartridges during pulse-jet cleaning. Powder Technol. 2010, 198, 75–81. [Google Scholar] [CrossRef]
  26. Long, Z.; Yao, Q. Numerical simulation of the flow and the collection mechanism inside a scale hybrid particulate collector. Powder Technol. 2012, 215, 26–37. [Google Scholar] [CrossRef]
  27. Baléo, J.L.; Subrenat, A.; Cloirec, P.L. Numerical simulation of flows in air treatment devices using activated carbon cloths filters. Chem. Eng. Sci. 2000, 55, 1807–1816. [Google Scholar] [CrossRef]
  28. Kaya, F.; Karagoz, I. Numerical investigation of performance characteristics of a cyclone prolonged with a dipleg. Chem. Eng. J. 2009, 151, 39–45. [Google Scholar] [CrossRef]
  29. Lee, K.; Sohn, J.; Park, Y. Filtration performance characteristics of ceramic candle filter based on inlet structure of high-temperature and high-pressure dust collectors. J. Ind. Eng. Chem. 2015, 21, 101–110. [Google Scholar] [CrossRef]
  30. Pereira, T.W.C.; Marques, F.B.; Pereira, F.D.A.R.; Ribeiro, D.D.C.; Rocha, S.M.S. The influence of the fabric filter layout of in a flow mass filtrate. J. Clean. Prod. 2016, 111, 117–124. [Google Scholar] [CrossRef]
  31. Qianpu, W.; Melaaen, M.C.; Silva, S.R.D. A Computational and Experimental Study of Fluid Flow in a De-duster. Model. Identif. Control. 2002, 23, 53–64. [Google Scholar]
  32. Zhang, F.; Ding, Y.; Low, Z.; Jia, L.; Zhou, G.; Liu, Y.; Zhong, Z.; Xing, W. Effects of flow distributor structures and particle-wall interaction on baghouse gas-solid flow. Sep. Purif. Technol. 2024, 335, 126140. [Google Scholar] [CrossRef]
  33. Lima, W.F.; Huebner, R. Optimization of Air Distribution in a Baghouse Filter Using Computational Fluid Dynamics. Eng. Technol. Appl. Sci. Res. 2019, 9, 4452–4456. [Google Scholar] [CrossRef]
  34. Chen, C.; Cheng, M. Effect of flow distributors on uniformity of velocity profile in a baghouse. J. Air Waste Manag. Assoc. 2005, 55, 886–892. [Google Scholar] [CrossRef]
  35. Chen, C.J. Reducing pressure drop in a baghouse using flow distributors. J. Air Waste Manage. Assoc. 2001, 51, 1471–1475. [Google Scholar] [CrossRef]
  36. Ansys, Inc. Ansys Fluent User’s Guide, Release 14.0; Ansys, Inc.: Canonsburg, PA, USA, 2011; pp. 260–355. [Google Scholar]
  37. Park, S.; Joe, Y.H.; Shim, J.; Park, H.; Shin, W.G. Non-uniform filtration velocity of process gas passing through a long bag filter. J. Hazard. Mater. 2019, 365, 440–447. [Google Scholar] [CrossRef]
Figure 1. 3D modeling and numbering scheme of the bag filter. (a) 3D Models of the single-chamber and multi-chamber bag filter; (b) numbering scheme for cross-sections and filter bags.
Applsci 15 04174 g001aApplsci 15 04174 g001b
Figure 2. Porous medium resistance performance of filter bags and comparison of simulation models: (a) Resistance curve of the tested porous medium; (b) velocity contours for the porous zone and porous-jump models in the single filter bag model.
Applsci 15 04174 g002
Figure 3. Mesh validation and mesh division for the single-chamber model: (a) Outlet velocity of bag X8Z7 with different grid numbers; (b) the mesh division of the single-chamber model.
Applsci 15 04174 g003
Figure 4. Flow field distribution experimental and corresponding simulation models. (a) Field picture of flow field distribution experiment; (b) corresponding simulation model.
Applsci 15 04174 g004
Figure 5. Velocity vectors and contours at the cross-section of the air inlet channel.
Applsci 15 04174 g005
Figure 6. Flow field distribution contours at the key cross-sections of each chamber. (a) Velocity contours at the R1 and R5 cross-section; (b) pressure contours at the R5 cross-section.
Applsci 15 04174 g006aApplsci 15 04174 g006b
Figure 7. Flow field distribution contours of cross-sections along the Z-axis. (a) Velocity contours of cross-sections along the Z-axis; (b) pressure contours of cross-sections along the Z-axis.
Applsci 15 04174 g007
Figure 8. Velocity variation curve of the center axis of different filter bags in each chamber along the Y-axis.
Applsci 15 04174 g008
Figure 9. Schematic diagram of Three Deflectors Scheme 1.
Applsci 15 04174 g009
Figure 10. Internal flow field distribution contours of different scaled-down simplified models. (a) Velocity contours at R5; (b) velocity contours at Y1; (c) velocity contours at Y2.
Applsci 15 04174 g010aApplsci 15 04174 g010b
Figure 11. Velocity contours of continuous phase for the optimization models in full scale.
Applsci 15 04174 g011
Figure 12. Particle trajectory plots for the optimization models. (a) Particle diameter = 2.5 μm; (b) particle diameter = 5.0 μm.
Applsci 15 04174 g012
Figure 13. Flow distribution coefficient plot for different schemes in full scale.
Applsci 15 04174 g013
Table 1. Airflow uniformity indices and relative errors of the scaled-down original model.
SchemeKqi K ¯ ζ σCv (%) v ¯ o u t (m/s)
Original modelSimulation0.99920.21690.251625.23%0.6907
Experiment1.11610.23110.270127.08%0.6361
Relative error11.70%6.56%7.33%7.33%7.89%
Table 2. Optimized model details for adding deflectors (full-scale).
SchemeLength of the Deflectors (mm)Spacing Between the Deflectors (mm)
Three Deflectors Scheme 11054-1304-1554965-965-965-965
Three Deflectors Scheme 2804-1054-1304965-965-965-965
Three Deflectors Scheme 31304-1554-1804965-965-965-965
Three Deflectors Scheme 41054-1304-1554905-945-985-1025
Three Deflectors Scheme 51054-1304-15541130-800-800-1130
Table 3. Results of experiments and simulations for optimized model flow field distribution.
Schemes K ¯ ξ σCv (%) v ¯ o u t (m/s)
Three Deflectors Scheme 1Simulation0.19660.242124.270.6902
Experiment0.21380.255825.64190.6401
Relative error8.74%5.66%5.66%7.26%
Three Deflectors Scheme 2Simulation0.19900.250425.100.6907
Experiment0.21640.263326.40150.6370
Relative error8.73%5.19%5.19%7.77%
Three Deflectors Scheme 3Simulation0.17580.221822.230.6906
Experiment0.19160.230923.15100.6409
Relative error9.00%4.13%4.13%7.20%
Three Deflectors Scheme 4Simulation0.19450.234623.520.6907
Experiment0.20340.247124.77130.6392
Relative error4.55%5.32%5.32%7.46%
Three Deflectors Scheme 5Simulation0.19800.245824.640.6905
Experiment0.21550.257925.85560.6396
Relative error8.84%4.92%4.92%7.37%
Table 4. Evaluation indices of airflow uniformity for different schemes in full scale.
SchemesKqi K ¯ ζ σCv (%)P
Original Model1.1810.1900.25325.334523.67
Three Deflectors Scheme 10.6820.1030.13013.086535.43
Three Deflectors Scheme 20.8230.1200.15115.124527.80
Three Deflectors Scheme 30.5260.0970.11911.882532.31
Three Deflectors Scheme 40.7050.1000.12212.263465.02
Three Deflectors Scheme 50.7630.1130.14314.335523.48
Three Deflectors Scheme 60.5640.1100.13213.244533.46
Disclaimer/Publisher’s Note: The statements, opinions and data contained in all publications are solely those of the individual author(s) and contributor(s) and not of MDPI and/or the editor(s). MDPI and/or the editor(s) disclaim responsibility for any injury to people or property resulting from any ideas, methods, instructions or products referred to in the content.

