1. Introduction
Multi-criteria decision-making (MCDM) methods are essential for addressing complex problems that involve multiple, often conflicting, factors. Among these, the Technique for Order of Preference by Similarity to Ideal Solution (TOPSIS) is widely used due to its ability to effectively rank alternatives based on their closeness to an ideal solution.
Clustering techniques are increasingly relevant in TOPSIS-based applications because they enable decision-makers to group alternatives with similar characteristics before performing the ranking procedure. This segmentation enhances the interpretability of results and allows for more context-sensitive comparisons. Rather than applying a one-size-fits-all ranking across a diverse set of alternatives, clustering allows each group to be evaluated against a tailored ideal profile, reflecting specific priorities or constraints. In this way, clustering not only increases adaptability to real-world scenarios but also improves the fairness and clarity of the final rankings.
However, despite its advantages, certain challenges remain—particularly related to clustering and normalization. Traditional clustering methods tend to assign alternatives to fixed categories, even when those alternatives share features with multiple groups. This rigid classification can lead to misinterpretation and the loss of valuable information, especially when the data involves uncertainty or overlapping characteristics. Likewise, widely used normalization techniques—such as Min–Max and Z-score—often struggle to manage large data variations, skewed distributions, and extreme values, which can distort rankings and introduce bias into decision-making.
To overcome these limitations, this study proposes two innovative methods designed to make the TOPSIS framework more flexible, reliable, and user-friendly. The first is Clustering Using Fuzzy Numbers and Centroid-Based Distance Allocation, a novel clustering approach that incorporates fuzzy numbers to represent uncertainty in the evaluation of alternatives. Unlike traditional clustering methods such as K-Means—where cluster centroids are determined based on the data of existing elements—our approach defines the centroid of each cluster a priori, based on expert judgment and ideal conditions for each criterion. Alternatives are then evaluated using fuzzy numbers to account for uncertainty, and their distances to the predefined cluster centroids are computed using crisp values derived from these fuzzy assessments. This process avoids arbitrary assignments and provides a more structured, interpretable classification framework that reflects both expert intent and the inherent imprecision of real-world data.
The second innovation is logarithmic normalization in TOPSIS, a transformation technique that smooths extreme variations, preserves proportional differences, and prevents any single criterion from dominating the final rankings. A key benefit of this technique is that, while it enhances stability and accuracy, it remains as straightforward to apply as traditional methods like Min–Max or Z-score normalization, making it a practical enhancement for decision-makers.
By integrating these two methodological advancements, this study improves both the clustering and normalization components of the TOPSIS framework, addressing key limitations in traditional approaches while maintaining simplicity and efficiency.
Unlike traditional data-driven clustering algorithms, the proposed method allows decision-makers to define ideal cluster profiles independently of the dataset. This design, combined with the use of fuzzy numbers to capture evaluation uncertainty, enables a simple yet robust classification process. The deterministic assignment of alternatives enhances transparency and interpretability, making the approach both innovative and well-suited for real-world decision-making.
Designed for both ease of implementation and adaptability, the method is applicable across a wide range of domains, including finance, environmental assessment, and industrial planning. By improving the grouping of alternatives and enabling fairer comparisons between criteria, the proposed approach offers a more balanced, insightful, and scalable solution for complex decision-making problems.
The following sections provide a detailed explanation of the proposed methods, their theoretical underpinnings, and their practical implementation.
The rest of this paper is organized as follows:
Section 2 reviews the existing literature on clustering and normalization in TOPSIS, highlighting their strengths and limitations and identifying the gaps that this study aims to address.
Section 3 outlines the Materials and Methods, providing a detailed explanation of the proposed Clustering Using Fuzzy Numbers and Centroid-Based Distance Allocation approach, as well as the logarithmic normalization for TOPSIS, along with their theoretical foundations and implementation process.
Section 4 presents a case study, demonstrating how these methods can be applied in a real-world decision-making scenario.
Section 5 analyzes the results, comparing the proposed techniques with traditional methods to evaluate improvements in accuracy, robustness, and efficiency. Finally,
Section 6 offers the conclusion, summarizing the key findings, discussing their broader implications, and suggesting possible directions for future research.
2. Literature Review
Multi-criteria decision-making (MCDM) encompasses a set of methodologies used to evaluate and prioritize multiple—often conflicting—factors in the decision-making process. These approaches are critical in fields such as environmental management, engineering, and economics, where complex decisions are frequently encountered [
1].
One of the most widely applied MCDM techniques is the Technique for Order of Preference by Similarity to Ideal Solution (TOPSIS). Its core principle is straightforward: the optimal alternative is the one closest to the ideal solution and farthest from the worst-case scenario. TOPSIS is particularly valued for its simplicity and its ability to effectively handle both qualitative and quantitative data [
2].
Like any method, however, TOPSIS has its limitations. It can struggle with datasets characterized by uncertainty, outliers, or high variance, which may affect the consistency and reliability of its rankings. In response, researchers have explored methods to link input uncertainty with output uncertainty within the TOPSIS framework, highlighting the challenges of interpreting uncertain data in real-world decision-making contexts [
3].
Refining these techniques can increase decision-makers’ confidence in the results, thereby enhancing the overall value and applicability of MCDM methods across various industries [
4].
Comparative studies have examined TOPSIS alongside other MCDM methods such as VIKOR, PROMETHEE, and AHP. For instance, one study evaluated four different techniques—AHP, TOPSIS, ELECTRE III, and PROMETHEE II—in the context of group decision-making for sewer network projects, offering valuable insights into their applicability and effectiveness [
5,
6,
7].
Traditional clustering methods—such as K-Means and Hierarchical Clustering—have long served as fundamental tools for grouping similar data points in decision-making models. Their efficiency and ease of implementation contribute to their widespread use. However, these methods have notable limitations, especially when dealing with uncertainty, complex data distributions, or overlapping classifications. Because they rely on crisp boundaries, each data point is strictly assigned to a single cluster, which can result in inaccurate or overly simplistic groupings in real-world scenarios where data are often ambiguous and multidimensional [
8].
To overcome these limitations, fuzzy clustering techniques—particularly Fuzzy C-Means (FCM)—offer a more flexible alternative. Unlike traditional clustering methods, FCM allows data points to belong to multiple clusters with varying degrees of membership, enabling more nuanced and adaptable classifications. This approach is especially valuable in domains such as medical diagnosis, image segmentation, and customer profiling, where real-world data rarely conforms to clearly defined categories [
9].
Although FCM enhances clustering accuracy and adaptability, it also introduces considerable computational complexity. In contrast to K-Means, which follows a relatively simple iterative process, FCM requires more intensive calculations due to the continuous updating of membership probabilities and the optimization of an objective function. This iterative minimization process can become computationally expensive, particularly when working with large, high-dimensional datasets. As a result, FCM increases processing time and demands greater computational resources [
10].
Another significant barrier to the adoption of fuzzy clustering methods is the need for programming and algorithmic expertise. Implementing these methods—particularly in large-scale applications—requires familiarity with programming languages such as Python v3, R v4, or MATLAB R2024a, as well as with specialized libraries like scikit-fuzzy or the Fuzzy Logic Toolbox. Unlike traditional clustering algorithms, which are often accessible through built-in software tools with minimal coding, FCM and similar approaches demand manual parameter tuning (e.g., selecting the optimal fuzziness coefficient m) and careful data preprocessing to produce meaningful results [
11].
Additionally, FCM is highly sensitive to initialization—poorly selected initial centroids can lead to suboptimal clustering outcomes, often requiring advanced techniques such as genetic algorithms or particle swarm optimization to enhance results. Consequently, while fuzzy clustering offers improved accuracy and flexibility, its practical application demands greater expertise, computational resources, and algorithmic fine-tuning [
12].
Recent research has focused on reducing the computational overhead associated with fuzzy clustering by exploring hybrid models that combine deep learning and optimization algorithms. These models aim to automate parameter selection and improve overall performance. Such advances seek to make fuzzy clustering more accessible and scalable, bridging the gap between its theoretical strengths and practical usability in complex, real-world decision-making scenarios [
13].
Normalization is a critical step in multi-criteria decision-making (MCDM) processes, as it ensures that criteria measured on different scales can be compared meaningfully [
14].
Common normalization methods include Min–Max normalization: This method rescales data to a fixed range, typically [0, 1], but is sensitive to outliers, which can distort the normalized values. Z-Score normalization: This technique standardizes data based on mean and standard deviation, assuming a normal distribution, which may not hold true for all datasets. Vector normalization: Often used in TOPSIS, this method normalizes data by dividing each criterion value by the Euclidean norm of the vector. While effective, it may not always preserve proportional differences between criteria.
These conventional normalization techniques face challenges when applied to highly skewed data, extreme values, or non-linear distributions, which can compromise the fairness and accuracy of decision-making outcomes. For example, the choice of normalization method can significantly influence the ranking of alternatives in MCDM processes, underscoring the importance of selecting an appropriate technique for each specific decision context [
15,
16].
Logarithmic transformation is a mathematical technique used to handle non-linear data and compress large numerical ranges. By applying a logarithmic function, data can be transformed to reduce skewness, manage outliers, and stabilize variance. This transformation preserves relative differences while minimizing the influence of extreme values, making it useful in fields such as statistics, finance, and machine learning. Despite these advantages, logarithmic normalization remains underutilized in MCDM methods like TOPSIS. Integrating it into the TOPSIS framework could improve ranking stability and decision accuracy—especially in datasets characterized by high variance [
17]. One study introduced a novel logarithmic normalization method within the context of game theory, demonstrating its effectiveness in separating normalized values more efficiently than conventional approaches. These findings suggest promising applications for such a method in MCDM frameworks as well [
18].
The current literature reveals a lack of studies that combine fuzzy clustering with centroid-based distance allocation within MCDM frameworks [
19,
20]. Furthermore, although logarithmic normalization offers clear advantages for handling high-variance data, its application within TOPSIS and other MCDM models remains limited [
21].
Addressing these gaps presents an opportunity to improve decision-making processes by developing a unified framework that integrates both techniques, thereby enhancing clustering precision and ranking accuracy within MCDM applications [
22].
Recent studies have also explored the integration of MCDM methods with uncertainty modeling in emerging technological contexts. For instance, Nabeeh et al. [
23] proposed a hybrid model combining the Ordered Weighted Averaging (OWA) operator with the TOPSIS method to evaluate key factors influencing the production of digital twins based on blockchain technology. Their approach leverages neutrosophic logic to manage uncertainty in expert judgments, offering a structured yet flexible decision-making framework. While the application domain differs from the present study, both approaches share a common goal: enhancing the reliability of TOPSIS in uncertain, multi-criteria environments. In contrast to neutrosophic sets, our method uses fuzzy numbers exclusively to express uncertainty during the evaluation phase, followed by crisp classification based on distance to predefined ideal centroids. This allows for improved interpretability and computational simplicity while maintaining robustness in decision support.
Beyond the MCDM- and TOPSIS-focused research reviewed here, advanced studies in optimization, machine learning, and statistical modeling may inspire novel extensions to fuzzy clustering and logarithmic normalization approaches. Recent works on meta-learning for nonconvex optimization [
24], few-shot identification for stochastic dynamical systems [
25], robust kernel-based surrogate modeling [
26], and Gaussian kernel similarity for multisource information fusion [
27] illustrate how sophisticated algorithms can handle high-dimensional, uncertain data. Related efforts address robust statistical tests for heavy-tailed time series [
28], supervised learning for complex tracking [
29], adaptive opinion dynamics [
30], and agent-based decision models leveraging deep reinforcement learning [
31].
Although these advanced methods offer impressive capabilities, they often come with increased computational complexity and demand a high level of technical expertise for effective implementation. In contrast, our goal is to propose a more straightforward and practical approach, suitable for real-world scenarios, that balances the need to address data variability and uncertainty with simplicity and usability. Nonetheless, these sophisticated techniques highlight promising directions for future MCDM research, particularly in the integration of meta-learning, robust modeling, and adaptive information fusion to further improve clustering and normalization strategies in complex decision-making contexts.
3. Materials and Methods
In this section, we introduce a new methodological approach that enhances both clustering and normalization within the TOPSIS framework while ensuring that the process remains straightforward and easy to implement. The proposed methods, Clustering Using Fuzzy Numbers and Centroid-Based Distance Allocation, and the integration of logarithmic normalization in TOPSIS, address key limitations in traditional techniques. By introducing a more flexible clustering process and an adaptive normalization approach, these methods allow for a more accurate representation of real-world data variability, improving decision-making outcomes.
One of the fundamental challenges in decision models is that traditional clustering methods tend to assign alternatives to rigid categories, even when the data suggests a more nuanced classification. This can lead to misinterpretations, particularly when dealing with uncertainty or overlapping data points. To overcome this limitation, we propose Clustering Using Fuzzy Numbers and Centroid-Based Distance Allocation, which introduces a degree of membership for each alternative within a cluster instead of enforcing a strict assignment. This method acknowledges that alternatives may exhibit characteristics of multiple clusters, leading to a more precise, meaningful, and interpretable grouping of data.
Similarly, conventional normalization techniques such as Min–Max and Z-score often fail to handle datasets with large numerical variations, highly skewed distributions, or extreme outliers. These issues can distort rankings in TOPSIS, as criteria with significantly larger values may disproportionately influence the final results. To address this, we propose the integration of logarithmic normalization in TOPSIS, which effectively smooths extreme variations, preserves relative differences, and ensures a more balanced influence across criteria. One of its most compelling advantages is that, despite its effectiveness in handling complex data distributions, it remains as easy to apply as traditional normalization methods, making it an accessible yet powerful enhancement for decision-makers.
The strength of our proposed methodology lies in its ability to enhance accuracy, robustness, and adaptability while maintaining ease of implementation. Both the fuzzy clustering approach and logarithmic normalization are designed to seamlessly integrate into existing decision-making workflows without adding computational complexity. By introducing greater flexibility in clustering and a more adaptive approach to normalization, this study provides a scalable, practical, and efficient framework for improving multi-criteria decision-making. The following sections provide an in-depth explanation of how these methods work and their practical applications.
3.1. Clustering Using Fuzzy Numbers and Centroid-Based Distance Allocation
To group alternatives into meaningful clusters, we implement a fuzzy clustering approach. This method involves the following steps:
Step 1: Representation of alternatives with fuzzy numbers—each alternative’s criteria’s values are converted into fuzzy numbers (a, b, c) representing the lower bound, central value, and upper bound, respectively. This allows for a more flexible representation of uncertainty in the decision-making process.
Step 2: In this step, the cluster centroids are determined qualitatively by the user, identifying the optimal ranking for each criterion within the cluster. This process employs fuzzy numbers, represented as values (
a,
b,
c) ranging between 0 and 1. These results will allow us to measure the distance between the cluster centroids, which represent the ideal position for each cluster based on the selected criteria—and the scores of each alternative. Beyond this primary purpose, the resulting centroids are also used to determine the criterion weights, which will later be applied in the TOPSIS method. Formula (1) calculates the centroid representing the optimal position within a given cluster.
where
are the fuzzy number components representing the optimal position within a given cluster
.
Step 3: Determination of alternative centroids—using a fuzzy clustering approach, the centroids of each alternative are determined. The centroid
for each alternative
is computed as follows:
where
are the fuzzy number components of alternative
in the criterion
.
This formula is applied to all alternatives across all considered criteria to establish the ranking of the alternatives.
Equations (1) and (2) define two distinct types of centroids within the proposed method: cluster centroids and alternative centroids. The cluster centroid represents the ideal position of a given cluster across all criteria and is computed based on predefined fuzzy values that characterize the cluster’s optimal conditions. This centroid remains fixed for all alternatives within the cluster, serving as a reference point for comparison. In contrast, the alternative centroid is calculated based on the fuzzy scores assigned to a specific alternative, meaning it varies from one alternative to another. While the cluster centroid reflects the overall profile of a group, the alternative centroid captures the individual positioning of an alternative within the decision space. This distinction is crucial for the clustering process, as it enables a more flexible classification of alternatives while maintaining a structured evaluation framework.
Step 4: The new decision matrix, obtained from Step 3, is normalized using the cost (lower is better) and benefit (higher is better) formulas (Formulas (2) and (3)).
where
is the normalized value of the alternative
,
is the original value of the alternative
,
is the maximum value in the criterion, and
is the minimum value in the criterion. These formulas scale the values between 0 and 1, ensuring a fair comparison between alternatives while maintaining the meaning of cost and benefit criteria.
Step 5: Calculation of distance to cluster centroids—the distance between each alternative centroid (
) in each criterion
, and each cluster centroid (
) in each criterion
, is calculated using the Euclidean distance formula as follows:
where
represents the distance between the centroid of alternative
and the centroid of the optimal position within cluster
, and
denotes the number of criteria considered in the MCDM problem under analysis.
Step 4: Assignment of alternatives to clusters—each alternative is assigned to the cluster with the smallest distance to its centroid. This process involves calculating the distance between each alternative and all cluster centroids. The alternative is then assigned to the cluster with the nearest centroid, ensuring it is grouped with the most similar alternatives as defined in Formula (6).
where
is the cluster assigned to alternative
and
selects the cluster
that minimizes the distance.
3.2. Logarithmic Normalization: An Adaptive Approach for TOPSIS
Normalization is a fundamental step in multi-criteria decision-making (MCDM) methods such as TOPSIS (Technique for Order of Preference by Similarity to Ideal Solution). It ensures that criteria with different units and scales can be meaningfully compared. Traditional normalization methods, such as Min–Max and Z-score, effectively rescale data but may not be suitable for datasets with high variance, extreme outliers, or non-linear distributions. In such cases, logarithmic normalization emerges as an alternative technique that dynamically adjusts to data distributions, making it particularly effective for handling data spanning multiple orders of magnitude. By compressing large numerical variations while amplifying smaller differences, this approach ensures a more balanced contribution of criteria to the final decision, preserving the relative ranking among alternatives. Logarithmic normalization is mathematically expressed as shown in Equation (7),
where
represents the normalized value,
is the original value, and
and
denote the minimum and maximum values within a given criterion. This transformation is particularly beneficial in decision-making scenarios where some criteria exhibit exponential growth patterns, such as financial metrics, environmental indicators, and energy consumption data. By using a logarithmic scale, the influence of extreme values is harmonized, ensuring that all criteria contribute meaningfully to the decision-making process in TOPSIS, for instance. A key strength of logarithmic normalization is its adaptive nature. Unlike fixed range methods, it automatically adjusts to varying data magnitudes, dynamically scaling values to ensure fair comparisons across criteria. This makes it particularly effective for datasets with highly skewed distributions or large numerical differences. Moreover, it enhances decision stability, reducing the dominance of criteria with disproportionately large values while ensuring that smaller values remain distinguishable. Another advantage of logarithmic normalization is its ability to enhance differentiation among alternatives. By redistributing values in a way that emphasizes proportional differences, it ensures that the ranking process in TOPSIS remains representative and reliable, even when dealing with highly dispersed datasets. This is particularly beneficial in cases where criteria exhibit non-linear relationships, allowing for a more accurate reflection of each alternative’s performance. The implications of logarithmic normalization in TOPSIS are significant. By integrating this approach, rankings become more stable and reflective of real-world conditions, ensuring that decision-making processes remain robust and interpretable. Given its ability to balance differences across criteria without distorting rankings, logarithmic normalization offers an advanced scaling technique that aligns well with diverse decision-making scenarios. Despite its many advantages, logarithmic normalization has yet to be widely integrated into the TOPSIS framework, presenting an exciting opportunity for innovation. By introducing this approach, we can create a more adaptive way of handling criteria with high variance, non-linear distributions, and sensitivity to outliers. This integration helps improve ranking stability, ensures fairer comparisons between alternatives, and strengthens the overall decision-making process. What makes logarithmic normalization even more appealing is its ease of implementation. While it effectively balances data distribution and minimizes the impact of extreme values, it remains just as simple to apply as Min–Max or Z-score normalization. This means that decision-makers can benefit from its advantages without facing additional computational complexity or implementation challenges.
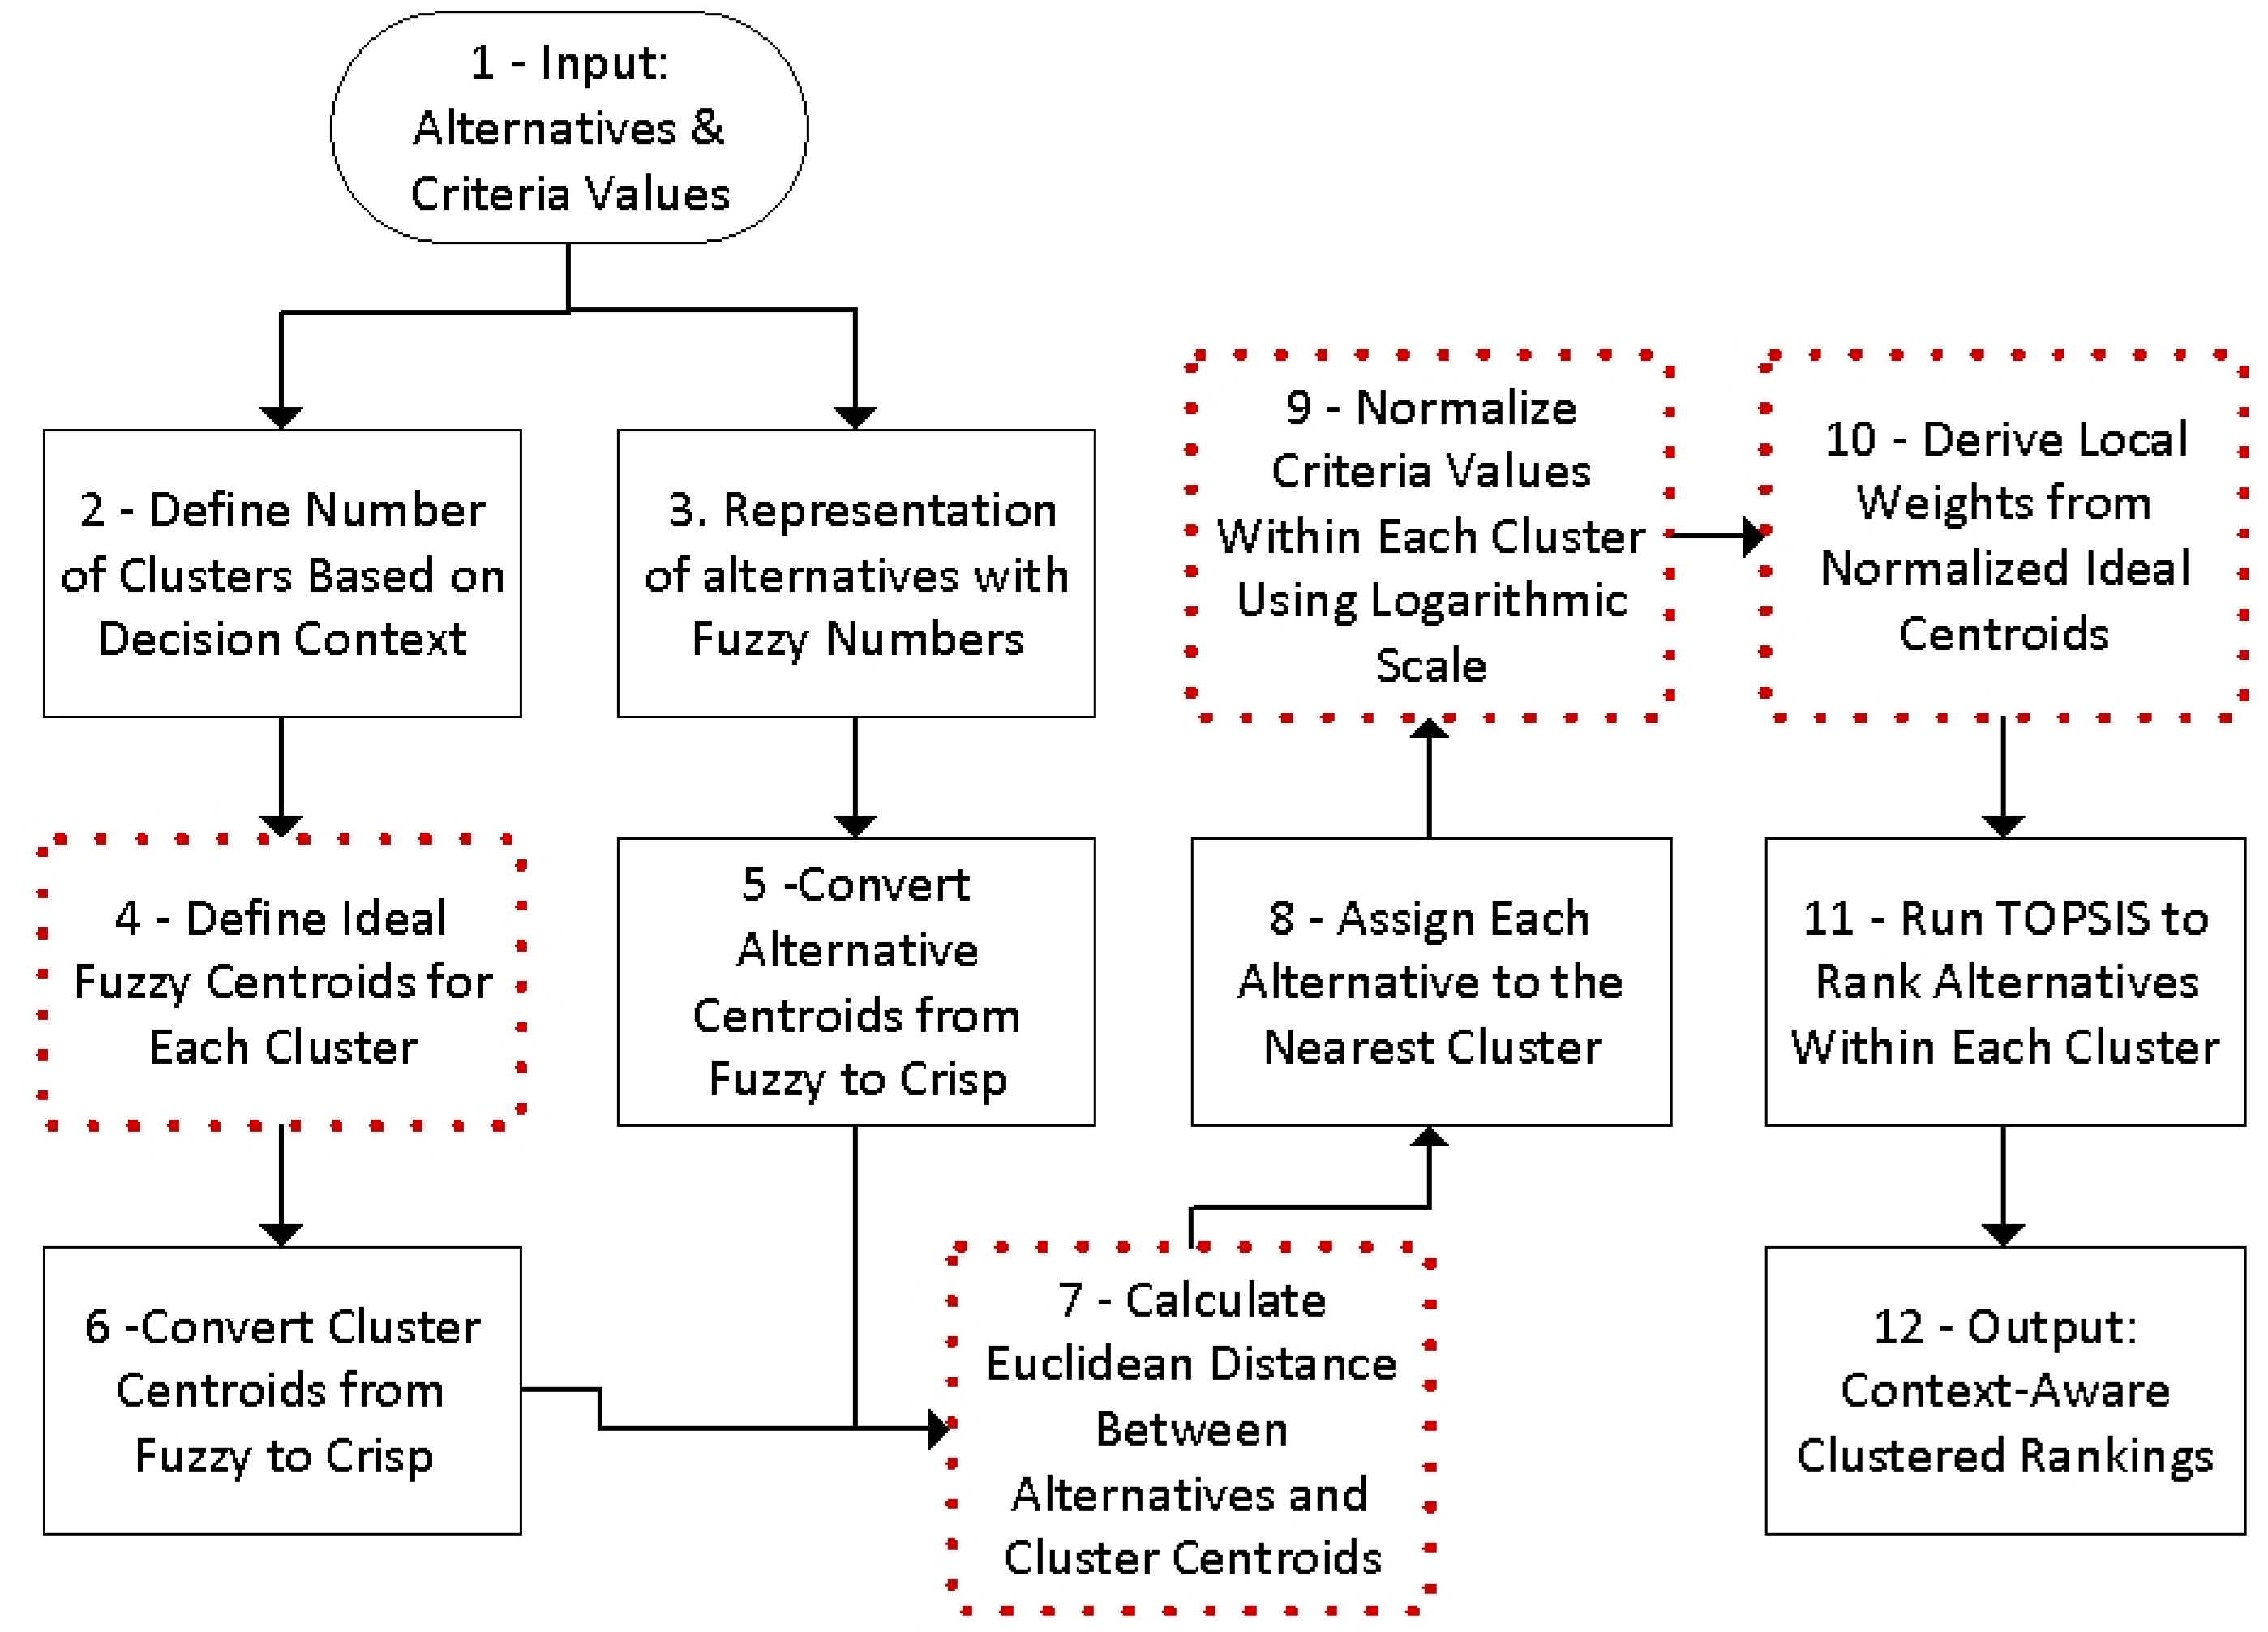
To further clarify the proposed method,
Figure 1 provides a step-by-step flowchart illustrating the transformation of raw data into fuzzy values, the application of fuzzy clustering, and the final logarithmic normalization.
The proposed method introduces several methodological innovations that enhance the flexibility, interpretability, and robustness of the TOPSIS framework. First, instead of relying on data-driven clustering techniques, the approach uses expert-defined ideal cluster profiles (step 4), represented through fuzzy numbers, allowing for context-aware classification of alternatives. Second, alternatives are assigned to clusters based on their Euclidean distance to these ideal profiles, enabling a deterministic and transparent grouping process (steps 7 and 8). Third, logarithmic normalization is applied within each cluster to reduce the influence of outliers and large variances, improving the stability and fairness of the rankings (step 9). Finally, the method derives the weights of criteria directly from the ideal cluster centroids, eliminating the need for subjective or complex weighting procedures (step 10). Together, these innovations offer a practical and scalable solution for multi-criteria decision-making in real-world scenarios involving uncertainty and heterogeneous data.
4. Case Study
This case study focuses on selecting the most suitable city to host an international event scheduled to take place in two years. The decision is complex, involving the evaluation of key factors such as costs, logistics, attendee experience, and overall event impact. To facilitate the process, a dataset of potential host cities was analyzed and grouped into clusters based on economic characteristics, infrastructure quality, safety, and accessibility.
Table 1 presents an overview of the cities, each identified by a letter for clarity. These cities were thoroughly assessed, with descriptions highlighting their individual strengths and challenges. This structured approach provides valuable insights, supporting decision-makers in identifying the best location to ensure the event’s success. In total, 12 cities were evaluated using four criteria: cost, infrastructure, safety, and accessibility. These alternatives were selected to reflect a realistic shortlisting scenario, where decision-makers typically narrow down options based on preliminary screening. While the dataset is moderate in size, it captures a diverse range of urban profiles and geographic contexts. The structure of the data—organized as fuzzy evaluations per criterion—allows for nuanced analysis and robust comparison across alternatives.
The cities were evaluated based on the following four key criteria, each playing a crucial role in determining their suitability to host the international event:
Cost (C1): The estimated total expense of hosting the event, measured in millions of dollars. This criterion reflects the financial feasibility of each city and its potential impact on the event’s budget.
Infrastructure (C2): A score from 1 to 10 that represents the quality of venues, transportation systems, accommodations, and other facilities required to host a large-scale international event.
Safety (C3): An index (1 to 10) measuring overall safety in the city, including crime rates, political stability, and emergency preparedness. A higher score indicates a safer environment for attendees.
Accessibility (C4): A score from 1 to 10 reflecting the city’s connectivity and ease of access, including international/domestic flight availability, public transit, and road infrastructure.
To streamline the decision-making process, the cities under consideration were grouped into three clusters based on shared characteristics, including cost, infrastructure, safety, and accessibility. Each cluster represents a distinct category of cities, enabling decision-makers to narrow their focus and evaluate alternatives more effectively as follows:
Cluster 1: Cost-Effective Cities with Moderate Infrastructure. This cluster consists of budget-friendly cities, making them attractive options for events with tighter financial constraints. Their lower costs allow organizers to allocate resources to other areas, such as marketing or improving the attendee experience. These cities may also attract higher attendance from local or regional participants due to their affordability. However, they present certain challenges. Infrastructure may require temporary enhancements to meet the needs of an international audience, and their safety and accessibility scores are generally moderate—requiring careful planning to ensure a successful event.
In the following, the values presented for each criterion are analyzed and discussed using fuzzy numbers, which represent the optimal values for each criterion within this cluster. These fuzzy values indicate the most desirable levels for cost, infrastructure, safety, and accessibility, providing a degree of flexibility rather than rigid, fixed values. By applying fuzzy logic, this approach acknowledges that real-world city classifications involve gradual transitions rather than strict categorizations, allowing for a more nuanced and adaptable evaluation of urban characteristics as follows:
Cost (C1): This criterion represents the financial affordability of the city. Since this cluster focuses on cost-effective locations, the cost should be as high as possible (fuzzy number (0.9, 1, 1)). A higher rating means the city is more budget-friendly in terms of living expenses, business operations, and overall affordability.
Infrastructure (C2): This refers to the quality and availability of public services, transportation, and essential facilities. Cities in this cluster should have a moderate level of infrastructure (fuzzy number (0.5, 0.6, 0.7)). This means they provide basic amenities but might require improvements in areas like roads, public transportation, healthcare, and digital connectivity.
Safety (C3): This criterion evaluates how secure the city is for residents, businesses, and visitors. These cities should have moderate safety levels (fuzzy number (0.4, 0.5, 0.6)). While they are generally safe, they may have certain areas that require extra precautions, such as higher crime rates or specific security concerns.
Accessibility (C4): This criterion assesses how well-connected the city is both regionally and internationally. The cities in this cluster should have moderate accessibility (fuzzy number (0.4, 0.5, 0.6)). They typically have good regional connectivity through local transportation networks but might lack direct access to global travel hubs, such as major international airports or high-speed rail links.
- 2.
Cluster 2: High-Investment Cities with World-Class Infrastructure. Cities in this cluster are renowned for their exceptional infrastructure, including state-of-the-art venues, premium accommodations, and robust transportation networks. These cities are ideal for events that aim to project prestige or cater to high-profile attendees. High safety and accessibility scores further ensure a smooth and secure experience for participants. However, these advantages come with significant costs, which can impact profitability or restrict participation. Careful budgeting and strong justifications to stakeholders are essential to address these challenges. The following analyzes and discusses the values for each criterion in Cluster 2 using fuzzy numbers, which define the optimal range for cost, infrastructure, safety, and accessibility within this category as follows:
Cost (C1): Should be as low as possible (fuzzy number (0.05, 0.1, 0.12)) because these are expensive cities, making budget management a challenge. The lower the rating, the higher the cost of living, business operations, and general expenses.
Infrastructure (C2): Should be as high as possible (fuzzy number (0.8, 0.95, 1)) to ensure world-class facilities. This includes cutting-edge public transportation, advanced healthcare systems, efficient digital connectivity, and modern urban planning.
Safety (C3): Should be as high as possible (fuzzy number (0.95, 0.95, 1)) since these cities are known for their stability and security. Low crime rates, strong law enforcement, and a secure environment make them attractive for businesses and residents alike.
Accessibility (C4): Should be as high as possible (fuzzy number (0.7, 0.95, 1)) to ensure global connectivity. These cities have major international airports, excellent public transit systems, and strong infrastructure to host international conferences and business events.
- 3.
Cluster 3: Balanced Cities with a Mix of Features. This cluster includes cities that strike a strong balance between affordability and quality, offering good infrastructure, high safety ratings, and excellent accessibility at reasonable costs. Their versatility makes them ideal for events that seek to combine cost-effectiveness with a high-quality experience for attendees. While these cities may not be as affordable as those in Cluster 1 or have infrastructure as advanced as those in Cluster 2, their overall balance makes them strong contenders for hosting successful events. Choosing between similarly balanced options in this cluster might require additional considerations, but their high safety and accessibility scores enhance the experience for all participants. The following analyzes and discusses the values for each criterion in Cluster 3 using fuzzy numbers, which define the optimal range for cost, infrastructure, safety, and accessibility within this category.
Cost (C1): Should be moderate (fuzzy number (0.5, 0.6, 0.7)) because these cities balance quality and affordability. They are neither excessively expensive nor extremely cheap, making them attractive for middle-income professionals and businesses looking for cost-effective but well-equipped locations.
Infrastructure (C2): Should be good but not premium (fuzzy number (0.5, 0.6, 0.7)). These cities provide high-quality public services, efficient transportation, and modern urban planning, but they may lack the cutting-edge facilities of world-class metropolises.
Safety (C3): Should be high but not extreme (fuzzy number (0.5, 0.6, 0.7)). These cities offer a safe environment with low to moderate crime rates, ensuring a comfortable living and working atmosphere without reaching the ultra-secure standards of Cluster 2 cities.
Accessibility (C4): Should be high but not at the maximum level (fuzzy number (0.5, 0.6, 0.7)). These cities have strong regional and international connectivity, including well-developed airports and transport networks, but they do not match the global reach of the top-tier business hubs in Cluster 2.
Table 2 provides a summary of the optimal scores for each cluster discussed in this section, with the centroids of each cluster defined using fuzzy numbers for each criterion considered.
The scores presented in
Table 3 were developed through a collaborative process involving a diverse panel of experts and analysts. This group combined professional experience in event planning and logistics with insights drawn from tourist feedback and reviews published in reputable travel and tourism journals. By integrating these perspectives, the evaluation captured not only the logistical and operational dimensions of hosting an international event but also traveler perceptions and experiences.
This comprehensive approach ensured that the assessment reflected both the functional feasibility and the broader appeal of each city as a vibrant and welcoming destination. For each city and criterion, experts provided individual scores based on their knowledge, experience, and trusted sources such as government reports, traveler feedback, and industry analyses. As expected, these evaluations varied, reflecting differing viewpoints and priorities across the panel.
To ensure fairness and consistency, final scores were calculated by averaging the individual assessments for each criterion and city. The resulting values were then expressed as fuzzy numbers. This method helps harmonize diverse opinions and minimizes potential bias, yielding well-rounded and objective scores for a more balanced evaluation.
5. Results and Discussion
In this section, we apply the proposed models, including the new clustering approach and the logarithmic normalization method—within the TOPSIS framework for the presented case study. The results are detailed step by step, then analyzed and compared with those obtained using traditional methods.
Table 4 presents the processing of the data from
Table 3. Using the fuzzy number of each alternative for each criterion, the corresponding centroid is calculated (columns 2 to 5), using Equation (2). These centroids are then normalized using the Min–Max method (columns 6 to 9), using Equations (3) and (4).
The centroids calculated for each alternative are then used to compute their distances to the optimal scores defined for each cluster, as outlined in
Table 2.
Table 5 presents these distances, calculated using the Euclidean norm, as specified in Equation (5). As the table shows, the distance between each alternative and the ideal cluster values varies. To assign each alternative to a cluster, we select the one with the minimum distance, as described in Equation (6). The final column in
Table 5 displays the shortest distance for each alternative, with the assigned cluster highlighted in bold.
Table 6 presents the results aggregated by cluster, revealing a distribution that aligns well with the intended definitions of each group.
Cluster 1—Cost-Effective Cities with Moderate Infrastructure—includes alternatives with the lowest costs, while the other criteria generally exhibit moderate values, confirming the coherence of the classification.
Cluster 2—High-Investment Cities with World-Class Infrastructure—comprises alternatives that match the profile of high-cost cities offering top-tier scores in infrastructure, safety, and accessibility.
Cluster 3—Balanced Cities with a Mix of Features—includes alternatives with intermediate cost levels and criteria ratings that fall between those of Clusters 1 and 2. This consistency reinforces the validity of the proposed clustering method.
Based on these results, we can conclude that the proposed model produces outcomes consistent with expectations. This means that analyzing the distribution of alternatives across the different clusters confirms that the results are logical and align with the expected distribution of alternatives within each cluster.
Table 7 compares the proposed clustering method with the Fuzzy K-Means approach, revealing that the results are nearly identical—with one notable exception: City K is assigned to Cluster 1 by the proposed method, whereas Fuzzy K-Means places it in Cluster 3. Although this difference may appear minor, it highlights an important distinction in how each method interprets distances and assigns alternatives to clusters. Overall, the strong alignment between the two methods supports the effectiveness and reliability of the proposed approach as a viable alternative to traditional fuzzy clustering techniques.
More importantly, assigning City K to Cluster 1 appears to be a more appropriate classification. The city shares a low-cost profile, which is a defining characteristic of Cluster 1. In fact, City K has the same cost value as City G, which was placed in Cluster 1 by the Fuzzy K-Means method. The only differences between the two are minor, such as a one-point variation in other criteria—making them highly comparable. Therefore, grouping City K with City G in Cluster 1 is more consistent with the underlying logic of the clustering process. This supports the conclusion that the proposed method offers a more accurate and contextually sound classification.
Another key advantage of the proposed method lies in its simplicity and computational efficiency when compared to Fuzzy K-Means, which depends on multiple iterative calculations and a more complex optimization process. In contrast, the proposed method uses a direct and intuitive approach by assigning each alternative to the nearest centroid, eliminating the need for repeated recalculations. Fuzzy K-Means, on the other hand, involves continuous re-evaluation of centroids, which increases computational demands—particularly for larger datasets. Additionally, Fuzzy K-Means applies a soft clustering strategy, where alternatives can partially belong to multiple clusters, whereas the proposed method deterministically assigns each alternative to a single cluster.
In contrast, the proposed method is deterministic, assigning each alternative to a single cluster without ambiguity. It also significantly reduces computational overhead by avoiding iterative adjustments. Its ease of implementation makes it especially practical in contexts where speed and efficiency are essential. Considering that the overall clustering results are nearly identical—and that the proposed method classifies City K in a way that aligns more logically with the data—it can be regarded as not only simpler but also more accurate and reliable than the Fuzzy K-Means approach.
In the next step, the rankings of each alternative within their respective clusters were normalized using two methods: logarithmic normalization (
Table 8) and Min–Max normalization (
Table 9).
An analysis of
Table 8 and
Table 9 shows that logarithmic normalization offers clear advantages over Min–Max normalization, particularly in the way it distributes values across clusters. In Cluster 2, where the cost criterion (C1) exhibits significantly higher values than in other clusters, Min–Max normalization exaggerates these differences, making cost variations between cities appear more pronounced. In contrast, logarithmic normalization compresses the scale, reducing the gaps between alternatives while preserving their relative rankings.
A similar effect is observed in Cluster 3, where differences in cost (C1) and infrastructure (C2) are more evenly balanced under logarithmic transformation. This prevents extreme values from overshadowing smaller differences. As a result, logarithmic normalization delivers a more balanced representation, ensuring that no single high value disproportionately influences the outcome—thus producing a more stable and interpretable ranking system.
The next step is the application of the TOPSIS method to the normalized tables (
Table 8 and
Table 9), considering the weights for each criterion and each cluster, as presented in
Table 10. These weights are derived from the optimal values within each cluster and are essentially obtained by normalizing these values using the Min–Max method.
The TOPSIS method was then applied using the weights derived for each cluster (as shown in
Table 10) and the normalized data from both approaches.
Table 11 presents the results obtained using logarithmic normalization, ranking the alternatives within their respective clusters.
Table 12 shows the results using Min–Max normalization, allowing for a direct comparison between the two normalization techniques.
The application of the TOPSIS method using both Min–Max and logarithmic normalization identified the top-ranked cities within each cluster. The results show that City K (Cluster 1) and City C (Cluster 2) consistently achieved the highest scores across both normalization methods, while City E (Cluster 3) exhibited some variation depending on the technique used.
In Cluster 1, City K emerged as the best-performing alternative, with a TOPSIS score of approximately 0.887 in both cases. This indicates that City K offers a well-balanced combination of cost, infrastructure, safety, and accessibility, making it the most suitable option within its group. Its consistent ranking across both normalization techniques demonstrates strong alignment with the cluster’s ideal conditions.
In Cluster 2, City C achieved a perfect TOPSIS score of 1.000 under both normalization methods, confirming its status as the most suitable alternative for this category. The unchanged result, regardless of the normalization applied, reinforces City C’s dominance in terms of meeting all weighted criteria.
In contrast, City E led Cluster 3 but showed noticeable variation between methods: 0.747 using Min–Max and 0.886 with logarithmic normalization. This difference suggests that the logarithmic approach was more effective in smoothing extreme values and reducing the influence of outliers. As a result, City E appeared closer to the ideal solution under logarithmic normalization.
Overall, the consistency of City K and City C as top-ranked alternatives reinforces the robustness of the methodology and confirms that the chosen criteria effectively distinguish the best-performing cities within each cluster. However, the variation in City E’s score highlights how normalization can influence ranking intensity, particularly in datasets where differences between values are more pronounced.
The results show that logarithmic and Min–Max normalizations produced nearly identical outcomes in the TOPSIS analysis, indicating that when there are no significant outliers, logarithmic normalization performs just as well as the Min–Max method. However, in the presence of extreme values, logarithmic normalization proves to be more effective, as it reduces the impact of outliers and prevents criteria with very high values from distorting the distance calculations in TOPSIS.
Thus, it is observed that for datasets without outliers, logarithmic normalization performs just as well as Min–Max normalization, with the added advantage that when outliers are present, logarithmic normalization delivers better performance. If the goal is to ensure that normalization has a meaningful effect only in cases where data variation is large, logarithmic normalization is preferable due to its ability to smooth extreme values. However, when the data are naturally well-distributed, Min–Max normalization remains a valid option, as it preserves the original proportions without information loss.
6. Conclusions
This study introduced two methodological innovations to enhance the TOPSIS decision-making framework: Clustering Using Fuzzy Numbers and Centroid-Based Distance Allocation and logarithmic normalization. Together, these methods address key limitations in traditional MCDM approaches, particularly in the handling of uncertainty, outliers, and rigid data-driven classifications.
The proposed clustering approach allows decision-makers to define ideal cluster profiles independently of the dataset, enabling greater strategic control. Fuzzy numbers are used exclusively to model uncertainty in the evaluation of alternatives, which are then converted to crisp values to calculate Euclidean distances from predefined centroids. This results in a robust yet transparent classification method, free from iterative optimization or probabilistic membership functions. Unlike traditional clustering techniques such as K-Means, which derive centroids from data, our approach decouples clustering from data distribution and focuses on alignment with idealized profiles—offering greater interpretability and consistency.
Logarithmic normalization further enhances the robustness of the TOPSIS method by smoothing extreme values and preserving proportional differences across criteria. This is especially useful in datasets with high variance or non-linear distributions, where traditional normalization techniques may distort rankings.
The case study results demonstrate that the proposed methodologies significantly enhance both the accuracy and stability of decision-making outcomes. The fuzzy clustering approach enables more realistic classification of alternatives, while logarithmic normalization improves the comparability of criteria—without adding unnecessary complexity. A key advantage of both methods is their computational simplicity and ease of implementation, making them accessible for a broad range of practical applications.
Beyond the context of city selection, the proposed methodology offers broader enhancements to decision-making by improving how alternatives are grouped and compared in the presence of uncertainty and variability. Its modular design—combining fuzzy-based evaluation, predefined cluster centroids, and adaptive normalization—makes it suitable for various domains such as supply chain optimization, financial assessment, environmental planning, and strategic project prioritization. The method supports more robust, context-aware, and scalable decision processes across diverse real-world applications.
Although the results are promising, there remain several opportunities for further exploration and validation. A logical next step is to test the performance of these techniques within other MCDM models—such as VIKOR, PROMETHEE, and AHP—to assess their adaptability across different decision-making frameworks. Each of these models has unique characteristics, and applying the proposed methods within them could offer deeper insights into their generalizability and effectiveness.
Despite its promising results, the proposed methodology presents some limitations. The definition of ideal cluster centroids is currently based on expert judgment, which, while offering flexibility and interpretability, may introduce a degree of subjectivity. Future refinements could explore hybrid or data-assisted strategies to support or validate these predefined profiles. Additionally, while the method is computationally simple and effective in the case study, its performance in large-scale or high-dimensional problems remains to be tested. Moreover, although the proposed approach was applied within the TOPSIS framework, evaluating its integration with other MCDM models (e.g., VIKOR, PROMETHEE, AHP) would help assess its generalizability.
Finally, future work could involve benchmarking the proposed methods against other clustering and normalization techniques. Comparative analyses focused on classification accuracy, ranking stability, and computational efficiency would further support method refinement and foster broader adoption in complex decision-making contexts.


