
Marble and Glass Waste Powder in Cement Mortar
 ,
, 
Abstract
1. Introduction
2. Materials and Methods
2.1. Materials
2.1.1. Cement
2.1.2. MWP
2.1.3. GWP
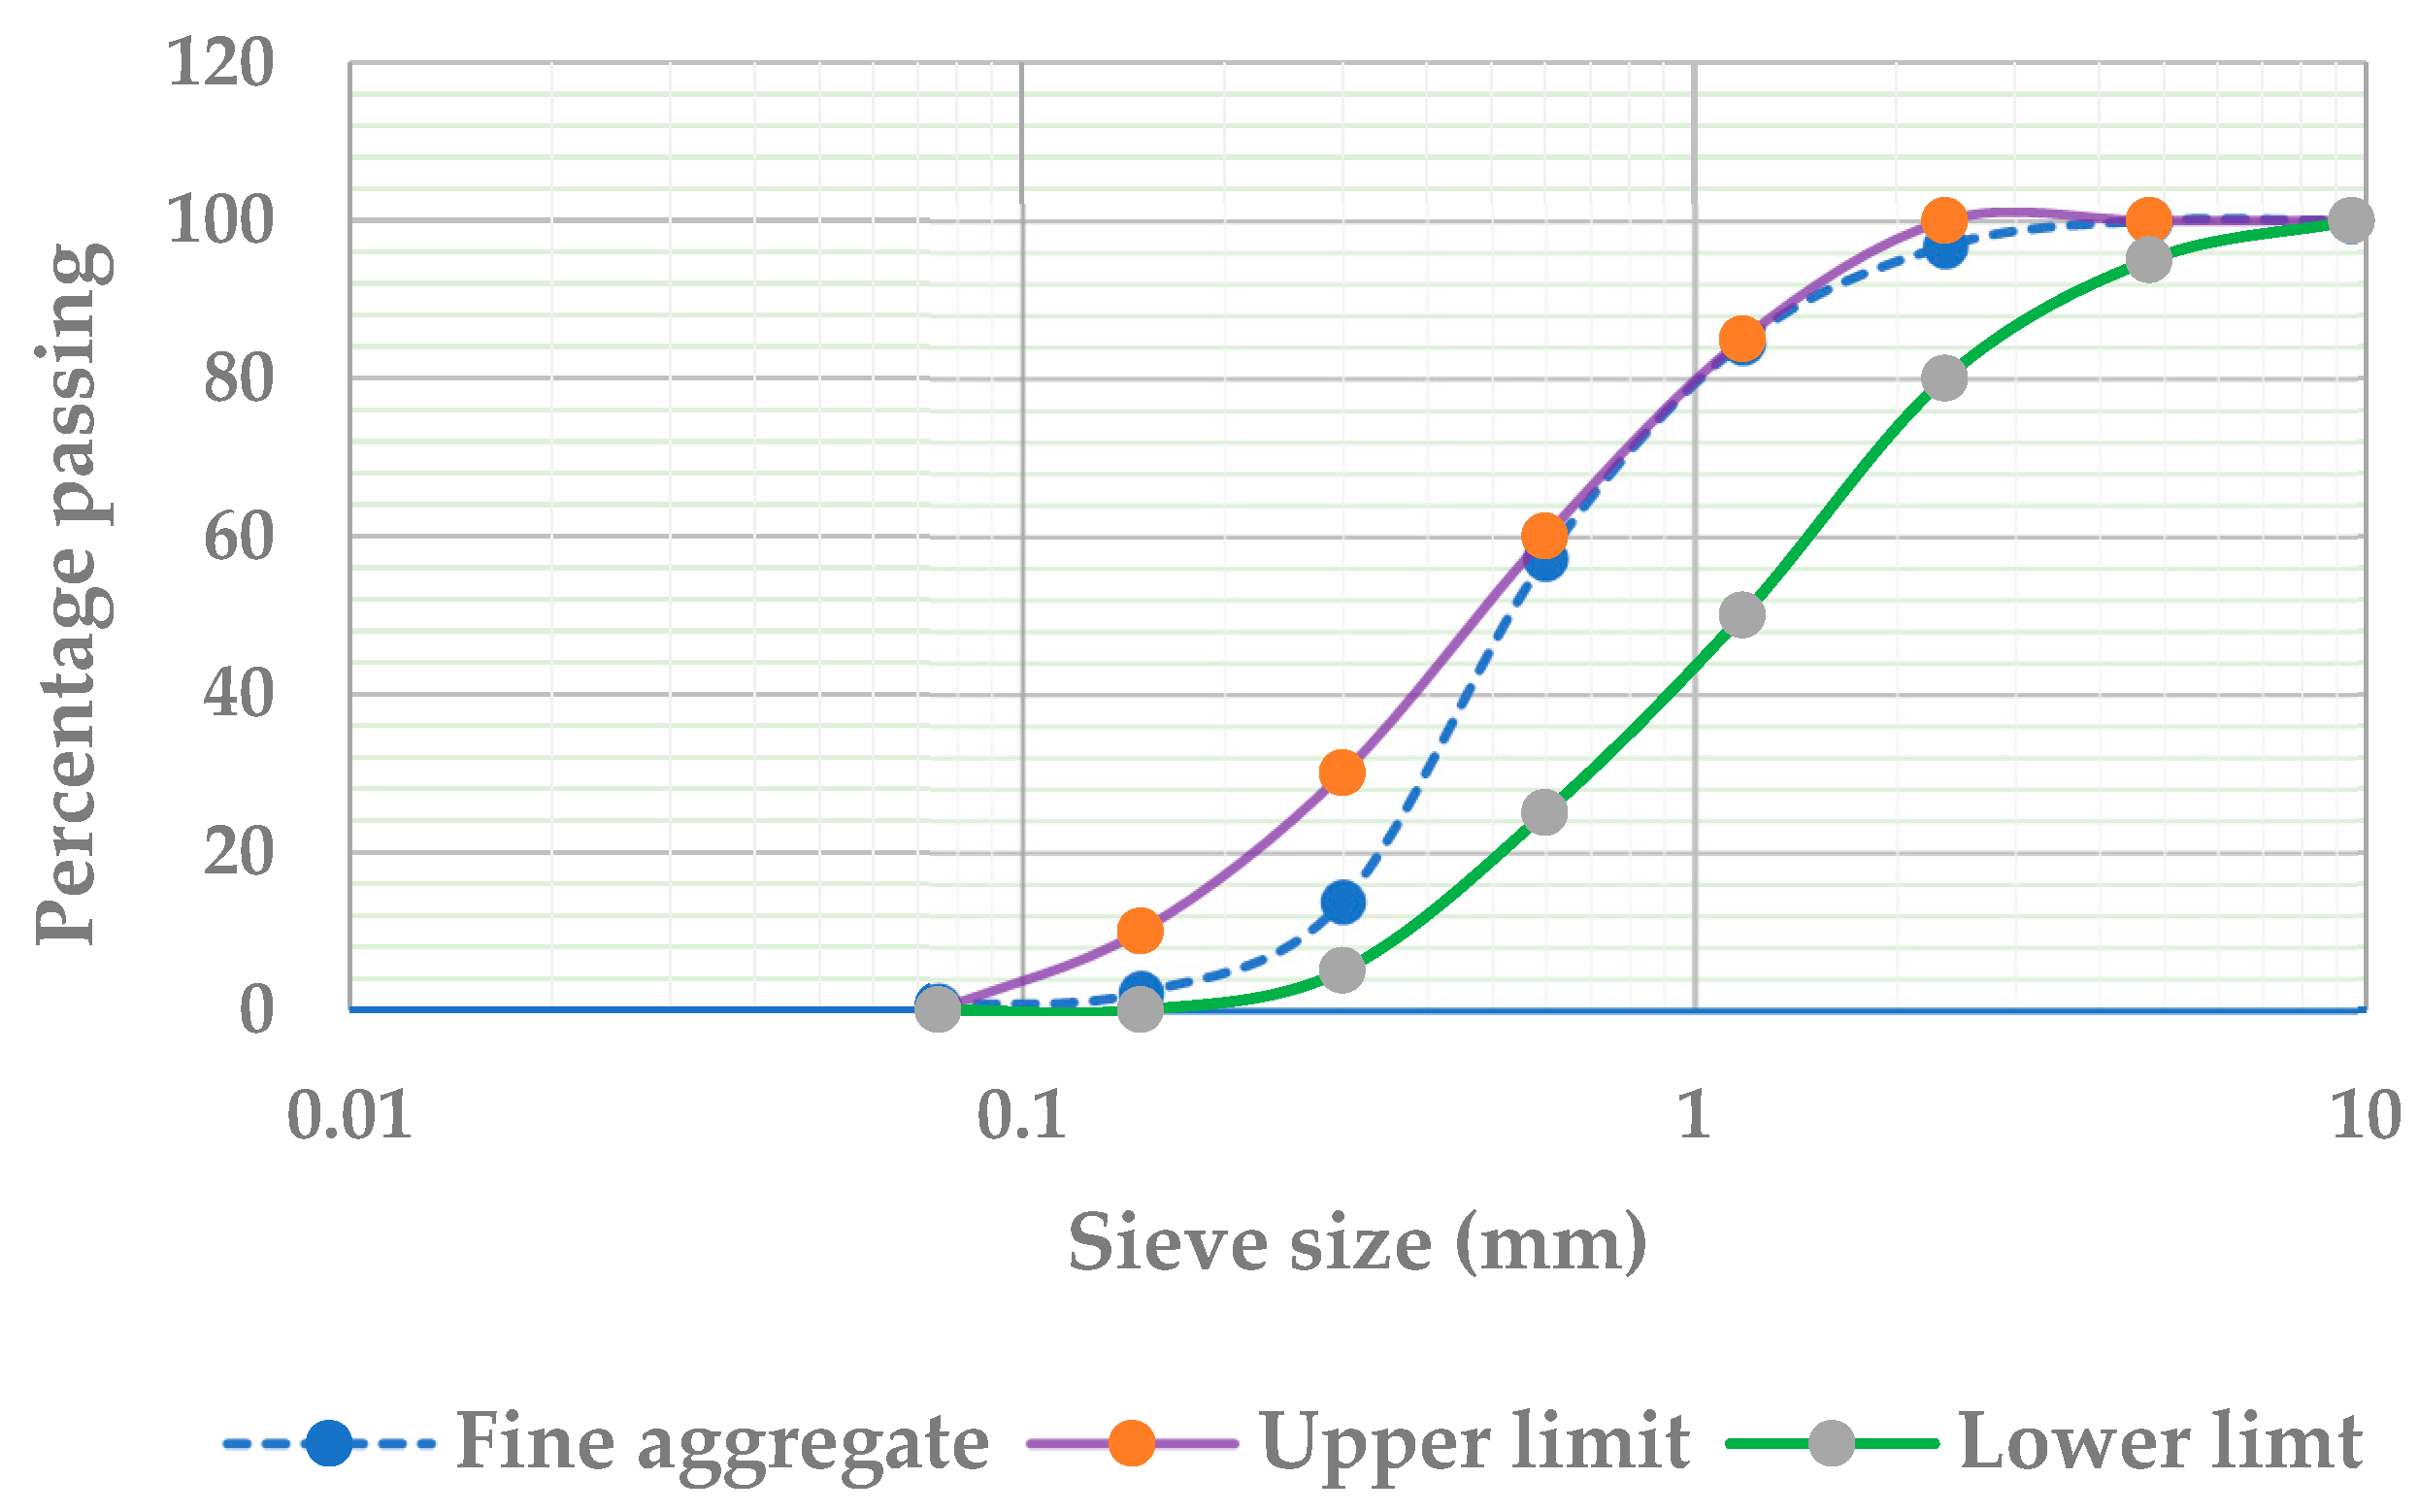
2.1.4. Fine Aggregate
2.2. Physical and Chemical Properties of OPC, GWP, and MWP
2.3. Mix Design
2.4. Test Methods
3. Results and Discussion
3.1. Fresh Properties
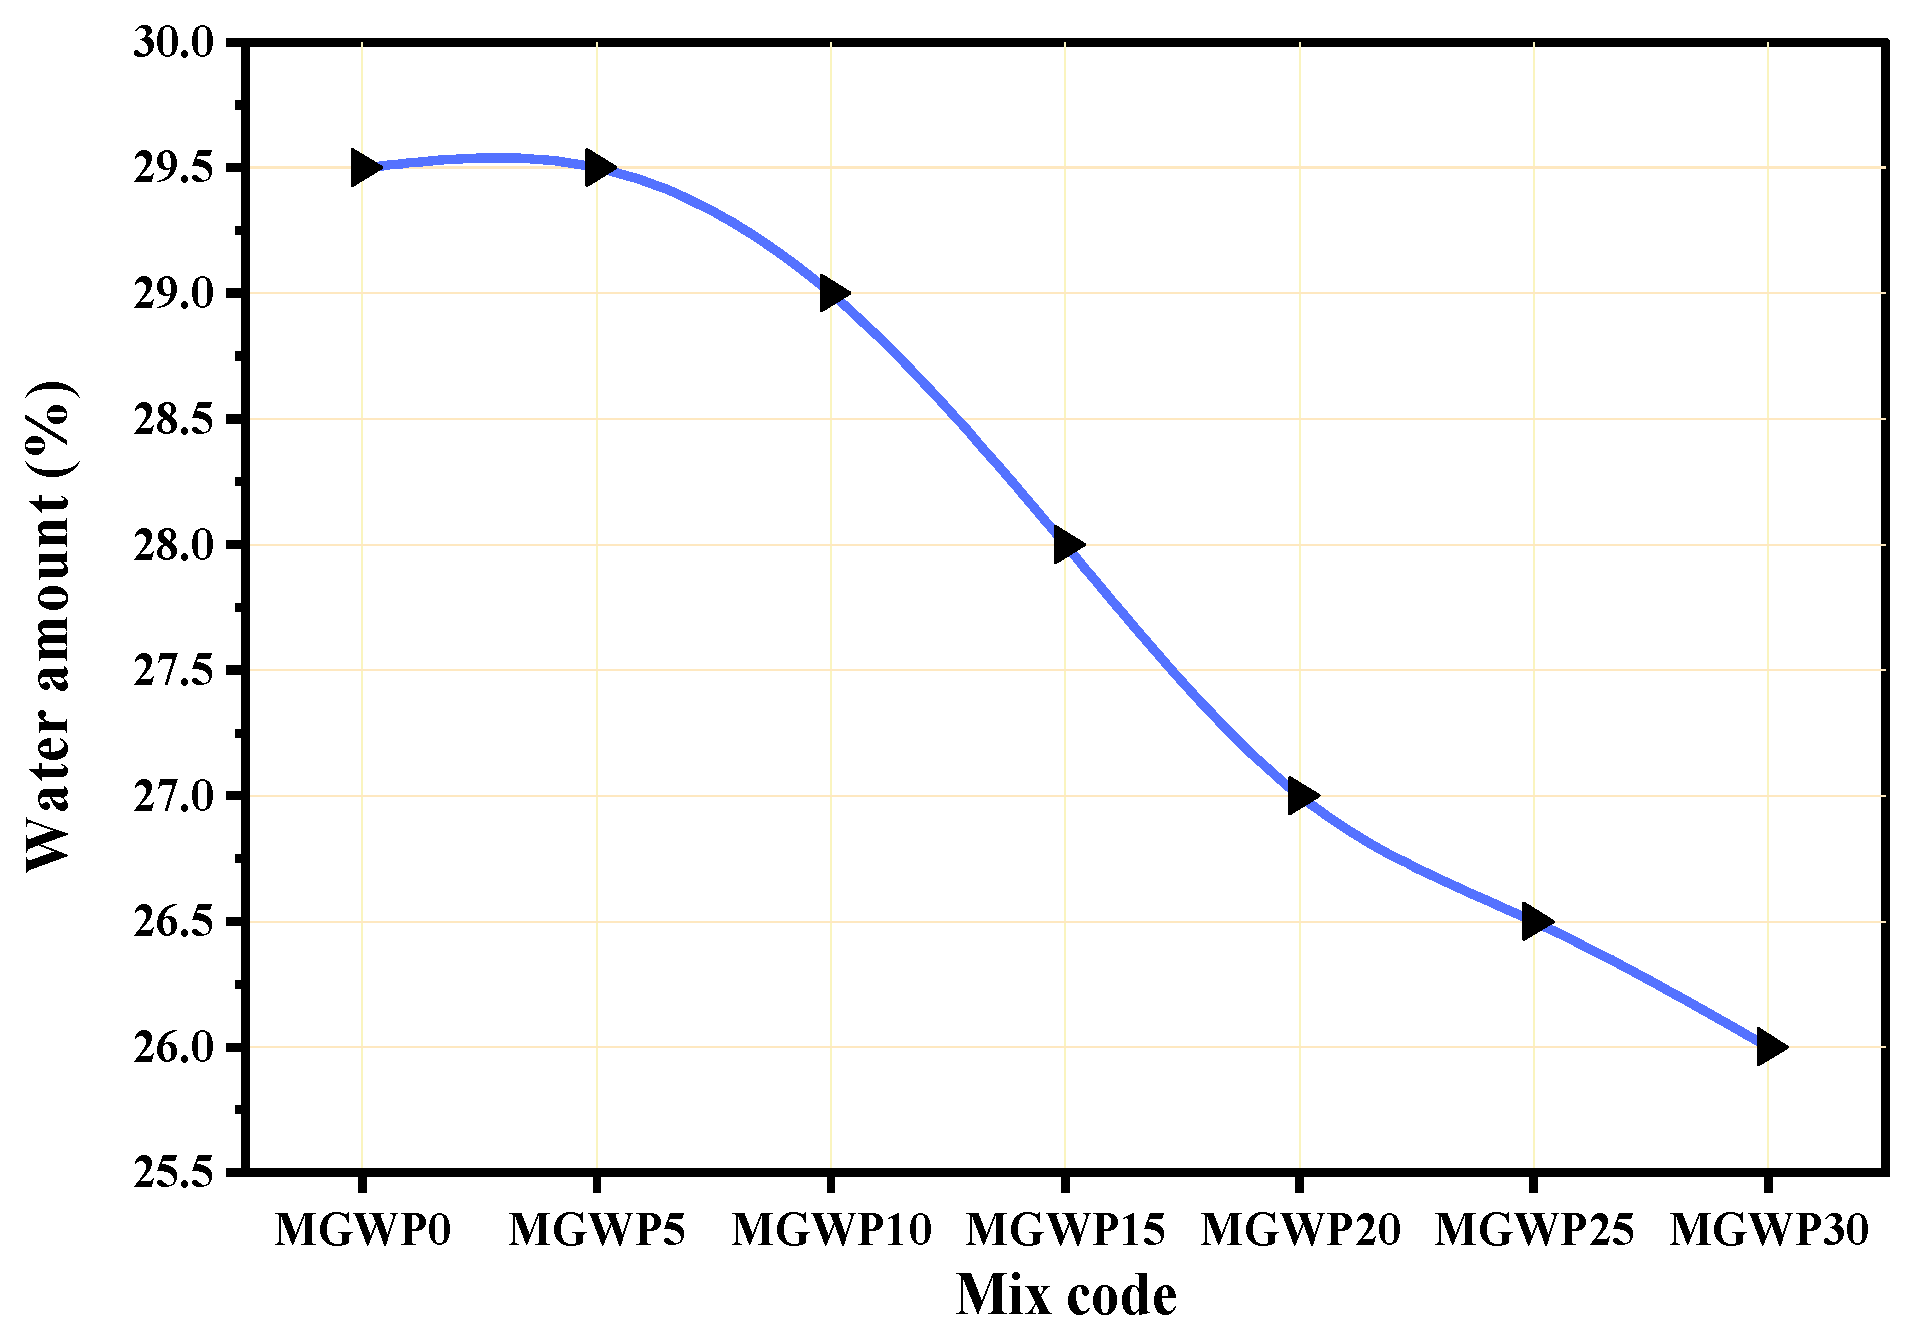
3.1.1. Normal Consistency of Paste
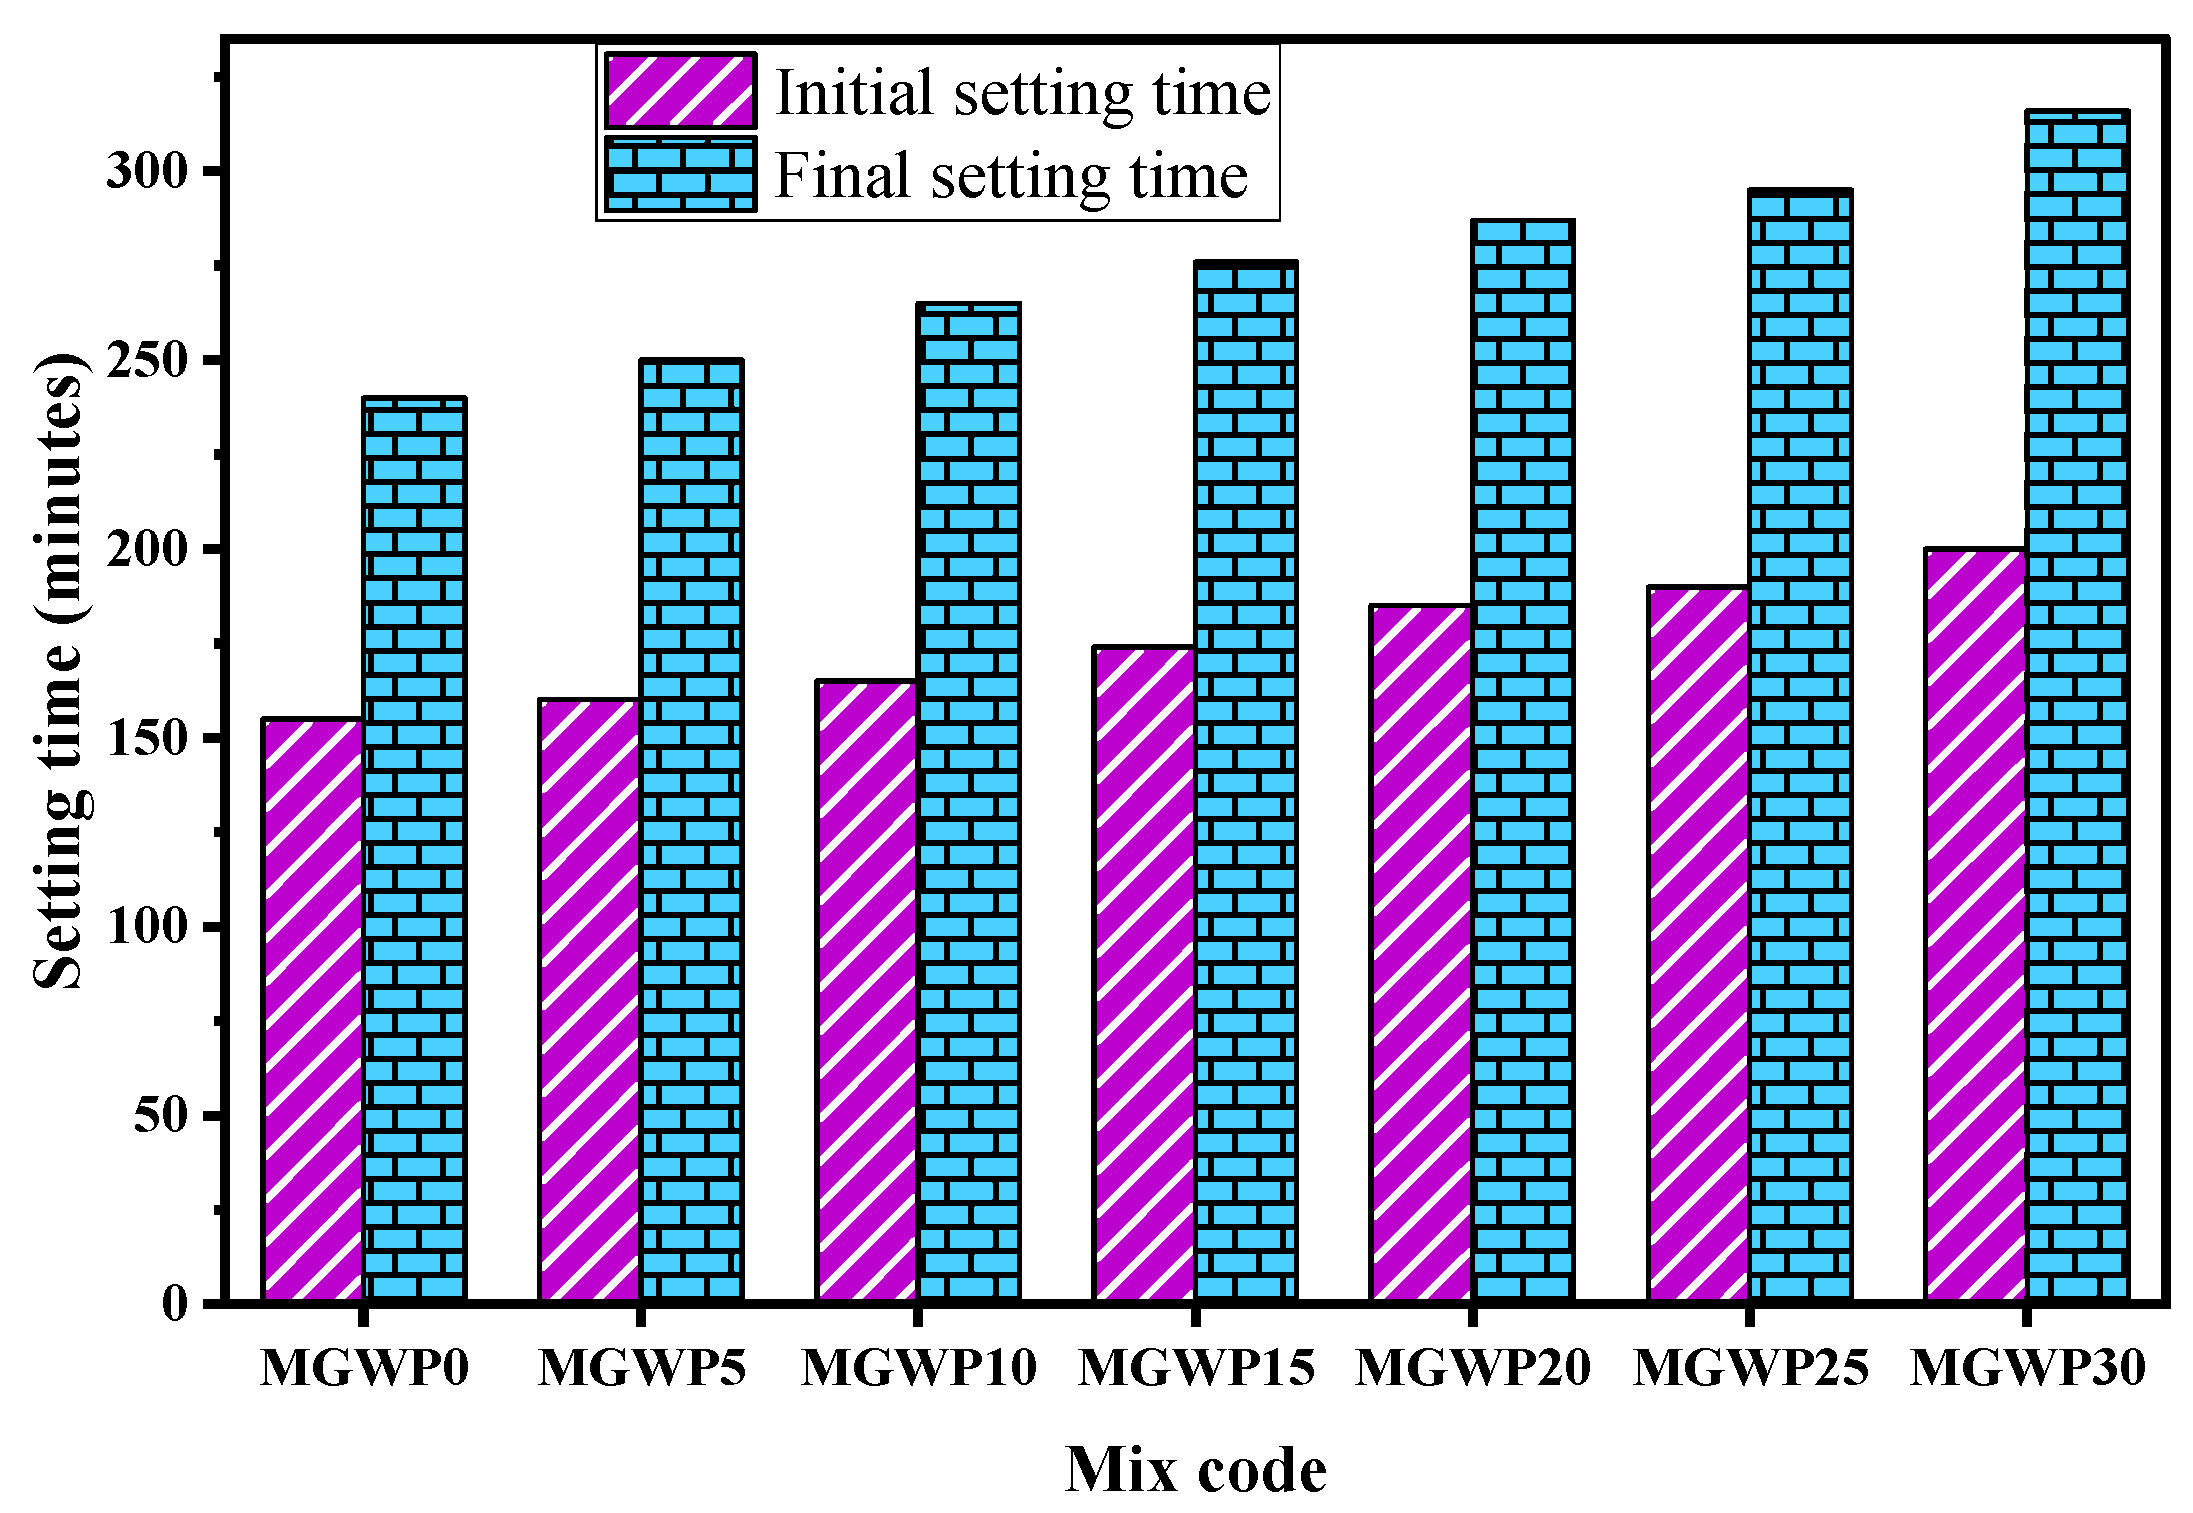
3.1.2. Initial and Final Setting Time
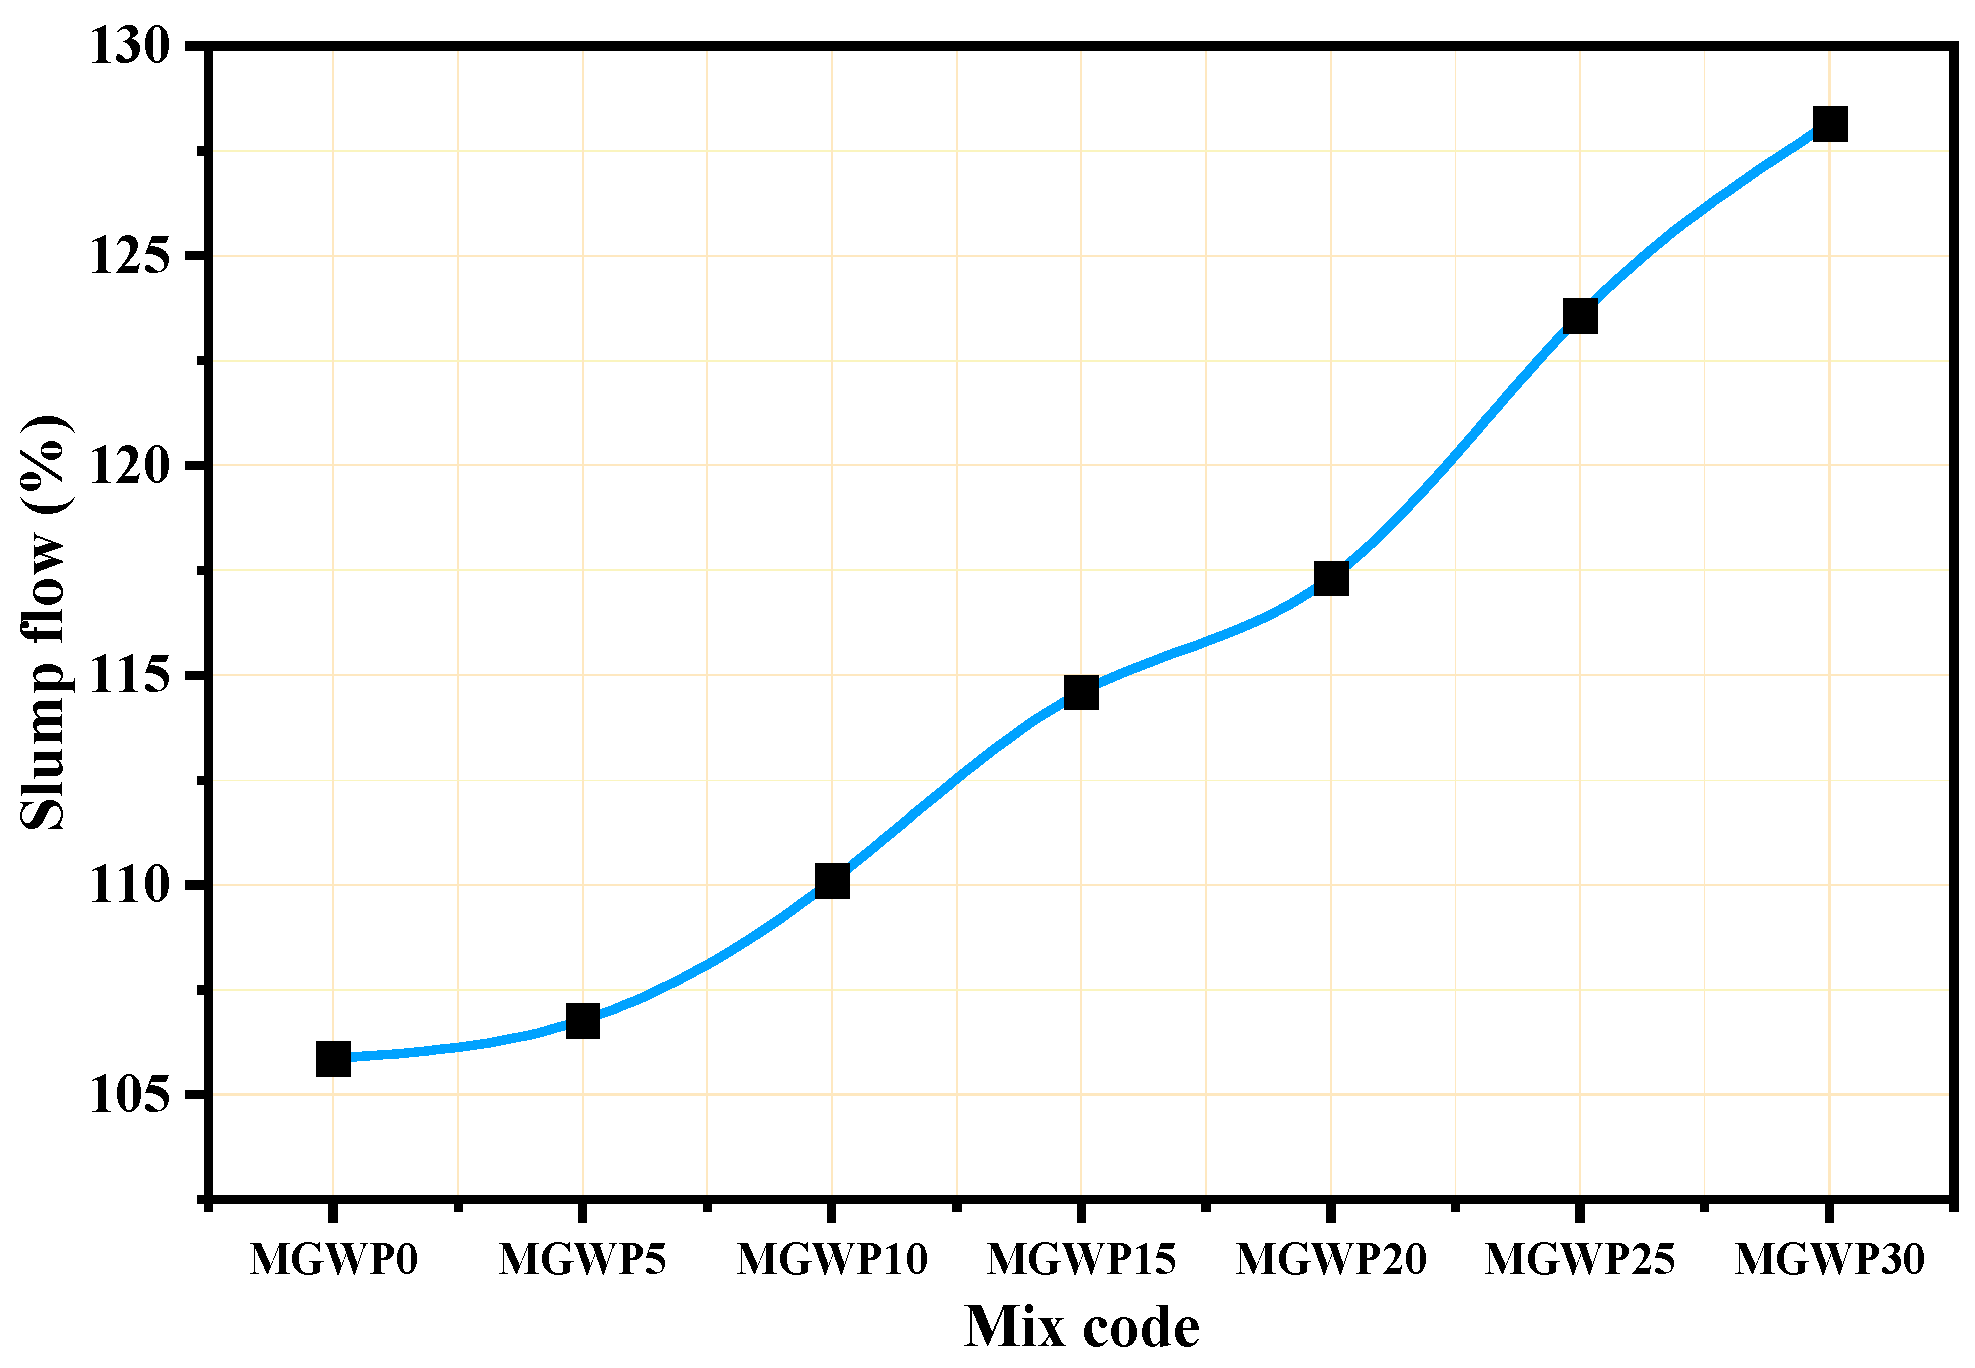
3.1.3. Slump Flow
3.2. Mechanical Properties of Mortar
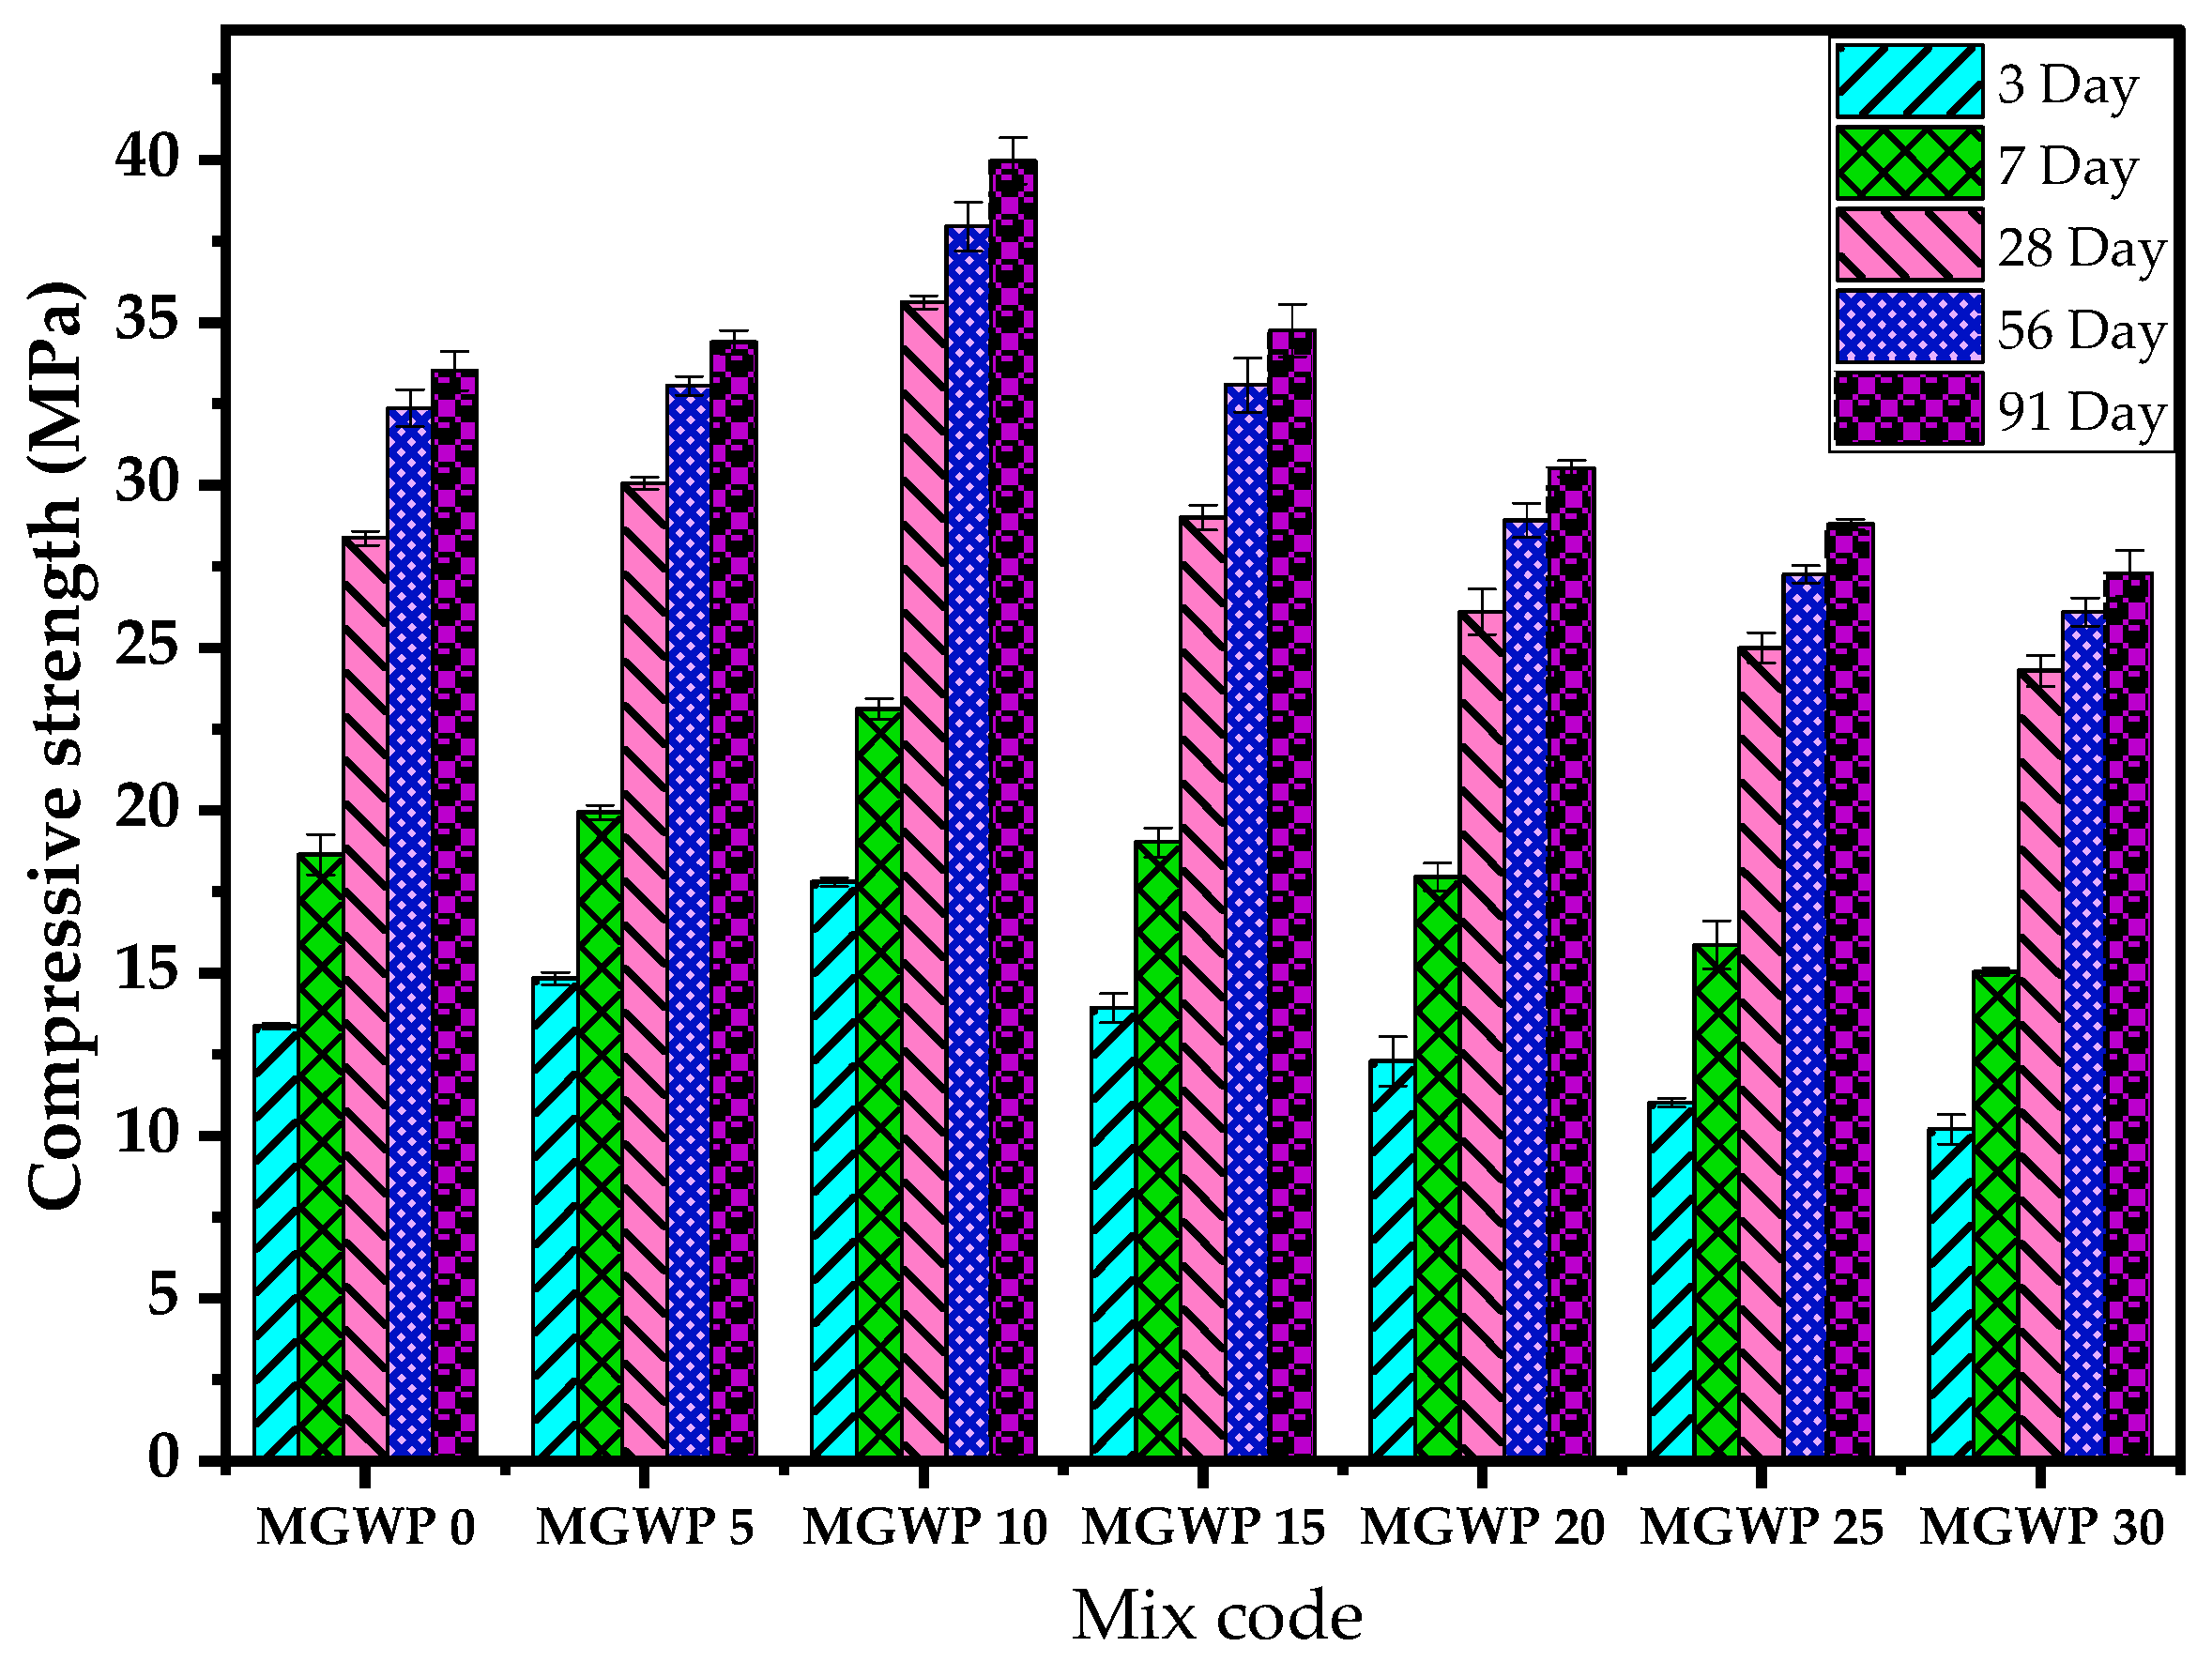
3.2.1. Compressive Strength
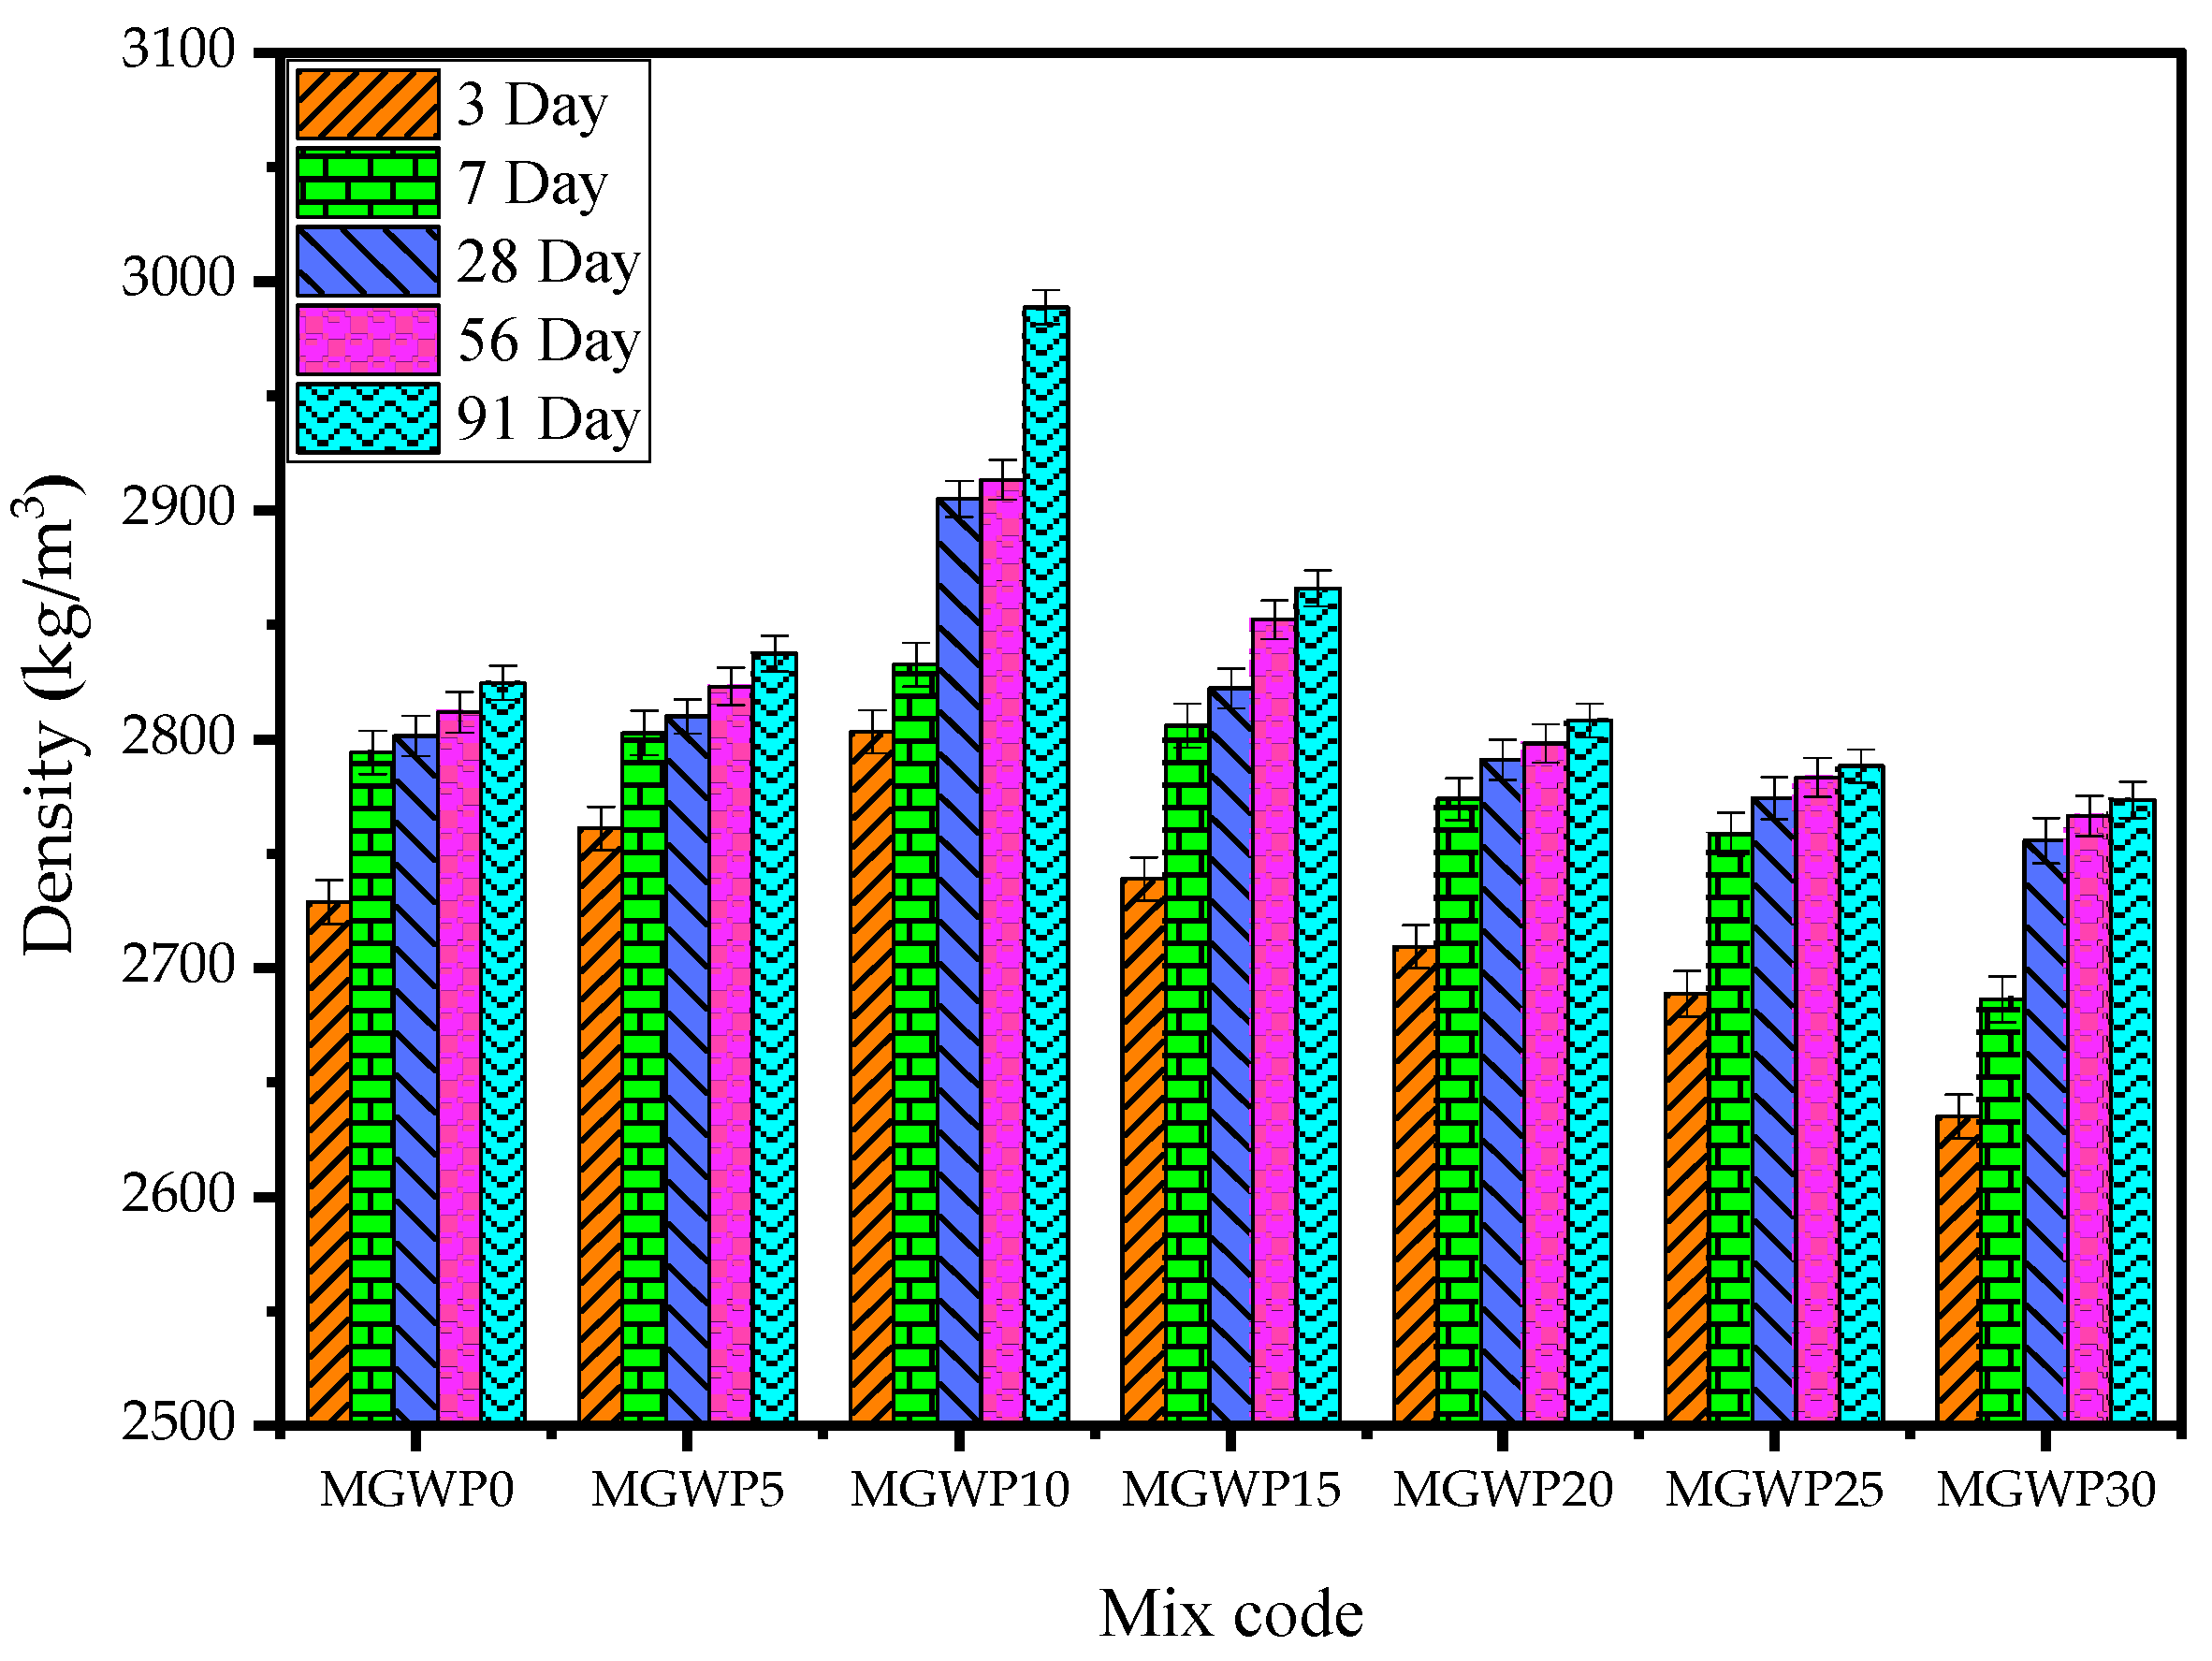
3.2.2. Bulk Density
3.2.3. UPV
3.3. Durability Properties
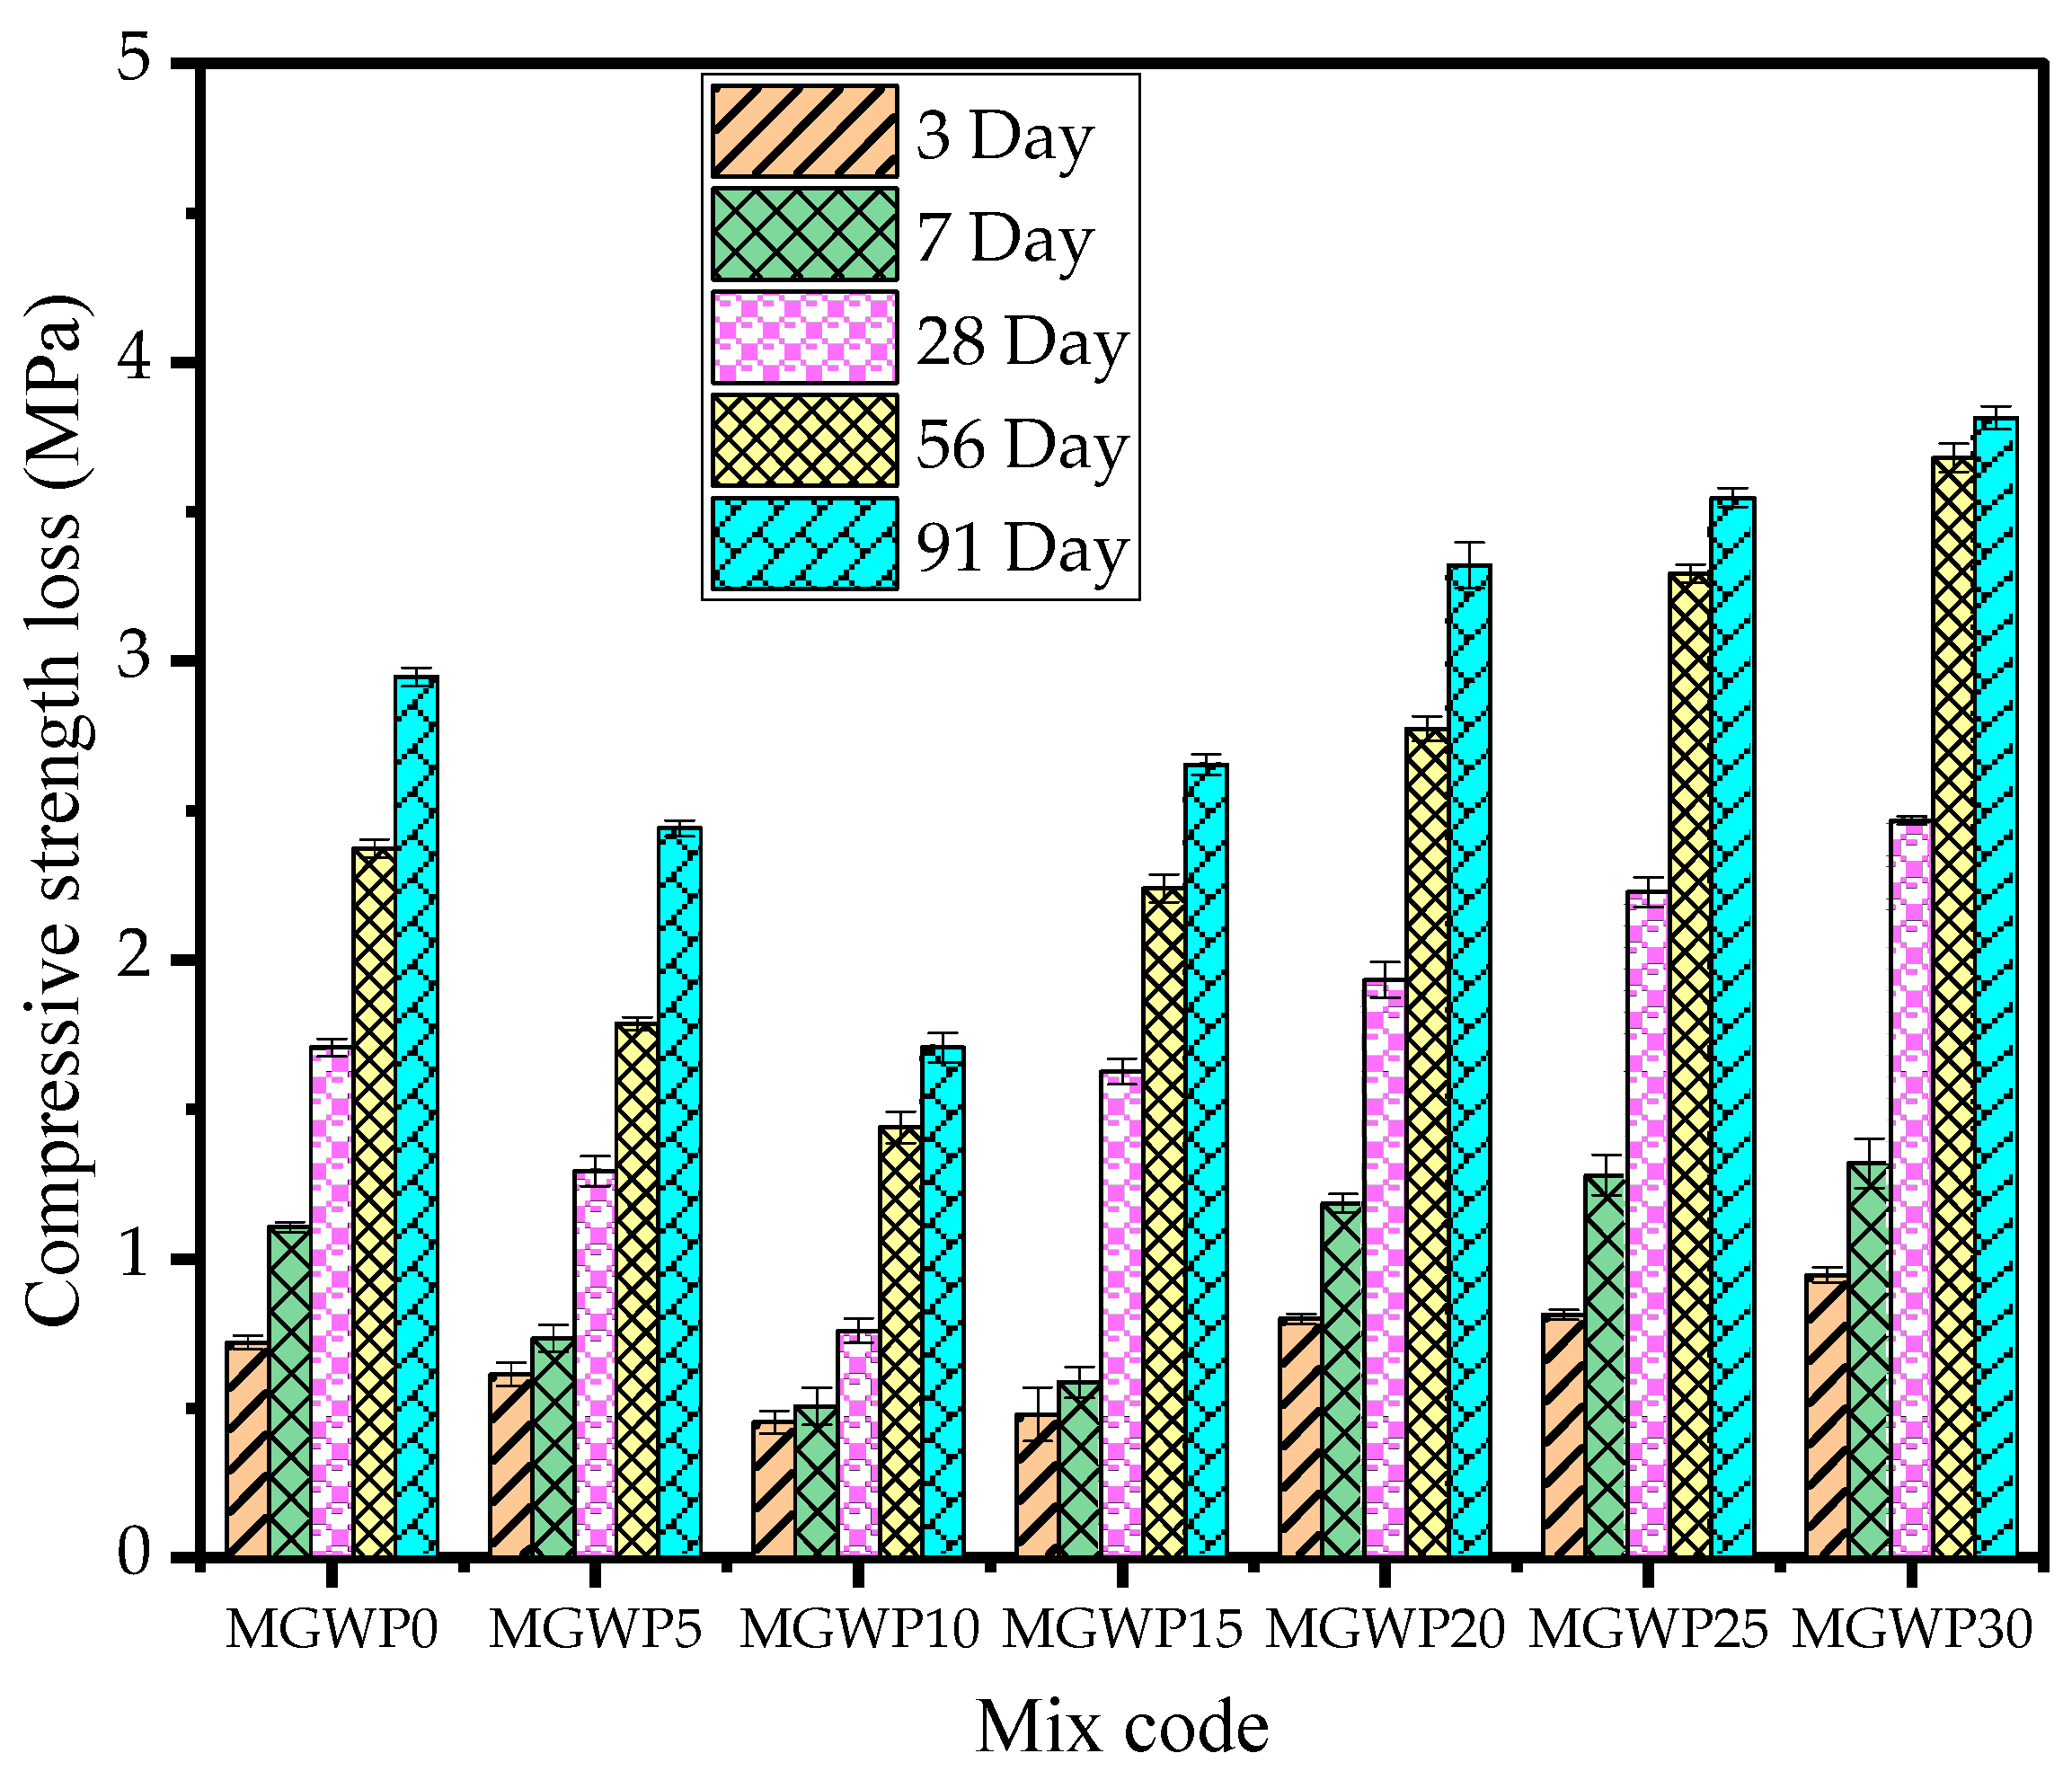
3.3.1. Sulfate Attack
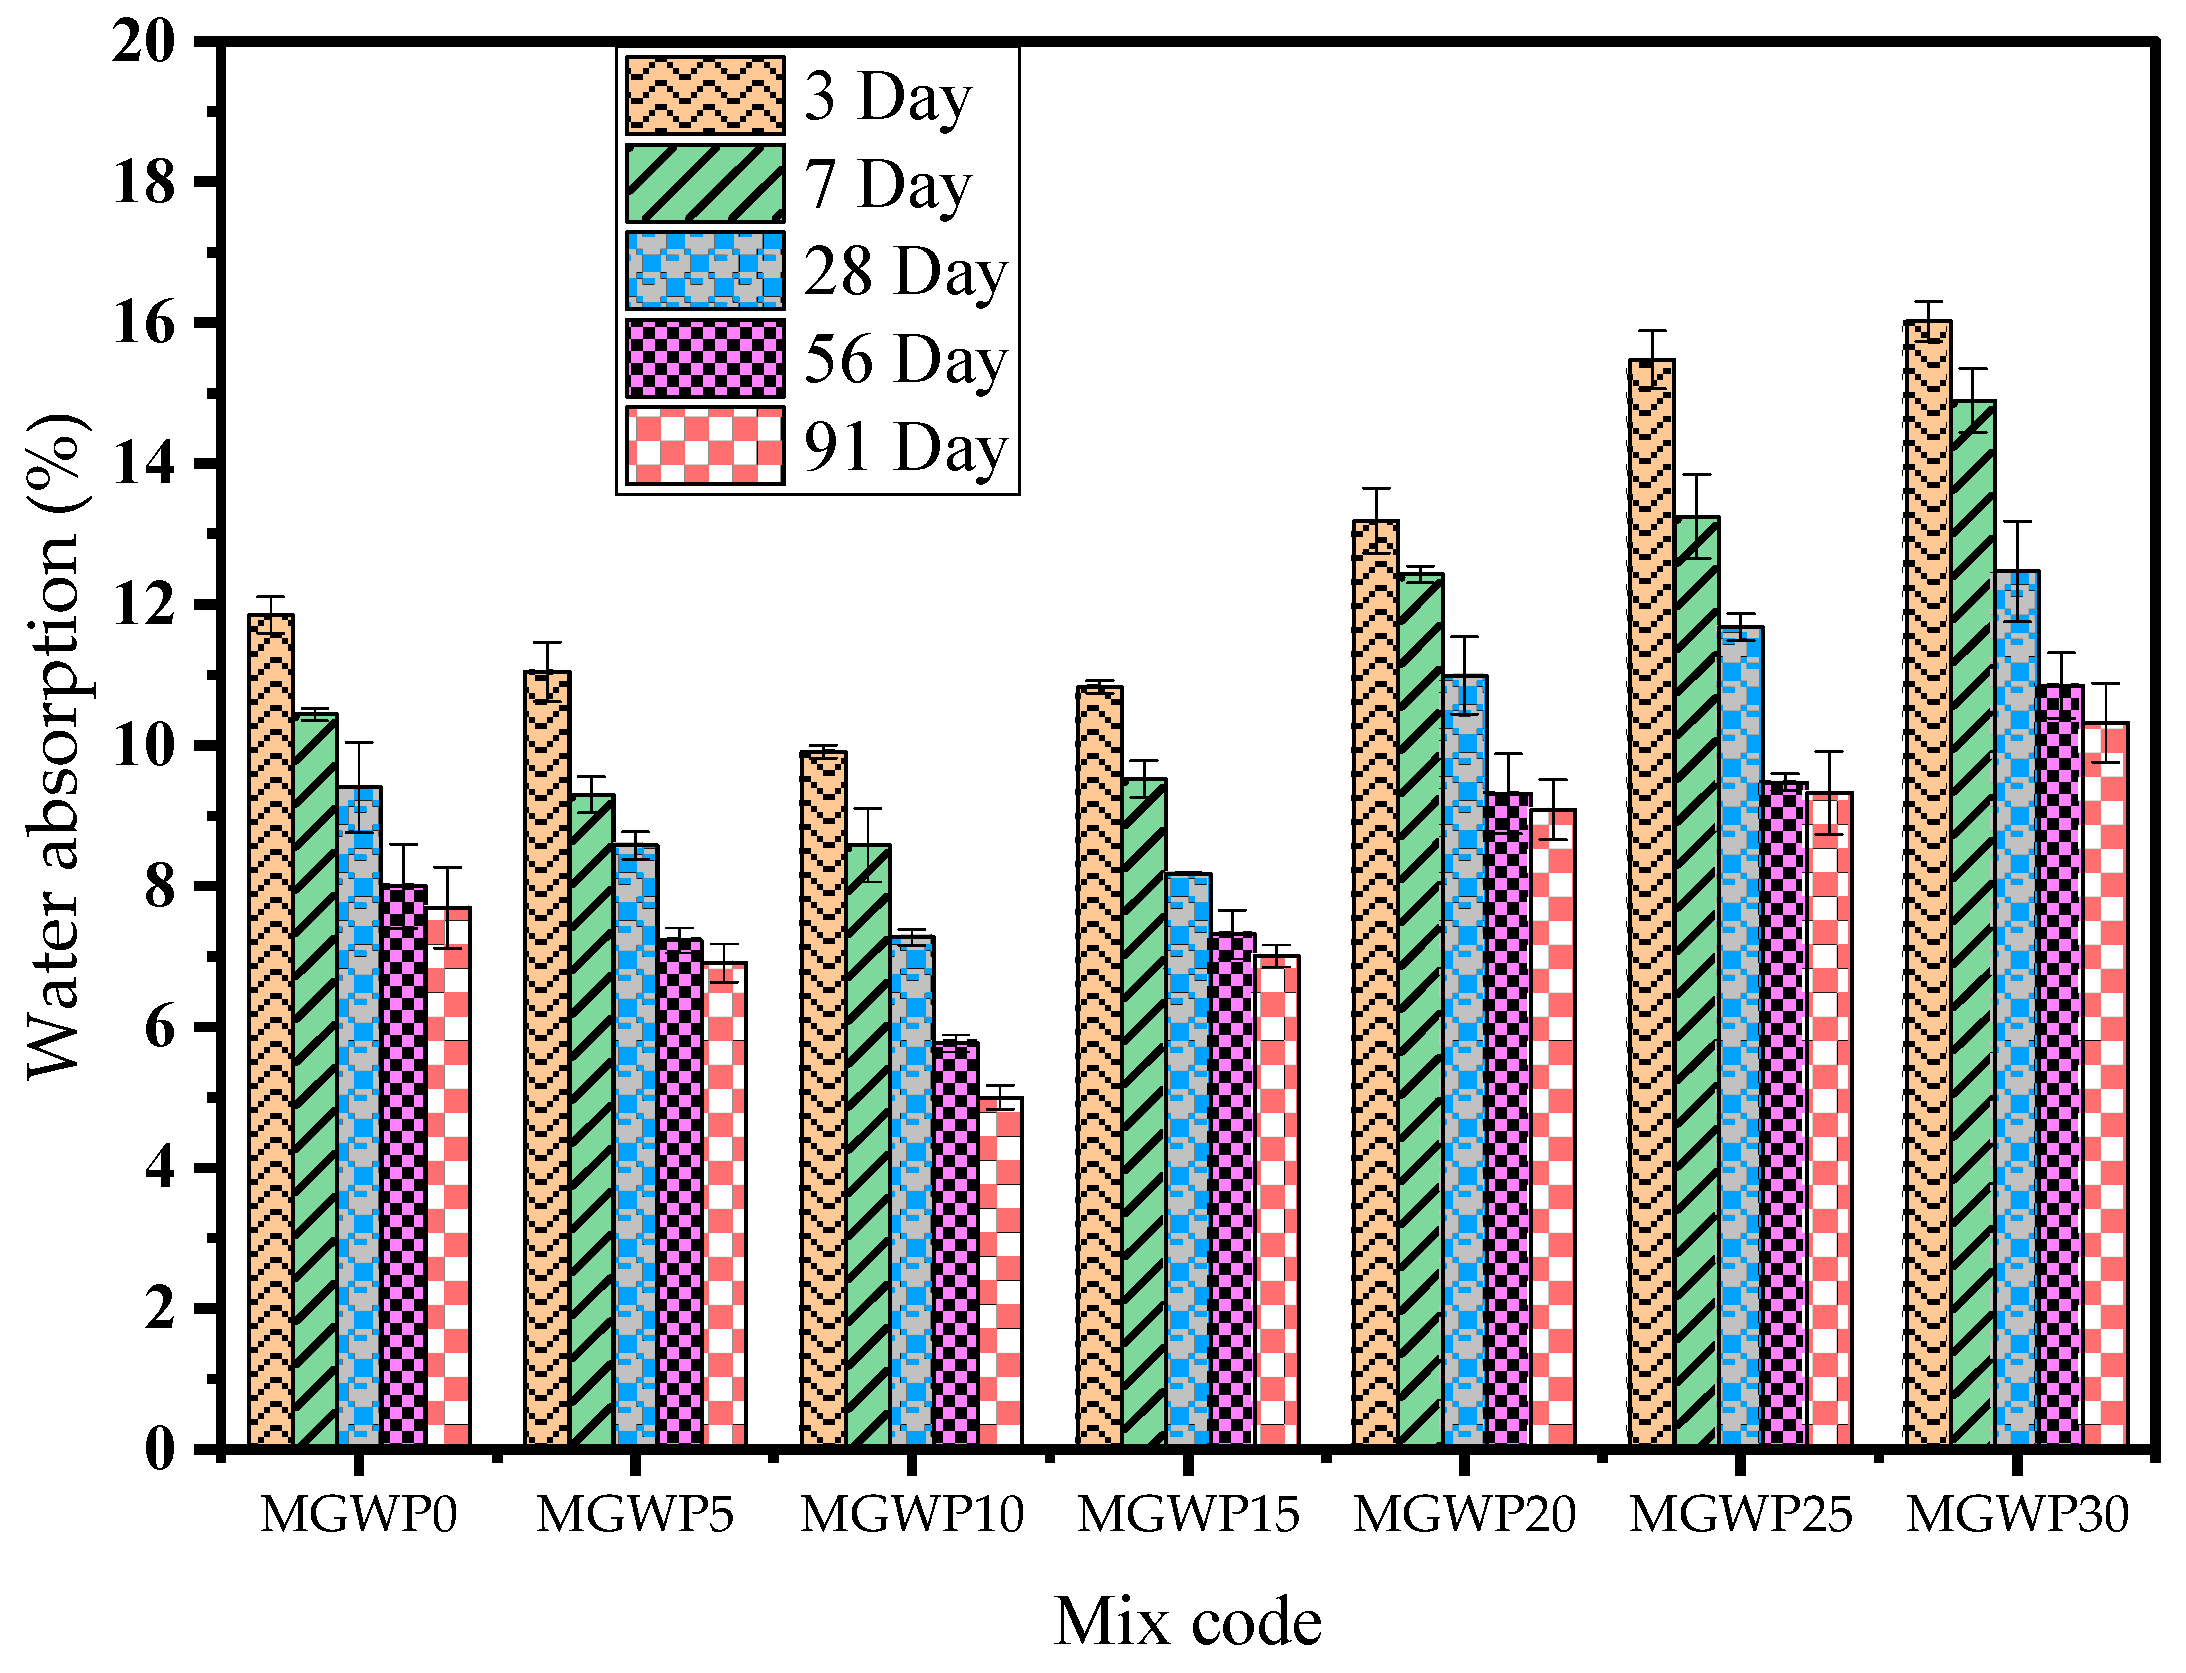
3.3.2. Water Absorption
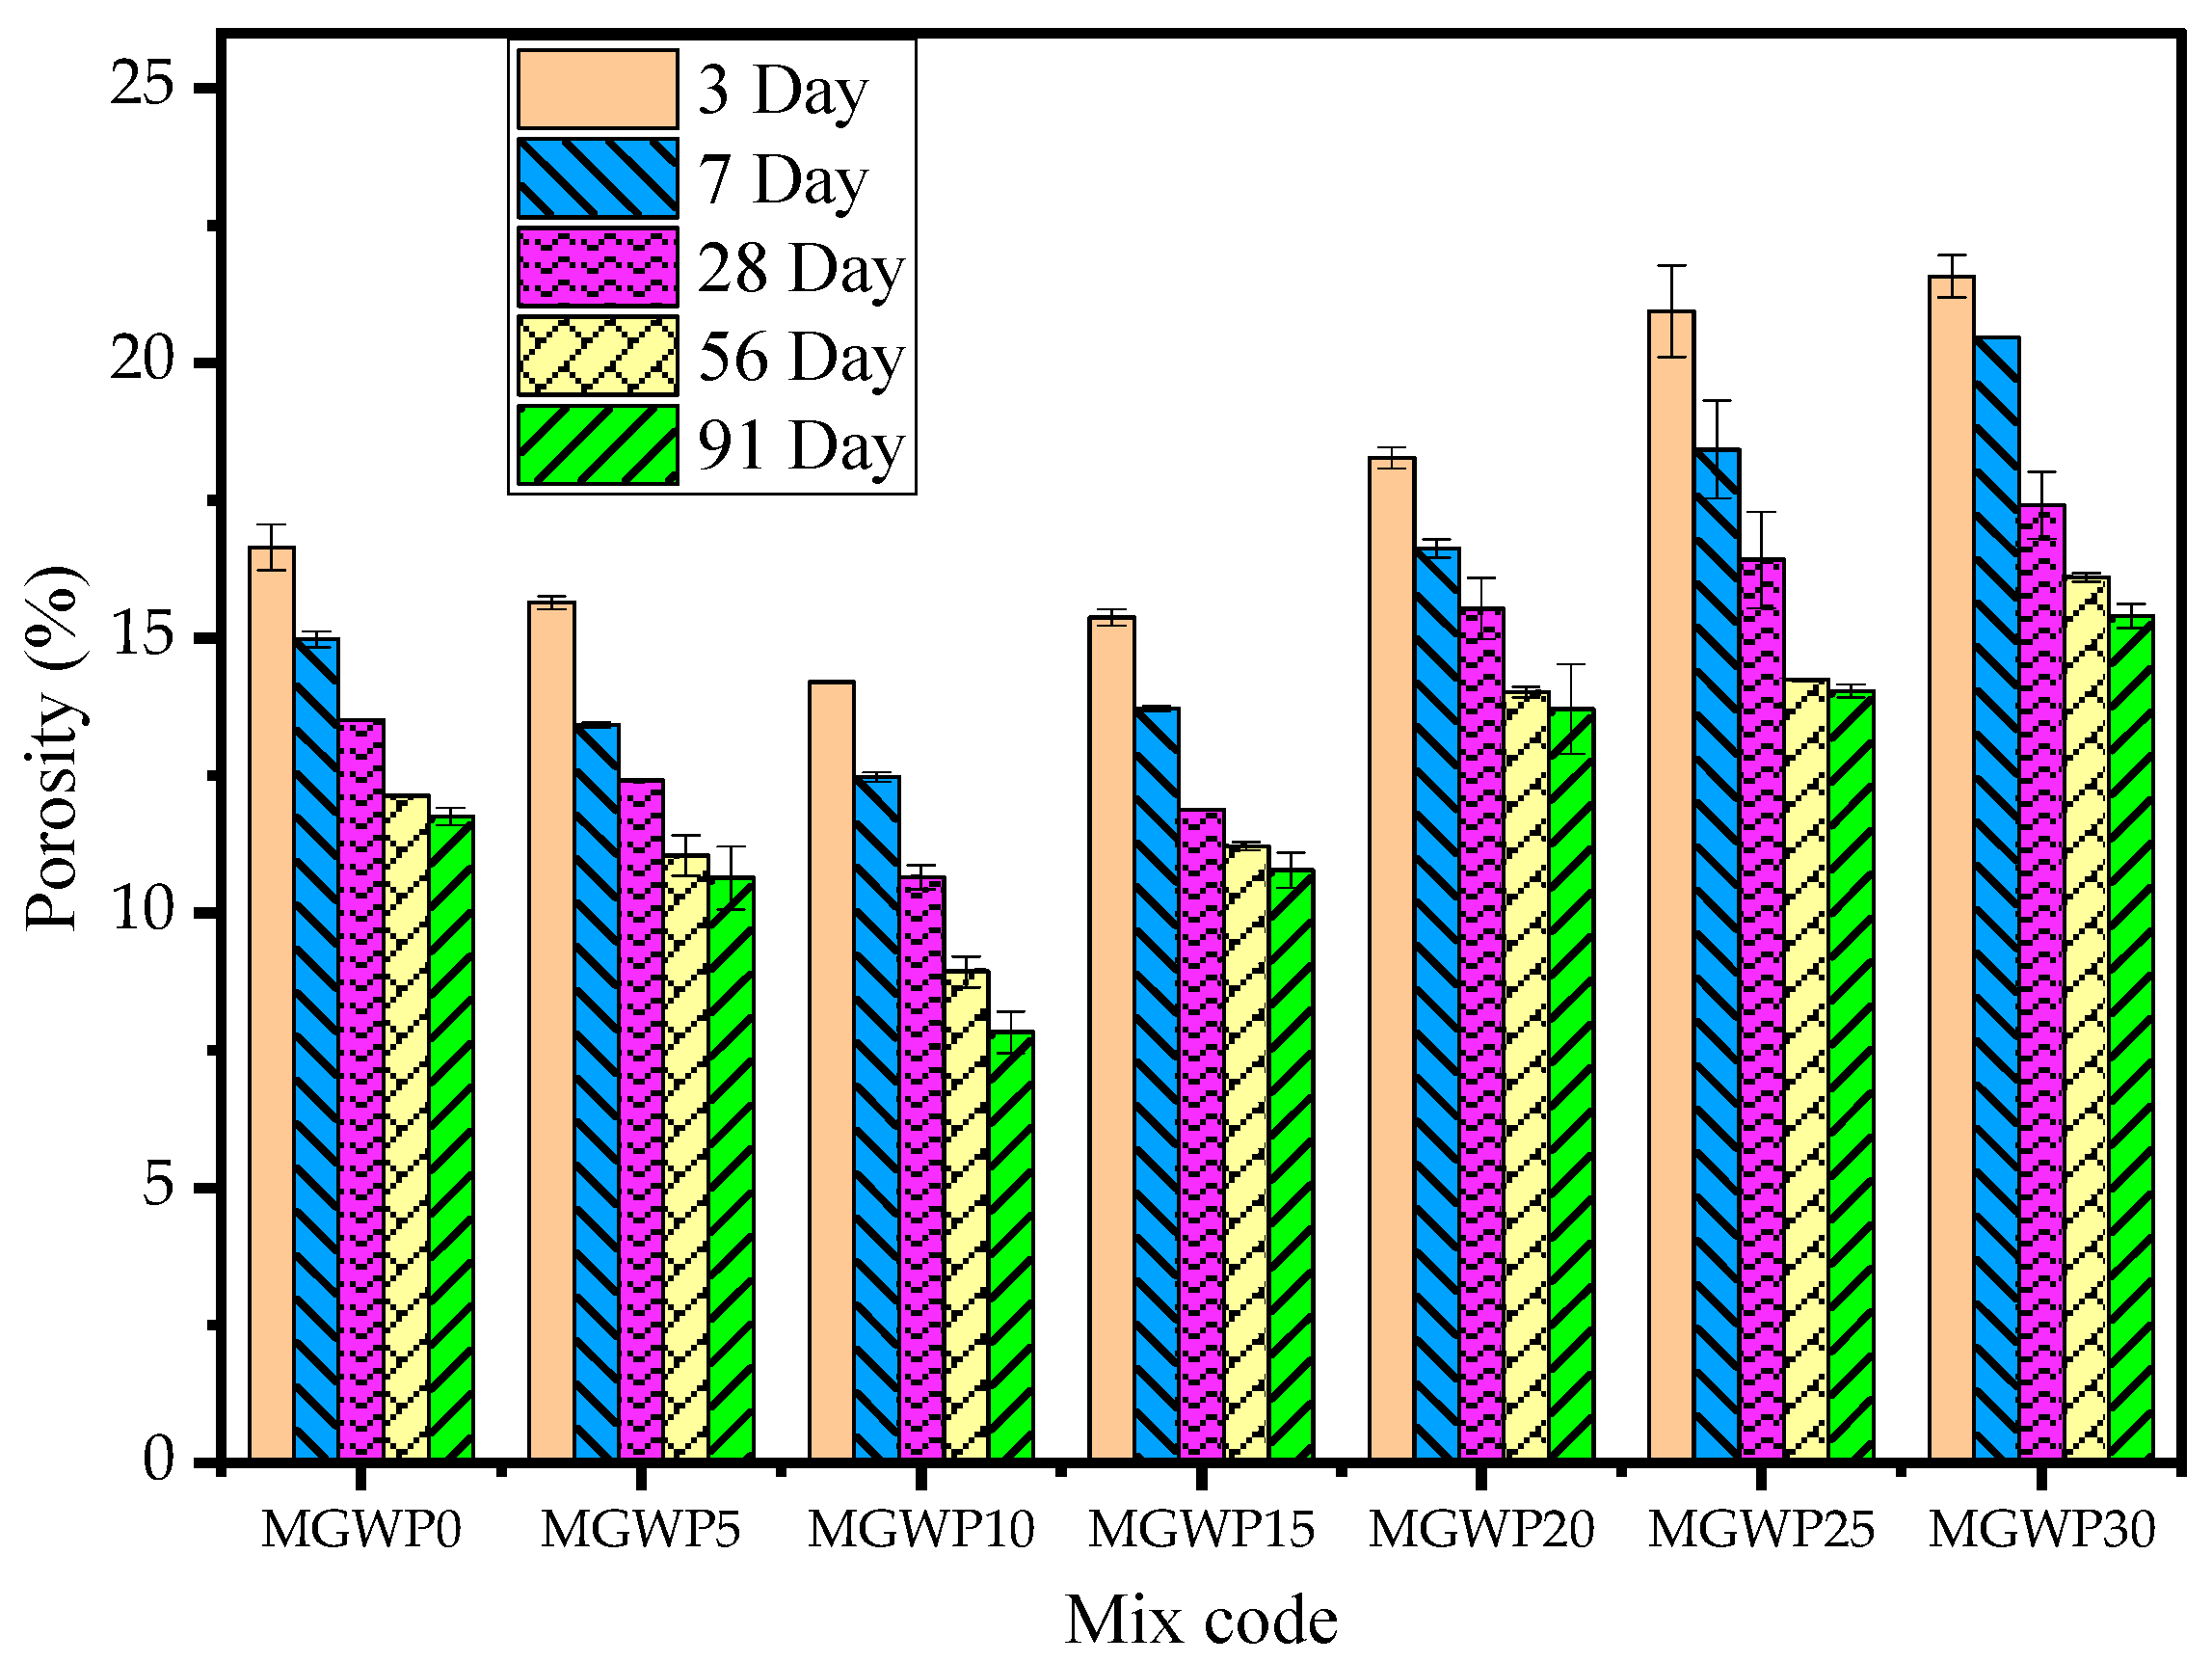
3.3.3. Porosity
3.4. Microstructure Properties of Hardened Mortar
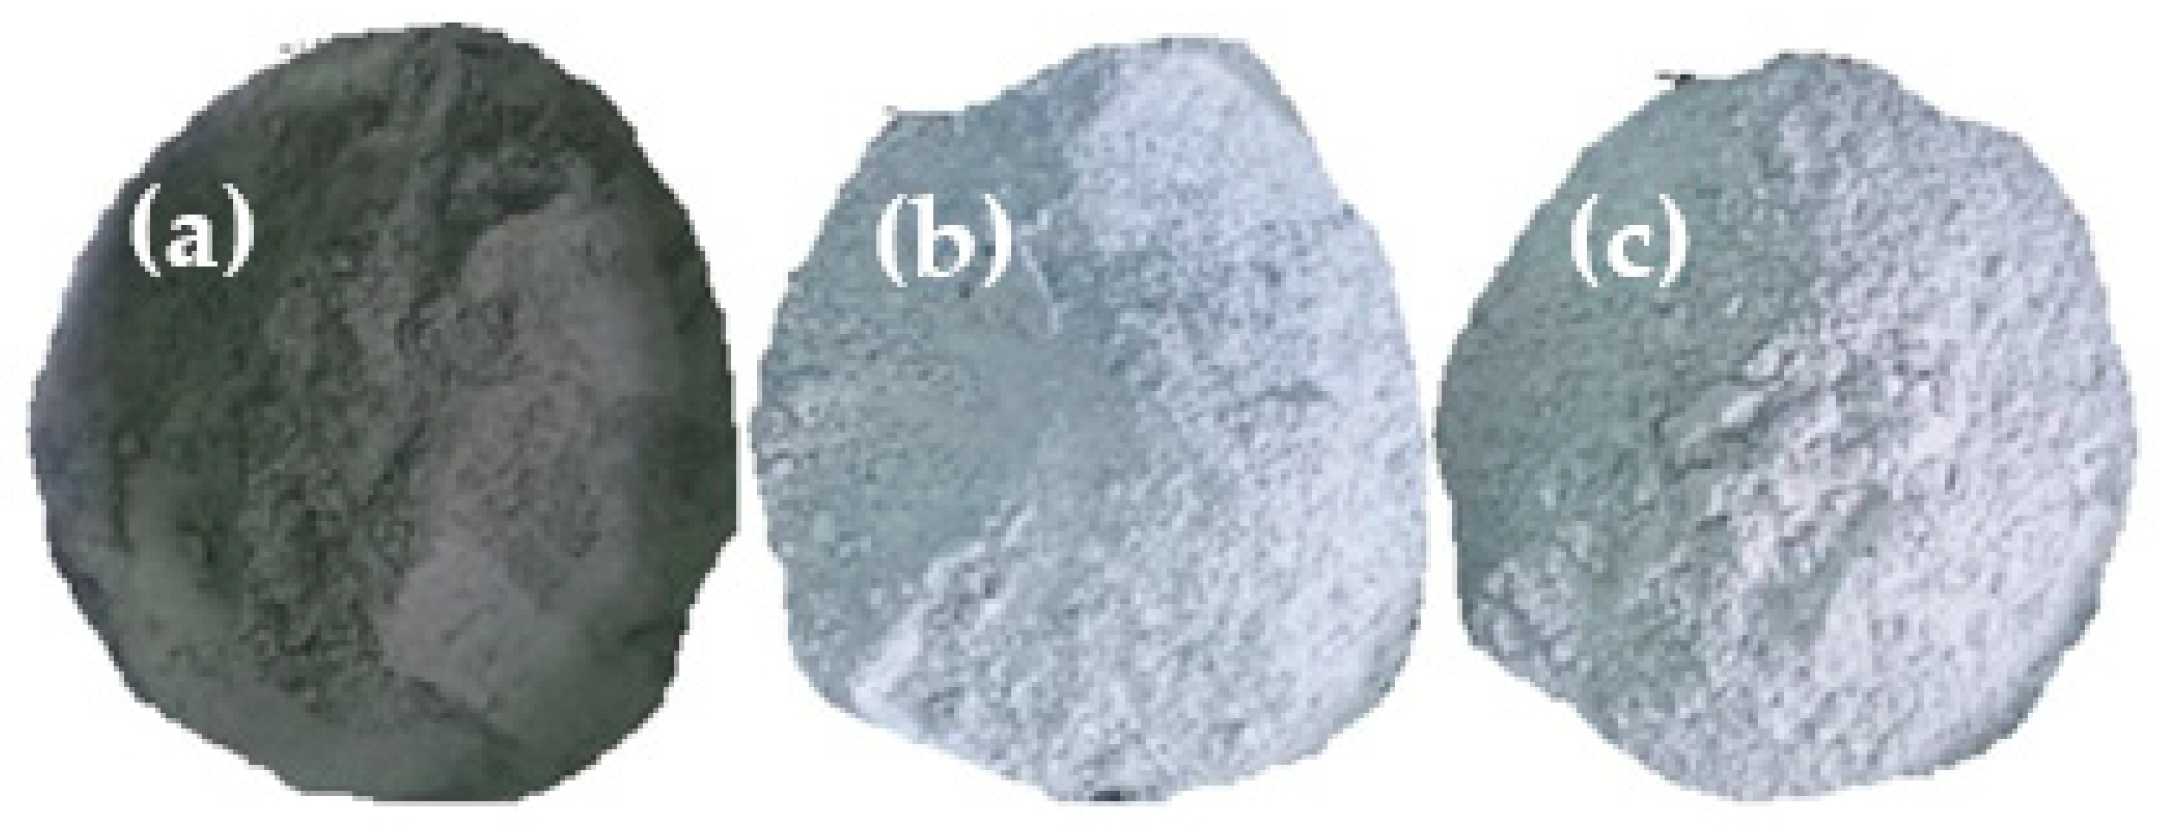
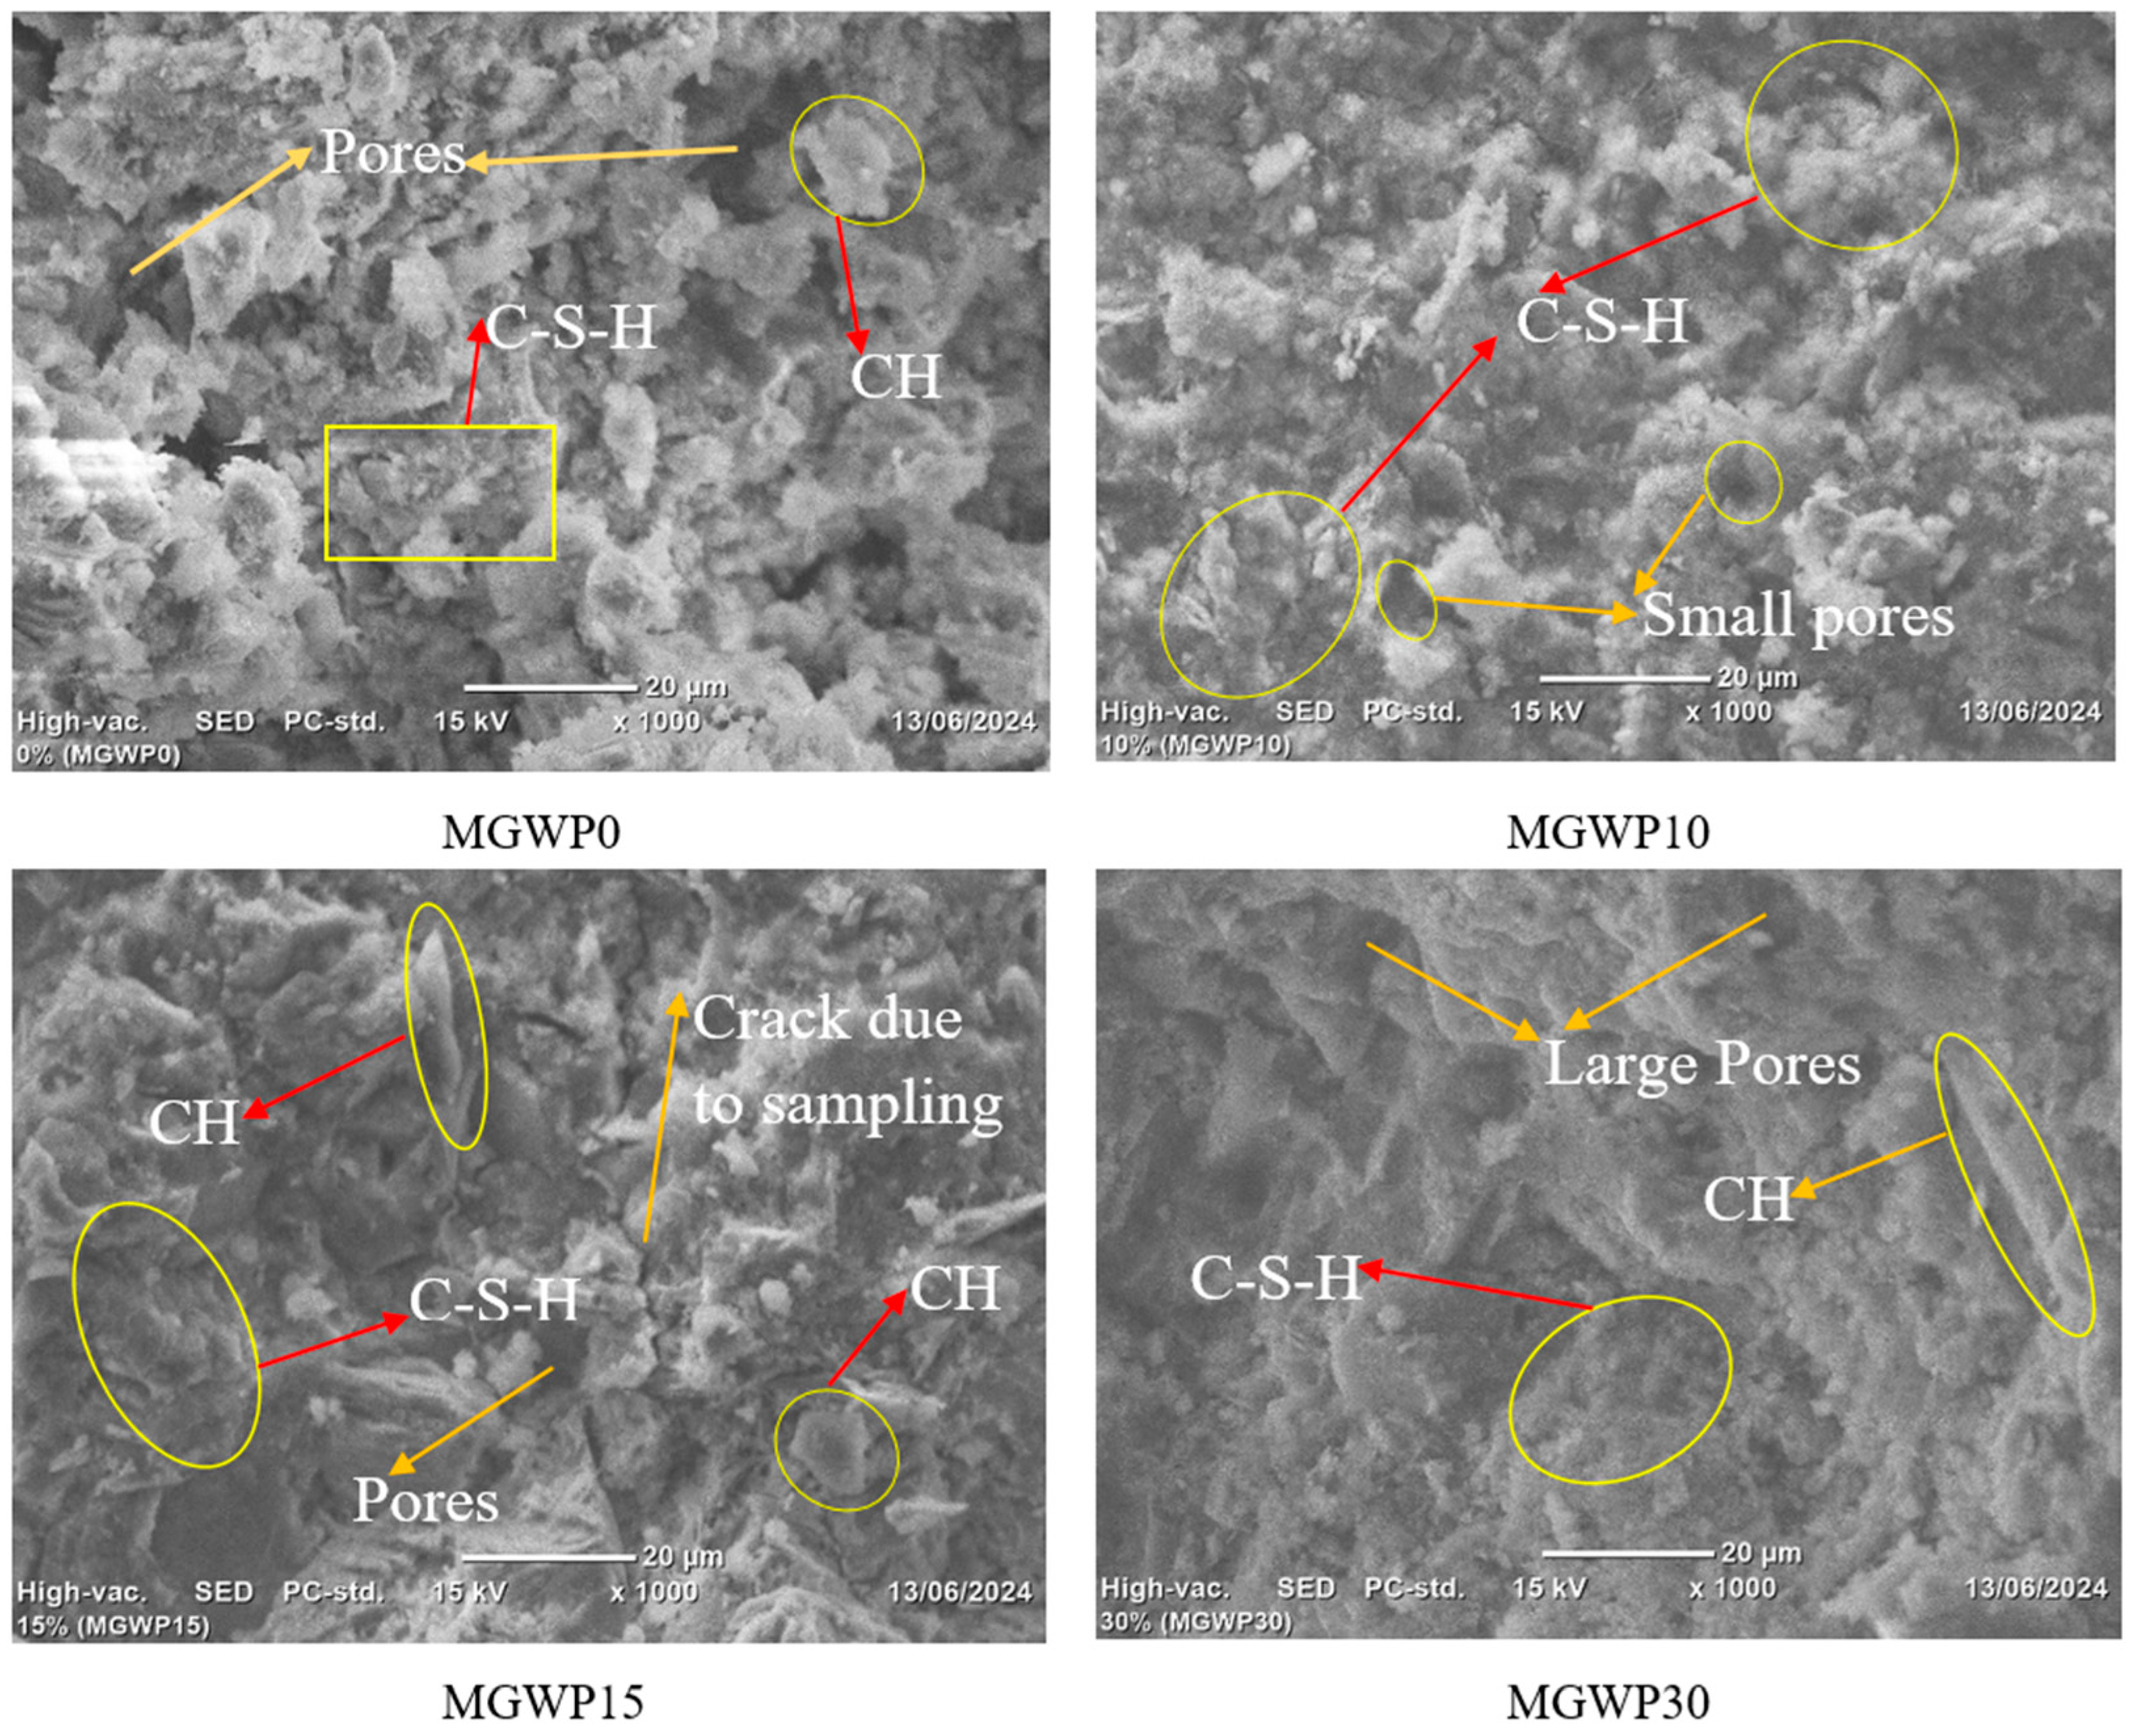
3.4.1. SEM
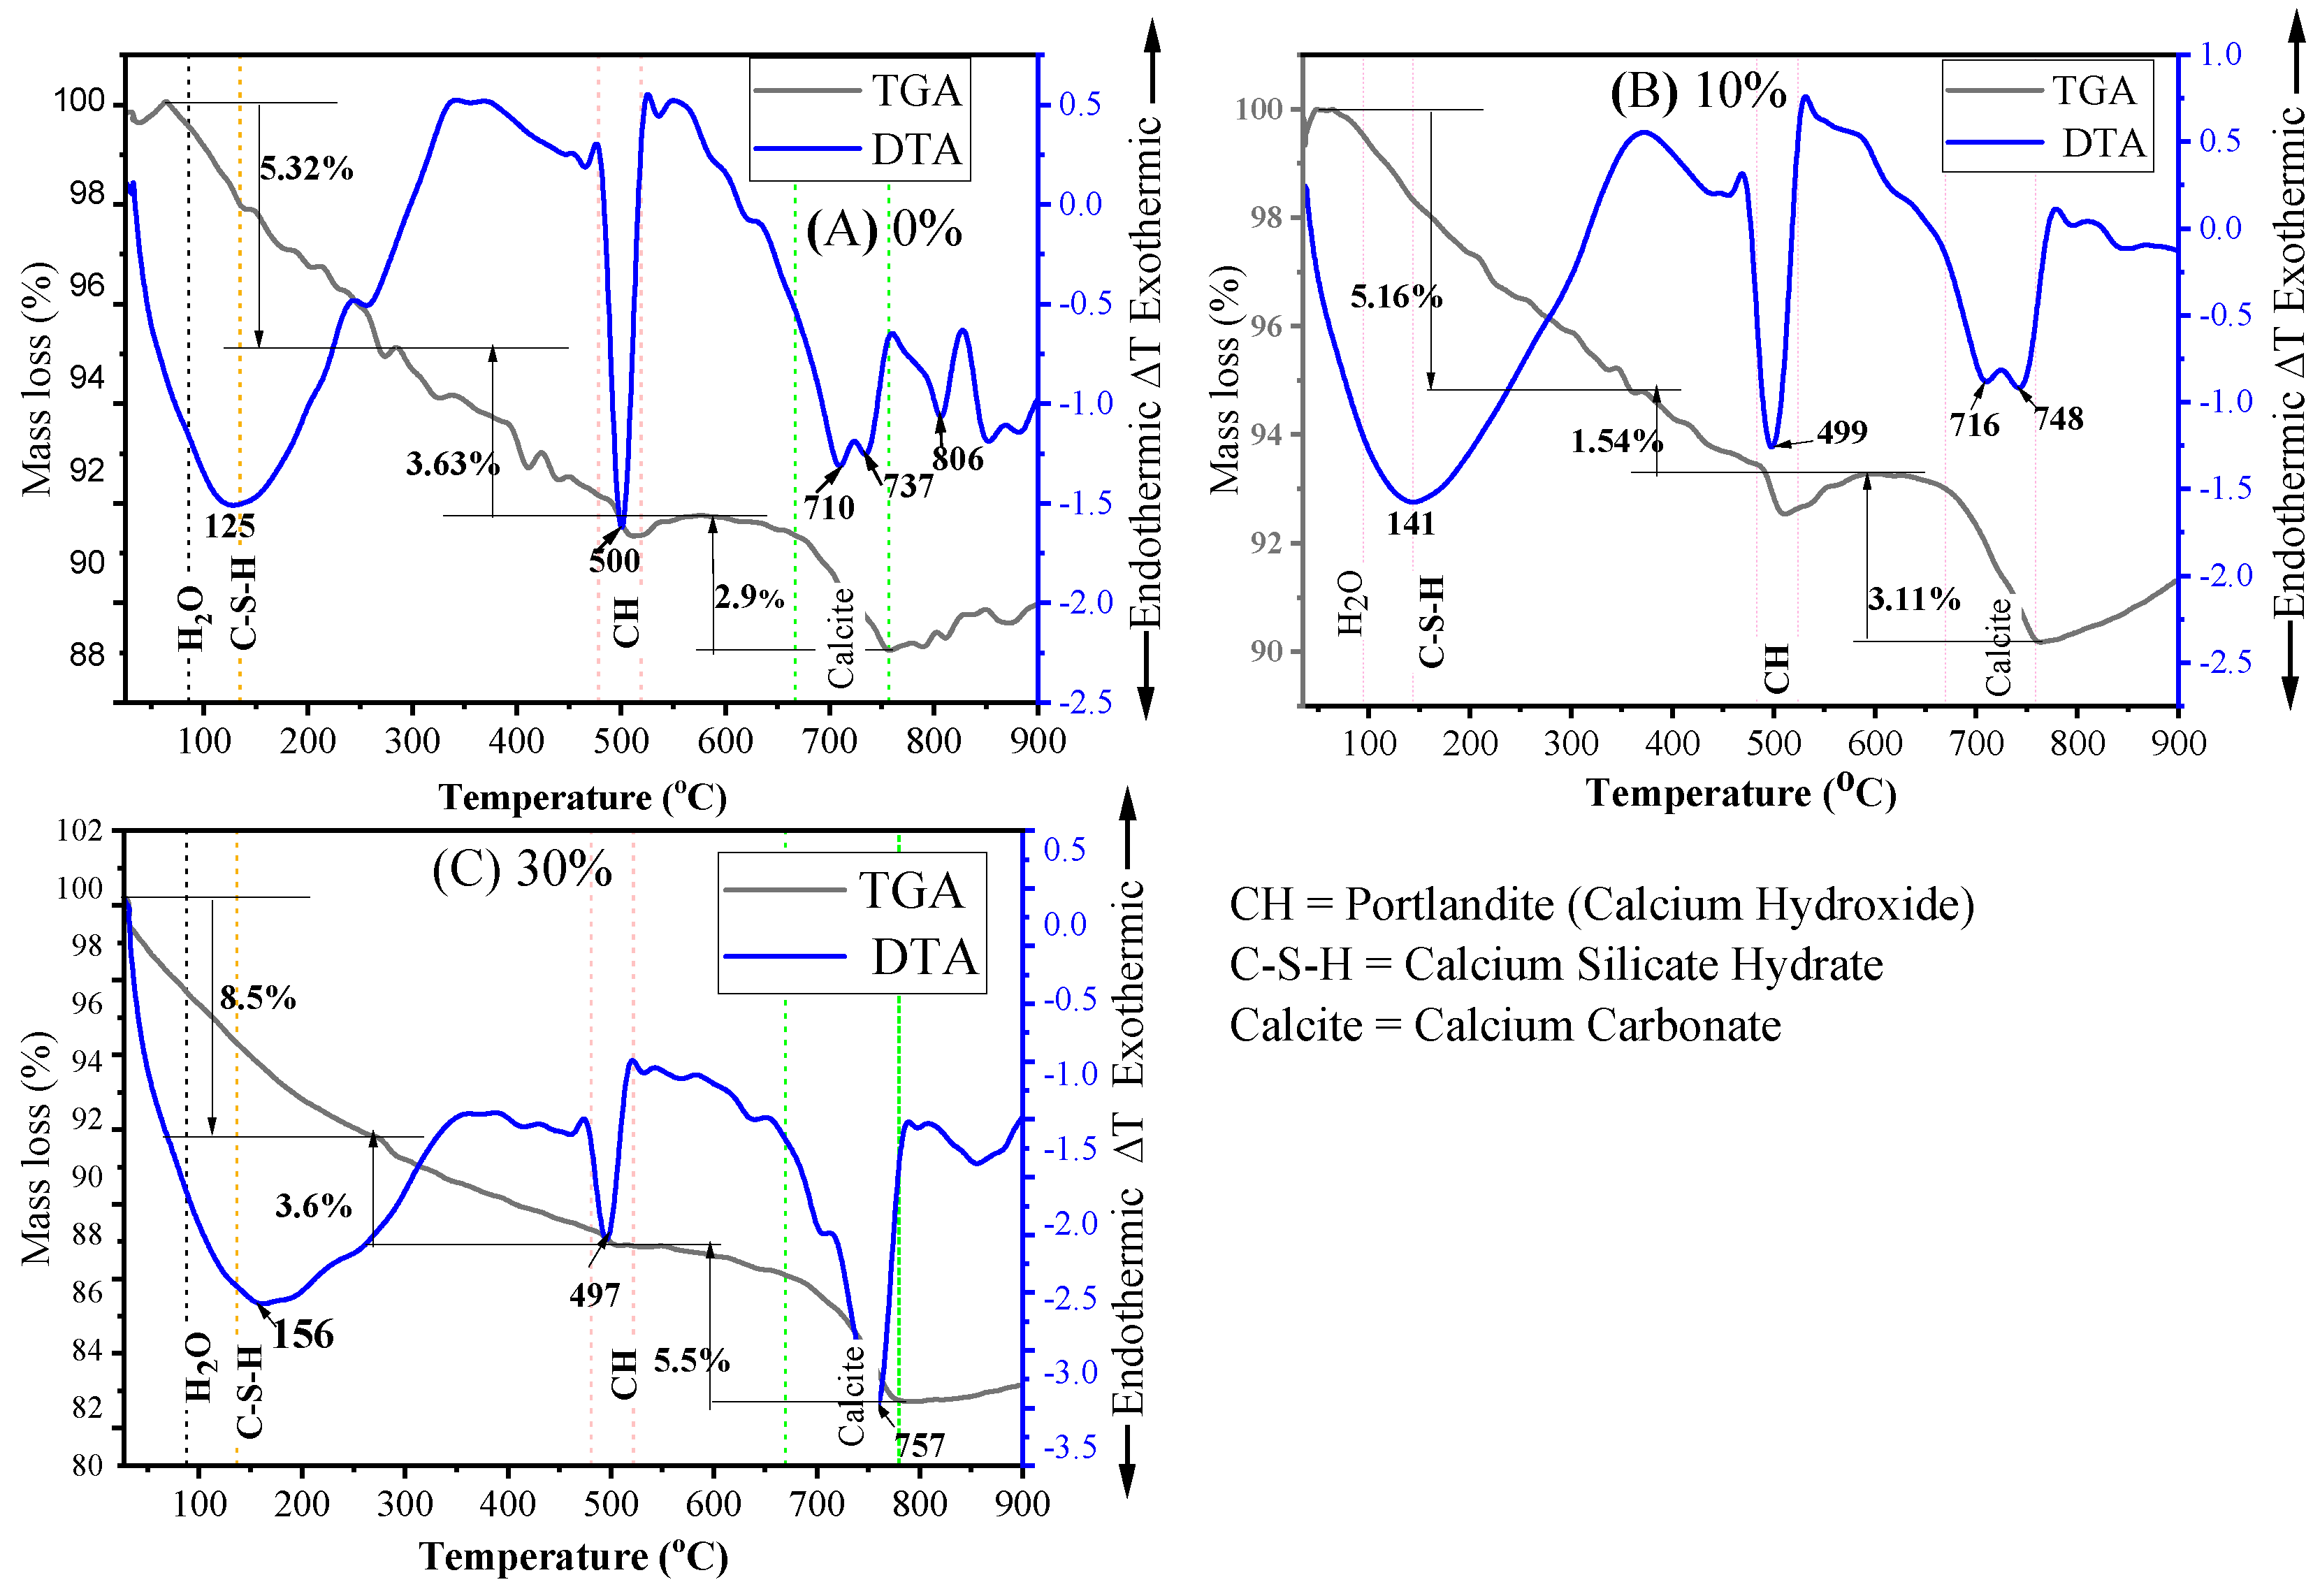
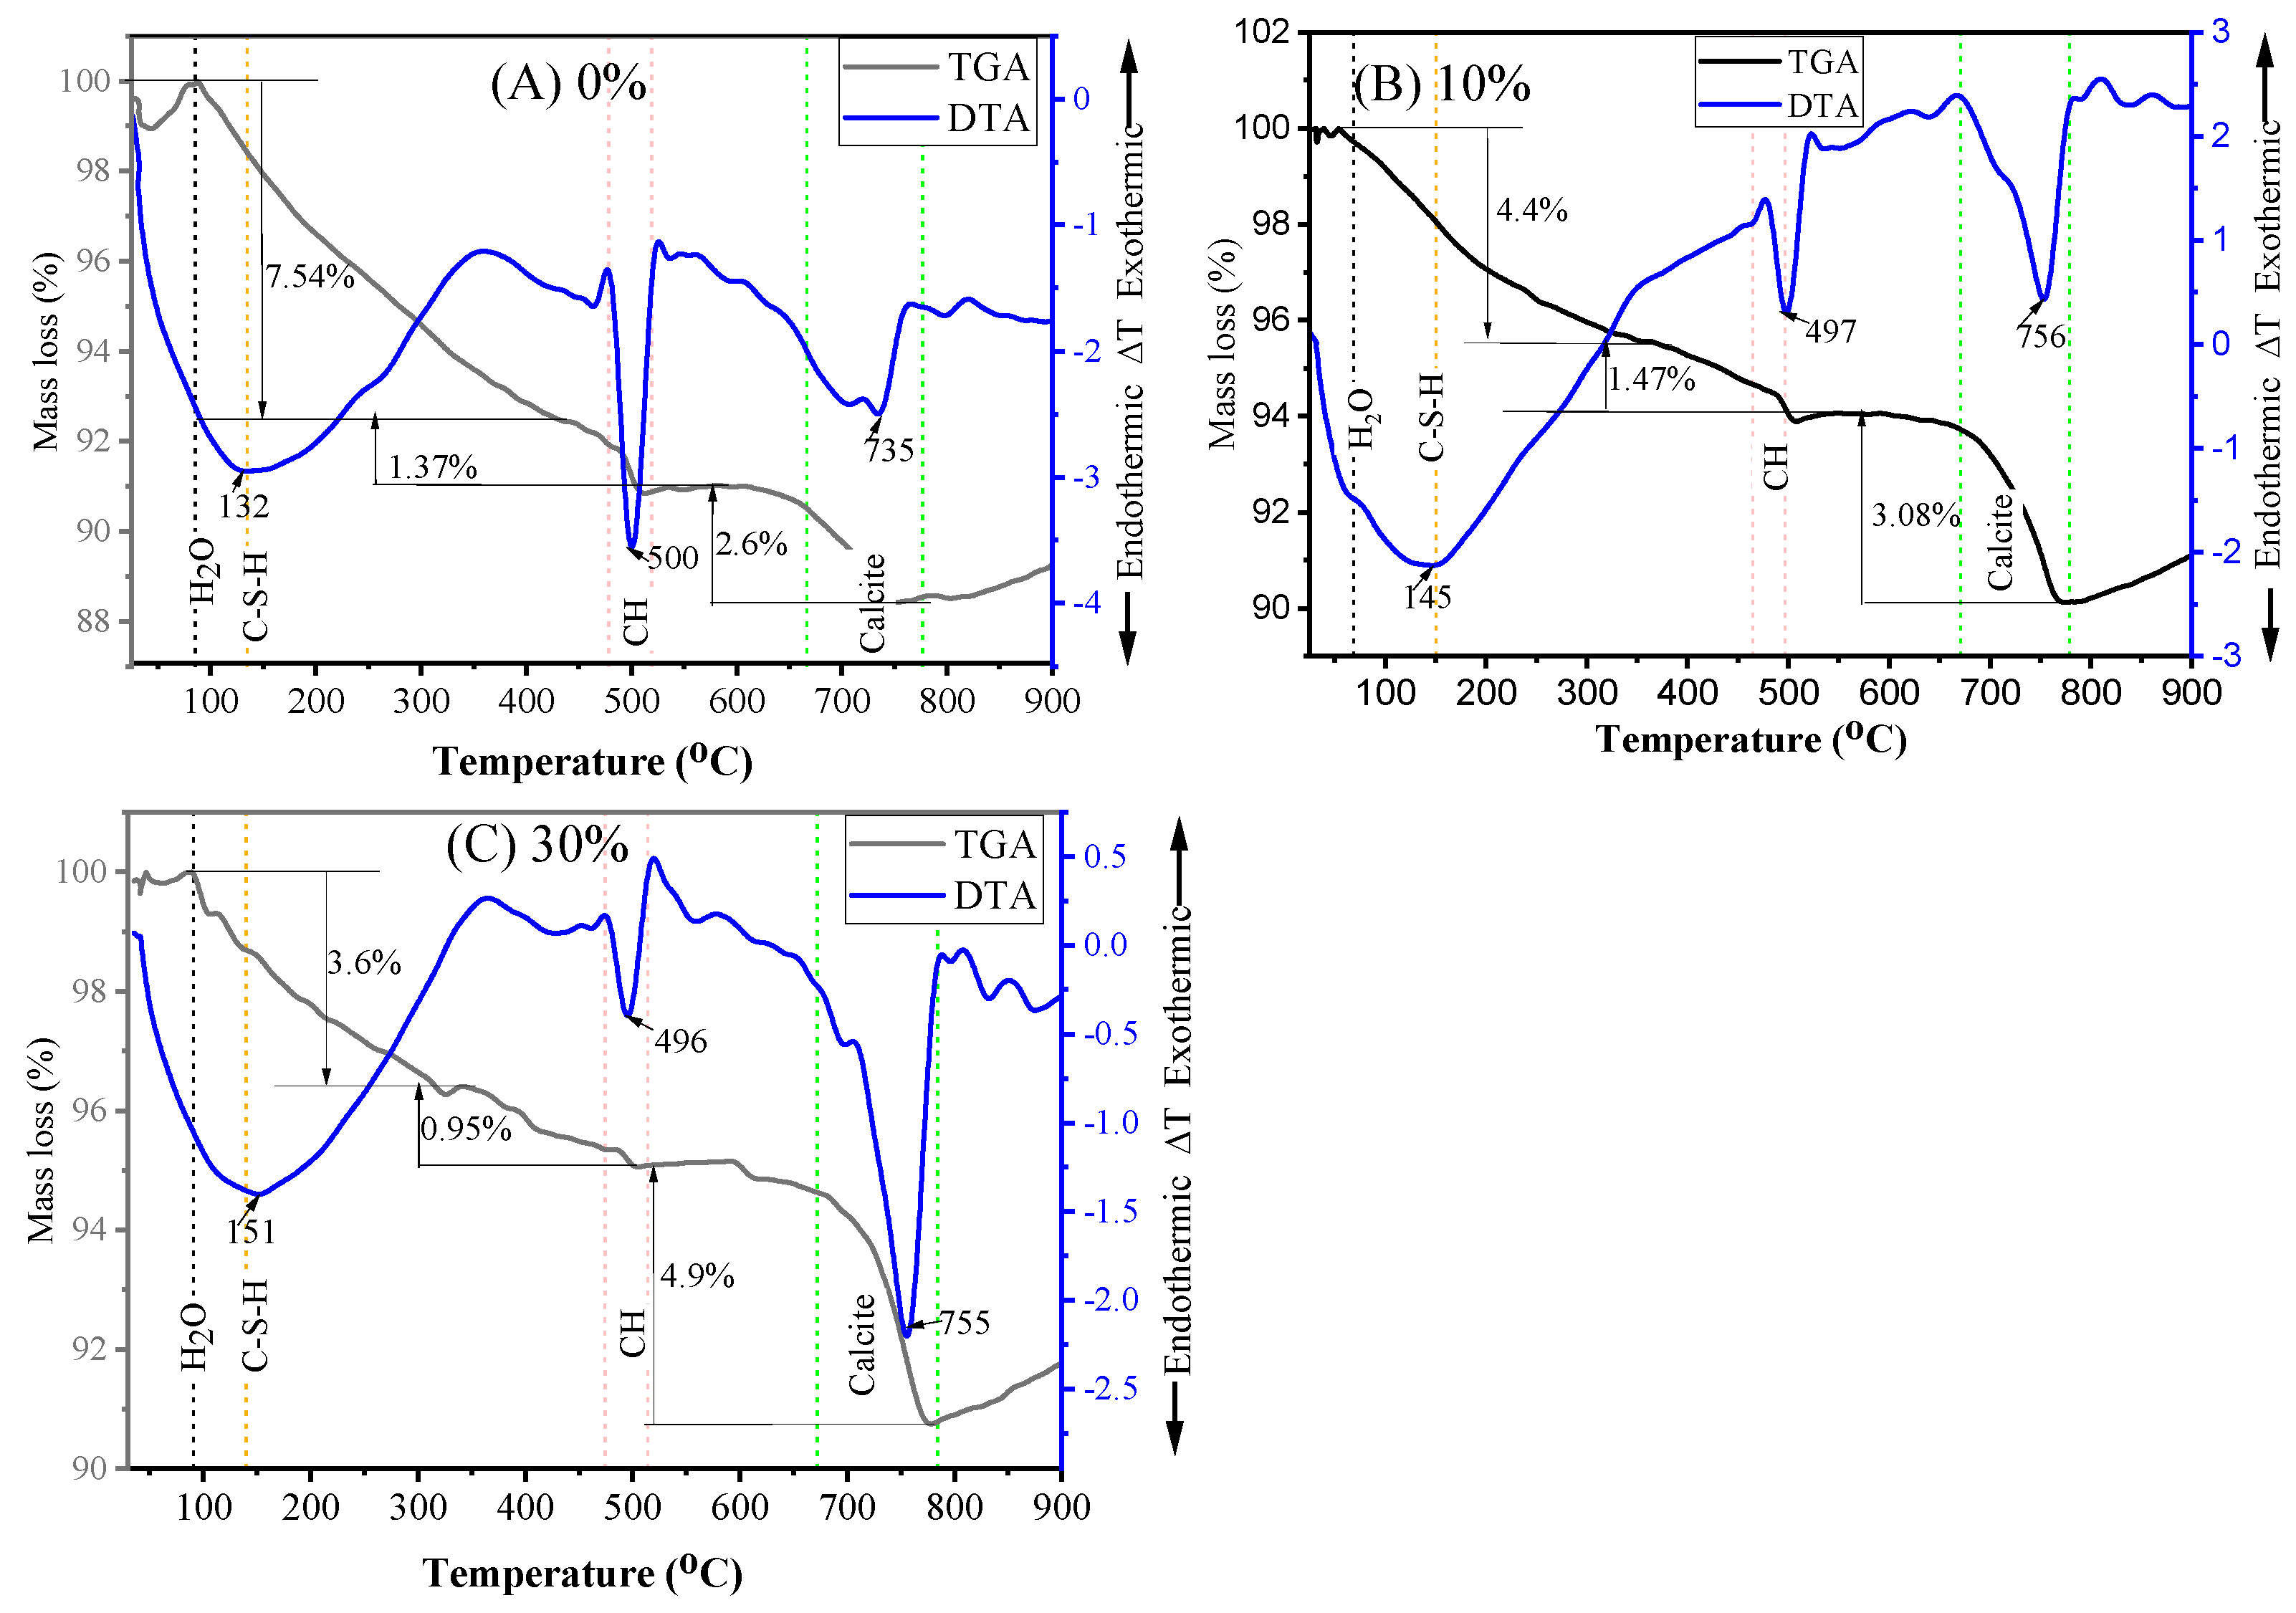
3.4.2. TGA and DTA
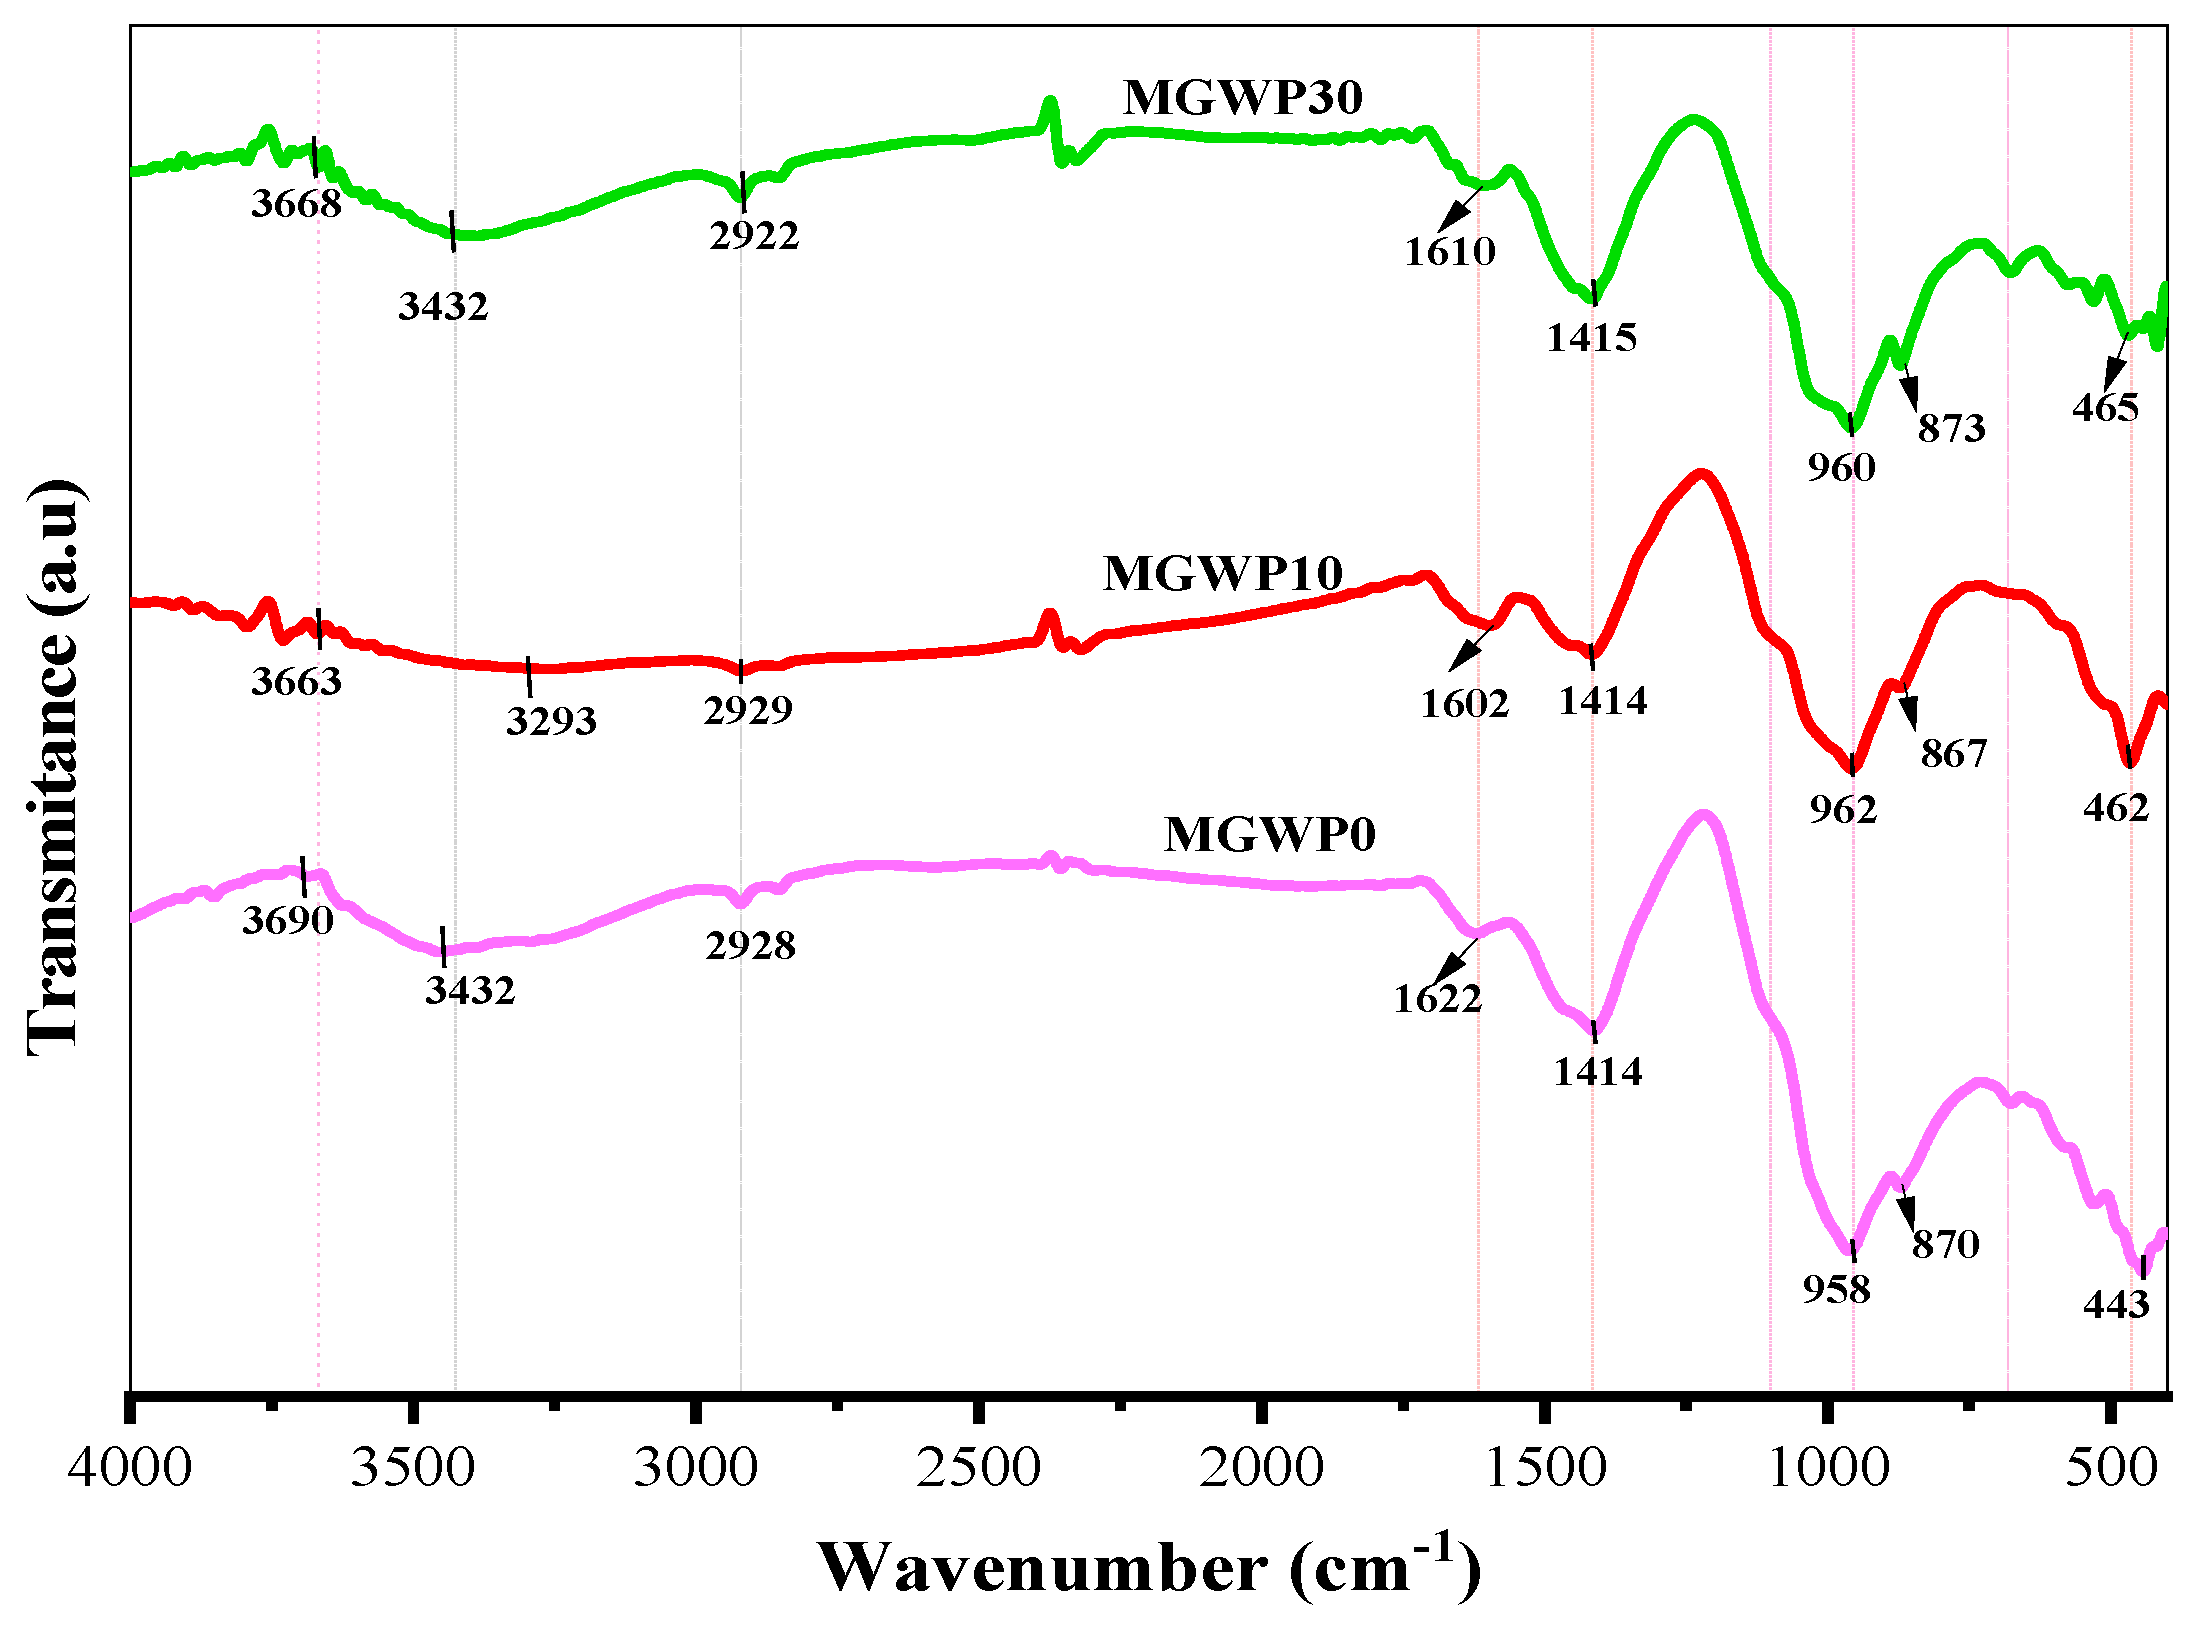
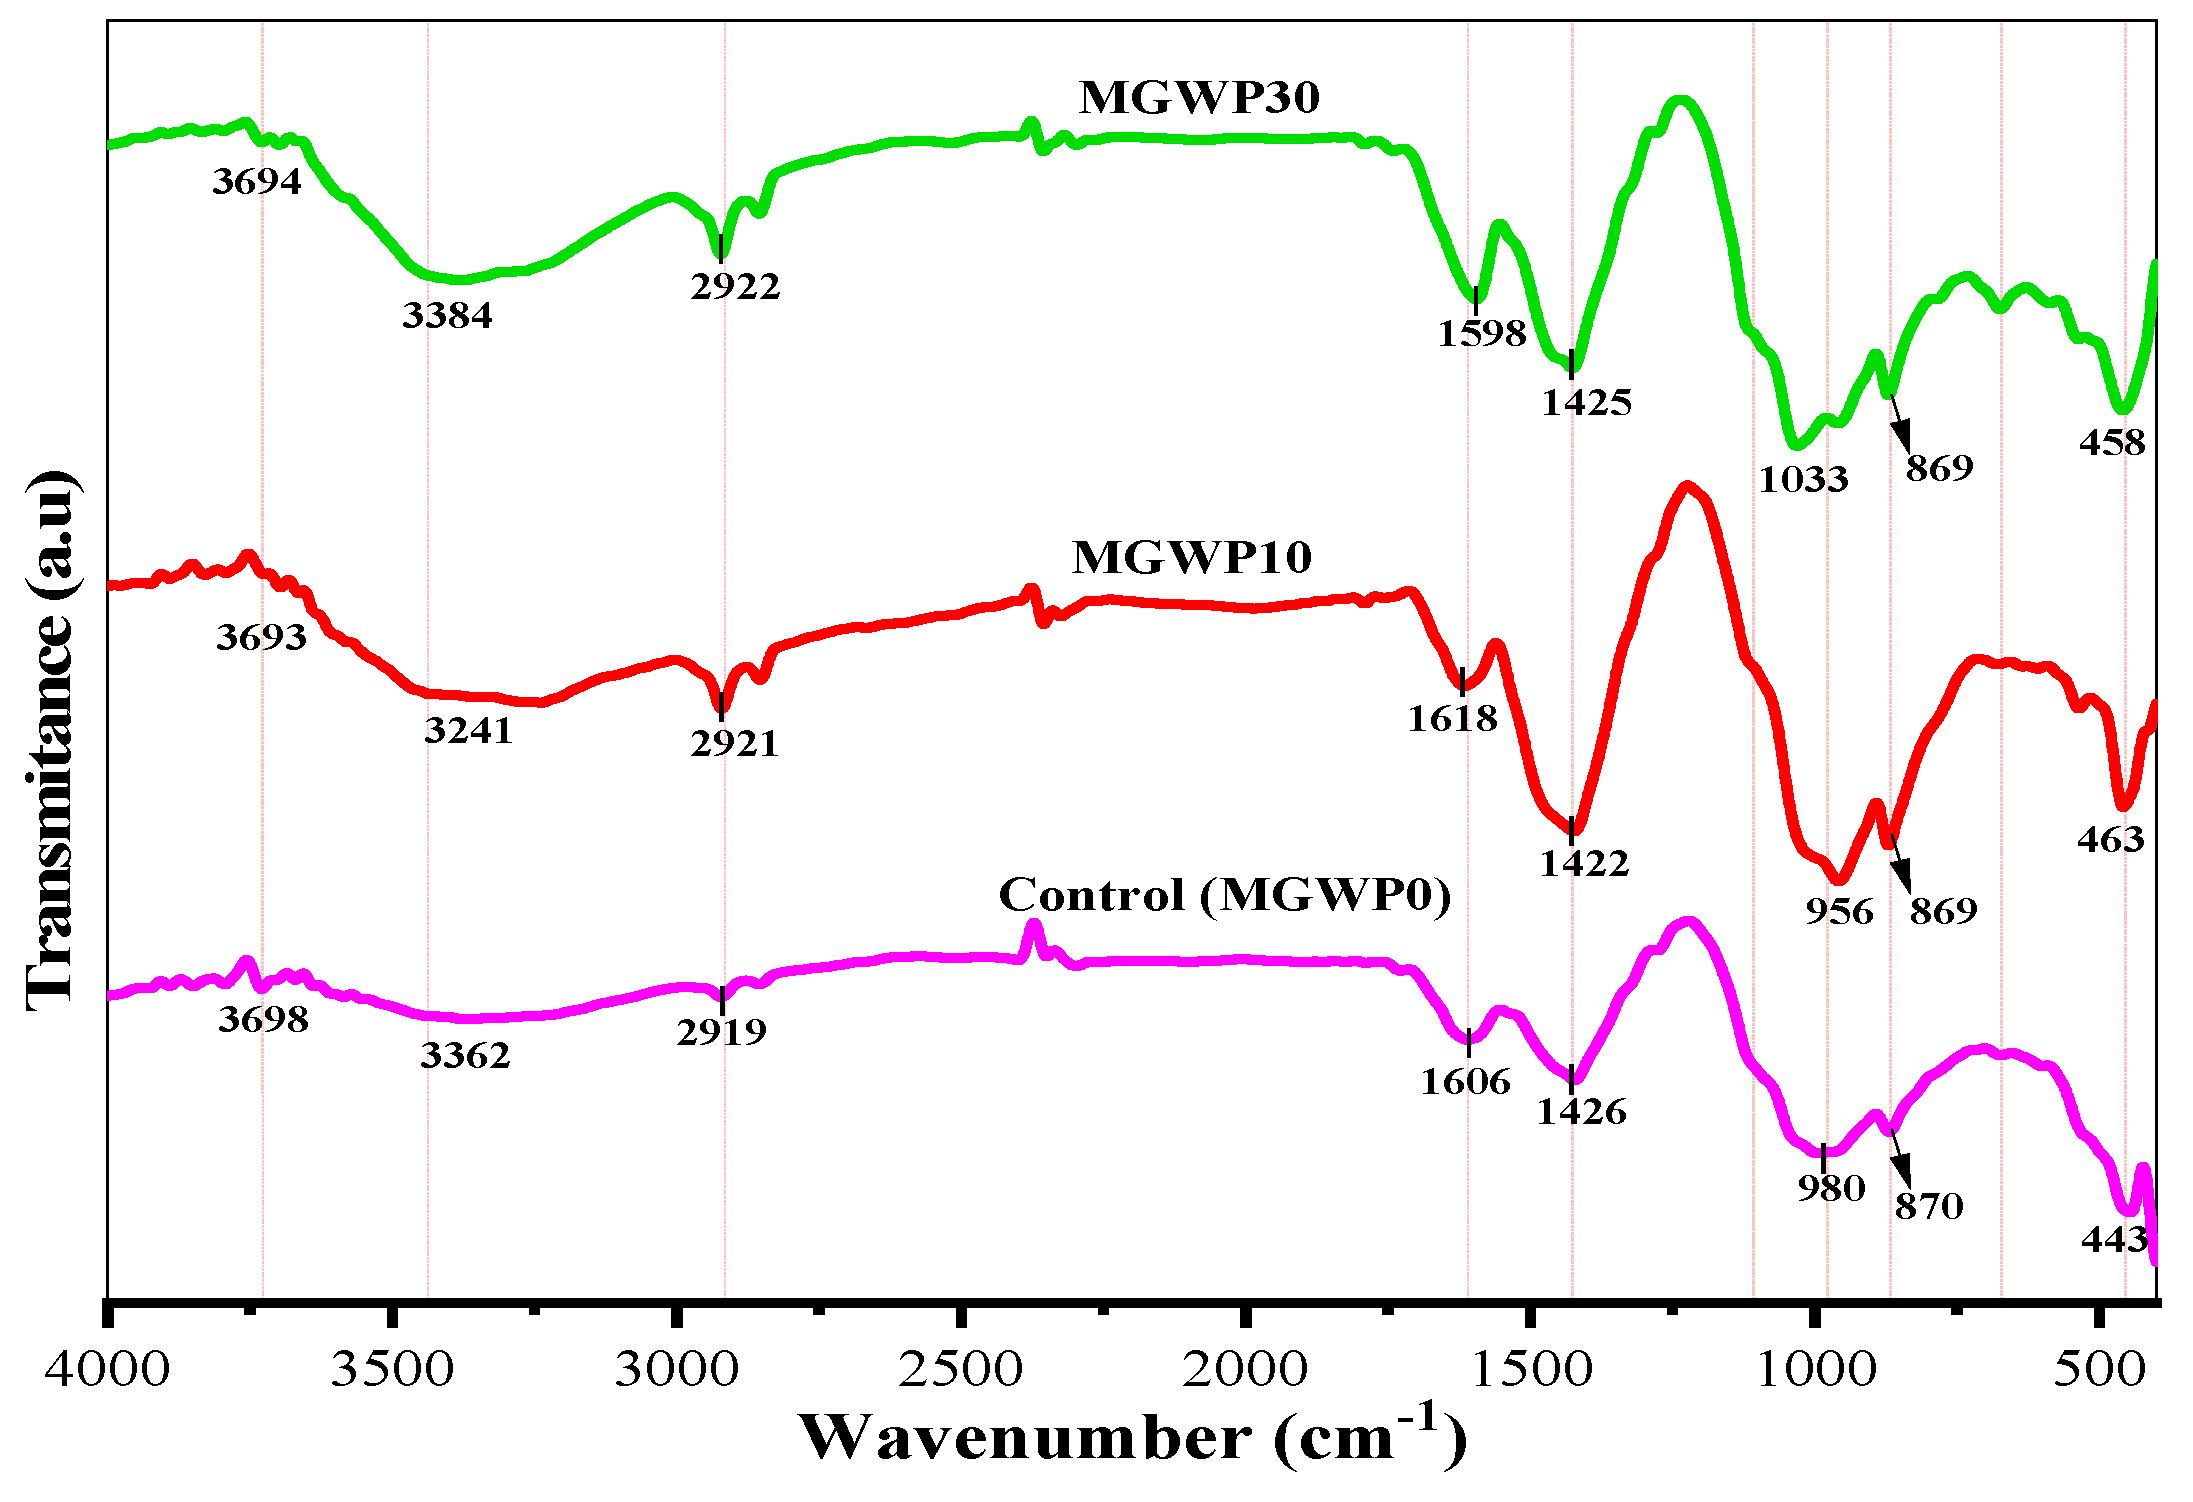
3.4.3. FT-IR
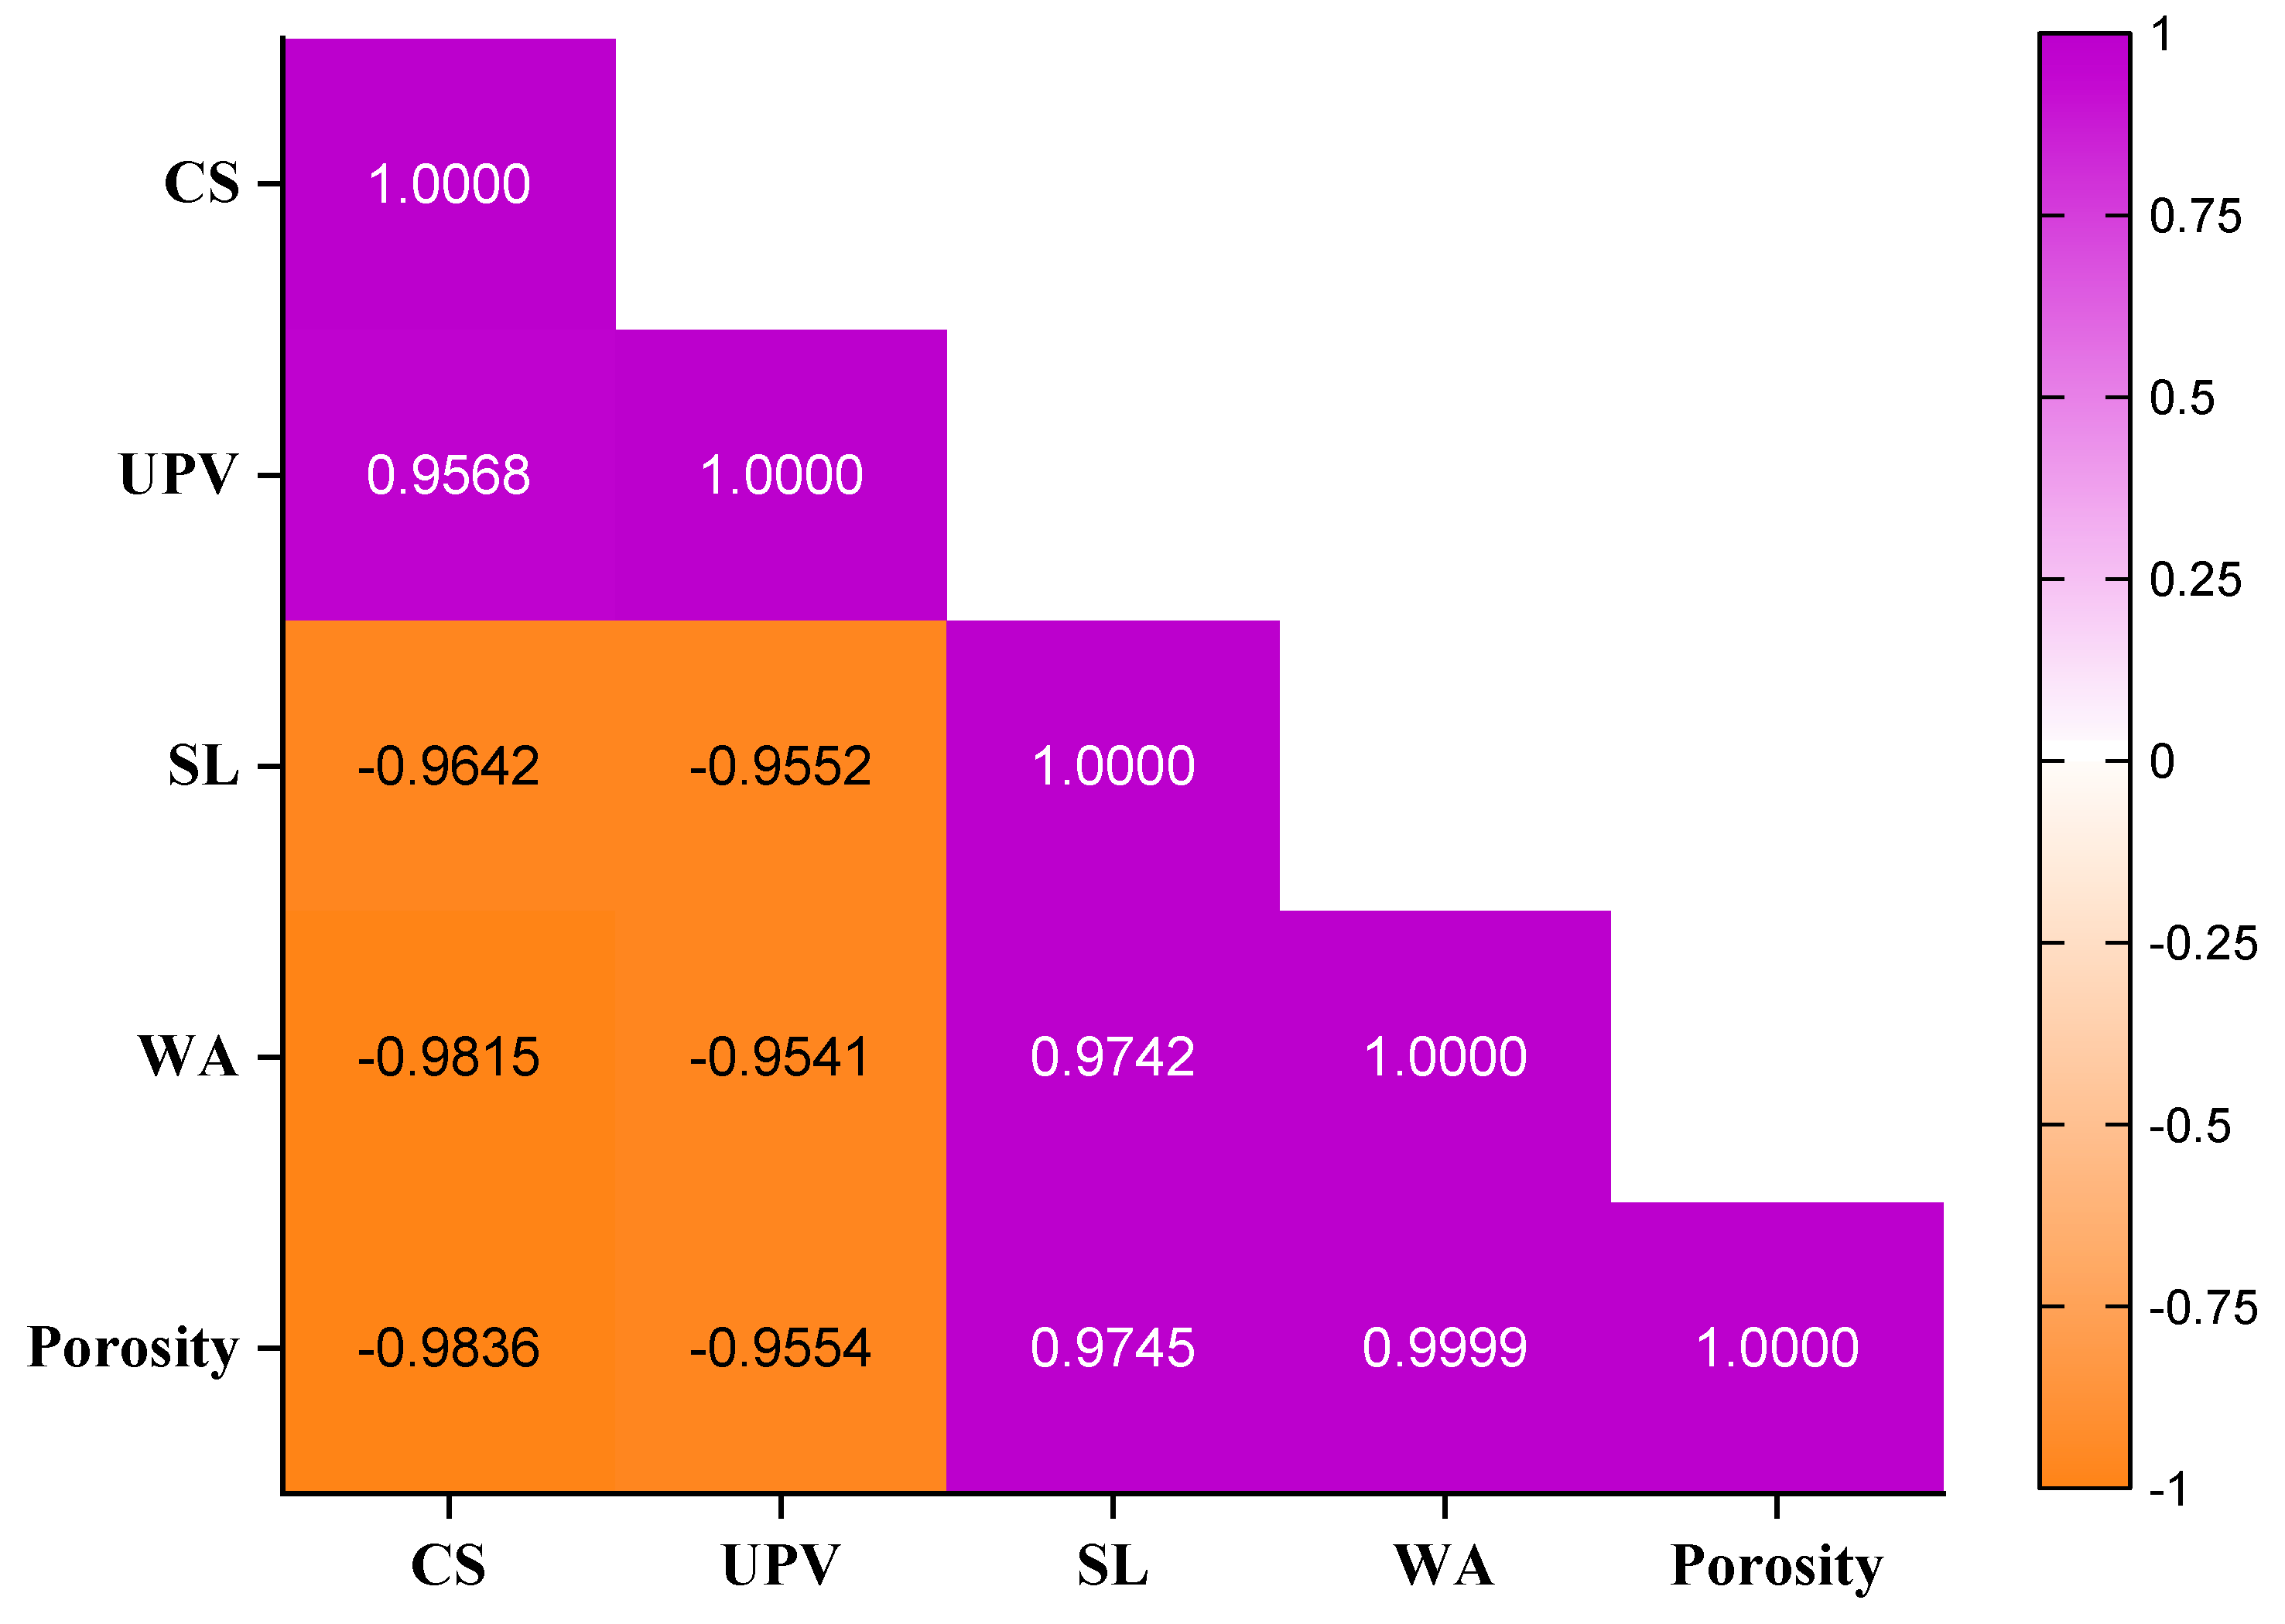
3.5. Correlations Between Properties of Mortar
4. Conclusions
- Glass waste powder is classified as a Class N pozzolanic material according to ASTM C618. Marble waste powder, on the other hand, does not meet the requirements specified in the ASTM standard.
- The workability of the mortar increased as the percentage of MGWP increased to replace cement because of the non-absorbent and smooth behavior of GWP.
- The compressive strength, density, and ultrasonic pulse velocity improve with up to 15% replacement of cement with marble and glass waste powder compared to control mixes over a period of 91 days. The maximum compressive strength is observed with a 10% replacement compared to control mixes.
- Related to durability, adding MGWP in mortar production reduces the loss of compressive strength by up to 15%, with the minimum loss observed at a 10% replacement. The porosity and water absorption of the mortar were improved with up to a 15% MGWP replacement.
- The SEM results demonstrated that mortar containing 10% MGWP is denser and has a more compact morphology as a result of additional C-S-H gel formation compared to the control mixes. Additionally, the TGA-DTA results showed that the total mass loss at 28 days is less than at 7 days, with the minimum mass loss determined at 10% MGWP.
- The more intense and broader bandwidth polymerization of C-S-H is observed at 28 days than 7 days compared to control mixes, as can be seen in FT-IR results.
- Using MGWP as a partial replacement for cement enhances the performance of mortar—improving its strength and durability—but also contributes to reducing cement costs and supports environmentally sustainable practices by lowering carbon emissions associated with cement production.
Author Contributions
Funding
Institutional Review Board Statement
Informed Consent Statement
Data Availability Statement
Acknowledgments
Conflicts of Interest
References
- Meyer, C. The greening of the concrete industry. Cem. Concr. Compos. 2009, 31, 601–605. [Google Scholar]
- Rao, V.V.; Parameshwaran, R.; Ram, V.V. PCM-mortar based construction materials for energy efficient buildings: A review on research trends. Energy Build. 2018, 158, 95–122. [Google Scholar]
- Getachew, E.M.; Yifru, B.W.; Taffese, W.Z.; Yehualaw, M.D. Enhancing Mortar Properties through Thermoactivated Recycled Concrete Cement. Buildings 2023, 13, 2209. [Google Scholar] [CrossRef]
- Huntzinger, D.N.; Eatmon, T.D. A life-cycle assessment of Portland cement manufacturing: Comparing the traditional process with alternative technologies. J. Clean. Prod. 2009, 17, 668–675. [Google Scholar]
- Yehualaw, M.D.; Alemu, M.; Hailemariam, B.Z.; Vo, D.-H.; Taffese, W.Z. Aquatic Weed for Concrete Sustainability. Sustainability 2022, 14, 15501. [Google Scholar] [CrossRef]
- Mohamad, N.; Muthusamy, K.; Embong, R.; Kusbiantoro, A.; Hashim, M.H. Environmental impact of cement production and Solutions: A review. Mater. Today Proc. 2022, 48, 741–746. [Google Scholar]
- Sakir, S.; Sudharshan, N.; Safiuddin, A.; Amrul, K.; Azrul, A. Utilization of by-products and wastes as supplementary cementitious materials in structural mortar for sustainable construction. Sustainability 2020, 12, 3888. [Google Scholar] [CrossRef]
- Stefanidou, M.; Kesikidou, F.; Konopisi, S.; Vasiadis, T. Investigating the suitability of waste glass as a supplementary binder and aggregate for cement and concrete. Sustainability 2023, 15, 3796. [Google Scholar] [CrossRef]
- Sufian, M.; Ullah, S.; Ostrowski, K.A.; Ahmad, A.; Zia, A.; Śliwa-Wieczorek, K.; Siddiq, M.; Awan, A.A. An experimental and empirical study on the use of waste marble powder in construction material. Materials 2021, 14, 3829. [Google Scholar] [CrossRef]
- Belouadah, M.; Rahmouni, Z.E.A.; Tebbal, N. Influence of the addition of glass powder and marble powder on the physical and mechanical behavior of composite cement. Procedia Comput. Sci. 2019, 158, 366–375. [Google Scholar] [CrossRef]
- Silva, D.; Lima, N. Incorporating marble sludge in laying mortars and their microstructural, thermal, mechanical, and chemical characteristics. Next Mater. 2025, 8, 100552. [Google Scholar]
- Ferdous, W.; Manalo, A.; Siddique, R.; Mendis, P.; Zhuge, Y.; Wong, H.S.; Lokuge, W.; Aravinthan, T.; Schubel, P. Recycling of landfill wastes (tyres, plastics and glass) in construction—A review on global waste generation, performance, application and future opportunities. Resour. Conserv. Recycl. 2021, 173, 105745. [Google Scholar]
- Olofinnade, O.M.; Ndambuki, J.M.; Ede, A.N.; Booth, C. Application of waste glass powder as a partial cement substitute towards more sustainable concrete production. Int. J. Eng. Res. Afr. 2017, 31, 77–93. [Google Scholar]
- Ali, S.; Ahmad, S.; Ullah, I. Utilization of waste marble dust as cement and sand replacement in concrete. Discov. Civ. Eng. 2024, 1, 15. [Google Scholar] [CrossRef]
- Anwar, A. The influence of waste glass powder as a pozzolanic material in concrete. Int. J. Civ. Eng. Technol. 2016, 7, 131–148. [Google Scholar]
- ASTM C150; Standard Specification for Portland Cement. American Society for Testing and Materials: West Conshohocken, PA, USA, 2007.
- ES 1177; Composition, Specifications and Conformity Criteria for Common Cements. Ethiopian Standard Agency: Addis Ababa, Ethiopia, 2005.
- ASTM C33; Standard Specification for Concrete Aggregates. American Society for Testing and Materials: West Conshohocken, PA, USA, 2018.
- ASTM C136; Standard Test Method for Sieve Analysis of Fine and Coarse Aggregates. American Society for Testing and Materials: West Conshohocken, PA, USA, 2014.
- ASTM C29; Standard Test Method for Bulk Density (“Unit Weight”) and Voids in Aggregate. American Society for Testing and Materials: West Conshohocken, PA, USA, 2019.
- ASTM C117; Standard Test Method for Materials Finer than 75-μm (No. 200) Sieve in Mineral Aggregates by Washing. American Society for Testing and Materials: West Conshohocken, PA, USA, 2016.
- ASTM C128; Standard Test Method for Density, Relative Density (Specific Gravity), and Absorption of Fine Aggregate. American Society for Testing and Materials: West Conshohocken, PA, USA, 2022. [CrossRef]
- ASTM C566; Standard Test Method for Total Evaporable Moisture Content of Aggregate by Drying. American Society for Testing and Materials: West Conshohocken, PA, USA, 2019.
- Ephrem, M. Experimental Investigation on the Binary and Ternary Effect of Ground Recycled Cement and Thermo-Activated Recycled Cement for Mortar Product. Masters’s Thesis, Bahir Dar University, Bahir Dar, Ethiopia, 2023. [Google Scholar]
- Ferraris, C.; Garboczi, E. Identifying improved standardized tests for measuring cement particle size and surface area. Transp. Res. Rec. 2013, 2342, 10–16. [Google Scholar]
- ASTM C618; Standard Specification for Coal Fly Ash and Raw or Calcined Natural Pozzolan for Use in oncrete. American Society for Testing and Materials: West Conshohocken, PA, USA, 2015.
- ASTM C109; Standard Test Method forCompressive Strength of Hydraulic Cement Mortars (Using 2-in. or [50-mm] Cube Specimens). American Society for Testing and Materials: West Conshohocken, PA, USA, 2021.
- ASTM C187; Standard Test Method for Amount of Water Required for Normal Consistency of Hydraulic Cement Paste. American Society for Testing and Materials: West Conshohocken, PA, USA, 2016.
- ASTM C191; Standard Test Methods for Time of Setting of Hydraulic Cement by Vicat Needle. American Society for Testing and Materials: West Conshohocken, PA, USA, 2013.
- ASTM C1437; Standard Test Method for Flow of Hydraulic Cement Mortar. American Society for Testing and Materials: West Conshohocken, PA, USA, 2001.
- ASTM C642; Standard Test Method for Density, Absorption, and Voids in Hardened Concrete. American Society for Testing and Materials: West Conshohocken, PA, USA, 2022.
- ASTM C1012; Standard Test Method for Length Change of Hydraulic-Cement Mortars Exposed to a Sulfate Solution. American Society for Testing and Materials: West Conshohocken, PA, USA, 2019.
- ASTM C597; Standard Test Method for Pulse Velocity Through Concrete. ASTM International: West Conshohocken, PA, USA, 2016.
- ASTM C1723; Standard Guide for Examination of Hardened Concrete Using Scanning Electron Microscopy. American Society for Testing and Materials: West Conshohocken, PA, USA, 2022.
- ASTM-E1131; Standard Test Method for Compositional Analysis by Thermogravimetry. American Society for Testing and Materials: West Conshohocken, PA, USA, 2015.
- ASTM-E1252; Standard Practice for General Techniques for Obtaining Infrared Spectra for Qualitative Analysis. American Society for Testing and Materials: West Conshohocken, PA, USA, 2021.
- Aruntaş, H.Y.; Gürü, M.; Dayı, M.; Tekin, I. Utilization of waste marble dust as an additive in cement production. Mater. Des. 2010, 31, 4039–4042. [Google Scholar]
- ul Islam, R.; Kaushal, M. Glass Waste Powder as Partial Replacement of Cement for Sustainable Concrete. Int. J. Innov. Res. Comput. Sci. Technol. 2022, 10, 292–298. [Google Scholar]
- Aydin, A.; Gül, R. Influence of volcanic originated natural materials as additives on the setting time and some mechanical properties of concrete. Constr. Build. Mater. 2007, 21, 1277–1281. [Google Scholar]
- Kalab, A.M. Investigate the Suitability of Scoria and Glass Waste as a Cement Replacement in Binary and Ternary Blended Cement Mortar. Masters’s Thesis, Bahir Dar University, Bahir Dar, Ethiopia, 2022. [Google Scholar]
- Vardhan, K.; Goyal, S.; Siddique, R.; Singh, M. Mechanical properties and microstructural analysis of cement mortar incorporating marble powder as partial replacement of cement. Constr. Build. Mater. 2015, 96, 615–621. [Google Scholar] [CrossRef]
- Buyuksagis, I.S.; Uygunoglu, T.; Tatar, E. Investigation on the usage of waste marble powder in cement-based adhesive mortar. Constr. Build. Mater. 2017, 154, 734–742. [Google Scholar]
- ASTM C270; Standard Specification for Mortar for Unit Masonry. American Society for Testing and Materials: West Conshohocken, PA, USA, 2010.
- Kumarappan, N. Partial replacement cement in concrete using waste glass. Int. J. Eng. Res. Technol. 2013, 2, 1880–1883. [Google Scholar]
- Yamanel, K.; Durak, U.; İlkentapar, S.; Atabey, İ.İ.; Karahan, O.; Duran, C. Influence of waste marble powder as a replacement of cement on the properties of mortar. Rev. De La Construcción J. Constr. 2019, 18, 290–300. [Google Scholar]
- Ahmad, J.; Martinez-Garcia, R.; Algarni, S.; de-Prado-Gil, J.; Alqahtani, T.; Irshad, K. Characteristics of sustainable concrete with partial substitutions of glass waste as a binder material. Int. J. Concr. Struct. Mater. 2022, 16, 21. [Google Scholar]
- Omran, A.; Soliman, N.; Zidol, A.; Tagnit-Hamou, A. Performance of ground-glass pozzolan as a cementitious material—A review. Adv. Civ. Eng. Mater. 2018, 7, 237–270. [Google Scholar]
- Endale, S.A.; Taffese, W.Z.; Vo, D.-H.; Yehualaw, M.D. Rice Husk Ash in Concrete. Sustainability 2023, 15, 137. [Google Scholar]
- Zhao, Y.; Gao, J.; Wu, S.; Li, Q. Strength development and microcosmic mechanism of waste glass powder cement mortar. J. Exp. Nanosci. 2022, 17, 564–584. [Google Scholar]
- Li, C. Study on compressive strength and sulfate corrosion resistance of limestone powder and waste glass powder mixed concrete. Mater. Res. Express 2024, 11, 025502. [Google Scholar] [CrossRef]
- Worku, M.A.; Taffese, W.Z.; Hailemariam, B.Z.; Yehualaw, M.D. Cow dung ash in mortar: An experimental study. Appl. Sci. 2023, 13, 6218. [Google Scholar] [CrossRef]
- Merida, A.; Kharchi, F. Pozzolan concrete durability on sulphate attack. Procedia Eng. 2015, 114, 832–837. [Google Scholar]
- Soroushian, P.; Sufyan-Ud-Din, M. Long-term field performance of concrete produced with powder waste glass as partial replacement of cement. Case Stud. Constr. Mater. 2021, 15, e00745. [Google Scholar]
- Vandhiyan, R.; Ramkumar, K.; Ramya, R. Experimental study on replacement of cement by glass powder. Int. J. Eng. Res. Technol 2013, 2, 234–238. [Google Scholar]
- Singh, M.; Srivastava, A.; Bhunia, D. An investigation on effect of partial replacement of cement by waste marble slurry. Constr. Build. Mater. 2017, 134, 471–488. [Google Scholar] [CrossRef]
- Aliabdo, A.A.; Abd Elmoaty, M.; Aboshama, A.Y. Utilization of waste glass powder in the production of cement and concrete. Constr. Build. Mater. 2016, 124, 866–877. [Google Scholar] [CrossRef]
- IS 13311; Method of Non-Destructive Testing of Concrete, Part 1: Ultrasonic Pulse Velocity. Bureau of Indian Standards: New Delhi, India, 1992.
- Alducin-Ochoa, J.M.; Martín-del-Río, J.J.; Torres-González, M.; Flores-Alés, V.; Hernández-Cruz, D. Performance of mortars based on recycled glass as aggregate by accelerated decay tests (ADT). Constr. Build. Mater. 2021, 300, 124057. [Google Scholar] [CrossRef]
- Wang, L.; Lu, X. A review of the influence of aluminum phases from cement, SCMs and external aluminum phases on the thaumasite sulfate attack in cement-based materials. J. Build. Eng. 2024, 94, 109966. [Google Scholar] [CrossRef]
- Ahmad, J.; Zhou, Z. Waste marble based self compacting concrete reinforced with steel fiber exposed to aggressive environment. J. Build. Eng. 2024, 81, 108142. [Google Scholar] [CrossRef]
- Marvila, M.T.; Alexandre, J.; de Azevedo, A.R.; Zanelato, E.B. Evaluation of the use of marble waste in hydrated lime cement mortar based. J. Mater. Cycles Waste Manag. 2019, 21, 1250–1261. [Google Scholar] [CrossRef]
- Jain, K.L.; Sancheti, G.; Gupta, L.K. Durability performance of waste granite and glass powder added concrete. Constr. Build. Mater. 2020, 252, 119075. [Google Scholar] [CrossRef]
- Chindaprasirt, P.; Rukzon, S. Strength, porosity and corrosion resistance of ternary blend Portland cement, rice husk ash and fly ash mortar. Constr. Build. Mater. 2008, 22, 1601–1606. [Google Scholar] [CrossRef]
- Bouleghebar, Y.; Bentchikou, M.; Boukendakdji, O.; El-Hadj, K.; Debieb, F.; Maisarah, A. The effect of brick and glass powder on the mechanical properties and porosity of self-compacting mortar. J. Appl. Eng. Sci. 2023, 13, 39–52. [Google Scholar] [CrossRef]
- Nega, D.M.; Yifru, B.W.; Taffese, W.Z.; Ayele, Y.K.; Yehualaw, M.D. Impact of Partial Replacement of Cement with a Blend of Marble and Granite Waste Powder on Mortar. Appl. Sci. 2023, 13, 8998. [Google Scholar] [CrossRef]
- Santos, T.A.; de Oliveira e Silva, G.A.; Ribeiro, D.V. Mineralogical analysis of portland cement pastes rehydrated. J. Solid Waste Technol. Manag. 2020, 46, 15–23. [Google Scholar] [CrossRef]
- Vogler, N.; Drabetzki, P.; Lindemann, M.; Kühne, H.-C. Description of the concrete carbonation process with adjusted depth-resolved thermogravimetric analysis. J. Therm. Anal. Calorim. 2021, 147, 6167–6180. [Google Scholar] [CrossRef]
- Prasad, D.D.; Ravande, K. Fourier transformed–infrared spectroscopy (FTIR) studies on the concrete/cement mortar mass made of cent percentage recycled coarse and fine aggregates. Int. J. Adv. Res. Eng. Technol 2021, 12, 387–400. [Google Scholar]
- Nandiyanto, A.B.D.; Oktiani, R.; Ragadhita, R. How to read and interpret FTIR spectroscope of organic material. Indones. J. Sci. Technol. 2019, 4, 97–118. [Google Scholar] [CrossRef]
- Tantawy, M. Effect of high temperatures on the microstructure of cement paste. J. Mater. Sci. Chem. Eng. 2017, 5, 33–48. [Google Scholar] [CrossRef]
- Hwang, C.-L.; Yehualaw, M.D.; Vo, D.-H.; Huynh, T.-P.; Largo, A. Performance evaluation of alkali activated mortar containing high volume of waste brick powder blended with ground granulated blast furnace slag cured at ambient temperature. Constr. Build. Mater. 2019, 223, 657–667. [Google Scholar] [CrossRef]
- Ylmen, R.; Jäglid, U. Carbonation of Portland cement studied by diffuse reflection Fourier transform infrared spectroscopy. Int. J. Concr. Struct. Mater. 2013, 7, 119–125. [Google Scholar] [CrossRef]
- Schober, P.; Boer, C.; Schwarte, L.A. Correlation coefficients: Appropriate use and interpretation. Anesth. Analg. 2018, 126, 1763–1768. [Google Scholar] [CrossRef]


| No. | Property | Test Method | Result |
|---|---|---|---|
| 1. | Unit weight (kg/m3) | ASTM C29 [20] | 1583.93 |
| 2. | Silt content (%) | ASTM C117 [21] | 2.71 |
| 3. | Fineness modules | ASTM C33 [18] | 2.5 |
| 4. | Specific gravity | ASTM C128 [22] | 2.6 |
| 5. | Absorption (%) | ASTM C128 [22] | 3.03 |
| 6. | Moisture content (%) | ASTM C566 [23] | 2.01 |
| Items | OPC | GWP | MWP | |
|---|---|---|---|---|
| Physical Properties | Surface Area (m2/g) | 339.56 | 485.15 | 439.47 |
| Specific Gravity (g/cm3) Color | 3.15 Dark grey | 2.37 White | 2.65 White | |
| Chemical Compositions | CaO (%) | 64.31 | 7.58 | 52.82 |
| SiO2 (%) | 21.57 | 71.24 | 4.48 | |
| Al2O3 (%) | 5.73 | 1.48 | 0.94 | |
| Fe2O3 (%) | 3.48 | 0.32 | 0.2 | |
| K2O (%) | 1.05 | 3.5 | <0.01 | |
| MgO (%) | - | <0.01 | <0.01 | |
| Na2O (%) | - | 15.12 | 0.34 | |
| Loss on Ignition (L.O.I, %) | 1.5 | 0.58 | 41.81 | |
| Mix Code | Ingredients Proportion | ||||||||
|---|---|---|---|---|---|---|---|---|---|
| w/b | OPC | MWP | GWP | Sand(g) | Water (mL) | ||||
| (%) | (g) | (%) | (g) | (%) | (g) | ||||
| MGWP0 | 0.53 | 100.0 | 500 | 0.0 | 0.0 | 0.0 | 0.0 | 1375 | 272.4 |
| MGWP5 | 0.53 | 95.0 | 475 | 1.67 | 8.33 | 3.33 | 16.67 | 1375 | 272.4 |
| MGWP10 | 0.53 | 90.0 | 450 | 3.33 | 16.67 | 6.67 | 33.33 | 1375 | 272.4 |
| MGWP15 | 0.53 | 85.0 | 425 | 5.0 | 25.0 | 10.0 | 50 | 1375 | 272.4 |
| MGWP20 | 0.53 | 80.0 | 400 | 6.67 | 33.33 | 13.33 | 66.67 | 1375 | 272.4 |
| MGWP25 | 0.53 | 75.0 | 375 | 8.33 | 41.67 | 16.67 | 83.33 | 1375 | 272.4 |
| MGWP30 | 0.53 | 70.0 | 350 | 16.67 | 50 | 33.33 | 100 | 1375 | 272.4 |
| Test Category | Property | Standard | Examined Sample | Curing Ages’ |
|---|---|---|---|---|
| Fresh | Workability | ASTM C1437 and ASTM C270 | All | - |
| Hardened | Compressive strength | ASTM C109 | All | 3, 7, 28, 56, and 91 days |
| Bulk density | ASTM C128 | |||
| UPV | ASTM C597-09 | |||
| Water absorption | ASTM C642-04 | |||
| Sulfate resistance | ASTM C1012 | |||
| Porosity | ASTM C642-06 | |||
| Microstructure | TGA/DTA | ASTM E1131 | MGWP0, MGWP10, and MGWP30 | 7 and 28 days |
| FT-IR | ASTM E1252-98 | |||
| SEM | ASTM C1723-16 | MGWP0, MGWP10, MGWP15, and MGWP30 | 28 days |
| Initial Mass Taken = 10 mg | Mass Loss | |||
|---|---|---|---|---|
| Mix Code | At 7 days | At 28 days | ||
| (mg) | (%) | (mg) | (%) | |
| MGWP0 | 1.185 | 11.85 | 1.151 | 11.51 |
| MGWP10 | 0.981 | 9.81 | 0.895 | 8.95 |
| MGWP30 | 1.766 | 17.66 | 0.945 | 9.45 |
| Assignment | Bond | Phase | Absorption Peak (cm−1) | ||
|---|---|---|---|---|---|
| MGWP0 | MGWP10 | MGWP30 | |||
| O-H stretching of Ca(OH)2 | O-H | Portlandite | 3698 | 3690 | 3694 |
| Stretching of water molecules (asymmetric and symmetric) | O-H | H2O capil | 3362 | 3241 | 3387 |
| C-H asymmetric stretching bond | C-H | CH2/CH3 | 2919 | 2921 | 2922 |
| H-O-H bending of absorbed water | O-H | H2O capil | 1606 | 1618 | 1598 |
| Asymmetric stretching of CO32− | C-O | Calcite | 1426 | 1422 | 1425 |
| S-O asymmetric stretching of sulfate SO42− inEttringite/Monosulfate | S-O | Ettringite | 1114 | 1114 | 1114 |
| Stretching of Si-O bond of C-S-H | Si-O | Afwillite | 980 | 985 | 1033 |
| Si-O-Si bending vibrations of C3S | Si-O | Alite | 870 | 865 | 869 |
| Si-O-Si bending vibrations of C2S | Si-O | Belite | 443 | 463 | 458 |
Disclaimer/Publisher’s Note: The statements, opinions and data contained in all publications are solely those of the individual author(s) and contributor(s) and not of MDPI and/or the editor(s). MDPI and/or the editor(s) disclaim responsibility for any injury to people or property resulting from any ideas, methods, instructions or products referred to in the content. |
© 2025 by the authors. Licensee MDPI, Basel, Switzerland. This article is an open access article distributed under the terms and conditions of the Creative Commons Attribution (CC BY) license (https://creativecommons.org/licenses/by/4.0/).
Share and Cite
Alemu, M.Y.; Yehualaw, M.D.; Nebiyu, W.M.; Nebebe, M.D.; Taffese, W.Z. Marble and Glass Waste Powder in Cement Mortar. Appl. Sci. 2025, 15, 3930. https://doi.org/10.3390/app15073930
Alemu MY, Yehualaw MD, Nebiyu WM, Nebebe MD, Taffese WZ. Marble and Glass Waste Powder in Cement Mortar. Applied Sciences. 2025; 15(7):3930. https://doi.org/10.3390/app15073930
Chicago/Turabian StyleAlemu, Mamaru Yenesew, Mitiku Damtie Yehualaw, Wallelign Mulugeta Nebiyu, Mulu Derbie Nebebe, and Woubishet Zewdu Taffese. 2025. "Marble and Glass Waste Powder in Cement Mortar" Applied Sciences 15, no. 7: 3930. https://doi.org/10.3390/app15073930
APA StyleAlemu, M. Y., Yehualaw, M. D., Nebiyu, W. M., Nebebe, M. D., & Taffese, W. Z. (2025). Marble and Glass Waste Powder in Cement Mortar. Applied Sciences, 15(7), 3930. https://doi.org/10.3390/app15073930