Review

FC-BENTEN: Synchrotron X-Ray Experimental Database for Polymer-Electrolyte Fuel-Cell Material Analysis

by
Takahiro Matsumoto
1,*,
Shigeru Yokota
1,
Takuma Kaneko
1,
Mayeesha Marium
1,2,
Jeheon Kim
1,3,
Yasuhiro Watanabe
1,
Hiroyuki Iwamoto
1,
Keiji Umetani
1,
Tomoya Uruga
1,
Albert Mufundirwa
1,
Yuki Mizuno
1,
Daiki Fujioka
1,4,
Tetsuya Miyazawa
1,5,
Hirokazu Tsuji
1,3,
Yoshiharu Uchimoto
2,
Masashi Matsumoto
6,
Hideto Imai
6 and
Yoshiharu Sakurai
1,*
1
Japan Synchrotron Radiation Research Institute, Sayo-gun 679-5198, Japan
2
Graduate School of Human and Environment Studies, Kyoto University, Kyoto 606-8501, Japan
3
Sumitomo Electric Industries, Ltd., Osaka 541-0041, Japan
4
Kumamoto Prefectural College of Technology, Kumamoto 869-1102, Japan
5
Kobe Steel, Ltd., Kobe 651-2271, Japan
6
Fuel Cell Cutting-Edge Research Center Technology Research Association, Kofu 400-1507, Japan
*
Authors to whom correspondence should be addressed.
Appl. Sci. 2025, 15(7), 3931; https://doi.org/10.3390/app15073931
Submission received: 21 February 2025 / Revised: 12 March 2025 / Accepted: 24 March 2025 / Published: 3 April 2025
(This article belongs to the Special Issue X-ray Scattering Characterization in Materials Science)

Abstract

:
This review is focused on FC-BENTEN, an advanced synchrotron X-ray experimental database developed at SPring-8 with support from Japan’s New Energy and Industrial Technology Development Organization (NEDO). Designed to advance polymer electrolyte fuel cells (PEFCs) research, FC-BENTEN addresses challenges in improving efficiency, durability, and cost-effectiveness through data-driven approaches informed by materials informatics (MI). Through standardization of protocols for sample preparation, data acquisition, analysis, and formatting, the database ensures high-quality, reproducible data essential for reliable scientific outcomes. FC-BENTEN streamlines metadata creation using automated processes and template-based tools, enhancing data management, accessibility, and interoperability. Security measures include two-factor authentication, safeguarding sensitive information and maintaining controlled user access. Planned integration with MI platforms will broaden data cross-referencing capabilities, facilitate PEFC applications expansion, and guide future research. This review discusses FC-BENTEN’s architectural framework, metadata standardization efforts, and role in advancing PEFC research through a high-throughput experimental workflow. It illustrates how data-driven methods and standardized practices contribute to innovation, underscoring databases’ potential to accelerate next-generation PEFC technologies development.

Graphical Abstract

1. Introduction

SPring-8, which is renowned for its high-brightness synchrotron X-ray radiation, has played a pivotal role in advancing materials science and energy research. The rich and complex datasets generated through its beamlines offer invaluable insights into the structural and functional properties of materials. To effectively harness these datasets for the development of polymer electrolyte fuel cells (PEFCs), Japan’s New Energy and Industrial Technology Development Organization (NEDO) established an FC-Platform [1,2]. This comprehensive initiative aligns with the FAIR principles (Findable, Accessible, Interoperable, Reusable) [3] and unites specialists in electrochemical evaluation, simulation, materials analysis, materials informatics (MI), and project management. Integrating expertise across multiple domains, the FC-Platform aims to accelerate PEFC material innovation, ultimately improving the efficiency, durability, and cost-effectiveness of sustainable energy applications (Figure 1).
Within the FC-Platform, SPring-8’s synchrotron X-ray capabilities are tailored to address critical challenges in PEFC material research. Advanced, standardized experimental techniques enable the in situ analysis of catalytic reactions, nanoscale investigations of water and proton transport, and detailed examination of electrode interfaces under operational conditions. The resulting high-quality and reproducible data facilitate a deeper understanding of the key phenomena influencing PEFC performance. To maximize the value of these experimental datasets, SPring-8 systematically shares them with the MI group, where they are integrated with electrochemical and simulation data. This collaborative data-driven approach provides robust insights and accelerates the design of the next-generation PEFC.
Recognizing the need for consistent data management and streamlined integration with broader data-driven frameworks, we developed FC-BENTEN, a dedicated synchrotron X-ray experimental database built on the existing experimental data transfer system, BENTEN [4,5]. The FC-BENTEN addresses several objectives that are critical for the advancement of PEFC research.
-
Standardized and Reproducible Experimental Protocols: FC-BENTEN ensures reliable and reproducible results at all stages of data acquisition, ranging from sample preparation to synchrotron measurements and post-experimental analysis.
-
Comprehensive Measurement Coverage: The database supports a wide array of techniques including X-ray absorption fine structure (XAFS), hard X-ray photoelectron spectroscopy (HAXPES), X-ray diffraction (XRD), pair-distribution function (PDF), and small-angle X-ray scattering (SAXS). These techniques yield complementary insights into the local structure, electronic states, crystallinity, and particle size distribution, thereby providing a holistic understanding of PEFC materials (Table 1).
-
Metadata Consistency and Interoperability: Rigorous metadata documentation is applied consistently, covering sample preparation, measurement conditions, data preprocessing, and analysis procedures. This approach not only enhances long-term data accessibility and integration with the MI platform but also streamlines cross-comparisons and future data-mining efforts.
-
Secure and Accessible Data Management: Robust security measures protect sensitive data while facilitating controlled access, promote effective collaboration between academic and industrial partners, and encourage widespread utilization of collected data.
This review provides a comprehensive overview of the design, implementation, and role of the FC-BENTEN in PEFC research. First, we detail the development of standardized experimental protocols that ensure the reproducibility of synchrotron X-ray measurements. Next, we introduce a metadata framework that underpins data interoperability and long-term usability, thereby extending the relevance of these datasets beyond their initial experimental contexts.
This review discusses the data management infrastructure and illustrates how it addresses the complexities inherent in handling large-scale synchrotron X-ray data. Practical examples show how FC-BENTEN’s streamlined data integration and standardized workflows significantly enhance the quality and interpretability of PEFC material analysis.
Finally, this review identifies ongoing challenges and proposes future directions. By continuously improving metadata standards, integrating with evolving analytical platforms, and adhering to the FAIR principles, FC-BENTEN sets the stage for a broader and more efficient utilization of PEFC data. This holistic approach paves the way for future innovations in PEFC technologies and contributes to the larger goals of sustainable energy and advanced material research.
Table 1. Synchrotron X-ray measurement techniques and their applications in catalyst analysis for PEFCs at SPring-8. This table overviews key measurement techniques, their corresponding beamlines, instruments, and specific information yielded. XAFS fluorescence detection, using a 25-element Ge detector, enables nondestructive analysis of local structure, valence states, and alloying degrees. HAXPES utilizes a high-resolution photoelectron analyzer to examine materials’ electronic states, offering insights into chemical shifts and the d-band center. The d-band center, calculated from the integration of the valence band density of states, serves as a critical descriptor of catalytic activity and often correlates with activity trends in volcano plots. XRD uses multi-axis diffractometers to investigate crystal structures and alloying behaviors. PDF applies multi-detector setups to characterize amorphous structures and particle sizes. SAXS features an extended vacuum pathway between sample and detector to minimize X-ray absorption and scattering by air, enabling precise analysis of nanoscale structural characteristics.
Measurement TechniqueBeamlinesInstrumentsInformation Obtained
XAFSBL14B2, BL36XUApplsci 15 03931 i001Local structure,
valence,
Degree of alloying
HAXPESBL46XU, BL09XUApplsci 15 03931 i002Electronic state,
d-band center
XRDBL19B2Applsci 15 03931 i003Crystal structure,
Degree of alloying
PDFBL04B2Applsci 15 03931 i004Amorphous structure,
Particle size
SAXSBL40B2Applsci 15 03931 i005Average particle size,
Distribution

2. Protocols for Synchrotron X-Ray Experiments

Achieving high-quality experimental data in FC-BENTEN hinges on the implementation of standardized protocols that ensure consistency, reproducibility, and traceability across all stages of the synchrotron X-ray experiments, from sample preparation to data analysis. To meet these objectives, beamlines tailored to specific measurement techniques, such as XAFS, HAXPES, XRD, PDF, and SAXS, were strategically selected. For example, although BL08W offers higher detector sensitivity for PDF measurements, its frequent reconfigurations can lead to calibration variability; thus, BL04B2 emerges as the preferred choice because of its stable setup.
To enhance reproducibility and minimize variability, critical protocol steps were meticulously documented as metadata. These metadata enable tracking and integration of experimental conditions and serve as the backbone for cross-disciplinary data utilization. Detailed online manuals in web-based format, developed using Markdown [6], provide standardized workflows that are accessible, user-friendly, and regularly updated. Robust authentication and authorization mechanisms ensure secure access, safeguard sensitive information, and promote responsible use.
This approach reduces inconsistencies from individual practices and supports reliable generation of high-quality data. The protocols cover key aspects, such as sample preparation, measurement techniques, and data processing workflows, with details on metadata design, data registration, and database integration provided in subsequent sections.

2.1. Sample Preparation

The catalyst samples are prepared in three distinct states, as-synthesized (AsMade), hydrogen-reduced (H), and electrochemically treated (EC), to support comprehensive synchrotron X-ray-based analyses employing techniques such as XRD, SAXS, XAFS, PDF, and HAXPES.

2.1.1. Hydrogen Reduction

Hydrogen reduction is performed by placing ~20 mg of the catalyst in a reaction vessel filled with high-purity hydrogen gas at room temperature for 30 min. This procedure facilitates the reduction in the surface and bulk states of the catalyst, enabling activation under controlled and reproducible conditions.

2.1.2. Electrochemical Treatment

Electrochemical treatment is conducted through cyclic voltammetry (CV) scans in a 0.1 M aqueous perchloric acid solution maintained at room temperature (Figure 2). The experimental setup comprised a reversible hydrogen electrode (RHE), a platinum counter electrode, and a gold plate working electrode coated with a catalyst ink containing 20 mg of the catalyst, Nafion solution, 2-propanol, and water. The CV scans are performed for 50 cycles across an operational potential range of 0.05–1.2 V at a scan rate of 50 mV/s as shown in Figure 3.
After treatment, the electrochemically treated samples are dried, collected, and subjected to hydrogen reduction to stabilize their chemical states for subsequent analysis using synchrotron X-rays.

2.1.3. Sample Mounting and Storage

The prepared catalyst samples are mounted according to the requirements of each synchrotron X-ray technique.
-
XRD and SAXS samples are packed into 0.3 mm diameter Lindemann capillaries.
-
XAFS and PDF samples are housed in 1 mm diameter quartz capillaries.
-
HAXPES samples are mounted on thin indium plates to ensure optimal conductivity and measurement stability.
To maintain their integrity, H and EC samples are handled and packed under an argon gas atmosphere in a glove box to prevent exposure to air and potential oxidation. The samples are stored in argon-filled containers until they are analyzed using synchrotron radiation analysis. In contrast, AsMade samples are prepared and handled under ambient conditions because their stability is unaffected by environmental factors during the preparation and storage phases.
This structured and meticulous approach to sample preparation ensures reproducibility and consistency of the experimental data.

2.2. XAFS

XAFS measurements facilitate the element-selective observation of valence states and local structures around specific atoms. Widely applied in materials science, XAFS provides critical insights into properties such as the valence state, coordination number, and bonding distances between neighboring atoms. This protocol establishes standardized procedures for XAFS measurements and analyses conducted at the BL14B2 [7] and BL36XU [8] beamlines at SPring-8. It encompasses guidelines for preparing measurement conditions, executing measurements, curating data, and performing analyses to ensure the reproducibility and high quality of data.

2.2.1. Preparation of Measurement Conditions

Effective XAFS measurements require precise adjustments of the optical system and meticulous sample preparation. The uniformity of the samples and optimal tuning of the optical system are critical for reliable data acquisition on both the BL14B2 and BL36XU beamlines.
During optical system adjustment, mirror alignment and energy calibration are performed in collaboration with the beamline staff. Mirrors are used to eliminate the higher-order harmonic light from the insertion device (ID) and focus the beam. For example, the mirror angles are set to 4.5 mrad during the experiments targeting the Pt L3-edge or Co K-edge at BL36XU. Energy calibration is performed using a standard sample such as a metal foil corresponding to the absorption edge of interest to correct for the monochromator angle.
The samples are uniformly packed into quartz glass capillaries with a diameter of 1 mm. This step is critical because the sample uniformity significantly affects the measurement reproducibility. Additionally, the optimal gas compositions for the ionization chambers are determined based on the absorption edge to enhance measurement accuracy. For instance, when measuring the Pt L3-edge at BL36XU using 31 cm ionization chambers, a gas mixture of N2:95% and Ar:5% for I0 and N2:50% and Ar:50% for I1 with an applied voltage of 1000 V is used.

2.2.2. Measurement Process

The measurement processes at BL14B2 and BL36XU are similar to the spectra recorded in transmission mode. Initially, the sample on the stage is aligned approximately using laser guidance, followed by fine adjustments using horizontal and vertical stage scans. The gain in the ionization chamber is optimized to achieve an appropriate count rate, after which the spectra are collected at room temperature. Typical measurement ranges extend from −300 eV to +1600 eV relative to the absorption edge, with data-acquisition intervals of 0.4 eV. The acquisition times range from 10 s to 10 min, depending on the sample.

2.2.3. Data Analysis

XAFS data analysis involves processing spectral and metadata, such as the coordination number, bond distance, Debye–Waller factor, and R factor, to derive detailed information about the local atomic structures and bonding characteristics. Data are processed using the Demeter package (v0.9.26) [9].
The recorded spectra are normalized, and the extended XAFS (EXAFS) oscillations are extracted using the Athena software within the Demeter package. The normalized spectra are calculated as follows:
μ n o r m = μ E μ p r e ( E ) Δ μ ( E 0 )
where μpre(E) represents a regression line fitted to data typically between −150 eV and −50 eV, and ∆μ(E0) denotes the edge jump. The EXAFS oscillation, represented by the following formula, was extracted using the AUTOBK algorithm [9]:
χ k = S 0 2 i N i F i ( k i ) k i R i 2 e x p 2 k i 2 σ i 2 e x p ( 2 R i λ i ) s i n 2 k i R i + ϕ i k i + ϕ c ( k i )
where k = 2 m 2 E E 0 , and the parameters S02, N, F, R2, λ, ϕ, and ϕc represent the intrinsic loss factor, coordination number, backscattering factor, bonding distance, Debye–Waller factor, mean free path, and phase shifts due to scattering and absorption, respectively. The radial structure function is derived from the Fourier transformation of the oscillation. An example of the resulting plot is shown in Figure 4.
The EXAFS data are further analyzed using Artemis, another tool in the Demeter package. Curve fitting is performed in R-space with weighting using the parameters calculated by FEFF6L [10]. FEFF calculations are based on CIF files from the Crystallography Open Database [11]. Typical fitting ranges are between 3 and 17 Å in k-space and 1–3 Å in R-space. An example of the fitting result is shown in Figure 5.
Data curation is conducted to organize the processed data and metadata, ensure consistency, and facilitate their reuse. This involves standardizing formats, associating relevant metadata, and systematically archiving datasets for future analysis and references.

2.2.4. Current Challenges and Future Directions

Currently, the preprocessing and analysis of XAFS data relies on manual verification and adjustments by researchers using specialized software. This process is time intensive and requires significant expertise, particularly for tasks such as energy calibration and background correction.
Automating data preprocessing and analysis workflows is vital for improving the efficiency and data quality assessment, as demonstrated in the RefXAS study [12]. Automated workflows can quickly identify cases where the measurement quality does not meet the required standards, ensuring that only high-quality datasets are selected for database registration. This enhances the overall efficiency and reliability of data curation, facilitating future analysis and reuse.

2.3. HAXPES

HAXPES has emerged as a powerful tool for studying PEFC catalysts [13]. This study provides detailed insight into the bulk and surface electronic structures of Pt, alloying metals, catalyst supports, and degradation products. Owing to its high detection sensitivity and probing depth of up to 30 nm, HAXPES can be used to analyze catalyst materials embedded deep within the pores of mesoporous carbon supports. Furthermore, it enables the detection of photoelectrons from deep core levels, facilitating the identification of the chemical states of trace elements that impact the catalytic activity. These attributes make HAXPES an essential technique for characterizing PEFC catalysts and elucidating the relationship between their structural and electrochemical properties.

2.3.1. Sample Preparation and Measurement Conditions

In this study, HAXPES is used to evaluate the fuel-cell materials at the BL46XU and BL09XU beamlines at SPring-8. The measurements are performed at an incident X-ray energy of 8 keV. A R-4000L1-10 kV hemispherical energy analyzer (Scienta Omicron AB, Uppsala, Sweden) is employed at BL46XU [14], whereas a SCIENTA OMICRON R4000 analyzer is used at BL09XU [15]. Sample preparation involves placing the powdered samples on indium and securing them to a sample holder. For H-treated and EC cycling-treated samples, this process is conducted in an Ar-filled glove box, followed by placement in an airtight transfer vessel.
The pass energy is set to 100 eV for BL09XU and 200 eV for BL46XU, with take-off angles ranging from 85° to 88° and a dwell time of 200 ms. The energy resolution, determined using a Au foil reference, typically ranges between 0.15 and 0.25 eV. Two attenuators composed of Si and Al are employed, with their thicknesses adjusted according to the measured energy levels. For typical Pt-C catalysts, a wide-range survey spectrum is recorded, followed by valence band and Pt 3d, Pt 4f, O 1s, and C 1s spectral measurements.

2.3.2. Data Analysis Procedure

HAXPES data analysis aims to extract critical parameters, such as binding energy peaks, full width at half maximum (FWHM), and d-band centers, which are pivotal for understanding the chemical and electronic properties of materials. The data analysis workflow is illustrated in Figure 6.
(a)
Energy Calibration
Accurate energy calibration is fundamental to reliable HAXPES analysis, as it ensures the precise detection of binding energy shifts indicative of chemical and electronic variations. The binding energies (EB) were calculated as follows:
EB = Ekϕ
where is the incident X-ray energy, Ek is the kinetic energy of emitted photoelectrons, and ϕ is the analyzer’s work function. Calibration typically employs reference materials such as Au to align the Fermi level, which is calculated as:
EB = EFermiEk
In the case of charge-up effects, the C 1s peak serves as an alternative reference. However, the local chemical shifts can introduce inaccuracies. To mitigate this, a refined calibration approach is developed using the rising Fermi edge from a reference sample tailored for fuel-cell materials. An example of the refined calibration using the rising Fermi edge is shown in Figure 7. This method minimizes the errors associated with charge-up effects and structural or chemical variations, thereby ensuring robust calibration.
Raw data from the HAXPES instruments at BL09XU and BL46XU, initially recorded in the kinetic energy format, are processed using a Python-based software system (Python 3.9) specifically developed for integration into the FC-BENTEN system. This approach streamlines energy calibration and converts data into binding energy profiles with minimal manual intervention, thereby enabling researchers to perform accurate and efficient analyses more easily. The protocol, validated at both beamlines, simplifies the data processing workflow and provides a robust framework for analyzing the chemical and electronic states of fuel-cell materials.
(b)
Background Correction and Normalization
The binding energy spectra are analyzed using Origin 2023 software [16]. Background correction is performed using the Shirley function for the survey spectra and the Pt 4f, Pt 3d, and C 1s spectra. For the O 1s, Co 1s, and spectra with weak intensity or long asymmetric tails, an asymmetric least-squares smoothing function is applied. Normalization is subsequently performed over the range of 0–1. For the valence band spectra, only normalization is applied without background correction. Examples of the calibrated and normalized spectra are shown in Figure 8.

2.3.3. Calculation of d-Band Center and Peak Properties

According to the d-band model proposed by Nørskov et al., the d-band center reflects the energy center of the valence d-band density of states at surface sites and correlates with catalytic activity [17,18]. The d-band center is calculated using the following equation by integrating the intensity over the range of 0–8 eV:
d b a n d   c e n t e r = 0   e V 8   e V   B i n d i n g   e n e r g y ( E ) × I n t e n s i t y ( E ) d E 0   e V 8   e V I n t e n s i t y E d E
The correlation between the Pt particle size, measured via SAXS at BL40B2 at SPring-8, and the d-band center values is explored. Additionally, the features of the shoulder peak near the Fermi edge are quantified and linked to variations in the catalyst structure and particle size.
Finally, the Doniach–Šunjić function is applied to Pt 4f, Pt 3d, and C 1s spectra to account for asymmetry in spectral line shapes during signal fitting. This approach enables precise determination of the binding energy peaks and FWHM, facilitating accurate spectral characterization. Insights into the electronic structures are further enhanced by calculating the d-band centers from the valence band spectra.
Although these analyses employ advanced techniques, their reliance on manual oversight for curve fitting remains a limitation. Streamlining these processes through automation would reduce the manual workload and enhance the efficiency and reproducibility of HAXPES studies, enabling broader applications in catalyst research.

2.4. XRD

Powder XRD is a pivotal technique for analyzing various material properties, including the crystal structure, lattice constants, atomic displacement, occupancy, crystallite size, lattice strain, and diffraction intensity profiles. This paper outlines the XRD measurements using the BL19B2 beamline of SPring-8 [19] and the data analysis protocols [20]. These protocols are designed for high-precision and reproducible analyses of diverse samples such as fuel-cell materials and catalysts.

2.4.1. Measurement Protocol

The XRD measurements are performed using an incident X-ray energy of 24 keV and covered a 2θ range from 2° to 81°. The samples are uniformly loaded into Lindemann glass capillaries with a diameter of 0.3 mm. Before each measurement, cerium oxide (CeO2) is used as the standard material for energy calibration to ensure the accuracy of the incident X-ray energy. The calibration process involves aligning the CeO2 diffraction peaks with known reference values, which is essential for maintaining measurement consistency across different samples.
In cases where significant background signals are observed, separate measurements are performed using empty Lindemann glass capillaries (Figure 9). These background measurements provide data on the scattering contributions from the capillaries. The background signal is subtracted from the sample diffraction data to minimize interference and improve the accuracy of the subsequent analyses. The measurement process is automated, and progress is monitored in real time using the dedicated measurement control system of the beamline.

2.4.2. Data Analysis Protocol

The acquired data are recorded as diffraction intensity profiles, 2θ-transformed data, and integrated datasets for analysis. Rietveld refinement is performed using Z-Rietveld (version 1.1.3), part of the Z-Code software package [21], to determine crystal structure parameters, including lattice constants, atomic displacement parameters, occupancy, and reliability factors (Rwp, S) [22,23].
Crystallite size is primarily evaluated using the Scherrer equation, which relates the FWHM (β) of specific diffraction peaks and the Bragg angle (θ) as follows:
D = K   λ β cos θ
Here, D is the crystallite size, K is the Scherrer constant (typically 0.9), λ is the X-ray wavelength, β is the FWHM in radians, and θ is the Bragg angle [24]. This method provides an initial estimate of the crystallite size under the assumption that strain effects are negligible.
To account for lattice strain (ϵ) and its influence on diffraction line broadening, the Williamson–Hall method is also employed [25], and the combined contributions of the crystallite size and strain are employed using the following relationship:
β cos θ = 4 ε sin θ + K λ D
Here, the slope of the linear plot of β cos θ versus sin θ yields the lattice strain (ϵ), while the intercept allows for refinement of the crystallite size (D) in Figure 10. By combining the Scherrer equation with Williamson–Hall analysis, both the crystallite size and strain contributions are quantitatively evaluated, providing comprehensive insights into the microstructural characteristics of the samples.

2.4.3. Data Curation

All measurement data and analytical results were organized into a unified format, incorporating metadata such as crystal structure parameters, reliability factors, measurement conditions, and sample information. These datasets are archived in a database to ensure transparency and reusability, facilitating broader applications in analytical and research activities.

2.4.4. Implications and Potential Developments

The presented protocols contribute to improving the efficiency and precision of microstructural analysis of fuel-cell materials and catalysts. By combining Rietveld refinement with the Scherrer equation and Williamson–Hall method, detailed evaluations of the crystallite size and lattice strain become feasible, advancing the understanding of catalyst properties and their optimization for enhanced performance. Currently, the Z-Rietveld analysis involves manual operations that require significant effort. Future developments will be focused on automating the analysis process to enhance its efficiency and reproducibility.

2.5. PDF

PDF analysis is an advanced X-ray scattering technique originally developed to analyze the local atomic structure of noncrystalline materials [26,27] and has recently been extended to applications involving nanocrystalline materials [28].
Unlike XRD, which focuses on periodic atomic arrangements, PDF analysis uses the inverse Fourier transform of scattering data to extract atomic pair distributions. This requires statistically reliable data over a wide Q range, typically spanning 15–30 Å−1. High-energy X-rays are essential for achieving wide Q ranges and ensuring sufficient resolution and precision. Consequently, the PDF measurements are conducted at the BL04B2 beamline at SPring-8, which is specifically designed for high-energy X-ray applications and enables precise and reliable data collection over an extensive Q range [29].

2.5.1. Sample Preparation and Measurement Conditions

The samples are prepared in an argon atmosphere to prevent oxidation and uniformly packed into 1 mm diameter quartz capillaries. A minimum sample length of 5 mm is maintained within each capillary, which is then sealed with wax. An empty capillary is also prepared for background correction.
Measurements are performed at the BL04B2 beamline under room temperature conditions using an incident energy of 61 keV, covering a Q range of 0.2–29.6 Å−1. By employing seven solid-state detectors, the range of the detected photon energies is limited to include elastic scattering and Compton scattering, enabling highly accurate measurements in the high Q range. The data accumulation time for each measurement typically ranges from 120 min to 240 min. These standardized conditions and optimized detection methods ensure high-precision and reproducible data collection.

2.5.2. PDF Analysis Procedure

The scattering data are corrected for background contributions using custom software developed and maintained by the BL04B2 staff specifically designed for PDF data processing. The corrected scattering intensity Icorrected(θ) is calculated using the equation:
I c o r r e c t e d θ = I o b s θ ε I B G δ P θ A ( θ )
Here, ϵ represents a scaling factor applied to account for differences between the scattering intensities of the sample and the background, while δ is an offset term used to correct systematic baseline variations. These corrections ensure that the scattering signal accurately reflects the structural features of the sample. Additional corrections for polarization P(θ) and absorption A(θ) are applied to further enhance data quality.
In this experiment, the polarization correction P(θ) is expressed by the following formula:
P θ = c o s 2 2 θ + p   s i n 2 ( 2 θ )
where p is a fitting parameter, typically ranging from 0.05 to 0.1. The absorption correction A(θ) was also applied to account for the attenuation of the X-ray beam in the sample and capillary. Together, these corrections enhance the accuracy of the scattering data and help ensure that the results are representative of the sample’s intrinsic properties.
The next step involves the calculation of the structure factor S(Q), which represents the normalized scattering intensity as a function of the scattering vector Q. The structure factor is computed using the equation (Faber–Ziman structure factor [30]):
S Q = I n o r m Q I i n c Q ( f Q 2 f Q 2 ) f ( Q ) 2
where I*inc(Q) denotes the incoherent scattering intensity, and f(Q) is the atomic scattering factor, describing the scattering amplitude of individual atoms as a function of Q. This structure factor forms the foundation for deriving real-space structural information. Figure 11 shows representative plots of Icorrected(θ) and S(Q).
The reduced PDF G(r), which captures local atomic correlations in real space, is obtained by applying Fourier transformation to S(Q):
G r = 2 π Q m i n Q m a x Q [ S Q 1 ] sin ( Q r ) d Q
The total radial distribution function T(r), representing the cumulative atomic density at a given distance r, is calculated from G(r) using the equation:
T r = G r + 4 π r ρ 0
Here, ρ0 denotes the average atomic number density of the sample, a parameter derived from the sample’s composition and bulk density. Representative plots of the reduced G(r) and the total radial distribution function T(r), obtained through the above equations, are shown in Figure 12. The areas of the first to fifth peaks in the T(r) distribution are valuable metadata for structural analysis. When the composition and density of the sample are well-characterized, such as in platinum-based materials, these peak areas can determine relative coordination numbers in absolute terms, normalized to known structural parameters. Even when the exact composition or density is unknown, comparative analysis of the first to fifth peaks provides insights into relative coordination numbers, used to infer structural trends or differences between samples without absolute calibration. These relative values enable a qualitative understanding of the sample’s local structure and can inform structural interpretations and comparative studies.
In addition to T(r), two supplementary functions, g(r) and RDF(r), provide complementary perspectives on the sample’s structure. The pair correlation function g(r) describes the probability of finding an atom at distance r from a reference atom compared to a random distribution. The radial distribution function RDF(r) quantifies the absolute number density of atoms at a given distance r, combining information from g(r) and ρ0 to characterize atomic arrangements.
Beyond structural analysis, the reduced PDF G(r) is applied to particle size evaluation. A correction factor f(r), specific to spherical nanoparticles, is introduced to account for finite-size effects and model the attenuation of atomic correlations near the particle boundary, as described in [31]. For a spherical nanoparticle with radius a, f(r) is defined as:
f r = 1 16 r a 3 3 4 r a + 1   ( r 2 a ) 0   ( r > 2 a )
Particle size can be determined by incorporating f(r) into the G(r) analysis. While this approach demonstrates the feasibility of extracting size-related trends from PDF data, its practical application is still in the exploratory phase. The results and limitations of this method are discussed.

2.5.3. Results and Discussion

The effectiveness of the proposed protocol is validated using a standard sample, TEC10V30E (Pt-loaded carbon, hydrogen-reduced, supplied by TANAKA Precious Metals). The structure factor S(Q), derived after corrections, exhibited well-resolved high-Q oscillations, ensuring reliability of the reduced PDF G(r). The total radial distribution function T(r), obtained through Fourier transformation of S(Q), revealed peaks corresponding to local structural features. Gaussian fitting of the first peak (representing Pt–Pt nearest-neighbor distance) yielded a coordination number of 11.1, agreeing with the theoretical value of 10.8 for 3 nm Pt nanoparticles. This demonstrates the robustness of PDF analysis in determining local atomic correlations and coordination environments.
In addition to structural characterization, the potential of PDF analysis for particle size evaluation was explored. By applying a spherical nanoparticle correction factor f(r), the attenuation of atomic correlations near the particle boundary was modeled. Initial findings suggest that PDF analysis could complement SAXS by providing localized structural information reflecting nanoparticle size trends. Future studies will aim to refine this methodology and establish its broader applicability to diverse materials systems.
While the current results demonstrate the protocol’s capability for structural characterization, challenges remain. The manual nature of data correction and fitting processes poses significant time and labor demands. The particle size estimation approach requires further refinement and validation across diverse samples and particle size distributions. Addressing these issues through automated workflows is critical for enhancing the methodology’s accessibility and efficiency.
In conclusion, the PDF analysis protocol has proven effective for high-precision structural analysis and holds promise for broader applications in materials research. Ongoing efforts to streamline data processing and expand particle size estimation techniques will further solidify their roles as robust tools in studying complex material systems.

2.6. SAXS

SAXS is a powerful technique for analyzing structural features at the nanometer scale, typically from a few nanometers to approximately 100 nm. In SAXS experiments, the scattering angle is usually less than 5°, and to achieve a high spatial resolution, the detector is positioned far downstream of the sample. A long vacuum path was introduced between the sample and detector to reduce X-ray absorption or scattering by air. In PEFC research, SAXS is frequently employed to investigate the domain structures and periodicities of electrolyte membranes as well as to determine the size distributions of catalyst nanoparticles. This section describes the protocol currently implemented at the BL40B2 beamline [32] at SPring-8 to analyze the size distributions of Pt catalyst particles. The protocol covers the selection of measurement conditions, sample preparation, data acquisition and correction, and data analysis, and provides guidance for interpreting results and validating particle size distributions using simulations.

2.6.1. Measurement Conditions and Instrumentation

At the BL40B2 beamline of SPring-8, the sample-to-detector distance (camera length) can be extended up to 6 m, and the X-ray energy can be selected within a range of 6.5–22 keV, with an X-ray flux of the order of 1011 photons/s. The choice of camera length and energy depends on the estimated particle size and the X-ray absorption characteristics of the sample. In general, larger particles benefit from longer camera lengths and lower energies, although lower energy increases absorption. For Pt catalysts, where the particle size is typically a few nanometers, a camera length of approximately 1.2 m and an X-ray energy of 11.504 keV are often sufficient to acquire suitable data for size distribution analysis. However, the same samples may also be measured at a camera length of 4.2 m and at 8 keV to cover a wider angle range, thus capturing additional structural information about the carbon support. By choosing the conditions that best suit the characteristics of the sample, it is possible to obtain scattering data with an appropriate Q range and quality for a reliable particle size distribution evaluation.

2.6.2. Sample Preparation and Setup

Prior to measurement, the sample undergoes any necessary pretreatment (as described in Section 2.1 of the original text) and is then packed into a glass capillary. For carbon-supported Pt or other metal catalysts, a 0.3 mm inner diameter capillary is typically sufficient. For pure carbon particles, which have a lower scattering intensity, a larger-diameter capillary may be required. The loaded capillaries are mounted onto a dedicated sample cassette developed through the NEDO project (Figure 13) capable of holding up to 19 capillaries. The cassette is then placed on a motorized XZ stage. By simply shifting the stage horizontally, multiple samples can be measured in sequence without the need to open or close the experimental hutch for each exposure. To avoid detector saturation, it is often advisable to accumulate data from multiple short exposures (e.g., 2 s × 10 exposures) and add them afterward.

2.6.3. Data Acquisition, Correction, and Analysis Flow

During the SAXS measurements, two ionization chambers are placed immediately upstream and downstream of the sample to record the X-ray flux and enable accurate absorption corrections. Before analyzing the scattering from the sample, the X-ray flux without any sample (air) is measured to calibrate the ionization chambers and account for their sensitivity variation. A two-dimensional Pilatus 2M detector (Dectris, Baden-Dättwil, Switzerland) is used to collect the scattering patterns, which are then integrated into one-dimensional scattering intensity profiles. After acquisition, background subtraction is performed using data from an empty capillary. The scattering intensity arising solely from the sample can only be accurately determined after applying an appropriate absorption correction. This correction accounts for the variation in the transmitted X-ray intensity owing to the presence of the sample and can be expressed as:
I(sample) = I(sample + capillary) − I(capillary) − (T(sample + capillary)/T(capillary))
where I is the intensity and T = I(anything)/I(air) is the transmittance. The sample-to-detector distance is then calibrated using a standard sample with a known d-spacing, such as silver behenate (d = 5.838 nm), to ensure accurate Q-scale determination. Once corrected and calibrated, the one-dimensional scattering profiles can be analyzed using various software tools designed for SAXS data interpretation. Commonly used programs include Irena [33], McSAS [34,35], SasFit [36], and SasView [37]. Fitting scattered data with a spherical form factor is generally sufficient for PEFC-related applications. In the NEDO project, McSAS is employed, allowing the determination of key parameters such as the mean particle radius and its distribution width.

2.6.4. Interpreting the Results and Validation

The corrected scattering profiles often display characteristic features that reflect the particle size distribution. For instance, Figure 14 illustrates a typical scattering intensity profile of carbon-supported Pt catalysts recorded at BL40B2, along with simulated profiles of spheres with similar diameters. In the observed curve, a shoulder-like feature around Q ≈ 1.0 nm−1 (the Guinier region) can be seen, representing the average diameter of the Pt particles. A uniform particle size distribution produces clear oscillations in the scattering curve; however, the observed curve in Figure 14 does not show such oscillations, indicating a broad particle size distribution.
Additionally, in the low-Q region, the observed curve shows an increase in intensity due to strong scattering from the Pt particles, which is significantly higher than that from the carbon support. In the example shown in Figure 14, Vulcan 72TM is used as the carbon support, and the scattering slope is smaller than −4 in the log–log plot. This slope suggests that the Pt particles formed a shell-like structure on the surface of the carbon spheres. When mesoporous carbon supports such as CNovelTM are used, the Pt particles are likely to form solid spheres embedded within the carbon, resulting in a slope closer to −4. Understanding these variations helps clarify the structural relationship between the Pt particles and their carbon supports.
To further validate the particle size distributions, advanced software tools such as McSAS (version 1.3.1) were used to analyze the scattering data. For example, Figure 15 shows the McSAS output for the scattered data shown in Figure 14. The left panel depicts the measured scattering profile (black) and the fitted curve (red), whereas the right panel shows a histogram of the particle size distribution. In this analysis, a Gaussian distribution fit reveals that the mean particle radius is 1.33 ± 0.38 nm, highlighting the utility of SAXS data for precise particle characterization.
Validation of the SAXS analysis is critical for ensuring reliability. One method is to compare the simulated scattering profiles of the model particles with the experimental results, as shown in Figure 14. Another approach involves cross-referencing SAXS-derived size distributions with transmission electron microscopy (TEM) images. Studies conducted during the NEDO project find good agreement between McSAS fittings and TEM observations [38], thereby confirming the robustness of the SAXS protocol for analyzing Pt catalyst nanoparticles.

3. Metadata Design

Metadata plays a pivotal role in ensuring that research data are not only stored but also remain meaningful, accessible, and reusable over time. In the FC-BENTEN framework, the systematic design of metadata, encompassing experimental conditions, sample information, measurement parameters, and subsequent data analyses, forms the backbone that enables cross-disciplinary comparison, integration with MI applications, and the long-term sustainability of research outputs.
This section details the fundamental principles, classification schemes, and processes used to create and validate the metadata within FC-BENTEN. By employing structured machine-readable formats and leveraging templates, automated extraction, and standardized workflows, the platform ensures that metadata do more than record information, empowering researchers to efficiently navigate, interpret, and build upon existing knowledge.

3.1. Fundamental Principles of Metadata Design

Three guiding principles shape the metadata framework in FC-BENTEN:
-
Consistency: Metadata are recorded systematically and uniformly across all stages of the experimental and analytical process. From initial sample preparation through data acquisition and analysis, carefully structured metadata ensure that the conditions and parameters influencing the results can be fully traced. This consistency underpins reproducibility, allowing independent researchers to verify the findings or reanalyze data under identical conditions.
-
Accessibility: Essential metadata ranging from beamline settings to sample compositions and analytical parameters must be easily searched and retrieved. FC-BENTEN facilitates easy accessibility to these details, enabling researchers to streamline data interpretation and quickly identify relevant datasets for comparison, integration, and subsequent MI-driven analyses.
-
Flexibility: The metadata design anticipates the evolving nature of research. As new techniques emerge or existing methods are refined, the metadata schema can adapt to ensure interoperability across different scientific domains. This flexibility fosters collaborative opportunities, encourages data reuse, and enhances the overall reliability and longevity of the research ecosystems.

3.2. Classification of Metadata Elements

To capture the complexity of modern synchrotron-based research, FC-BENTEN organizes metadata into distinct, intuitively defined categories. These categories ensured comprehensive coverage of the experimental workflow from raw data collection to final analysis.
-
data_info: General data descriptors, including unique identifiers, facility names, beamline details, and project information. This “data biography” traces how and when data were created, modified, or integrated into the system.
-
facility: Operational conditions at the synchrotron facility and beamline encompassing the accelerator parameters, beam energy, and current. Such details allow the precise contextualization of any given dataset and support cross-experimental comparisons.
-
sample: Information on each sample—unique ID, preparation method, chemical composition, or structural features. This category ensures that the fundamental characteristics of the studied materials are well documented.
-
measurement: Details of the measurements performed, including methodologies, instrumentation, and acquisition time. These records enabled a clear link between the collected data and the conditions under which they were obtained.
-
dataset: Parameters used for data calibration, preprocessing, and formatting. Storing these variables ensures the consistent application of analysis methods across multiple datasets, thus supporting a more reliable data interpretation.
-
analysis: Analytical procedures and associated parameters, as well as references to the software or algorithms employed. By standardizing the recording of the analysis steps, this category facilitates reproducible and transparent data processing pipelines.
-
entry: Attributes of individual data files (raw and processed) and their relationships with each other. Managing data in a structured list format enables researchers to track the progression from raw input to the final analyzed results, ensuring a clear lineage and reducing confusion when revisiting datasets after long periods.
This hierarchical organization of metadata, managed using machine-readable formats such as YAML [39] or JSON (JavaScript Object Notation) [40], addresses the limitations of earlier practices such as embedding experimental details in filenames or relying on file timestamps. Instead, it paves the way for seamless data integration with external platforms, reliable links between related experiments, and improved interpretability.
FC-BENTEN’s metadata schema builds upon the foundational framework of the SPring-8 XAFS standard sample database [41] but has been extensively tailored to meet the specific requirements of the platform. These adaptations enhance the practical utility of the metadata in synchrotron-based research, thereby providing a robust foundation for advanced data management and analysis. Examples of metadata elements relevant to the XAFS measurements categorized by context are presented in Appendix A (Table A1, Table A2, Table A3, Table A4, Table A5, Table A6 and Table A7). Each table focuses on a specific category, such as data_info (Table A1), sample (Table A2), and measurement (Table A3), with detailed attention paid to their respective metadata structures.

3.3. Metadata Generation Process and Validation

Creating high-quality metadata are streamlined through carefully designed workflows that minimize errors and ensure that critical information is captured from the outset.
-
Template-Based Generation: Predefined templates guide researchers to fill out the required fields for each measurement technique. These standardized forms reduce omissions, prevent inconsistencies, and simplify the metadata creation process.
-
Automated Metadata Extraction: Key metadata such as sample information and experimental proposal details are automatically retrieved from dedicated databases specifically built for these purposes. When metadata are embedded within the data files, the system extracts the relevant information directly from these embedded files. This approach significantly reduces the need for manual input, thereby lowering the risk of human error and ensuring that the recorded metadata remain accurate and up to date.
-
Standardized, Machine-Readable Formats: By segregating metadata from raw measurement data and maintaining them in a unified, structured format, FC-BENTEN preserves compatibility with existing analytical tools. Researchers can continue to use familiar data analysis workflows while benefiting from consistently formatted metadata that enhance searchability, interpretation, and interoperability.
The metadata generation workflow illustrated in Figure 16 begins with the researchers selecting the appropriate template. They then input the parameters for measurements, processing, and analysis. YAML was used as the input format owing to its hierarchical structure, which is readable and easy to edit. Additionally, YAML supports comments, allowing researchers to clearly document instructions for metadata input.
For experimental proposals and samples, the associated metadata were extracted using identifiers, such as proposals or sample IDs. These data points were integrated into a metadata workflow to form a unified, comprehensive record. Metadata for analysis-requested samples, summarized in Table 2, is initially submitted through Excel-based forms on the FC-Platform, serving as the foundation for constructing a dedicated database. For standard reference materials, relevant metadata, including supplier information and chemical composition, were systematically linked to the sample IDs.
Selected examples of the metadata and data utilized for key measurement techniques (e.g., XAFS, HAXPES, XRD, PDF, and SAXS) are listed in Table 3. These examples illustrate how metadata ensure consistency across varying experimental contexts and highlight their role in effective data utilization and integration.
Although the automation of metadata generation is ongoing, certain cases still require manual intervention. Future advancements in automation will aim to achieve a fully streamlined process. To ensure ongoing reliability, all the metadata were validated against a JSON schema [42] generated from an Excel-based definition file, as shown in Figure 17. Tools such as Visual Studio Code (latest version available during the study period) [43] provide real-time feedback during metadata entry, ensuring compliance with established standards.
By integrating robust metadata workflows, FC-BENTEN provides a precise and efficient framework for experimental data management, addressing the current challenges while adapting to the evolving demands of synchrotron-based research. Its metadata system ensures data accessibility, interpretability, and ability to repurpose, even as methodologies become more complex and cross-disciplinary collaborations expand.
Aligned with open science and FAIR principles, FC-BENTEN’s metadata framework continues to evolve, focusing on the precision, adaptability, and seamless integration of new measurement techniques. These advancements contribute to ensuring high-quality and versatile datasets that drive cutting-edge research and foster innovation in diverse scientific fields.

4. Data Management Infrastructure and Workflow

Robust and well-structured data management lies at the core of modern scientific endeavors, especially in multifaceted research fields such as PEFC material studies that leverage synchrotron-based X-ray characterization techniques. In this chapter, we present the overarching framework developed for the data management of this project, from designing domain-specific metadata schemas and curating experimental data to integrating databases and ensuring secure and user-friendly data access. We also highlight how these efforts align with and build upon existing national and international initiatives seeking to standardize metadata formats, ensure reproducibility, and foster interoperability among diverse research communities.

4.1. Metadata Catalogs and Database Overview

The development and maintenance of metadata catalogs and databases have proven instrumental in promoting the reproducibility, interoperability, and long-term accessibility of experimental data. In synchrotron X-ray research encompassing techniques such as XAFS, HAXPES, XRD, PDF, and SAXS, several platforms and frameworks have been established, each addressing particular requirements for data quality assurance, metadata structuring, and community-wide data sharing.
In Japan, the SPring-8 BL14B2 XAFS Standard Sample Database [41] serves as a model for consistent data management and well-structured metadata organization. This database exclusively handles data collected by the beamline staff using rigorously controlled experimental procedures and standard samples sourced directly from manufacturers. These practices ensure that the datasets are of high quality and are thus critical for ensuring the reproducibility and comparability of XAFS research. Similarly, the BL46XU HAXPES Standard Sample Database, hosted by SPring-8, is a dedicated repository for HAXPES standard sample datasets that adhere to similar high-quality standards. These databases are accessible through the BENTEN system, support reproducible research, and offer reliable data to the broader scientific community. The registration of these datasets with the NIMS Materials Data Repository (MDR) ensures proper citation via DOI assignments, further facilitating integration into wider material research efforts [44,45].
Expanding beyond individual facility-based databases, the MDR XAFS DB [44] plays a crucial role in unifying experimental data from multiple domestic synchrotron facilities, including SPring-8, KEK PF, and Ritsumeikan SR. This integrated platform aggregates a wide variety of experimental data across a broad network of institutions, thereby creating a comprehensive and interoperable resource for the synchrotron research community. By consolidating datasets from diverse facilities, the MDR XAFS DB enables comparative studies, fosters cross-institutional collaboration, and provides a foundation for advanced data-driven methodologies. The adoption of standardized metadata structures ensures that datasets remain discoverable and interoperable, thereby addressing key challenges in synchrotron-based research while enhancing the accessibility and utility of experimental data.
The potential of these data-driven methodologies is already evident in the innovative research enabled by the MDR XAFS DB. For instance, machine learning algorithms have been successfully applied to automate the analysis of XAFS spectra using datasets from databases [46]. These applications not only improve the efficiency and accuracy of synchrotron-based research but also exemplify how data-driven approaches can provide new insights and expand the frontiers of synchrotron science. These findings highlighted the essential role of well-structured and unified databases in fostering innovation and advancing cutting-edge research.
Globally, platforms such as the Diamond Light Source XAFS database [47] and RefXAS [12] exemplify the best practices in data sharing and integration. RefXAS prioritizes the data quality assessment and provides an intuitive web interface, rendering it a valuable resource for the XAFS research community. The International XAFS DB portal [48] extends these capabilities by integrating data from multiple facilities worldwide and by leveraging a comprehensive material dictionary to support interoperability and effective cross-referencing.
Efforts to address the challenges of metadata standardization are gaining momentum. The IXAS community [49] has been pivotal in advancing metadata standards for XAFS, including the development of the XAS Data Interchange (XDI) format [50] and the adoption of standards such as NeXus [51,52]. Although these standards are still evolving, their adoption has the potential to harmonize metadata across platforms, streamline data sharing, and enable advanced analytical methods, such as machine-learning-assisted spectroscopy.
National initiatives, such as Japan’s ARIM [53], provide frameworks for controlled data circulation, fostering secure sharing among collaborators while creating pathways for broader accessibility. Similarly, platforms such as the SPring-8 Data Center [54] emphasize secure internal workflows that can evolve toward external accessibility depending on policy needs, whereas SciCat [55], widely adopted across Europe, underscores the scalability and flexibility required for managing diverse experimental datasets. Collectively, these platforms demonstrate a balance between protecting sensitive research data and enabling broader scientific collaboration.
Although platforms such as ICAT [56] are used internationally to manage experimental data, their implementation in synchrotron X-ray research often requires significant customization to align with domain-specific workflows. In the examples discussed here, tailored solutions are selected to address the unique experimental and collaborative requirements of the synchrotron research community. This approach highlights the importance of flexibility in data management systems and the need to closely align solutions within specific research contexts.
In summary, these collaborative efforts, ranging from localized databases such as the SPring-8 BL14B2 XAFS Database to integrated platforms such as the MDR XAFS DB, demonstrate the pivotal roles of metadata and database infrastructure in advancing reproducibility, interoperability, and innovation. By integrating data from multiple facilities and fostering applications such as machine learning, these systems not only support immediate scientific needs, but also contribute to the long-term advancement of synchrotron-based research.

4.2. Data Management in This PEFC Project

In this project, we build on established practices and emerging standards to implement a data management framework tailored to the specific demands of PEFC-related synchrotron research. Although international efforts toward standardization are still in progress, our approach emphasizes the key principles of metadata consistency, reproducibility, and interoperability, adapted to the immediate needs and constraints of the research environment.
Key elements of our data management approach include:
-
Metadata Design and Consistency Enhancement: Building on the metadata design principles outlined earlier, we focus on ensuring the consistent application of schemas that capture essential contextual information for experimental techniques such as XAFS, HAXPES, and XRD. This includes the adoption of standardized descriptors (e.g., beamline identifiers, measurement conditions, and sample characteristics) to maintain discoverability, comparability, and interpretability. Annotation reviews, controlled vocabulary, and internal guidelines were implemented to enhance consistency. Recognizing that metadata quality is critical to research reproducibility and usability, we view it as an iterative process subject to continuous refinement.
-
Database Integration and Centralized Access: Curated datasets are registered in a centralized database to streamline data organization, discovery, and retrieval. Using a platform such as the BENTEN system, we established a coherent environment that supported metadata-driven searches. This design facilitates collaborative research and lays the groundwork for potential future linkages with external databases or national initiatives as the standards evolve.
-
MI Integration (Planned): We plan to integrate our curated datasets with material informatics workflows for PEFC research by leveraging platforms such as the NIMS MIX platform [57]. This platform integrates experimental, computational, and simulation data, providing a robust foundation for data interoperability and advanced analyses. Our metadata schemas and database structures were designed to support MI-ready data, enabling the seamless integration of experimental datasets (e.g., XAFS spectra and crystallographic information) with computational models. Currently, FC-BENTEN includes only experimental results obtained at SPring-8 by the authors’ group. However, future integration with the NIMS MIX platform may allow for the incorporation of additional datasets, including those from other research publications, to further enhance data comprehensiveness.
-
This unified approach aims to accelerate insights into structure-property relationships and support next-generation PEFC material development.
-
Collaboration and Potentially Broader Accessibility: Our data management infrastructure supports secure collaboration within the project team and among authorized external partners. Policies and workflows governing data access rights help protect sensitive or proprietary information, while enabling efficient knowledge exchange. Although fully open data sharing policies have not been established, our framework is sufficiently flexible to adapt to future developments. As metadata standards mature and community norms evolve, we may consider incremental steps toward broader accessibility, aligning our practices with international trends in research transparency and data stewardship.
By focusing on metadata integrity, centralized management, and flexible future integration with MI tools, these data management strategy positions our project to effectively meet current research needs while remaining open to future opportunities for interoperability, improved accessibility, and alignment with emerging global standards.

4.3. System Design, Data Access Workflow, and Security Features

Figure 18 shows a schematic overview of the workflow adopted in our BENTEN-based data management system. The measurement data produced at each synchrotron beamline were transferred to project-specific storage repositories, where researchers curated the datasets by assigning and validating metadata before registering them in the database using the BENTEN REST API.
The integrated workflow features:
-
End-to-End Data Pipeline: From initial data acquisition to metadata assignment and database registration, every step follows a well-defined sequence. This consistency ensures that the data remain traceable, their provenance is well documented, and subsequent analyses are reproducible.
-
User-Friendly Access and Search: A web-based interface mirrors the directory structures of the underlying beamline storage, thereby providing an intuitive navigation experience. The integration of Elasticsearch [58] enables efficient discovery through keyword and full-text searches. Additionally, preview functionalities such as thumbnails and spectral plots allow users to rapidly evaluate the relevance of datasets.
-
Flexible and Efficient Data Retrieval: For datasets within a few gigabytes, users can directly download the ZIP archives through a web interface for straightforward access. For datasets exceeding this size, the system supports downloads via the aria2 protocol [59]. In such cases, users must launch the download separately to handle the download process. This method retains the original tree-structured directory organization and ensures efficient and reliable transfers through parallel downloads and hash-based data integrity verification using Metalink [60]. These flexible options accommodate datasets of various sizes, thereby enhancing the usability and performance of synchrotron X-ray experimental data management.
-
Robust Security, Authentication and Authorization: The system employs OpenID Connect 1.0 [61] for secure user verification, ensuring that access tokens are issued through standardized procedures and are used to safeguard communication. These tokens facilitate secure authentication (verifying the identity of users) and authorization (granting users an appropriate level of access to their role) for operations such as data registration, search, and access via the BENTEN API. In addition, the platform incorporates a two-factor authentication (2FA), requiring an email-based verification during logging in to enhance security. These measures protect intellectual property, enable controlled data sharing, and ensure secure operation. Integration with the NIMS MIX platform facilitates secure interoperability between external collaborators and future data repositories.
By meticulously designing the data pipeline, focusing on metadata quality, and aligning efforts with ongoing international standardization initiatives, the PEFC project’s data management infrastructure positions itself on the frontiers of reproducibility, interoperability, and collaborative research. Looking ahead, we plan to deepen the integration with emerging metadata standards, broaden the range of MI tools employed, and continuously refine our security and access policies. Ultimately, this evolving framework will ensure that our data serve not only the immediate needs of the PEFC research community, but also the long-term advancement of materials science as a whole.
The FC-BENTEN platform has been developed based on user needs to facilitate efficient data registration, browsing, searching, and downloading. The web interface of FC-BENTEN, which supports these functionalities through a user-friendly layout and full-text search, is sown in Figure 19. While no specific UI/UX improvement requests have been received, we remain open to future enhancements and will consider improvements based on user feedback to further enhance accessibility and usability.

5. Database Content and Analysis Examples

The FC-BENTEN database serves as a comprehensive repository of experimental synchrotron X-ray data tailored for the advancement of PEFC research. By standardizing protocols across various measurement techniques, such as XAFS, HAXPES, XRD, PDF, and SAXS, the database ensures high-quality and reproducible data essential for driving material innovation. In addition to synchrotron-based techniques, electrochemical measurements such as CV are included, enabling the direct comparison and integration of data from different analytical perspectives.
Up to January 2025, the database contained extensive datasets encompassing 202 user-submitted samples and 57 standard reference samples. These datasets, summarized in Table 4, reflect a systematic approach to sample preparation and measurement, with each sample undergoing appropriate pretreatment conditions (e.g., AsMade, hydrogen reduction, or electrochemical treatment). This ensured that the collected data were consistent and aligned with the specific analytical goals.
For example, XAFS measurements systematically capture key absorption edges (e.g., Pt L3, Fe K, and Co K), whereas HAXPES provides comprehensive spectra of the core levels and valence bands across various energy ranges. This meticulous data-acquisition process often results in multiple datasets per sample, contributing to the breadth and depth of the database. Furthermore, additional datasets derived from the reference samples enhance the utility of the database as a benchmarking tool for validating analytical methodologies.
Although the database facilitates advanced data analysis, comparing datasets across different measurement techniques remains labor-intensive due to individualized data storage. To address this, a Data Retriever tool was developed, consolidating key analytical parameters into a unified tabular format for each sample and pretreatment condition. This tool, currently reliant on Excel, is designed for future compatibility with hierarchical data formats, such as HDF5 [62], streamlining comparative analyses and fostering insights into the interplay between structural and electronic properties of PEFC materials.

5.1. Data Analysis Example Using Standard Samples

A comprehensive suite of analytical techniques (XAFS, HAXPES, XRD, PDF, and SAXS) was applied to standard Pt and Pt–Co catalyst nanoparticles supported on various carbon materials (Table 5). By leveraging these complementary approaches, a multifaceted view of the structural evolution and electronic state modifications of the catalyst emerges. This section highlights the interplay between the particle size, crystallinity, alloy composition, electronic properties, and support interactions, ultimately guiding future catalyst design strategies.

5.1.1. Particle and Crystallite Size Evolution

The particle and crystallite size evolutions were evaluated using SAXS and XRD, as shown in Figure 20. These methods provide complementary insights into the structural changes in Pt- and Pt–Co-based catalysts under various treatment conditions.
-
Pt-Based Catalysts: For Pt-based samples (e.g., TEC10EA50E, TEC10V30E), SAXS revealed relatively small initial particle sizes (~2.7 ± 0.1 nm in AsMade samples). After hydrogen reduction (H) and EC cycling, particles grew significantly (reaching ~3.3 ± 0.9 nm by SAXS), and corresponding XRD analyses confirmed crystallite size increases. Notably, a correlation emerged between particle size and lattice strain; smaller initial particles tended to experience a reduction in lattice strain during post-treatment, as illustrated in Figure 21. This figure highlights how the lattice strain decreases more prominently for samples with smaller initial particle sizes, suggesting that structural relaxation accompanies particle growth and improved ordering.
-
Pt–Co Alloy Catalysts: Pt–Co alloy samples (e.g., TEC35V31E, TEC36E52) started with larger initial sizes (~6.8 ± 0.7 nm) and displayed relatively stable dimensions after treatments. Compared to Pt-only catalysts, the alloyed systems showed less pronounced growth under H or EC conditions and maintained more consistent lattice strain values, indicating that Co alloying contributes to structural stability and resistance to treatment-induced changes.
Together, these findings emphasize that both the initial particle size and composition dictate the evolution of the catalyst nanostructure. In tandem, SAXS and XRD paint a nuanced picture of the size, strain, and stability, setting the stage for an integrated interpretation of how structural modifications are linked to electronic and catalytic properties.
Figure 20. Correlation between particle sizes determined by SAXS and Scherer sizes determined by XRD, illustrating size differences in diameter. Distinct colors and markers represent samples listed in Table 5, with Pt-based samples in warm colors and Pt–Co alloys in cool colors. For AsMade samples, SAXS particle size distribution widths are indicated. Solid green and dashed gray arrows mark transitions to H and EC treatments, respectively. The diagonal dashed line represents ideal 1:1 correlation. SAXS and XRD sizes show strong correlation, with Pt–Co alloys and post-treatment samples exhibiting larger particle sizes.
Applsci 15 03931 g020
Figure 21. Correlation between particle sizes (diameters) determined by SAXS and lattice strain from the Williamson–Hall method in XRD. Samples are distinguished by colors and markers as in Figure 20: Pt-based samples in warm colors, Pt–Co alloys in cool colors. The solid green and dashed gray arrows indicate transitions to H and EC treatments, respectively. Smaller SAXS-determined particle sizes in Pt-based samples show a tendency for lattice strain to decrease, suggesting strain relaxation during these transitions.
Applsci 15 03931 g021

5.1.2. Integrated Insights and Guidance for Catalyst Design

The integrated application of SAXS, PDF, XRD, XAFS, and HAXPES enables a deeper understanding of the interplay between alloy composition, structural order, electronic properties, and performance. Future directions can be framed into two key categories: (1) Approaches for Fundamental Understanding and Principle-based Design and (2) Applied Strategies for Practical Catalyst Optimization and Deployment.
  • Approaches for Fundamental Understanding and Principle-based Design
    -
    Alloy Composition and Stability: By systematically varying the alloy composition (e.g., by tuning the Co content), researchers can understand how different elements contribute to catalyst stability and performance. Such knowledge helps mitigate unwanted particle growth and degradation under operating conditions, ultimately guiding rational alloy design.
    -
    Structural Order and Electronic Tuning: Observed correlations among particle size, crystallinity, and electronic structure offer a roadmap for fine-tuning catalysts at the atomic scale. Adjusting parameters, such as the reduction temperature or electrochemical conditioning, can deliberately tailor the lattice strain and d-band positions, providing a principle-driven approach to achieve the targeted structural and electronic characteristics.
2.
Applied Strategies for Practical Catalyst Optimization and Deployment
-
Processing Conditions and Enhanced Performance: Leveraging fundamental insights and refining thermal and electrochemical protocols can streamline the transition from raw materials to ready-to-use catalysts. Controlled temperature, atmosphere, and cycling conditions can balance the stability and activity, thereby extending the catalyst lifetime in PEFC applications.
-
Carbon Support Selection and Nanostructure Control: Future studies should exploit the tenability of diverse carbon supports to achieve precise nanostructure control. As shown in Table 5, the tested supports range from solid-sphere carbons (e.g., Vulcan XC72, Acetylene black) to hollow-sphere carbons (e.g., Ketjenblack, Graphitized Ketjenblack), each providing distinct characteristics such as surface area, pore structure, and crystallinity. Beyond solid versus hollow morphologies, supports also vary in crystallinity and functional group densities, which influence catalyst behavior at multiple levels. By systematically evaluating how catalyst nanoparticles interact with these diverse architectures, researchers can develop guidelines for selecting supports that promote uniform particle distribution, control growth mechanisms, and enhance electron transport pathways. Understanding how support morphology, crystallinity, and surface chemistry impact structural and electronic properties can lead to tailored carbon substrates, enhancing stability and activity in PEFC applications.
Aligning these topics with the fundamental principles and applied development strategies, future catalyst design efforts can transition from trial-and-error experimentation to a more predictive, data-driven, and highly targeted approach.

6. Future Directions

The FC-BENTEN database was designed as a comprehensive platform for synchrotron X-ray experiments, specifically tailored to the measurement requirements of PEFC materials. Standardizing protocols, from sample preparation to metadata annotation, facilitates long-term data preservation, improves data quality, and aligns with FAIR principles. This progress not only enhances internal data analysis within SPring-8 but also fosters interoperability with platforms such as MIX, thereby advancing the project’s initial goals.
However, the sustainable development and evolution of this initiative require addressing several key challenges and directions. These include the automation of experimental and data workflows (Section 6.1), integration of broader ID systems for metadata extraction (Section 6.2), standardization of metadata and data structures (Section 6.3), broader data sharing (Section 6.4), establishment of dedicated beamlines for PEFC research (Section 6.5), and expansion of research activities to quantum-beam facilities beyond SPring-8 (Section 6.6).

6.1. Automation of Sample Preparation, Measurement, Data Processing, and Analysis

Currently, sample preparation is handled by the Fuel Cell Cutting-Edge Research Center Technology Research Association (FC-Cubic) team, and data preprocessing occurs at SPring-8; however, these steps are still largely manual, limiting scalability and efficiency. Initial progress included employing robotic systems for sample preparation [63] and automated XRD measurements at BL19B2 [19]. The next critical step is to achieve fully integrated, high-throughput experimental capabilities that streamline the entire workflow (sample preparation, measurement, and real-time data processing) with minimal human intervention. Furthermore, the heavy reliance on manual transcription from laboratory logs (Figure 17) hinders consistency and speed. Embracing digital laboratory notebooks enables automated metadata collection, reduces human error, and enhances data quality.
The ultimate goal is to apply measurement informatics to extract scientifically meaningful parameters directly from raw data, thereby enabling rapid interpretation and analysis. For example, the slope in the low-Q region of an SAXS profile can quickly reveal information on the catalyst nanoparticle morphology and distribution. Similarly, the shape and position of the valence band (d-band) in the HAXPES spectra can be algorithmically analyzed to track the nanoparticle size evolution and electronic structure changes. By identifying and quantifying these characteristic descriptors, they can be readily incorporated into data-driven MI platforms. Through the integration of structural and electronic indicators with performance metrics via machine learning, this approach paves the way for a rational catalyst design, ultimately accelerating the discovery of advanced PEFC materials.

6.2. Metadata Extraction and Integration Via ID Management

As described in Appendix A, the PEFC research involves complex and diverse metadata. Although unique IDs are currently assigned to samples and experimental proposals, achieving scalable and automated metadata extraction requires the integration of persistent ID systems. In addition to internal databases, the use of instrument-specific persistent identifiers (PIDINST [64]) and researcher-associated identifiers (ORCID [65]) streamlines metadata retrieval and facilitates cross-platform interoperability.
From April 2022 to September 2023, Japan’s Research Data Utilization Forum (RDUF) [66] subcommittee on persistent identifier (PID) for research resources and instruments made significant efforts to address the challenges of assigning PIDs to physical research assets, including samples and experimental equipment. This initiative is part of Japan’s broader goal of enhancing digital research transformation (DX) and open science practices. The activities of the subcommittee culminated in a comprehensive proposal published in Japanese that outlined strategies and solutions for effective metadata management and resource visibility improvement [67].
In collaboration with international initiatives, such as the Research Data Alliance (RDA) [68], the subcommittee supported the dissemination of the global framework and guidelines by creating a Japanese translation of the RDA whitepaper on Persistent Identification of Instruments [69]. This effort reflects Japan’s commitment to enhance interoperability and promote the visibility of international frameworks within the domestic research community.
For instance, the MatVoc materials dictionary [70] used in the MDR XAFS DB exemplifies progress toward standardized metadata; however, these identifiers are not persistent. Transitioning to PID-based systems, as proposed by the subcommittee, ensures long-term stability, broader compatibility, and improves cross-disciplinary searches. These enhancements will strengthen data sharing within the synchrotron community and enable seamless collaboration across diverse research fields.

6.3. Standardization of Metadata and Data Structures

Efforts by organizations, such as IXAS and the Japan Society for Synchrotron Radiation Research, are driving the standardization of metadata and data structures. Aligning with international standards (e.g., the NeXus format) and cooperating with these initiatives will enhance data interoperability and reusability, thereby increasing the efficiency and impact of PEFC research. Harmonized data frameworks ensure that the FC-BENTEN database can support an evolving global ecosystem of synchrotron-based studies.

6.4. Data Sharing for PEFC Synchrotron X-Ray Experiments

Currently, data sharing Via the FC-BENTEN database is restricted to members of the FC-Platform. To maximize utility, future efforts must consider wider data accessibility and appropriate licensing policies. Assigning DOIs to reference samples for open access, aligning with policy developments such as the 2024 “Basic Policy for Immediate Open Access to Academic Papers” [71], and adhering to FAIR principles will enhance collaboration, reproducibility, and societal benefits. Balancing commercial interests in PEFC development with open science principles is essential, and ongoing stakeholder engagement is needed to navigate legal, ethical, and technical challenges responsibly.
While FC-BENTEN is currently a closed platform due to data ownership constraints, future expansions may involve data sharing upon obtaining necessary approvals. This could open opportunities for integration with global MI platforms, further enhancing accessibility and collaboration.

6.5. Dedicated Beamlines for PEFC Materials Development

At present, PEFC studies rely on multiple beamlines at SPring-8, each optimized for specific techniques, such as XAFS, HAXPES, XRD, PDF, and SAXS. Although this approach has yielded valuable insights, scheduling constraints and competition for beam time have limited the pace of the research. Establishing a dedicated beamline tailored specifically to PEFC materials would integrate multiple measurement techniques, streamline scheduling, and facilitate continuous, targeted experimentation. Such infrastructure would significantly accelerate PEFC research and bolster the field’s ability to adapt rapidly to emerging scientific priorities.

6.6. Expansion to Other Quantum Beam Facilities

While SPring-8 excels in hard X-ray-based structural analyses, broadening its scope to include other facilities will provide a more comprehensive understanding of PEFC materials. Integrating complementary soft X-ray measurements from the NanoTerasu facility in Sendai, which began user operations in 2024, and neutron-based experiments from J-PARC can reveal interfacial and functional properties, as well as hydrogen-related dynamics.
The FC-Platform has already made significant progress in utilizing neutron-based techniques at J-PARC. These include neutron imaging, which enables real-scale evaluations of operational devices, and scattering experiments, which provide insights into the molecular dynamics and structural characteristics, particularly targeting hydrogen atoms and water molecules. Building on these advancements, integrating data from the J-PARC with synchrotron radiation studies can further enhance the scope of PEFC research.
By unifying data from multiple quantum-beam sources (hard/soft X-rays and neutrons) using the FC-Platform, researchers can gain holistic insights into PEFC materials. Such interdisciplinary data integration will drive innovative materials and device development, ultimately advancing state-of-the-art sustainable energy technologies.

7. Conclusions

This review highlights FC-BENTEN’s pivotal role, a synchrotron X-ray experimental database at SPring-8, for advancing PEFC research. By establishing standardized protocols for sample preparation, measurement, data preprocessing, and analysis, FC-BENTEN ensured high-quality and reproducible experimental data. Its emphasis on machine-readable metadata fosters transparent documentation, facilitates long-term data management, and enables efficient comparison across diverse measurement techniques. These attributes, coupled with integration into evolving platforms such as the MIX Platform, underline the database’s potential to accelerate data-driven innovation and broaden MI applications within the PEFC community.
As metadata standardization efforts progress, FC-BENTEN remains adaptable, aligning with emerging guidelines and FAIR principles. This adaptability promotes interoperability and enhances collaborative research, contributing to academic excellence and industrial advancements in PEFC technologies. Sustained integration with evolving metadata standards, greater interoperability with MI tools, and continued refinement of data management protocols will further amplify the database’s impact. Through these improvements, FC-BENTEN will remain indispensable for advancing PEFC research and support broader objectives in sustainable energy and cutting-edge material science.

Author Contributions

Supervision, metadata design, database, web portal and data retriever, T.M. (Takahiro Matsumoto); data curation, T.M. (Takahiro Matsumoto) and M.M. (Masashi Matsumoto); data infrastructure and sample preparation protocol, S.Y.; XAFS protocol, T.K.; HAXPES protocol, M.M. (Mayeesha Marium), D.F. and T.M. (Tetsuya Miyazawa); XRD protocol, J.K. and H.T.; PDF protocol, Y.M. and Y.W.; SAXS protocol, H.I. (Hiroyuki Iwamoto) and A.M.; guidance on data analysis, T.U.; project administration and funding acquisition, H.I. (Hideto Imai), Y.S. and Y.U.; leading writing and editing of the draft, T.M. (Takahiro Matsumoto); writing draft for sample preparation protocol, S.Y.; writing draft for XAFS protocol, T.K.; writing draft for HAXPES protocol, M.M. (Mayeesha Marium); writing draft for XRD protocol, J.K.; writing draft for PDF protocol, Y.W.; writing draft for SAXS protocol, H.I. (Hiroyuki Iwamoto); writing draft for data analysis example, K.U.; review, T.M. (Takahiro Matsumoto), S.Y., T.K., M.M. (Mayeesha Marium), J.K., Y.W., H.I. (Hiroyuki Iwamoto), T.U., K.U. and Y.S. All authors have read and agreed to the published version of the manuscript.

Funding

This research was supported by the NEDO project (Project code: P20003), “Collaborative Industry-Academia-Government research and development Project for Solving Common Challenges Toward Dramatically Expanded Use of Fuel Cells and Related Equipment”.

Data Availability Statement

The data supporting the results presented in this study is made publicly available on Zenodo upon publication (https://doi.org/10.5281/zenodo.15107540).

Acknowledgments

The experiments were performed with the approval of Japan Synchrotron Radiation Research Institute (JASRI) under the following proposal numbers: 2023A1009, 2023B1014, 2022B1967, 2023A1040, 2023A1651, 2023A1819, 2023B1939, 2021B1849, 2021B1913, 2022B1049, 2022B1968, 2023A1041, 2023A1652, 2023A1820, 2023A1019, 2021B1046 and 2022B1051. The XAFS measurements were performed at BL36XU in SPring-8 through a research proposal application approved by RIKEN, which manages the beamline. We express our sincere gratitude to the staff of the associated SPring-8 beamlines (BL04B2, BL09XU, BL14B2, BL19B2, BL36XU, BL40B2 and BL46XU) for their invaluable support in conducting the experiments and for providing guidance on data preprocessing and analysis procedures during the development of the synchrotron X-ray experimental database for PEFCs. We also extend our heartfelt thanks to the FC-Cubic staff for their assistance in coordinating sample exchanges, facilitating measurement requests via the FC-Platform, and providing various other forms of support. The assignment of IDs to the samples in this PEFC synchrotron X-ray experimental database benefited greatly from discussions and information shared by the RDUF subcommittee on PID for research resources and instruments. We are particularly grateful to Takaaki Aoki, the Chair of the subcommittee, for his guidance and support during this process. Finally, we extend our appreciation to Naoko Takami and Ayako Hirata for their vital support in managing the experimental proposal and sample databases for the PEFC synchrotron X-ray experiments. Ayako Hirata’s contributions during her tenure at JASRI were invaluable, and we are grateful for her efforts.

Conflicts of Interest

The authors Jeheon Kim, Hirokazu Tsuji, and Tetsuya Miyazawa were formerly affiliated with JASRI at the time of their contributions to this research. Although they are currently employed by Sumitomo Electric Industries, Ltd. (Kim and Tsuji) and Kobe Steel, Ltd. (Miyazawa), they made no contributions to this work after joining their respective companies. Therefore, there are no conflicts of interest to declare. The remaining authors declare that the research was conducted in the absence of any commercial or financial relationships that could be construed as a potential conflict of interest.

Abbreviations

The following abbreviations are used in this manuscript:
2FATwo-factor authentication
AsMadeAs-synthesized
CVCyclic voltammetry
DXDigital research transformation
ECElectrochemically treated
EXAFSExtended XAFS
FAIRFindable, Accessible, Interoperable, Reusable
FC-CubicFuel Cell Cutting-Edge Research Center Technology Research Association
FWHMFull width at half maximum
HHydrogen-reduced
HAXPESHard X-ray photoelectron spectroscopy
IDInsertion device, Identifier
JASRIJapan Synchrotron Radiation Research Institute
JSONJavaScript Object Notation
MDRMaterials Data Repository
MIMaterial informatics
NEDONew Energy and Industrial Technology
PDFPair-distribution function
PEFCPolymer electrolyte fuel cell
PIDPersistent identifier
RDAResearch Data Alliance
RDUFResearch Data Utilization Forum
RHEReversible hydrogen electrode
SAXSSmall-angle X-ray scattering
XAFSX-ray absorption fine structure
XDIXAFS Data Interchange format
XRDX-ray diffraction
YAMLYAML Ain’t Markup Language

Appendix A. Metadata Examples for XAFS Standard Samples

This appendix provides metadata examples of XAFS standard samples designed to ensure reproducibility, transparency, and interoperability. Metadata are organized into categories: data_info (Table A1) for general dataset information such as identifiers and timestamps, sample (Table A2) for details such as composition and preparation, measurement (Table A3) for conditions such as methods and timing, instrument (Table A4) for beamline frontend setups and detector configurations, dataset (Table A5) for processed data attributes such as file formats and steps, analysis (Table A6) for fitting parameters and software details, and entry (Table A7) for linking raw data, results, and analyses. Although a facility category exists, it is omitted here because of its simplicity and limited relevance to XAFS-specific metadata. Nested attributes (e.g., @data_info@identifier@pid) and the “-” symbol for list elements enable clear and flexible documentation of complex datasets. The framework adopts principles from established practices to ensure compatibility with broader informatics systems. Automation tools, templates, and PIDs enhance consistency and traceability, supporting advanced analyses, cross-experimental comparisons, and FAIR data practices.
Table A1. Metadata elements for general dataset information (Category: data_info). This table includes dataset-level identifiers, proposal numbers, timestamps, and associated IDs. Such elements establish a clear record of each experiment and ensure seamless traceability and integration within broader data ecosystems.
KeyValueRemarks
@data_info@identifier@pidspring8.65a277ec-74fd-4552-9056-6a89e698bb35Persistent data ID
@data_info@identifier@proposal_number2024A0005RExperimental Proposal number
@data_info@date@create_time2024-08-06 16:39:14
@data_info@date@update_time2024-08-06 16:39:14
@data_info@facilitySPring-8
@data_info@class_nameBL36XUBeamline
@data_info@titleMaterial analysis in PEFC analysis platform (NEDO project)
@data_info@contact_name@nameHideto ImaiContact name of this dataset
@data_info@contact_name@affiliation@organizationFC-Cubic
@data_info@data_depositor@nameKaneko TakumaName of data depositor
@data_info@data_depositor@affiliation@organizationJASRI
Table A2. Metadata elements describing sample properties (Category: sample). Capturing chemical composition, physical form, preparation steps, and reference standards, these metadata elements ensure that samples can be reproducibly characterized and cross-correlated with other datasets. Sample IDs and standardized sample descriptors support robust sample lineage tracking.
KeyValueRemarks
@sample
   idFCPF_MA_240522_10
   structure@formPowder
   structure@diameter1
   structure@diameter_unitmm
   cell@name1 mmϕ capillary
   catalysist@pretreatment_idEC
   catalysist@formPt/Cnovel MH-18 (800 nm)catalyst structure
   catalysist@carrying_ratePt (58.2 wt%) Co (6.1 wt%)catalyst loading rate
   contact_name@nameMasashi Matsumotocontact name of this sample
   contact_name@affiliation@organizationFC-Cubic
Table A3. Metadata elements for measurement parameters (Category: measurement). Information on measurement techniques, atmospheric conditions, measurement sequences, and timing details are recorded here. Such metadata facilitates reproducibility, contextualizes experimental conditions, and streamlines comparative studies among multiple experiments.
KeyValueRemarks
@measurement@method@categorySpectroscopy
@measurement@method@sub_categoryXAFS
@measreument@method@detectionTransmission
@measurement@method@absorption_edgePt L3
@measurement@scan_modeangle axis
@measurement@atmosphere@sample@gasAr
@mesurement@atmosphere@start_temperature25
@measurement@atmosphere@start_temperature_unitdeg C
@measurement@atmosphere@end_temperature25
@measurement@atmosphere@end_temperaturedeg C
@measurement@measurement_time10
@measurement@measurement_time_unitsec
@measurement@iteration_number10
@measurement@date@start_time2024-07-15 22:18:00
@measurement@date@end_time2024-07-16 22:20:00
Table A4. Metadata elements detailing instrument configurations (Category: instrument). X-ray beamline frontend setups, monochromator settings, detector specifications, and slit geometries are crucial for understanding data quality and constraints. Recording these parameters ensures that instrument conditions are well documented and can be reproduced or validated in future experiments.
KeyValueRemarks
@instrument@slit@name4Dslit
@instrument@slit@vertical_size0.3
@instrument@slit@vertical_size_unitmm
@instrument@slit@horizontal_size0.3
@instrument@slit@horizontal_size_unitmm
@instrument@xafs@I0@element_number1
@instrument@xafs@I0@element
   -typeIon chamber (31 cm)
  gasN2 95% + Ar 5%
   HV1000
   HV_unitV
   amp_gain100,000
   amp_gain_unitV/A
@instrument@xafs@I1@element_number1
@instrument@xafs@I1@element
   -typeIon chamber (31 cm)
   gasN2 50% + Ar 50%
   HV1000
   HV_unitV
   amp_gain100,000
   amp_gain_unitV/A
@instrument@monochrometer@net_planeSi(111)
@instrument@monochrometer@distance3.13551
@instrument@monochrometer@distance_unitA
@instrument@monochrometer@section
   -start_energy10.1
   start_energy_unitdeg
   step_energy−0.0002
   step_energy_unitdeg
   end_energy8.7
   end_energy_unitdeg
   dwell_time1.43
   dwell_time_unitms
Table A5. Metadata elements for processed datasets (Category: dataset). Processed data files, column definitions, and related processing details are documented here. These elements are designed to support the reproducibility of data transformations and to facilitate transparent sharing of analysis workflows.
KeyValueRemarks
@dataset@processed_data@contact_nameKaneko Takuma
@dataset@processed_data@contact_name@affiliation@organizationJASRI
@datset@xafs@processed_data@data_format
   -extensiontxt
  formatAthena
   column
    - namephoton energy
    uniteV
    - nameabsorption coefficient
    unitNone
Table A6. Metadata elements for analysis parameters (Category: analysis). These fields detail the analytical methods, reference files (e.g., scattering paths), fitting parameters, and software versions used. Clear analysis documentation ensures that results are interpretable, verifiable, and can support a wide range of further analyses and applications.
KeyValueRemarks
@analysis@contact_name@nameKaneko Takumacontact name of this analysis
@analysis@contact_name@affiliation@organizationJASRI
@analysis@xafs@application@nameDemeter Athena
@analysis@xafs@application@version0.8
@analysis@xafs@reference_fileraw_data/Pt05.pf9809reference filename used for XAFS analysis
@analysis@xafs@scattering_path_list
   -namePt–Pt
  reference_fileanalysis/Pt-foil.txt
  cif_fileanalysis/1524398_Pt3Co.cifCIF filename for EXAFS scattering path
  cif_file_path_index1
   -namePt–Co
  reference_fileanalysis/Pt-foil.txt
  cif_fileanalysis/152498_Pt3Co.cif
  cif_file_path_index2
Table A7. Metadata elements linking raw and processed data (Category: entry). These elements connect input files, processed data, and final results, enabling researchers to navigate data products and combine information from multiple measurements efficiently.
KeyValueRemarks
@entry
   -dataset@xafs@raw_fileraw_data/12_FCPF_MA_240522_10_EC_01.pf9809
   dataset@xafs@processed_fileFCPF_MA_240522_10_EC.txtμt data processed filename
   dataset@xafs@processed_file_mutanalysis/FCPF_MA_240522_10_EC.norNormalized μt data filename
   dataset@xafs@processed_file_chikanalysis/FCPF_MA_240522_10_EC.chikχ(k) data filename
   dataset@xafs@processed_file_chiranalysis/FCPF_MA_240522_10_EC.chirχ(r) data filename
   dataset@xafs@exafs_analysis_fileanalysis/FCPF_MA_240522_10_EC.logEXAFS analysis filename
   analysis@xafs@scattering_path_list
    - namePt–Pt
    coordination_number7.77
    bond_distance2.713
    bond_distance_unitÅ
    debye_waller_factor0.0062
    debye_waller_factor_unitÅ2
    - namePt–Co
    coordination_number2.49
    bond_distance2.685
    bond_distance_unitÅ
    debye_waller_factor0.0073
    debye_waller_factor_unitÅ2
  analysis@xafs@r_factor0.0114785R factor

References

  1. NEDO. 2020. Available online: https://www.nedo.go.jp/english/activities/activities_ZZJP_100182.html (accessed on 12 February 2025).
  2. PEFC Analysis and Evaluation Platform (FC-Platform)—PEFC Related Materials. Available online: https://pf.fc-cubic-event.jp/ (accessed on 12 February 2025). (In Japanese).
  3. Wilkinson, M.D.; Dumontier, M.; Aalbersberg, I.J.; Appleton, G.; Axton, M.; Baak, A.; Blomberg, N.; Boiten, J.-W.; da Silva Santos, L.B.; Bourne, P.E.; et al. The FAIR Guiding Principles for scientific data management and stewardship. Sci. Data 2016, 3, 160018. [Google Scholar] [CrossRef] [PubMed]
  4. Matsumoto, T.; Furukawa, Y.; Hiraoka, Y.; Kodera, M.; Matsushita, T.; Nakada, K.; Yamashita, A.; Yokota, S. Experimental Data Transfer System BENTEN at SPring-8. In Proceedings of the 17th International Conference on Accelerator and Large Experimental Physics Control Systems. ICALEPCS2019, New York, NY, USA, 5–11 October 2019. [Google Scholar] [CrossRef]
  5. Matsumoto, T.; Nakada, K.; Matsushita, T.; Yokota, S.; Furukawa, Y.; Yamashita, A.; Kodera, M. Experimental data collection and data access software through internet at SPring-8. In Proceedings of the 13th International Conference on Synchrotron Radiation Instrumentation–SRI2018, Taipei, Taiwan, 11–15 June 2018; p. 060076. [Google Scholar] [CrossRef]
  6. Markdown: Syntax Documentation. Available online: https://daringfireball.net/projects/markdown/syntax (accessed on 12 February 2025).
  7. Honma, T.; Oji, H.; Hirayama, S.; Taniguchi, Y.; Ofuchi, H.; Takagaki, M. Full-Automatic XAFS Measurement System of the Engineering Science Research II beamline BL14B2 at SPring-8. In Proceedings of the 10th International Conference On Synchrotron Radiation Instrumentation (SRI 2009), Melbourne, Australia, 27 September–2 October 2009; Volume 1234, pp. 13–16. [Google Scholar] [CrossRef]
  8. Uruga, T.; Tada, M.; Sekizawa, O.; Takagi, Y.; Yokoyama, T.; Iwasawa, Y. SPring-8 BL36XU: Synchrotron radiation X-ray-based multianalytical beamline for polymer electrolyte fuel cells under operating conditions. Chem. Rec. 2019, 19, 1444–1456. [Google Scholar] [CrossRef]
  9. Ravel, B.; Newville, M. ATHENA, ARTEMIS, HEPHAESTUS: Data analysis for X-ray absorption spectroscopy using IFEFFIT. J. Synchrotron Radiat. 2005, 12, 537–541. [Google Scholar] [CrossRef] [PubMed]
  10. Zabinsky, S.I.; Rehr, J.J.; Ankudinov, A.; Albers, R.C.; Eller, M.J. Multiple scattering calculations of X-ray absorption spectra. Phys. Rev. B 1995, 52, 2995–3009. [Google Scholar] [CrossRef] [PubMed]
  11. Vaitkus, A.; Merkys, A.; Sander, T.; Quirós, M.; Thiessen, P.A.; Bolton, E.E.; Gražulis, S. A workflow for deriving chemical entities from crystallographic data and its application to the Crystallography Open Database. J. Cheminf. 2023, 15, 123. [Google Scholar] [CrossRef]
  12. Paripsa, S.; Gaur, A.; Förste, F.; Doronkin, D.E.; Malzer, W.; Schlesiger, C.; Kanngießer, B.; Welter, E.; Grunwaldt, J.-D.; LützenKirchen-Hecht, D. RefXAS: An open access database of X-ray absorption spectra. J. Synchrotron Radiat. 2024, 31, 1105–1117. [Google Scholar] [CrossRef]
  13. Yoshikawa, H.; Matolínová, I.; Matolín, V. Practical chemical analysis of Pt and Pd-based heterogeneous catalysts with hard X-ray photoelectron spectroscopy. J. Electron Spectrosc. Relat. Phenom. 2013, 190, 268–277. [Google Scholar] [CrossRef]
  14. Yasuno, S.; Oji, H.; Koganezawa, T.; Watanabe, T. Hard X-ray photoelectron spectroscopy equipment developed at beamline BL46XU of SPring-8 for industrial researches. In Proceedings of the 12th International Conference on Synchrotron Radiation Instrumentation—SRI2015, New York, NY, USA, 6–10 July 2015; p. 030020. [Google Scholar] [CrossRef]
  15. Yasui, A.; Takagi, Y.; Osaka, T.; Senba, Y.; Yamazaki, H.; Koyama, T.; Yumoto, H.; Ohashi, H.; Motomura, K.; Nakajima, K.; et al. BL09XU: An advanced hard X-ray photoelectron spectroscopy beamline of SPring-8. J. Synchrotron Rad. 2023, 30, 1013–1022. [Google Scholar] [CrossRef]
  16. OriginLab Corporation. OriginPro, Version 2023; OriginLab Corporation: Northampton, MA, USA, 2023. Available online: https://www.originlab.com/ (accessed on 12 February 2025).
  17. Hammer, B.; Nørskov, J.K. Electronic factors determining the reactivity of metal surfaces. Surf. Sci. 1995, 343, 211–220. [Google Scholar] [CrossRef]
  18. Ramesh, G.V.; Kodiyath, R.; Tanabe, T.; Manikandan, M.; Fujita, T.; Umezawa, N.; Ueda, S.; Ishihara, S.; Ariga, K.; Abe, H. Stimulation of electro-oxidation catalysis by bulk-structural transformation in intermetallic ZrPt3 nanoparticles. ACS Appl. Mater. Interfaces 2014, 6, 16124–16130. [Google Scholar] [CrossRef]
  19. Osaka, K.; Yokozawa, Y.; Torizuka, Y.; Yamada, Y.; Manota, M.; Harada, N.; Chou, Y.; Sasaki, H.; Bergamaschi, A.; Sato, M. Versatile high-throughput diffractometer for industrial use at BL19B2 in SPring-8. In Proceedings of the 13th International Conference on Synchrotron Radiation Instrumentation–SRI2018, Taipei, Taiwan, 11–15 June 2018; p. 050008. [Google Scholar] [CrossRef]
  20. Cullity, B.D.; Stock, S.R. Elements of X-Ray Diffraction; Pearson Education: Boston, MA, USA, 2014. [Google Scholar]
  21. Z-Code. Available online: https://z-code-software.com/ (accessed on 12 February 2025).
  22. Rietveld, H.M. A profile refinement method for nuclear and magnetic structures. J. Appl. Crystallogr. 1969, 2, 65–71. [Google Scholar] [CrossRef]
  23. Oishi, R.; Yonemura, M.; Nishimaki, Y.; Torii, S.; Hoshikawa, A.; Ishigaki, T.; Morishima, T.; Mori, K.; Kamiyama, T. Rietveld analysis software for J-PARC. Nucl. Instrum. Methods Phys. Res. A 2009, 600, 94–96. [Google Scholar] [CrossRef]
  24. Monshi, A.; Foroughi, M.R.; Monshi, M.R. Modified Scherrer equation to estimate more accurately nano-crystallite size using XRD. World J. Nano Sci. Eng. 2012, 2, 154–160. [Google Scholar] [CrossRef]
  25. Purushotham, E.; Krishna, N.G. X-ray determination of crystallite size and effect of lattice strain on Debye–Waller factors of platinum nano powders. Bull. Mater. Sci. 2013, 36, 973–976. [Google Scholar] [CrossRef]
  26. Waseda, Y. The Structure of Non-Crystalline Materials: Liquids and Amorphous Solids; McGraw-Hill International Book Co.: New York, NY, USA, 1980. [Google Scholar]
  27. Warren, B.E. X-ray Diffraction; Addison-Wesley Publishing Company: Boston, MA, USA, 1969. [Google Scholar]
  28. Egami, T.; Billinge, S.J.L. Underneath the Bragg Peaks: Structural Analysis of Complex Materials; Elsevier: Amsterdam, The Netherlands, 2003. [Google Scholar]
  29. Kohara, S.; Suzuya, K.; Kashihara, Y.; Matsumoto, N.; Umesaki, N.; Sakai, I. A horizontal two-axis diffractometer for high-energy X-ray diffraction using synchrotron radiation on bending magnet beamline BL04B2 at SPring-8. Nucl. Instrum. Methods Phys. Res. A 2001, 467–468, 1030–1033. [Google Scholar] [CrossRef]
  30. Faber, T.E.; Ziman, J.M. An Introduction to the Theory of Liquid Metals; Cambridge University Press: Cambridge, UK, 1972. [Google Scholar]
  31. Kodama, K.; Iikubo, S.; Taguchi, T.; Shamoto, S. Finite size effects of nanoparticles on the atomic pair distribution functions. Acta Cryst. A 2006, 62, 444–453. [Google Scholar] [CrossRef]
  32. Ohta, N.; Sekiguchi, H.; Sasaki, Y.C.; Yagi, N. Absolute scale calibration with use of excess scattering length for small-angle X-ray scattering. J. Appl. Crystallogr. 2014, 47, 654–658. [Google Scholar] [CrossRef]
  33. Ilavsky, J.; Jemian, P.R. Irena: Tool suite for modeling and analysis of small-angle scattering. J. Appl. Crystallogr. 2009, 42, 347–353. [Google Scholar] [CrossRef]
  34. Pauw, B.R.; Pedersen, J.S.; Tardif, S.; Takata, M.; Iversen, B. Improvements and considerations for size distribution retrieval from small-angle scattering data by Monte Carlo methods. J. Appl. Crystallogr. 2013, 46, 365–371. [Google Scholar] [CrossRef]
  35. Bressler, I.; Pauw, B.R.; Thünemann, A.F. McSAS: Software for the retrieval of model parameter distributions from scattering patterns. J. Appl. Crystallogr. 2015, 48, 962–969. [Google Scholar] [CrossRef]
  36. Kohlbrecher, J.; Breßler, I. Updates in SASfit for fitting analytical expressions and numerical models to small-angle scattering patterns. J. Appl. Crystallogr. 2022, 55, 1677–1688. [Google Scholar] [CrossRef] [PubMed]
  37. Alina, G.; Attala, Z.; Bakker, J.; Beaucage, P.; Bourne, R.; Bouwman, W.; Breßler, I.; Butler, P.; Caddy-Jones, I.; Campbell, K.; et al. SasView for Small Angle Scattering Analysis. 2022. Available online: https://www.sasview.org (accessed on 12 February 2025).
  38. Mufundirwa, A.; Sakurai, Y.; Arao, A.; Matsumoto, M.; Imai, H.; Iwamoto, H. Contrast variation method applied to structural evaluation of catalysts by X-ray small-angle scattering. Sci. Rep. 2024, 14, 2263. [Google Scholar] [CrossRef] [PubMed]
  39. YAML Ain’t Markup Language (YAMLTM) Revision 1.2.2, 1 October 2021. Available online: https://yaml.org/spec/1.2.2/ (accessed on 12 February 2025).
  40. Bray, T. The JavaScript Object Notation (JSON) Data Interchange Format (Request for Comments No. RFC 8259); Internet Engineering Task Force: Fremont, CA, USA, 2017. [Google Scholar] [CrossRef]
  41. Ofuchi, H.; Matsumoto, T.; Honma, T. Construction of XAFS standard sample database at BL14B2 in SPring-8. Radiat. Phys. Chem. 2024, 218, 111581. [Google Scholar] [CrossRef]
  42. Carion, U. JSON Type Definition (Request for Comments No. RFC 8927); Internet Engineering Task Force: Fremont, CA, USA, 2020. [Google Scholar] [CrossRef]
  43. Visual Studio Code—Code Editing. Redefined. Available online: https://code.visualstudio.com/ (accessed on 12 February 2025).
  44. Ishii, M.; Tanabe, K.; Matsuda, A.; Ofuchi, H.; Matsumoto, T.; Yaji, T.; Inada, Y.; Nitani, H.; Kimura, M.; Asakura, K. Integration of X-ray absorption fine structure databases for data-driven materials science. Sci. Technol. Adv. Mater. Methods 2023, 3, 2197518. [Google Scholar] [CrossRef]
  45. National Institute for Materials Science. MDR HAXPES DB; National Institute for Materials Science: Tsukuba, Japan, 2020. [Google Scholar] [CrossRef]
  46. Miyasaka, N.; Gracia-Escobar, F.; Takahashi, K. Automatic identification of X-ray absorption fine structure spectra via machine learning. J. Phys. Chem. C 2024, 128, 17921–17927. [Google Scholar] [CrossRef]
  47. Cibin, G.; Gianolio, D.; Parry, S.A.; Schoonjans, T.; Moore, O.; Draper, R.; Miller, L.A.; Thoma, A.; Doswell, C.L.; Graham, A. An open access, integrated XAS data repository at Diamond Light Source. Radiat. Phys. Chem. 2020, 175, 108479. [Google Scholar] [CrossRef]
  48. International XAFS DB Portal. Available online: https://ixdb.jxafs.org/ (accessed on 12 February 2025).
  49. IXAS: The International X-Ray Absorption Society, 2025. Available online: https://xrayabsorption.org/ (accessed on 12 February 2025).
  50. XDI Data Format—X-Ray Absorption Data Library. Available online: https://docs.xrayabsorption.org/xaslib/xdi.html (accessed on 12 February 2025).
  51. Könnecke, M.; Akeroyd, F.A.; Bernstein, H.J.; Brewster, A.S.; Campbell, S.I.; Clausen, B.; Cottrell, S.; Hoffmann, J.U.; Jemian, P.R.; Männicke, D.; et al. The NeXus data format. J. Appl. Crystallogr. 2015, 48, 301–305. [Google Scholar] [CrossRef]
  52. NXxas—Nexus v2024.02 Documentation. Available online: https://manual.nexusformat.org/classes/applications/NXxas.html (accessed on 12 February 2025).
  53. Advanced Research Infrastructure for Materials and Nanotechnology in Japan. Available online: https://nanonet.mext.go.jp/ (accessed on 12 February 2025).
  54. SPring-8 Data Center Portal—SPring-8 Data Center Portal. Available online: https://dc-portal.spring8.or.jp/ (accessed on 12 February 2025).
  55. SciCat. Available online: https://scicatproject.github.io/ (accessed on 12 February 2025).
  56. The ICAT Collaboration. The ICAT Project; The ICAT Collaboration, 2014. Available online: https://icatproject.org/releases/ (accessed on 12 February 2025).
  57. FC-Platform WP1: Data-Driven Materials Design—MIX Platform Note. Available online: https://pf.fc-cubic-event.jp/wp1 (accessed on 12 February 2025). (In Japanese).
  58. Elastic. Elasticsearch: The Definitive Guide. Available online: https://www.elastic.co/guide/en/elasticsearch/reference/current/ (accessed on 12 February 2025).
  59. aria2: The High-Speed Download Utility. Available online: https://aria2.github.io/ (accessed on 12 February 2025).
  60. metalink: The Metalink Standard. Available online: https://www.metalinker.org/ (accessed on 12 February 2025).
  61. Sakimura, N.; Bradley, J.; Jones, M.; de Medeiros, B.; Mortimore, C. OpenID Connect Core 1.0. OpenID Foundation, 2014. Available online: https://openid.net/specs/openid-connect-core-1_0.html (accessed on 12 February 2025).
  62. The HDF Group. Hierarchical Data Format, version 5. 1997–2024; The HDF Group Champaign: Champaign, IL, USA; Available online: https://www.hdfgroup.org/solutions/hdf5/ (accessed on 12 February 2025).
  63. Ofuchi, H.; Honma, T. SPring-8/SACLA Annual Report FY2021. SPring-8/SACLA Annual Report 2021. Available online: http://www.spring8.or.jp/pdf/en/ann_rep/21/10.BL14B2.pdf (accessed on 12 February 2025). (In Japanese).
  64. Persistent Identification of Instruments. Persistent Identification of Instruments Whitepaper, version 1.0; Research Data Alliance; European Commission: Brussels, Belgium; Luxembourg, 2020; Available online: https://docs.pidinst.org/ (accessed on 12 February 2025).
  65. ORCID. Available online: https://orcid.org/ (accessed on 12 February 2025).
  66. Japan Link Center. Research Data Utilization Framework (RDUF). Available online: https://japanlinkcenter.org/rduf/ (accessed on 12 February 2025).
  67. Research Data Utilization Forum. Research Data Utilization Forum Subcommittee on Assigning PIDs to Research Resources and Instruments: Discussion Summary and Recommendations for the Future. Japan Link Center, 2023. Available online: https://japanlinkcenter.org/rduf/doc/rduf_pidrri_report3.pdf. (accessed on 12 February 2025). (In Japanese).
  68. Research Data Alliance. Available online: https://www.rd-alliance.org/ (accessed on 12 February 2025).
  69. Persistent Identification of Instruments. Recommendations for Persistent Identification of Instruments (Japanese Version), Version 1.0. Research Data Alliance, 2020. Available online: https://docs.pidinst.org/ja/ (accessed on 12 February 2025).
  70. MatVoc. Explore MatVoc Explorer, Materials Vocabulary. Available online: https://matvoc.nims.go.jp/explore/ (accessed on 12 February 2025).
  71. Cabinet Office, Government of Japan. Basic Policy for Immediate Open Access to Academic Papers. 2024. Available online: https://www8.cao.go.jp/cstp/oa_240216.pdf (accessed on 12 February 2025). (In Japanese).
Figure 1. Overview of the FC-Platform, an analysis and evaluation platform for PEFCs. This figure illustrates the platform’s architecture, highlighting its role in integrating cross-disciplinary expertise and facilitating the development of advanced materials and methods for PEFCs.
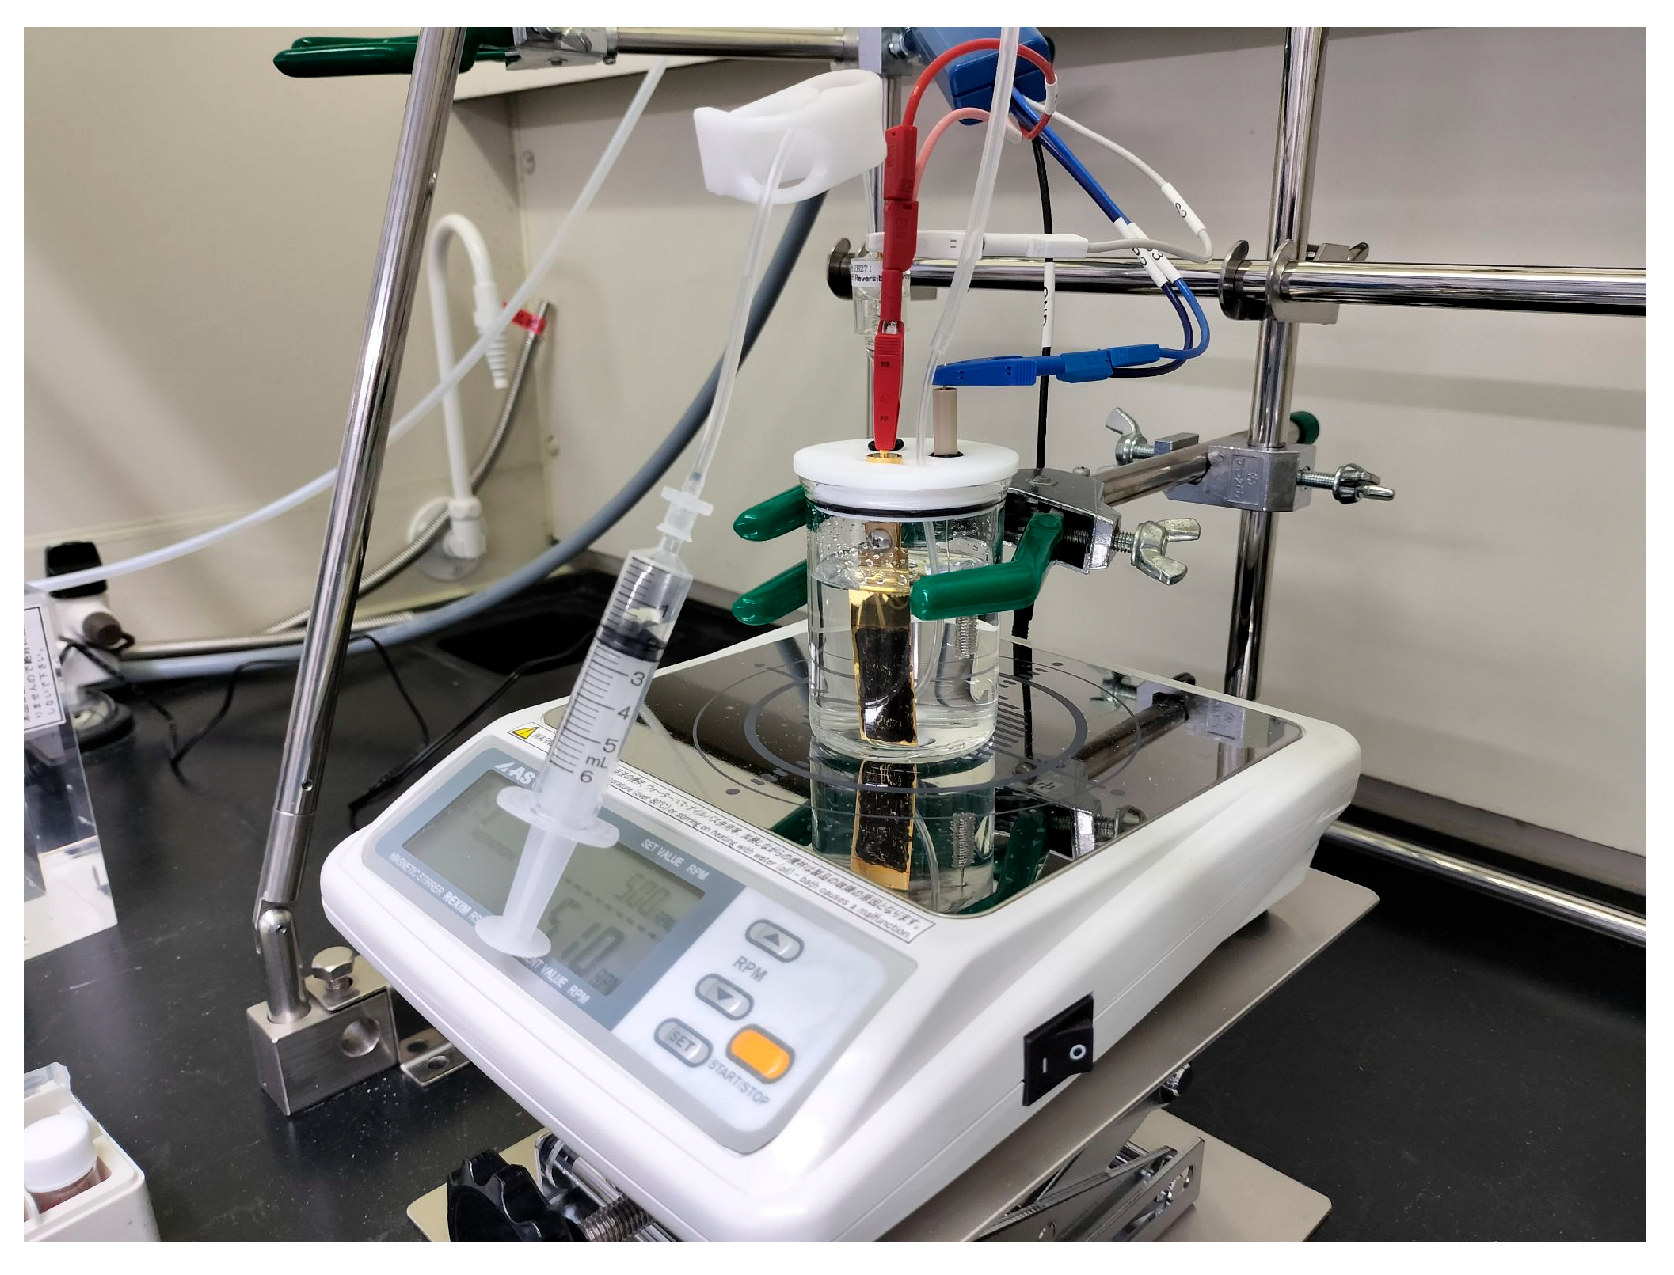
Applsci 15 03931 g001
Figure 2. Experimental setup for CV measurements. The setup includes an RHE, a platinum counter electrode, and a gold plate working electrode coated with catalyst ink. The figure illustrates the arrangement of electrodes, electrolyte solution, and measurement equipment used to perform CV scans under controlled conditions.
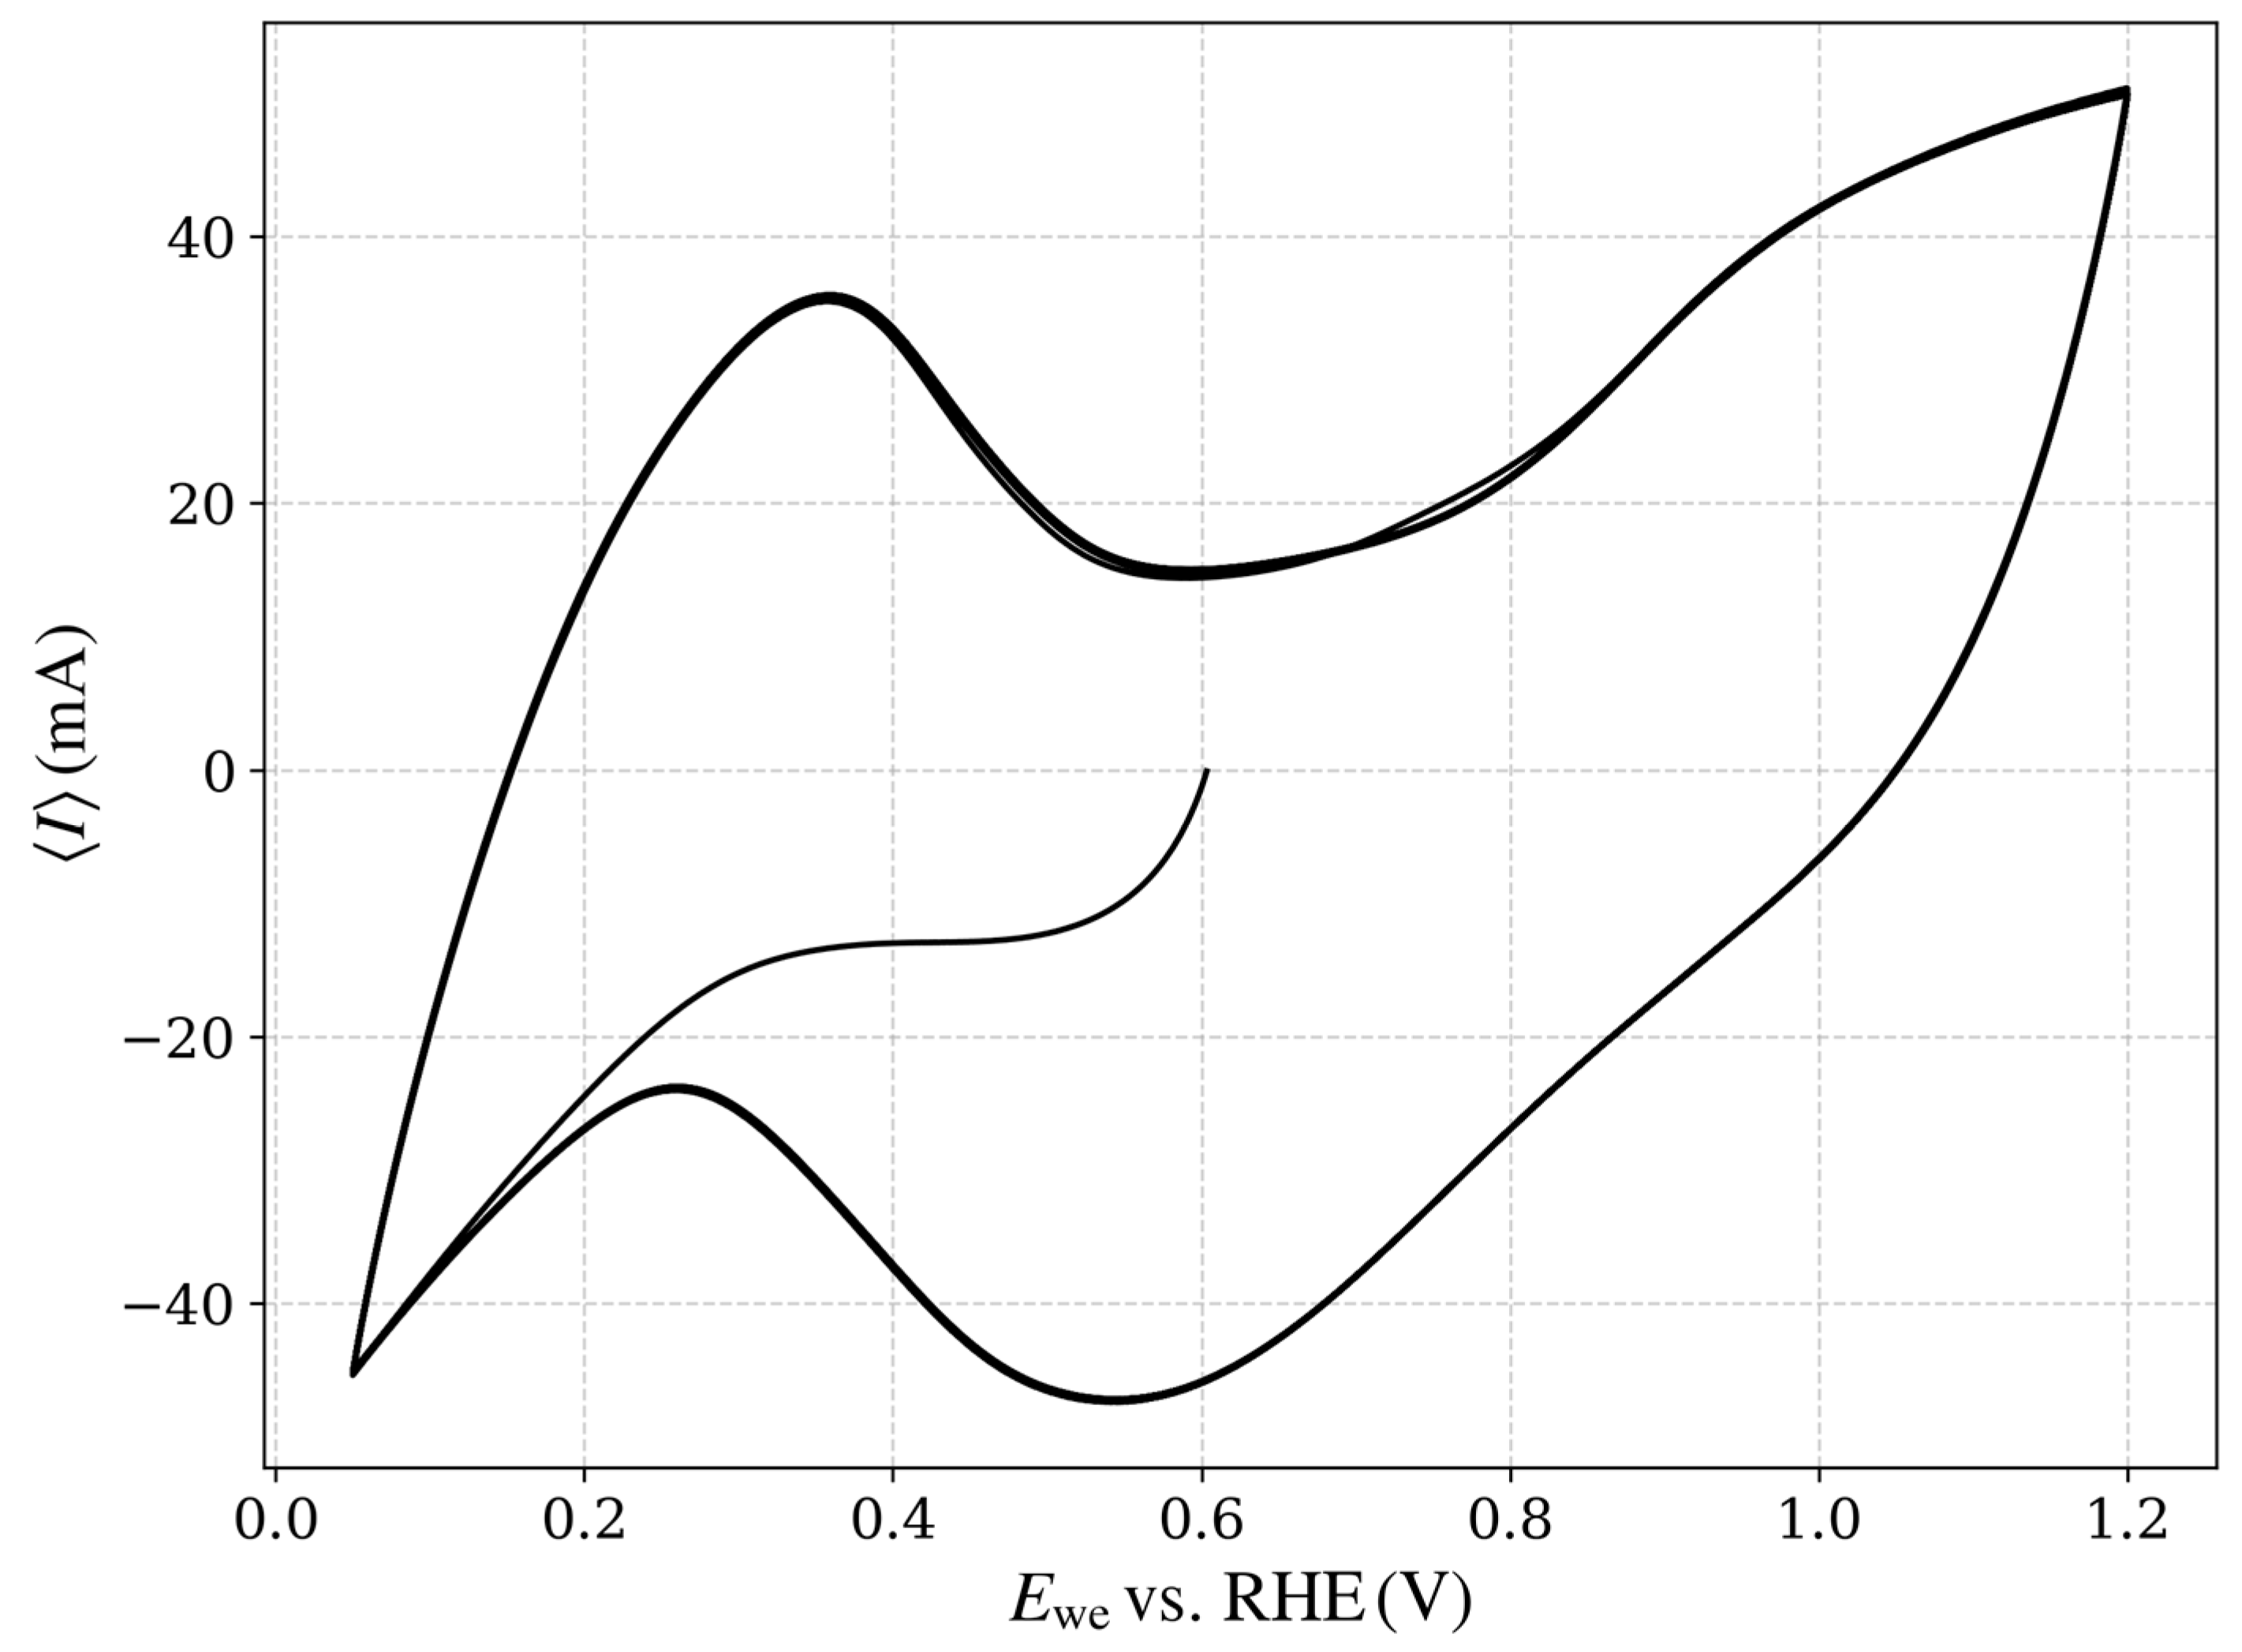
Applsci 15 03931 g002
Figure 3. Representative CV results for TEC10V30E (supplied by TANAKA Precious Metals [TANAKA PRECIOUS METAL TECHNOLOGIES Co., Ltd., Tokyo, Japan]) under an operational potential range of 0.05–1.2 V vs. the RHE at a scan rate of 50 mV/s. The plot shows the relationship between the working electrode potential (Ewe) relative to RHE and the resulting current (I), highlighting key electrochemical responses within the operational range.
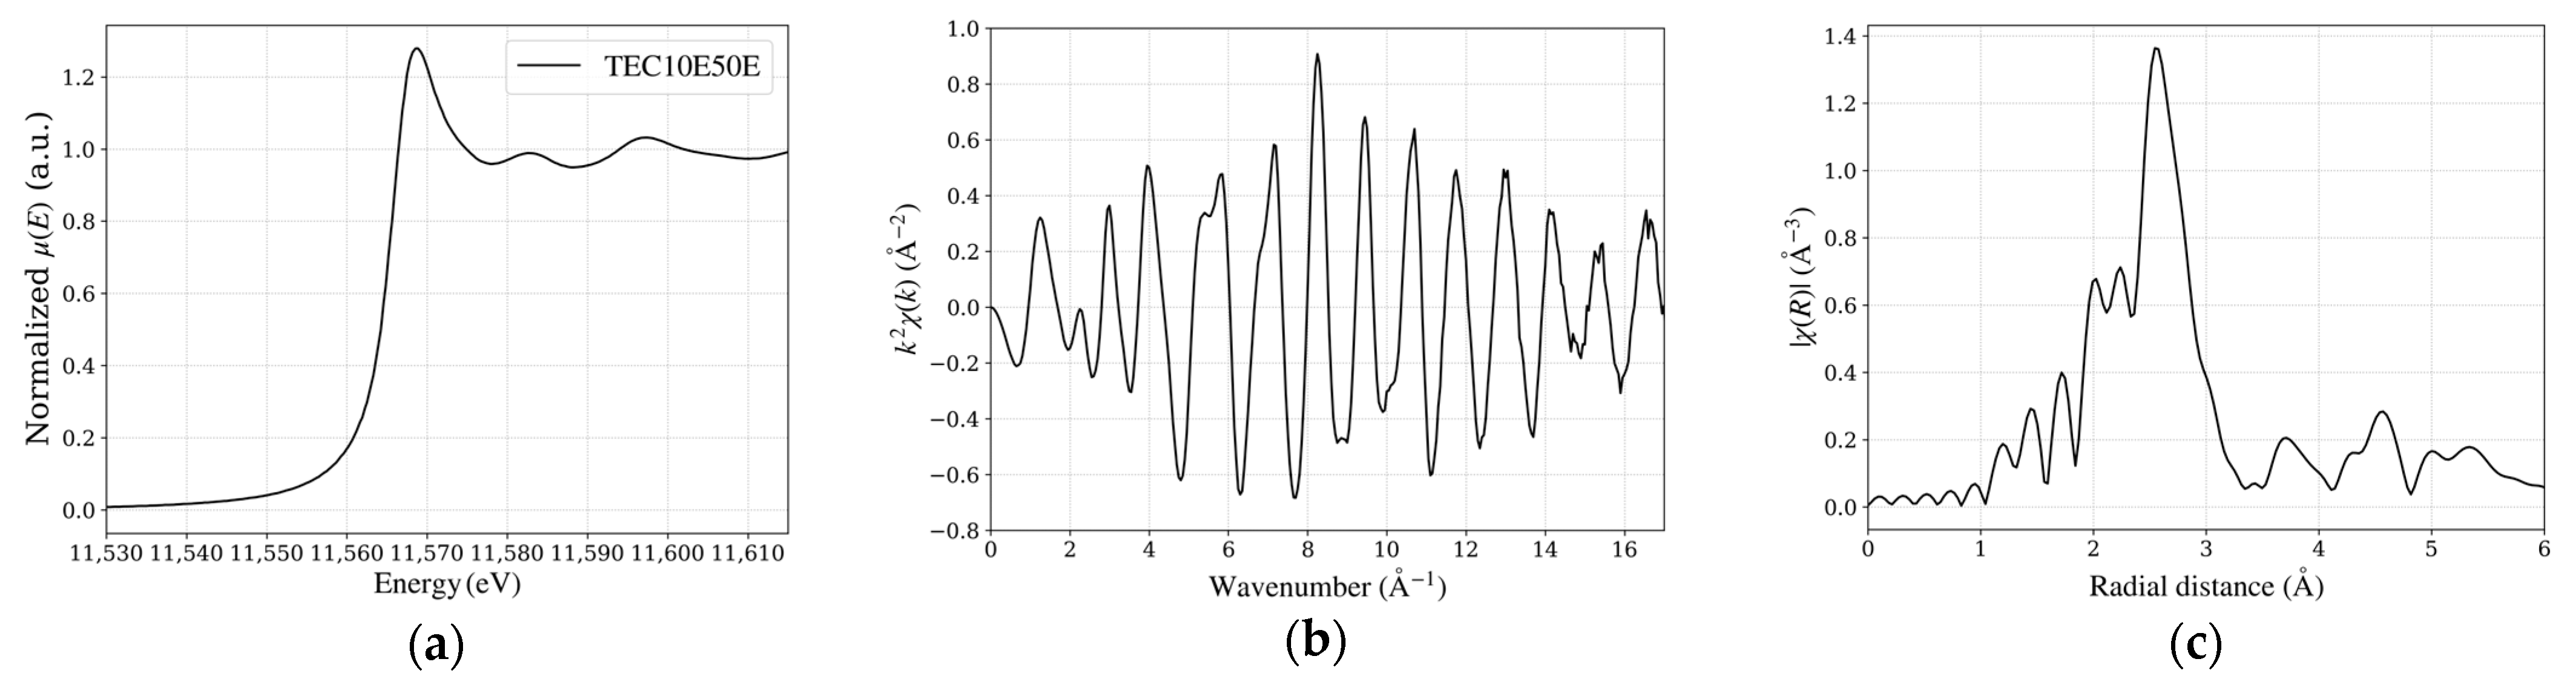
Applsci 15 03931 g003
Figure 4. Pt L3-edge XAFS spectra of TEC10E50E, a hydrogen-reduced sample supplied by TANAKA Precious Metals. (a) X-ray absorption near edge structure spectrum at the Pt L3-edge, indicating the electronic state of Pt. (b) EXAFS spectrum in k-space, showing oscillations related to local structures. (c) Fourier-transformed EXAFS spectrum in R-space, illustrating the radial distribution of neighboring atoms around Pt.
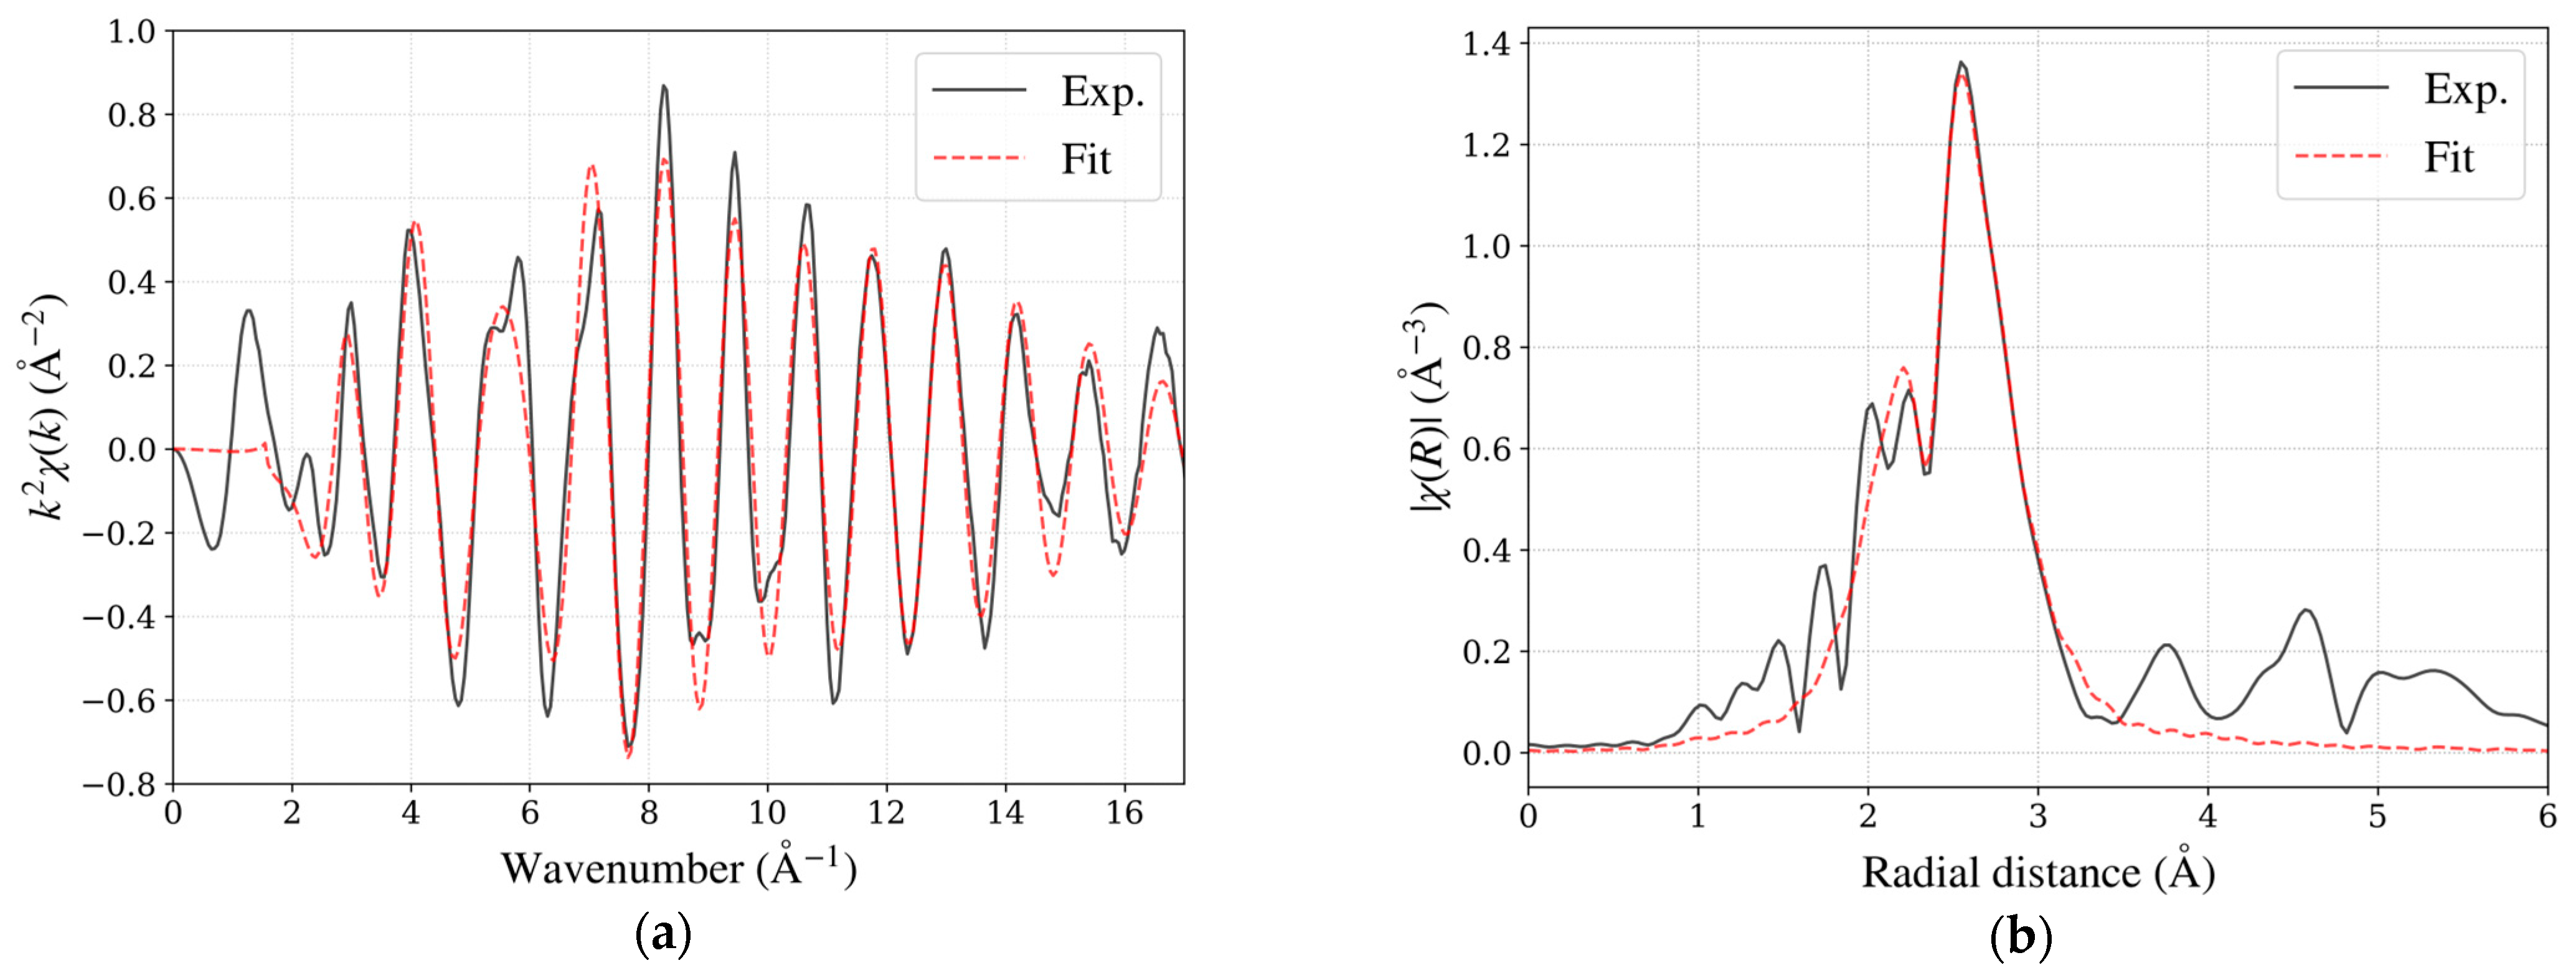
Applsci 15 03931 g004
Figure 5. (a) EXAFS spectrum in k-space for the Pt L3-edge of TEC10E50E, a hydrogen-reduced sample supplied by TANAKA Precious Metals. (b) Magnitudes of Fourier-transformed spectrum in R-space. Experimental data (black solid line, Exp.) and fitting result (red dashed line, Fit) are shown.
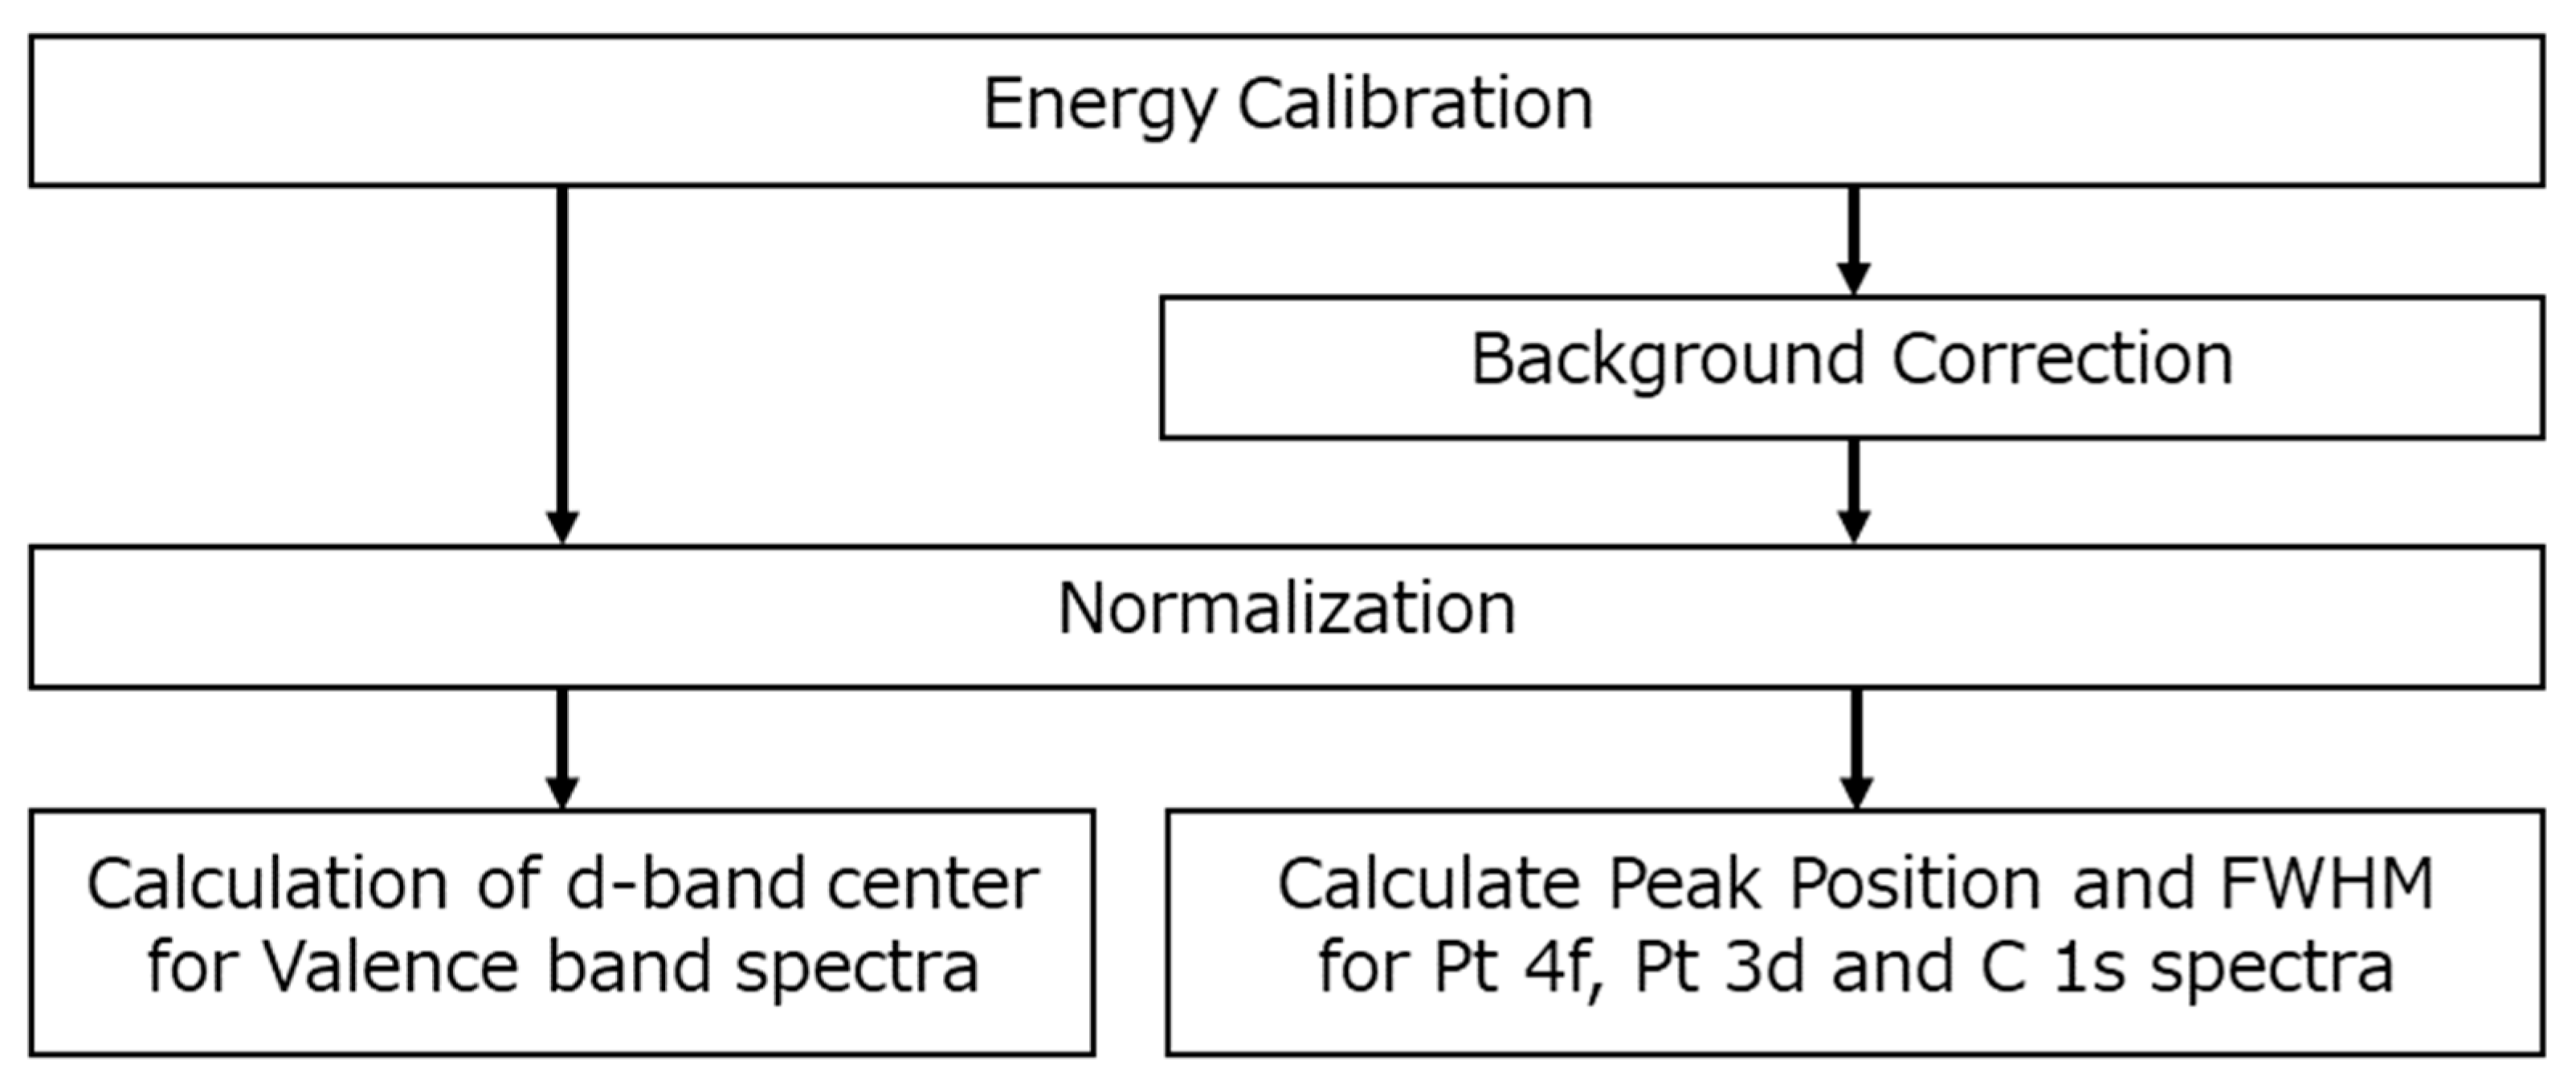
Applsci 15 03931 g005
Figure 6. Workflow for HAXPES spectra analysis, illustrating the sequential steps from energy calibration to background correction and normalization. The calculation of d-band center for valence band spectra uses energy calibration and normalization, while peak positions with FWHM for core-level spectra also include background correction.
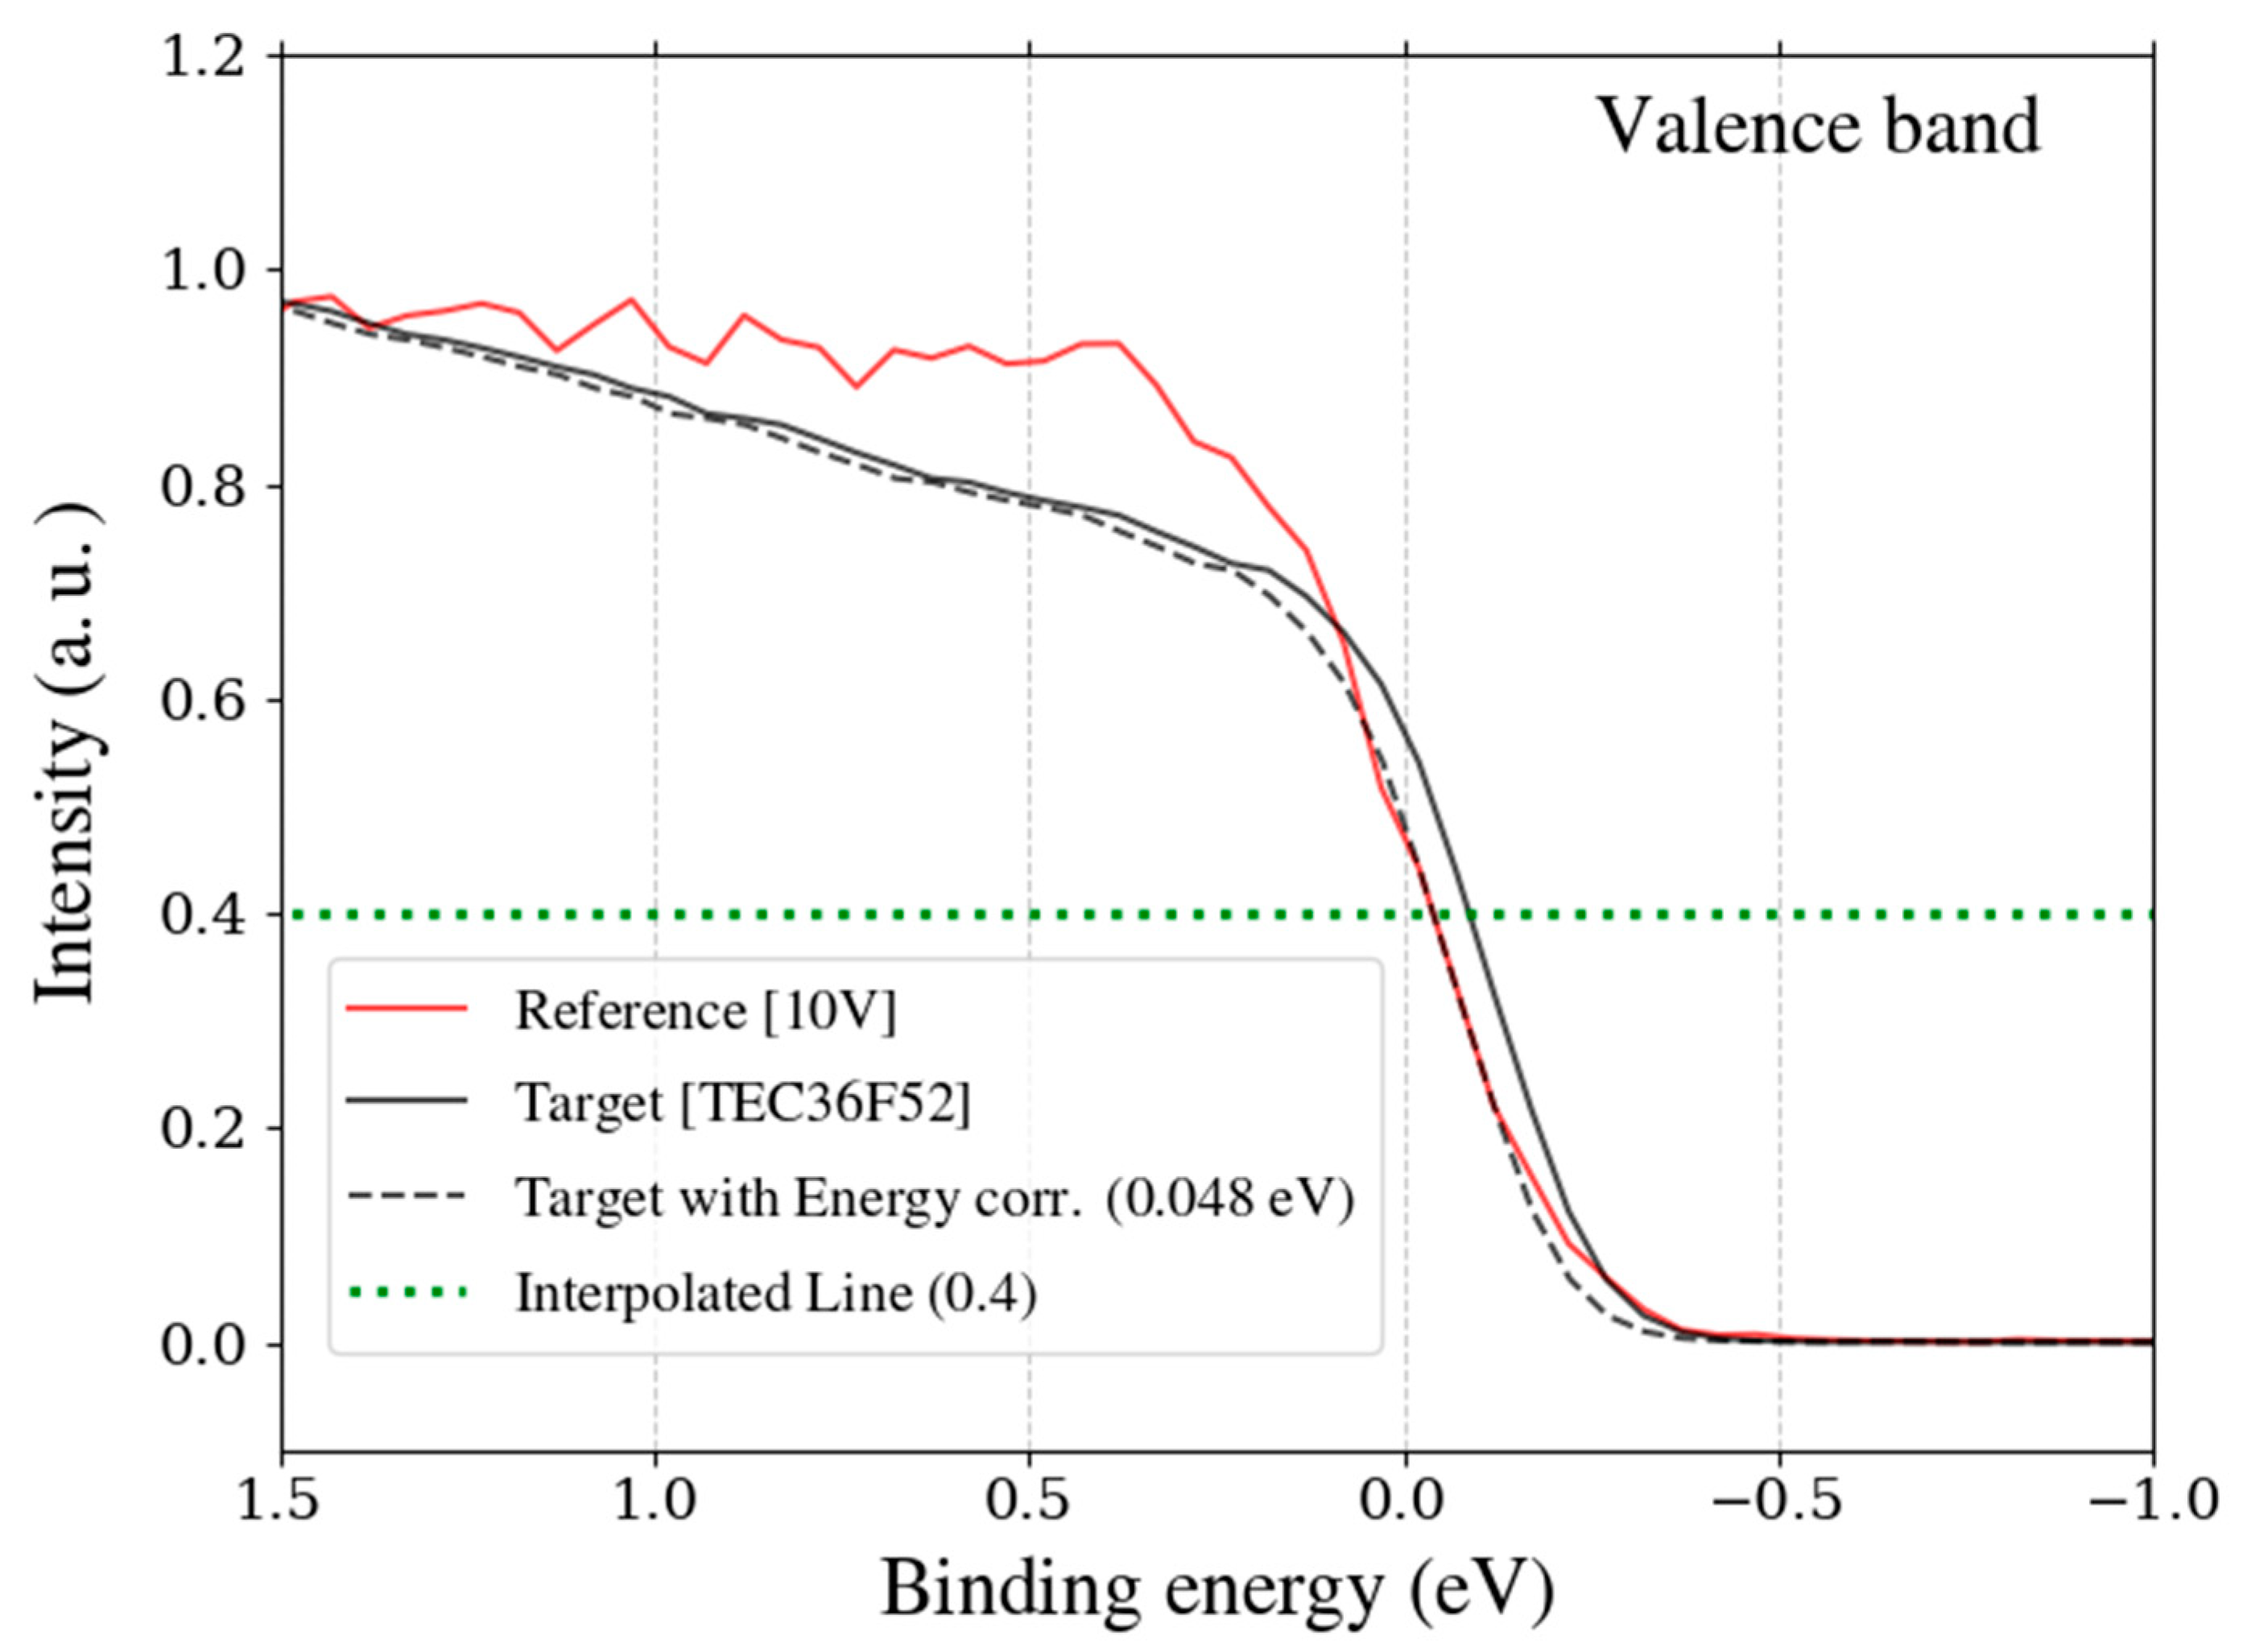
Applsci 15 03931 g006
Figure 7. Binding energy profiles of the valence band for the reference sample (10 V, red solid line) and the target sample (TEC36F52, black solid line), both provided by TANAKA Precious Metals. The intensity distributions are normalized. The interpolated binding energy is indicated by a green dashed line at an intensity of 0.4. The black dashed line represents the target sample data after energy correction, where the binding energy has been calibrated using the energy offset at the interpolated point, aligning it with the reference sample.
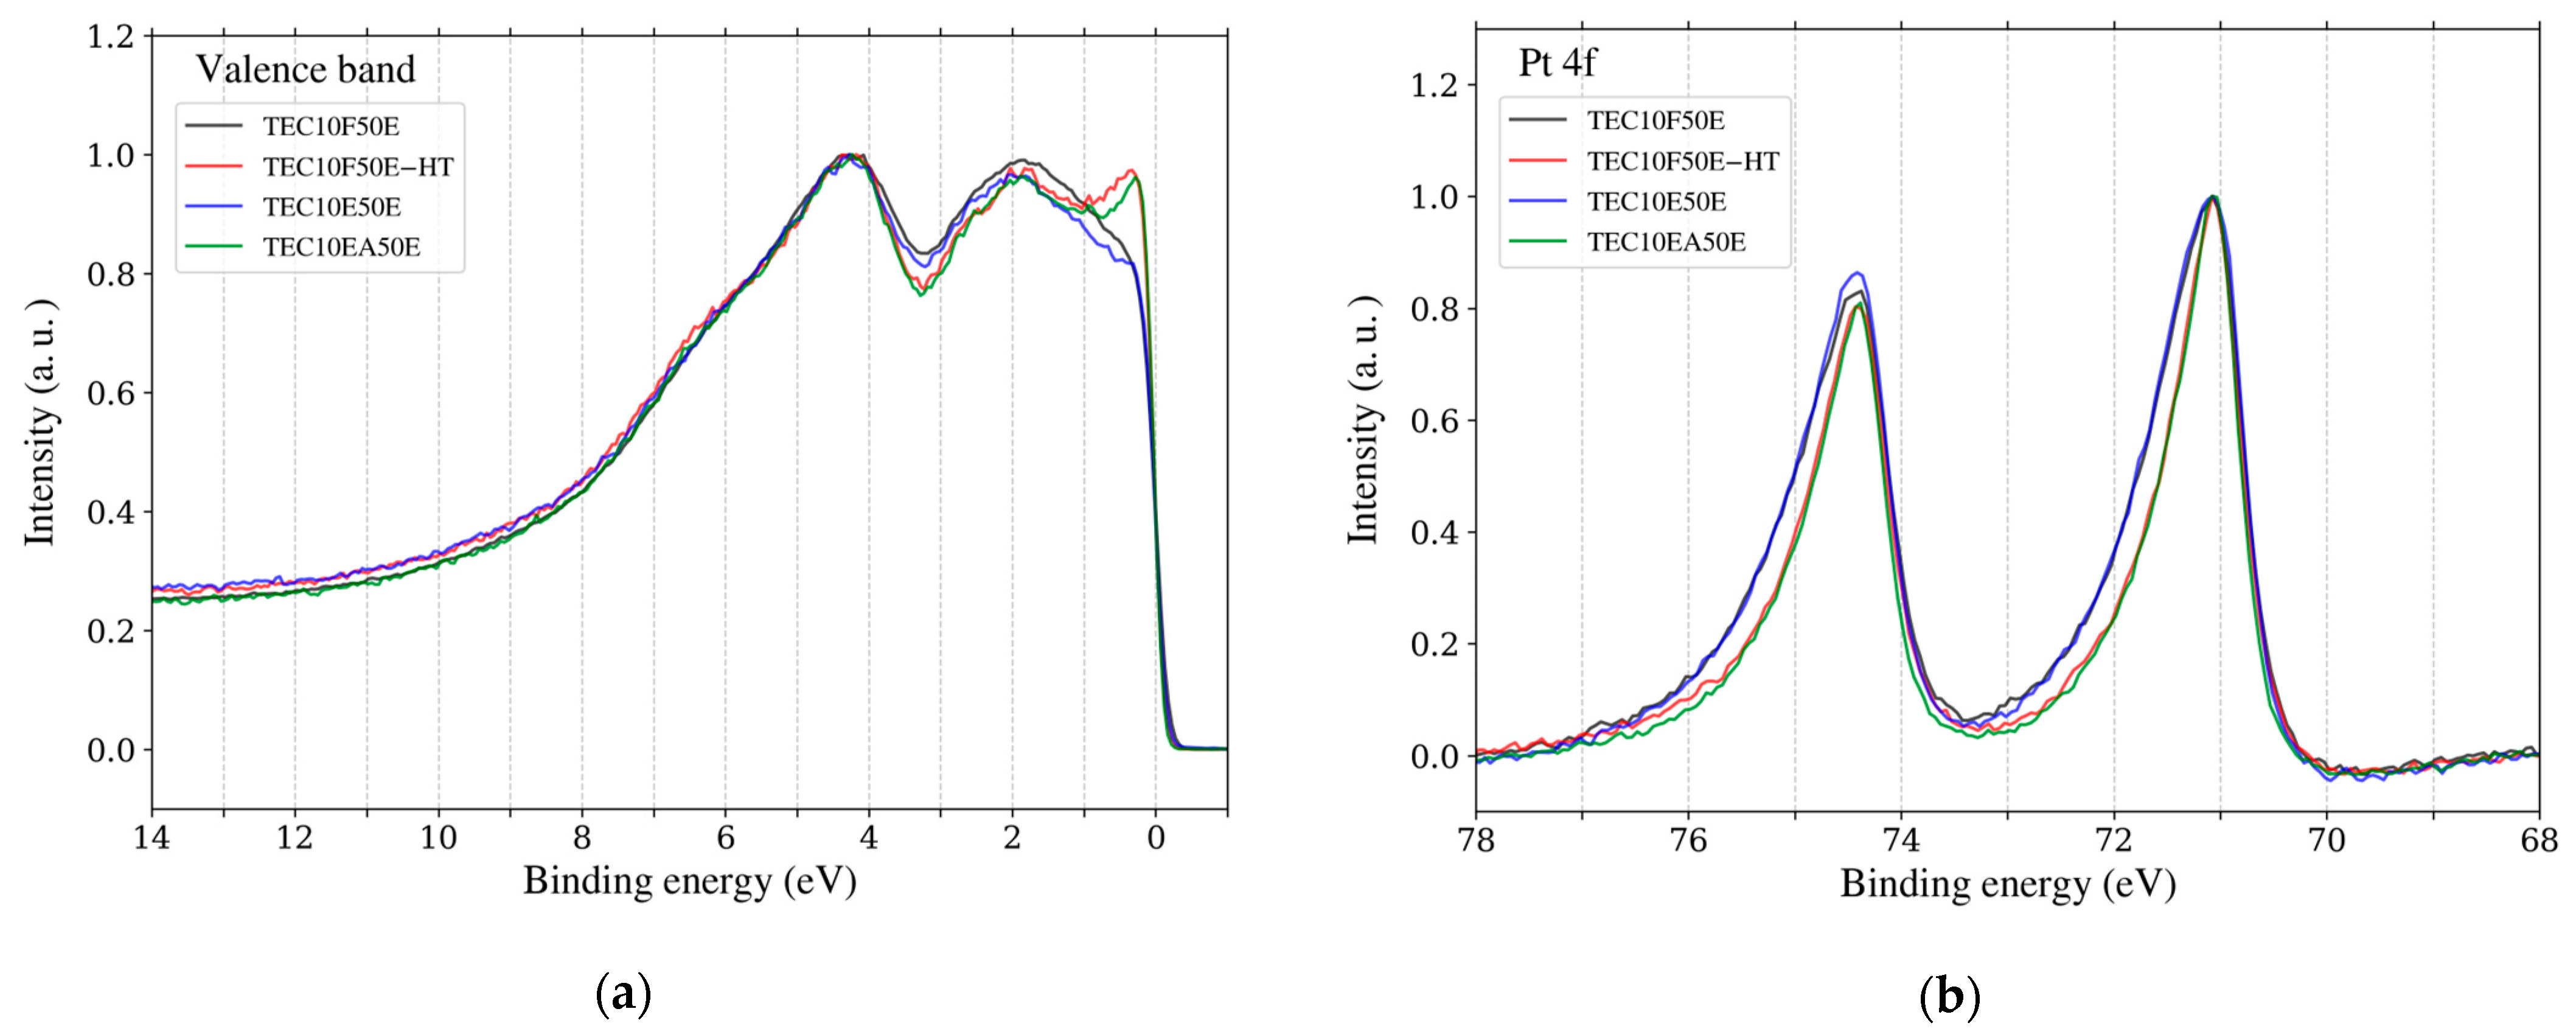
Applsci 15 03931 g007
Figure 8. (a) Valence band spectra after energy calibration and normalization. (b) Pt 4f spectra after energy calibration, background correction and normalization. Each plot represents data for different samples: TEC10EF50E (black), TEC10F50E-HT (red), TEC10E50E (blue), and TEC10EA50E (green). All samples are hydrogen-reduced and supplied by TANAKA Precious Metals.
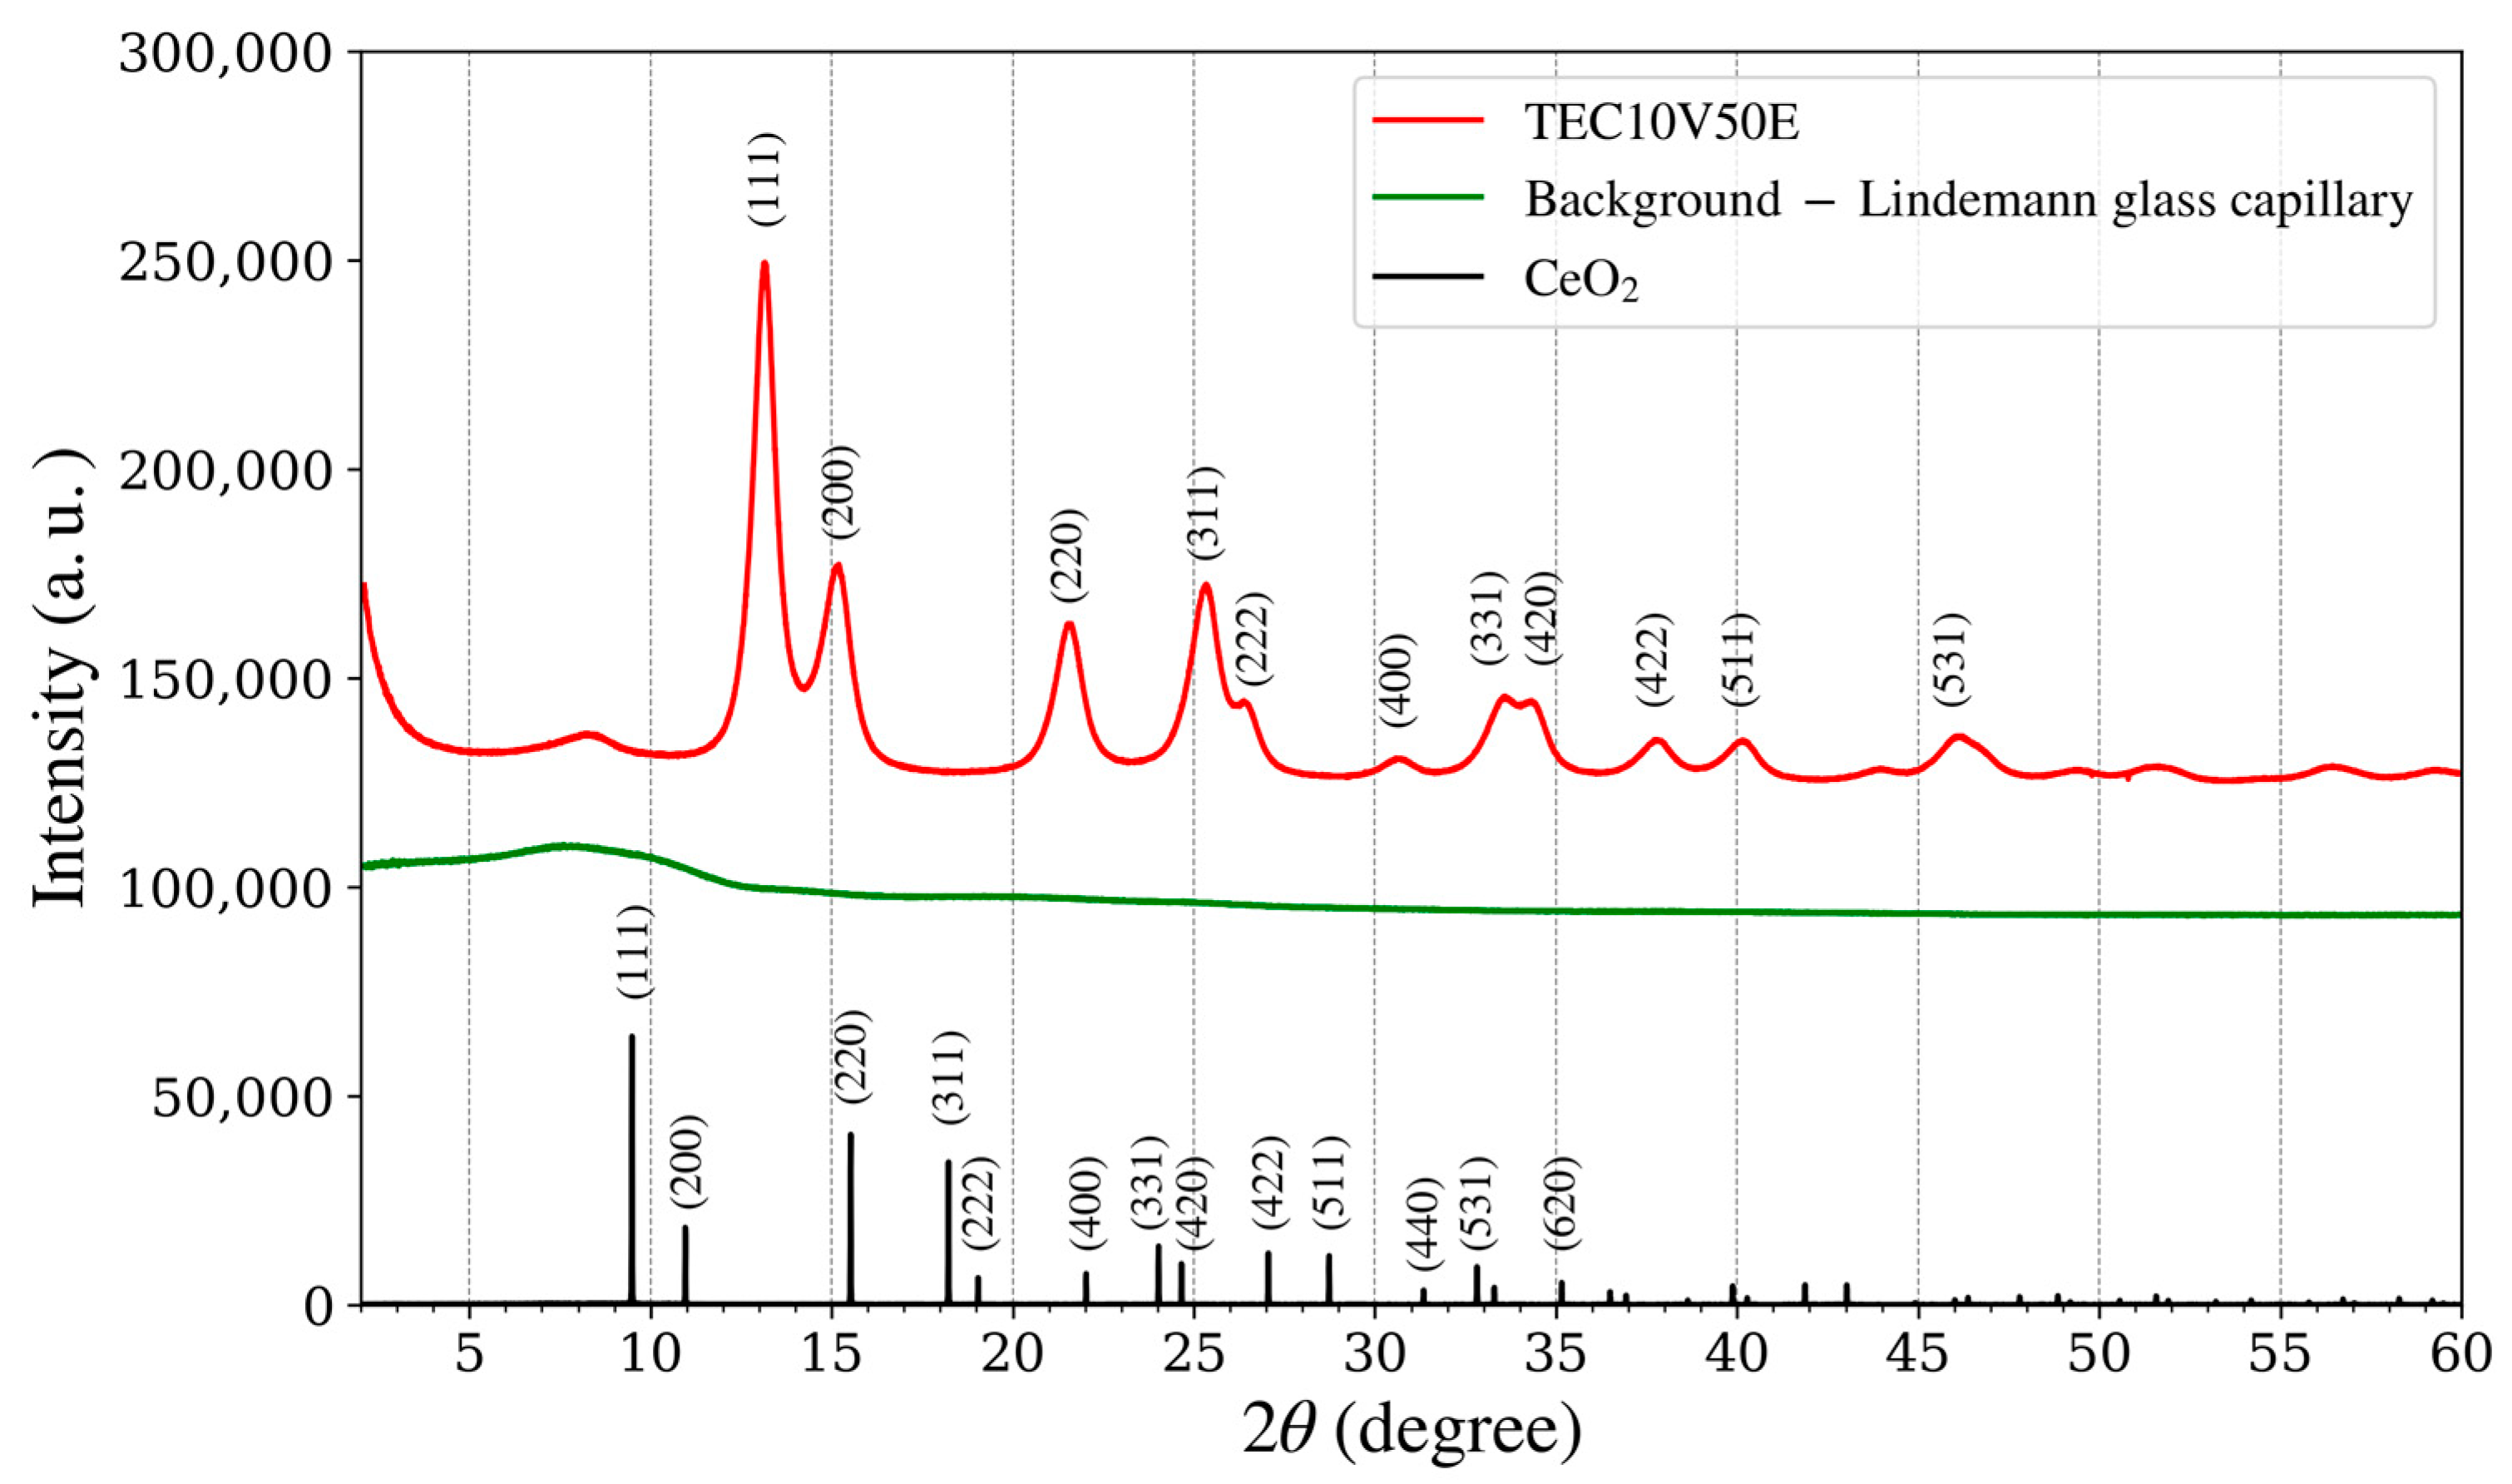
Applsci 15 03931 g008
Figure 9. XRD spectra of the platinum catalyst as a standard sample (TEC10V50E, red line), supplied by TANAKA Precious Metals; background of an empty Lindemann glass capillary (green line) and cerium oxide (black line).
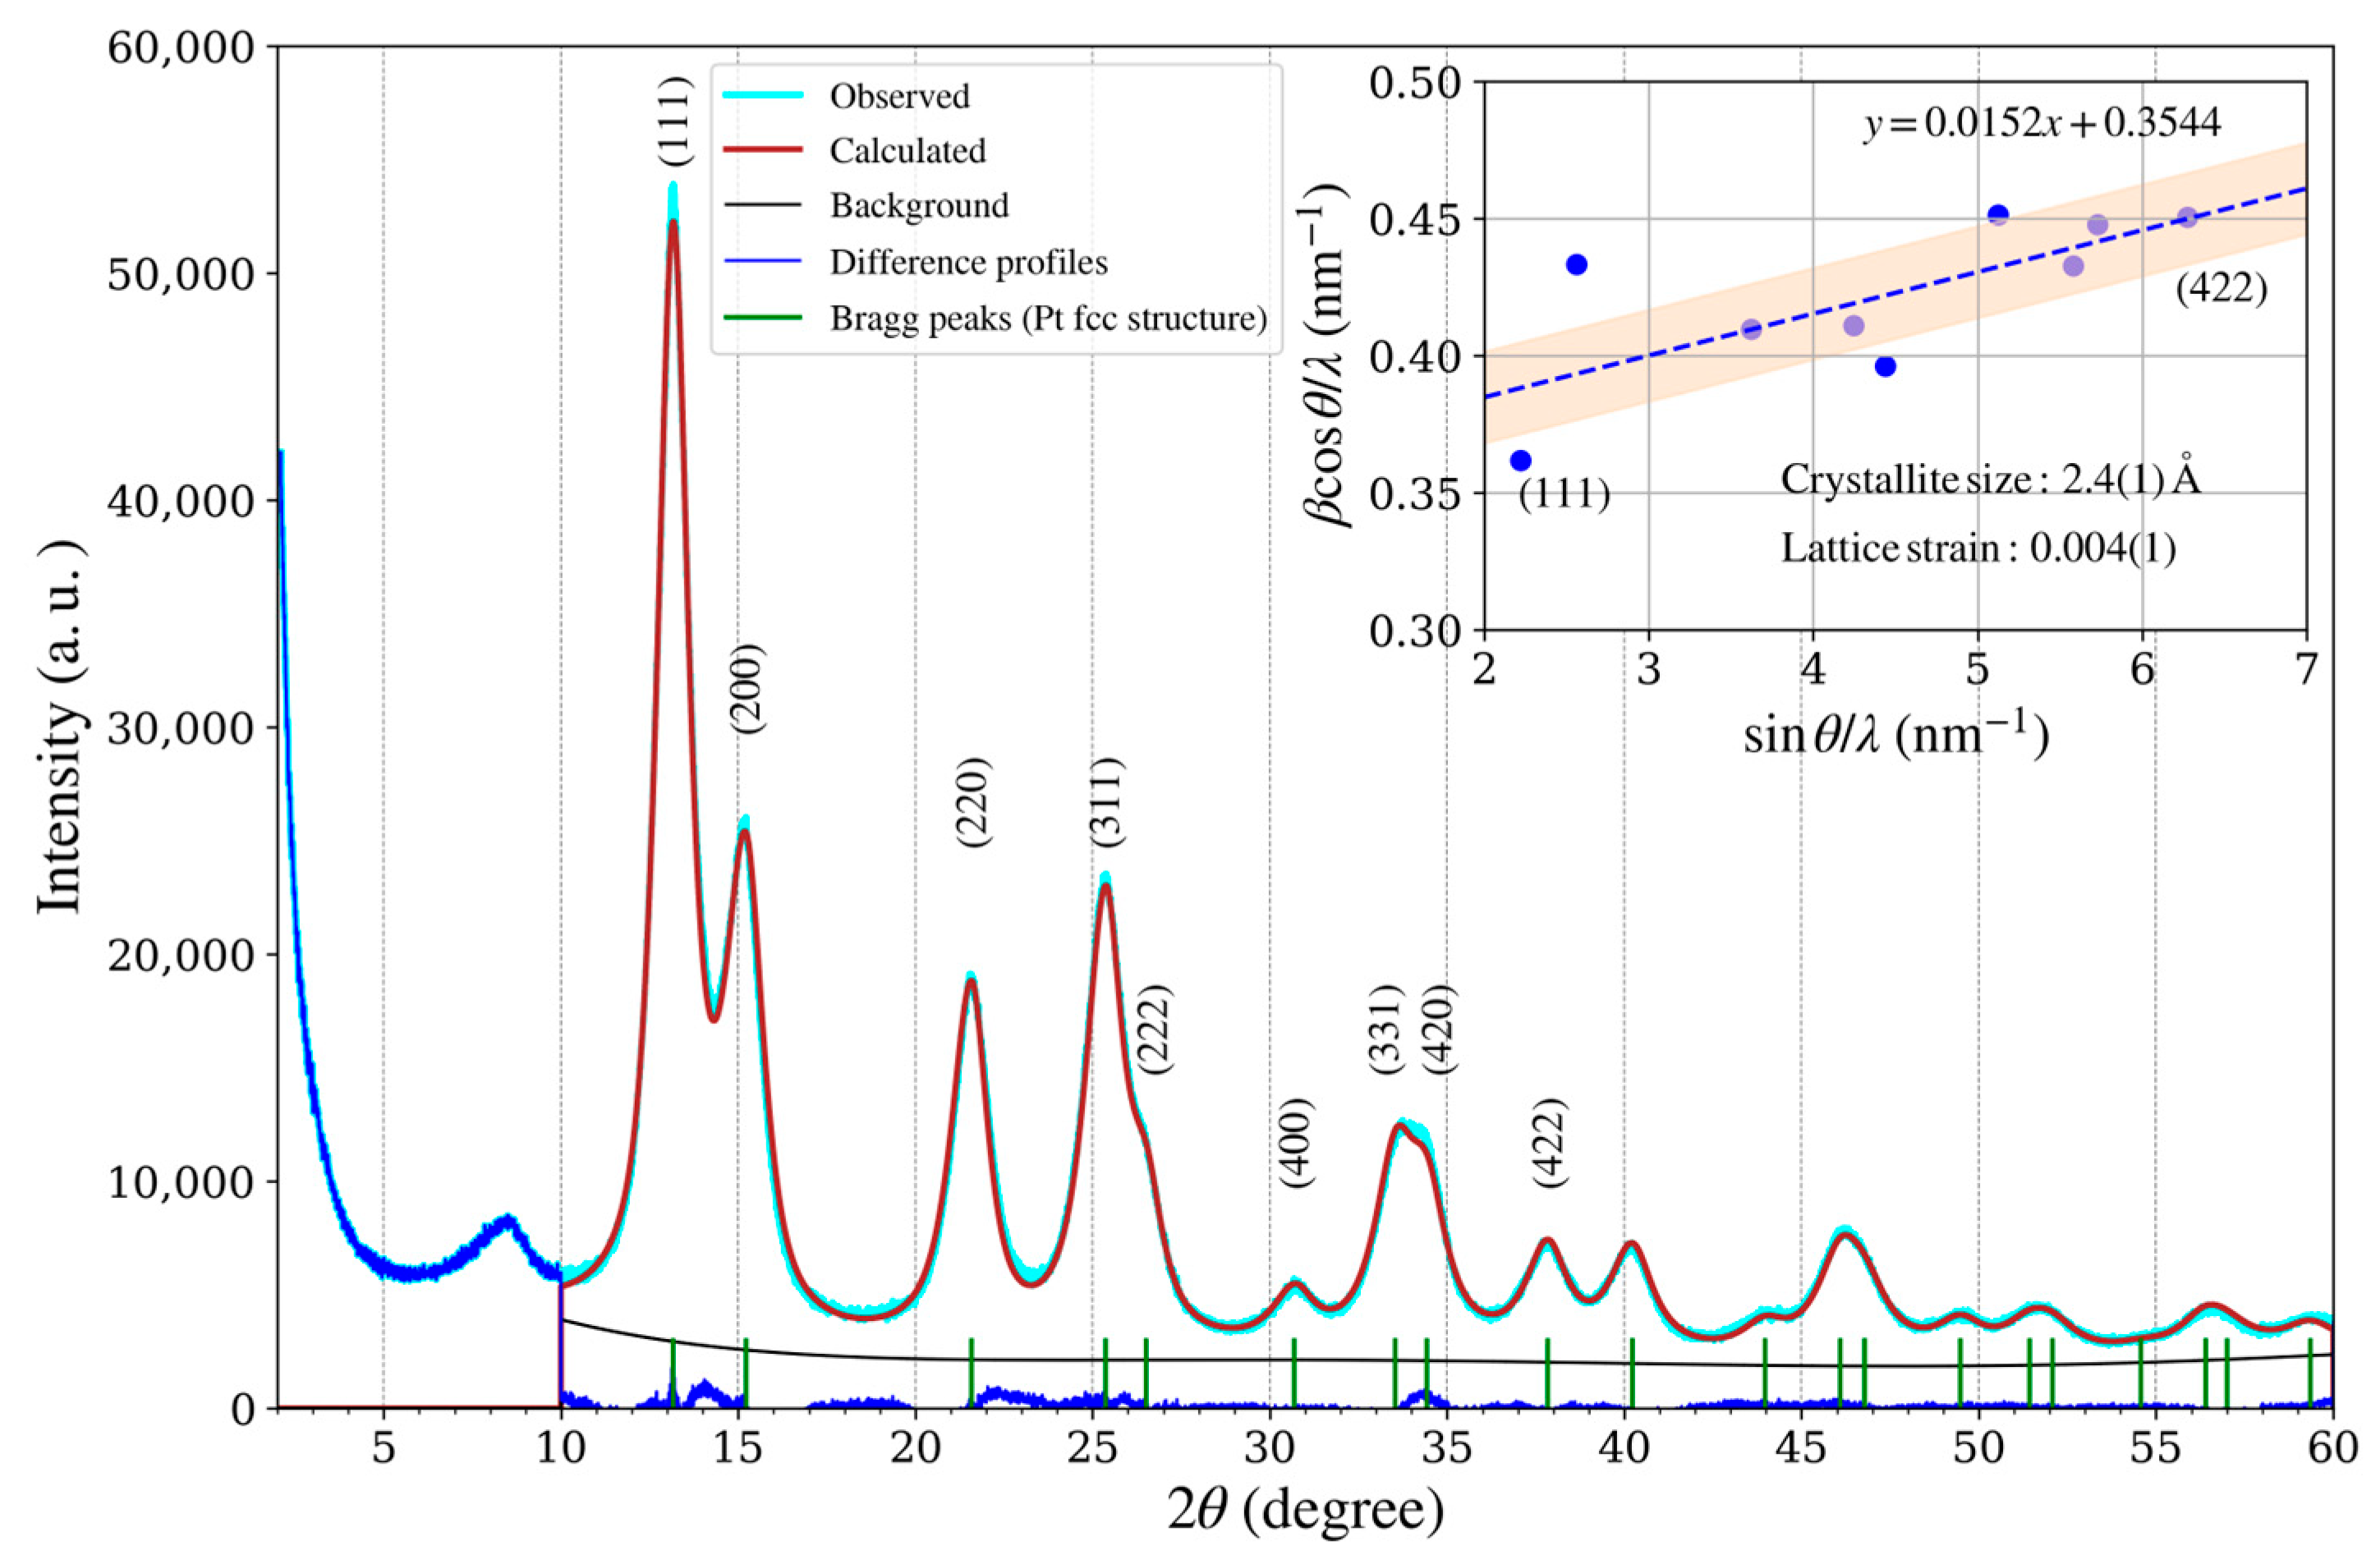
Applsci 15 03931 g009
Figure 10. XRD pattern of the platinum catalyst (TEC10V50E, supplied by TANAKA Precious Metals) and plot of Williamson–Hall analysis (inset).
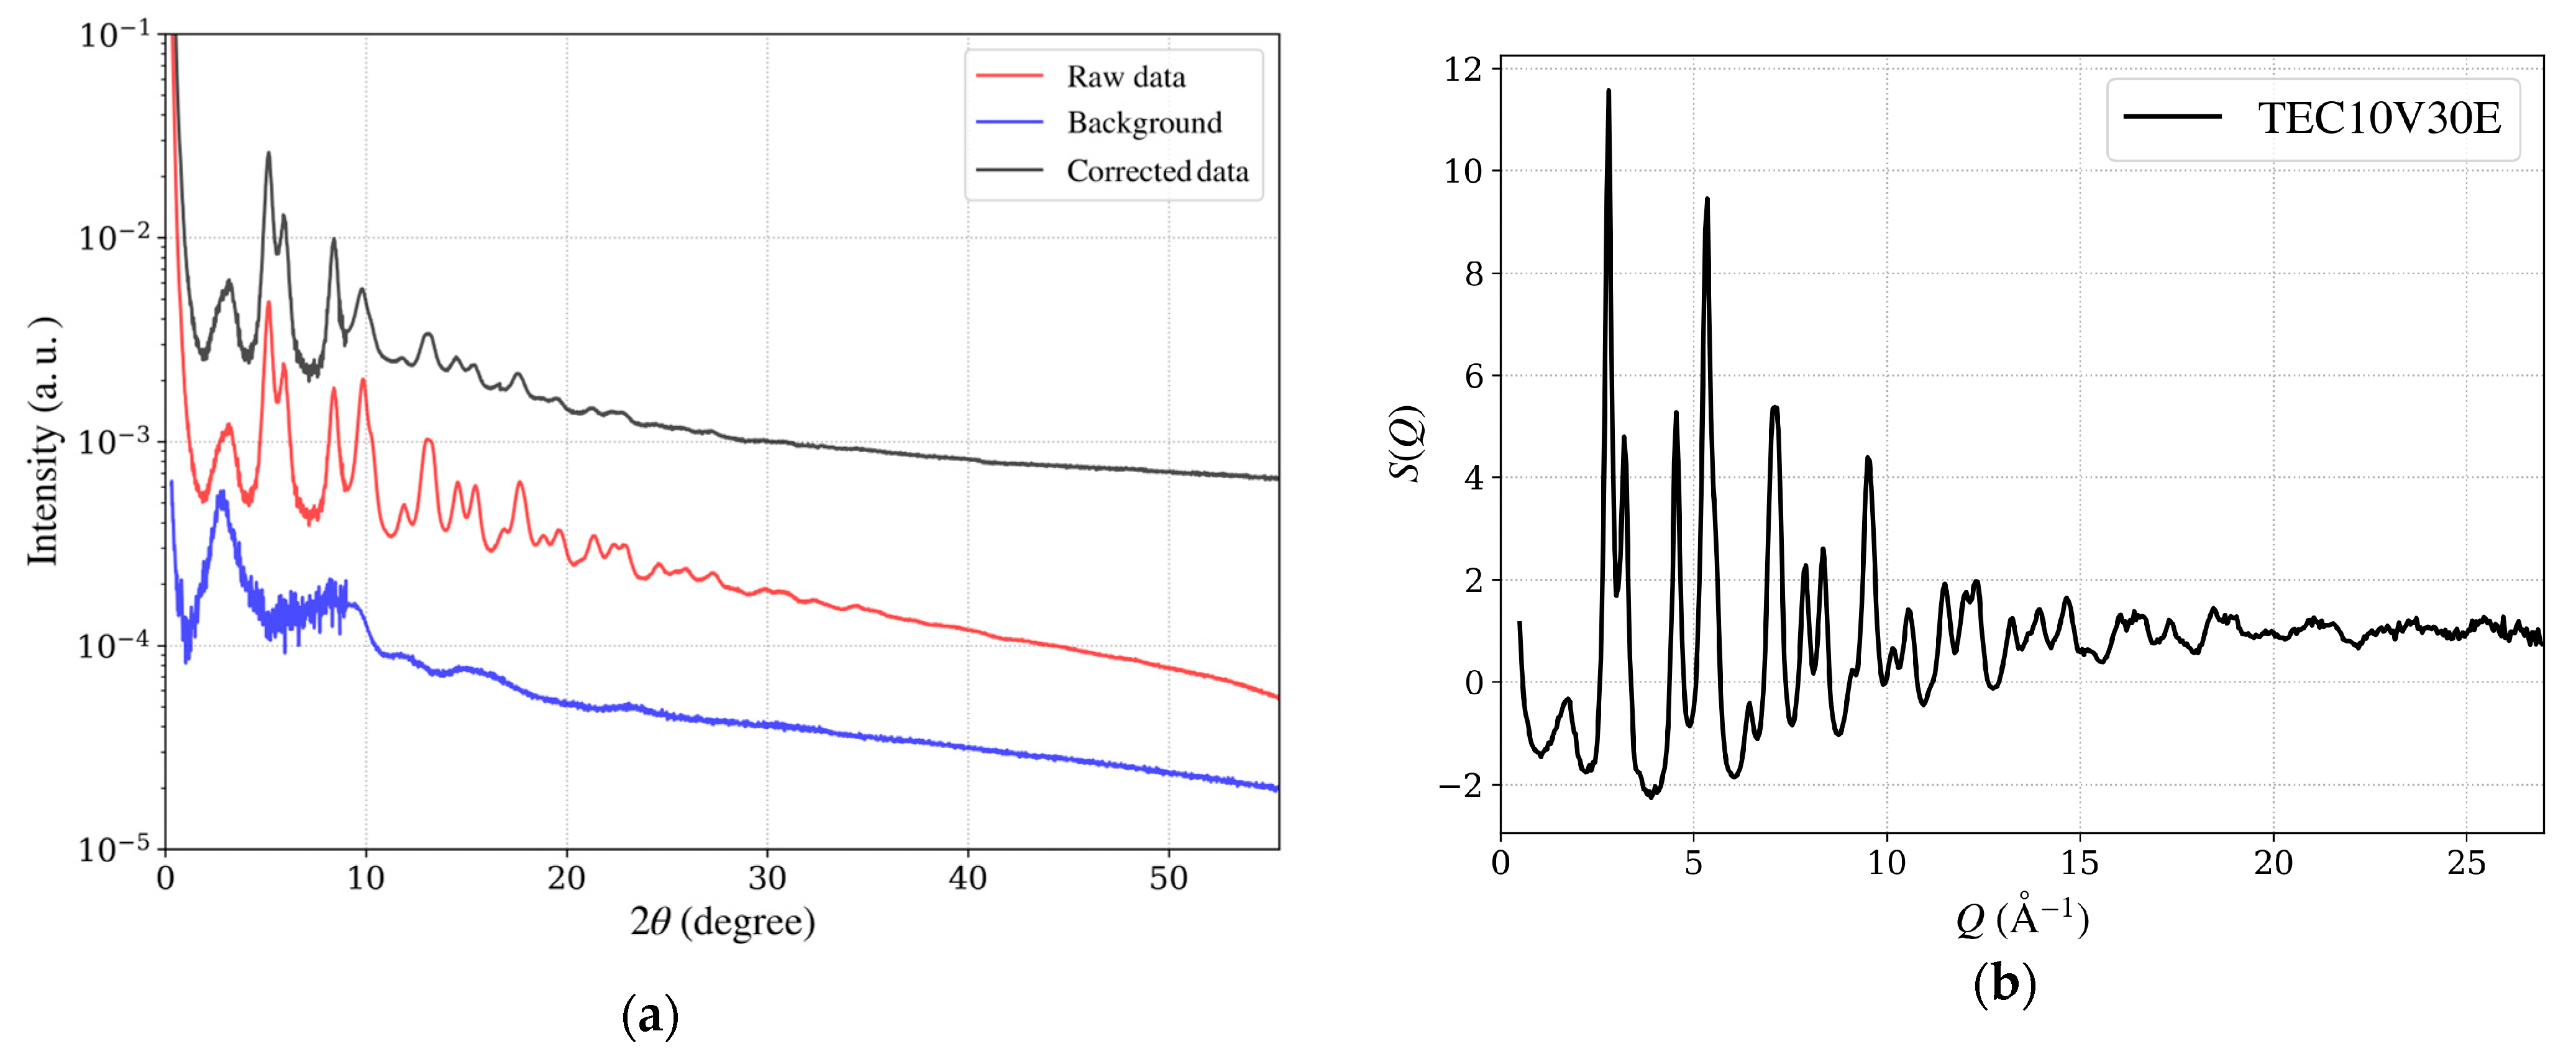
Applsci 15 03931 g010
Figure 11. (a) Intensity as a function of 2θ for the hydrogen-reduced TEC10V30E sample, supplied by TANAKA Precious Metals. The red line (Iobs) represents raw data, and the blue line (IBG) shows background data from a vacant quartz capillary, obtained by combining measurements from seven detectors positioned at different angles. The black line (Icorrected) indicates the corrected data, obtained after applying background subtraction and corrections for absorption and polarization. (b) The structure factor S(Q), emphasizing high Q oscillations.
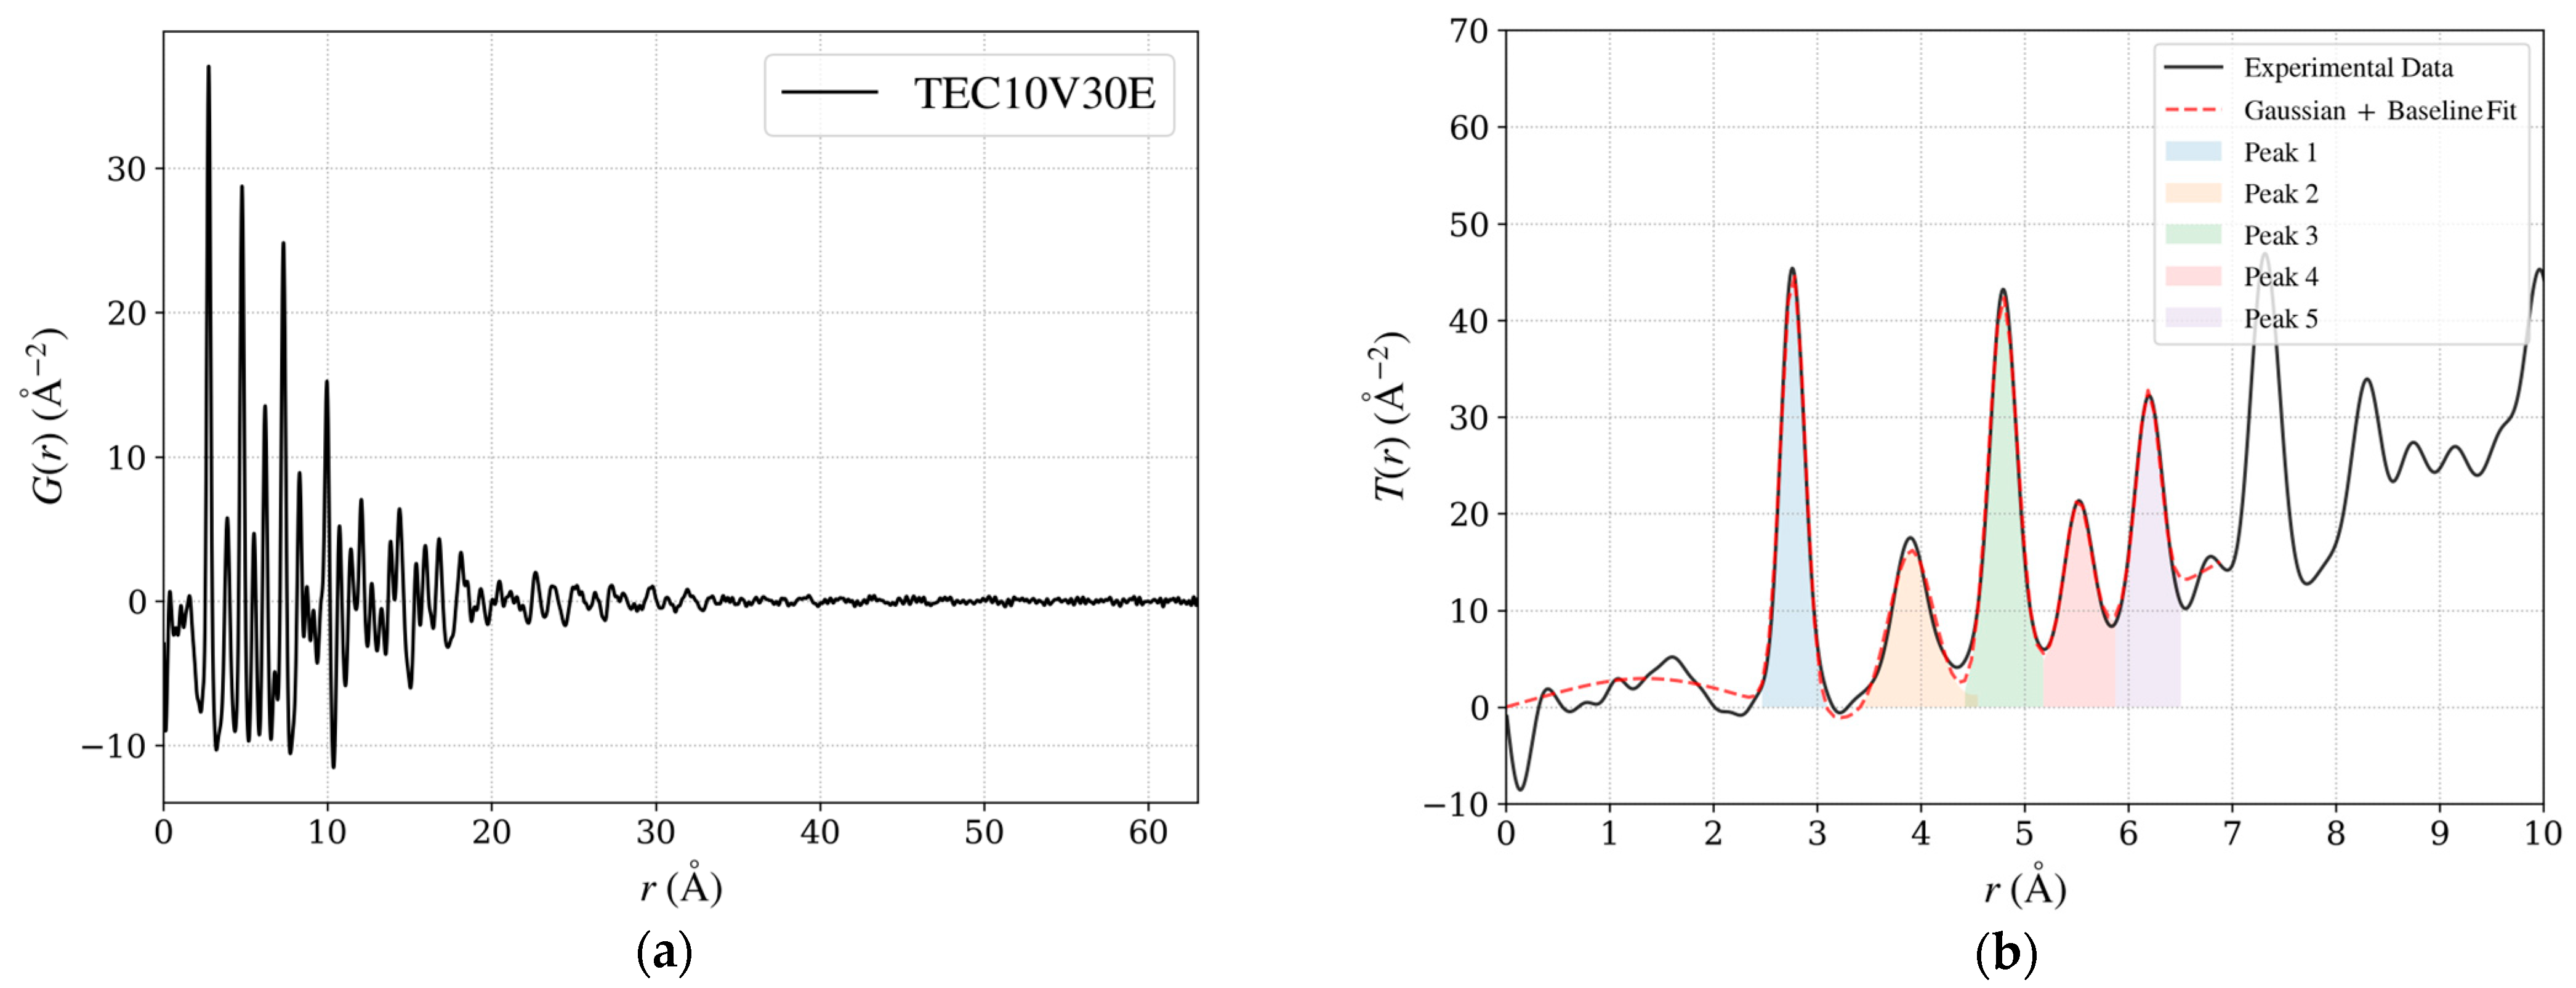
Applsci 15 03931 g011
Figure 12. (a) PDF G(r) for the standard sample TEC10V30E, a hydrogen-reduced material supplied by TANAKA Precious Metals. (b) T(r), where each peak is fitted using a Gaussian function combined with a baseline. The integration range for each peak, corresponding to ±3σ from the peak center where T(r) > 0, is highlighted with distinct background colors. The integrated values represent the relative coordination numbers, offering insights into local structural trends.
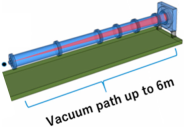
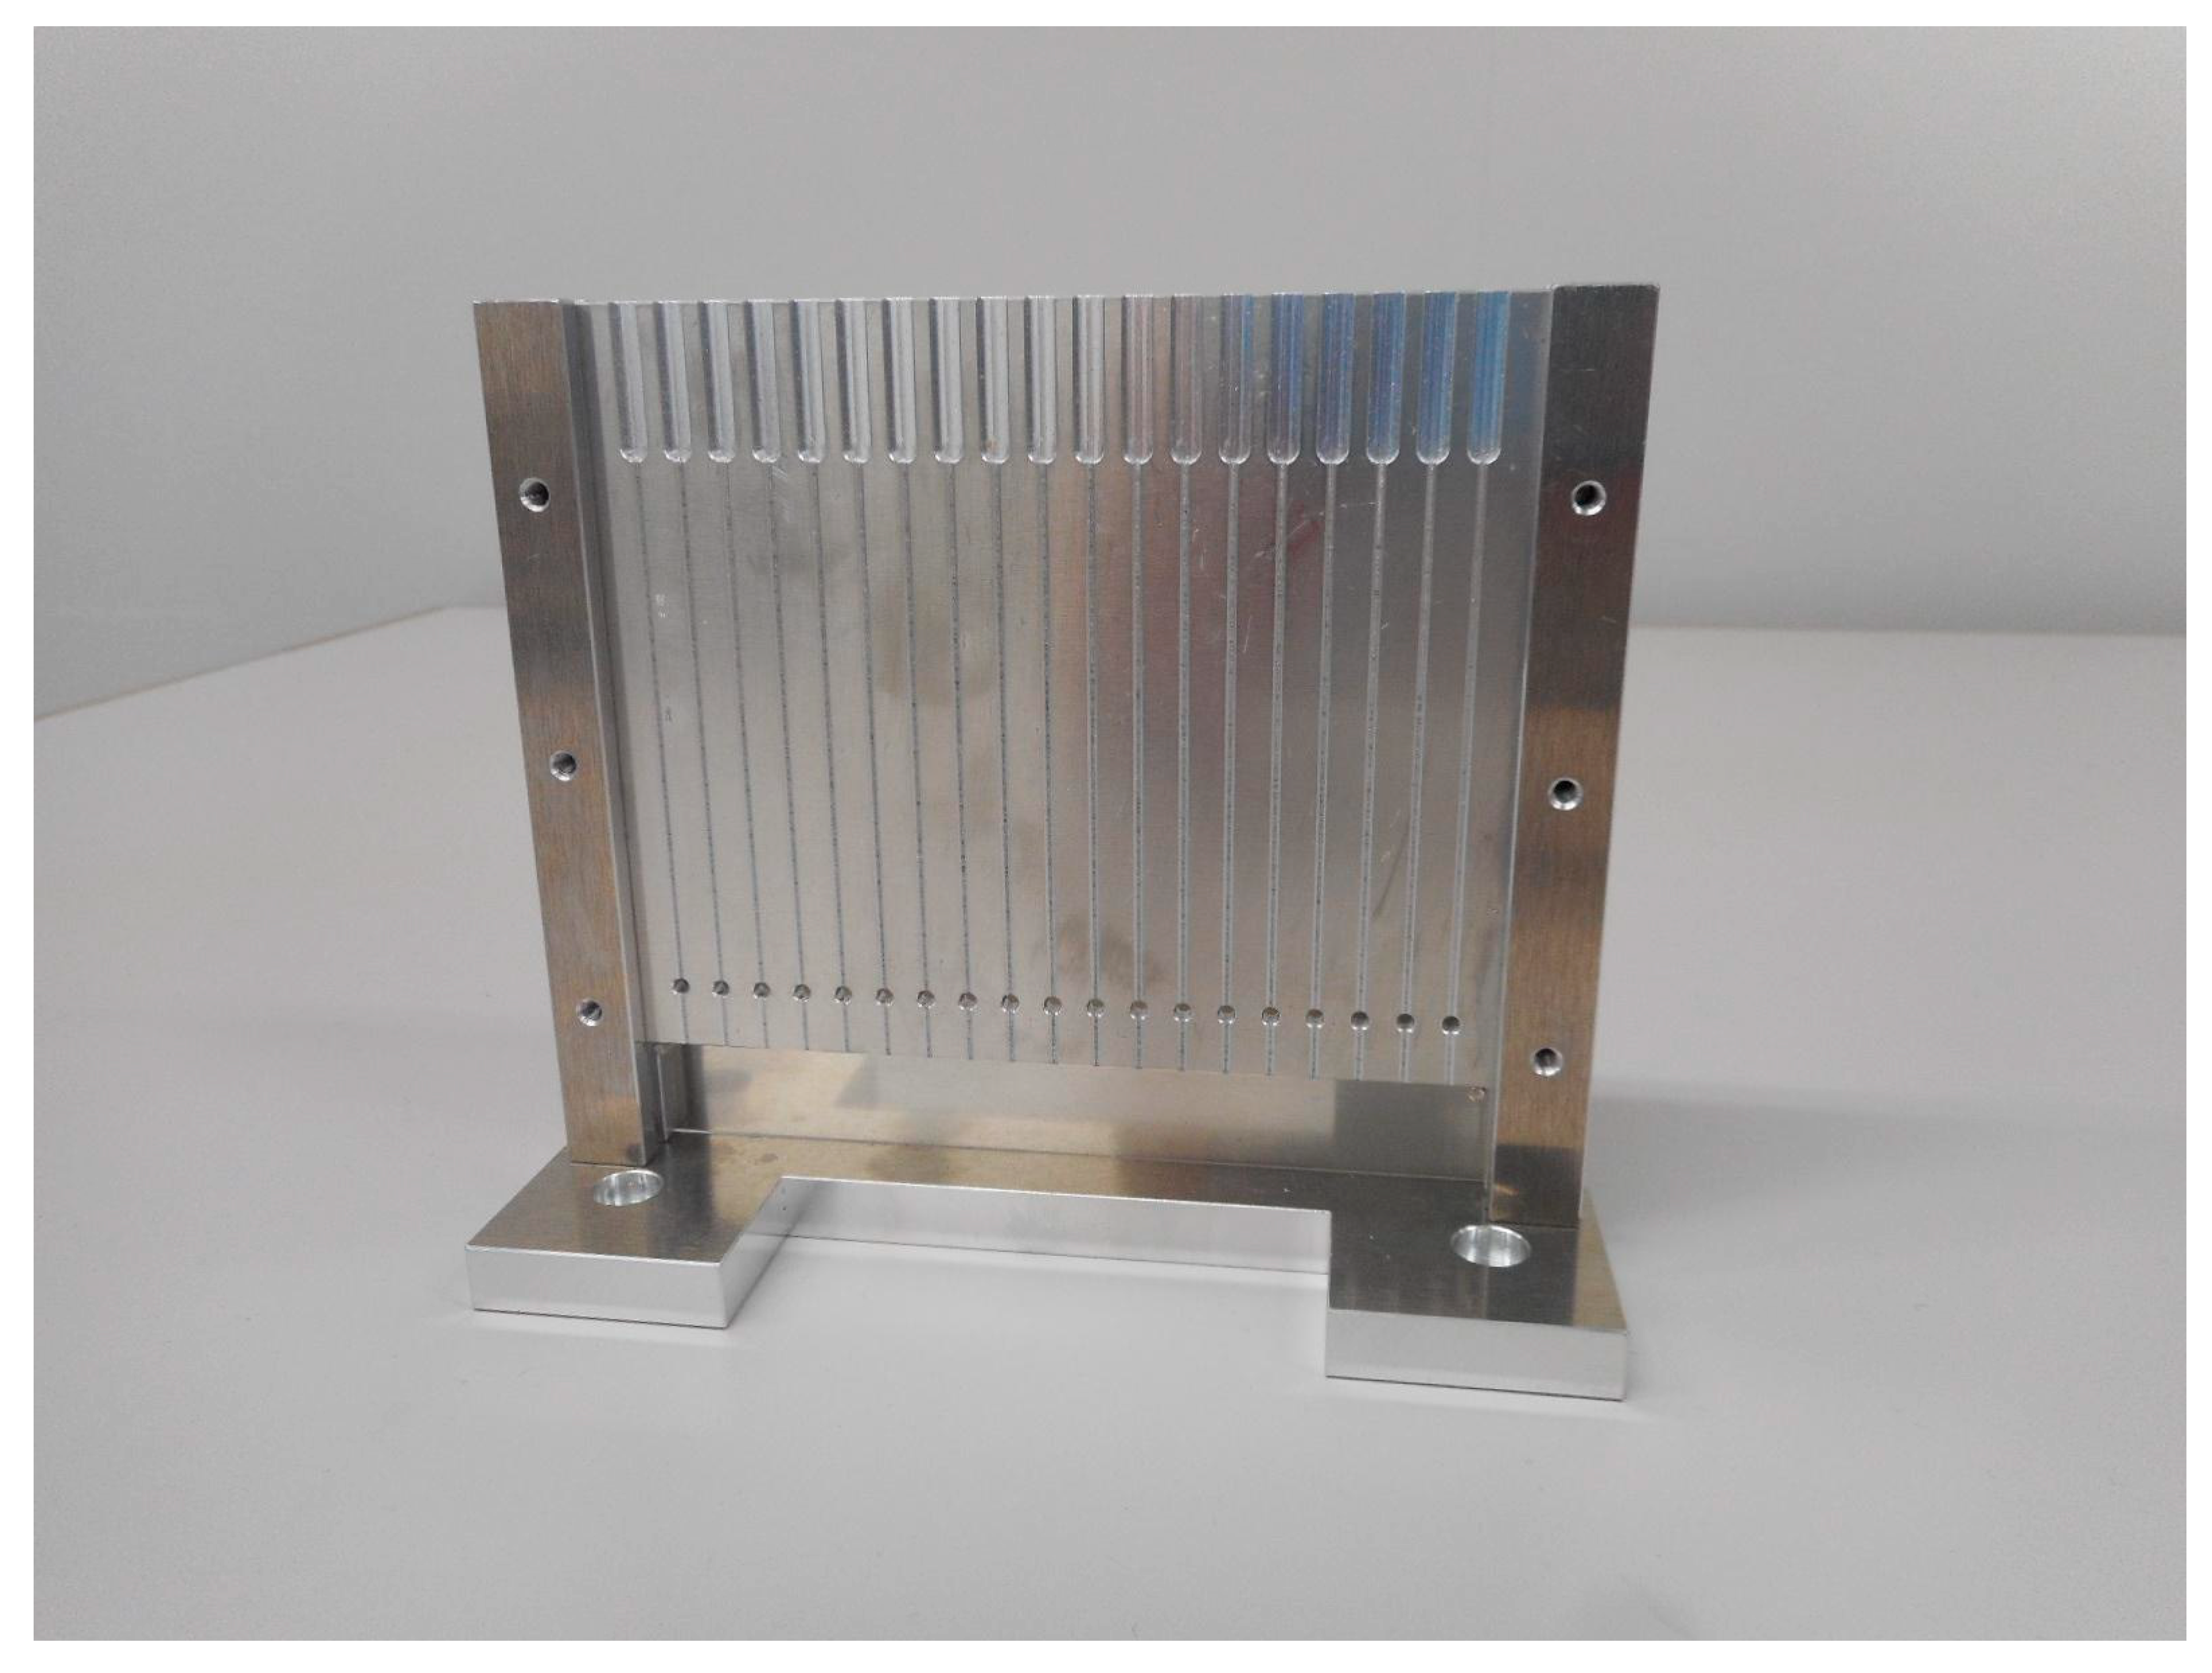
Applsci 15 03931 g012
Figure 13. Custom-designed cassette for holding capillaries during SAXS measurements. Each capillary is placed in a vertical groove, and X-rays pass through a small aperture aligned with the sample position, ensuring stable and reproducible sample orientation for scattering measurements.
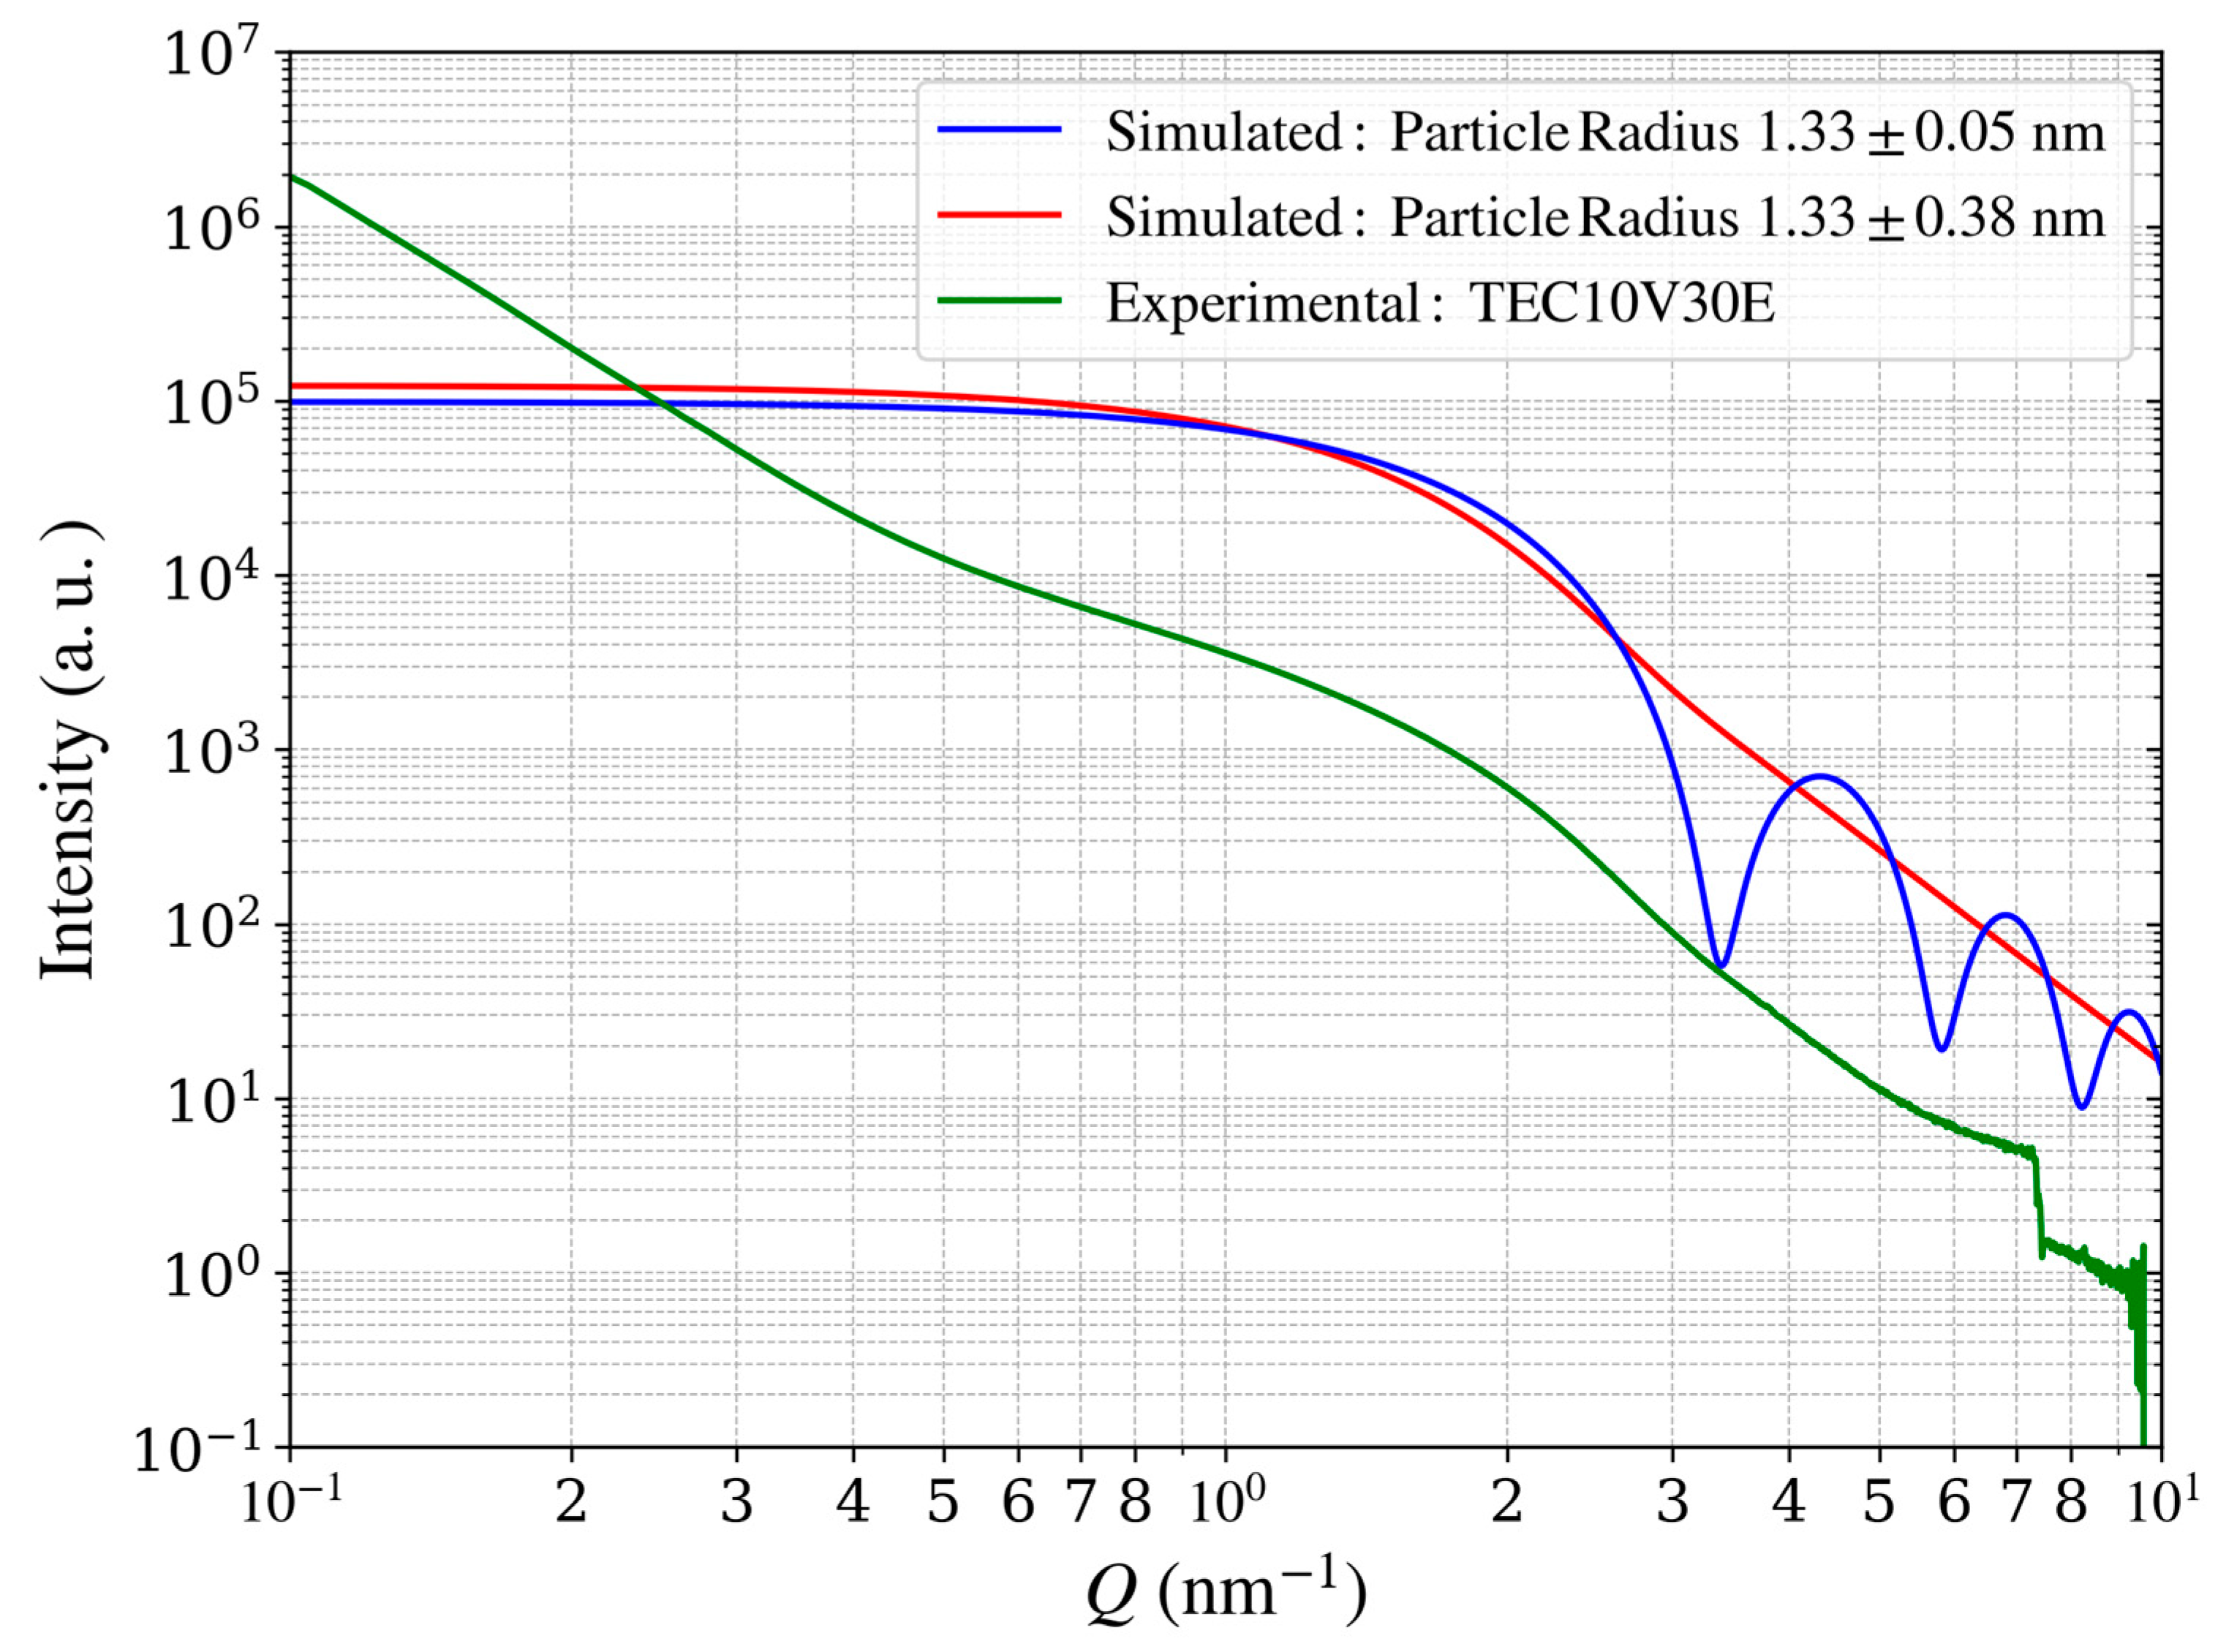
Applsci 15 03931 g013
Figure 14. Measured and simulated scattering intensity profiles of Pt catalysts. The green curve shows experimental data for carbon-supported Pt catalysts (TEC10V30E, supplied by TANAKA Precious Metals), while the blue and red curves represent simulated profiles of Pt catalysts without carbon support, sharing an identical mean particle radius (1.33 nm). Varying the radius distribution (standard deviations of 0.05 and 0.38 nm) illustrates the effect of particle size dispersion on the scattering profile.
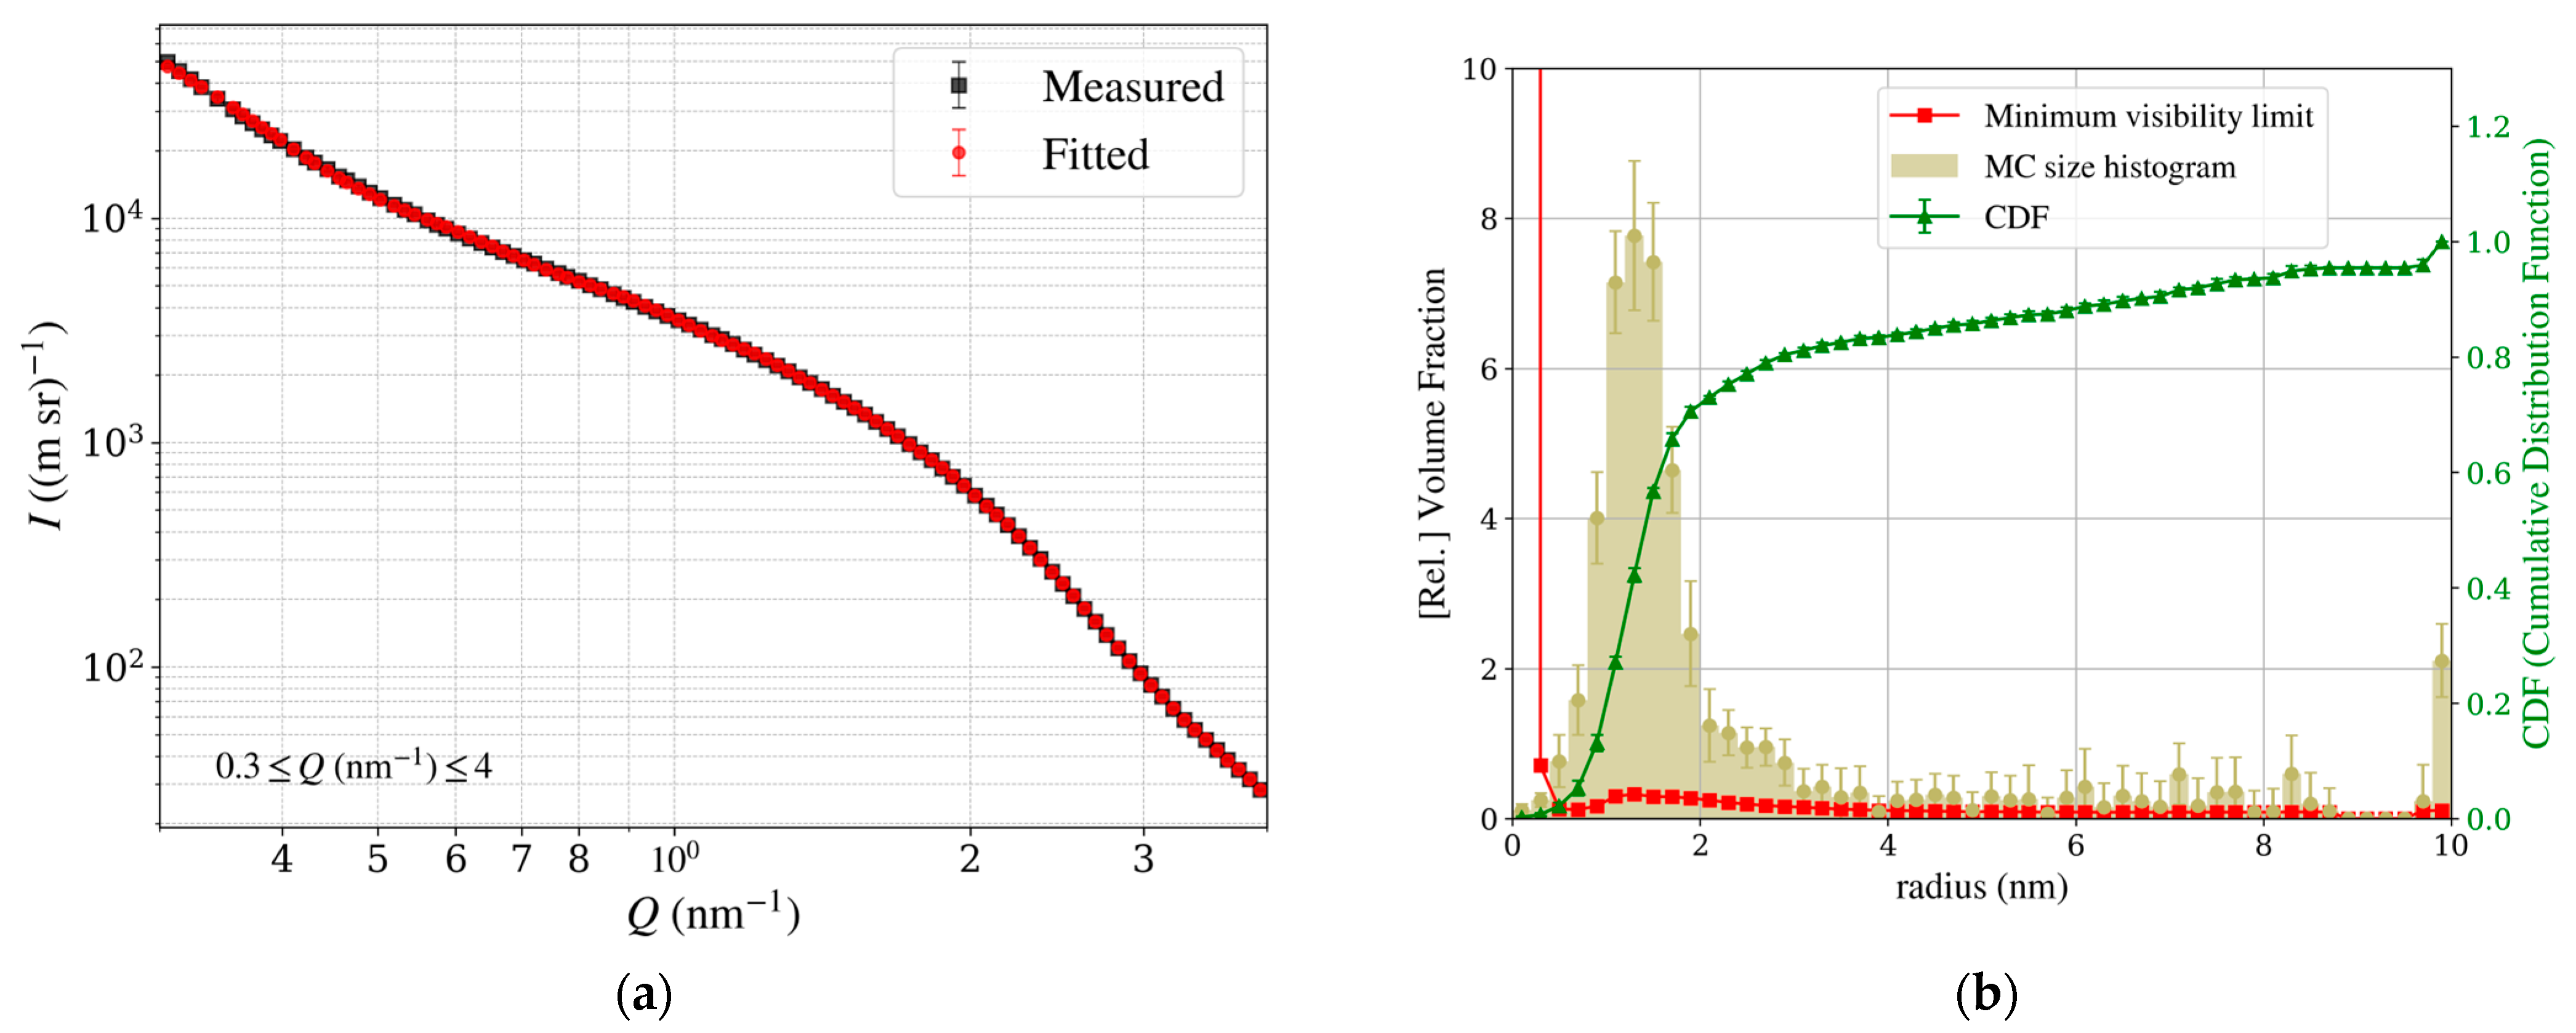
Applsci 15 03931 g014
Figure 15. Results of the McSAS analysis of the Pt particle size distribution in TEC10V30E, supplied by TANAKA Precious Metals. (a) Measured scattering profile in the Guinier region (black) with the fitted curve (red), showing excellent agreement, with the fitted curve predominantly obscuring the measured data. (b) Particle size distribution as a histogram, with a Gaussian fit yielding a mean particle radius of 1.33 ± 0.38 nm, where the value is expressed as mean ± S.D., reflecting the structural uniformity of the catalyst nanoparticles.
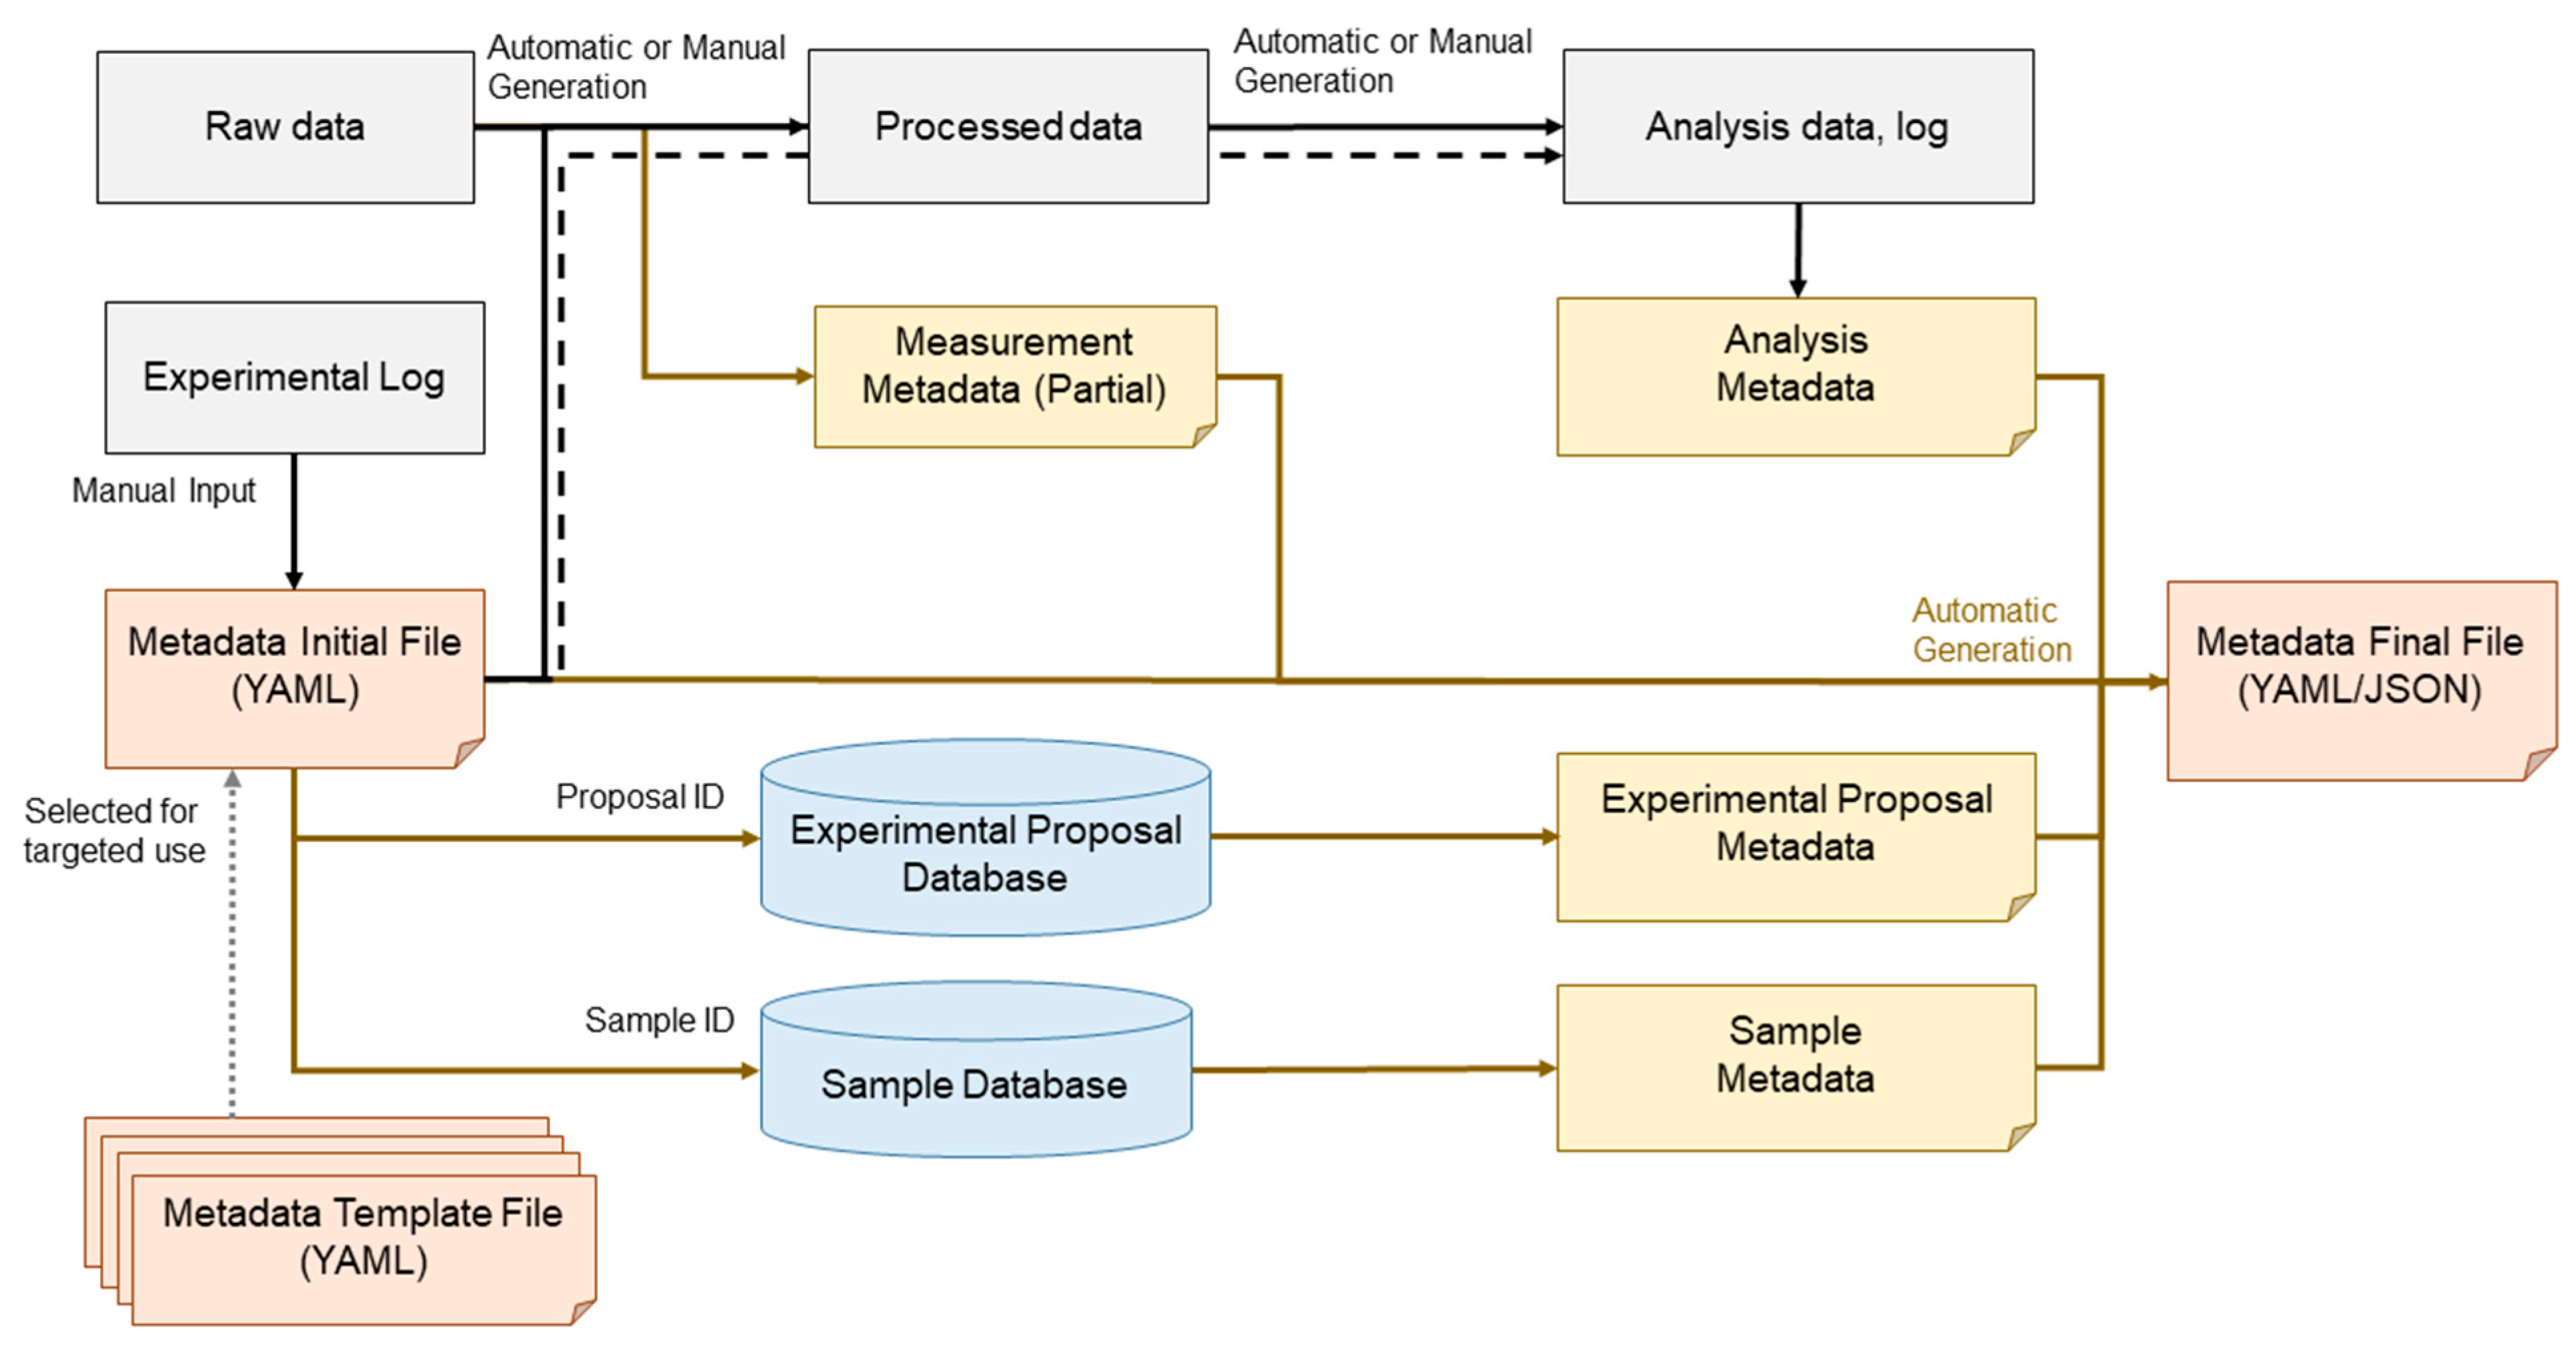
Applsci 15 03931 g015
Figure 16. Overview of metadata, processed data, and analysis data generation workflow. This figure illustrates the sequential steps from raw data acquisition to metadata annotation, data processing, and subsequent analysis, ensuring data traceability, reproducibility, and integration within the research framework.
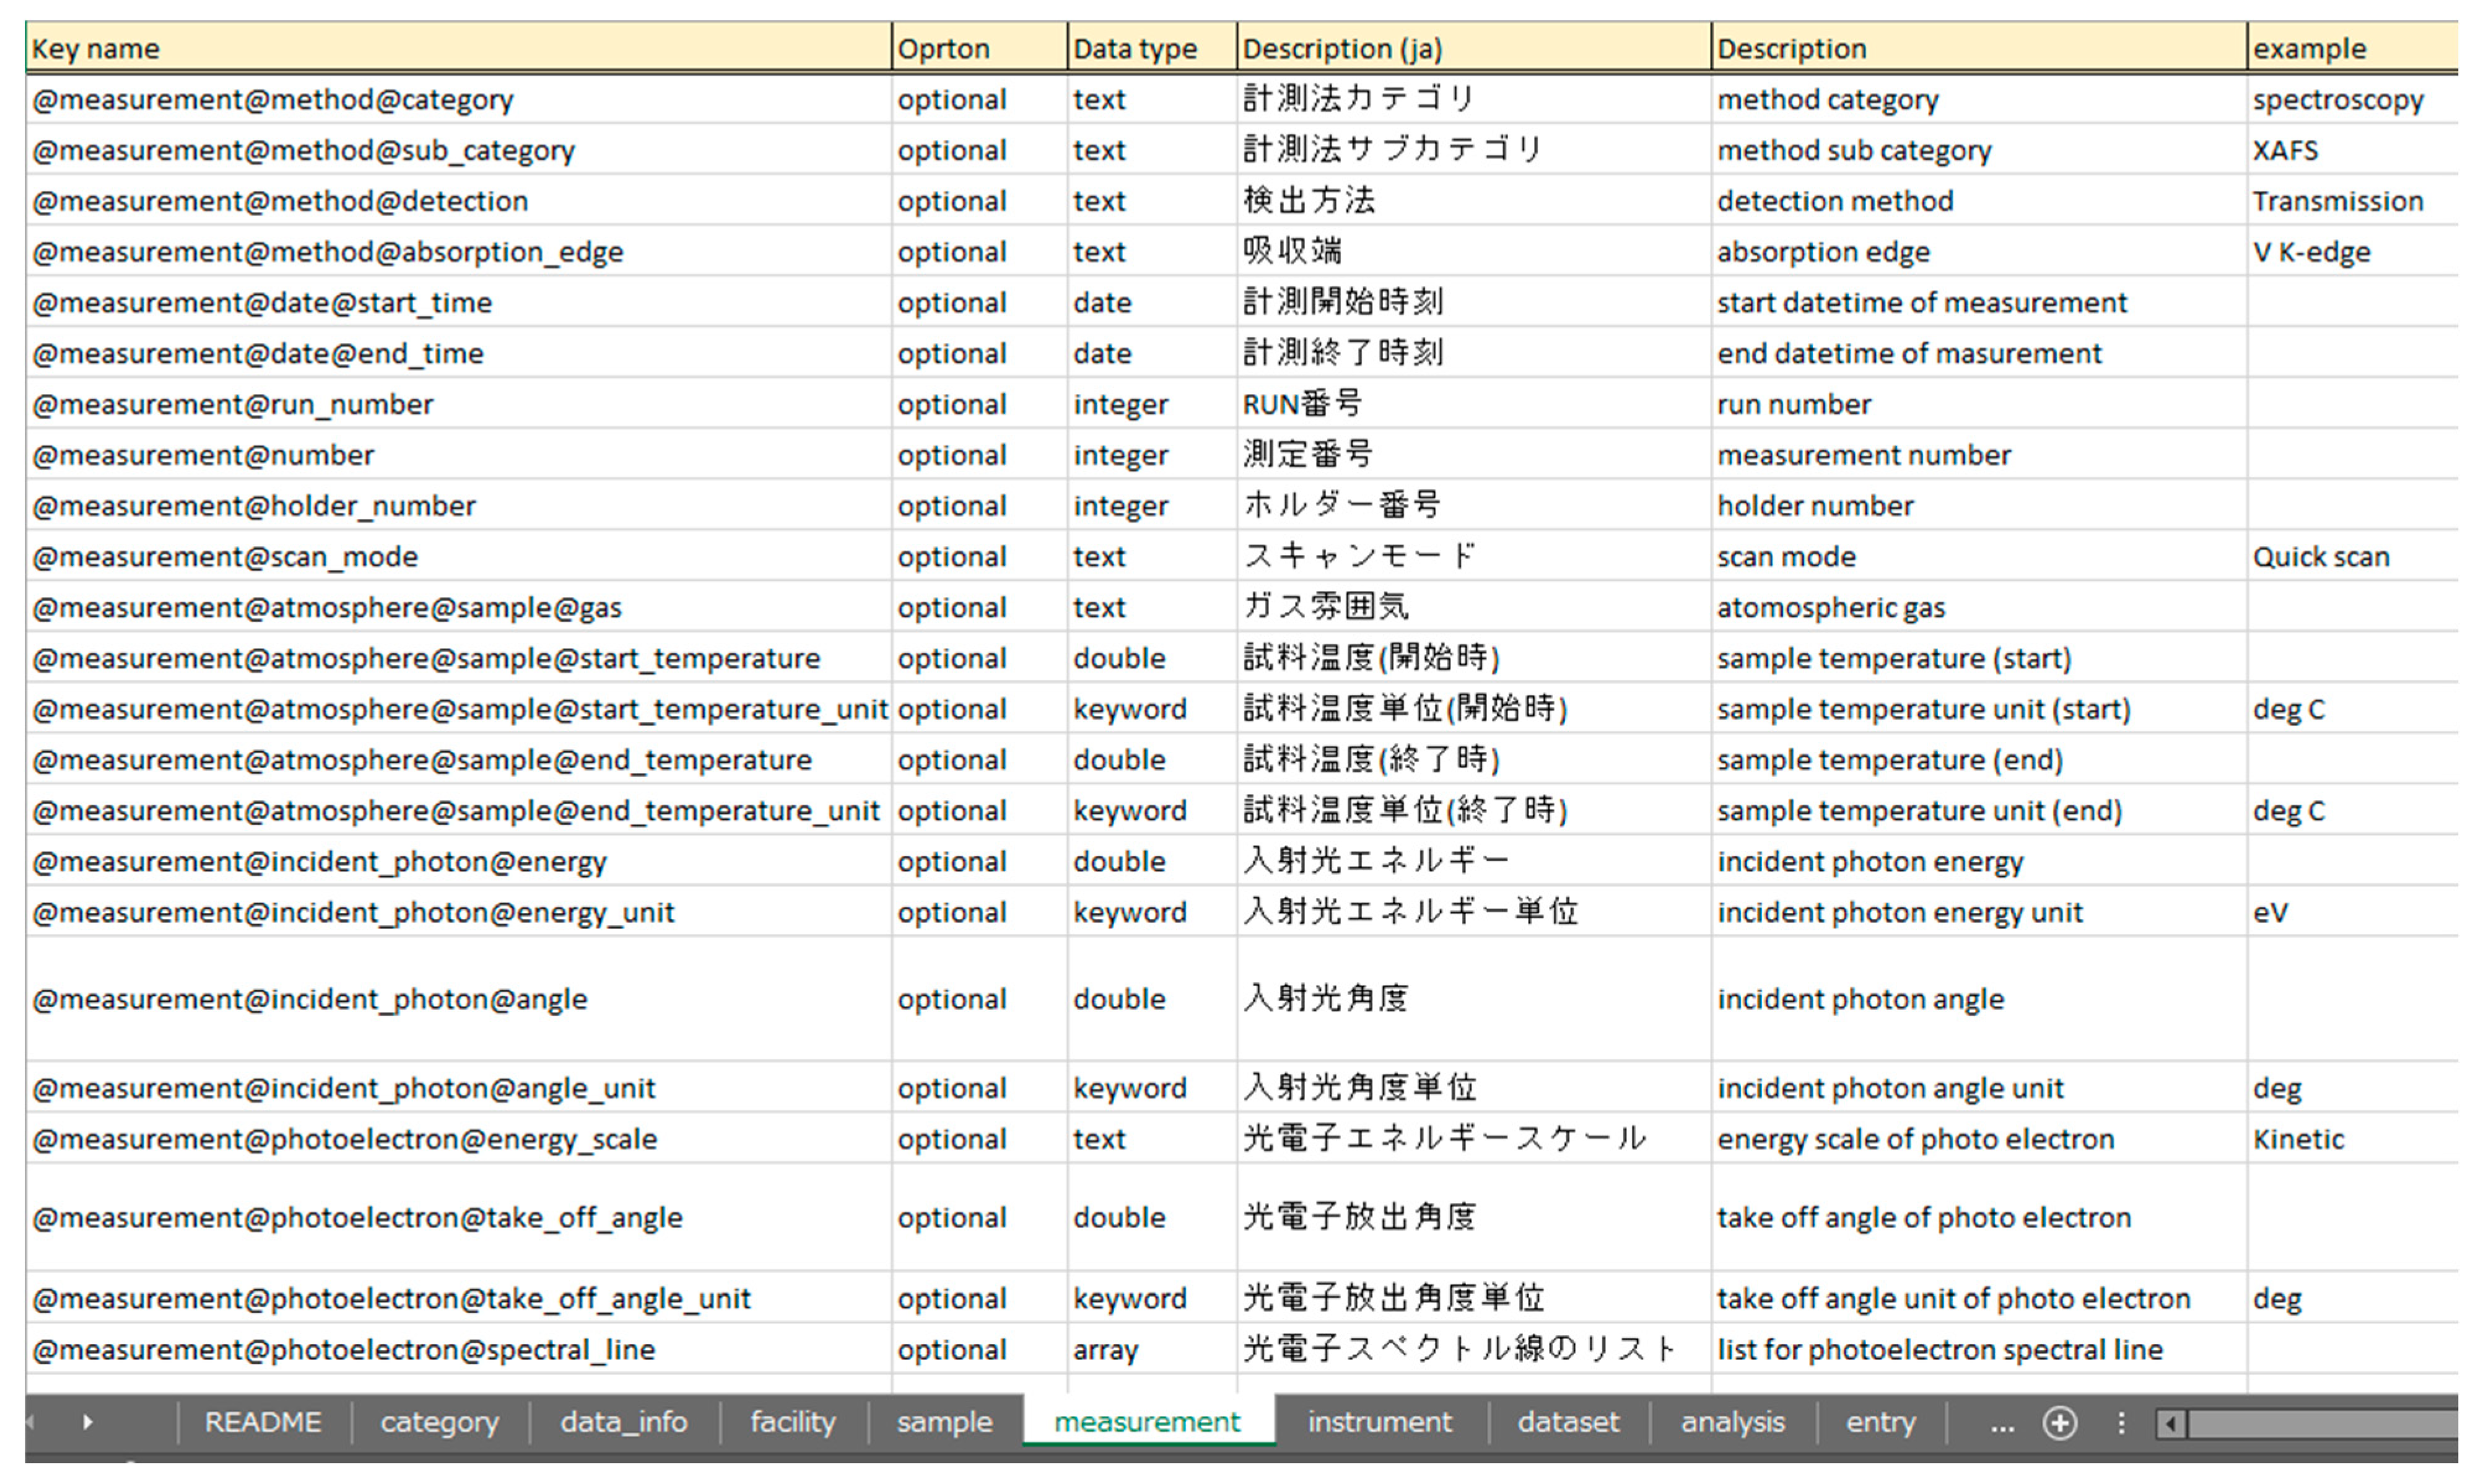
Applsci 15 03931 g016
Figure 17. Metadata schema defined in an Excel file. Each category (data_info, facility, sample, measurement, instrument, dataset, analysis, entry) is represented as a separate sheet, detailing mandatory/optional status, data types, descriptions, and usage examples. A corresponding JSON schema is automatically generated from the Excel metadata to enable streamlined validation.
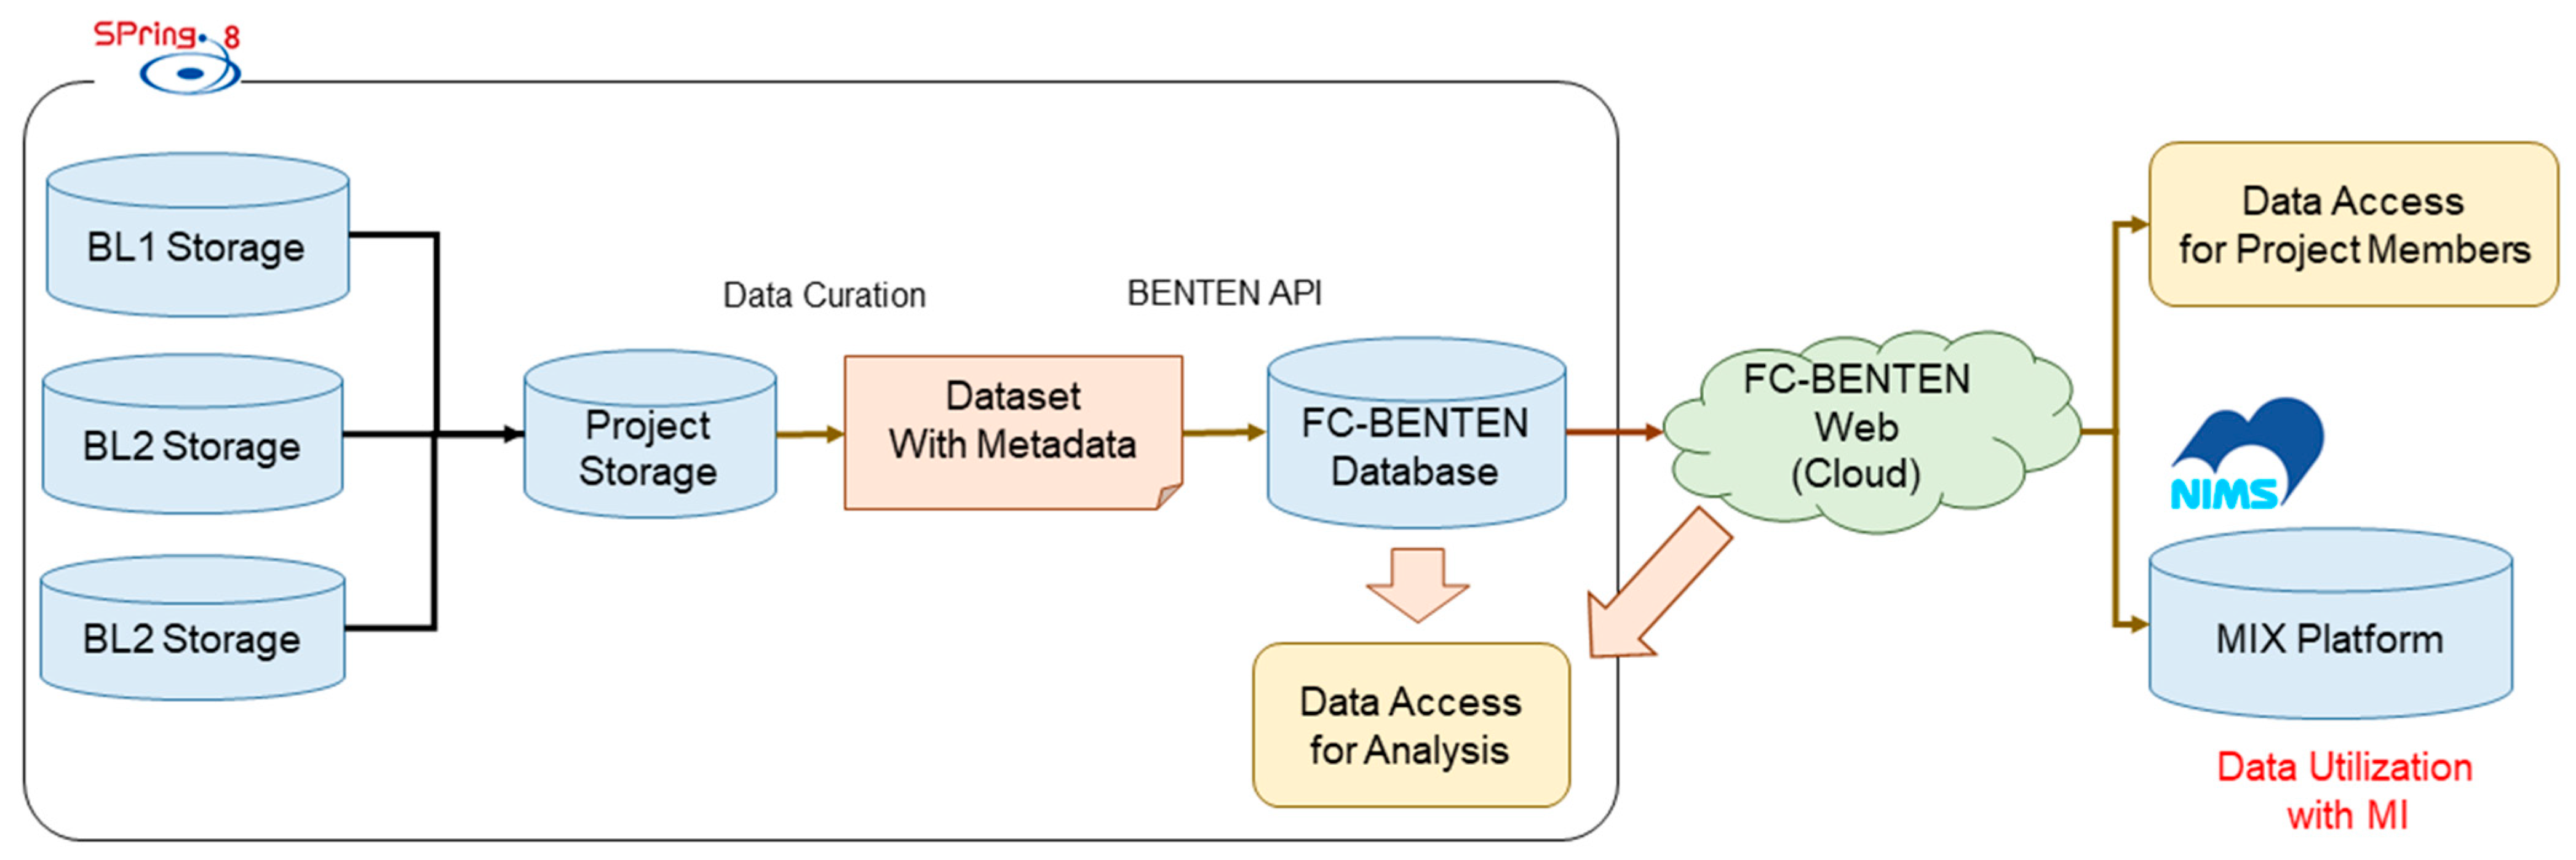
Applsci 15 03931 g017
Figure 18. Overview of data management using the BENTEN platform. Beamline-collected datasets are curated and annotated with metadata before database registration. The curated data are made available for analysis via a web interface and can be transferred to the NIMS MIX platform for advanced MI-based evaluations.
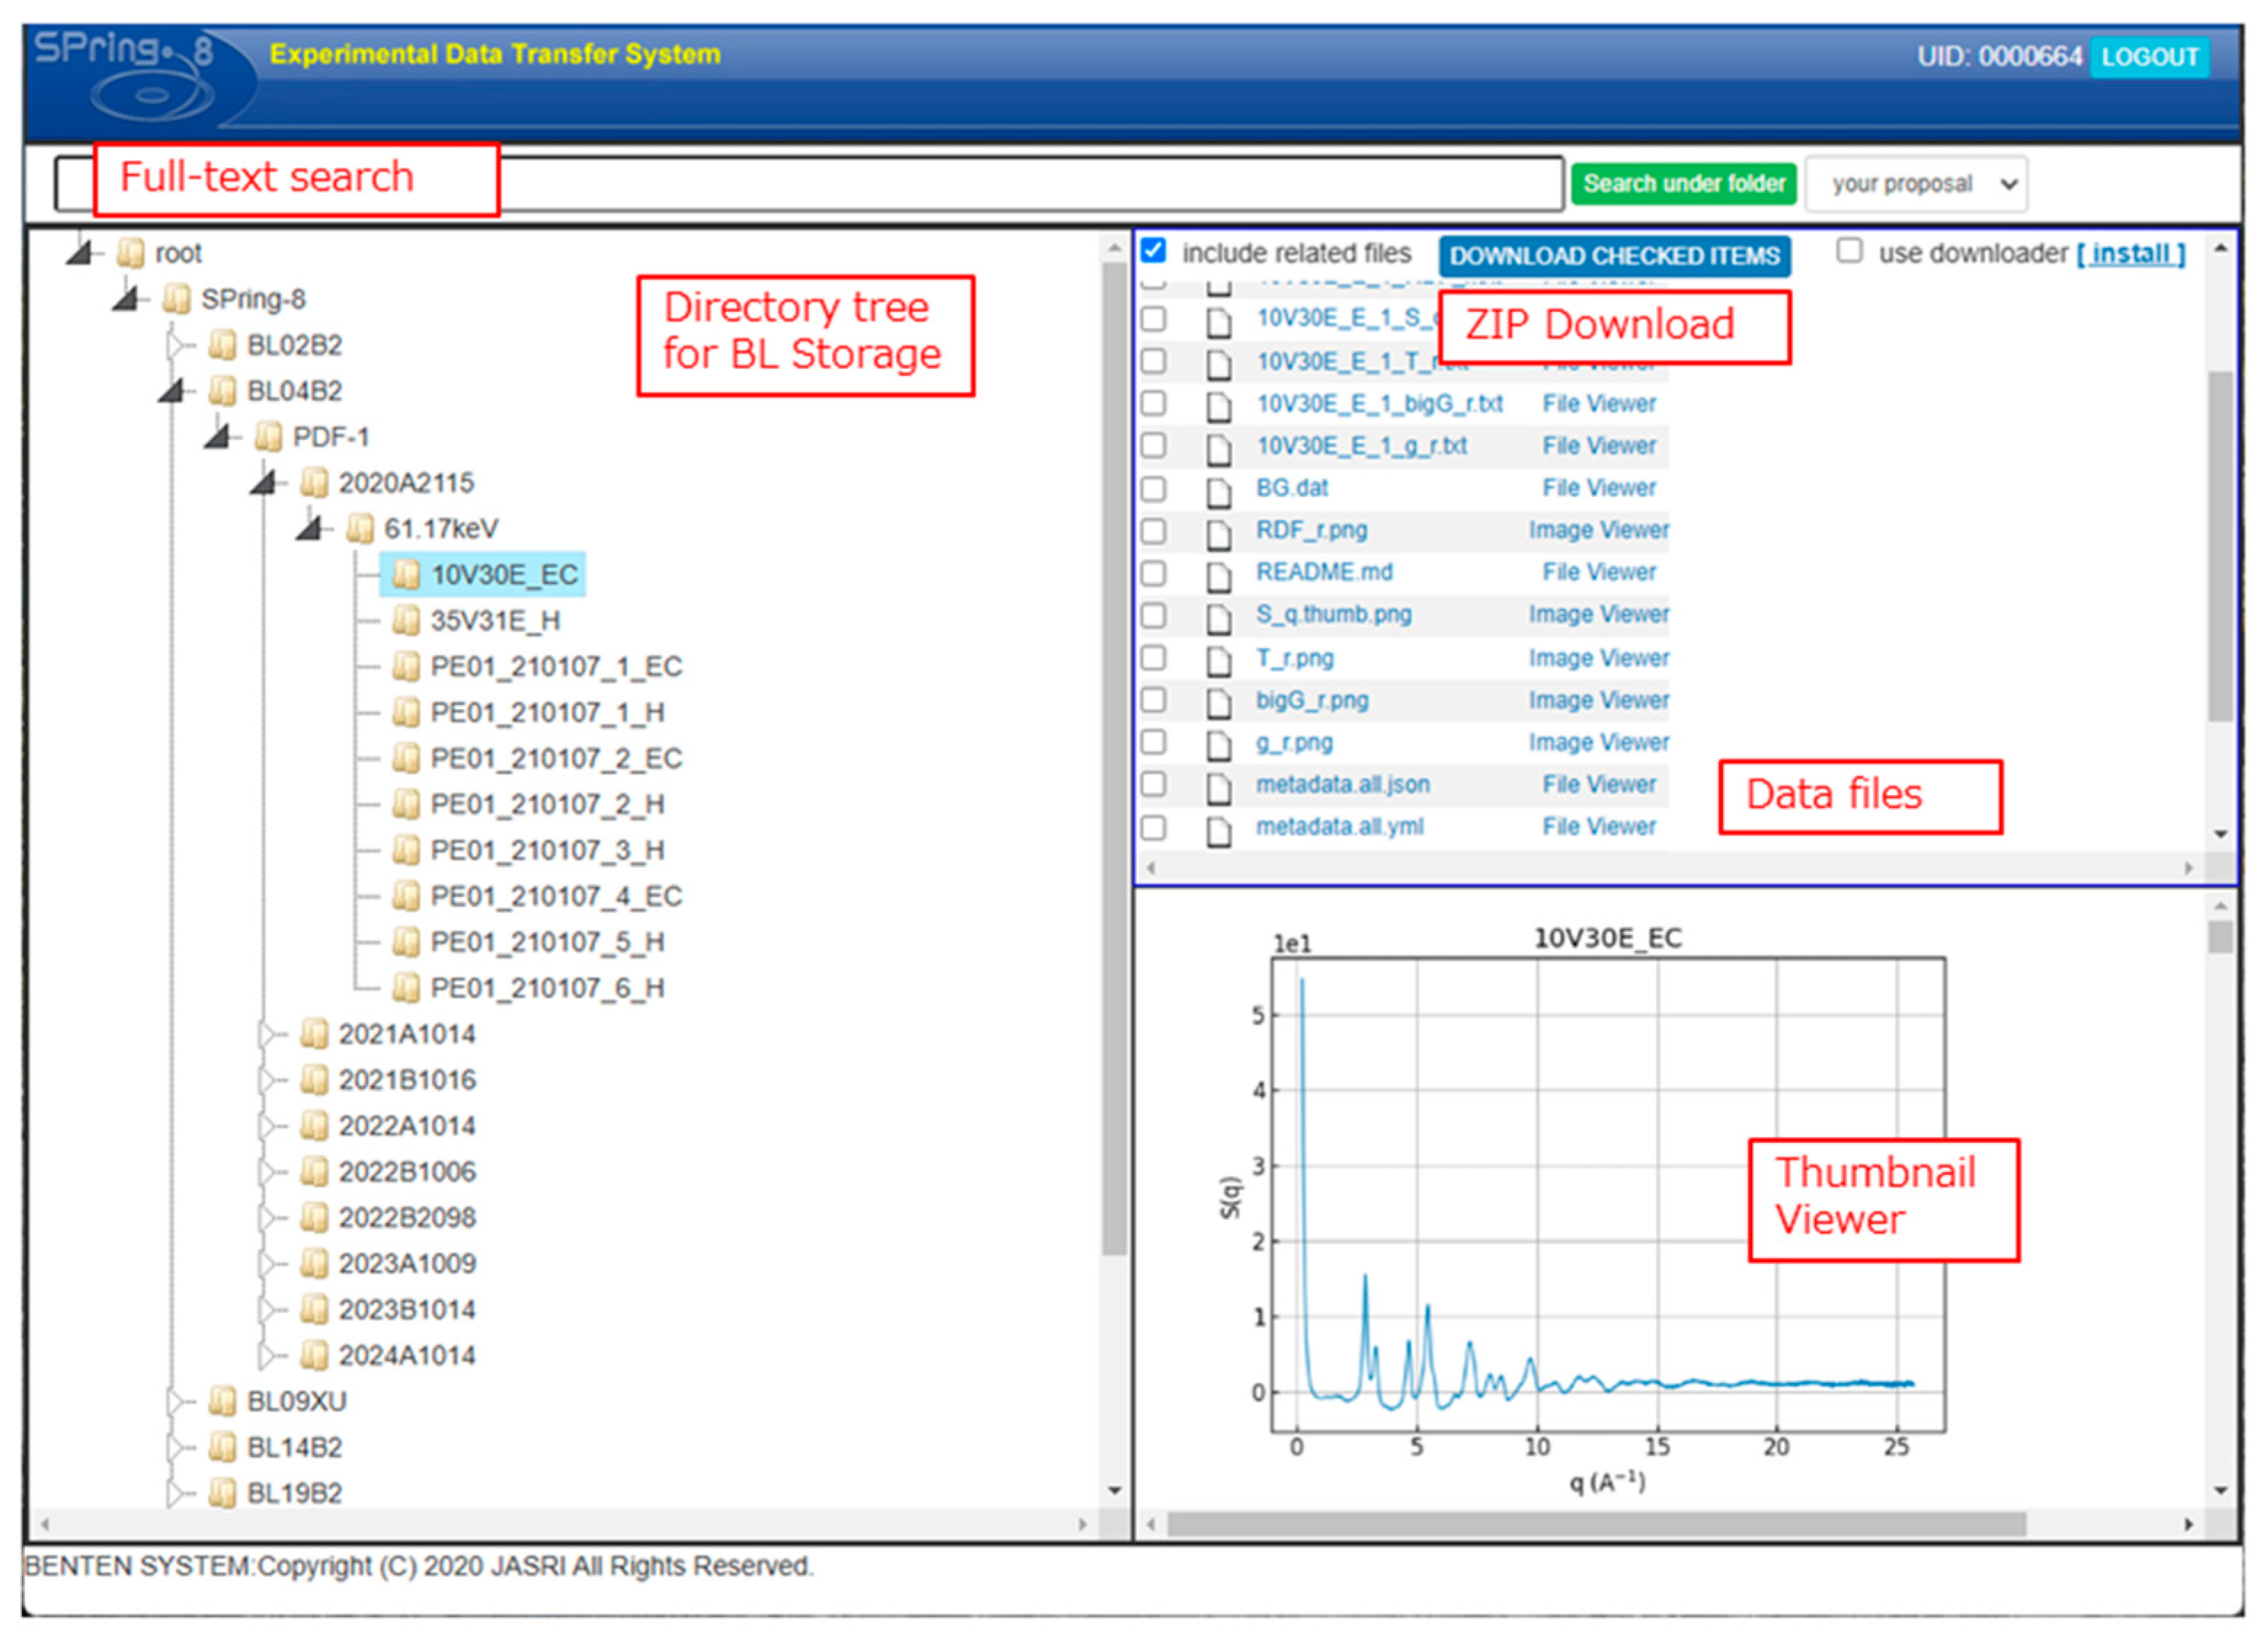
Applsci 15 03931 g018
Figure 19. FC-BENTEN web interface for data access (https://fcbenten.jasri.jp/, accessed on 26 March 2025). The directory structure on the left panel and full-text search functionalities streamline dataset navigation. The upper-right pane lists files, while the lower-right pane displays thumbnails or spectra previews, facilitating rapid and informed dataset selection.
Applsci 15 03931 g019
Table 2. Metadata elements categorized by sample type, focusing on those submitted for analysis. This table identifies required metadata fields common to all samples as well as those specific to catalysts and electrolyte membranes. Comprehensive metadata ensures accurate documentation of sample characteristics and experimental context.
CategoryElementRemarks
CommonSample IDUnique identifier for the sample
Sample NameDesignated name of the sample
Sample Preparation DateDate the sample was prepared
Responsible PersonName and affiliation of the person responsible for the sample
RemarksAdditional notes or observations
For CatalystsCatalyst StructureStructural details of the catalyst
Catalyst LoadingWeight percentage (wt%)
Elemental CompositionComposition of elements in the catalyst
Crystal Structure and HomogeneityInformation on crystallinity and uniformity
Catalyst Particle SizeAverage particle size (nm)
Support Material and Surface TreatmentType of support material and any applied surface treatments
Loading MethodMethod used to load the catalyst onto the support
Synthesis ConditionsRaw materials and synthesis details
Additives and Surface TreatmentsDetails of additives, surface modifications, and their quantities
Post-Treatment ProcessesInformation on processes such as heat or acid treatments
Aging ConditionsPresence and details of any aging treatment
For Electrolyte MembranesChemical StructureMolecular structure of the material
Membrane StructureMorphology of the membrane
Membrane ThicknessMeasured in micrometers (μm)
Ion Exchange CapacityEquivalent weight (EW)
Membrane ResistanceElectrical resistance (Ω·cm2)
Gas PermeabilityPermeability in cm3/(cm2·s·kPa)
Glass Transition/Softening TemperatureTemperature (°C)
Water Content and Volume ExpansionHydration levels and volumetric changes (%)
DurabilityDurability metrics under specified conditions
Table 3. Selected analytical metadata and utilized data for key measurement techniques. This table summarizes key analytical metadata elements (e.g., coordination number, binding energy, lattice constant, particle size distribution) and the corresponding utilized data (e.g., normalized μt, intensity profiles, G(r)), highlighting the information derived from each measurement technique and its role in data analysis and interpretation.
Measurement TechniqueAnalytical Metadata ElementsUtilized Data
XAFSCoordination Number, Bond Distance, Debye–Waller Factor, R factorNormalized μt, χ(k), χ(R)
HAXPESBinding Energy Peak and Width (FWHM), d-band centerBinding Energy Profile
XRDCrystal Structure Phase, Lattice Constant, Atomic Displacement, Occupancy Rate, Crystallite Diameter, Rwp, SIntensity Profile
PDFInteratomic Distance, Relative Coordination Number, Peak Area (1st–5th peaks) from T(r)S(Q), G(r), T(r), g(r), RDF(r)
SAXSParticle Radius, Size Distribution, and WidthIntensity Profile and Particle Size Distribution
Table 4. Overview of datasets in the FC-BENTEN database, showcasing its comprehensive data coverage and research utility. This table summarizes the number of analysis-requested samples, corresponding datasets, and total datasets collected using various measurement techniques, including XAFS, HAXPES, XRD, PDF, SAXS, and CV. The “Total” for “Number of Analysis-Requested Samples” (567) includes overlapping samples that were analyzed using multiple measurement techniques. When excluding such overlaps, the number of unique samples amounts to 202. The data exemplify the database’s systematic approach to capturing diverse analytical parameters, supporting advanced research into the structural and electronic properties of PEFC materials.
Measurement TechniqueNumber of Analysis-Requested SamplesNumber of Datasets for Analysis-Requested SamplesTotal Number of Datasets
XAFS79196272
HAXPES858731298
XRD144234358
PDF110178235
SAXS128205366
CV (Electrochemical)212143
Total56717072572
Table 5. Sample list showing Pt (wt%), Co (wt%), C (wt%), and carbon support types for the analyzed materials. All samples were obtained from TANAKA Precious Metals. Samples TEC35V31E, TEC36E52, and TEC36F52 were Pt–Co-based, whereas the other samples were Pt-based. The Carbon supports were classified as solid spheres (Vulcan XC72, Acetylene black) or hollow spheres (Ketjenblack, Graphitized Ketjenblack).
Sample NamePt (wt%)Co (wt%)C (wt%)Carbon Support
TEC10V30E28.90.071.1Vulcan XC72
TEC10V50E46.50.053.5Vulcan XC72
TEC10E30E30.00.070.0Vulcan XC72
TEC10E50E46.30.053.7Ketjenblack
TEC10EA50E46.80.053.2Graphitized Ketjenblack
TEC10F30E27.20.072.8Acetylene black
TEC10F50E46.30.053.7Acetylene black
TEC35V31E29.62.268.2Vulcan XC72
TEC36E5246.25.248.6Ketjenblack
TEC36F5247.44.947.7Acetylene black
Disclaimer/Publisher’s Note: The statements, opinions and data contained in all publications are solely those of the individual author(s) and contributor(s) and not of MDPI and/or the editor(s). MDPI and/or the editor(s) disclaim responsibility for any injury to people or property resulting from any ideas, methods, instructions or products referred to in the content.

