Article

The Impact of GoLo Technology on the Quality Properties of Dealcoholised Wines

by
Juan José Cuenca-Martínez
1,
José Manuel Veiga-del-Baño
1,
Cristina Cebrián-Tarancón
2,
Rosario Sánchez-Gómez
2,
José Oliva
1 and
Pedro Andreo-Martínez
1,*
1
Department of Agricultural Chemistry, Faculty of Chemistry, Regional Campus of International Excellence “Campus Mare Nostrum”, University of Murcia, Campus of Espinardo, 30100 Murcia, Spain
2
Cátedra de Química Agrícola, E.T.S. de Ingeniería Agronómica y de Montes y Biotecnología, Universidad de Castilla-La Mancha, Avda. de España s/n, 02071 Albacete, Spain
*
Author to whom correspondence should be addressed.
Appl. Sci. 2025, 15(7), 3867; https://doi.org/10.3390/app15073867
Submission received: 28 February 2025 / Revised: 26 March 2025 / Accepted: 28 March 2025 / Published: 1 April 2025
(This article belongs to the Special Issue Wine Chemistry)

Abstract

:
Winemakers are increasingly adopting partial or total dealcoholisation of wines and alcoholic beverages in response to market trends and the impact of climate change on wine alcohol content. In this study, the patented very low-temperature vacuum wine distillation technology known as GoLo was used to dealcoholise various types of red, white, and rosé wines from different Spanish designations of origin (DOs) in order to examine changes in oenological parameters as pH, sulphites, total acidity, volatile acidity, and sugars and the perceptible differences among a set of wines through sensory analysis and the chemical analysis related, such as turbidity, total phenolic content, and a profile of volatile compounds. The results indicate that there is an increase in the overall polyphenol content in the range of 8 to 12%, turbidity increased in the range of 13 to 70%, and sulphites decreasing in the range of 20 to 40%. The aroma profile also reveals that the most volatile and less soluble compounds—such as esters (reduction between 60% and 96%), terpenes (reduction between 45% and 80%), and aldehydes (reduction between 86% and 95%)—are lost in varying percentages during the dealcoholisation process, depending on the type of wine. Meanwhile, other more soluble compounds like phenols and acids undergo transformations during GoLo’s dealcoholisation process, leading to an increase in their concentrations up to more than 90% in the case of phenols in white wines or 35% for acids in red wines.

1. Introduction

Wine is one of the most consumed beverages globally, with 221 million hectoliters consumed in 2023, according to the latest data from the International Organization of Vine and Wine (OIV) [1]. Further, wine production and consumption are highly globalised, as highlighted by the OIV study. This study reveals that there are a total of 7202 thousand hectares of cultivated land dedicated to wine worldwide. Remarkably, only twenty countries account for 89% of the wine produced and exported, and the five countries with the largest areas of cultivated land for wine are Spain (13.1%), France (11.0%), China (10.5%), Italy (10.0%), and Turkey (5.7%).
In this highly competitive market, the quality of a wine is essential for its sale and is determined by the interaction of physicochemical and sensory properties. These parameters depend on intrinsic factors such as the grape variety and extrinsic ones including soil, weather, and winemaking techniques. The interaction of all of these factors determines a profile of compounds directly involved in the quality of the wines and therefore in their sale [2].
In recent years, increasing environmental factors and changing consumer habits have led to the production of more dealcoholised wines [3], that are required to maintain the same quality, ensuring an optimal balance of physical, chemical, and sensory parameters.
Dealcoholisation processes are based on different technologies such as very-low-temperature vacuum distillation technology called GoLo [4], being the most advanced dealcoholisation technology on the market today. In this context, its noteworthy that the authors of this study previously published the first research on the use of GoLo technology to dealcoholise wines [5].
The GoLo dealcoholisation technology utilises vacuum distillation at low temperatures (45–47 °C) and reduced pressure levels of −83 to −90 KPa. The process features three distillation columns, and the final outlet temperature of the dealcoholised wine is 2 °C. This technology combines traditional multiple batch separation processes into a single, continuous, user-friendly operation. It features a thin film creation system that functions efficiently without any moving parts. In just one pass, GoLo dealcoholisation technology can separate nearly 100% of the volatile aromatic compounds (the essence), reduce the alcohol content of wine to as low as 0.05% (v/v), and rectify the alcohol content to as high as 85% (v/v) [5].
A comparison of GoLo dealcoholisation technology with the most common post-harvest dealcoholisation methods available in the market, using a simplified strengths, weaknesses, opportunities, and threats (SWOT) analysis [6], is presented in Table 1. Additionally, GoLo operates at higher flow rates than other dealcoholisation technologies while using less energy and water, which results in lower losses [5].
The chemical composition of wine is very complex and consists of a mixture of various compounds including alcohols, sugars, acids, minerals, proteins, phenolic acids, and volatile and phenolic compounds (also called polyphenols) in the following approximate proportions: water (86%), ethanol (12%), glycerol, higher alcohol and polysaccharides (1%), organic acids (0.4%), polyphenols (0.1%), and minerals, volatile compounds, and other compounds (0.5%) [22].
Although polyphenols comprise only a small portion of a wine’s overall composition, they play a crucial role in determining its quality. These compounds are directly linked to many sensory characteristics that affect the perception of the wine, including its colour, aroma, and flavour. These qualities significantly influence consumer preferences and sales [23], being parameters of great importance for the acceptance of dealcoholised wines.
Polyphenols are polymers of flavan-3-ol units [24] naturally present in grapes (especially in red grapes) and can be grouped into two big families: (i) flavonoids, including anthocyanidins, flavonols, hydrolysable and condensed tannins, flavanones, flavones, and chalcones; and (ii) non-flavonoids, including hydroxycinnamic acids, hydroxybenzoic acids, stilbenes, tyrosol, and hydroxytyrosol.
Regarding volatile compounds in wines, it has been reported that more than 1000 volatile compounds with very different contents, from nanograms per liter to grams per liter, have been found [25]. These volatile compounds could be grouped according to the type of aroma into primary, secondary, and tertiary. The volatile compounds that make up the different aromas are of very different natures, mainly composed of alcohols, esters, aldehydes, ketones, acids, terpenes, and phenols [26].
Several physicochemical parameters influence wine quality, including residual sugar content (related to alcoholic strength), total acidity, and sulphites. These parameters also affect sensory properties such as aroma, flavour, astringency, bitterness, and turbidity, which relate to appearance and colour [23,27].
As discussed, the authors of this study recently published the first research on the evolution of physicochemical parameters in 274 samples of dealcoholised Spanish wines using GoLo dealcoholisation technology. We evaluated several parameters before and after the dealcoholisation process, including alcohol content, pH, total SO2, free SO2, total acidity, and volatile acidity [5].
Therefore, this study aims to verify and expand upon the results from the initial research on dealcoholised Spanish wines using GoLo dealcoholisation technology. To achieve this, we evaluated the alcohol content, pH, total SO2, free SO2, total acidity, and volatile acidity of 18 samples of various types of Spanish wines both before and after the dealcoholisation process using GoLo technology. This was performed to confirm the previously published findings. Additionally, we assessed total phenolic content, volatile compounds, total sugar content, and turbidity and conducted a sensory analysis to further enhance the previously published results on GoLo dealcoholisation technology.

2. Materials and Methods

2.1. Sample Selection

A total of 18 wine samples from the Spanish commercial market were collected, including 6 white (B), 6 red (T), and 6 rosé (R) wines from various designations of origin (DOs). The varieties of red wines included Tempranillo (T1 and T5), Cabernet Sauvignon (T2), Garnacha (T3), Merlot (T4), and Monastrell (T6). The rosé wines were made from Garnacha (R1–R3) and Merlot (R4–R6). The white wines included Macabeo (W1), Verdejo (W2 and W5), Chardonnay (W3 and W6), and Airén (W4). Additional information on the designations of origin and the % of the variety of the wines studied can be found in the Supplementary Materials. The vintage year of all wines was 2023. The non-dealcoholised wine samples were first analysed and then dealcoholised using GoLo technology. This process and subsequent analysis took place over a 9-month period from January 2024 to October 2024. The samples and dealcoholisation technology were provided by a company located in central Spain. The analyses were conducted at the laboratories of the University of Murcia and the University of Castilla-La Mancha, in collaboration with a private Spanish laboratory accredited by ISO 17025 [28], which specialises in wine analysis.

2.2. Total Phenolic Content

The total polyphenolic content was determined according to the OIV method [29] based in the Folin–Ciocalteu method. All phenolic compounds contained in wine are oxidised by Folin–Ciocalteu reagent, reducing the heteropoly acids to a blue Mo–W complex. The blue coloration produced has a maximum absorption in the region of 750 nm and is proportional to the total quantity of phenolic compounds originally present, expressed as gallic acid equivalents. For each sample of wine, 1 mL was mixed with 250 μL carbonate tartrate solution (200 g of sodium carbonate and 12 g of sodium tartrate in 1 L of distilled water) and 50 μL of Folin–Ciocalteu was added. The absorbance of the sample was measured at 750 nm after 30 min of reaction.

2.3. Determination of Volatile Compounds by SBSE-GC-MS

Wine volatile compounds were analysed in triplicate using stir bar sorptive extraction with a polydimethylsiloxane coating (10 mm length; 0.5 mm film thickness) and gas chromatography–mass spectrometry analysis [30]. The extraction process was conducted with stirring at 500 rpm for 60 min at room temperature (21 ± 3 °C). The analysis was performed using an automated thermal desorption unit (TDU, Gerstel, Mülheim an der Ruhr, Germany) connected to an Agilent 7890A gas chromatograph coupled with a quadrupole Agilent 5975C electron ionisation mass spectrometer (MS, Agilent Technologies, Palo Alto, CA, USA). The GC system was equipped with a fused silica capillary column (BP21 stationary phase; 30 m length; 0.25 mm I.D.; and 0.25 µm film thickness) sourced from SGE (Ringwood, Australia). Helium served as the carrier gas, maintaining a constant column pressure of 20.75 psi. Mass spectrometry (MS) analysis was conducted using scan acquisition in the m/z range of 27 to 300, with an ionisation energy set to 70 eV. The temperature of the MS transfer line was kept at 230 °C. Data acquisition was performed in positive scan mode to minimise matrix interferences. For confirmation, the MS operated in single ion monitoring mode, utilising the characteristic m/z values of each compound. Identification was carried out using the NIST library. Quantification was achieved using pure standards for each compound, along with the internal standard, 3-methyl-1-pentanol (Sigma-Aldrich, Steinheim, Germany).

2.4. Total Sugar Content

The total sugar content was measured by the reduction of ketonic and aldehydic functions present in the sugars according to the method described by OIV [29]. Briefly, total sugar content, expressed as invert sugar, was determined using the conversion tables specified in the referenced method, based on the volume of 0.1 M thiosulfate utilised in the volumetric titration performed on the resulting solution.

2.5. Turbidity

Turbidity was analysed directly in each wine sample using a Lovibond brand turbidimeter (Tintometer GmbH, Dortmund, Germany), which was calibrated with reference solutions using formazin as the calibration standard. The results are expressed in nephelometric turbidity units (NTU) corresponding to the measurement of the light diffused at a 90° angle to the direction of the incident beam.

2.6. Titratable Acidity

Titratable acidity was analysed by potentiometric titration. The samples were shaken continuously to remove the carbon dioxide before the analysis of 50 mL of wine by titration with bromothymol blue as indicator and comparison with an end-point colour standard [29].

2.7. Other Oenological Parameters

Alcohol content, pH, total SO2, free SO2, and volatile acidity were measured according to previous studies [5] and OIV methods [29].

2.8. Sensorial Analysis

There are a wide variety of methodologies for carrying out different sensory analyses in wines [31,32]. These protocols are used to evoke, measure, analyse, and interpret reactions to stimuli perceived through the senses. To determine if there are differences in sensory properties before and after the dealcoholisation process using GoLo technology, a sensory analysis was conducted by adapting existing methodologies.

2.8.1. Chromatic Characteristic

Wine colour analysis was carried out using the chromatic difference (ΔC) between wine before and after the dealcoholisation process using GoLo technology. Equation (1), based on the OIV method [33], was used to calculate ΔC. The intensity (I) of colour is given by the sum of absorbances using a 1 cm optical path at wavelengths of 420, 520, and 620 nm (Equation (2)). The other chromatic characteristic is the shade (N) and is expressed as the ratio of absorbance at 420 and 520 nm (Equation (3)). Absorbance was determined using glass cuvettes with a path length of 0.2 cm.
ΔC = ΔI + ΔN
I = A420 + A520 + A620
N = A420/A520

2.8.2. Odour and Flavour

The odour and flavour of the wines were realised through Friedman’s test based on DIN 10964 [34]. For this purpose, the standard that outlines the sensory testing method for describing attributes or components of attributes in one or several samples was used. This standard suggests the establishment of a nine-point hedonic scale with a neutral value (5), four positive categories (6 to 9), and four negative categories (1 to 4). The categories were classified as disliked extremely (1), disliked very much (2), disliked moderately (3), disliked slightly (4), liked slightly (6), liked moderately (7), liked very much (8), liked extremely (9). The main reason the nine-point hedonic scale is the most commonly used tool in acceptance testing is its limited number of categories. This simplicity allows various segments of the population to use it easily, without requiring prior training. This contrasts with other scales, such as magnitude estimation, which can involve more complex intensity assessments [35].
The analyses of smell and taste were conducted simultaneously on both the original wines and those that underwent a dealcoholisation process. The tasting panel was organised as a blind test and conducted through the sensory evaluation of eight individuals, selected from within the employee pool in the dealcoholising company, including four females and four males aged between 25 and 65 years old. The evaluation panel was selected and trained over several weeks, adhering to the requirements of the ISO 8586 standard [36].

2.9. Statistical and Data Analysis

To describe the oenological values of the wines studied, the average, minimum, and maximum values were calculated for each type of wine.
To evaluate significant differences between wines in oenological parameters and sensorial analysis, Student’s t-test for paired samples and a Friedman test were applied, respectively, which were considered statistically significant at p-value ≤ 0.05.
To illustrate the concentrations of the various volatile compounds analysed and their relationships with the different wines, a heatmap was employed. For the correlation study between the variables, a minimum R2 value of 0.5 was established. Additionally, for the multiple linear regression analysis, a p-value of ≤0.05 was used.
The software used was the Rstudio IDE Desktop 2023.06.01 tool and R 4.4.2 [37]. Different R libraries were used depending on the analysis carried out: for example, the data import into R was performed using the Readxl library, and graph analysis and Friedman’s test were performed using ggplot2, rstatix, patchwork, dplyr, and tidyverse. The R-script code used in this paper is available on request from the corresponding author.

3. Results and Discussion

3.1. Oenological Parameters

Table 2 displays the results obtained for the oenological parameters analysed before and after the dealcoholisation process using GoLo technology. Table 2 also shows that changes in alcohol content do not generally affect basic wine parameters such as pH, titratable acidity, and volatile acidity and other parameters not studied such as density [38]. However, among the oenological parameters studied, it is noted that the total polyphenol content increases by 12% for red wines, which have a higher polyphenol content, and by 8% for white wines.
The parameters that exhibit significant differences (using Student’s t-test to compare the means between the results before and after the process of dealcoholisation using GoLo technology) across all types of wines include total polyphenol content, turbidity, and both free and total sulphite contents. The variations in sulphite content have already been reported in relation to this type of dealcoholisation process in our previous study [5], as well as wine phenolic compounds and other dealcoholisation technology [39]. This confirms the effectiveness of the dealcoholisation process and the reduction of sulphites following the dealcoholisation process using GoLo technology.
With respect to turbidity, it is noteworthy that it increased in all types of wine, with a more significant rise observed in wines with a higher polyphenol content. In this regard, turbidity is formed by suspended particles, such as proteins and phenolics, originating from the grape. Changes in the total content and type of polyphenols in the dealcoholisation process can influence the turbidity and colloidal stability of the final product by complex formation with polysaccharides [40].

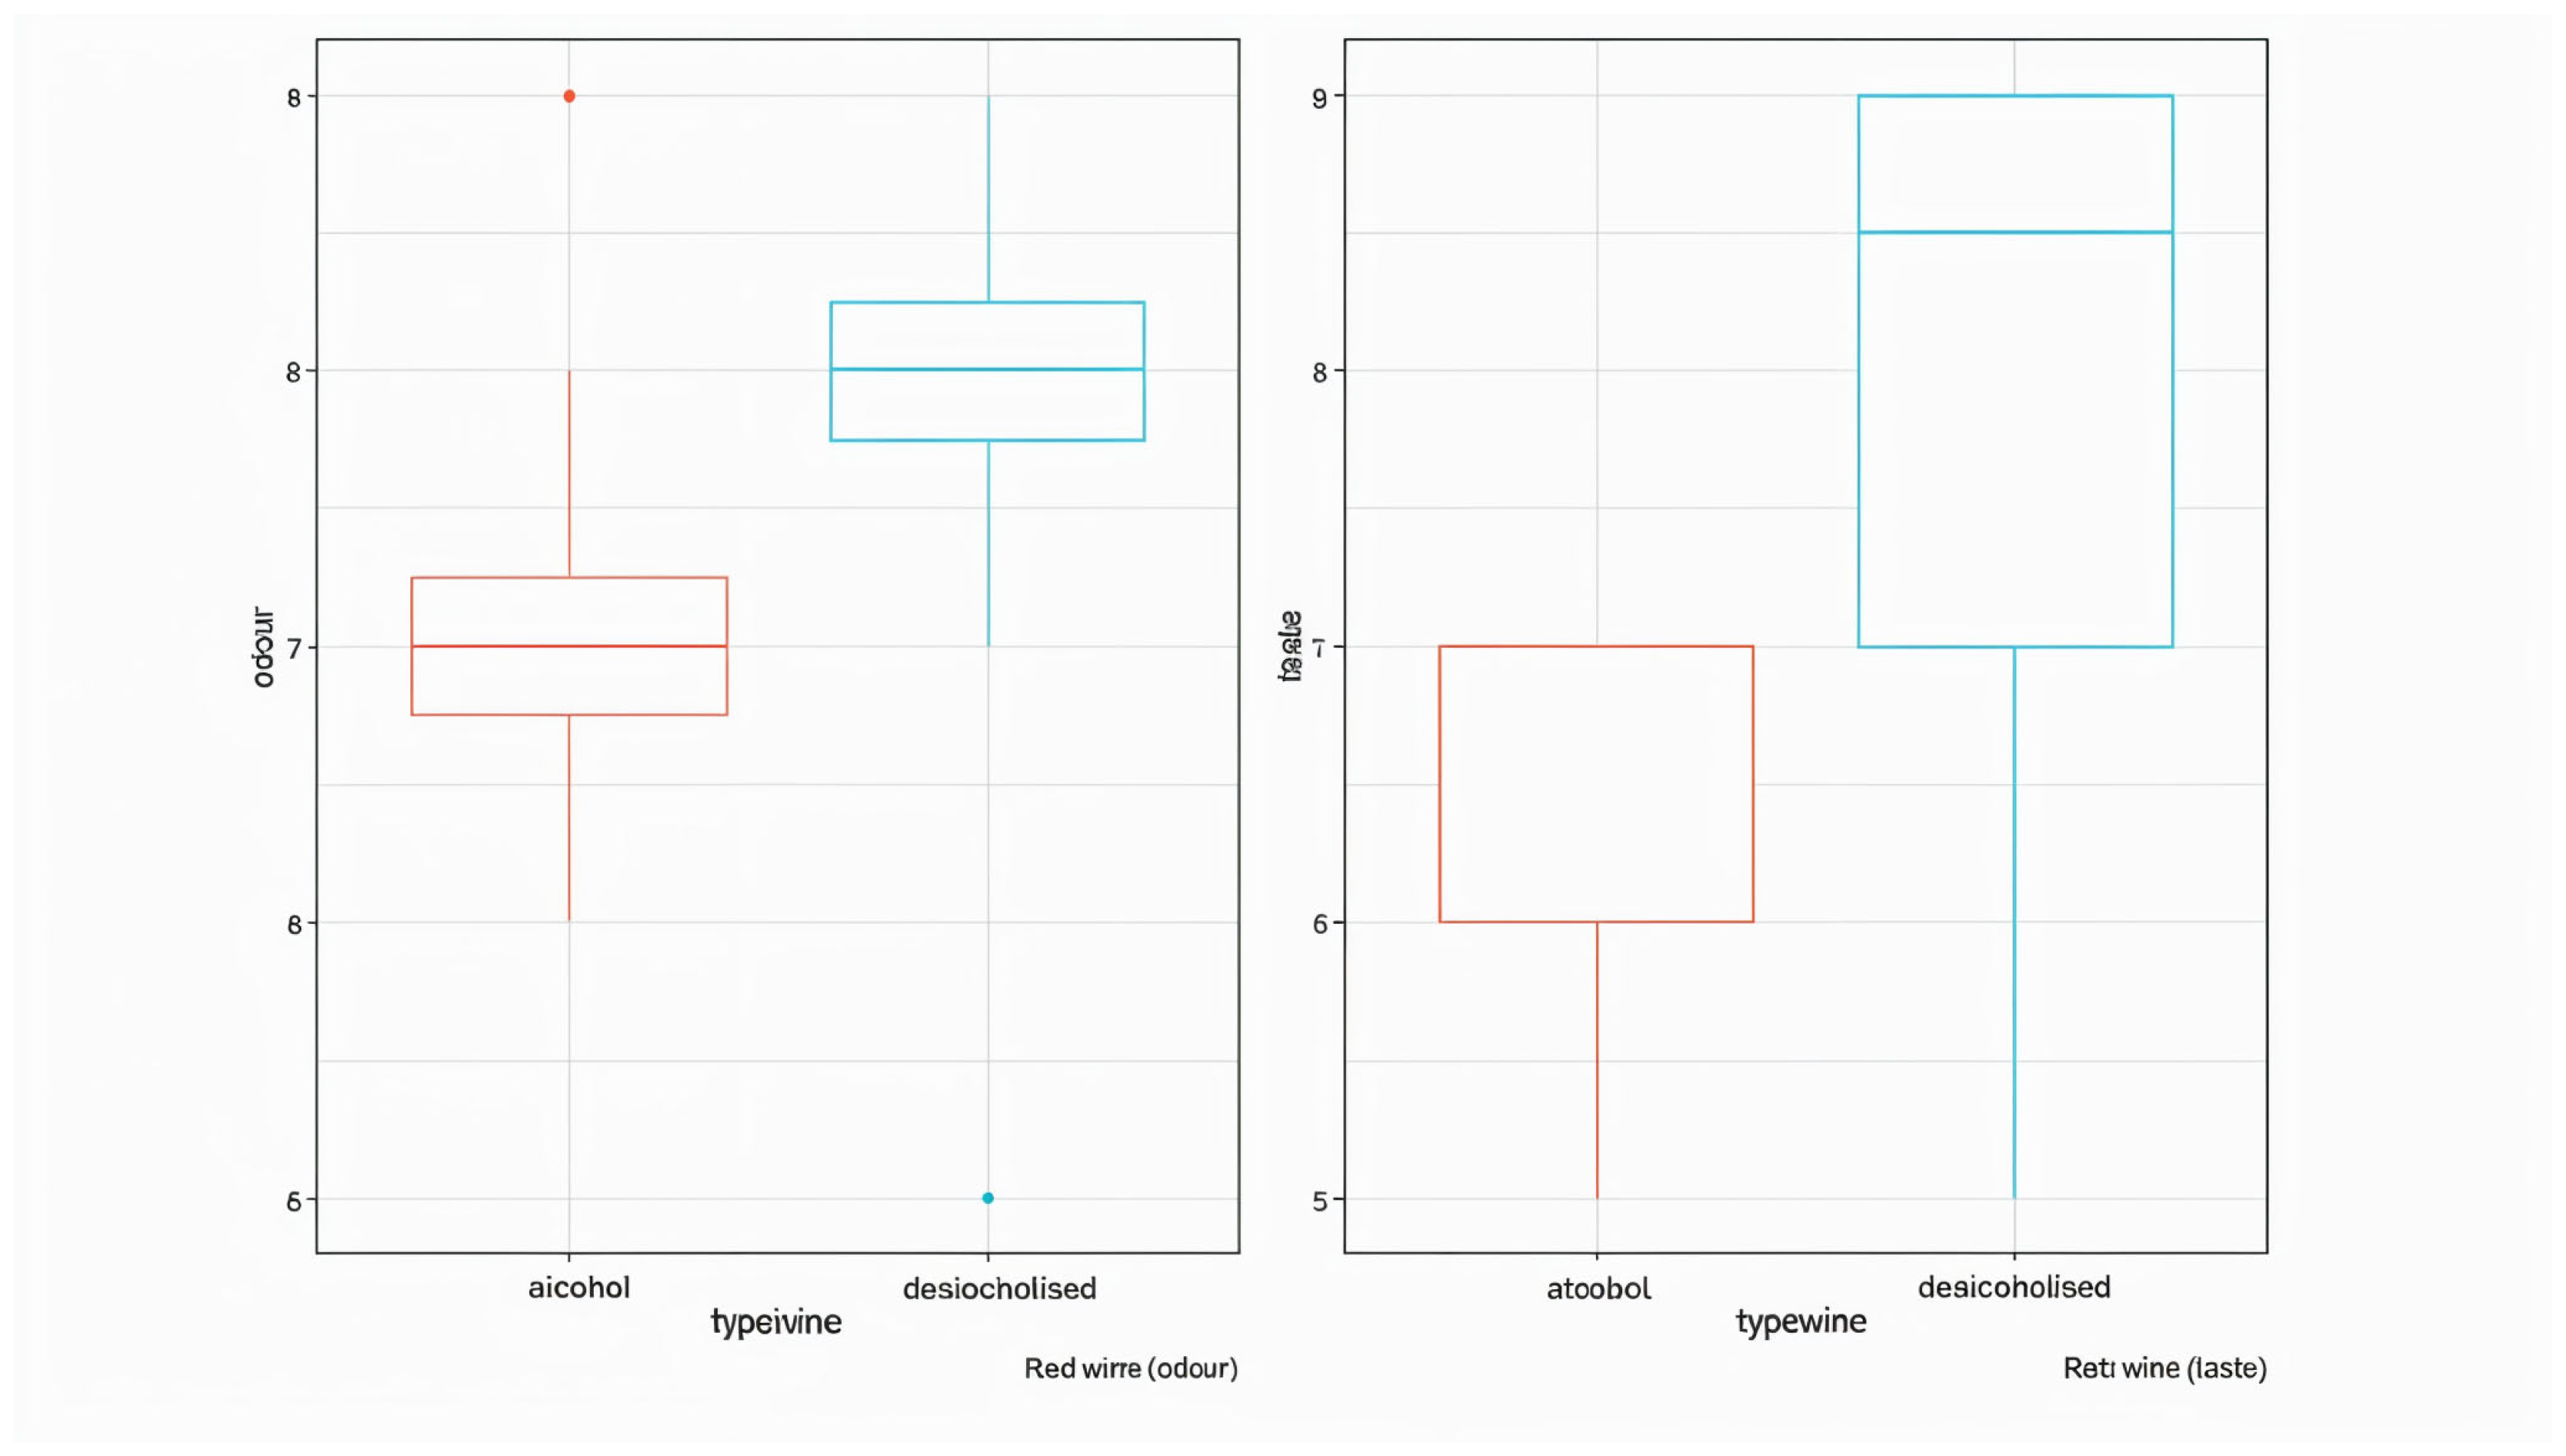
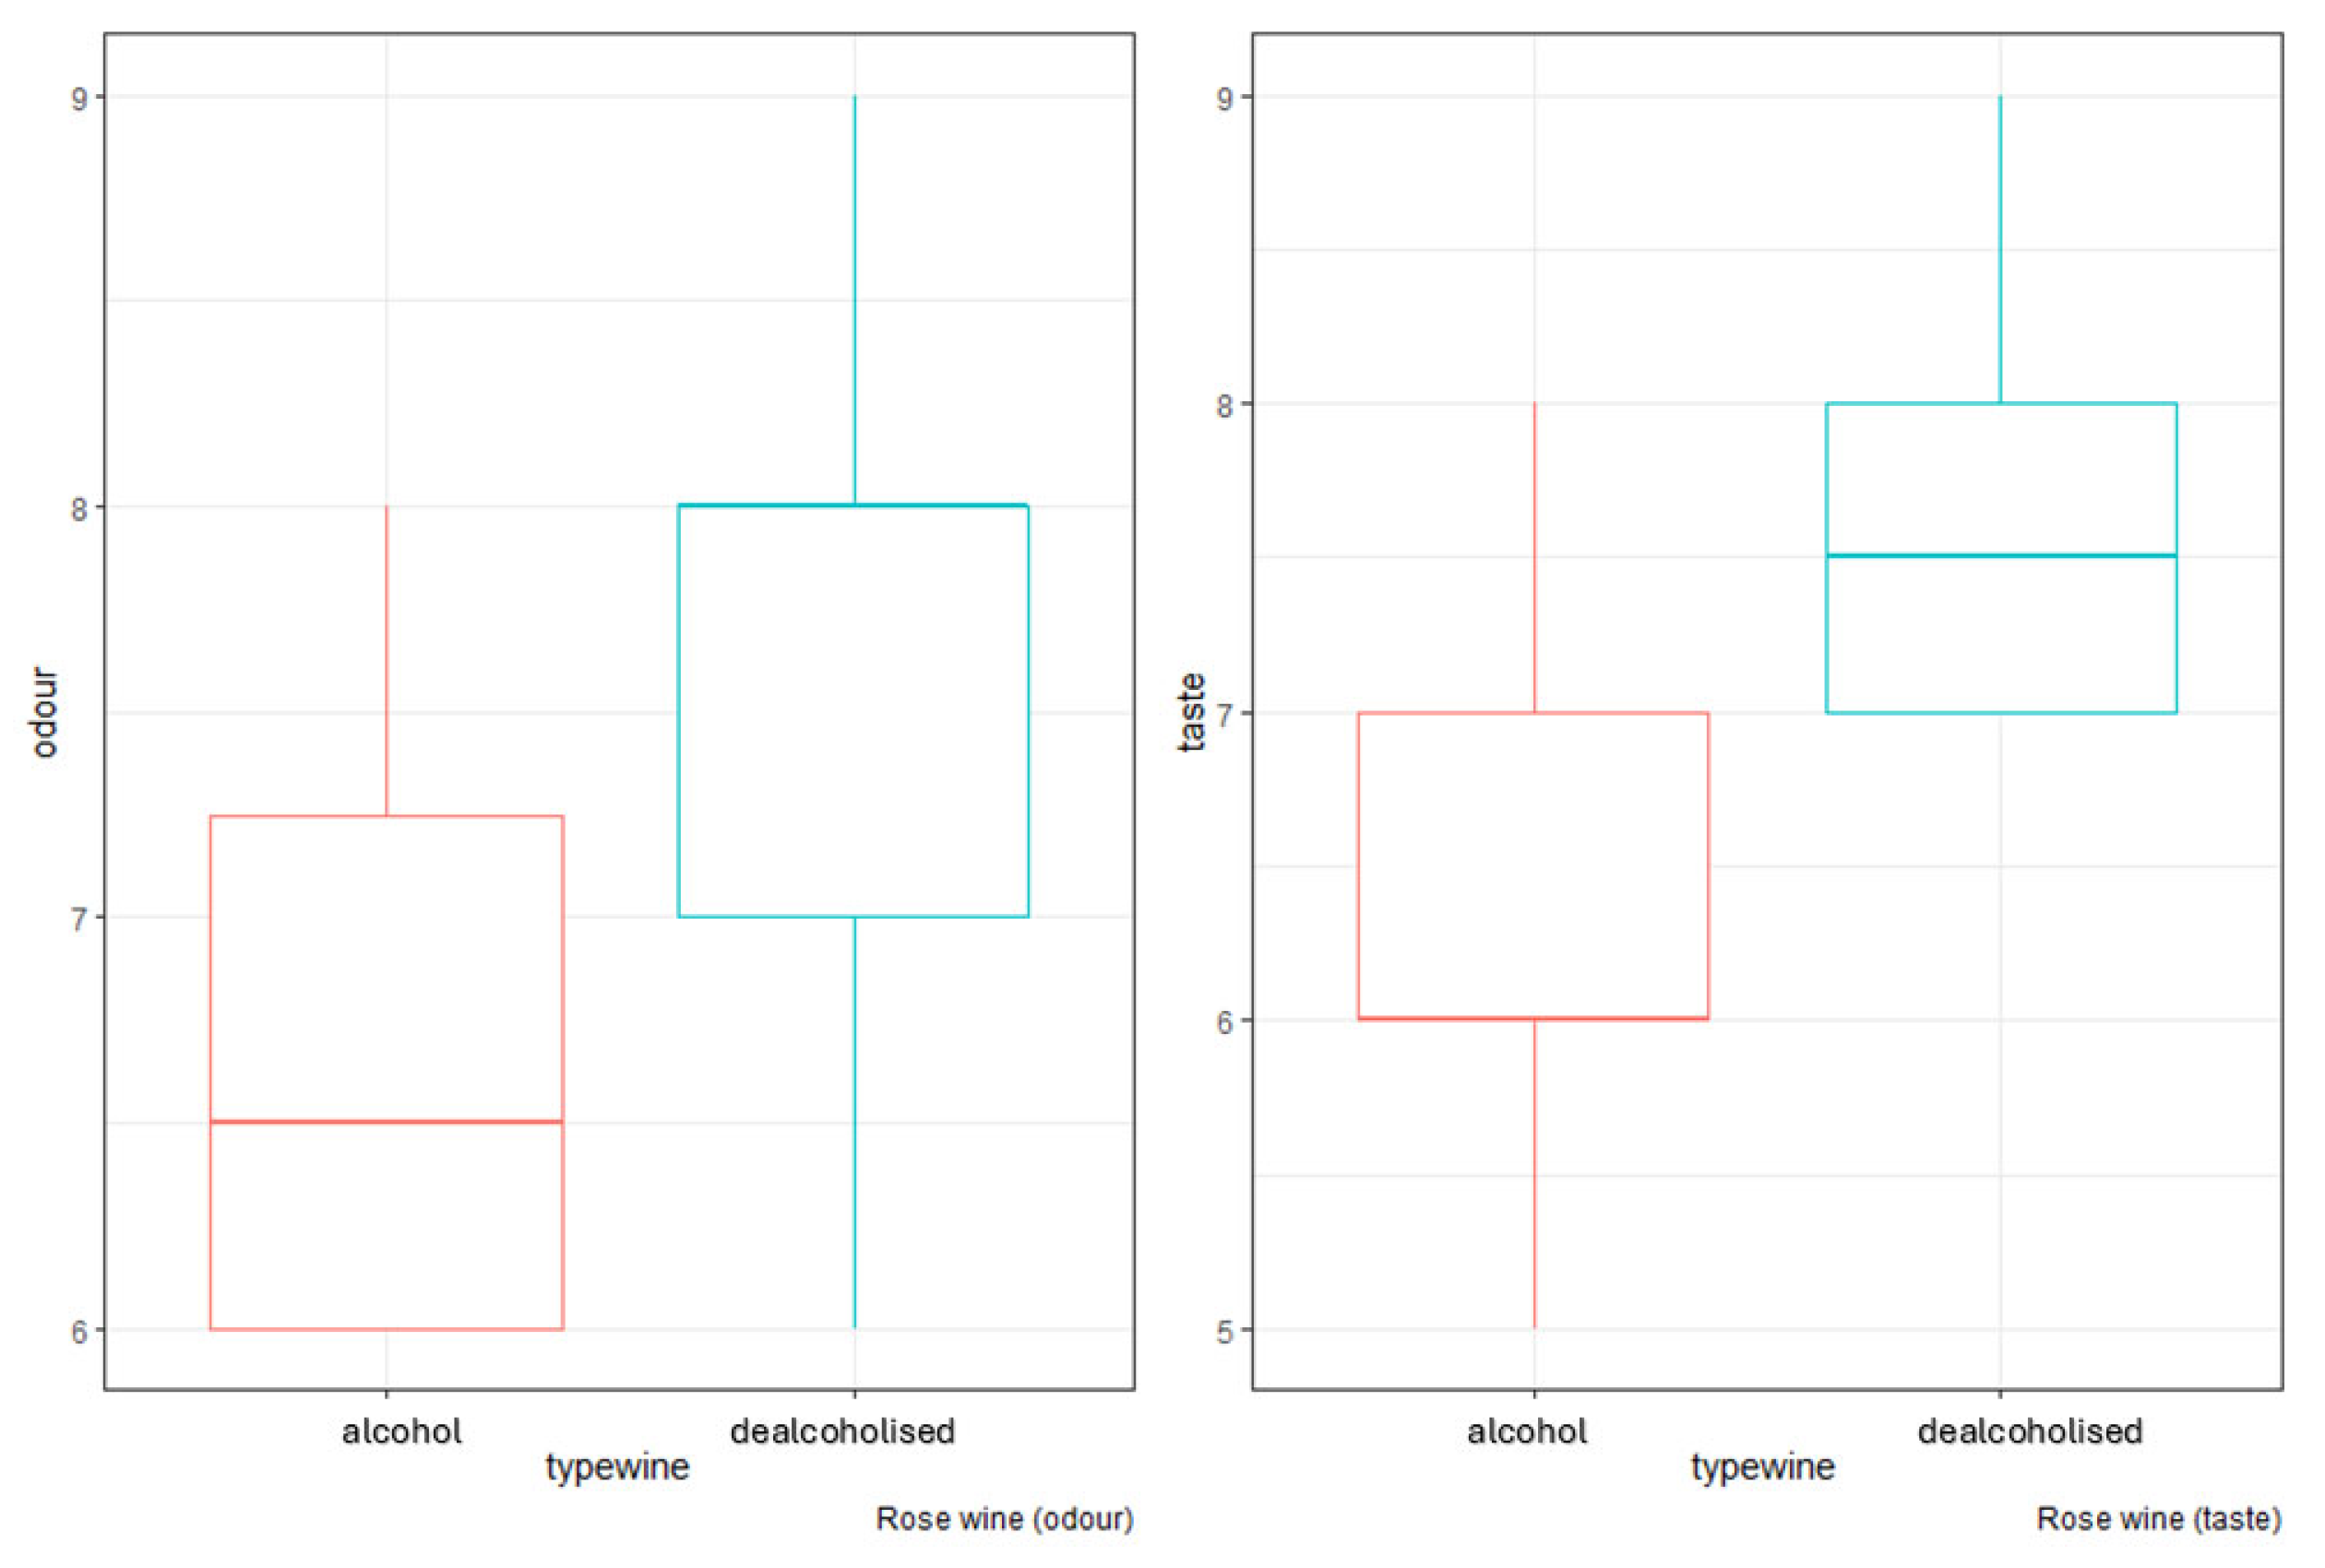
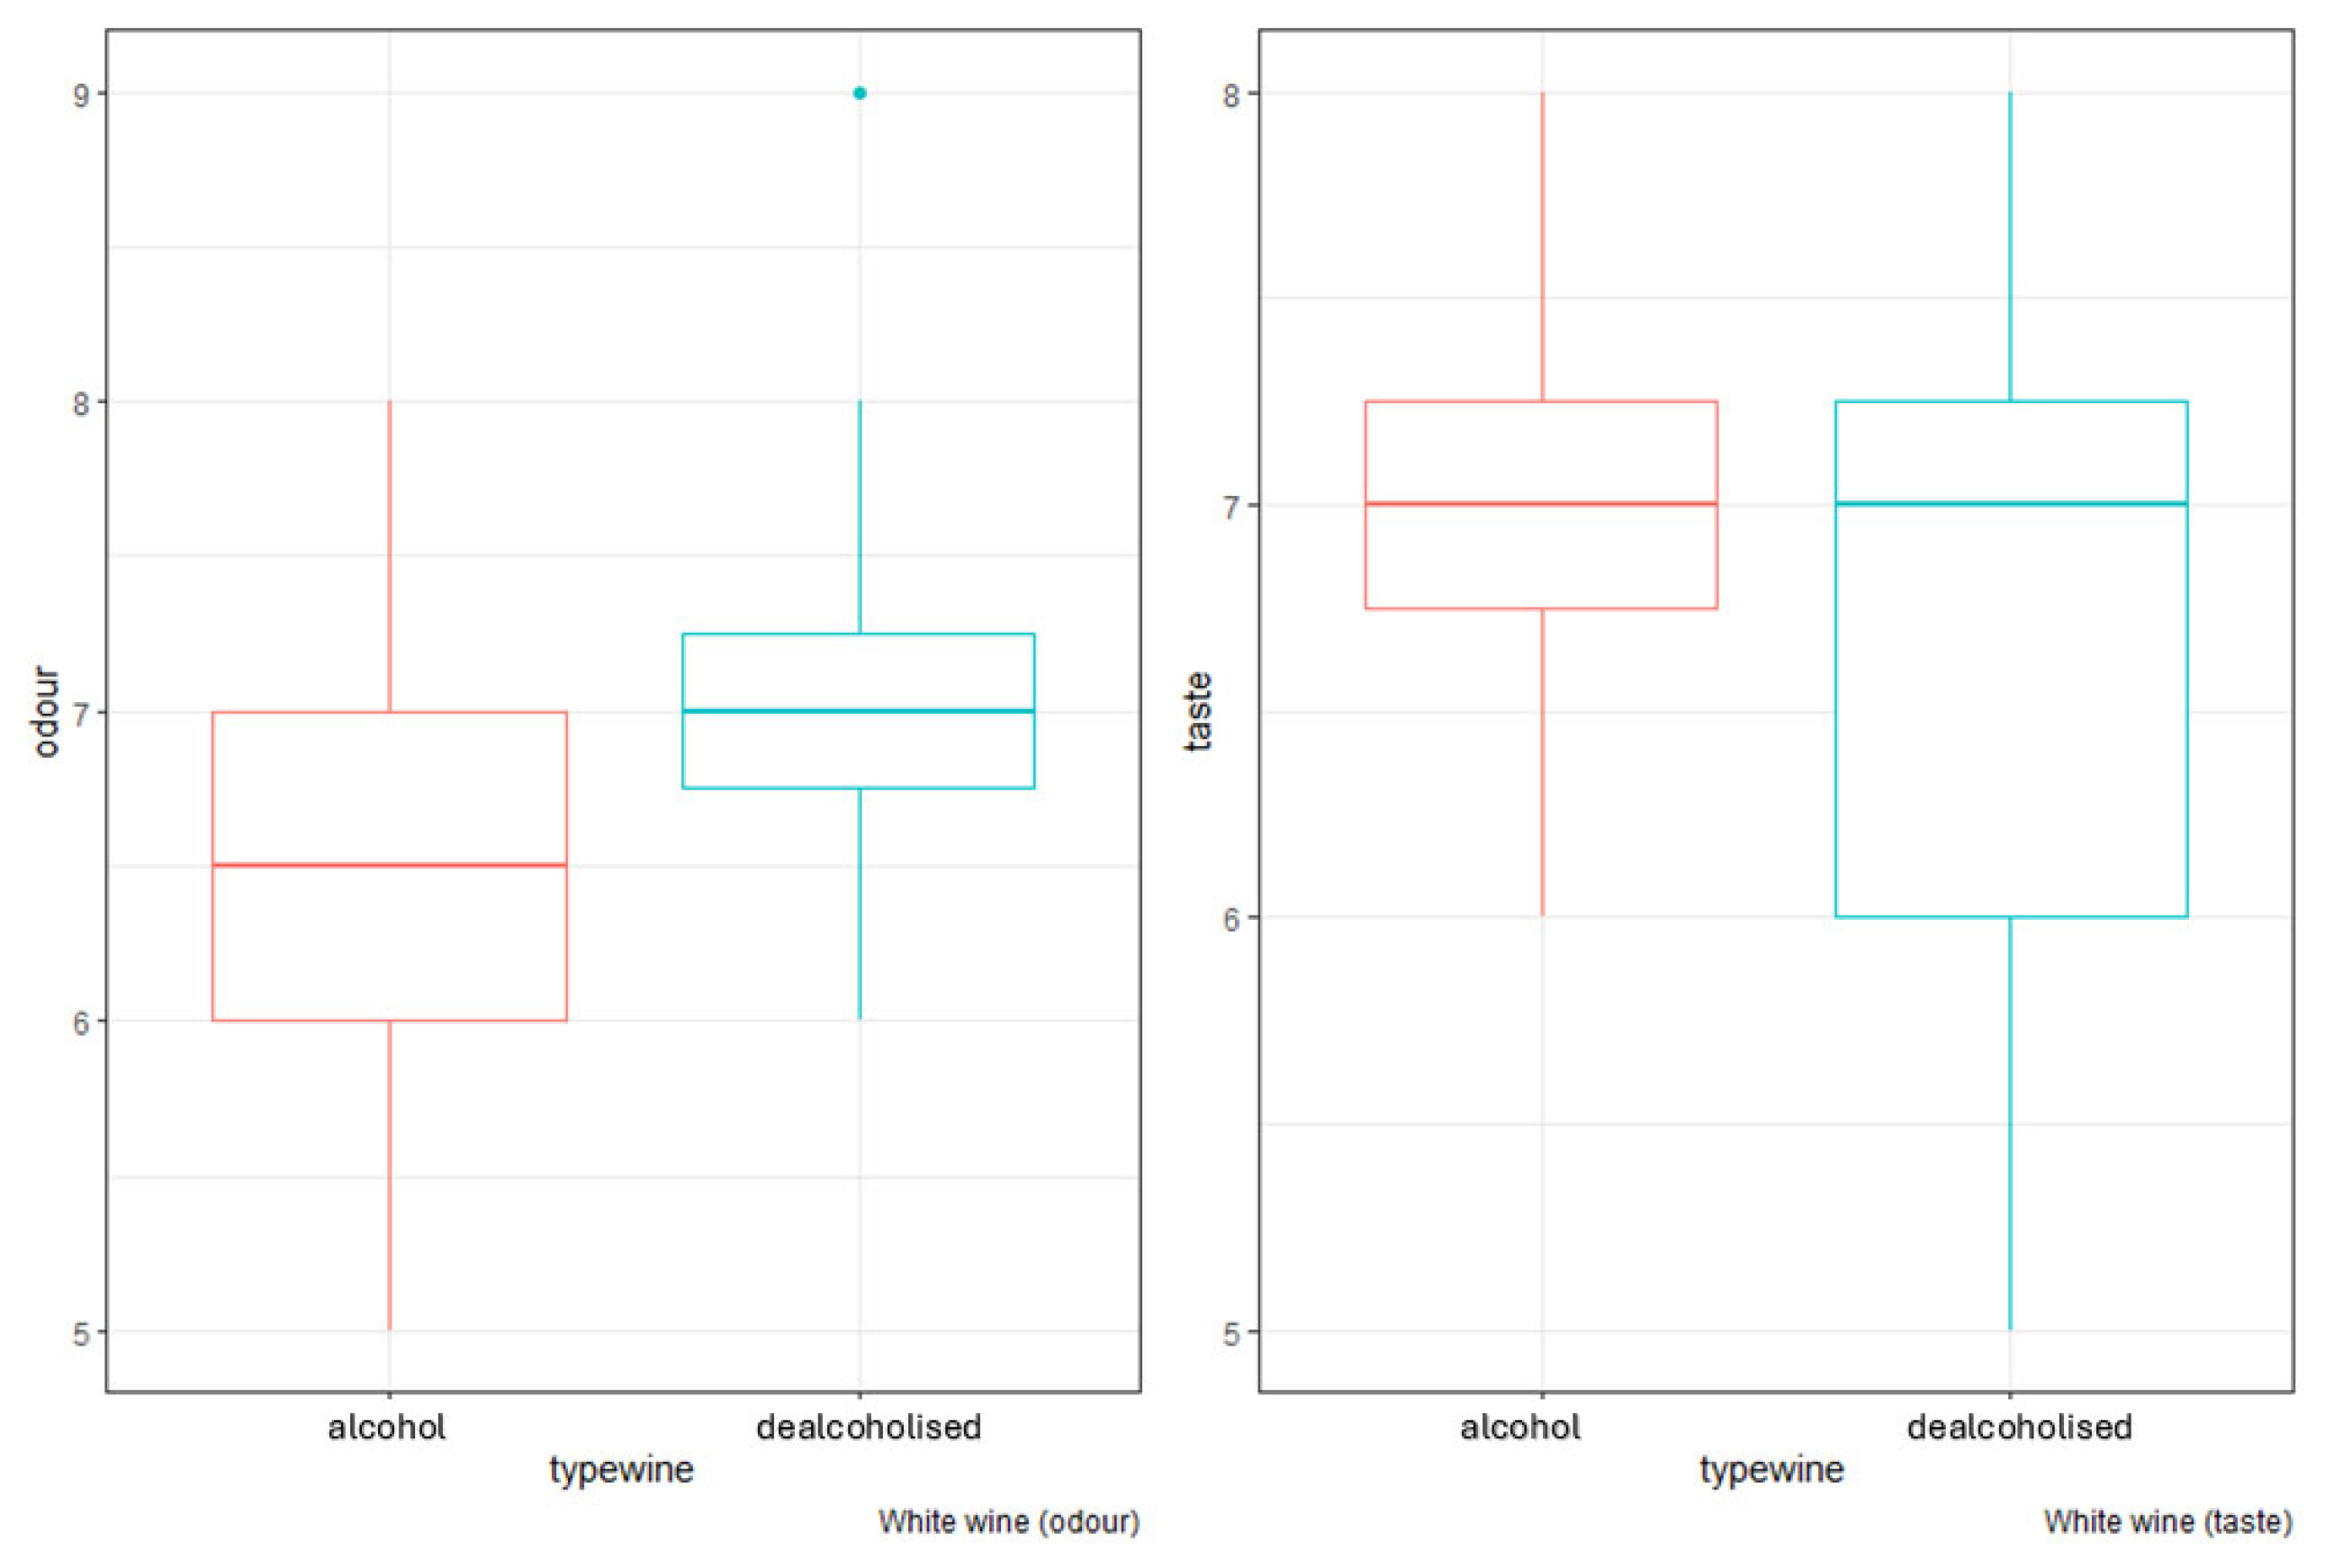
3.2. Sensorial Analysis

The average scores of the sensory analyses for red, rosé, and white wines after and before the dealcoholisation process using GoLo technology are represented in Figure 1, Figure 2 and Figure 3. To this purpose, a box plot, where the central value is represented within the box, the size of the box indicates the dispersion, and the extremes show the range of values, has been used. It is evident from all the figures that there is a low level of homogeneity among the panelists for all the wines analysed.
To compare the sensory analyses conducted, before and after the dealcoholisation process using GoLo technology, a Friedman test was employed. In the Friedman test, the answers of one respondent are ranked. Then all rankings of one competence are summed to gain group results, being especially useful for sensory evaluation [41].
Figure 1 shows that the score for odour and taste varies from a central value of 7 to 8 after the dealcoholisation process using GoLo technology. Despite these differences in taste and smell when applying the Friedman rank sum test, in all the results, a p-value of 0.22 (>0.05) is obtained so the differences are not significant. Although the removal of alcohol can cause changes in odour or taste by losses or concentrations of desirable volatile aroma compounds [42] there does not seem to be an influence on the perception of the range of wine studied as reported in similar studies [12]. Although the overall sensory parameters do not show significant differences, it has been observed that the dispersion in the odour parameter is much smaller than for taste, especially after the dealcoholisation process using GoLo technology.
For the case of rosé wine (Figure 2), the central scores are also increased in both sensory analyses, and in the Friedman rank sum test a non-significant p-value of 0.087 was obtained. The dispersion of values is lower than in red wine after the dealcoholisation process using GoLo technology.
In the case of white wines (Figure 3), the Friedman rank sum test showed no significant difference between the values of odour and flavour (p-value of 0.253).
The sensory analysis of the wines indicates that changes during the dealcoholisation process using GoLo technology were more pronounced in red wines compared to white wines. However, these changes are not clearly evident due to the lack of significant differences in the results. This is primarily attributed to the variability in the tasting panel, which consists of the company’s own staff rather than specialised personnel.
The average chromatic characteristics of each type of wine are shown in Table 3. Table 3 also shows that red wine presents an increase in the absorbance values and in the chromatic value (ΔC) of 2.271, which is lower in rosé wines (0.202) and negative (−1.86) in white wines. The increase in colour intensity in red wine and slight increase in rosé wine during the dealcoholisation process using GoLo technology may be related to the concentration effect in the polyphenols and anthocyanins produced by the removal of ethanol from the wine [13]. Moreover, the complexity of the wine, with extreme colloidal properties, could lead to complex oxidation processes [12,21].

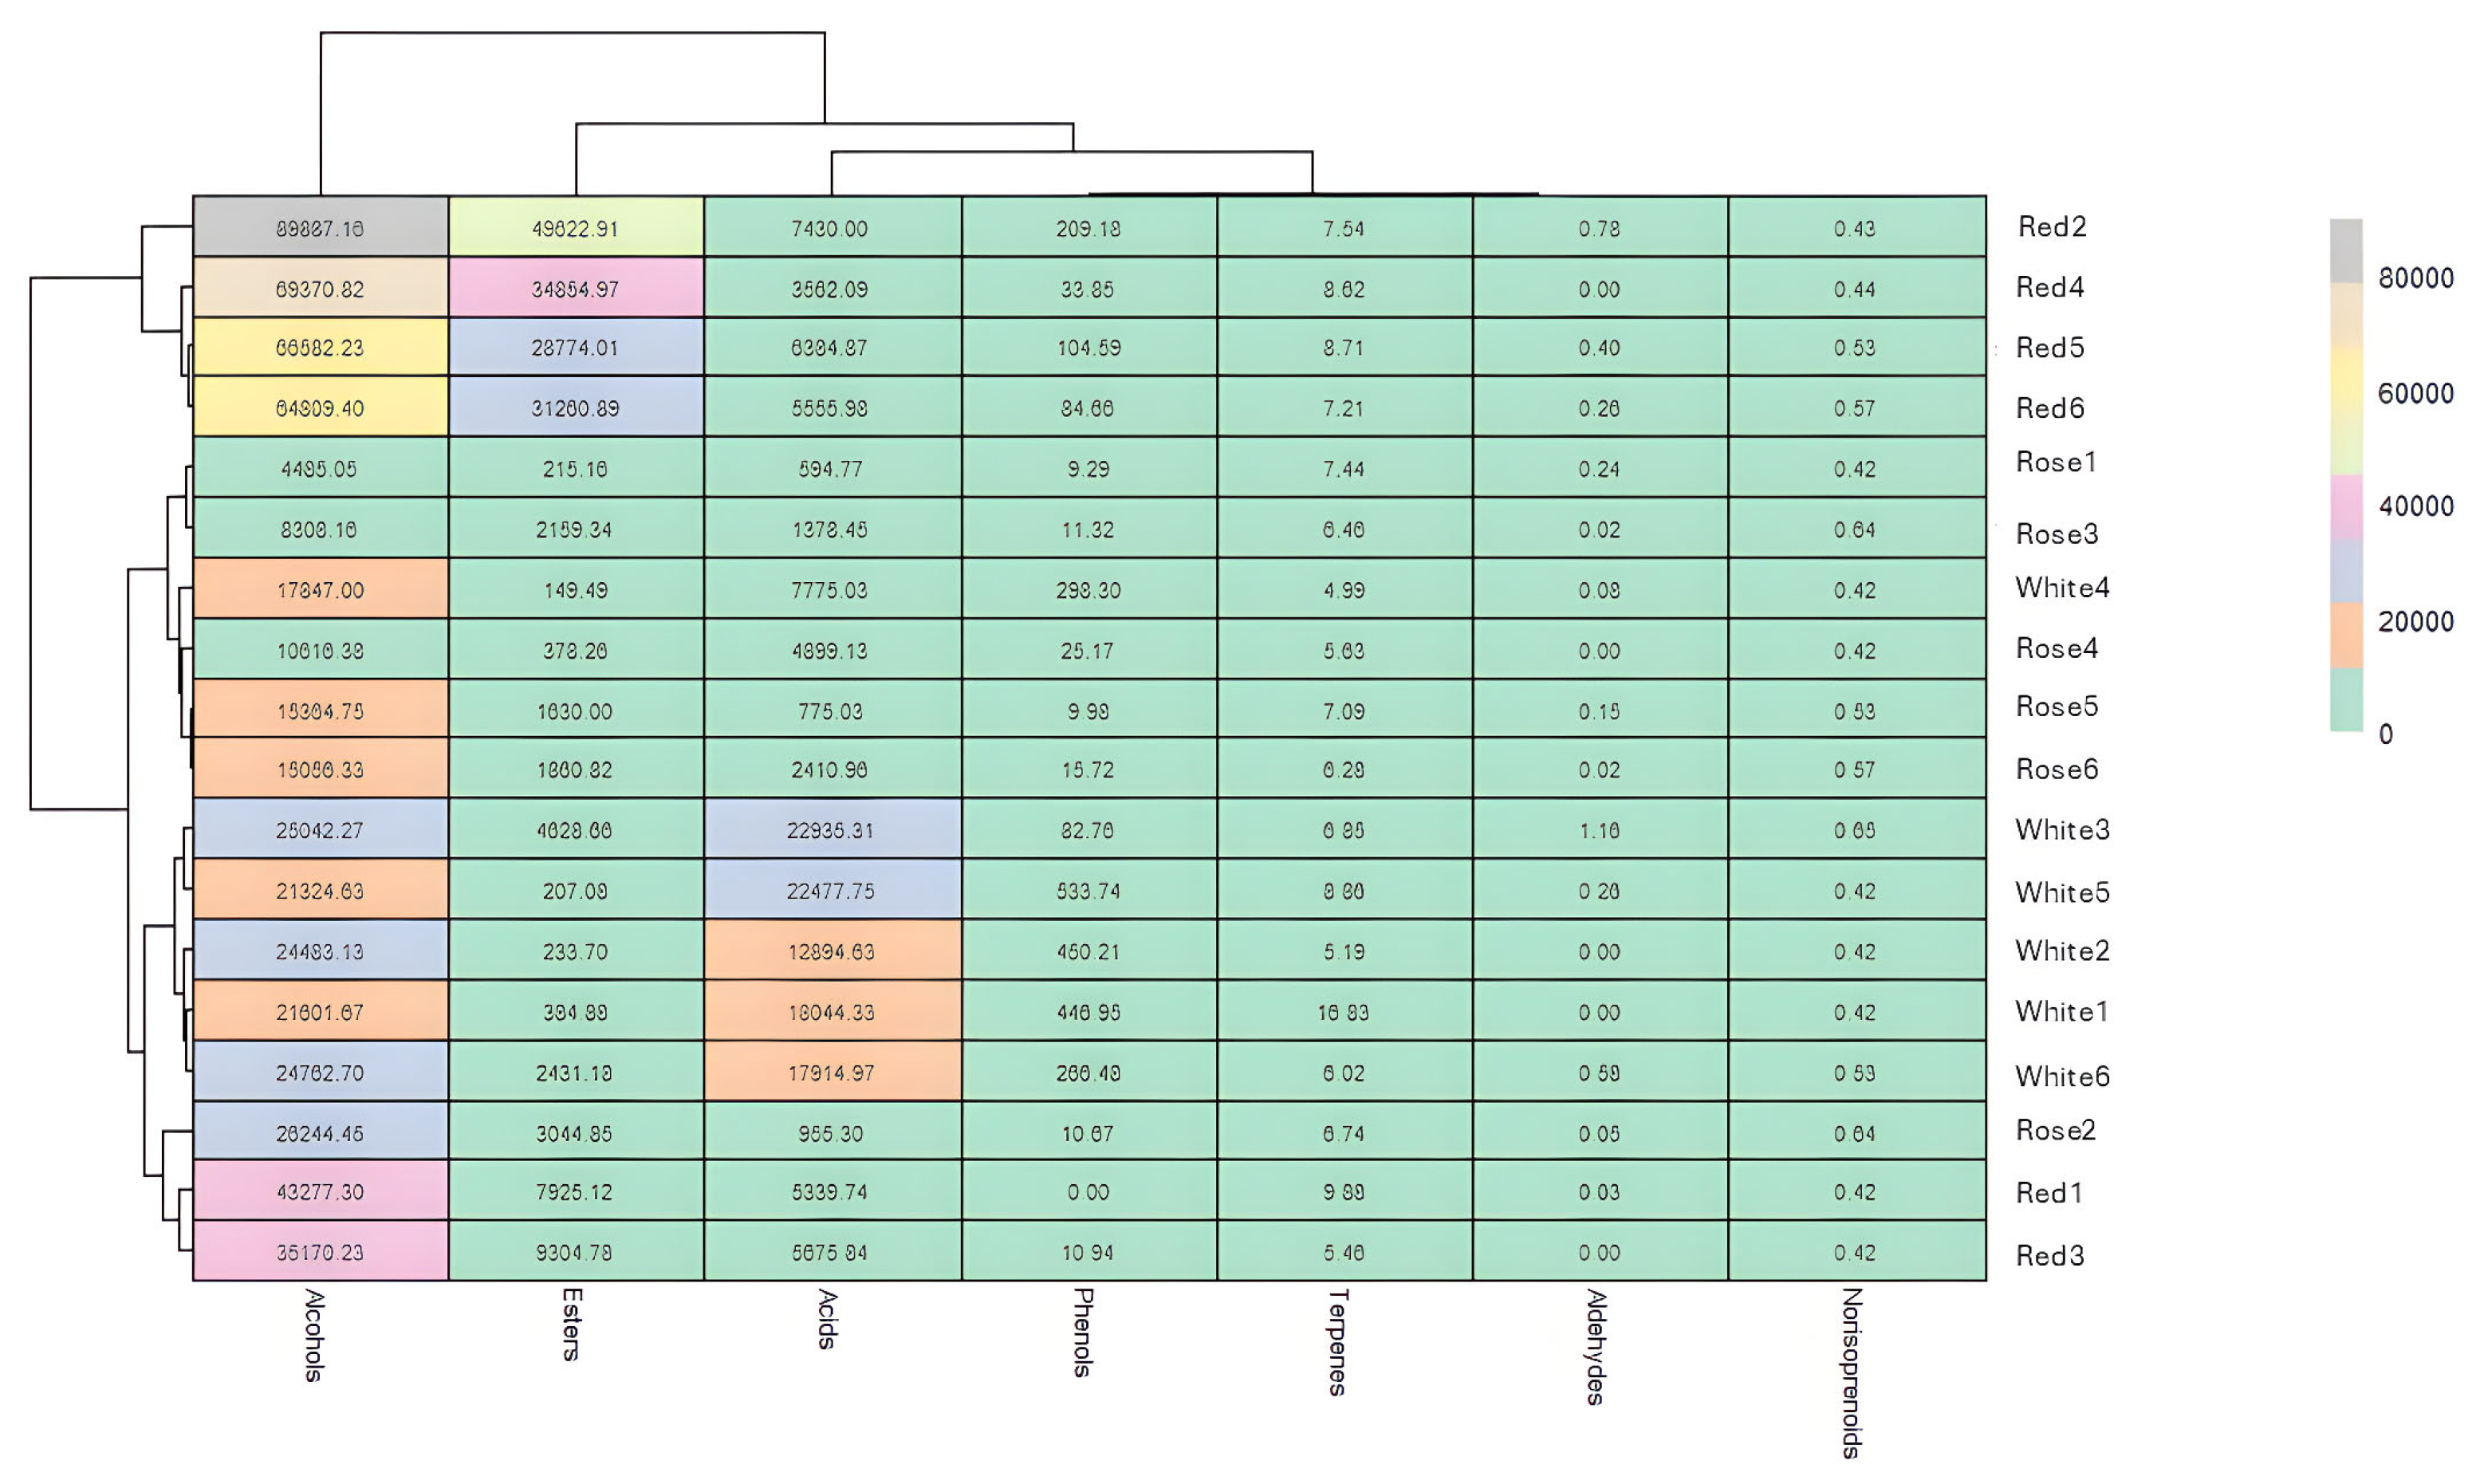
3.3. Volatile Compound Analysis

Aroma is classified into varietal aroma (primary aroma), fermentation aroma (secondary aroma), and aging aroma (tertiary aroma) which come from various volatile compounds, including higher alcohols, esters, acids, norisoprenoids, terpenes, phenols, and aldehydes [26]. Table 4 lists the compounds analysed for each group, along with their main associated aroma. Figure 4 and Figure 5 illustrate the concentrations of the seven volatile compound groups studied in the wines analysed both before and after the dealcoholisation process using GoLo, presented in a heatmap format. A heatmap is a graphical representation of data where the individual values for each variable are represented as colours and with a dendrogram added to the left side and to the top. The rows and columns are reordered according to the restrictions imposed by the dendrogram. The top dendrogram grouped the aroma types and the left dendrogram grouped the wine types.
Figure 4 shows the compounds found in the highest proportion in all wines, esters and alcohols, followed by acids, phenols, terpenes, aldehydes, and norisoprenoids. In red wines, the compounds present in the highest concentrations were esters and alcohols. In white wines, acids were dominant. However, rosé wines fall somewhere in between. Among the rosés, Rosé 2 has a higher concentration of esters and alcohols compared to the others, while Rosé 4 has a greater concentration of acids.
Aldehydes and terpenes were highly variable in different types of wines because their formation depends on the fermentation process rather than the grape variety [44,45]. The dendrogram of the samples shown in Figure 4 illustrates that there were no significant differences in concentration levels between the different types of wine. As observed on the vertical axis, there were connections among white, rosé, and red wines, highlighting the variability of the wines and grape varieties included in this study.
Figure 5 illustrates the results after the dealcoholisation process using GoLo technology and Table 5 summarises the range and average percentage reduction for each aroma group analysed. It highlights that compounds such as esters, terpenes, and aldehydes were generally lost in significant percentages across all wine types after this process, with losses approaching nearly 100% in white and rosé wines for esters (Table 5). Also, Table 5 shows values with negative numbers, indicating an increase in the concentration of certain aromas after the dealcoholisation process using GoLo technology. This phenomenon occurs in rosé wines for norisoprenoids, in red wines for alcohols and phenols, and in white wines for alcohols, phenols, and norisoprenoids. The loss of compounds is linked to the GoLo system technology [5] but also to other dealcoholisation systems such as pervaporation with a PDMS membrane [46]. During the first distillation column process, all volatile compounds are directed towards the final product. However, the efficiency of this separation depends on the volatility of the compound; high-molecular-weight esters are less volatile, while phenols and alcohols, which are more volatile, can be lost more readily compared to esters and terpenes.
The concentration of certain compounds did not show a consistent pattern, as they varied significantly across different wine types. For instance, phenylethyl alcohol, which was the most concentrated compound in all wine, demonstrated different trends. Thus, in rosé wines, the concentration decreased from 11.785 ng/mL to 10.452 ng/mL (a loss of 13%). In contrast, in white wine, it increased from 15.462 ng/mL to 21.601 ng/mL (a gain of 40%). Red wines showed a more uniform concentration, ranging from 17% to 98%. These observations suggest that, during the distillation process, the more soluble and less volatile compounds increase in concentration after the dealcoholisation process, and this increase is greater depending on the complexity of the matrix (greater for red wines than white wines), so further investigation is needed to understand their behaviour completely.
The results presented in Figure 4 and Figure 5 encompass all types of wine without differentiation, as both the lateral dendrogram and the analysed aroma content reveal similarities among different wine varieties that may initially appear distinct. For instance, Figure 4 illustrates that, prior to the dealcoholisation process using GoLo technology, there are notable similarities between Rosé 3 (Garnacha) and White 2 (Verdejo), as well as between Red 3 (Garnacha) and Rosé 6 (Merlot). This suggests that, despite the differences in grape varieties, there are relationships based on similar aroma profiles, which may be altered following the dealcoholisation process using GoLo technology. Specifically, the samples of Red 3 and Rosé 6 become dissimilar mainly due to variations in terpenes, aldehydes, and esters. Rosé 6 experiences reductions of 71%, 99.9%, and 95% in these aroma components, respectively, while Red 3 exhibits reductions of 70%, 99.9%, and 95%. In other words, these results indicate a significant decrease in these aromas after the dealcoholisation process using GoLo technology.
To determine correlations between significant oenological parameters (polyphenols and turbidity), the initial concentration of the different volatile compounds studied, and the total concentration of the volatile compounds in the different wines analysed, a correlation matrix was constructed between predictor variables for all the analysed wines. Correlations were considered significant for a Pearson correlation coefficient (r) of absolute value ≥ 0.5, shown in Figure 6 with asterisks. The total concentration of volatile compounds according to the score showed a great correlation to total polyphenols (0.783), esters (0.853), and alcohols (0.718) and a lower one to norisoprenoids (0.516). Although there are no similar studies in the literature, it is related to the fact that they are the volatile compounds that are mostly found and have been studied in different types of wines [47].
Figure 6 also shows that there is a positive correlation between the total polyphenol content and alcohols (0.826) and esters (0.727) and a negative correlation with acids (−0.714). Likewise, the turbidity shows a slight positive correlation with alcohols (0.523) and a negative correlation with phenols (−0.536).
The relationship between esters and alcohols may be influenced by the complexity of the fermentation processes or the synergistic effects of other compounds, such as pyruvic acid [48,49].
The negative correlation between turbidity and phenols can be explained by the different oxidation processes, that can take place in wines, and which mainly affect phenolic groups [50] and the positive correlation by the amount of alcohol present that can generate precipitation processes increasing the turbidity of the wines [51].
Other less significant correlations, both in terms of their Pearson correlation coefficient value and their interpretation in the wines studied, were found between turbidity and phenols and alcohols, as well as acids with terpenes, norisoprenoids, and phenols.
To go further and determine if the total concentration of volatile compounds after the dealcoholisation process using GoLo technology is correlated with the volatile compound content, total polyphenols, and turbidity, a multiple linear regression analysis was performed. The Akaike information criterion (AIC) was used as an estimator of prediction error and, thereby, the relative quality of statistical models was studied [52], resulting in the following linear equation:
Concentration of total aromas (ng/mL) = −1.796 × 10³ + 27.25 × PP* (mg/L) + 1.856 × 10⁴ × TURB (NTU) + 1.408 × ALCOHOLS (ng/mL) − 990.3 × ALDEHYDES (ng/mL) + 3.56 × ACIDS* (ng/mL) + 1.737 ×10⁵ × NORISOPRENOIDS* (ng/mL) + 69.55 × PHENOLS (ng/mL)
The linear equation has an adjusted R-squared of 0.828 with a p-value of 0.00029, and more significant terms (p-value < 0.05) such as the volatile compounds are marked with an asterisk (*). The linear regression model, developed through several iterations using the AIC, has eliminated the terms related to esters and terpenes. These compounds are associated with the highest percentage of reduction listed in Table 4 for all types of wines analysed. Despite the significance of these compounds in contributing to volatile compounds and their connection to grape varieties [53], the model disregarded them due to the variability observed in the results (see Figure 4 and Figure 5). For instance, compounds such as cis-linalool oxide, linalool, and nerolidol experienced varying degrees of loss during the dealcoholisation process. This behaviour was previously observed in dealcoholised Merlot red wine for linalool and nerolidol compounds [54]. In contrast, other compounds, such as limonene, remained unaffected, likely due to their more apolar nature, which prevents them from being lost in the alcoholic fraction.
Further, the aldehydes analysed showed a significant reduction in their concentration in all the wines studied, exceeding 80%. This decrease is consistent for both compounds examined, nonanal and benzaldehyde, indicating that they can be used as predictors of the final concentration.

4. Conclusions

As expected, the results of this study demonstrate that the GoLo dealcoholisation process resulted in significant differences in total polyphenols, sulphite content (both total and free), and turbidity. However, the other oenological parameters assessed—such as total sugars, pH, titratable acidity, and volatile acidity—did not show any significant changes after the GoLo dealcoholisation process.
The results of this study also demonstrate that the dealcoholisation using GoLo technology significantly alters the aromatic composition of all studied wines, leading to substantial losses in esters, terpenes, and aldehydes. The loss of these compounds, which are more volatile and susceptible to evaporation during the distillation process, could result in wines that lack the complexity and aromatic intensity found in traditional wine. While the dealcoholisation process reduces alcohol content, it also compromises the sensory richness that these volatile compounds contribute to the wine’s aroma. The volatile compounds that are concentrated after the dealcoholisation using GoLo technology are mainly norisoprenoids and phenols.
Future studies should explore additional grape varieties, wine types, origins, and other analytical parameters, including the phenolic profile, among others.

Supplementary Materials

The following supporting information can be downloaded at: https://www.mdpi.com/article/10.3390/app15073867/s1, Table S1: Denominations of Origin and % of the variety of each wine studied title.

Author Contributions

Conceptualisation, J.M.V.-d.-B. and P.A.-M.; Data curation, J.J.C.-M., J.M.V.-d.-B., C.C.-T., R.S.-G., J.O. and P.A.-M.; Formal analysis, J.J.C.-M., J.M.V.-d.-B., C.C.-T., R.S.-G., J.O. and P.A.-M.; Investigation, J.J.C.-M., J.M.V.-d.-B., C.C.-T., R.S.-G., J.O. and P.A.-M.; Methodology, J.J.C.-M., J.M.V.-d.-B., C.C.-T., R.S.-G., J.O. and P.A.-M.; Resources, J.M.V.-d.-B. and P.A.-M.; Software, J.J.C.-M., J.M.V.-d.-B., C.C.-T., R.S.-G., J.O. and P.A.-M.; Supervision, J.M.V.-d.-B. and P.A.-M.; Validation, J.J.C.-M., J.M.V.-d.-B., C.C.-T., R.S.-G., J.O. and P.A.-M.; Visualisation, J.J.C.-M., J.M.V.-d.-B., C.C.-T., R.S.-G., J.O. and P.A.-M.; Writing—original draft, J.J.C.-M., J.M.V.-d.-B., C.C.-T., R.S.-G., J.O. and P.A.-M.; Writing—review and editing, J.J.C.-M., J.M.V.-d.-B., C.C.-T., R.S.-G., J.O. and P.A.-M. All authors have read and agreed to the published version of the manuscript.

Funding

This research received no external funding.

Institutional Review Board Statement

Not applicable.

Informed Consent Statement

Not applicable.

Data Availability Statement

The raw data supporting the conclusions of this article will be made available by the authors on request.

Conflicts of Interest

The authors declare no conflicts of interest.

References

  1. OIV. State of the World Vine and Wine Sector in 2023. 2023. Available online: https://www.oiv.int/sites/default/files/2024-04/OIV_STATE_OF_THE_WORLD_VINE_AND_WINE_SECTOR_IN_2023.pdf (accessed on 21 January 2025).
  2. Blotevogel, S.; Schreck, E.; Laplanche, C.; Besson, P.; Saurin, N.; Audry, S.; Viers, J.; Oliva, P. Soil chemistry and meteorological conditions influence the elemental profiles of West European wines. Food Chem. 2019, 298, 125033. [Google Scholar] [CrossRef]
  3. Sánchez-Ortiz, A.; Mateo-Sanz, J.M.; Mateos-Fernández, M.A.; Figueras, M.L. New Labeling Rules for Wine: Wine Alcohol-Derived Calories and Polyphenol Consumption on Health. Foods 2024, 13, 295. [Google Scholar] [CrossRef]
  4. Pienaar, S.W. Process and Apparatus for the Reduction of Alcohol in Fermented Beverages. Google Patents US20150132459A1, 2 February 2016. [Google Scholar]
  5. Veiga-del-Baño, J.M.; Cuenca-Martínez, J.J.; Oliva, J.; Cámara, M.Á.; Andreo-Martínez, P. Total Dealcoholisation of Wines by Very Low Temperature Vacuum Distillation Technology Called GoLo. Beverages 2024, 10, 32. [Google Scholar] [CrossRef]
  6. Puyt, R.W.; Lie, F.B.; Wilderom, C.P.M. The origins of SWOT analysis. Long Range Plann. 2023, 56, 102304. [Google Scholar] [CrossRef]
  7. OIV. Resolution OIV-OENO 394A-2012. 2012. Available online: https://www.oiv.int/public/medias/1431/oiv-oeno-394a-2012-en.pdf (accessed on 23 January 2025).
  8. EU. Regulation (EU) No 1308/2013 of the European Parliament and of the Council of 17 December 2013 Establishing a Common Organisation of the Markets in Agricultural Products and Repealing Council Regulations (EEC) No 922/72, (EEC) No 234/79, (EC) No 1037/2001 and (EC) No 1234/2007. 2013. Available online: https://eur-lex.europa.eu/legal-content/EN/ALL/?uri=celex%3A32013R1308 (accessed on 21 March 2025).
  9. Pickering, G.J. Low- and Reduced-alcohol Wine: A Review. J. Wine Res. 2000, 11, 129–144. [Google Scholar] [CrossRef]
  10. Kucherenko, V.; Uspalenko, O. Relevance of the production of non-alcoholic wines. BIO Web Conf. 2023, 68, 03017. [Google Scholar]
  11. Gómez-Plaza, E.; López-Nicolás, J.M.; López-Roca, J.M.; Martínez-Cutillas, A. Dealcoholization of Wine. Behaviour of the Aroma Components during the Process. LWT-Food Sci. Technol. 1999, 32, 384–386. [Google Scholar] [CrossRef]
  12. Sam, F.E.; Ma, T.-Z.; Salifu, R.; Wang, J.; Jiang, Y.-M.; Zhang, B.; Han, S.-Y. Techniques for Dealcoholization of Wines: Their Impact on Wine Phenolic Composition, Volatile Composition, and Sensory Characteristics. Foods 2021, 10, 2498. [Google Scholar] [CrossRef]
  13. Sam, F.E.; Ma, T.; Liang, Y.; Qiang, W.; Atuna, R.A.; Amagloh, F.K.; Morata, A.; Han, S. Comparison between Membrane and Thermal Dealcoholization Methods: Their Impact on the Chemical Parameters, Volatile Composition, and Sensory Characteristics of Wines. Membranes 2021, 11, 957. [Google Scholar] [CrossRef]
  14. Catarino, M.; Mendes, A. Dealcoholizing wine by membrane separation processes. Innov. Food Sci. Emerg. Technol. 2011, 12, 330–337. [Google Scholar] [CrossRef]
  15. Margallo, M.; Aldaco, R.; Barceló, A.; Diban, N.; Ortiz, I.; Irabien, A. Life cycle assessment of technologies for partial dealcoholisation of wines. Sustain. Prod. Consum. 2015, 2, 29–39. [Google Scholar] [CrossRef]
  16. Montevecchi, G.; Ricci, A.; Masino, F.; Ferrari, V.; Versari, A.; Antonelli, A. Profile of red wine partially dealcoholized with a membrane-based technique and strategies to mitigate the loss of volatile compounds. Curr. Res. Food Sci. 2024, 8, 100776. [Google Scholar] [CrossRef]
  17. Zamora, F. Dealcoholised Wines and Low-Alcohol Wines. In Wine Safety, Consumer Preference, and Human Health; Moreno-Arribas, M.V., Bartolomé Suáldea, B., Eds.; Springer International Publishing: Cham, Switzerland, 2016; pp. 163–182. [Google Scholar]
  18. Saussay, A.; Sato, M. The impact of energy prices on industrial investment location: Evidence from global firm level data. J. Environ. Econ. Manag. 2024, 127, 102992. [Google Scholar] [CrossRef]
  19. Belisario-Sánchez, Y.; Taboada-Rodríguez, A.; Marín, F.; Iguaz, A.; López-Gómez, A. Aroma Recovery in Wine Dealcoholization by SCC Distillation. Food Bioprocess Technol. 2011, 5, 2529–2539. [Google Scholar] [CrossRef]
  20. Mangindaan, D.; Khoiruddin, K.; Wenten, I.G. Beverage dealcoholization processes: Past, present, and future. Trends Food Sci. Technol. 2018, 71, 36–45. [Google Scholar] [CrossRef]
  21. Kumar, Y.; Ricci, A.; Parpinello, G.P.; Versari, A. Dealcoholized Wine: A Scoping Review of Volatile and Non-Volatile Profiles, Consumer Perception, and Health Benefits. Food Bioprocess Technol. 2024, 17, 3525–3545. [Google Scholar] [CrossRef]
  22. Nemzer, B.; Kalita, D.; Yashin, A.Y.; Yashin, Y.I. Chemical Composition and Polyphenolic Compounds of Red Wines: Their Antioxidant Activities and Effects on Human Health—A Review. Beverages 2022, 8, 1. [Google Scholar] [CrossRef]
  23. Gutiérrez-Escobar, R.; Aliaño-González, M.J.; Cantos-Villar, E. Wine Polyphenol Content and Its Influence on Wine Quality and Properties: A Review. Molecules 2021, 26, 718. [Google Scholar] [CrossRef]
  24. Haslam, E. Natural polyphenols (Vegetable tannins) as drugs: Possible modes of action. J. Nat. Prod. 1996, 59, 205–215. [Google Scholar] [CrossRef]
  25. Liu, S.; Lou, Y.; Li, Y.; Zhao, Y.; Laaksonen, O.; Li, P.; Zhang, J.; Battino, M.; Yang, B.; Gu, Q. Aroma characteristics of volatile compounds brought by variations in microbes in winemaking. Food Chem. 2023, 420, 136075. [Google Scholar] [CrossRef]
  26. González Pereira, A.; Corral, M.; García Oliveira, P.; Rodríguez, M.; Jiménez-López, C.; Lourenço-Lopes, C.; Barros, L.; Ferreira, I.; Prieto, M.; Simal-Gandara, J. Management of Wine Aroma Compounds: Principal Basis and Future Perspectives. In Winemaking-Stabilization, Aging Chemistry and Biochemistry; IntechOpen: London, UK, 2020. [Google Scholar]
  27. Ballester, J.; Belascoin, M.; Gonzalez-Hernandez, M.; Parga-Dans, E.; Alonso González, P.; Saenz-Navajas, M.-P. Sensory attributes and quality perception of red natural wines: A comparative study in Spain and France. OENO One 2024, 58, 1–10. [Google Scholar] [CrossRef]
  28. ISO. ISO/IEC-17025; General Requirements for the Competence of Testing and Calibration Laboratories. 2017. Available online: https://www.iso.org/obp/ui#iso:std:iso-iec:17025:ed-3:v2:es (accessed on 11 February 2025).
  29. OIV. Compendium of International Methods of Analysis of Wine and Must. 2023. Available online: https://www.oiv.int/standards/compendium-of-international-methods-of-wine-and-must-analysis (accessed on 22 January 2024).
  30. Sánchez-Gómez, R.; Zalacain, A.; Alonso, G.L.; Salinas, M.R. Effect of toasting on non-volatile and volatile vine-shoots low molecular weight phenolic compounds. Food Chem. 2016, 204, 499–505. [Google Scholar] [CrossRef] [PubMed]
  31. Lesschaeve, I.; Noble, A.C. 7-Sensory analysis of wine. In Managing Wine Quality, 2nd ed.; Reynolds, A.G., Ed.; Woodhead Publishing: Sawston, UK, 2022; pp. 243–277. [Google Scholar]
  32. OIV. Review Document on Sensory Analysis of Wine. 2015. Available online: https://www.oiv.int/public/medias/3307/review-on-sensory-analysis-of-wine.pdf (accessed on 30 January 2024).
  33. OIV. Compendium of International Methods Of Analysis–OIV. Chromatic Characteristics. Method OIV-MA-AS2-07B. Type IV Method. 2009. Available online: https://www.oiv.int/public/medias/2475/oiv-ma-as2-07b.pdf (accessed on 30 January 2024).
  34. DIN. DIN 10964:2014-11; Sensory Analysis-Simple Descriptive Test. 2014. Available online: https://tienda.aenor.com/norma-din-10964-2014-11-222693508 (accessed on 30 January 2024).
  35. Pimentel, T.C.; Gomes da Cruz, A.; Deliza, R. Sensory Evaluation: Sensory Rating and Scoring Methods. In Encyclopedia of Food and Health; Caballero, B., Finglas, P.M., Toldrá, F., Eds.; Academic Press: Cambridge, MA, USA, 2016; pp. 744–749. [Google Scholar]
  36. ISO. ISO 8586:2023; Sensory Analysis—Selection and Training of Sensory Assessors. 2023. Available online: https://www.iso.org/es/contents/data/standard/07/66/76667.html (accessed on 30 January 2024).
  37. Aria, M.; Cuccurullo, C. Bibliometrix: An R-tool for comprehensive science mapping analysis. Informetrics 2017, 11, 959–975. [Google Scholar] [CrossRef]
  38. Pickering, G.J.; Heatherbell, D.A.; Vanhanen, L.P.; Barnes, M.F. The Effect of Ethanol Concentration on the Temporal Perception of Viscosity and Density in White Wine. Am. J. Enol. Vitic. 1998, 49, 306–318. [Google Scholar] [CrossRef]
  39. Gambuti, A.; Rinaldi, A.; Lisanti, M.T.; Pessina, R.; Moio, L. Partial dealcoholisation of red wines by membrane contactor technique: Influence on colour, phenolic compounds and saliva precipitation index. Eur. Food Res. Technol. 2011, 233, 647–655. [Google Scholar] [CrossRef]
  40. De La Cruz Rojas, E.M.; Nuñez-Pérez, J.; Lara-Fiallos, M.; Pais-Chanfrau, J.-M.; Espín-Valladares, R.; DelaVega-Quintero, J.C. An Artificial Intelligence Approach for Estimating the Turbidity of Artisanal Wine and Dosage of Clarifying Agents. Appl. Sci. 2024, 14, 4416. [Google Scholar] [CrossRef]
  41. Anonymous. Sensory Analysis. J. Am. Soc. Brew. Chem. 1987, 45, 102–105. [Google Scholar] [CrossRef]
  42. Pham, D.-T.; Ristic, R.; Stockdale, V.J.; Jeffery, D.W.; Tuke, J.; Wilkinson, K. Influence of partial dealcoholization on the composition and sensory properties of Cabernet Sauvignon wines. Food Chem. 2020, 325, 126869. [Google Scholar] [CrossRef]
  43. Fisher, C.; Scott, T.R. Flavores de los Alimentos Biología y Química; Acribia: Zaragoza, Spain, 2000. [Google Scholar]
  44. Arias-Pérez, I.; Sáenz-Navajas, M.P.; de-la-Fuente-Blanco, A.; Ferreira, V.; Escudero, A. Insights on the role of acetaldehyde and other aldehydes in the odour and tactile nasal perception of red wine. Food Chem. 2021, 361, 130081. [Google Scholar] [CrossRef]
  45. Dziadas, M.; Jeleń, H.H. Analysis of terpenes in white wines using SPE–SPME–GC/MS approach. Anal. Chim. Acta 2010, 677, 43–49. [Google Scholar] [CrossRef]
  46. Figueroa Paredes, D.A.; Assof, M.; Sánchez, R.J.; Sari, S.; Catania, A.; Fanzone, M.; Espinosa, J. Partial dealcoholization of a Malbec wine through pervaporation with a PDMS membrane: Effect of operation temperature on process economics, volatile aroma composition and sensory properties. Sep. Purif. Technol. 2024, 335, 126076. [Google Scholar] [CrossRef]
  47. Martínez-Moreno, A.; Bautista-Ortin, A.B.; Gómez-Plaza, E. Correlation of chemical composition and sensory scores in Spanish Monastrell red wines: Insights from a blind wine competition. J. Food Compost. Anal. 2024, 134, 106567. [Google Scholar] [CrossRef]
  48. Ling, M.; Qi, M.; Li, S.; Shi, Y.; Pan, Q.; Cheng, C.; Yang, W.; Duan, C. The influence of polyphenol supplementation on ester formation during red wine alcoholic fermentation. Food Chem. 2022, 377, 131961. [Google Scholar] [CrossRef] [PubMed]
  49. Ling, M.; Cui, D.; Zhu, B.; Li, D.; Mu, H.; Li, J.; Shi, Y.; Duan, C.; Lan, Y. The influence of polyphenols on the hydrolysis and formation of volatile esters in wines during aging: An insight of kinetic equilibrium reaction. Food Chem. 2025, 464, 141593. [Google Scholar] [CrossRef]
  50. Rødtjer, A.; Skibsted, L.H.; Andersen, M.L. The role of phenolic compounds during formation of turbidity in an aromatic bitter. Food Chem. 2010, 123, 1035–1039. [Google Scholar] [CrossRef]
  51. Różański, M.; Pielech-Przybylska, K.; Balcerek, M. Influence of Alcohol Content and Storage Conditions on the Physicochemical Stability of Spirit Drinks. Foods 2020, 9, 1264. [Google Scholar] [CrossRef]
  52. Ingdal, M.; Johnsen, R.; Harrington, D.A. The Akaike information criterion in weighted regression of immittance data. Electrochim. Acta 2019, 317, 648–653. [Google Scholar] [CrossRef]
  53. Marais, J. Terpenes in the aroma of grapes and wines: A review. S. Afr. J. Enol. Vitic. 1983, 4, 49–58. [Google Scholar] [CrossRef]
  54. Sam, F.E.; Ma, T.; Wang, J.; Liang, Y.; Sheng, W.; Li, J.; Jiang, Y.; Zhang, B. Aroma improvement of dealcoholized Merlot red wine using edible flowers. Food Chem. 2023, 404, 134711. [Google Scholar] [CrossRef]
Figure 1. Sensory differences in red wine.
Applsci 15 03867 g001
Figure 2. Sensory differences in rosé wine.
Applsci 15 03867 g002
Figure 3. Sensory differences in white wine.
Applsci 15 03867 g003
Figure 4. Heatmap of concentration (ng/mL) of each wine studied before dealcoholisation process using GoLo technology.
Applsci 15 03867 g004
Figure 5. Heatmap of concentration (ng/mL) of each wine studied after dealcoholisation process using GoLo technology.
Applsci 15 03867 g005
Figure 6. Matrix of parameter correlations. Symbol * show significant value, symbol *** show the most significant value, and symbol ** the intemediate signficant value.
Applsci 15 03867 g006
Table 1. SWOT analysis comparing GoLo with other post-harvest desalcoholisation (No GoLo) technologies.
SWOTGoLoNo GoLo
StrengthsElimination of alcohol content according to OIV-OENO 394A-2012 resolution [7,8] and below total dealcoholisation (0.5% v/v) and elimination of free and total sulphites [5]First patented technologies in early 1900 [9]
Widely used in industrial and scientific fields [10,11,12]
WeaknessesRecent technology, patented in 2016 [4] and marketed since 2022
No articles or studies other than those provided by the manufacturer
Some techniques fail to reduce the alcohol content according to OIV-OENO 394A-2012 [7,8] or below total dealcoholisation (0.5% v/v) [12,13,14,15]
Increase in free and total sulphite content [16]
Some techniques show high maintenance and operational costs [12,17]
OpportunitiesThe behaviour and evolution of organoleptic characteristics and aromas in various types of winesOptimisation of the best existing techniques to meet the minimum alcohol content with the least loss of aromas and organoleptic characteristics
ThreatsRising of energy prices [18]
Loss of aromas and organoleptic defects
Rising of energy prices [18]
Loss of aromas and organoleptic defects [11,12,16,19,20,21]
Table 2. Oenological parameters.
WineTotal Polyphenols
(++)
Sugars
(g/L)
Turbidity (NTU)
(++)
Alcohol (% v/v) (++)pH
(uds pH)
T SO2 (mg/L)
(++)
F SO2
(++)
Titratable Acidity
(g/L)
Volatile Acidity
(g/L)
Rbef763 ± 1850.41 ± 0.131.35 ± 0.2510.8 ± 0.813.27 ± 0.2669 ± 1215.5 ± 35.14 ± 0.34<0.15
Raft836 ± 2010.48 ± 0.121.53 ± 0.2403.24 ± 0.3155.0 ± 132 ± 0.55.47 ± 0.52<0.15
Tbef2153 ± 4550.30 ± 0.141.60 ± 0.4512.4 ± 1.043.59 ± 0.23104 ± 2430 ± 4.54.89 ± 0.340.44 ± 0.14
Taft2415 ± 3250.36 ± 0.112.82 ± 0.5403.43 ± 0.2178 ± 182 ± 0.35.43 ± 0.290.47 ± 0.12
Wbef525 ± 1350.22 ± 0.110.87 ± 0.219.5 ± 0.443.48 ± 0.14113 ± 2824 ± 8.55.17 ± 0.510.42 ± 0.13
Waft 567 ± 1660.27 ± 0.101.48 ± 0.1803.35 ± 0.2469 ± 141.5 ± 0.35.33 ± 0.620.44 ± 0.11
T: Red; W: White; R: Rosé; Bef: Before process of dealcoholisation using GoLo technology; Aft: After process of dealcoholisation using GoLo technology; mean ± standard deviation (++). Oenological parameters with statistically significant differences are represented by p-value ≤ 0.05.
Table 3. Average of chromatic parameters.
WineINΔC
Rbef0.4751.3680.202
Raft0.5751.474
Tbef6.7251.6662.271
Taft8.3532.270
Wbef0.0925.233−1.86
Waft 0.1643.303
T: Red; W: White; R: Rosé; Bef: Before process of dealcoholisation using GoLo technology; Aft: After process of dealcoholisation using GoLo technology; I: Intensity; N: Shade; ΔC: Increased chromatic value.
Table 4. Groups of volatile compounds analysed.
Type of GroupCompounds AnalysedType of AromaCharacteristics
EstersEthyl acetate, ethyl butyrate, ethyl hexanoate, isoamyl acetate, ethyl hexanoate, hexyl acetate, ethyl octanoate, ethyl decanoate, diethyl succinate, 2-phenylethyl acetate, ethyl cinnamatePrimaryFruity, floral
Alcohols3-Methyl-1-butanol, 1-hexanol, 3-hexen-1-ol, (Z), 1-octen-3-ol, benzyl alcohol, phenyethyl alcoholSecondaryFermentation product
AcidsHexanoic acid, octanoic acid, decanoic acidPrimaryRancid
PhenolsGuaiacol, 4-ethyl-phenol, 4-vinylguaiacolSecondarySpicy, smoked
Terpenescis-Linalol oxide, linalool, α-terpineol, citronellol, nerolidol isomer d-limoneno, farnesol isomer SecondaryFloral, sweet
AldehydesNonanal, benzaldehydeSecondarySweet
Norisoprenoidsα-Ionone, β-iononeTertiaryFloral, fruity
Characteristics: main sensory characteristics provided by the analysed compounds [43].
Table 5. Percentage of reduction (positive values) and increase (negative values) for each aroma group analysed.
Aroma Groups%R Range%R Average%T Range%T Average%W Range%W Average
Esters90.2 to 99.394.946.1 to 81.263.283.8 to 99.596.1
Alcohols32 to 54.345.2(−98.1) to (−17.8)(−41.46)(−62.6) to 2.2(−39.2)
Aldehydes81.6 to 10095.248.9 to 10086.367.5 to 10091.0
Acids75.7 to 91.283.5(−34.7) to 25.23.63.7 to 53.416.2
Terpenes52.1 to 89.372.474.3 to 90.679.24.3 to 76.845.0
Norisoprenoids(−47.2) to 39.8(−11.01)11.2 to 38.521.7(−45.9) to 3.3(−6.9)
Phenols38.9 to 52.247.3(−76.3) to 9.8(−16.6)(−94) to 16.2(−50.7)
T: Red; W: White; R: Rosé; Range: Minimum and maximum percentage after and before dealcoholisation process; Average: Average percentage after and before dealcoholisation process using GoLo technology. Results with brackets are negative values, indicating the percentage of aroma increase after the dealcoholisation process using GoLo technology.
Disclaimer/Publisher’s Note: The statements, opinions and data contained in all publications are solely those of the individual author(s) and contributor(s) and not of MDPI and/or the editor(s). MDPI and/or the editor(s) disclaim responsibility for any injury to people or property resulting from any ideas, methods, instructions or products referred to in the content.

