1. Introduction
Athletes who participate in winter sports or practice sports in specific areas of the world often face cold environmental conditions [
1]. Cold exposure is not by itself considered a barrier to perform sports; however, at ambient air temperatures less than 28.5 °C, the body responds with a number of physiological coping mechanisms to maintain the core body temperature [
2]. Given that winter sports typically occur in temperatures from 0 °C to −20 °C [
3], the importance of physiological (heat produced via metabolism) and non-physiological (e.g., insulative clothing) factors that aid in maintaining body temperature are critical for the safety and performance of athletes. On top of cold ambient air, winter-sport athletes also deal with wind and precipitation as factors, which can increase cooling in winter environments [
4]. To mitigate these environmental factors, outdoor winter-sport athletes employ two key strategies to ensure optimal performance in their chosen sports. One, athletes use “dynamic warm-ups” defined as “physical activity or movement based exercise of sufficient length and intensity to increase muscle temperature and blood flow” [
5]. These warm-ups can last between 15 and 30 min and ideally occur immediately prior to the start of a competition [
6]. Second, athletes wear insulative clothing, like specific race suits, that allows for protection from cold, wind, and precipitation, which has resulted in the development of highly technical textile products for cold-weather athletes [
7]. However, in winter sports, such as snowboarding, alpine skiing, cross country skiing and biathlon, there is a typical interim period (1 to 20 min) between the end of the warm-up and the start of a competition. This interim period can be composed of various preparation tasks, including toileting, fluid intake, timing chip placement, travelling to the start area and taking of the warm-up clothing the competitor is wearing. The latter portion of this transition is primarily passive rest, which involves the athletes “waiting for their start”. This final period of time before a race start typically does not include much body movement, despite its known benefits on muscle temperatures, oxygen consumption and blood flow to muscles in warmer, above 0 °C, temperate environments [
8]. To date, our current understanding of how this interim period affects aerobic exercise performance and physiology, especially in cold conditions, is limited.
We do know that muscle temperature and neuromuscular function are linearly related [
9]; thus, it stands to reason that the maintenance of muscle temperature is paramount to performance in cold environments. In fact, exposure to ambient air below 20 °C is sufficient to decrease the maximal contractile force of skeletal muscles [
10], shift force- velocity curves to the left [
11] and reduce drop jump performance [
12]. These findings imply that cold stress—especially in sub-zero temperatures—likely affects winter-sport athletes prior to a race or competition. However, these effects prior to a race or high-intensity effort have received little attention in research. Those who have studied the interim period post warm-up have found that the longer the interim period, the greater the influence on reduced esophageal and skin temperature, as well as a 4% decrease in performance (running or rowing time trial time was slower) in 5 °C cool conditions [
13]. In outdoor winter sports, the results are equivocal, where insulative clothing worn during an interim period post warm-up improved the jump height performance at −7 °C [
14] but reduced the jump height in colder temperatures of −18 to −20 °C, where participants acted as their own controls [
15]. The influence of cold stress on performance has been shown to be reduced by wearing more insulative clothing during the interim period [
16,
17].
The interaction between the warm-up protocol and interim rest period on subsequent performance indicates that an interim rest period <20 min improves time to exhaustion [
18] in temperate environments. However, beyond 20 min, it has been shown that any benefit of a warm-up is lost in swimmers, which is associated with a loss in body temperature prior to the start of competition [
19]. This is due to the fact that the muscle temperature needs to be maintained, otherwise a rapid decrease in the muscle temperature can also occur upon the cessation of exercise [
20,
21], and this decreased muscle temperature has been shown to reduce exercise performance in temperate environments [
22].
Thus, given the influence that sub-zero cold exposure can have on exercise performance, the importance of systematically evaluating how the length of an interim period affects performance in winter-like conditions is warranted. Therefore, the main aim of this project was to determine how the length of an interim period affects subsequent exercise in severe cold air. Specifically, we aimed to understand how exercise performance, the physiology of thermoregulation and blood flow and perceptions of effort and comfort in severe cold were altered with different interim periods of waiting between a warm-up and start of maximal exercise. We hypothesized that the temperature chosen (−15 °C) would provide sufficient cooling [
23], such that a longer interim period would alter the response in the subsequent exercise performance trial. Our second objective was to explore whether sex influenced the performance, physiological and perceptual alterations for different interim periods.
2. Materials and Methods
2.1. Participants
We recruited 6 male and 8 female healthy adults between 18 and 40 years, where sex was defined as biological attributes that are associated with male- and female-specific physical and physiological features. Participant descriptive data are reported in
Table 1. Some participants were recruited due to personal contact with researchers planning the study (other staff and students within the sport science department). If the person wanted to know more about the study, they then reached out formally via e mail to the principle investigator, to express interest in participation, on their own accord. Alternatively potential participants heard about the study via social media within the local university community and surrounding geographic area. In each case, an interested participant was asked to e-mail the official address, at which time an information package was provided. If they chose, they then sent their informed consent to the lead researcher, which meets the participant autonomy criteria set forth by the Board for Ethical Questions, when the ethics for this project were approved. Participant inclusion criteria included being used to physical exertion with at least 3 years of regular habitual aerobic training [
24] and free from injury or illness based on the Physical Activity Readiness Questionnaire (PAR-Q) [
25], with a minimum V̇O
2max of 45 mL/kg/min for females and 50 mL/kg/min for males, which is a known threshold to tolerate exercise stress in this protocol [
26]. Exclusion criteria were existing acute or chronic illnesses, pregnancy or breastfeeding, regular cigarette smoking (more than 1 cigarette per day) and any sojourn to an altitude of over 2500 m in the last two weeks before the start of the study. All participants signed informed consent, which included statements regarding the protection of privacy rights. The informed consent was signed once all the inclusion and exclusion criteria were clarified. This process was in accordance with the policies and procedures set forth from the Board for Ethical Questions in Science of the University of Innsbruck (certificate of good standing 84/2022, dated 22 September 2022), conducted in accordance with the ethical standards set out in the 1975 Helsinki Declaration.
2.2. Study Design
The study was an open randomized cross-over design with the same exercise protocol in a cold air environment repeated in 3 different conditions in random order (see below for each condition). Prior to completing the 3 cold air trials, a baseline day was completed, which included the completion of a screening questionnaire for readiness to exercise and a graded exercise test to fatigue on a treadmill. The cold air tests were scheduled with a minimum of 48 h between tests in a 3-week window, and the study was completed across the autumn months of October and November and early December. The tests were conducted in the laboratories of the Department of Sport Science of the University Innsbruck (Austria). The overall ambient temperature of the geographic region of the Inn valley, where the university is located, was stable with daytime temperatures ranging from 0 to 20 °C (weatherspark.com).
Participants were instrumented with core temperature, EMG, muscle oxygen saturation sensors, as well as a heart rate monitor. This was all performed outside of the environmental chamber, and once all sensors were instrumented, the person dressed in a standard set of clothing as described below. All sensors were started to record in the preparation room, and then, the participant walked slowly to the environmental chamber, where they sat on the isometric knee-extension device to perform a maximum voluntary contraction knee extension as described below. Then, the participant entered the chamber, and the specific timeline is described above in
Figure 1.
Participants were asked to continue their normal exercise and activity patterns. However, on a scheduled test day participants were asked to abstain from caffeine, large meals and alcohol. Participants were reminded regularly to not complete any heavy workouts that might have had undue influence on preparation and fatigue for any of their test days. Normal commuting patterns, including walking and cycling to and from the laboratory, were allowed with specific instruction to perform no heavy intensive or prolonged exercise performed the day prior and the day of a scheduled visit.
2.3. Graded Exercise Test Day
In order to assess the V̇O
2max, participants completed a running graded exercise test (GXT; h/p cosmos sports & medical GmbH, Traunstein, Germany) to fatigue in ambient (20 to 22 °C) laboratory conditions (3-min stages starting at 6 km/h, increasing 1 km/h to volitional fatigue at a standard grade of 5%, [
27]) where expired gas analysis was measured continuously, averaged over 30 s to determine results post hoc (Oxycon Pro, Care Fusion, Höchberg, Germany). The heart rate (PS 800; Polar, Kempele, Finland) and oxygen saturation (finger pulse oximeter, Onyx II 9550, Nonin Medical, Plymouth, MA, USA) were also measured continuously. Perceptual measures, including Heavy Legs and Thermal State/Comfort scales, were measured at the end of each work stage. The speed of the last completed full work stage was the target intensity for the running trial in the subsequent 3 cold air trials. This workload was chosen based on previous research, which showed that 8-min of running at 5% grade at a speed that induced V̇O
2 peak values (denoted as the greatest measured V̇O
2 for this particular test protocol) was tolerated but resulted in severe intensity work at −15 °C [
26]. Familiarization of the environmental chamber was provided after the participant had cooled down and completed all their tests on the GXT day [
27].
2.4. Cold Air Trial Days
All ambient air conditions for the cold air trials were set at −15 °C and a relative humidity of 50%. This temperature was chosen to ensure that significant cooling occurred but warm enough that we were not putting participants in danger of cold-related health issues. All cold air trial testing occurred in a custom environmental chamber with a specialized treadmill (h/p cosmos sports & medical GmbH, Traunstein, Germany) that could operate in sub-zero conditions [
27].
The study had an open randomized cross-over design, with the same exercise protocol in a cold air environment repeated in 3 different conditions in random order: (1) no rest after warm-up (CON), (2) 6-min interim period (6IP) and (3) 12-min interim period (12IP) (see below for detailed information). The CON condition was a standardized warm-up with no rest where insulative clothing was removed in the minute between ending the warm-up and starting the 8-min performance trial; the 6IP was the standardized warm-up with 6 min rest where insulative clothing was kept on during the rest period and removed in the minute just prior to the 8-min performance trial; and the 12IP was the standardized warm-up with 12 min rest where insulative clothing was kept on during the rest period and removed in the minute just prior to the 8-min performance trial. The decision to make the IP conditions 6 and 12 min long was based on the typical times associated with waiting to start, and to ensure that we saw an effect of time, we decided that the long IP (12IP) should be twice as long as the short IP (6IP).
The standardized warmup included 5 min of walking at a 1% grade, then 5 min of running at 2 km/h less than the V̇O
2 max velocity, at a 1% grade, and then 5-min running at 2 km/h less than the V̇O
2 max velocity with three surges to the V̇O
2 max velocity for 15 s equidistant apart. This warmup protocol has been used previously in cold air research and adequately prepared participants for the heavy-intensity stage [
28].
For all conditions, the participant ended the warm-up intermittently walking and standing for the allotted rest period prior to the start of the high-intensity protocol. The speed participants walked at in the active rest period was 3 km/h with the pattern of walk/stand being 1 min of each starting with walking. The performance trial consisted of 8-min at a velocity equal to the last completed stage in the GXT at a 5% grade. At the end of minute 1, 3, 5, and 7, Heavy Legs and Thermal State/Comfort scales were administered [
27].
Insulative clothing was standardized across participants and included a synthetic high wicking top and bottom base layer (McKinley, Yalata base layer set), a mid-layer consisting of a Lycra top and bottom (Jakroo, Ruka race suit) and the insulative clothing layer, which consisted of a technical jacket (Loffler, Gore Windstopper® Alpha WS Light jacket) and pants (Loffler, Gore Windstopper® WS Warm Bib Tights). Participants wore the same head covering (Jakroo, Denali Nordic Hat), wore no neck tube or buff and were allowed to choose their own gloves. A full range of sizes for male and female participants was available, and clothing was laundered using the same detergent after each use.
2.6. Physiological Measures
Muscle oxygenation was measured using two NIRS monitors (Moxy Monitor; Fortiori Design, Hutchinson, MN, USA) placed on the participants’ left leg, in the vastus medialis (VM) and vastus lateralis (VL) muscles according to Seniam recommendations [
30]. Muscle O
2 saturation (SmO
2) was measured continuously in both the VM and VL stored in real time within a Garmin Forerunner 945 for subsequent download in Garmin Connect software (Garmin Ltd., Olathe, KS, USA) for analysis.
The heart rate was measured continuously using a Garmin Pro Plus heart rate strap (HRM-Pro 8.1, Garmin Ltd., Olathe, KS, USA) transmitted in real time to a Garmin Forerunner 945 watch for subsequent download in Garmin Connect.
The core body temperature was measured using a novel wireless non-invasive heat-flux-based thermometer that uses the skin temperature and heat flux and to estimate the core body temperature (CALERAresearch; greenTEG AG, Ruemlang, Switzerland). The core body temperature algorithm is based on a combination of classical biophysical and machine learning models trained on more than 1 million data points. The temperature sensor was placed on the mid-axial line, below the heart rate strap, secured as per manufacturer guidelines, directly on the skin. These probes have been validated during exercise previously [
31].
For all physiological measures cited above, the recording was started in the instrumentation room and only stopped after the person was done and returned to the room where probes and clothing were removed. There was much extraneous recorded data on the front end and back end of each trial, but we felt that this was the only way to ensure that all devices were synced and operating correctly before we headed to the chamber.
2.7. Perceptual Effort and Thermal State/Comfort Scales
Localized muscular fatigue was measured with the Heavy Leg Scale, modified from the Borg CR-10 scale previously shown to evaluate localized muscular fatigue [
32]. The range rating was from “0—not heavy at all” to “10—extremely heavy” [
33]. Similar CR10-derived scales have been used to assess muscle soreness in studies involving interventions in cold environments [
34]. The Personal Thermal State was evaluated with the Scale of Perceptual Judgements on Personal Thermal State, which asks “How are you feeling now?” This scale asked of the participants thermal comfort state [
35] with a scale ranging from “ +5—Extremely Hot” to “−5—Extremely Cold”. The cumulative cold stress in extreme environments was determined with the Cold Discomfort Scale by asking “How cold do you feel right now?” [
36]. The scale range was “0—Not feeling cold in any way” to “10—feeling unbearably cold”.
2.8. Data Management and Statistical Analysis
Heart rate and SmO
2 data were exported to Garmin Connect online software (v.2022) where visual inspection of each participant’s files allowed each stage of each trial to be identified. The primary identification determination was the running cadence (steps/min), with the secondary evaluation as the pace (min/km), as shown in
Figure 1. Once time points were visually identified, the 1-min average heart rate and SmO
2 were taken. The maximum heart rate for each trial was determined as the highest 5 s average heart rate within the 8-min intense running stage.
Based on previous research, exercise at −14 °C alters performance after insulative clothing is removed, and thus, we estimated that to see an effect of cold air exposure in −15 °C cold air, at least 8 subjects were required (ES = 0.5, α = 0.05; β = 0.8) [
23]. Since knowledge about sex differences in cold exposure is very limited, a similar number of females and males were included in the study.
The primary evaluation of the data set was performed with Q-Q plots for outlier identification. Group-level data are expressed as the means and standard deviations (SDs). Normal distribution, sphericity and homogeneity were determined with a Shapiro–Wilk test, Mauchly’s W-test, and Levene test, respectively. All data met these assumptions. We used a mixed model ANOVA design (sex [between] × condition [within]x time point[within]) for HRavg, MVC, SmO2VL, SmO2VM, heavy legs, cold discomfort and thermal state scale values. Distance and HRmax were analyzed with mixed measures ANOVAs as (sex [between] × condition [within]). In case of a significant effect, post hoc Bonferroni analyses were used to identify the significant pairwise group differences. For all analyses, the statistical significance level was set at α = 0.05 (two-tailed). To assess the effect size of the mixed model ANOVAs, the partial eta squared was used, assuming a strong effect from η
p2 > 0.14 and a medium effect between η
p2 = 0.06 and η
p2 = 0.14 [
37]. In post hoc power analyses, the result was considered meaningful if the power was greater than 0.8 (1–β > 0.8). Data in tables are presented as means ± standard deviations, with data in figures as means and standard errors. Data management and analysis was performed with Excel (Microsoft Corporation, Seattle, WA, USA, 2018), Jamovi version 2.3 (The Jamovi Project, Sydney, Australia, 2022), and power was calculated using G*Power version 3.1.9.7.
3. Results
Overall, there was no difference in the distance run between conditions (CON: 1619.0 ± 180.1 m, 6IP: 1618.0 ± 180.3 m, 12IP: 1615.8 ± 179.7 m;
p = 0.162) with no interaction effect between sex and condition (
p = 0.682). Males, on average, ran approximately 237 m more than females (
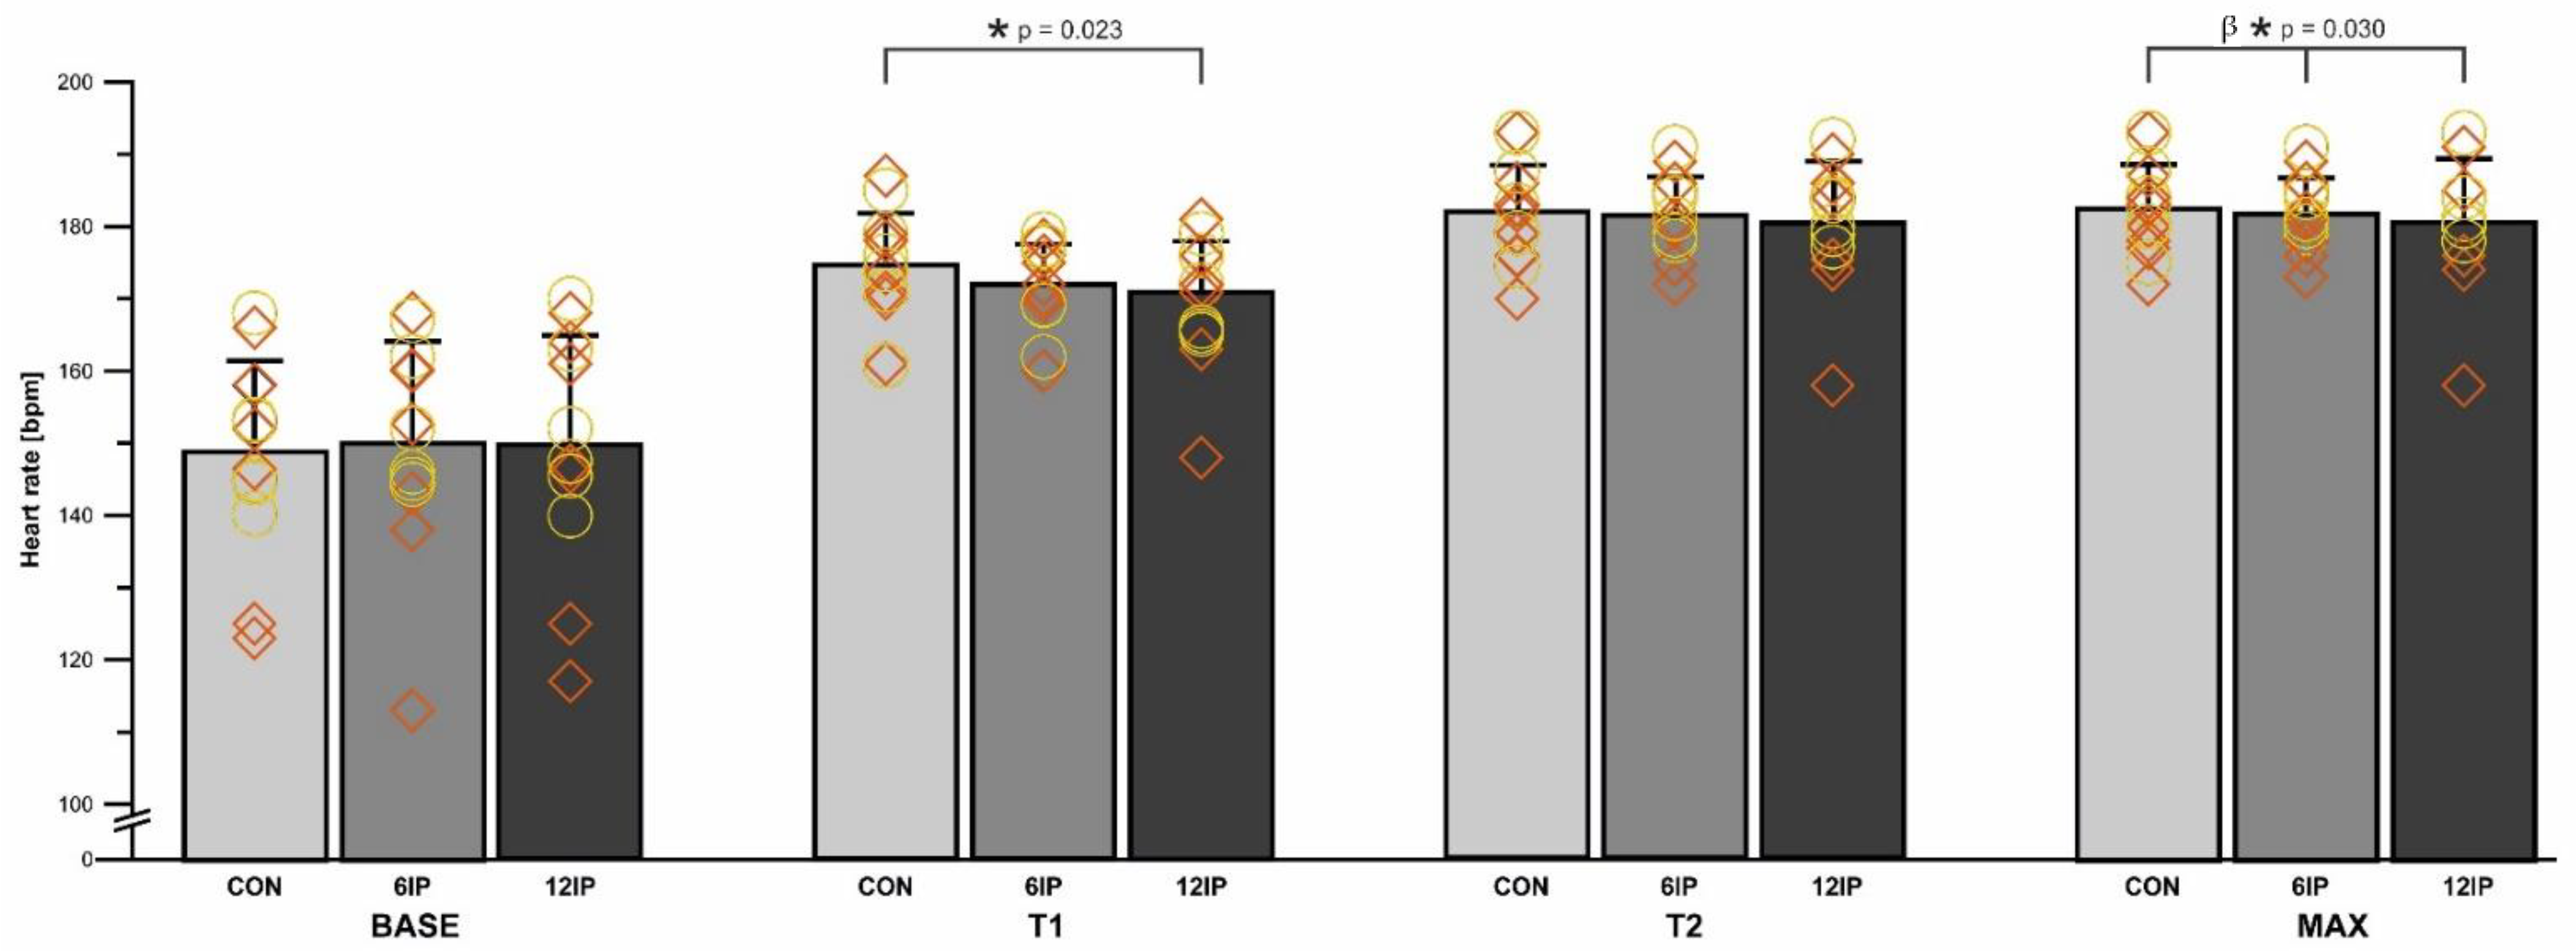
p = 0.008). As shown in
Figure 2, HR was significantly lower in the first minute (T1) of the 12IP performance trial (170.0 ± 8.9 bpm) compared to the CON (175.0 ± 7.7 bpm;
p = 0.023) but not 6IP (172.0 ± 6.0 bpm;
p > 0.05). There was no difference in HR between males and females in any condition (
p = 0.450), and there was no significant interaction among the condition, time and sex (
p = 0.903), although males had a greater relative increase in the HR in each condition from T1 to T2 (males: 5.3, 6.3, 7.1%; females: 3.4, 4.9, 5.6% for CON, 6IP, 12IP respectively). The overall peak HR (MAX) was significantly decreased (
p = 0.03) in the 12IP condition (181.0 ± 9.1 bpm) compared to 6IP (182.0 ± 5.1 bpm) and CON (183.0 ± 6.2 bpm) with no difference between sexes (
p = 0.319;
Figure 2). There was no interaction effect between condition and sex (
p = 0.63); however, females had a lower peak HR (MAX) than males in the 12IP condition (
Figure 2).
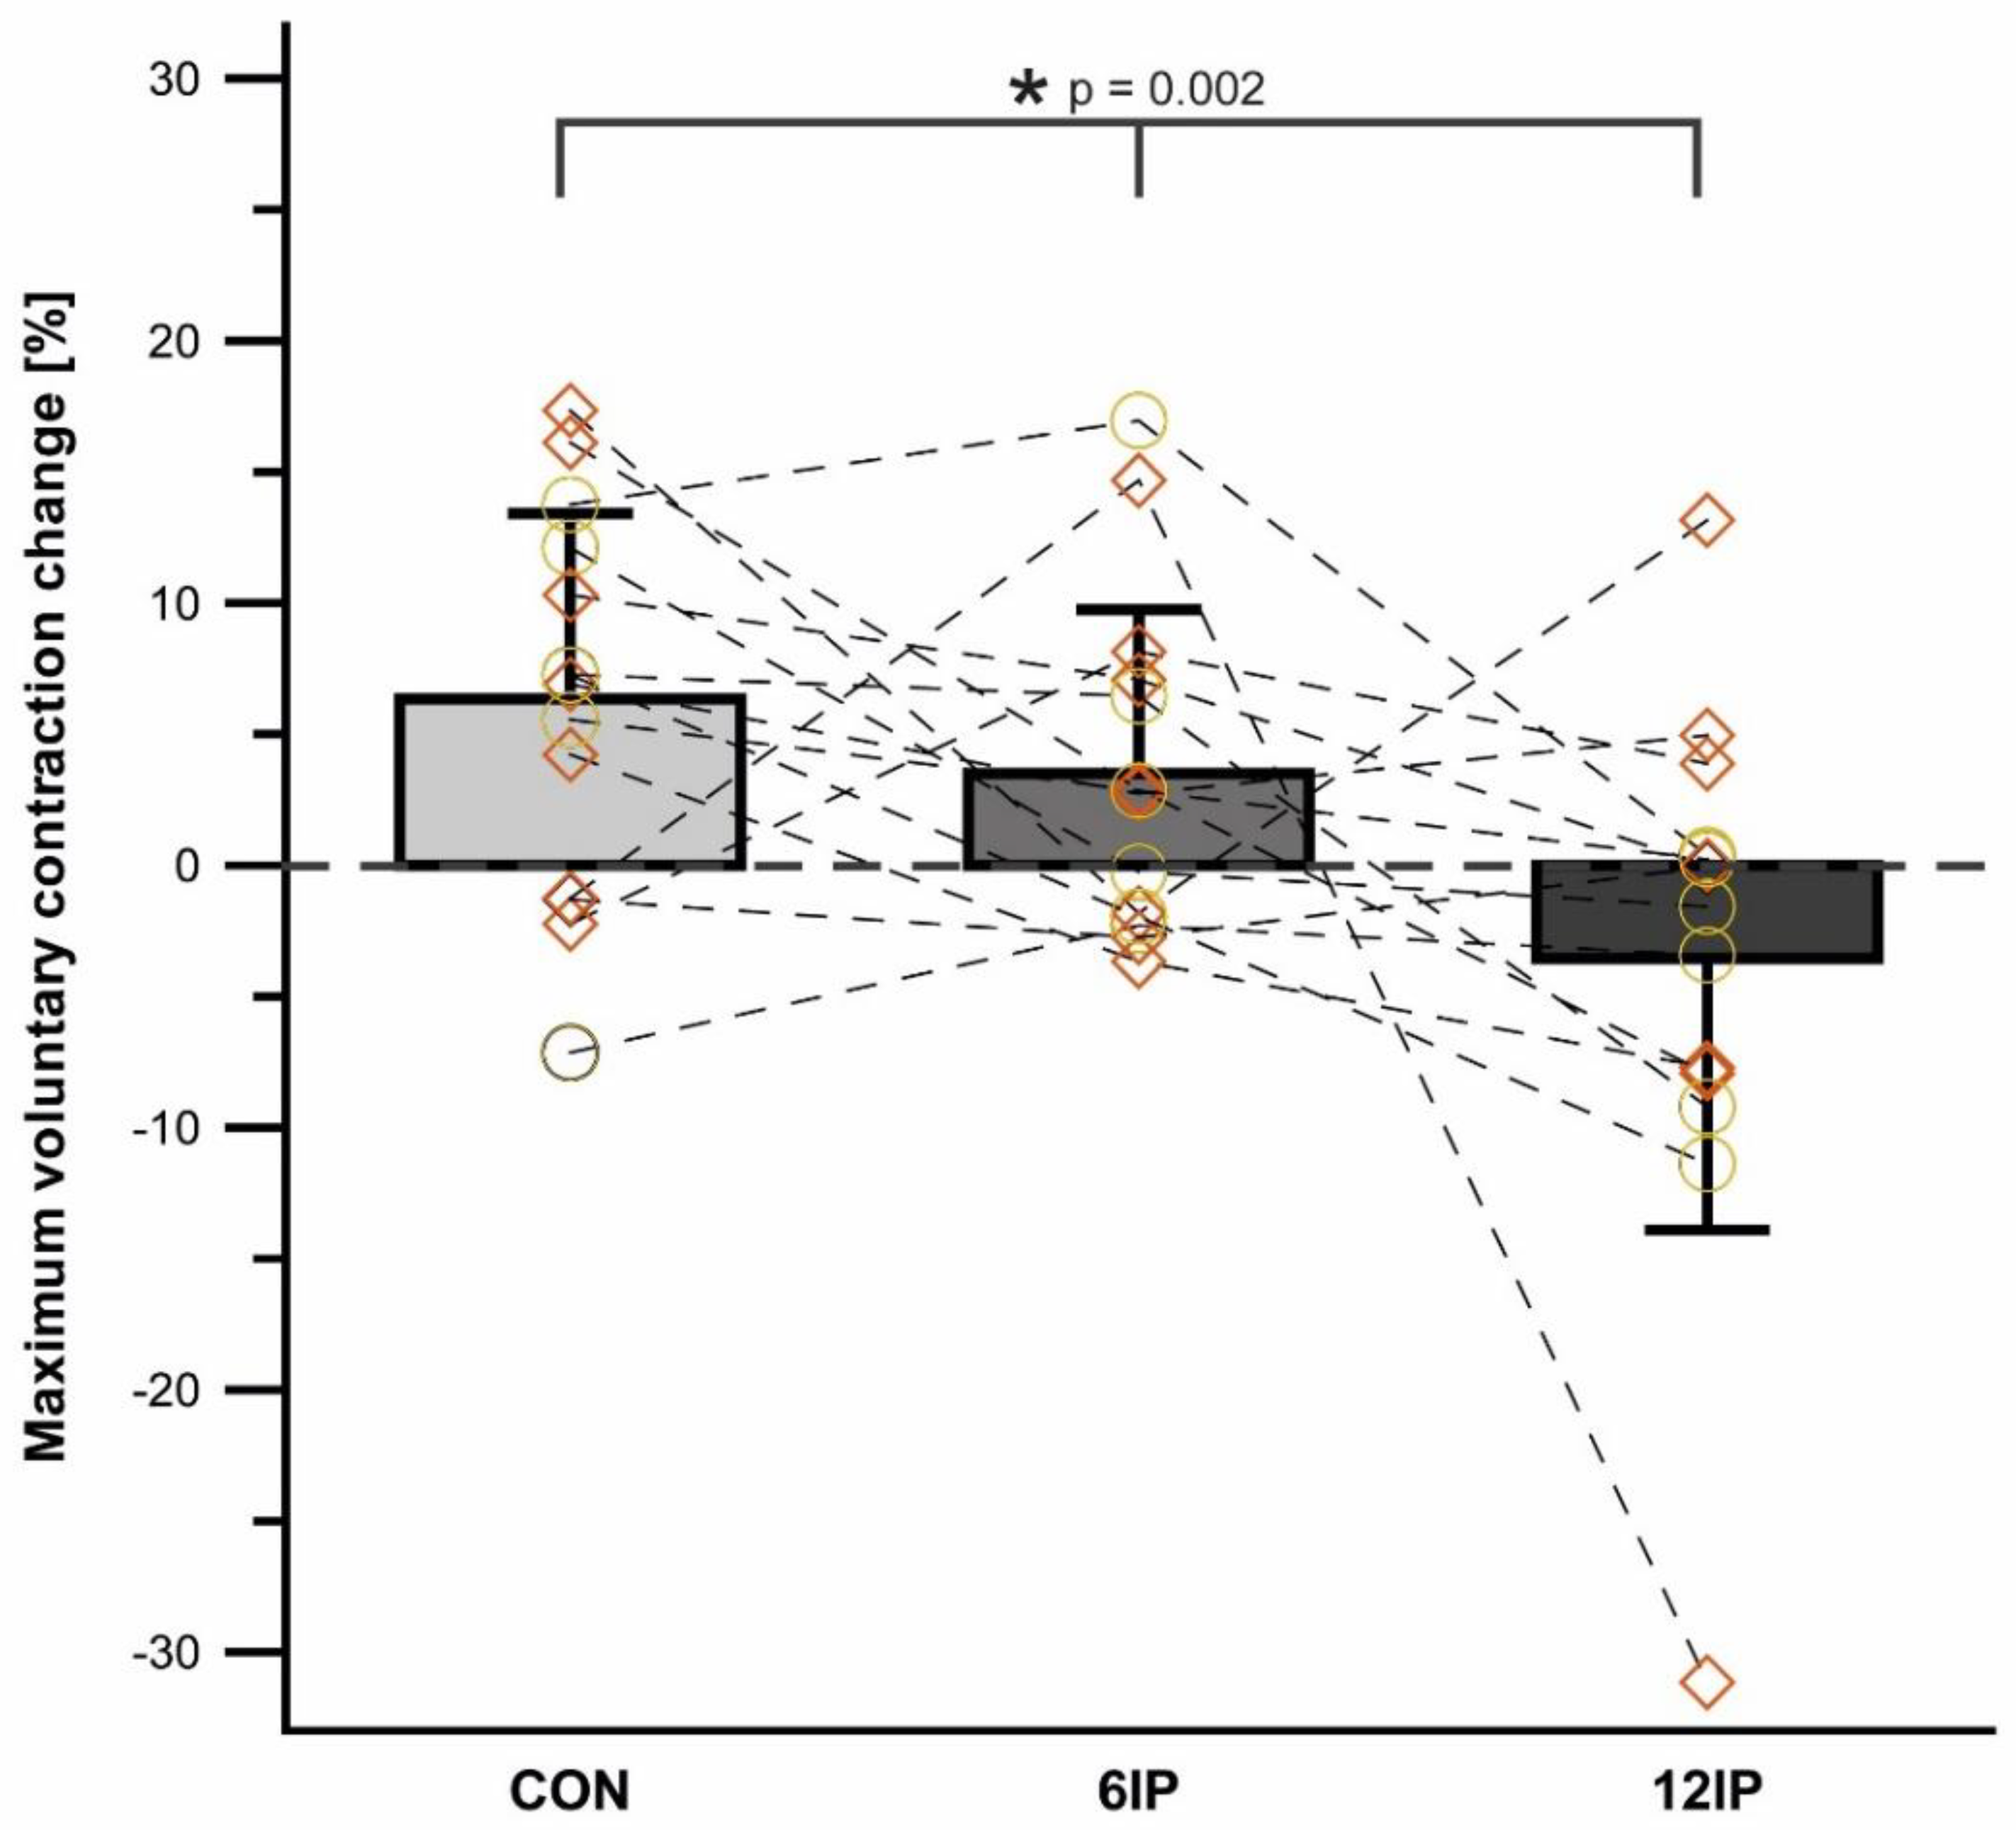
Figure 3 shows the overall change in MVC for each condition, as well as the individual change per condition. There was no difference overall in the MVC pre-post (
p = 0.167) or between conditions overall (
p = 0.329), but males, overall, had a significantly greater MVC compared to females (
p = 0.001) with no interaction effect between sex and condition (
p = 0.658). There was a significant interaction between time and condition (
p = 0.002), where CON increased 6.3% pre-post, which was different from 6IP (3.5% increase), and with a 3.6% decrease in the 12IP condition (males decreased 4.2% and females 3.1%). These mean differences relate to the individual trends, as shown in
Figure 3, where 10 of the 14 participants increased the MVC post-CON, whereas only 3 increased the MVC and 3 had no change in the 12IP condition.
Table 2 provides an overview of the perceptual responses to the performance trial in the beginning minute (T1) and the last minute of the trial (T2) and the associated delta change (raw units). There was no difference between conditions for heavy legs (
p = 0.451) or between sexes (
p = 0.575), but overall, there was a difference between T1 and T2 of the performance trial (
p = 0.003) as shown in
Table 2 (heavy legs went from “Slight” to “Severe” overall and in males and females). There was no main effect of condition for the cold discomfort scale (
p = 0.256), time (
p = 0.361) or sex (
p = 0.512), nor were there any interaction effects. As noted in
Table 2, there was a trend towards participants being colder at the start of the performance trial in the 12IP condition (“Somewhat Severely Cold”) compared to “Slightly to Moderately Cold” in the CON condition. Each 8-min trial in each condition reduced cold discomfort (see
Table 2), and females had greater cold discomfort at the beginning of each trial compared to males (see
Table 2). There was a significant main effect of condition for the Thermal State (
p < 0.001), where pairwise comparisons revealed that participants rated their thermal state in CON as warmer at the beginning of the performance trial and also at the end (see
Table 2). There was no main effect for sex (
p = 0.541), and there was a trend for increased thermal comfort from T1 to T2 (
p = 0.055). S post hoc comparison showed that females had a significantly greater increase in the thermal state in each condition (
p = 0.042, see
Table 2) and the delta increase in females in 12IP (2.5 scale units increase) was significantly greater than the 12IP change in males (0.5 scale units; see
Table 2).
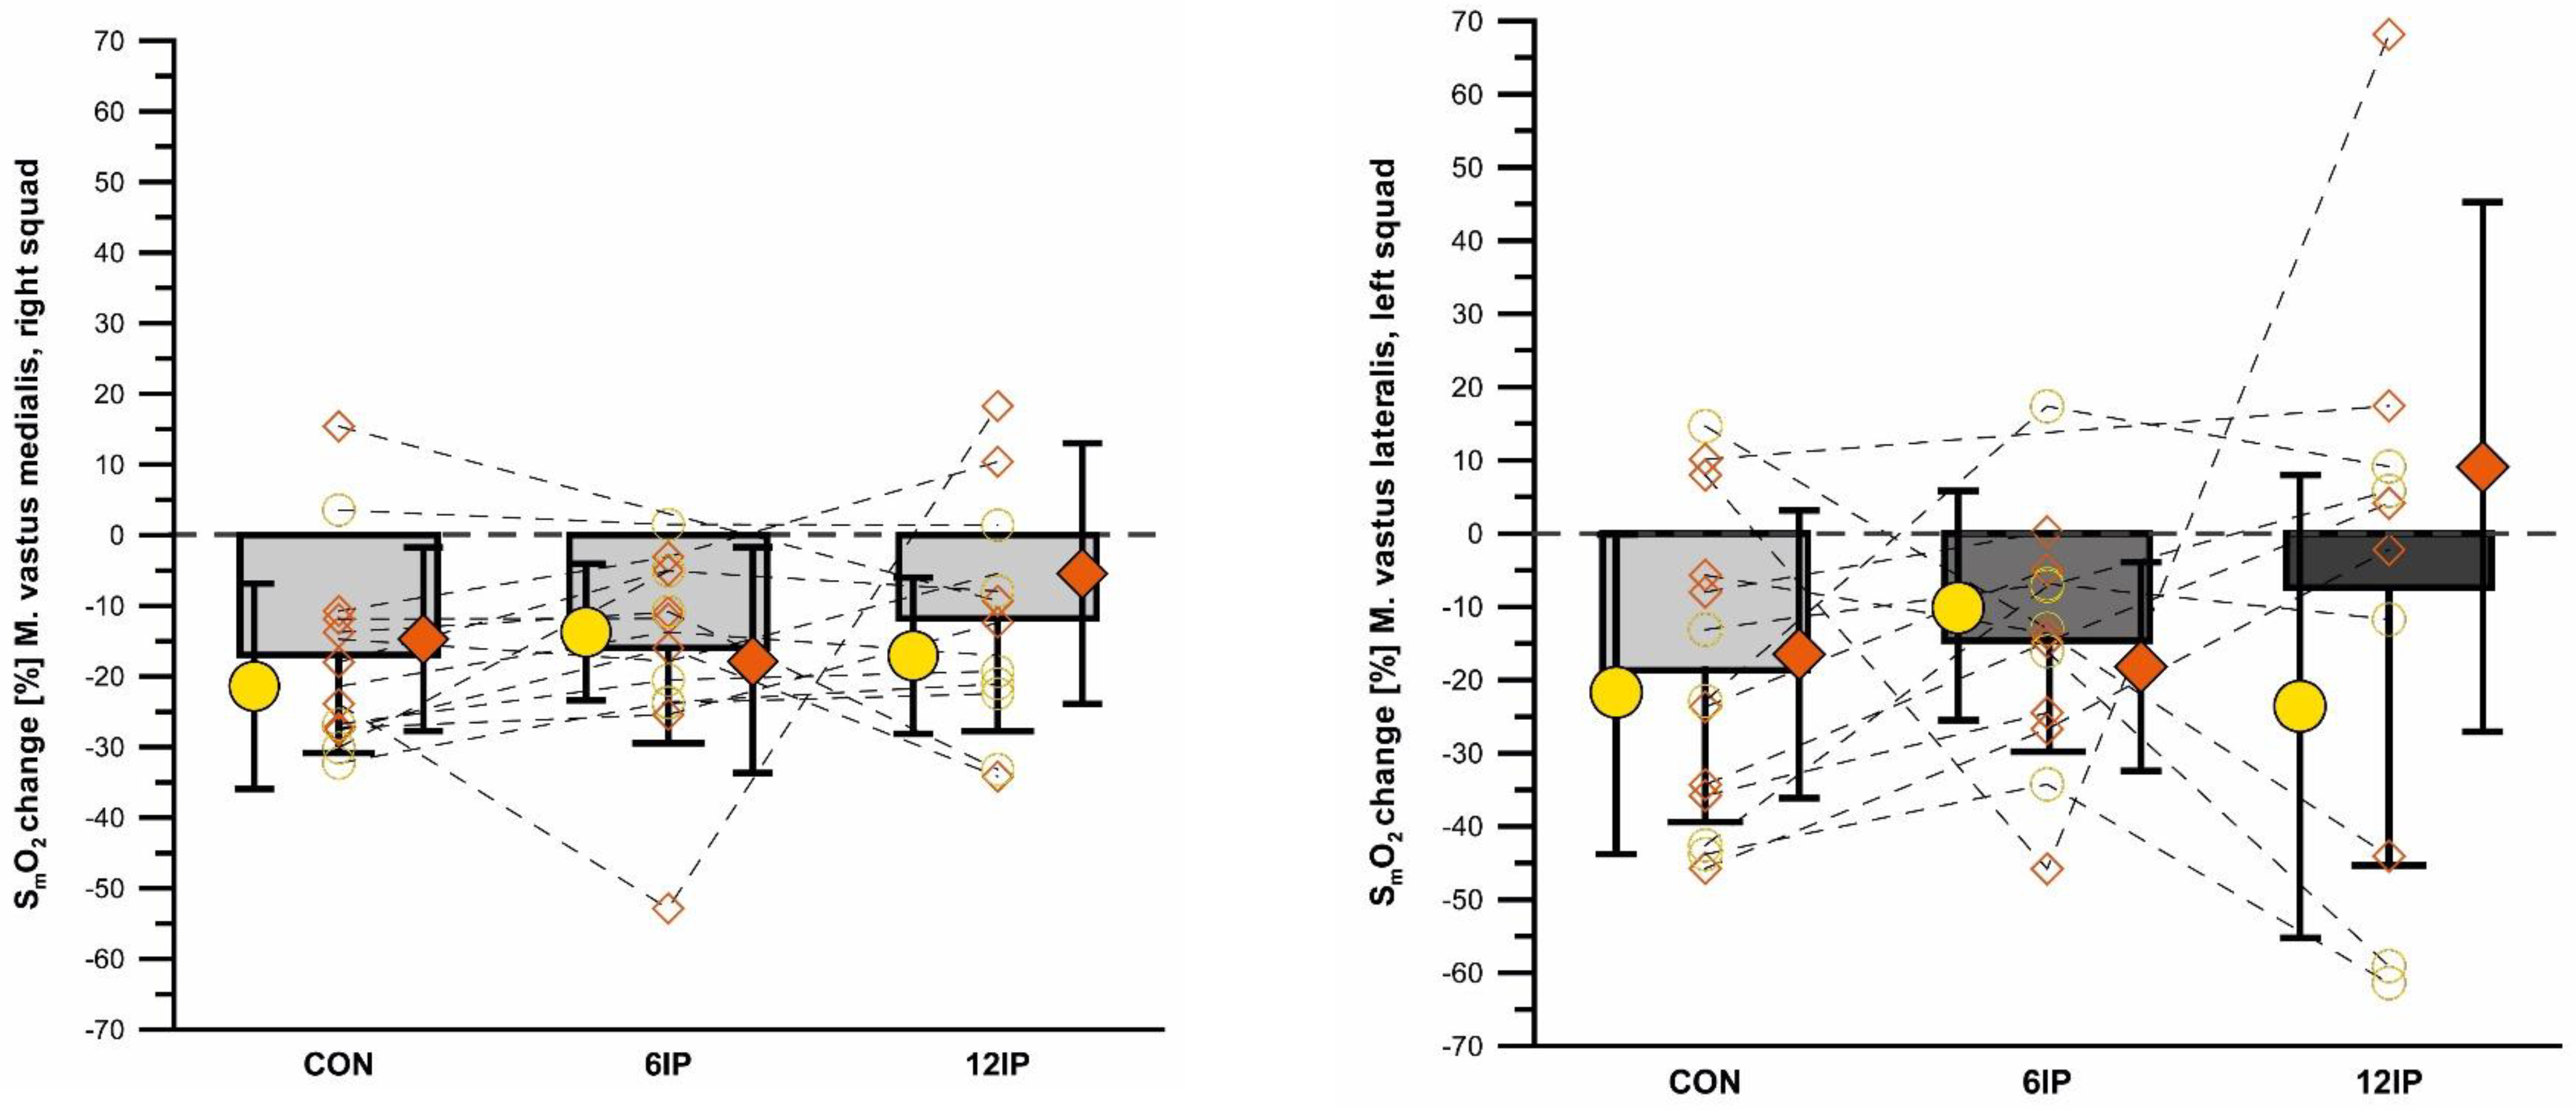
There was an overall effect of condition for 12IP SmO
2VM where 12IP was lower than both 6IP (
p = 0.045) and CON (
p = 0.031) conditions. There was an overall decrease in SmO
2VM from the start to the end of the performance trial (
p = 0.009), with no differences between conditions for the magnitude of this decrease (
Figure 4). SmO
2VM was lowest at the start of the performance trial in the 12IP condition (35.6 ± 7.9) compared to 6IP (44.0 ± 15.5) and CON (44.3 ± 13.1), although neither of these comparisons were significant. There was no difference in SmO
2VM between males and females (
p = 0.997), however, and although females had a greater SmO
2VM in minute 1 and minute 8 compared to males in each condition, this was not significant (
p = 0.343).
There was no overall difference in SmO
2VL between conditions (
p = 0.546) or change in SmO
2VL from the beginning to the end of the performance trial (
p = 0.394) (see
Figure 4). The 12IP condition had lower starting SmO
2VL values (38.6 ± 18.4) compared to 6IP (40.4 ± 16.9) and CON (46.0 ± 17.6), although neither of these comparisons were significant. Overall, there was no difference in SmO
2VL between males and females (
p = 0.768), except for 6IP, where females had significantly greater SmO
2VL at minute 1 (
p = 0.011).
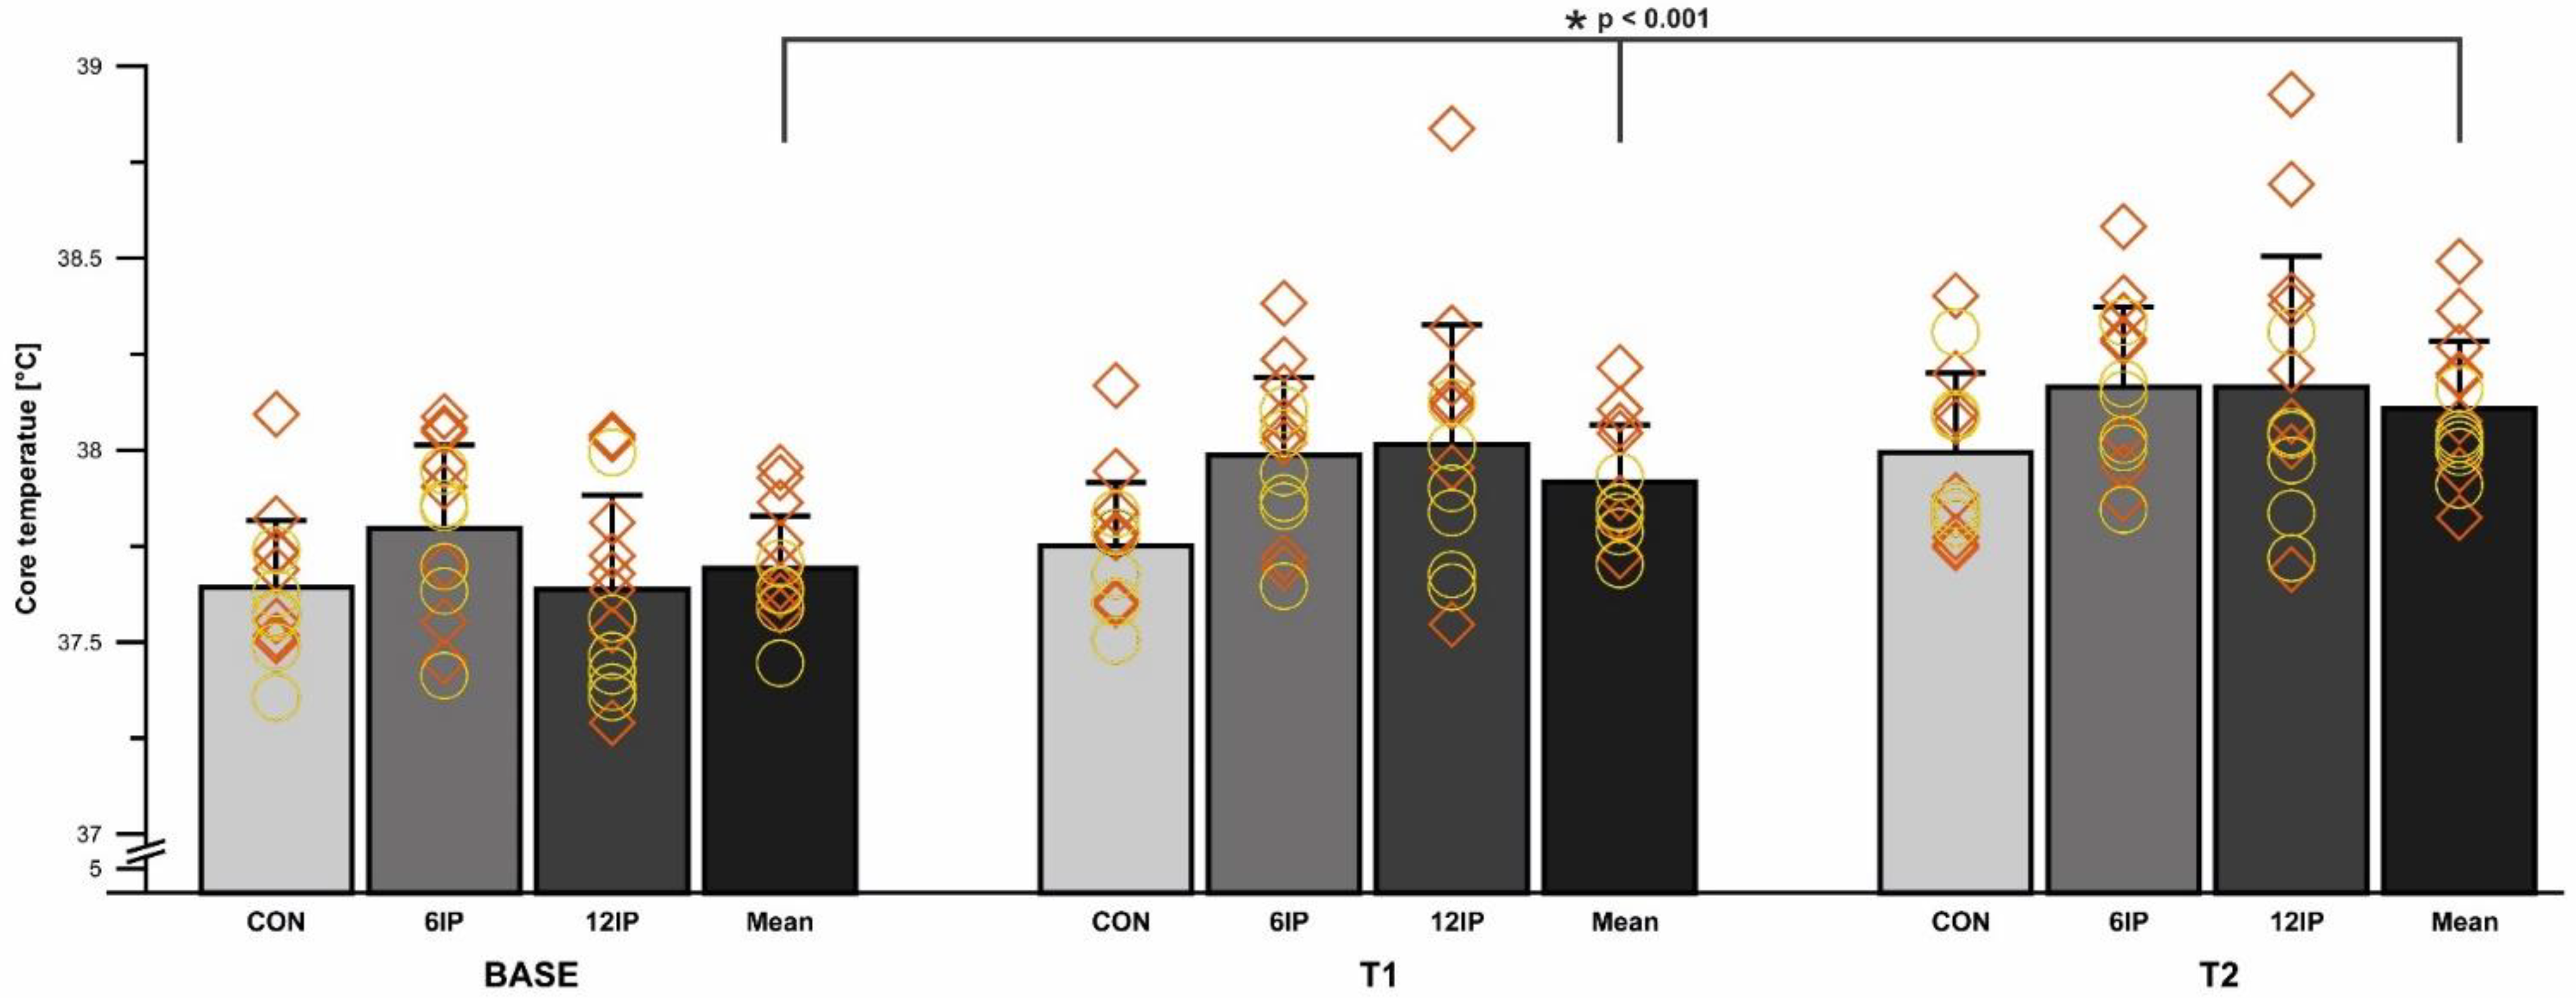
Overall, there was a difference in the core body temperature between conditions (
p < 0.001); specifically, CON was less than 6IP (
p = 0.012). The core body temperature differed overall between time points (
p < 0.001), with BASE significantly lower than T1 and T2 and T1 less than T2 (all
p < 0.001; see
Figure 5 below). Females had a greater core body temperature at BASE (
p = 0.046) and T1 (
p = 0.044) compared to males, but the overall core body temperature did not differ significantly between males and females within each condition (
p = 0.877).
4. Discussion
The interim period did not alter the magnitude of performance significantly given that there were only a few participants who saw reduced performance (see results for specific changes). The hypothesis that increased cold exposure (longer rest) would reduce performance was not confirmed either, with only one female in the 12IP (1% reduction) and two males in the 6IP condition (1% reduction) asking for a treadmill speed reduction late in the performance trial. These minimal reductions in distance with prolonged cold exposure are consistent with previous research with no interim period (like our CON condition), where no differences in distance travelled were found at an air temperature of −15 °C compared to warmer air temperatures of 0 °C, −5 °C, and −10 °C [
27]. The performance measured as running speed is, however, significantly reduced in −18 °C conditions compared to 20.2 °C [
38], which illustrates that cold air may have an effect on performance. Given that there were negligible changes in running performance, it is reasonable to assume that fatigue, measured as the change in MVC from pre- to post-trial in the key locomotor muscles of the leg, would also not be significantly different across conditions. However, there were some noticeable differences in MVC between conditions, where on average, the MVC increased from pre- to post-trial in the CON and 6IP conditions, while it decreased in the 12IP condition. There were 10 participants (5 females) in the CON condition that increased MVC, on average by 38.9 N, whereas in the 12IP, there was an average decrease of 22.7 N for 8 participants (4 females). The reduced MVC in the 12IP condition may be explained by greater cooling affecting the muscle temperature, which can reduce muscle power [
11,
22] and peak power by up to 7.2% at −14 °C [
23]. Given that the 12IP condition did not have a significantly lower core body temperature compared to CON and 6IP, this points to muscle tissue temperature potentially being the more important factor in muscle power decline. This is in contrast to previous research, which showed that the core temperature and muscle tissue temperature fall in parallel with reduced muscle power immediately after cooling has occurred in the leg muscle [
22]. We would hypothesize that the warm-up with the slow walking that occurred in the interim period might have been sufficient to maintain the core temperature but not sufficient to maintain the muscle tissue temperature; however, more research should explore this hypothesis. Given that the time course of muscle temperature cooling has been shown to occur within 10 min [
21], it also makes sense that in the 12IP condition, the cooling time was sufficient to have an effect on the muscle tissue temperature. Thus, given that high-intensity exercise has a significant effect on raising the muscle temperature in warmer conditions, it appears that the 8-min performance trial in this study was not sufficient to overcome the cooling effect of the 12IP interim period on muscle force production post-trial. Collectively, these results indicate that going directly from your warm-up to the start of your race likely has key benefits to muscle power compared to a longer rest period as shown by the reduced MVC in the 12IP condition. Further research should look at the time course of muscle tissue temperature changes in cold-air environments to understand how the tissue temperature affects muscular performance both before and after a high-intensity aerobic exercise bout. In addition, longer durations of cold exposure could be applied.
It was expected that HR in the first minute of the performance trial would be less in the 12IP condition due to a combination of the time HR recovery duration [
13] and cold-induced HR reduction during the interim period [
39]. The net influence of a lower initial HR in the 12IP condition on HR achieved in the final minute of the trial affected the female participants more than the male participants. This is the first study to show a sex-based difference in the HR response to different interim periods, although others have shown that a longer rest period in 5 °C air affects the peak HR achieved at the end of a rowing or running time trial in a mixed-sex cohort [
13]. Overall, it is known that the slope of the HR/V̇O
2 relationship is flatter (i.e., less steep) in colder air conditions [
39], and our results indicate that a sex-based difference in accumulated cold stress may also exist, especially when looking at the 12IP condition. There is limited research to compare to our findings but what might be considered is that males and females with no rest period have a similar average HR (152 male vs. 150 female) when running for 40 min in 10 °C conditions [
40]. In addition, severe cold (−15 °C) with no rest period showed no difference in male and female HR responses to an 8-min exercise trial [
26]. Thus, our results suggest that a severe cold air rest period may affect the physiology of thermoregulation more in females, and this should be confirmed in future research.
Although not statistically significant, female participants did report a 2-fold greater cold discomfort score (were “severely cold”) compared to males (were “slightly to moderately cold”) at the beginning of the performance trial in the 12IP cooling condition. This was also associated with females also being “cold” on the thermal state scale in the 12IP condition compared to males being “cool” at the start of the performance trial, a finding that aligns with current perspectives on female responses to whole-body cooling [
41]. To the best of our knowledge, this is one of the first studies to measure cold discomfort during a physical activity trial and the first to report a sex-based difference. The original research on cold discomfort found that after 25 min of passive −20 °C exposure in one layer of insulative clothing, participants rated themselves as severely cold [
36]. In contrast, despite the benefits of two extra layers of insulative clothing and a vigorous warmup, the 12IP interim period significantly increased cold discomfort in female but not male participants in the present study. It has been shown that the onset of shivering (using a passive cooling model) is significantly shorter in females and related to a low BMI [
42], which might physiologically explain some of the differences between sexes in this study. Compared to the males’ BMI in this study (21.6 ± 1.8), the female participants’ average BMI was 18.1 ± 1.7 (range: 15.8 to 20.4), which is associated with low adiposity and lean muscle mass [
43]. This lower BMI may have then reduced any protective effect that adipose and lean mass might have on delaying the “threshold of cold perception” onset [
42]. Given that “feeling cold” as reported in the 12IP condition by females has been associated with significant alterations in the skin temperature and core temperature preservation [
44], the core temperature results in this study do not fit this conclusion. In fact, female participants in this study did not have, on average, a lower core temperature at T1 compared to males (
Figure 5), which highlights, in this case, that perceptions of the thermal state and comfort are not necessarily related to body temperature (i.e., feeling colder is not tied to an actual decreased core temperature). Collectively, these perceptual responses reveal some key sex-based differences in the 12IP condition that have consequences on competition preparedness, especially in female endurance athletes, and how they perceive cold discomfort and the thermal state prior to a race.
The performance trial had the desired effect of being strenuous enough to induce feelings of “severe” heavy legs overall with no differences between sexes or conditions. The increased heavy legs were associated with a decreased SmO
2 from the beginning to the end of the performance trial in all conditions and in both sexes (see
Table 2). A key finding was the lower SmO
2 in both VM and VL in the first minute in the 12IP condition, compared to 6IP and CON. A likely explanation is that blood flow may have been reduced in 12IP, due to longer exposure to cold air compared to 6IP and CON during the interim period, thereby decreasing muscle oxygenation. Accordingly, reduced muscle blood flow has been reported as one of the main physiological responses to cold-temperature exposure in previous research [
45]. Males also had lower starting SmO
2 values in the first minute in both VM and VL, which reflects a potentially greater O
2 extraction in the working muscle, as has been shown in the heavy phase of graded exercise testing in 22 °C indoor temperatures during cycling [
46] and treadmill exercise [
47]. Others have previously illustrated that significant O
2 extraction, as measured based on SmO
2 at the onset of exercise, occurs in the first minute of exercise in warm ambient conditions [
48]; however, this study is the first showing that a similar magnitude of extraction occurs in severe cold weather exercise, and the magnitude of extraction is greater in males. Given that the time course of SmO
2 after a warm-up is not well studied, we can hypothesize that the warm-up likely had a positive effect on muscle oxygenation and the unloading of hemoglobin. This has been found previously in warm ambient conditions (20–22 °C) where a prior heavy exercise bout (10 min of cycling at a work intensity 50% between anaerobic threshold and V̇O
2 max) with a 10 min break does improve the deoxygenated hemoglobin signal in muscle [
49].
From a limitations standpoint, it should be noted that the participants’ faces were uncovered for the duration of the exposure and there is a known link between cutaneous reflexes in the face and upper airway and thermoregulation [
50]. Future research, which investigates face cooling, would assist in understanding the magnitude of the influence on the whole body perceptual thermal state and thermoregulation [
51]. We also acknowledge that the participants were living their normal life, which included other recreational pursuits and exercise bouts. Thus, despite specific instructions to modify and avoid heavy-intensity exercise, there might have been undue fatigue in specific participants, which could have influenced the results based on their weekly recreation and exercise patterns. Looking back on the performance trial, we expected a bigger difference in the distance run over 8-min. This lack of a difference likely did not give us the full influence of the interim period on performance, whereas if we had performed a time-to-fatigue trial, we may have seen greater changes between IP conditions.
5. Conclusions and Practical Applications
The use of non-invasive physiological measures provides practical guidance to others who might study cold weather exercise, especially in field settings. Thus, these technologies are recommended in the field, especially given that there was no loss of signal for either heart rate, core body temperature or muscle oxygenation. Caution is advised that the application of the MOXY monitor to the VM and VL requires careful secure placement, especially if insulative layers are put over the legs, to not dislodge the probes.
It was found that the length of the interim period does influence both physiological and perceptual responses. We would highlight that one of the most notable changes was thermal comfort, where 12 min of waiting produced significant thermal discomfort, potentially negating any value of a warm-up on subsequent performance. It can be ascertained that the effect of the cold exposure on thermal comfort is greater in females and necessitates likely different approaches to pre-competition management in males and females. The finding that core body temperature was overall less after the warm-up compared to the performance trial time highlights that a moderate-intensity warm-up may not be enough to counteract whole-body cooling in −15 °C ambient environments, despite excellent insulative clothing. Furthermore, the value of keeping insulative clothing on during an interim period appears to be important to counteract further cooling that might occur in the non-intense exercise interim periods of 6 or 12 min. Our study compared no rest to 6 or 12 min of rest; however, it would be worthwhile to examine how rest periods of intermediate durations (e.g., 3 or 9 min) may alter the physiological and performance responses. For example, it may be that 3-min rest allows athletes to recover slightly from the warm-up-induced fatigue but not long enough to allow for excessive cooling, which could negatively affect performance and physiological responses.
The practical applications of this research extend to several cold-weather sports where waiting for the start occurs [
4]. To our knowledge there is no official manual, coaching manual or risk management advice on what should be the recommended length of time a participant in cold-weather winter sports, such as cross country skiing, should wait before their start. Furthermore, this study had participants maintain all of their insulative clothing for the interim periods (6IP and 12IP conditions), yet in many winter sports, athletes have to actually wait in just their race suit for a period of time [
6]. The creation of applied risk management for a whole-body cold-exposure model should be a long term endeavor to provide sound evidence-based recommendations for organizing committees, athletes and coaches in cold-winter sports [
15]. The strength of this study, by keeping the insulative clothing on, was that we could better isolate the effects of only ’time’, without inducing another conditions (of removing warm-ups). Yet, this is also a limitation because it cannot be determined how no insulative clothing might have also altered these responses to a performance trial. It should also be noted that the effects of wind chill were not included, despite the importance that wind speed has on cooling in outdoor winter sports [
4]. These results also extend to training sessions, where athletes and coaches can better control the length of waiting before a time trial or interval session, and the results of this study would recommend reducing the waiting time to less than minutes. For competitions, planning should be intensified, where each athlete should have exact times and locations of the pre-start and start area, and distances to be covered by the athlete before the start should be known and included in their pre-race plan.


 ,
, 
