Article

ShadeNet: Innovating Shade House Detection via High-Resolution Remote Sensing and Semantic Segmentation

School of Aeronautics and Astronautics, Sun Yat-sen University, Shenzhen Campus, No. 66, Gongchang Road, Guangming District, Shenzhen 518107, China
*
Author to whom correspondence should be addressed.
Appl. Sci. 2025, 15(7), 3735; https://doi.org/10.3390/app15073735
Submission received: 15 February 2025 / Revised: 25 March 2025 / Accepted: 25 March 2025 / Published: 28 March 2025
(This article belongs to the Special Issue Remote Sensing Image Processing and Application, 2nd Edition)

Abstract

:
Shade houses are critical for modern agriculture, providing optimal growing conditions for shade-sensitive crops. However, their rapid expansion poses ecological challenges, making the accurate extraction of their spatial distribution crucial for sustainable development. The unique dark appearance of shade houses leads to low accuracy and high misclassification rates in traditional spectral index-based extraction methods, while deep learning approaches face challenges such as insufficient datasets, limited receptive fields, and poor generalization capabilities. To address these challenges, we propose ShadeNet, a novel method for shade house detection using high-resolution remote sensing imagery and semantic segmentation. ShadeNet integrates the Swin Transformer and Mask2Former frameworks, enhanced by a Global-Channel and Local-Spatial Attention (GCLSA) module. This architecture significantly improves multi-scale feature extraction and global feature capture, thereby enhancing extraction accuracy. Tested on a self-labeled dataset, ShadeNet achieved a mean Intersection over Union (mIOU) improvement of 2.75% to 7.37% compared to existing methods, significantly reducing misclassification. The integration of the GCLSA module within the Swin Transformer framework enhances the model’s ability to capture both global and local features, addressing the limitations of traditional CNNs. This innovation provides a robust solution for shade houses detection, supporting sustainable agricultural development and environmental protection.

1. Introduction

With the growing consumer demand for agricultural products such as fruits, vegetables, and flowers, alongside the rapid development of the plastics industry, plastic films have become widely utilized in agriculture worldwide, significantly altering agricultural landscapes. Studies have shown that by the year 2000, the area of agricultural plastic covers (APCs) had exceeded 5000 square kilometers, and they have continued to grow since then with the advancement of agricultural modernization [1,2]. According to the Food and Agriculture Organization of the United Nations (FAO), plastic films are primarily used in agricultural protection structures such as plastic-covered greenhouses (PCGs), plastic-mulched farmlands (PMFs), and shade houses [3]. Shade houses create ideal growing conditions for crops that are sensitive to environmental changes, such as flowers and fruits, by regulating light, temperature, and controlling pests and diseases [4]. They are extensively used in areas for cultivating shade-loving crops. The FAO’s case studies have demonstrated that shade houses significantly enhance crop yield and quality at low economic costs, playing an important role not only in technological and ecological aspects, but also in promoting the sustainable development of agriculture on the socio-economic level, thus becoming an integral part of facility agriculture [5]. However, the rapid expansion of shade houses, which predominantly use plastic shading nets as a covering material, has resulted in numerous ecological challenges, including high greenhouse gas emissions [6], land occupation [7], soil acidification and salinization [8], biodiversity loss [9], and microplastic pollution [10]. Therefore, the management and monitoring of shade houses should be prioritized equally alongside PCGs and PMFs in the regulation of facility agricultural land. Accurately capturing the spatial distribution and area of shade houses is essential for crop monitoring, yield estimation, environmental conservation, and informed agricultural planning. Despite this, existing studies have largely focused on PCGs and PMFs [1,11], while the monitoring of shade houses remains underexplored. This study proposes a novel method for accurately extracting shade houses, which in turn facilitates the collection of distribution data and other relevant information, addressing this research gap.
Traditional APC extraction methods rely on manual surveys, which are time-consuming, inaccurate, and highly subjective [12]. Although remote sensing technology enables large-scale and real-time monitoring, the significant spectral differences between shade houses and PCGs make it difficult to establish a unified spectral index for the simultaneous extraction of these two structures [13]. As a result, the extraction of shade houses is often overlooked. Furthermore, traditional spectral index methods commonly face the issues of “same object, different spectra” and “different objects, same spectra”, making it challenging to accurately distinguish shade houses from other easily confused land covers [14]. While Wang et al. made some progress in shade house extraction using convolutional neural network (CNN)-based deep learning methods, their approach still suffers from low accuracy [15]. The local receptive field characteristic of CNNs limits their ability to capture global contextual information, particularly in complex terrain backgrounds, resulting in poor generalization [16]. More importantly, existing research often does not prioritize shade houses as the main extraction target, and specialized methods for shade house extraction are still lacking.
To overcome the challenges outlined above, this paper aims to propose a high-precision, shade houses-specific extraction method. We utilized high-resolution remote sensing imagery as the data source, and defined shade house extraction as a semantic segmentation task. The key problems to be addressed include the following:
  • The lack of datasets, as there is currently no publicly available semantic segmentation dataset for shade houses, and high-quality datasets are essential for training deep learning models.
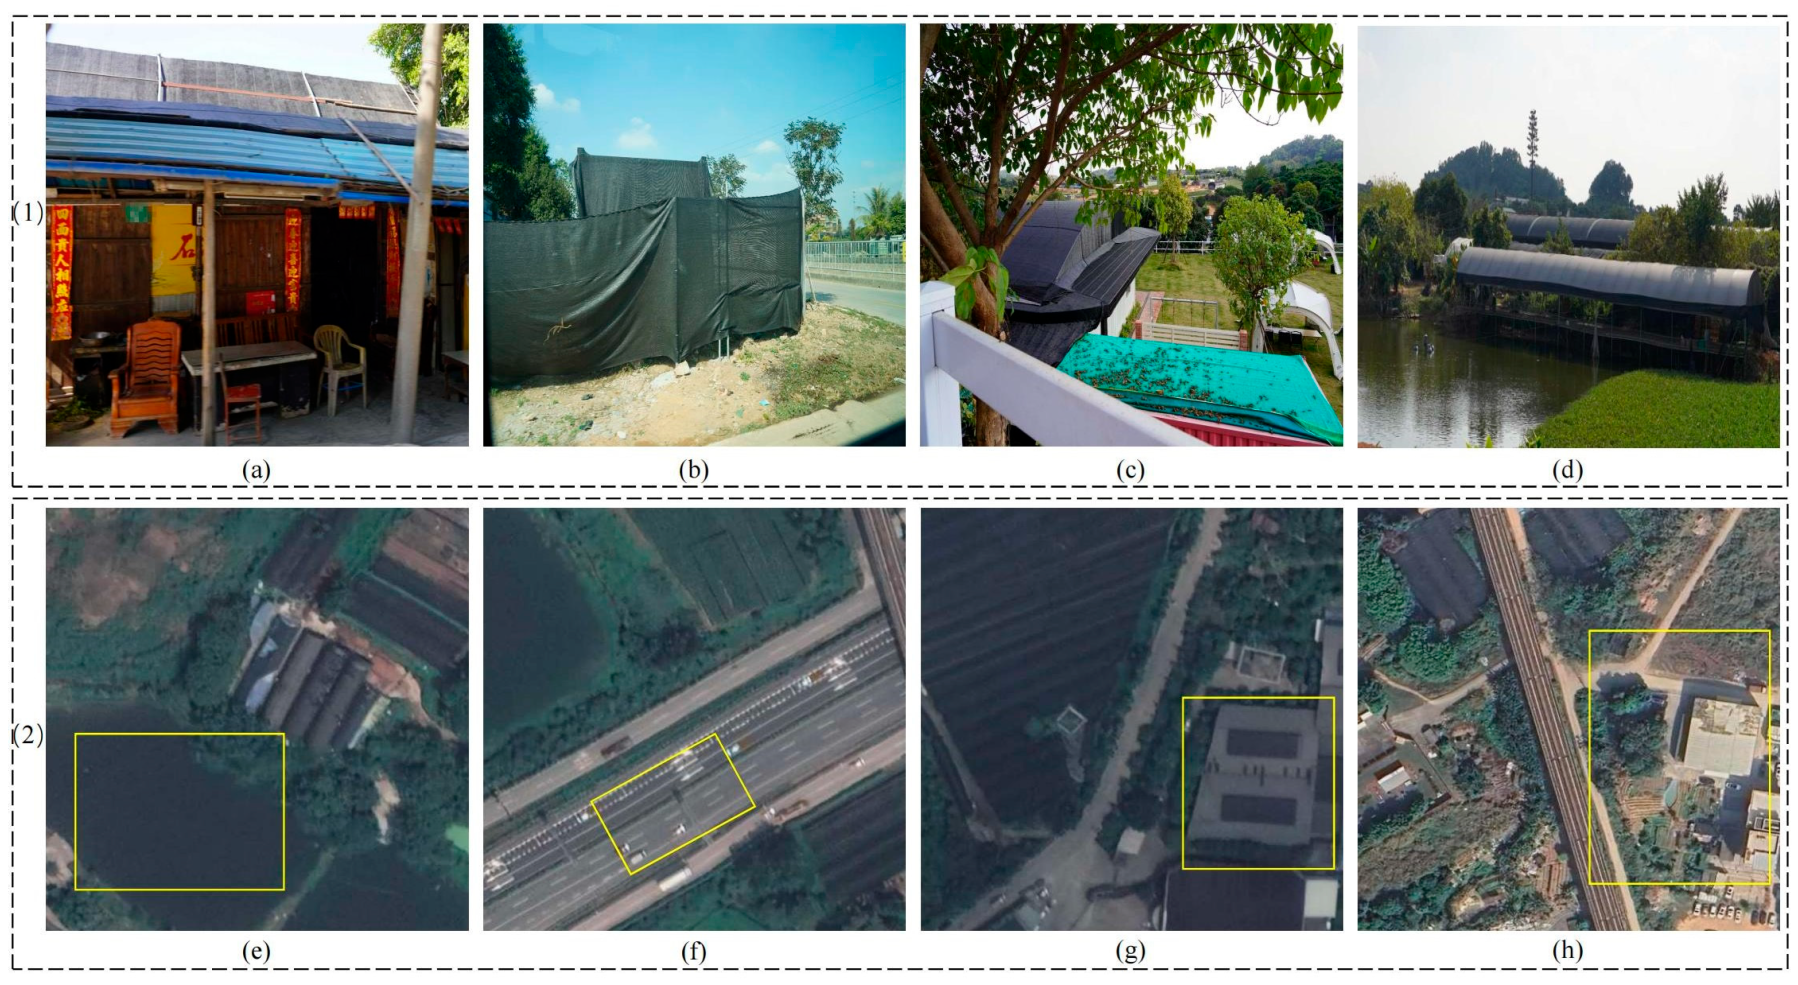
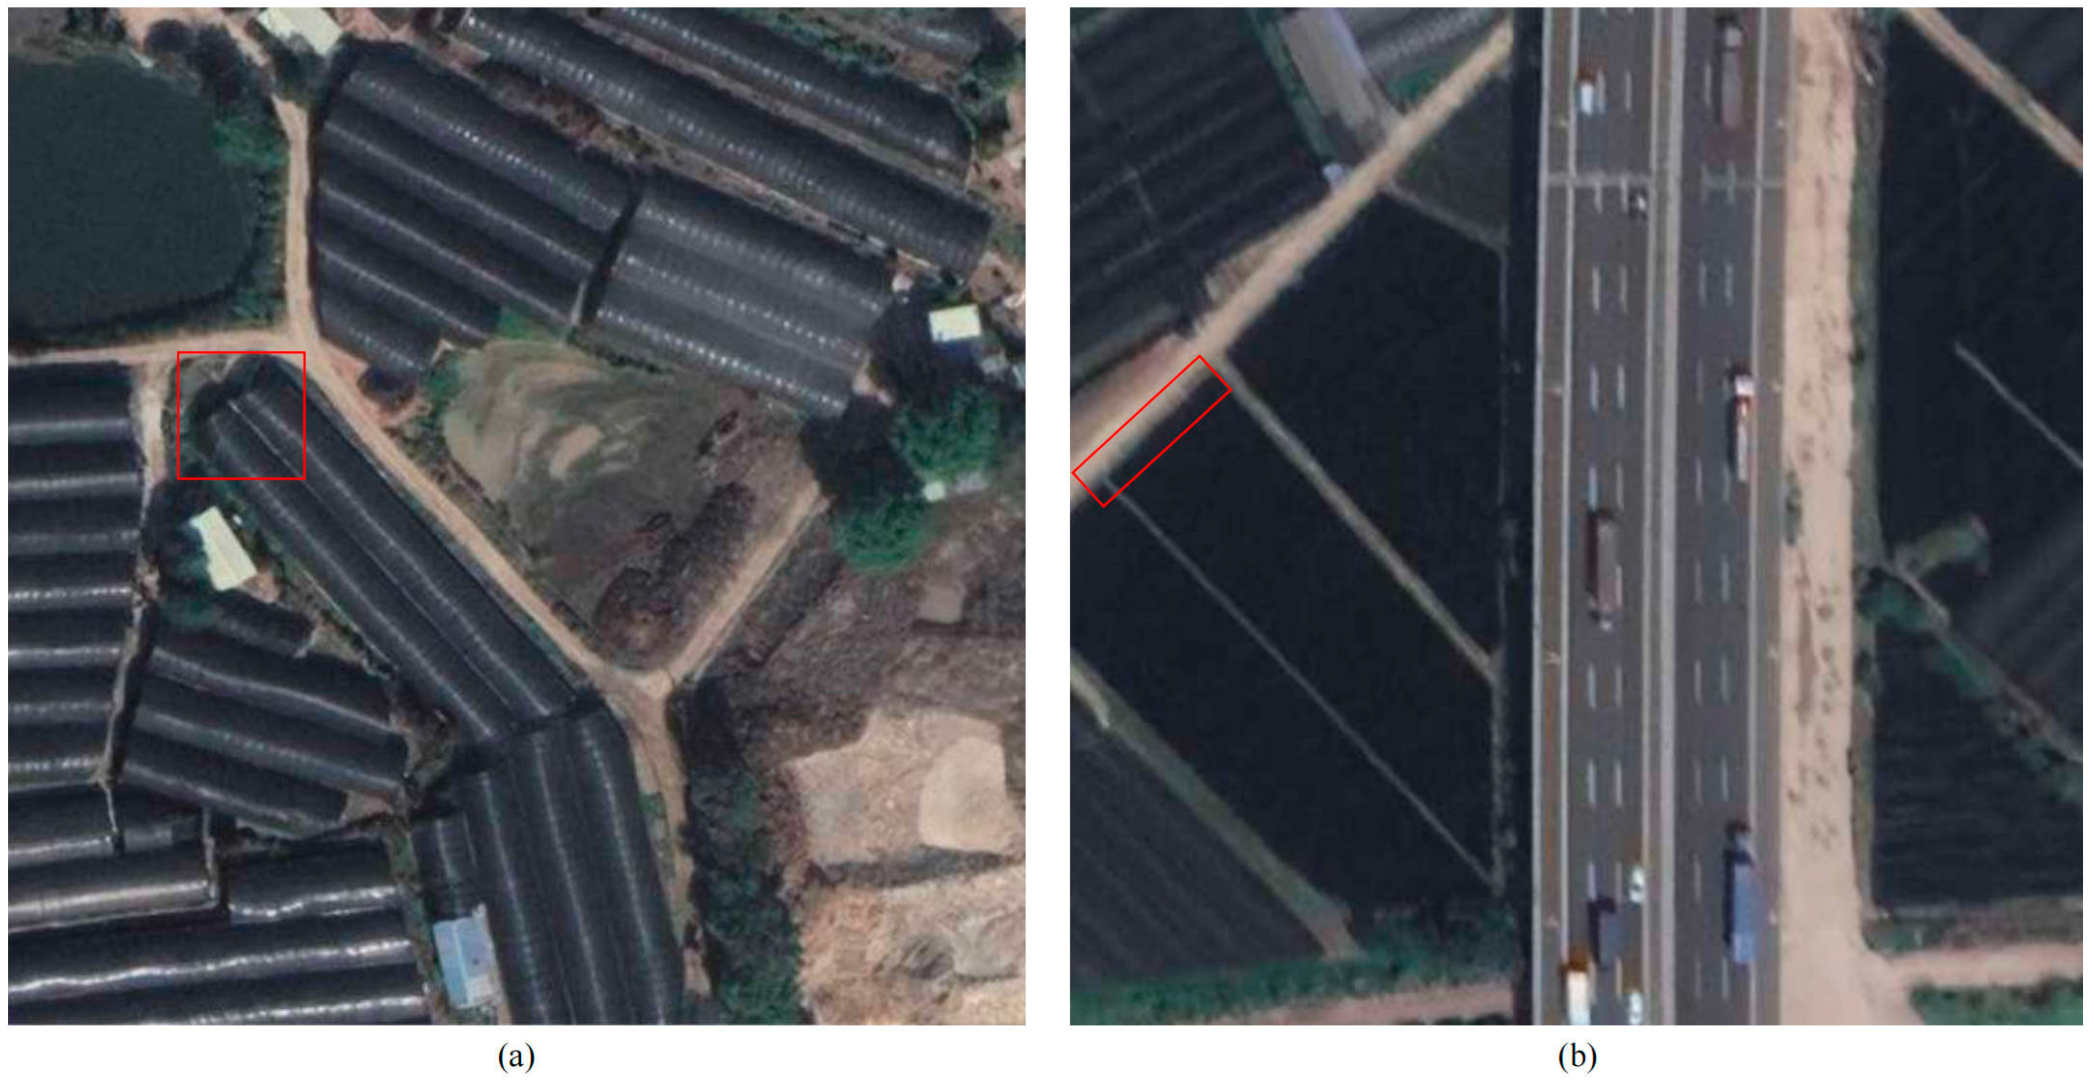
  • The low extraction accuracy, which is partly due to the concentrated distribution of shade houses, as farmers maximize land use, resulting in a high number and density of shade houses in the study area. Additionally, the dark appearance of shade houses often leads to confusion with black PMFs, roads, building shadows, and dark water bodies, causing diverse features to be present in high-resolution remote sensing imagery. This poses significant challenges for the accurate extraction of shade houses.
This paper introduces several key contributions:
  • We have constructed the first dedicated semantic segmentation dataset for shade houses. We collected six optical remote sensing images from Google Earth, each with a resolution of 38,656 × 34,048 pixels, covering the period from 2021 to 2023, and spanning all four seasons. The data were annotated using SAM-Tool (https://github.com/facebookresearch/segment-anything, accessed on 24 March 2025), resulting in a dataset containing 4101 image patches of size 512 × 512 pixels. This dataset provides essential data support for subsequent research.
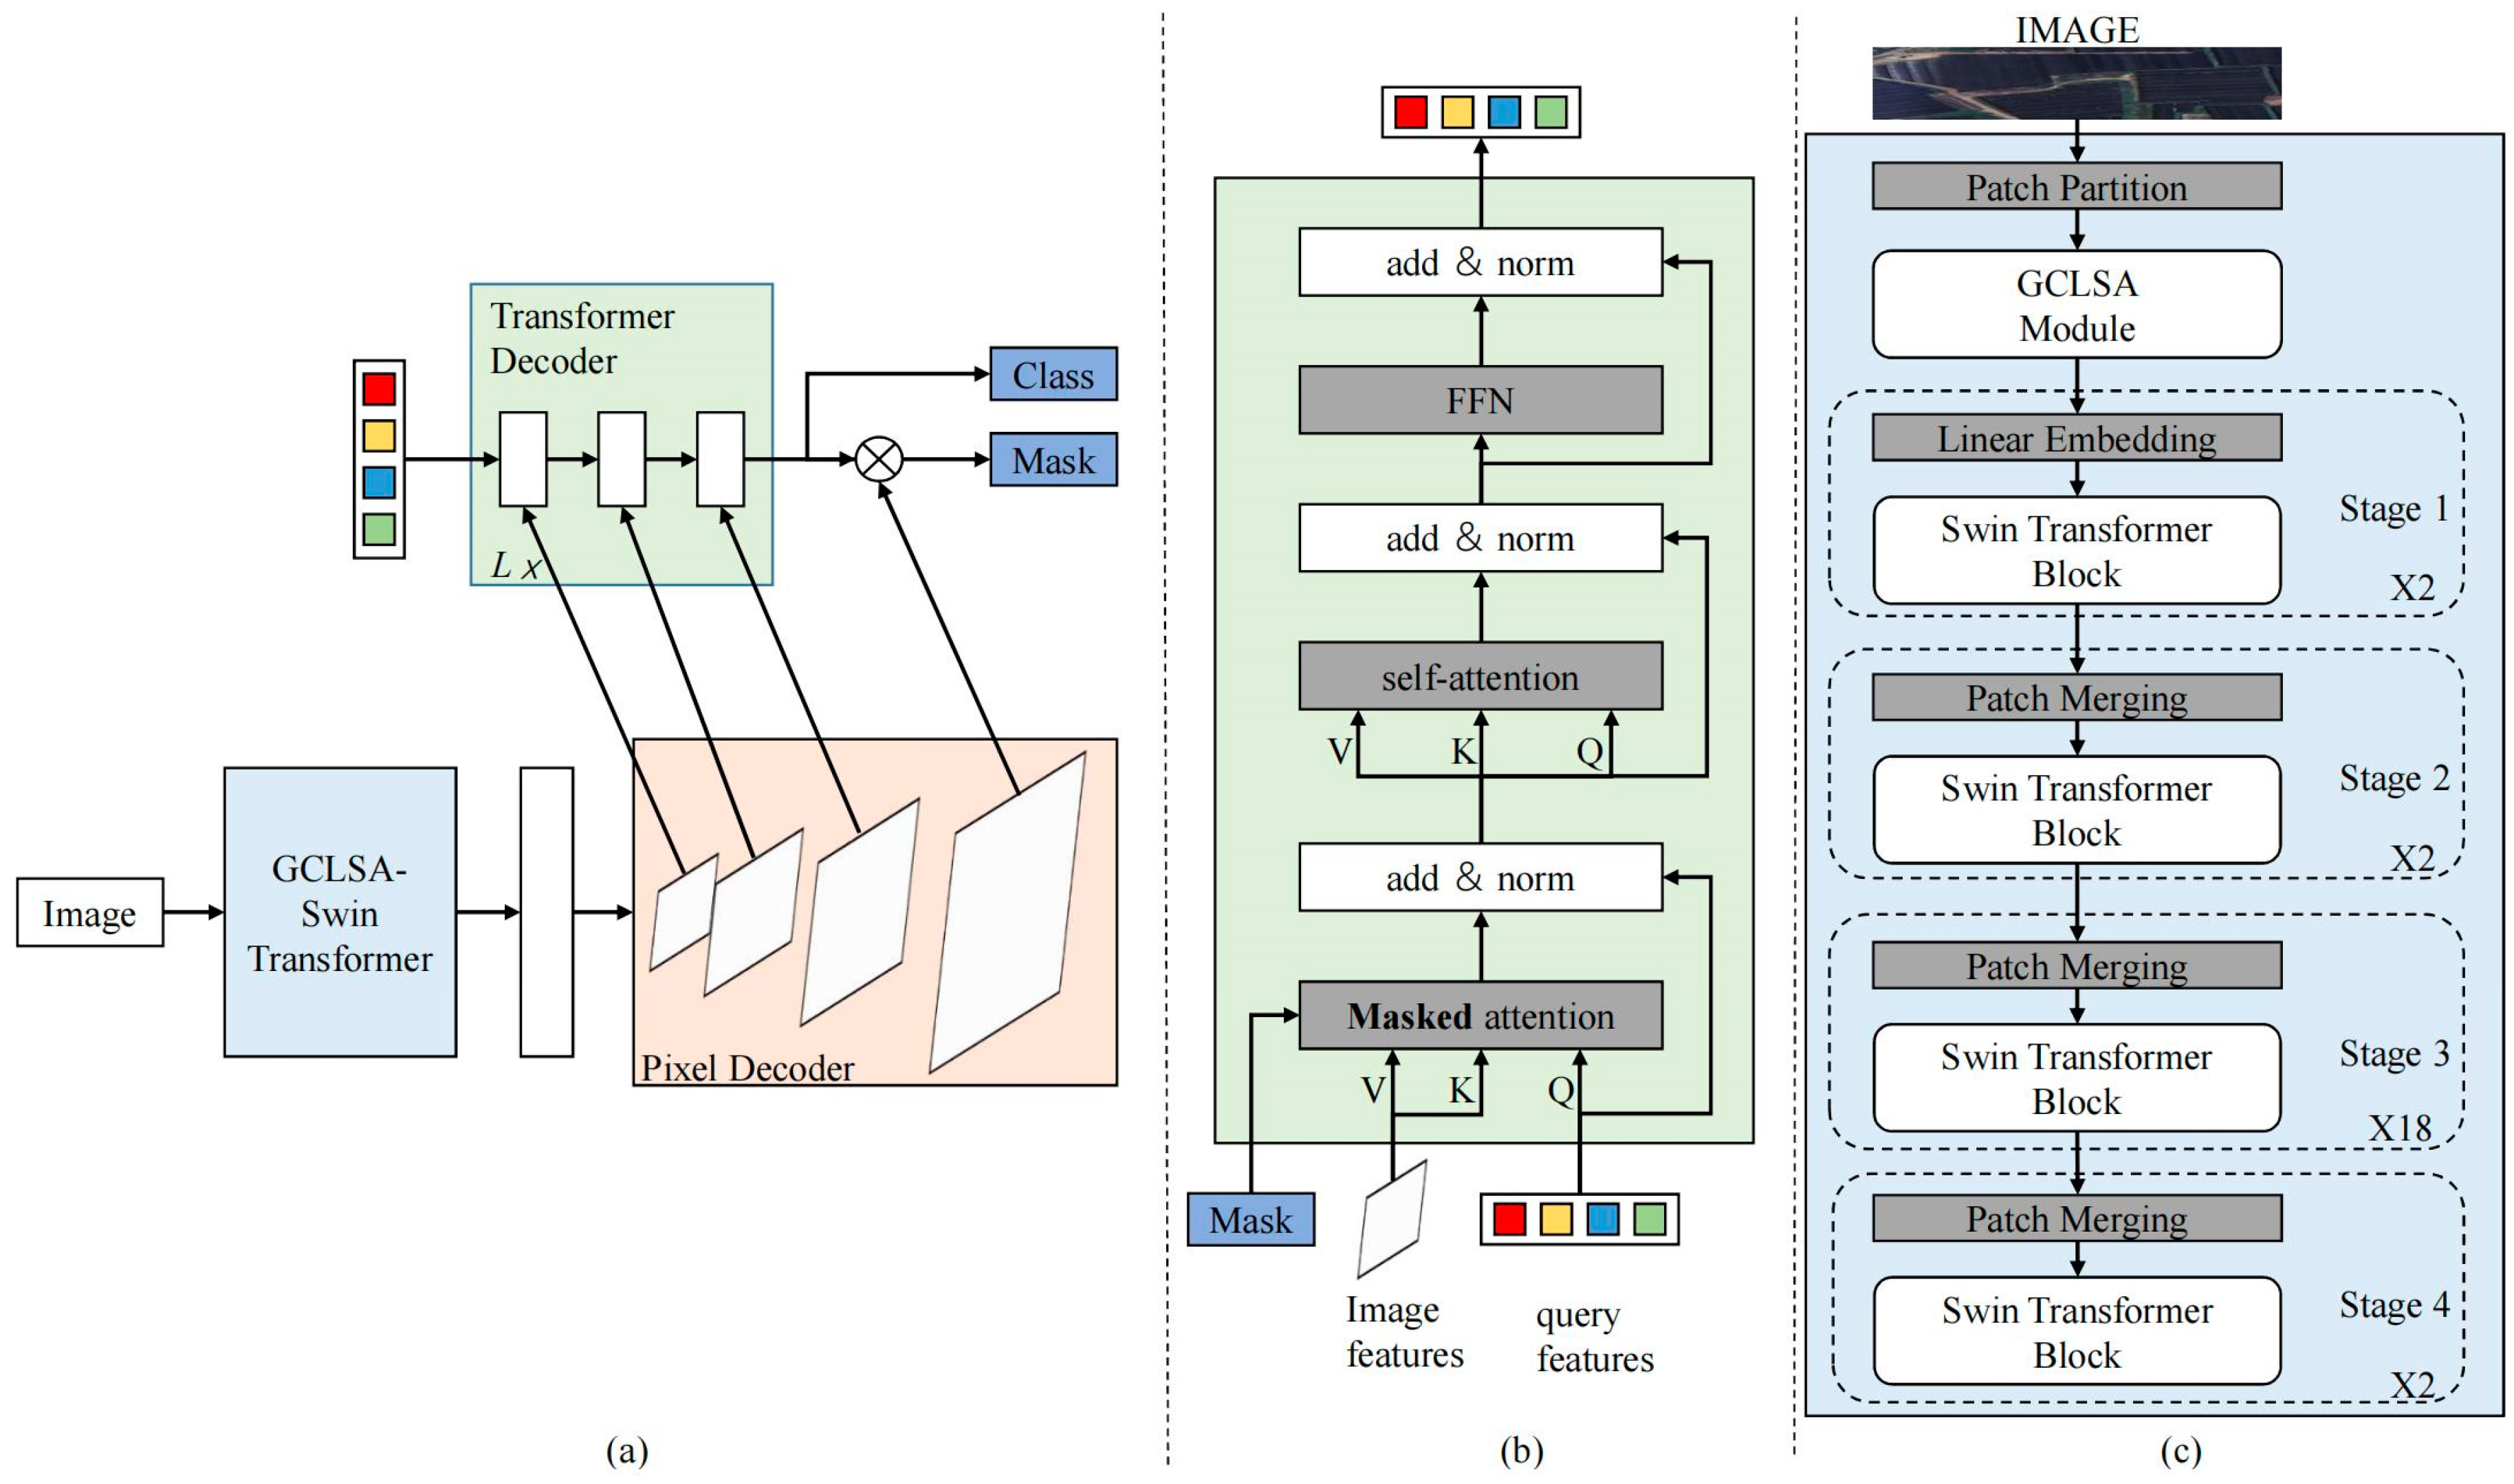
  • We propose ShadeNet, a novel method for detecting shade houses using high-resolution remote sensing imagery and semantic segmentation. ShadeNet integrates the Swin Transformer [17] and Mask2Former [18] frameworks, and is enhanced by the Global-Channel and Local-Spatial Attention (GCLSA) module. This architecture significantly improves multi-scale feature extraction and global feature capture, thereby enhancing extraction accuracy. Notably, this study represents the first application of combining Swin Transformer [17] with Mask2Former [18] for the remote sensing extraction task of PCGs, demonstrating the potential of this combination in remote sensing object extraction tasks with complex backgrounds.
The structure of this paper is arranged as follows: Section 2 reviews related works, summarizing existing methods for shade house extraction and their limitations. Section 3 provides a detailed introduction to the proposed high-precision shade house extraction method, including the construction of the dataset and the design of the ShadeNet. Section 4 describes the experimental design and results, and analyzes the effectiveness of the proposed method in various scenarios. Section 5 discusses the advantages and limitations of the proposed method, as well as potential improvements and applications. Finally, Section 6 summarizes the research findings and outlines directions for future research.

2. Related Works

Recent advancements in Earth observation technologies have paved the way for remote sensing to offer innovative approaches and scientific methods for the extraction of agricultural plastic covers. Remote sensing technology, with its advantages of extensive coverage, all-weather capability, and real-time monitoring [19], provides an efficient, non-invasive, and cost-effective solution for large-scale, multi-temporal APC extraction, significantly enhancing research and monitoring efficiency and accuracy. The resolution of remote sensing imagery is critical for APC extraction. Low-resolution imagery often lacks sufficient spatial detail, hindering the accurate differentiation of land cover types and resulting in low classification accuracy [20]. In contrast, high-resolution imagery offers finer details and clearer structures, making it more suitable for precision extraction tasks [11]. As technology advances, researchers are increasingly relying on high-resolution imagery to improve the accuracy and precision of APC extraction. In remote sensing-based APC extraction, shade houses and PCGs share similar structural and material characteristics, but research on shade house extraction remains scarce. Therefore, this paper will leverage the latest advances in PCG extraction research to analyze and address the key technical challenges in shade house extraction.
Remote sensing techniques for extracting PCGs fall into two main categories: object-oriented and pixel-based approaches. The object-oriented approach involves segmenting an image into superpixel blocks, which are then classified using rule-based features to identify PCGs. For instance, Li et al. developed a threshold model using Landsat 8 OLI imagery, combining object-oriented segmentation with spectral analysis. By selecting 7 features, they successfully extracted PCGs in Xuzhou, Jiangsu Province, for the years 2014 and 2018 [21]. However, the accuracy of object-oriented methods is often limited by the size of the superpixel blocks. Large superpixel blocks may cause confusion between different land cover types, while very small superpixel blocks can result in excessive fragmentation of the classification [22]. Consequently, recent studies on remote sensing-based PCG extraction have increasingly favored pixel-based approaches, especially spectral index and deep learning methods.
Spectral index methods typically construct feature indices using different spectral bands of remote sensing imagery to differentiate PCGs, and utilize techniques such as threshold comparison to distinguish PCGs, offering the advantages of fast computation and easy application. For instance, during winter, the temperature differences inside PCGs often lead to condensation, causing the PCGs to exhibit water-related characteristics in remote sensing imagery. Based on this, Wang et al. proposed an enhanced water index (EWI) using multiple spectral bands of Landsat imagery to extract PCGs in Jiangmen, Guangdong, accurately distinguishing them from other land cover types [23]. Similarly, Yang et al. introduced a new spectral index designed to suppress spectral signals from vegetation and enhance the spectral differences between PCGs and other land cover types [24]. The proposed method yielded excellent extraction results on both Landsat and QuickBird-2 images. Zhang et al. developed the Advanced Plastic Greenhouse Index (APGI), which is effective for the large-scale identification of PCGs, providing good mapping results in multiple study areas globally [25]. The index shows a significant difference between PCGs and the background, and uses a single-threshold segmentation approach, making it efficient for mapping. However, the optimal threshold varies across different study areas. In large-scale extraction tasks, manually adjusting the index threshold is time-consuming and inefficient, leading to lower overall accuracy. Although spectral index methods can effectively utilize spectral reflectance information from remote sensing imagery, they still face challenges such as “same spectra for different objects” and “different spectra for the same object”, which can result in misclassification and lower extraction accuracy [14]. Guo Jintao’s study [13] indicated that shade houses and other types of PCGs exhibit significant spectral differences, while the widespread use of black plastic mulching and black shading nets (for non-agricultural purposes) complicates the accurate identification of shade houses. Therefore, existing spectral index methods for PCG extraction have not considered the unique characteristics of shade houses, indicating that previous studies have largely overlooked this extraction issue. Given the technical difficulties associated with spectral index methods for extracting shade houses, deep learning approaches may be more suitable for this task.
Deep learning provides a novel method for automatically generating high-level and more representative features based on multi-layered neural network architectures [26]. With the emergence of efficient and accurate network architectures such as U-Net [27], HRNet [28], and EfficientNet [29], along with the increasing availability of high-resolution remote sensing imagery, the current mainstream methods for extracting PCGs using deep learning are often based on CNNs and high-resolution remote sensing imagery. Li et al. compared the performance of three classic object detection algorithms for extracting PCGs using mixed imagery from Gaofen-2 and Gaofen-1 satellites, finding that YOLOv3 [30] could quickly and accurately detect PCGs [31]. Feng et al. proposed an improved deep convolutional neural network to accurately distinguish PCGs from PMFs in Google imagery and applied the results for mapping [8]. Baghirli et al. modified the upsampling step in the U-Net decoder [27] by implementing parallel transpose convolution and bilinear upsampling, which alleviated noise in the extraction results [32]. However, the encoder used a simple stacked “convolution–activation–pooling” structure, which limited its ability to extract high-level semantic features for PCGs. Ma et al. proposed a dense object dual-task deep learning (DELTA) framework based on 1 m spatial resolution remote sensing imagery to address large-scale mapping of PCGs [33]. This framework employs a dual-task learning module to simultaneously extract greenhouse area and quantity. In applications across six regions of China, this method achieved a 1.8% improvement in average precision over Faster R-CNN and successfully extracted more than 13 million greenhouses, demonstrating the advantages of deep learning techniques in large-scale automatic extraction. Wang et al. developed an improved U-Net model that successfully extracted shade houses and PCGs through multi-task learning, particularly achieving significant performance improvements in shade house extraction compared to traditional methods [15]. However, the study had some limitations, including a limited number of shade house samples in the dataset, insufficient identification accuracy, and difficulty distinguishing shade houses from similar objects such as roads and building shadows. Furthermore, since the study was primarily conducted in a flat farmland environment, the method showed limited adaptability and generalization capability when applied to more complex backgrounds. Networks for shade house extraction require a richer receptive field to capture both the target’s semantic features and contextual information, which is necessary to distinguish easily confused objects. Although several novel and convenient CNN-based methods have been proposed for PCG extraction in the literature, these models inherently have smaller receptive fields due to CNN structure limitations, which hinders their ability to capture global semantic information, especially when analyzing remote sensing images with complex backgrounds [16]. Current methods attempt to expand the local receptive field through techniques like dilated convolutions, but these strategies do not fundamentally resolve the issue of global receptive field deficiency, leading to performance bottlenecks for CNN-based models in semantic segmentation tasks [34].
In summary, the primary technical challenges associated with the high-precision extraction of shade houses from high-resolution remote sensing imagery are as follows:
  • The lack of publicly available datasets for shade houses, despite the critical need for high-quality data to train deep learning models.
  • The limited receptive fields of traditional CNNs, which restrict their ability to capture sufficient contextual information, thereby reducing extraction accuracy.
  • The poor generalization ability of existing models, particularly when applied to diverse backgrounds, with suboptimal extraction accuracy in non-farmland environments.
  • The high misclassification rate in complex scenarios, where shade houses are frequently confused with visually similar objects such as roads, building shadows, dark-colored vegetation, and dark-colored water bodies.
To address the issue of a limited receptive field in CNNs, the Transformer architecture, based on self-attention mechanisms, has been proposed in recent years [35], achieving significant results in remote sensing image analysis [34]. In this study, we selected the Swin Transformer [17] as the backbone network for feature extraction. Its hierarchical structure and sliding window attention mechanism effectively expand the receptive field and improve the ability to capture multi-scale features. To address the issue of insufficient extraction accuracy in complex backgrounds, we chose the Mask2Former decoder [18], which performs more precise extraction through mask generation rather than pixel-by-pixel classification, thus effectively handling complex backgrounds. This study is the first to apply the combination of Swin Transformer [17] and Mask2Former [18] to the remote sensing extraction task of APCs, demonstrating the potential of this combination for remote sensing object extraction tasks in complex backgrounds. To mitigate the high misclassification rate, we introduced a Global Channel and Local Spatial Attention module (GCLSA) to strengthen the model’s understanding of inter-channel relationships and spatial dependencies, improving its ability to capture global features and comprehensively analyze contextual information. Since no public semantic segmentation dataset for shade houses currently exists, the proposed ShadeNet is tested on a self-labeled shade house dataset.

3. Materials and Methods

3.1. Study Area and Construction of High-Quality Shade House Semantic Segmentation Dataset

In this section, we will first discuss the reasons for choosing Hualong Town as the study area, followed by a detailed introduction to the two types of shade houses objects extracted in this study. Finally, we will present the comprehensive methodology for constructing a high-quality shade house semantic segmentation dataset by collecting remote sensing images for annotation.

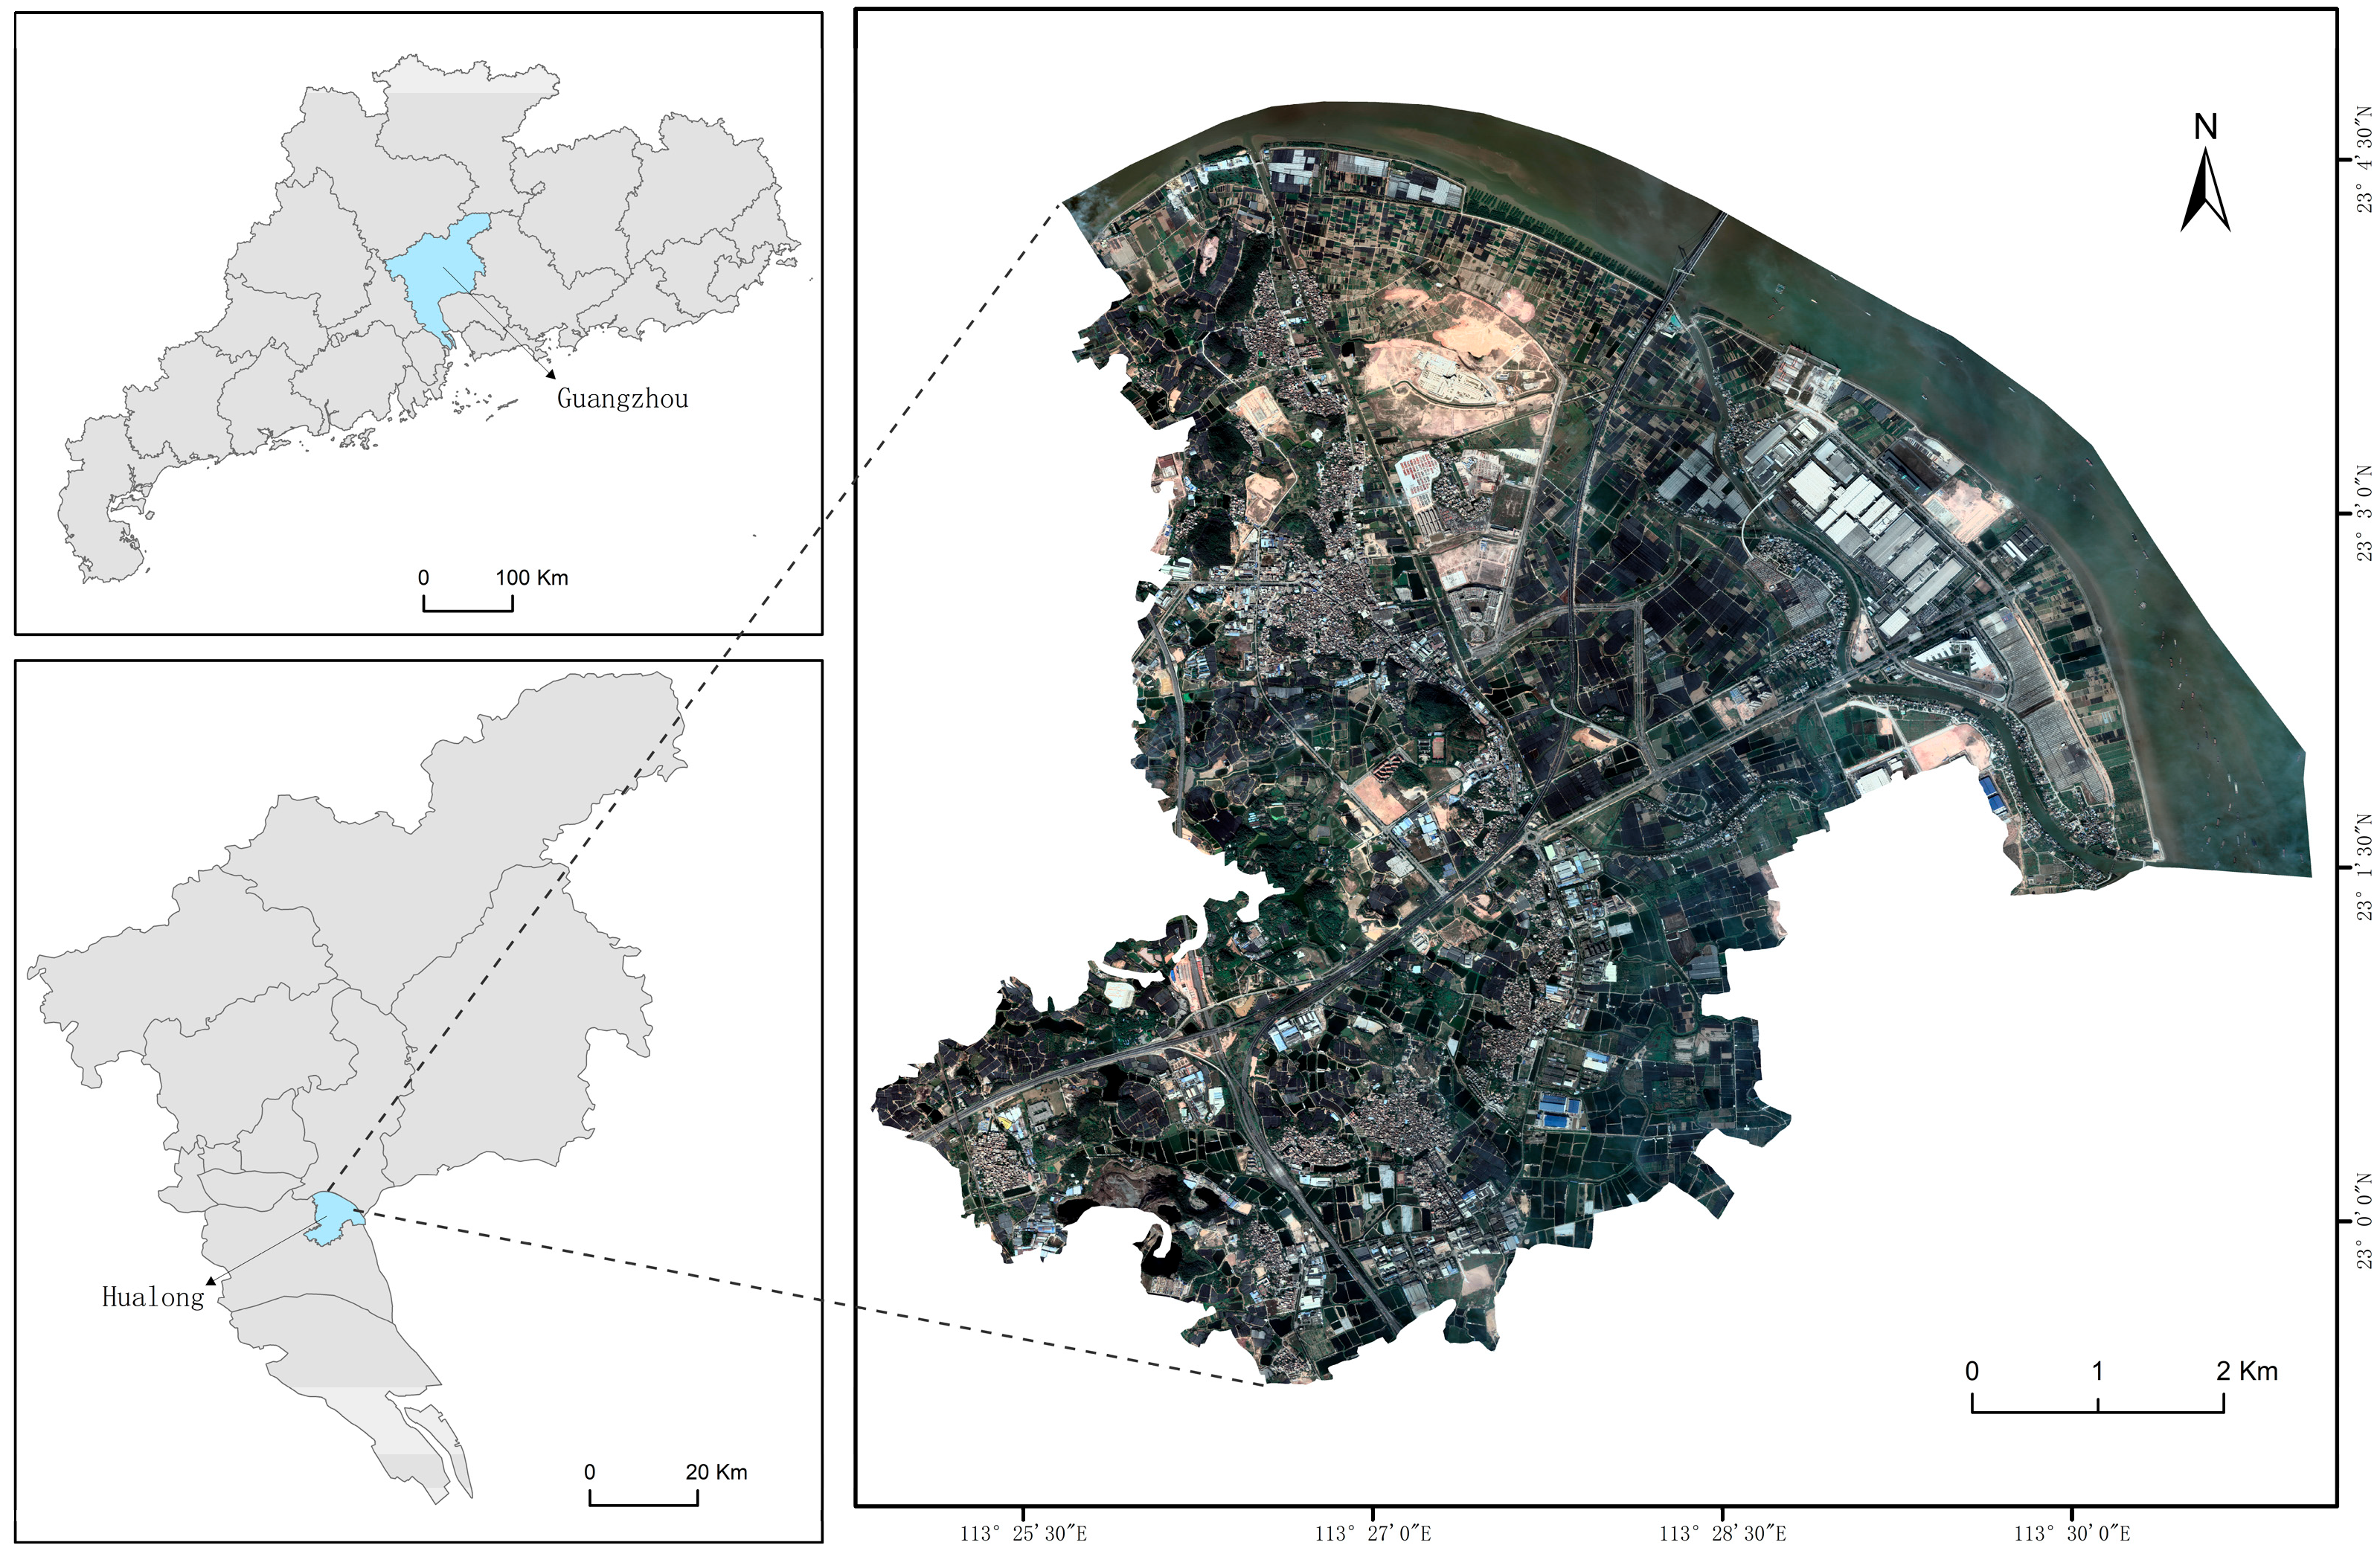
3.1.1. Hualong Town and Its Diversified Shade House Samples

Hualong Town, located between 113°24′50.4″ E and 113°30′25.2″ E, and 22°59′16.8″ N and 23°4′33.6″ N, covers a total area of 55.7 square kilometers [36] (Figure 1). It is a significant production and sales base for shade-loving ornamental plants in China, holding a 50% share of the Chinese market [37]. The town’s independently developed flower products have won nearly 40 awards at various editions of the China Flower Expo [37]. The cultivation of shade-loving plants requires the avoidance of direct sunlight [38], leading to the extensive coverage of shade houses in Hualong Town, providing a rich sample base for the dataset. Additionally, due to varying sizes of farming operations, the different dimensions of shade houses contribute to the dataset’s diversity. Located in the bustling city of Guangzhou, the complex urban background surrounding Hualong Town adds further diversity to the environmental context of the dataset. Therefore, choosing Hualong Town as the research area ensures the adequacy of the dataset in terms of sample size, sample diversity, and environmental complexity.

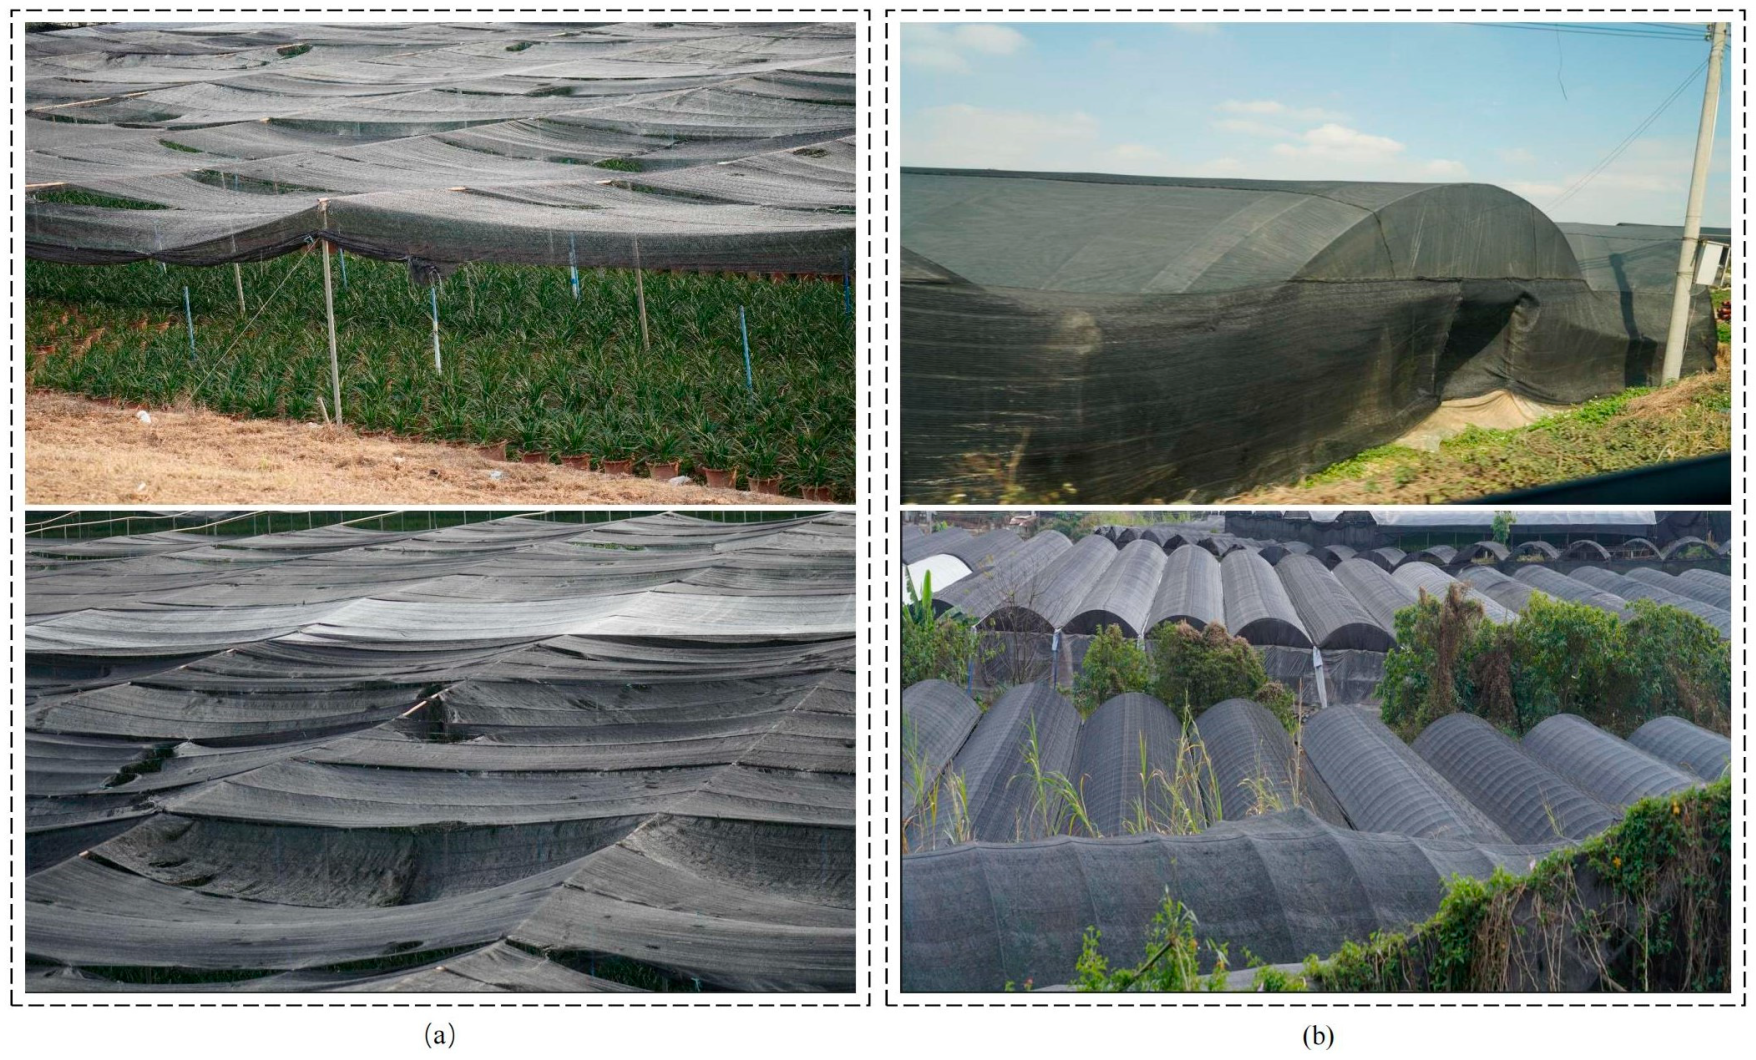
3.1.2. The Two Types of Shade Houses Extracted in This Study

After detailed visual interpretation and summarizing relevant research, we identified two types of targets: background and shade houses. According to the definition provided by the FAO [3] and field verification, we define the following two types as the shade houses to be extracted in this study (Figure 2):
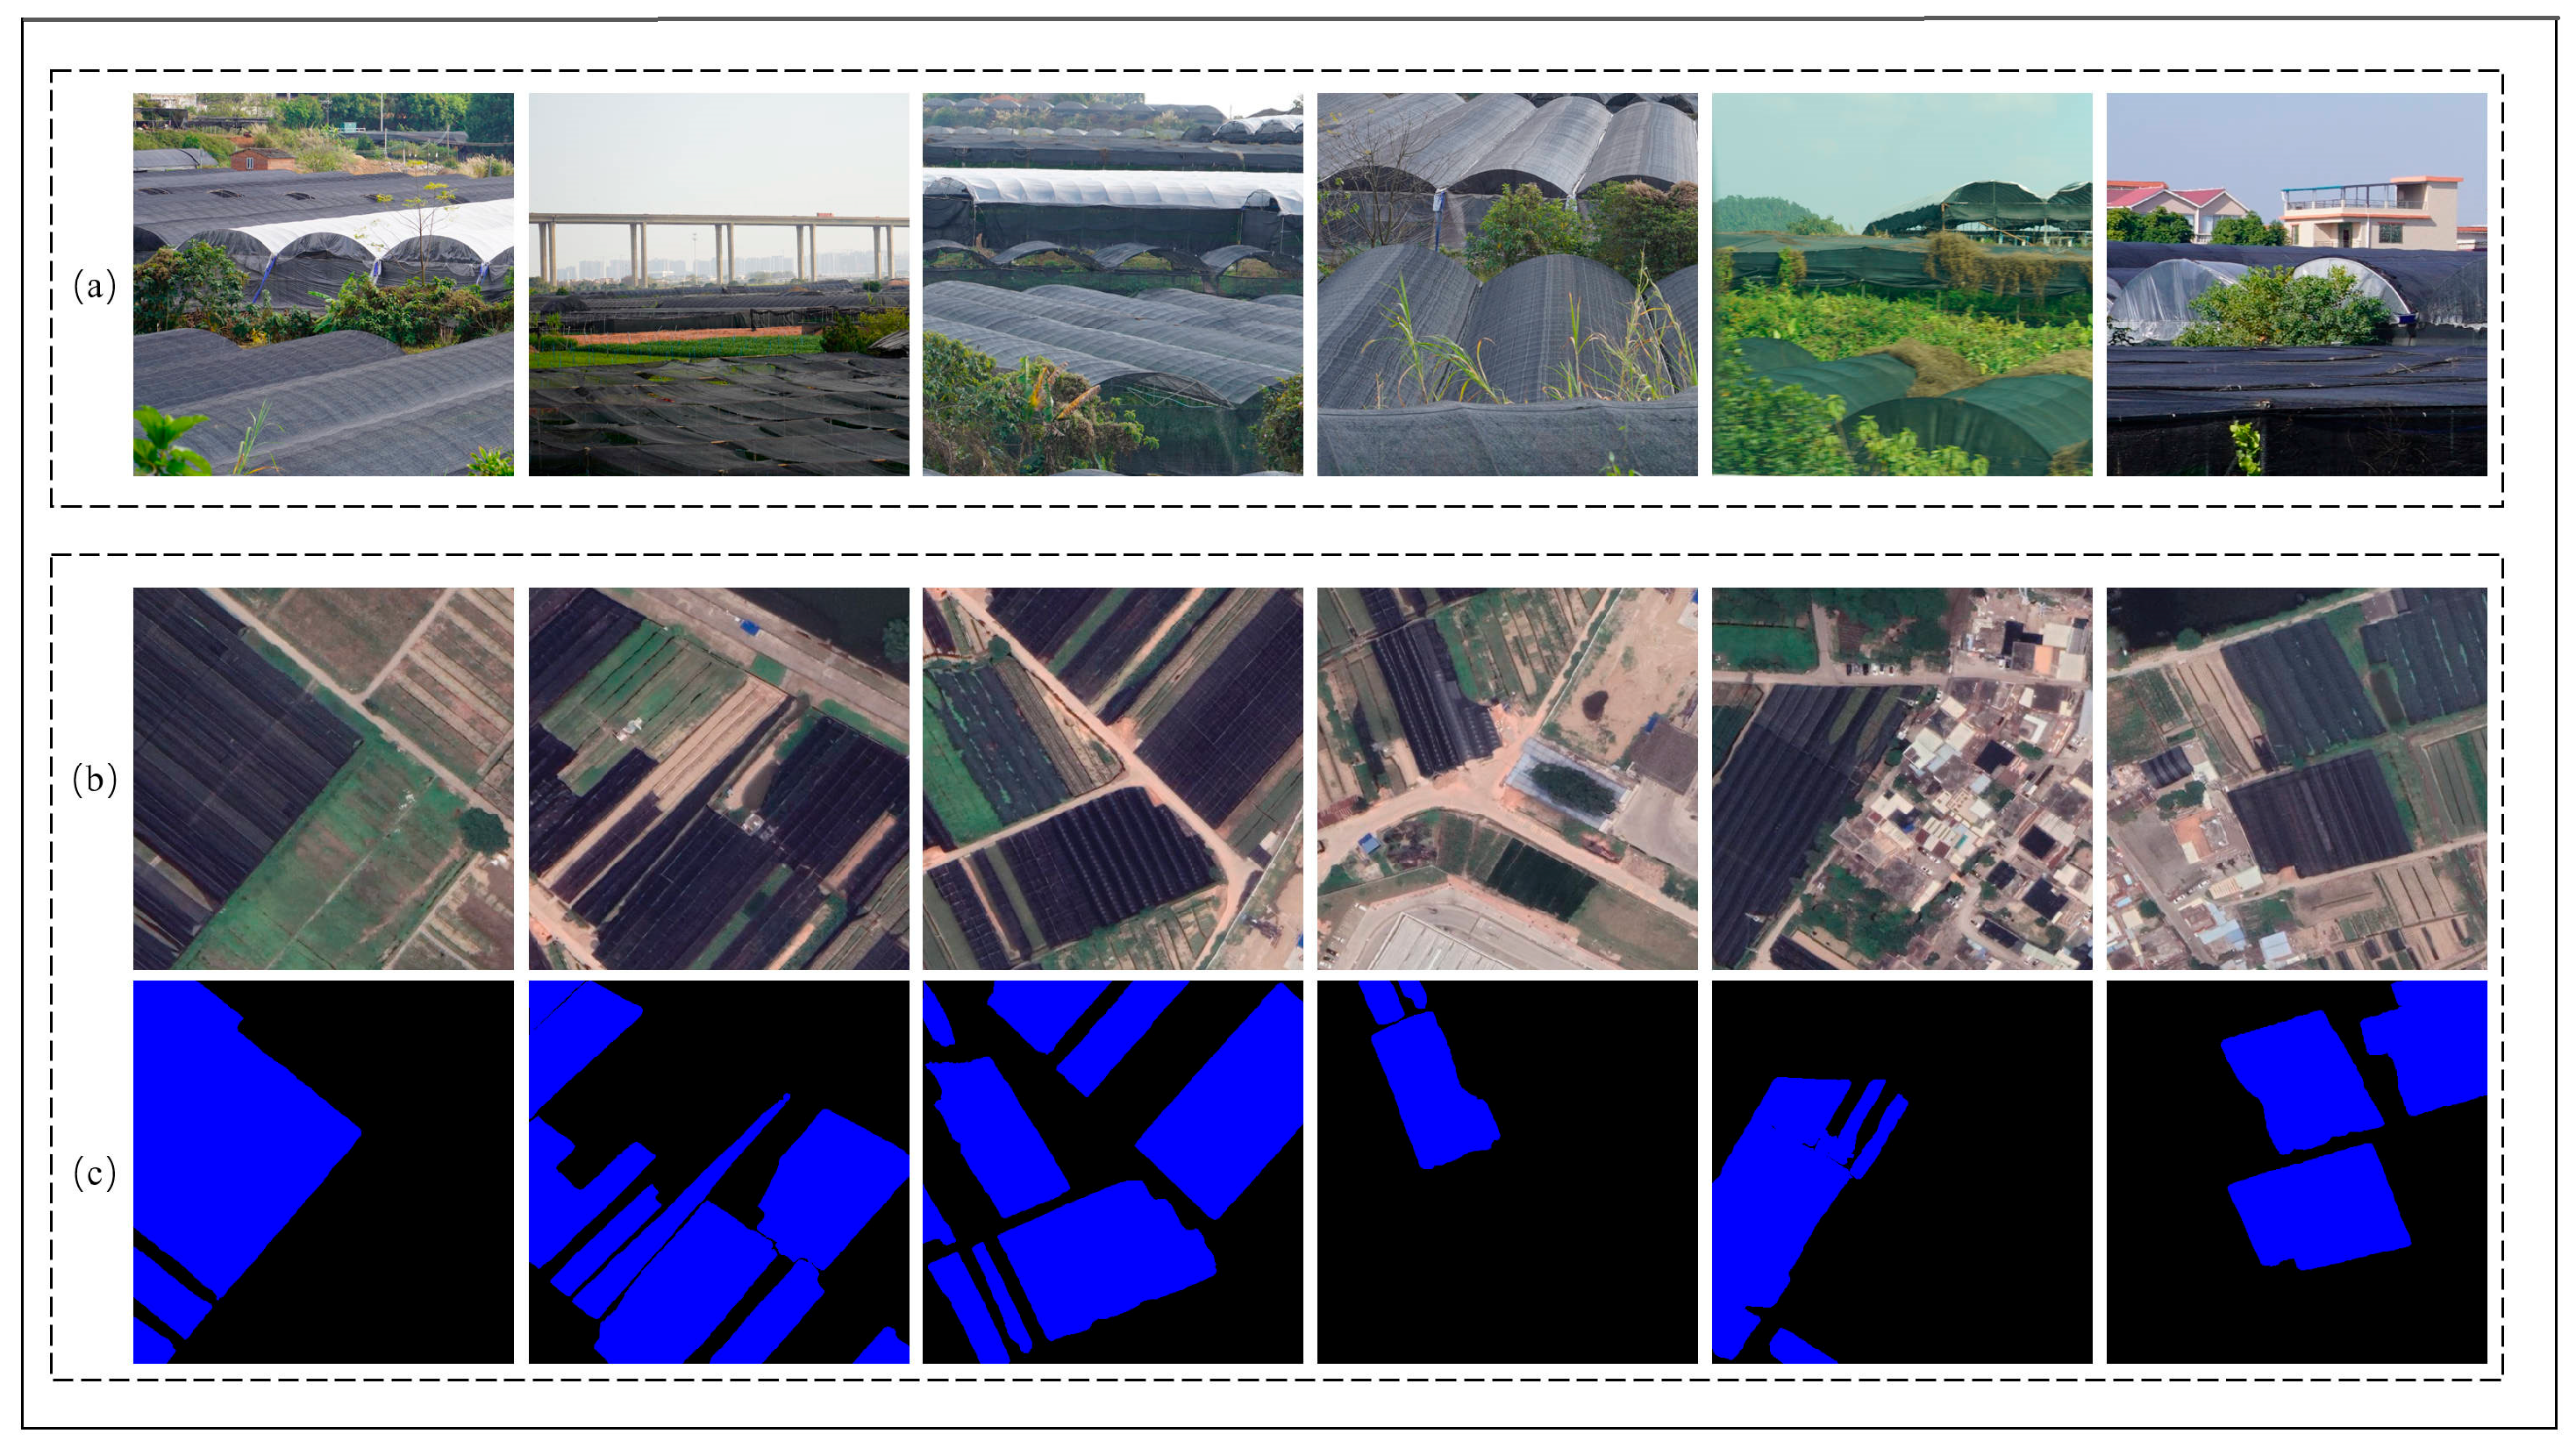
  • Shade facilities erected above open-ground seedbeds, characterized by the installation of shade nets over a steel frame structure, with open sides on both sides of the structure. From a top–down view, the overall structure is flat, with no obvious arching.
  • Shade facilities erected above PCGs are characterized by the installation of shade nets on the outside of the PCGs. Sometimes, to enhance the shading effect, shade nets are placed both inside and outside the plastic film of the PCGs, and the sides of the structure are enclosed. From a top–down view, the overall structure is arched.
Figure 2. Images of shade houses. (a) Shade facilities erected above open-ground seedbeds; (b) shade facilities erected above plastic-covered greenhouses.
Applsci 15 03735 g002
It should be noted that, as shade nets are widely used in non-agricultural fields and similar structures to shade houses are also common in everyday life, we provide a comparison diagram in Figure 3 to more accurately label the shade houses. The first row of Figure 3 presents objects that resemble shade houses in everyday scenes, and the second row displays objects that are easily confused with shade houses from a remote sensing perspective. Specifically, the items are as follows: (a) black rooftops; (b) shade net scenes used for non-agricultural purposes; (c) rooftops covered with shade nets; (d) shade houses next to ponds; (e) dark-colored water bodies; (f) roads; (g) black rooftops; (h) building shadows.

3.1.3. Construction of the Shade House Dataset

We labeled the shade houses according to the aforementioned criteria (Figure 4a), while other objects with different appearances were categorized as background (Figure 4b,c). To ensure the integrity and accurate representation of the data, we collected six optical remote sensing images of the study area from 2021 to 2023, each with a resolution of 38,656 × 34,048 pixels, from Google Earth. The resulting remote sensing images were 24-bit images based on the red (R), green (G), and blue (B) bands, with a spatial resolution of 0.3 m, and no preprocessing was required. To enhance the robustness and diversity of the dataset and reduce edge effects [39], each cropped patch overlapped by 10% both horizontally and vertically with 20 adjacent patches [40]. In selecting dataset samples, we considered three key attributes: sufficient total image volume, balanced class distribution, and adequate instances for each class. Based on these criteria, we manually selected and cropped 4101 image patches of size 512 × 512 pixels for the dataset. Using the established classification standards, we labeled the data with SAM-Tool. Each instance was labeled using point annotation operations in the Segment Anything Model (SAM) [41], and the annotations were exported in COCO format via SAM-Tool. To verify the accuracy of the annotations, we converted the annotations in COCO format into JSON format compatible with the Labelme tool 5.4.1, and then imported them into Labelme for checking and correction. The final validated annotations were converted from JSON format into integer mask format for semantic segmentation (Figure 5). To minimize subjective influence on the dataset, we randomly divided the dataset into training, validation, and test sets in a 7:1.5:1.5 ratio. This split resulted in 2871 training images, 615 test images, and 615 validation images. The above image cropping and dataset division process can be quickly implemented via Python 3.8 programming.

3.2. ShadeNet: A Novel Approach to High-Precision Shade House Extraction

3.2.1. Overall Architecture of ShadeNet

This paper proposes a semantic segmentation network (ShadeNet) for the precise extraction of shade houses, and its overall architecture is shown in Figure 6. The model primarily consists of three key modules: the GCLSA-Swin Transformer feature extraction module, the pixel decoder module, and the Transformer decoder module. Additionally, to enhance the network’s global context understanding, we innovatively introduce a Global-Channel and Local-Spatial Attention (GCLSA) module into the feature extraction part. The functions of each module and their adaptability to the shade house extraction are detailed below from an overall structural perspective, and the collaborative mechanism of the network is explained in conjunction with the overall workflow.
GCLSA-Swin Transformer Feature Extraction Module: As the backbone of the network, the GCLSA-Swin Transformer leverages the advantages of the Swin Transformer [17] to extract multi-scale and high-level semantic features from remote sensing images. Its window-based attention mechanism, combined with a hierarchical structure design, enables the efficient capture of both global and local features of shade houses. The shade houses in remote sensing images have the following characteristics: varying density within each image patch, which may be concentrated in certain areas or dispersed; varying sizes, encompassing large areas covered by shade houses, as well as small targets; and a high presence of similar objects in the surrounding environment, such as dark-colored water bodies, roads, and dark-colored vegetation, which can lead to model misclassification. The hierarchical feature design of Swin Transformer [17], by progressively extracting and integrating features of different scales, is capable of capturing the global distribution of shade houses while also accurately expressing small targets and detailed features, thus providing robust feature support for the subsequent segmentation tasks. The specific design will be detailed in Section 3.2.2.
Pixel Decoder Module: The Pixel Decoder is responsible for fusing multi-scale features from the output of the GCLSA-Swin Transformer and generating high-resolution feature maps. In response to the diversity of shade houses sizes and the varying density of their distribution, the Pixel Decoder enhances the model’s ability to resolve densely packed areas by progressively upsampling and integrating multi-scale features. At the same time, it improves the model’s recognition capability for small target regions. Particularly when dealing with areas that are dense or have complex backgrounds, which are prone to confusion, the pixel decoder effectively integrates contextual information to reduce mis-segmentation, thus laying the foundation for generating accurate segmentation masks.
Transformer Decoder Module: The Transformer Decoder directly predicts the target class and segmentation mask through a query-based mechanism. Each query vector interacts with the feature map to generate candidate target regions, which are then further refined into precise target classifications and segmentation boundaries. In addressing the diversity of shade houses, the Transformer Decoder demonstrates significant advantages in the following aspects: for densely distributed shade house regions, the query mechanism dynamically adjusts the segmentation scope of targets, preventing overlaps or omissions between targets; for shade houses of varying sizes, the multi-head attention mechanism fine-tunes boundary details, ensuring the precise segmentation of both large and small targets; and for ambiguous regions, the integration of contextual semantic information enhances the robustness of segmentation, effectively reducing the misclassification of similar objects (e.g., dark-colored water bodies, roads, and dark-colored vegetation).
Global-Channel and Local-Spatial Attention Module (GCLSA): To enhance the model’s global perception ability for densely distributed regions and low-contrast targets, we designed and incorporated the Global-Channel and Local-Spatial Attention (GCLSA) module based on the Swin Transformer [17]. This module strengthens the network’s ability to capture the characteristics of shade house areas by capturing the global correlations of different channels and the local spatial features of the positions within the feature map. In terms of implementation, the GCLSA module optimizes the segmentation performance through the following mechanisms: At the global level, the GCLSA module effectively focuses on the important channel features related to shade houses through channel attention, thereby improving the network’s global perception ability of target features. At the local level, the spatial attention module models the spatial information of the feature map, enhancing the understanding of local targets in densely distributed scenes. This makes the model more accurate and robust when extracting shade house features. The specific design will be detailed in Section 3.2.3.

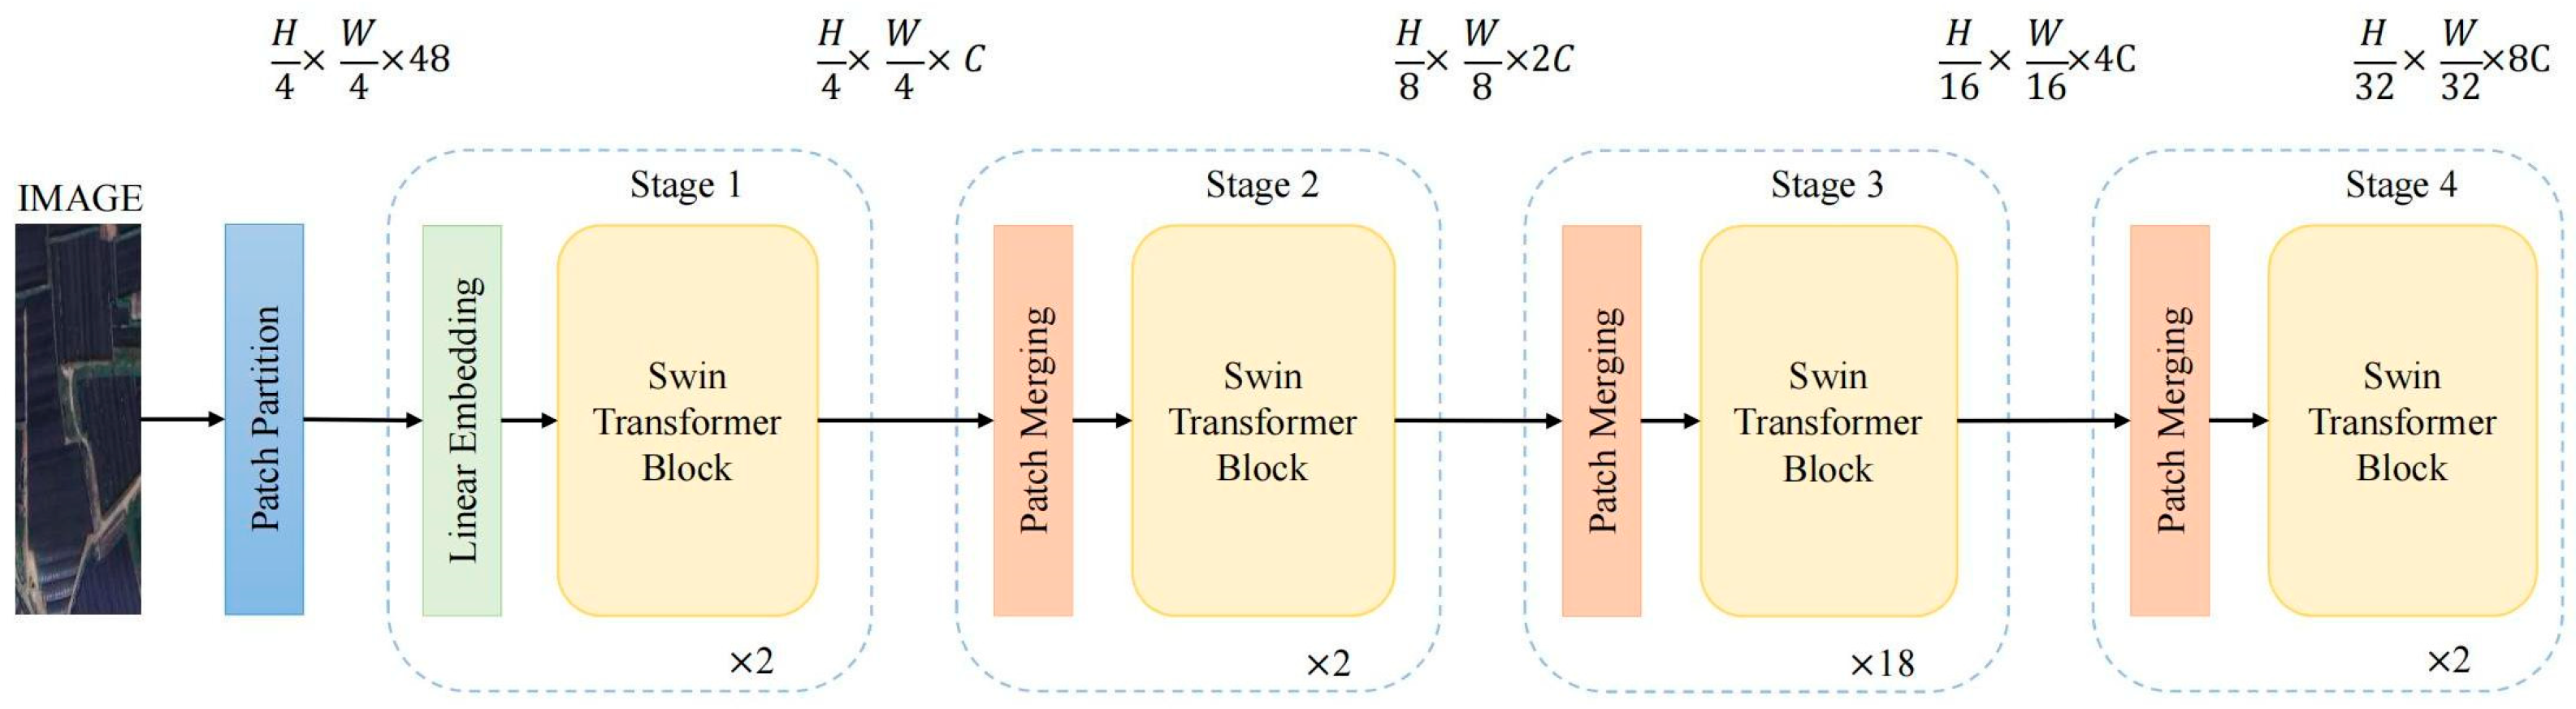
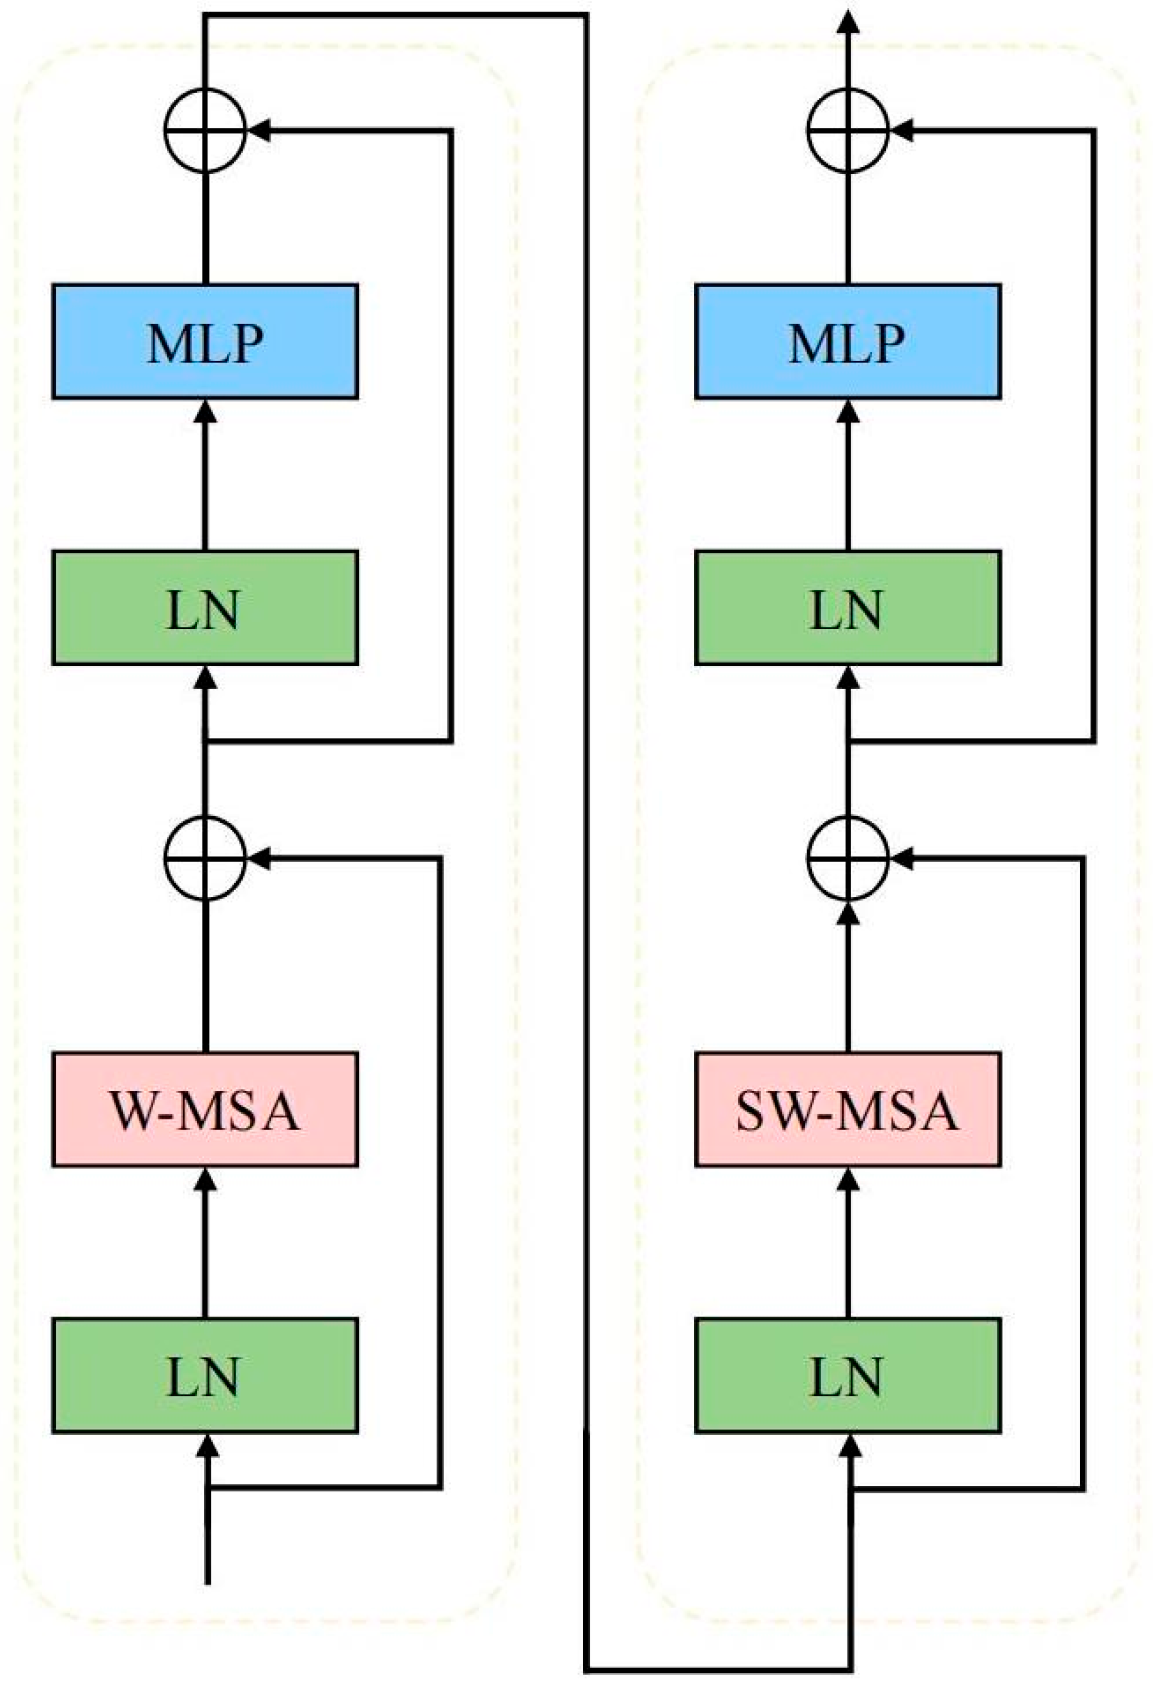
3.2.2. Backbone of ShadeNet: Swin Transformer

In existing research on the extraction of APCs, most semantic segmentation methods rely on CNN architectures, such as FCN [39], U-Net [27], etc. A few studies adopt Transformer architectures, often combined with U-Net [27], ResNet [40], etc., as backbone networks for feature extraction. However, CNNs have limitations in handling images due to their restricted receptive fields, while the earlier proposed Vision Transformer (ViT) [41] network faces the issue of insufficient information sharing between windows. To overcome these challenges, this study innovatively proposes using the Swin Transformer [17] as the backbone and combining it with the Mask2Former architecture [18] for the APC extraction task, aiming to enhance the model’s ability to learn global context information. Experimental results show that the network based on Swin Transformer [17] and Mask2Former [18] exhibits significant performance improvement in shade house extraction tasks, particularly in fine-grained image segmentation and global information integration, demonstrating its potential and advantages in high-precision remote sensing image segmentation tasks. The Swin Transformer [17] is responsible for feature extraction, and this section will provide a detailed introduction to its structure, as used in our study.
An overview of the Swin Transformer [17] architecture is presented in Figure 7. The process begins by splitting the input image into non-overlapping patches using the patch partition module. Each patch is treated as a “token”, and its feature is represented as a concatenation of the raw pixel RGB values. In this implementation, the patch size is 4 × 4, and each patch has a feature dimension of 4 × 4 × 3 = 48. A linear embedding layer was applied on this raw-valued feature to project it to an arbitrary dimension (denoted as C). The first stage involves passing these patch tokens through several Swin Transformer blocks, with the number of tokens maintained as H/4 × W/4. This stage, referred to as Stage 1, incorporates the linear embedding and Transformer blocks. To produce a hierarchical representation, the number of tokens is reduced by Patch Merging layers as the network deepens. The first patch merging layer concatenates the features of each group of 2 × 2 neighboring patches, applying a linear layer on the 4C-dimensional concatenated features. This reduces the number of tokens by a factor of 2 × 2 = 4, with a 2× downsampling of resolution, and the output dimension is set to 2C. The resulting feature map undergoes additional transformations through the Swin Transformer Blocks. This process, labeled as Stage 2, keeps the resolution at H/8 × W/8. This procedure is repeated in Stage 3 and Stage 4, where the output resolutions are H/16 × W/16 and H/32 × W/32, respectively.
The Swin Transformer [17] adopts a hierarchical structure, enabling it to process images at multiple scales and resolutions. The outputs at different stages represent features at various scales, capturing both local and global information from the input image. By combining or extracting features from different stages, a feature pyramid is formed. This process involves obtaining features from multiple levels to create a set of multi-scale features. The feature pyramid is crucial for capturing information at different levels of abstraction, allowing the model to handle objects of varying sizes in the input image. To address the challenges faced by the original ViT [41], the Swin Transformer [17] introduces two fundamental concepts: shifted window attention and hierarchical feature maps. In fact, the term “Swin Transformer” is derived from the “Shifted Window Transformer” concept. The shifted window attention mechanism enhances the interaction between windows by adjusting their positions, alleviating the issue of insufficient information sharing. The intermediate tensors generated by each layer are commonly referred to as “feature maps”. The term “hierarchical” refers to merging the feature maps from one layer with those from the subsequent layer, which effectively reduces the spatial dimensions of the feature maps (i.e., downsampling) and forms multi-scale feature representations. These hierarchical feature maps maintain the same spatial resolution as those of ResNet [40]. This is intentional to ensure that existing vision task solutions can easily replace traditional ResNet backbone networks [40] with the Swin Transformer [17]. Compared to CNNs, the Swin Transformer [17] possesses a stronger ability to learn global information and can more efficiently capture information at different scales and abstraction levels when processing complex image tasks. Therefore, the Swin Transformer [17] provides a novel and efficient solution for shade house extraction in remote sensing images.
Patch Merging: Hierarchical feature maps are generated by progressively merging and downsampling the spatial resolution of feature maps. CNNs, like, ResNet [40] use convolution operations to downsample feature maps. Therefore, feature map downsampling can also be performed without using convolutions. The downsampling technique used in Swin Transformer is called Patch Merging. In this process, the smallest unit in the feature map is referred to as a “patch”. A 14 × 14 feature map contains 14 × 14 = 196 patches. To perform n-fold downsampling on the feature map, patch merging concatenates the features of each group of n × n consecutive patches.
Swin Transformer Block: Swin Transformer uses window based multi-head self-attention (W-MSA) and shifted window multi-head self-attention (SW-MSA) modules to replace the multi-head self-attention (MSA) module commonly used in ViT [41]. The Swin Transformer module consists of two smaller sub-units. Each sub-unit consists of a multilayer perceptron (MLP) layer, an attention module, an additional normalization layer, and a normalization layer (Figure 8). The first sub-unit uses the W-MSA module, and the second sub-unit uses the SW-MSA module. The standard MSA used in ViT [41] is employed for global self-attention, which computes the associations between each patch and other patches. For high-resolution features, this leads to quadratic complexity in the number of patches. Swin Transformer uses a window-based MSA technique as a solution. Simply put, a window is a set of patches, and attention is only computed within each window. The window-based MSA calculates attention only within each window, where the window size is 2 × 2 patches. The disadvantage of window-based MSA is that it requires self-attention within each window, thus limiting the network’s modeling capability. To address this, Swin Transformer uses the SW-MSA module after the W-MSA module. In the Shifted Window MSA, the windows shift by M/2, where M is the window size. However, this modification leads to “isolated” patches (patches that do not belong to any window) and incomplete patches. Using the “cyclic shifting” technique, Swin Transformer moves the “isolated” patches to windows that are not yet fully repaired.

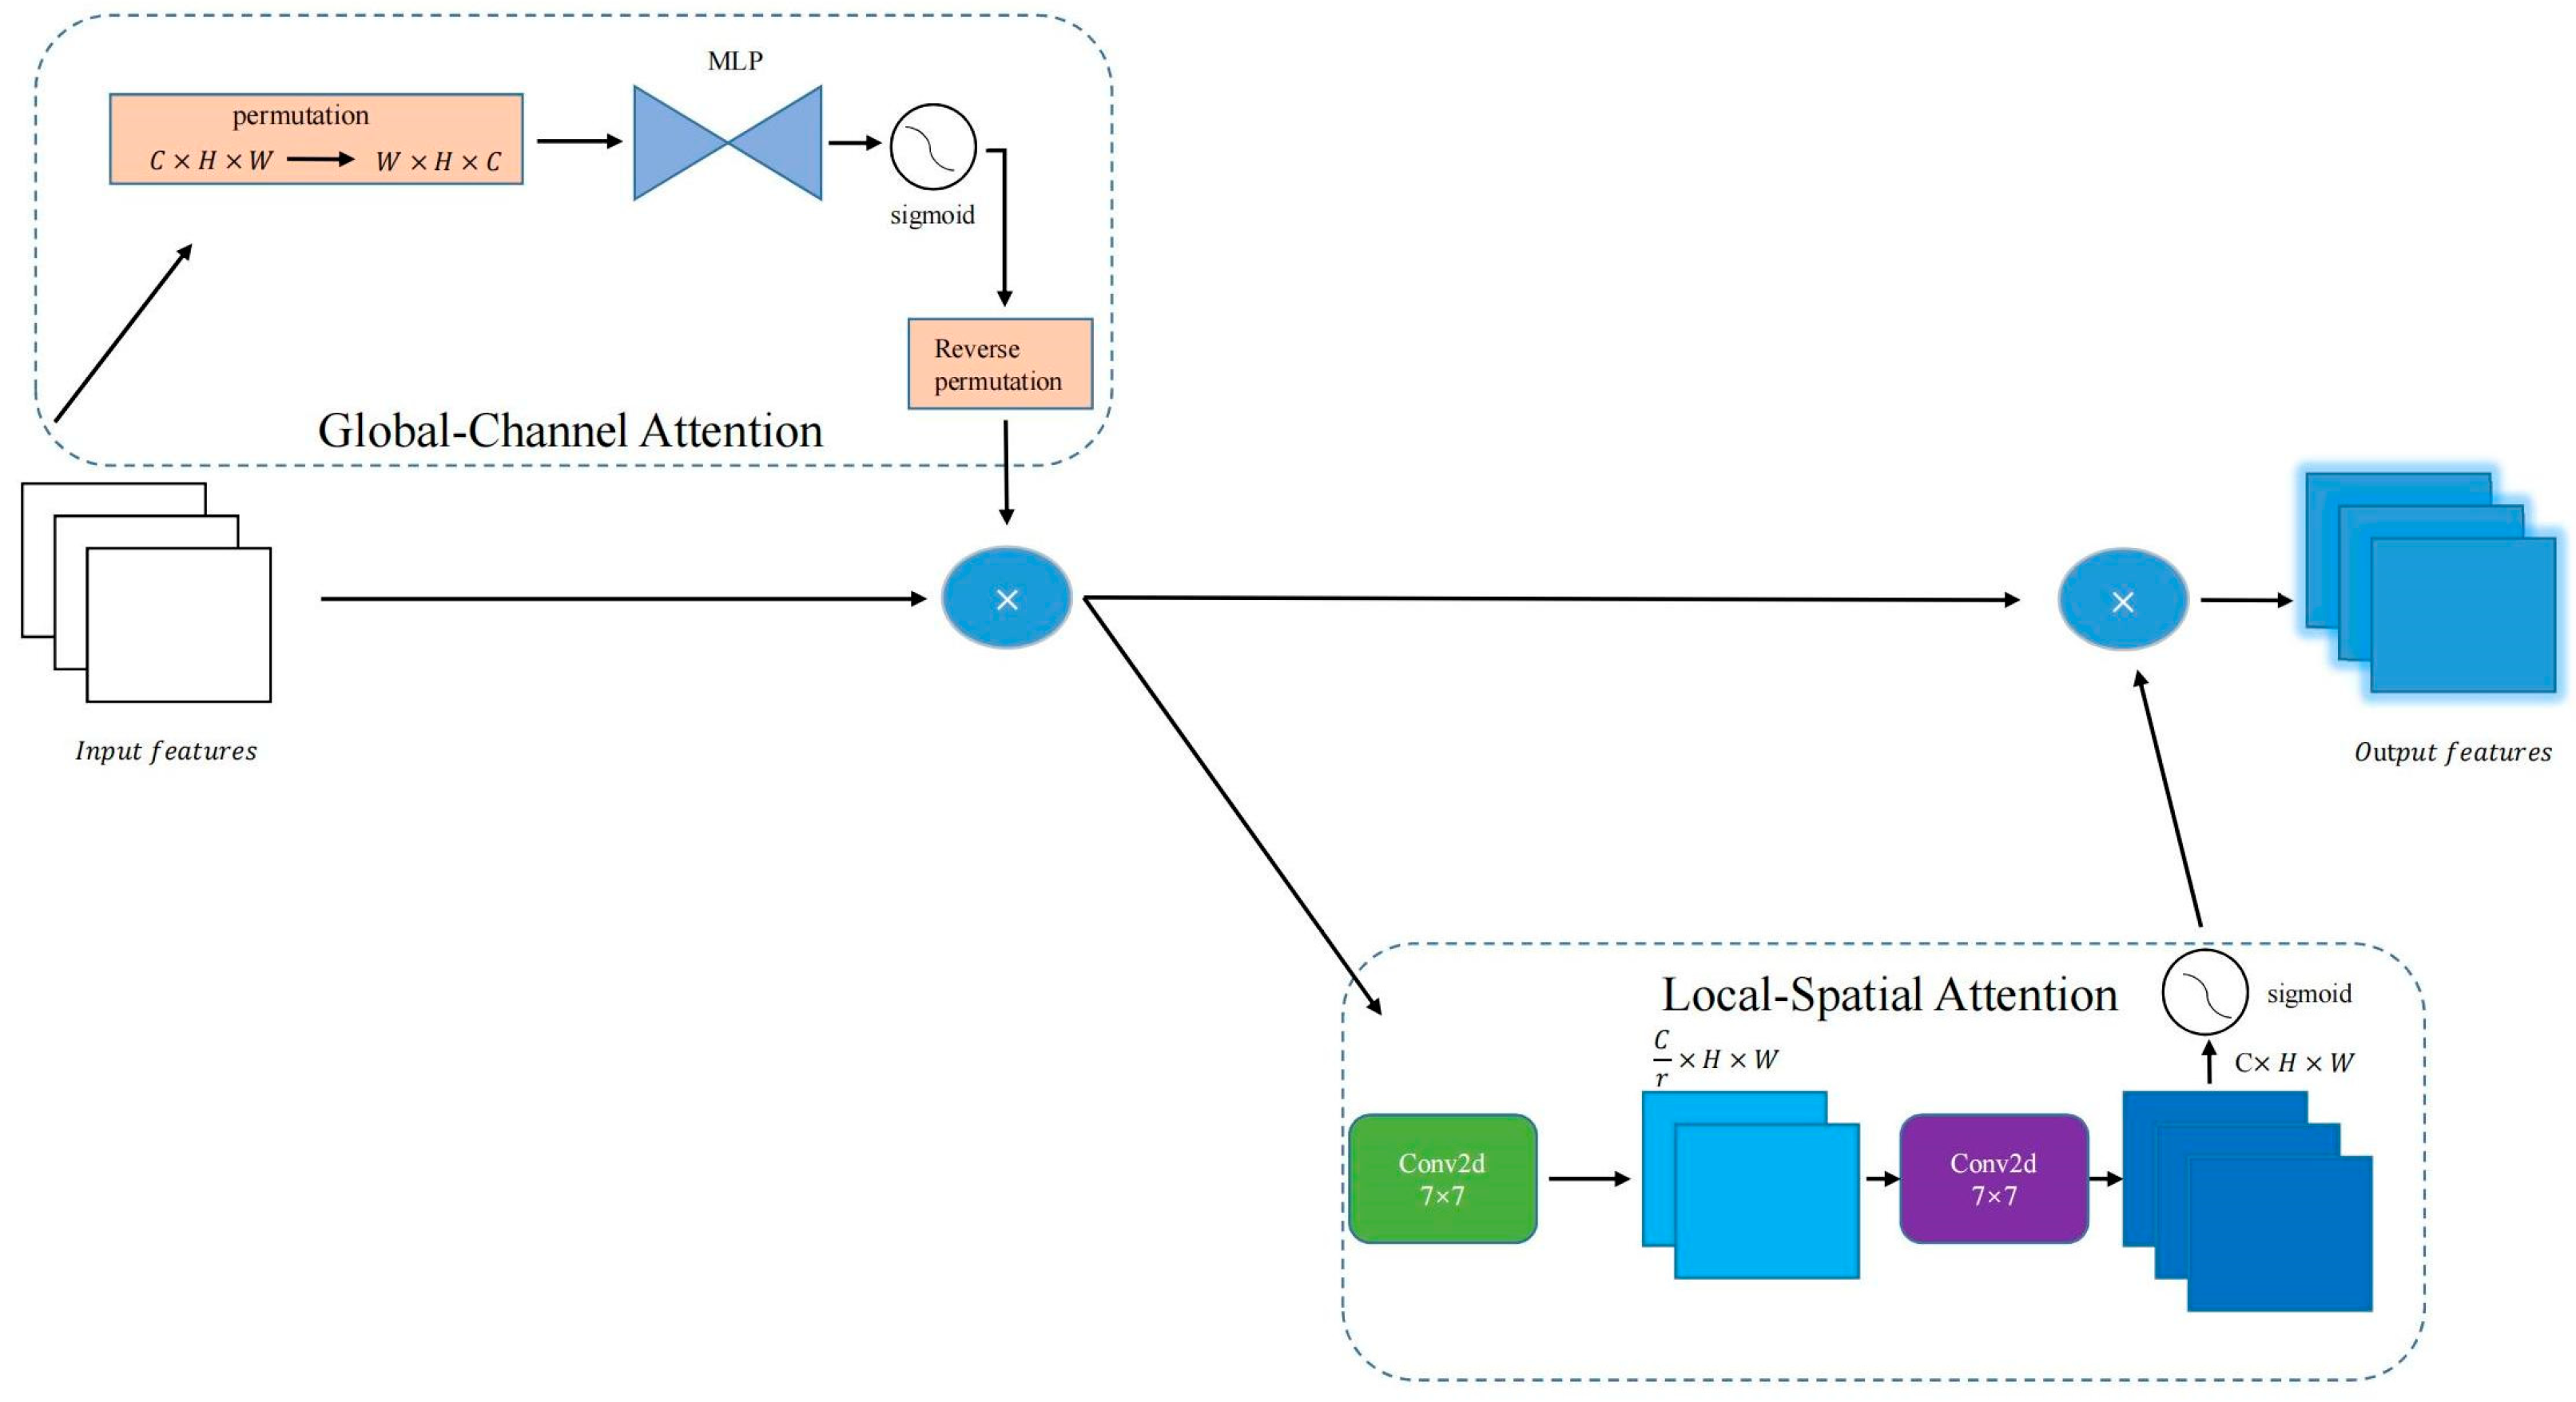
3.2.3. GCLSA Module: Enhancing Shade House Extraction with Global-Channel and Local-Spatial Attention

In the task of shade house extraction, the key challenge lies in enhancing the model’s ability to distinguish shade houses from similar objects, thereby reducing the misclassification rate and improving accuracy. Through comparative experiments, we found that networks based on self-attention mechanisms, compared to traditional CNNs, can effectively capture long-range dependencies and global contextual information in images. This enables the optimization of feature representations, thereby improving extraction accuracy. This result indicates that when performing shade house extraction, the model’s ability to relate contextual information is crucial for accurately distinguishing shade houses.
Building on this insight, further analysis of the images revealed that the objects surrounding shade houses typically consist of simple backgrounds such as farmland or bare soil, while similar objects, such as dark water bodies, roads, or building shadows, are usually surrounded by dense buildings or roads in more complex urban environments. Therefore, by further enhancing the model’s ability to learn global contextual information, it could, upon identifying the “black rectangles”, discern whether the surrounding environment consists of farmland, thus determining whether the target is a shade house. This could effectively reduce misclassification and improve extraction accuracy. Based on this, we designed a Global-Channel and Local-Spatial Attention (GCLSA) Module (Figure 9), which aims to strengthen the model’s ability to capture global contextual information, especially in complex backgrounds. This module combines channel and spatial attention mechanisms to optimize the weighted distribution of feature maps, enabling the model to focus more accurately on the target region and relate it to the background environment, thus improving the precision of shade house extraction.
Global-Channel Attention Submodule: The relationship between channels is crucial for capturing global information. Without considering the inter-channel dependencies, the model may fail to fully leverage all the information in the feature map, leading to the insufficient capture of global features. To enhance the inter-channel dependencies, we employed multi-layer perceptron (MLP) in the channel attention submodule. By utilizing MLP for channel attention, redundant information between channels can be reduced, and important features can be emphasized. First, the input feature map’s dimensions are permuted, changing from C × H × W to W × H × C, so that the channel dimension is moved to the last dimension. Then, two MLP layers are applied: the first layer reduces the number of channels to 1/4 of the original, introducing non-linearity via a ReLU activation function, and the second layer restores the channel number to its original dimension. This process facilitates better capture of global dependencies between channels. Next, the Sigmoid activation function was applied to generate the channel attention map. Finally, the reverse permutation was performed to restore the original dimensions (C × H × W), and the input feature map multiplied with the channel attention map element-wise to obtain the enhanced feature map. The formula representing this process is as that in (1), where Fchannel represents the enhanced feature map, σ denotes the Sigmoid function, ⊙ indicates element-wise multiplication, Finput refers to the original input feature map.
Fchannel = Permute−1 (σ (MLP (Permute (Finput)))) ⊙ Finput
Local-Spatial Attention Submodule: Channel attention alone may not fully exploit spatial information, which is equally crucial for capturing both local and global features in the image. Without considering spatial dimension information, the model may overlook important details in the feature map. In the spatial attention submodule, we process spatial information using two 7 × 7 convolutional layers. The input feature map first undergoes a 7 × 7 convolutional operation, reducing the number of channels to 1/r of the original. The variable r (the r variable in Figure 9) is used to control the reduction ratio of the number of channels in the spatial attention submodule. Specifically, r determines the reduction and restoration of the number of channels during the convolution operation. By adjusting the value of r, the computational cost and the number of parameters can be effectively reduced while maintaining model performance, thereby improving the efficiency of the model. This is followed by batch normalization and a ReLU activation function for non-linear transformation. The second 7 × 7 convolutional layer restores the channel number to its original dimension, followed by another batch normalization layer. This approach helps capture the dependencies in the spatial dimension more effectively. Finally, a spatial attention map is generated using the Sigmoid activation function. The channel attention map and spatial attention map are then element-wise multiplied to produce the final output feature map. The formula representing this process is as that in (2), where Fspatial represents the feature map after passing through the local–spatial attention submodule.
Fspatial = σ (Conv(BN(ReLU(Conv(Fchannel))))) ⊙ Fchannel
Overall, the workflow of the entire module is as follows: the input feature map first passes through the channel attention submodule. After undergoing dimension permutation and MLP processing, the channel attention map is generated using a Sigmoid activation function and then multiplied element-wise with the input feature map to obtain the enhanced feature map. Next, the feature map enters the spatial attention submodule, where convolution operations and a Sigmoid activation function generate the spatial attention map. Finally, the spatial attention map is multiplied element-wise with the channel-enhanced feature map, resulting in the final feature map enhanced by both channel and spatial attention.

4. Experiments and Results

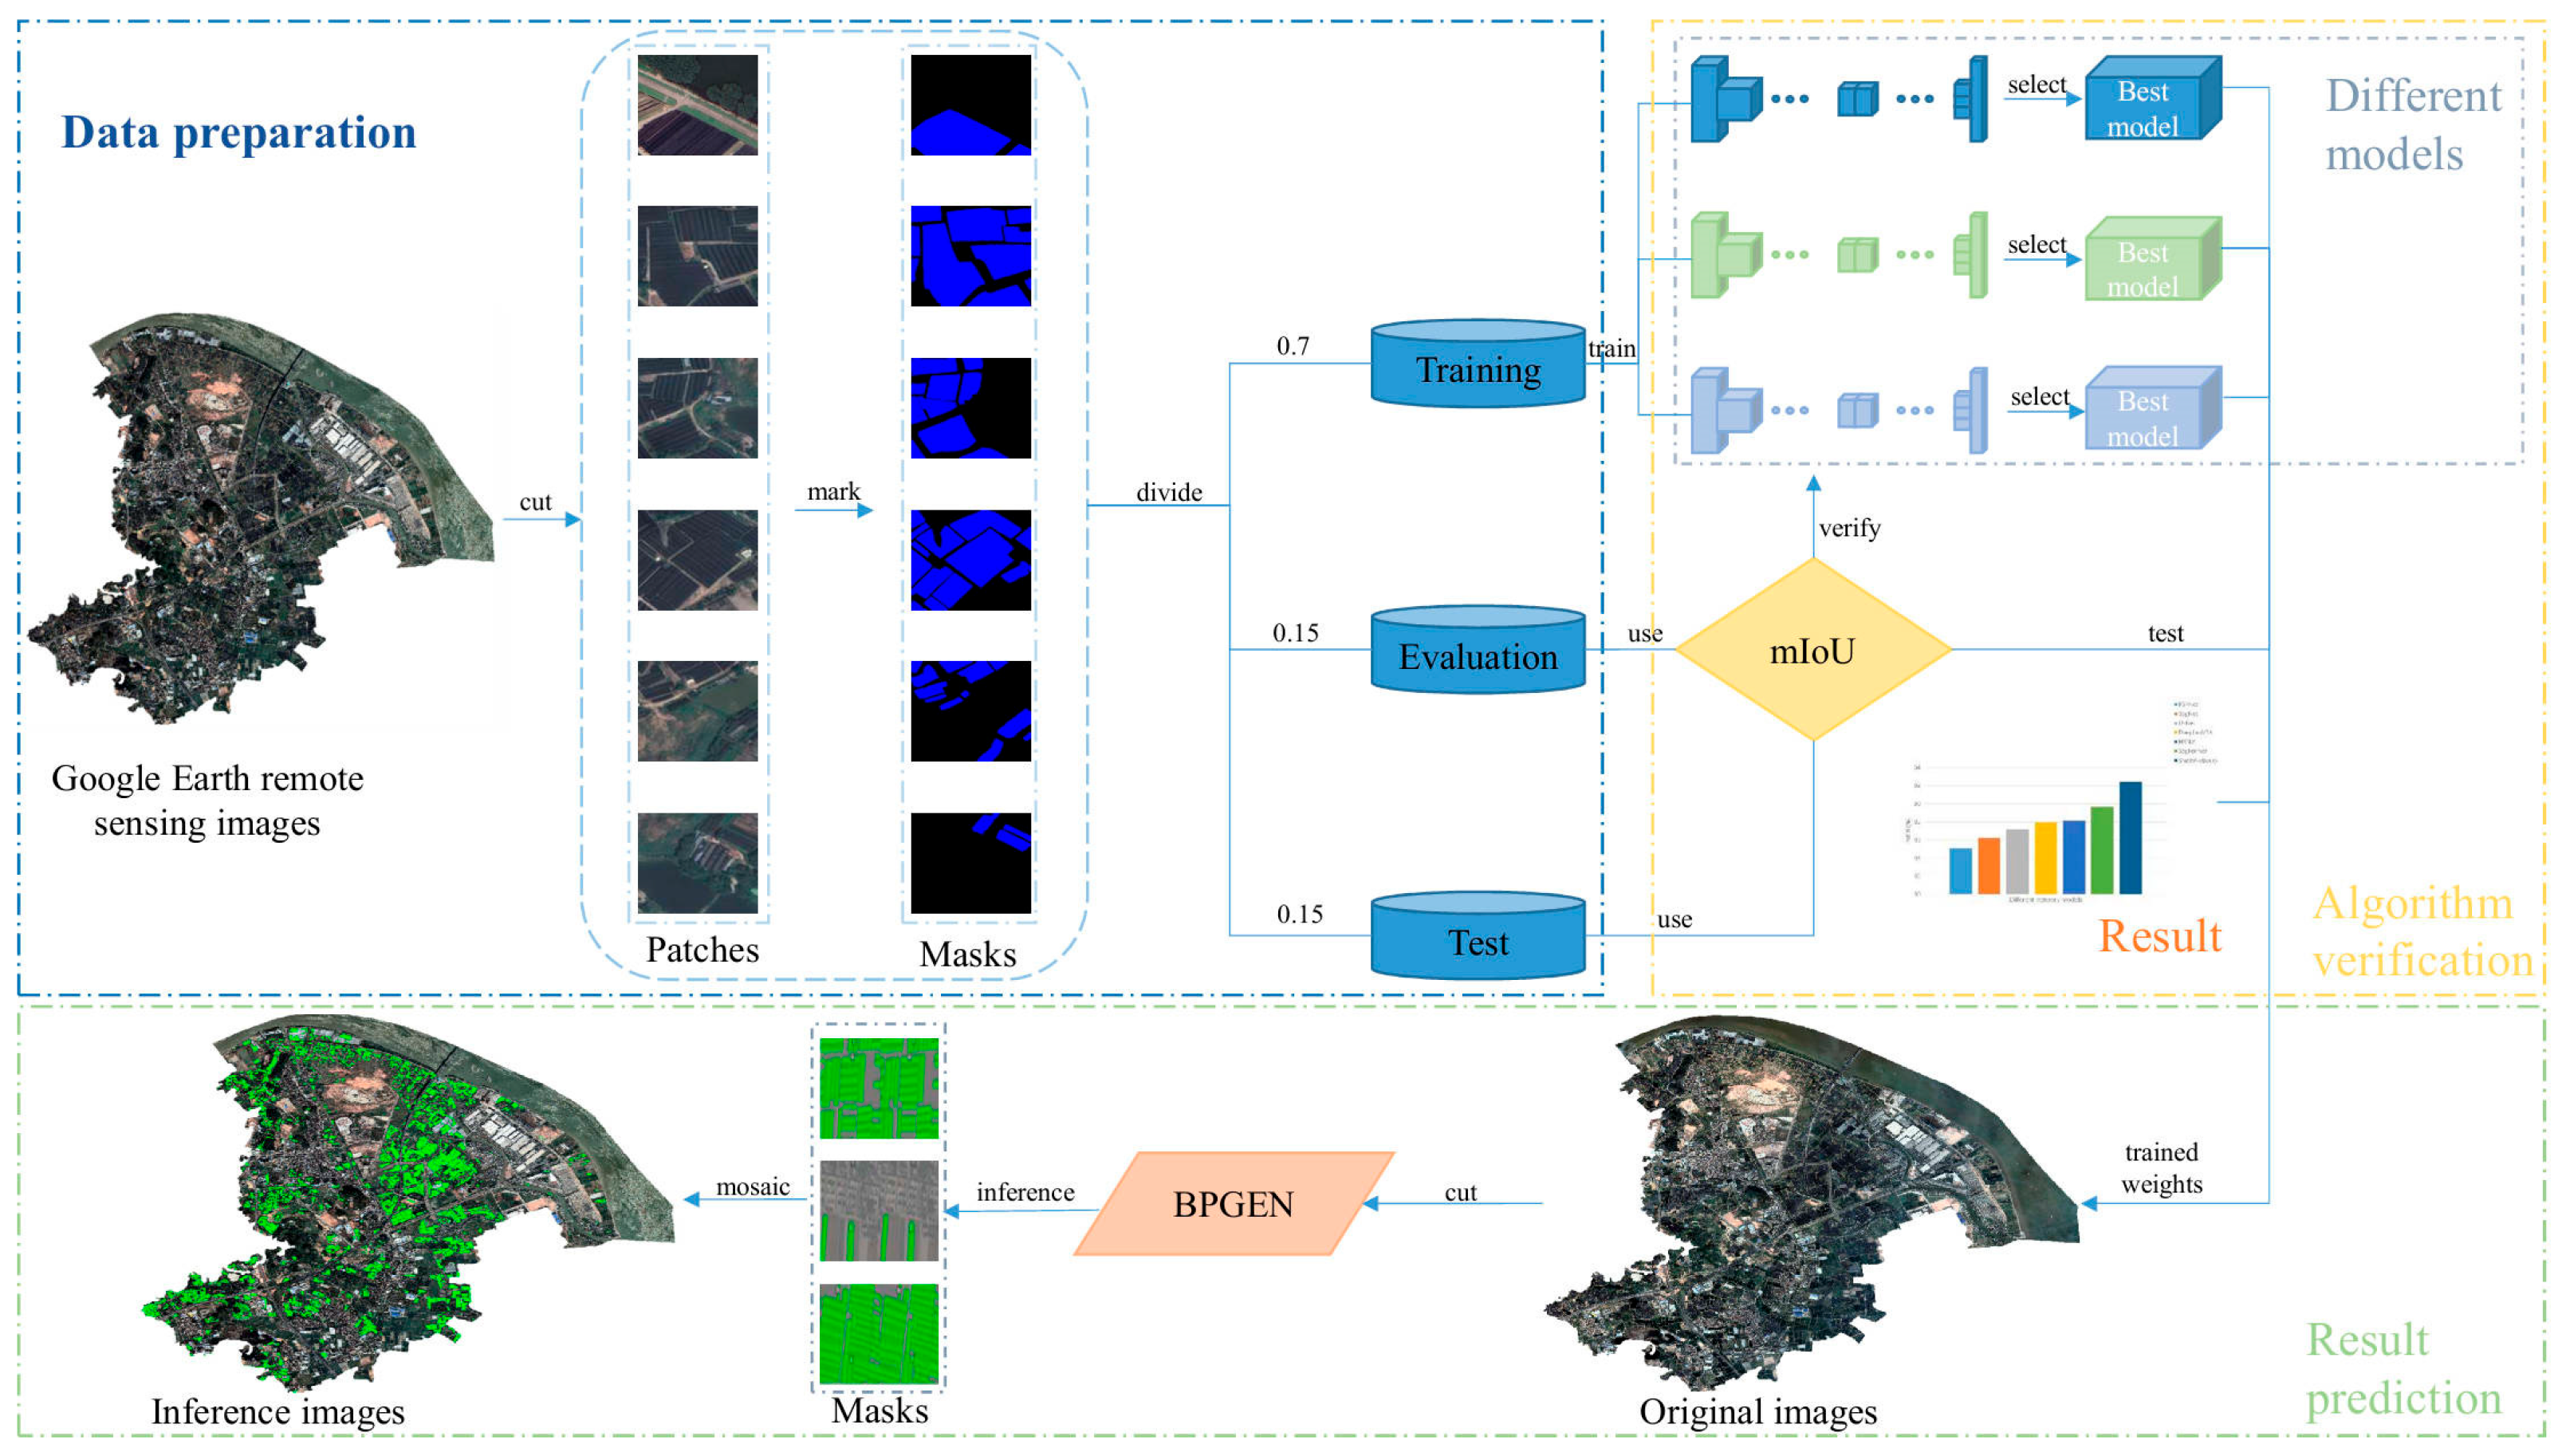
4.1. The Overall Process of Extracting Shade Houses

Figure 10 illustrates the main technical process for shade house extraction, comprising three key steps: data preparation, algorithm validation, and result prediction.
  • In the data preparation phase, we manually annotated the downloaded high-resolution remote sensing images through visual interpretation, storing the annotation results as binary grayscale images. Subsequently, the images were cropped, and the dataset was divided as described in Section 3.1.3.
  • In the algorithm validation phase, the mean Intersection over Union (mIoU, %) was used as the evaluation metric to assess the accuracy of each model. The best accuracy weight file for each model was selected through the validation set and then evaluated on the test set. The specific details of the model training settings are described in Section 4.3.
  • In the result prediction phase, we divided the original images into several image patches, input the trained weight files into the ShadeNet, and obtained the predicted masks. The mask images of all image patches were then stitched together using geographic coordinates, ultimately producing the shade house extraction result for the designated area of the original image.
Figure 10. Overall process diagram of shade house extraction.
Applsci 15 03735 g010

4.2. Accuracy Evaluation Metric: mIoU

In this study, we define shade house extraction as a semantic segmentation task. For semantic segmentation tasks, the mean Intersection over Union (mIOU) is an important evaluation metric widely used to measure the model’s classification accuracy at the pixel level, particularly for extracting two target classes: background and shade houses. mIoU effectively reflects the model’s accuracy in extracting target regions and provides a quantifiable measure of the model’s ability to distinguish between different classes. Given that the primary goal of this study was to achieve high-precision shade house extraction, mIoU is particularly suitable as the performance evaluation metric, as it comprehensively assesses the model’s ability to distinguish between these two classes and ensures its precision and stability in practical applications.
The mIoU calculation relies on binary confusion matrices, with the specific formula:
mIOU = 1 2 TP TP + FN + FP + TN TN + FN + FP .
The detailed expression of the confusion matrix is listed in the Table 1. In the binary confusion matrix used in this experiment, the meanings of TP, FN, FP, and TN are as follows: TP: true positive, i.e., the actual class of the sample is a shade house, and the model predicts it as a shade house; FN: false negative, i.e., the actual class of the sample is a shade house, but the model predicts it as background; FP: false positive, i.e., the actual class of the sample is background, but the model predicts it as a shade house; TN: true negative, i.e., the actual class of the sample is background, and the model predicts it as background.

4.3. Experimental Setup

The hardware used in this experiment consisted of an NVIDIA GeForce RTX 4070 GPU (NVIDIA, Santa Clara, CA, USA), which provided sufficient computational power to efficiently train the model. The optimizer used during training was AdamW, which is well-suited for training deep learning models with weight decay. The learning rate was set to 0.0001, with a weight decay of 0.05, which helped regularize the model and prevent overfitting. Additionally, a Polynomial Learning Rate Decay (PolyLR) scheduler was employed to dynamically adjust the learning rate as training progressed, ensuring smooth convergence. The learning rate decayed according to a polynomial function with a decay exponent of 0.9, and training ran for a total of 400,000 iterations. The batch size was set to 4, which was determined through experimental comparison to be the optimal value, balancing computational efficiency and memory consumption. A batch size of four allowed for efficient processing without exceeding the GPU memory limits. During training, validation was performed every 800 iterations, and the model was evaluated based on the mIoU metric, with the best model being saved. To prevent overfitting, various regularization techniques were applied, including the use of dropout and a drop_path_rate of 0.3 in the backbone network, which helps regularize the model by randomly dropping paths during training. These measures contribute to improving the model’s generalization ability and ensure that the model does not overly rely on specific paths within the network.
In terms of the loss function, this experiment uses multiple loss functions to optimize the performance of the segmentation task. Specifically, these include the following:
  • CrossEntropyLoss, used for classification tasks, with a loss weight of 2.0 and mean reduction.
  • DiceLoss, with a loss weight of 5.0, used to better handle class imbalance, especially when target objects are small or imbalanced.
  • MaskLoss, also based on CrossEntropyLoss, with a loss weight of 5.0, used for precise pixel classification.
The training pipeline also incorporates several data augmentation techniques aimed at increasing the diversity of the training data and improving the model’s robustness. These augmentation methods include random cropping, random flipping to introduce variations in the orientation of the input images, and photometric distortion to randomly adjust the brightness and color of the images, simulating different lighting conditions. These image transformations help the model encounter more diverse scenarios during training, thereby enhancing the model’s ability to generalize to unseen data during testing and in practical applications.
In addition, during the testing phase, we applied the Test-Time Augmentation (TTA) strategy, which involves applying different transformations (such as scaling, flipping, etc.) to the input images to further improve the model’s performance on the test data. TTA helps enhance the model’s robustness, making it more precise and stable in real-world applications.

4.4. Ablation Experiment and Result

To systematically evaluate the effectiveness of the core components in the ShadeNet model, this study designs hierarchical ablation experiments based on the Mask2Former framework [18]:
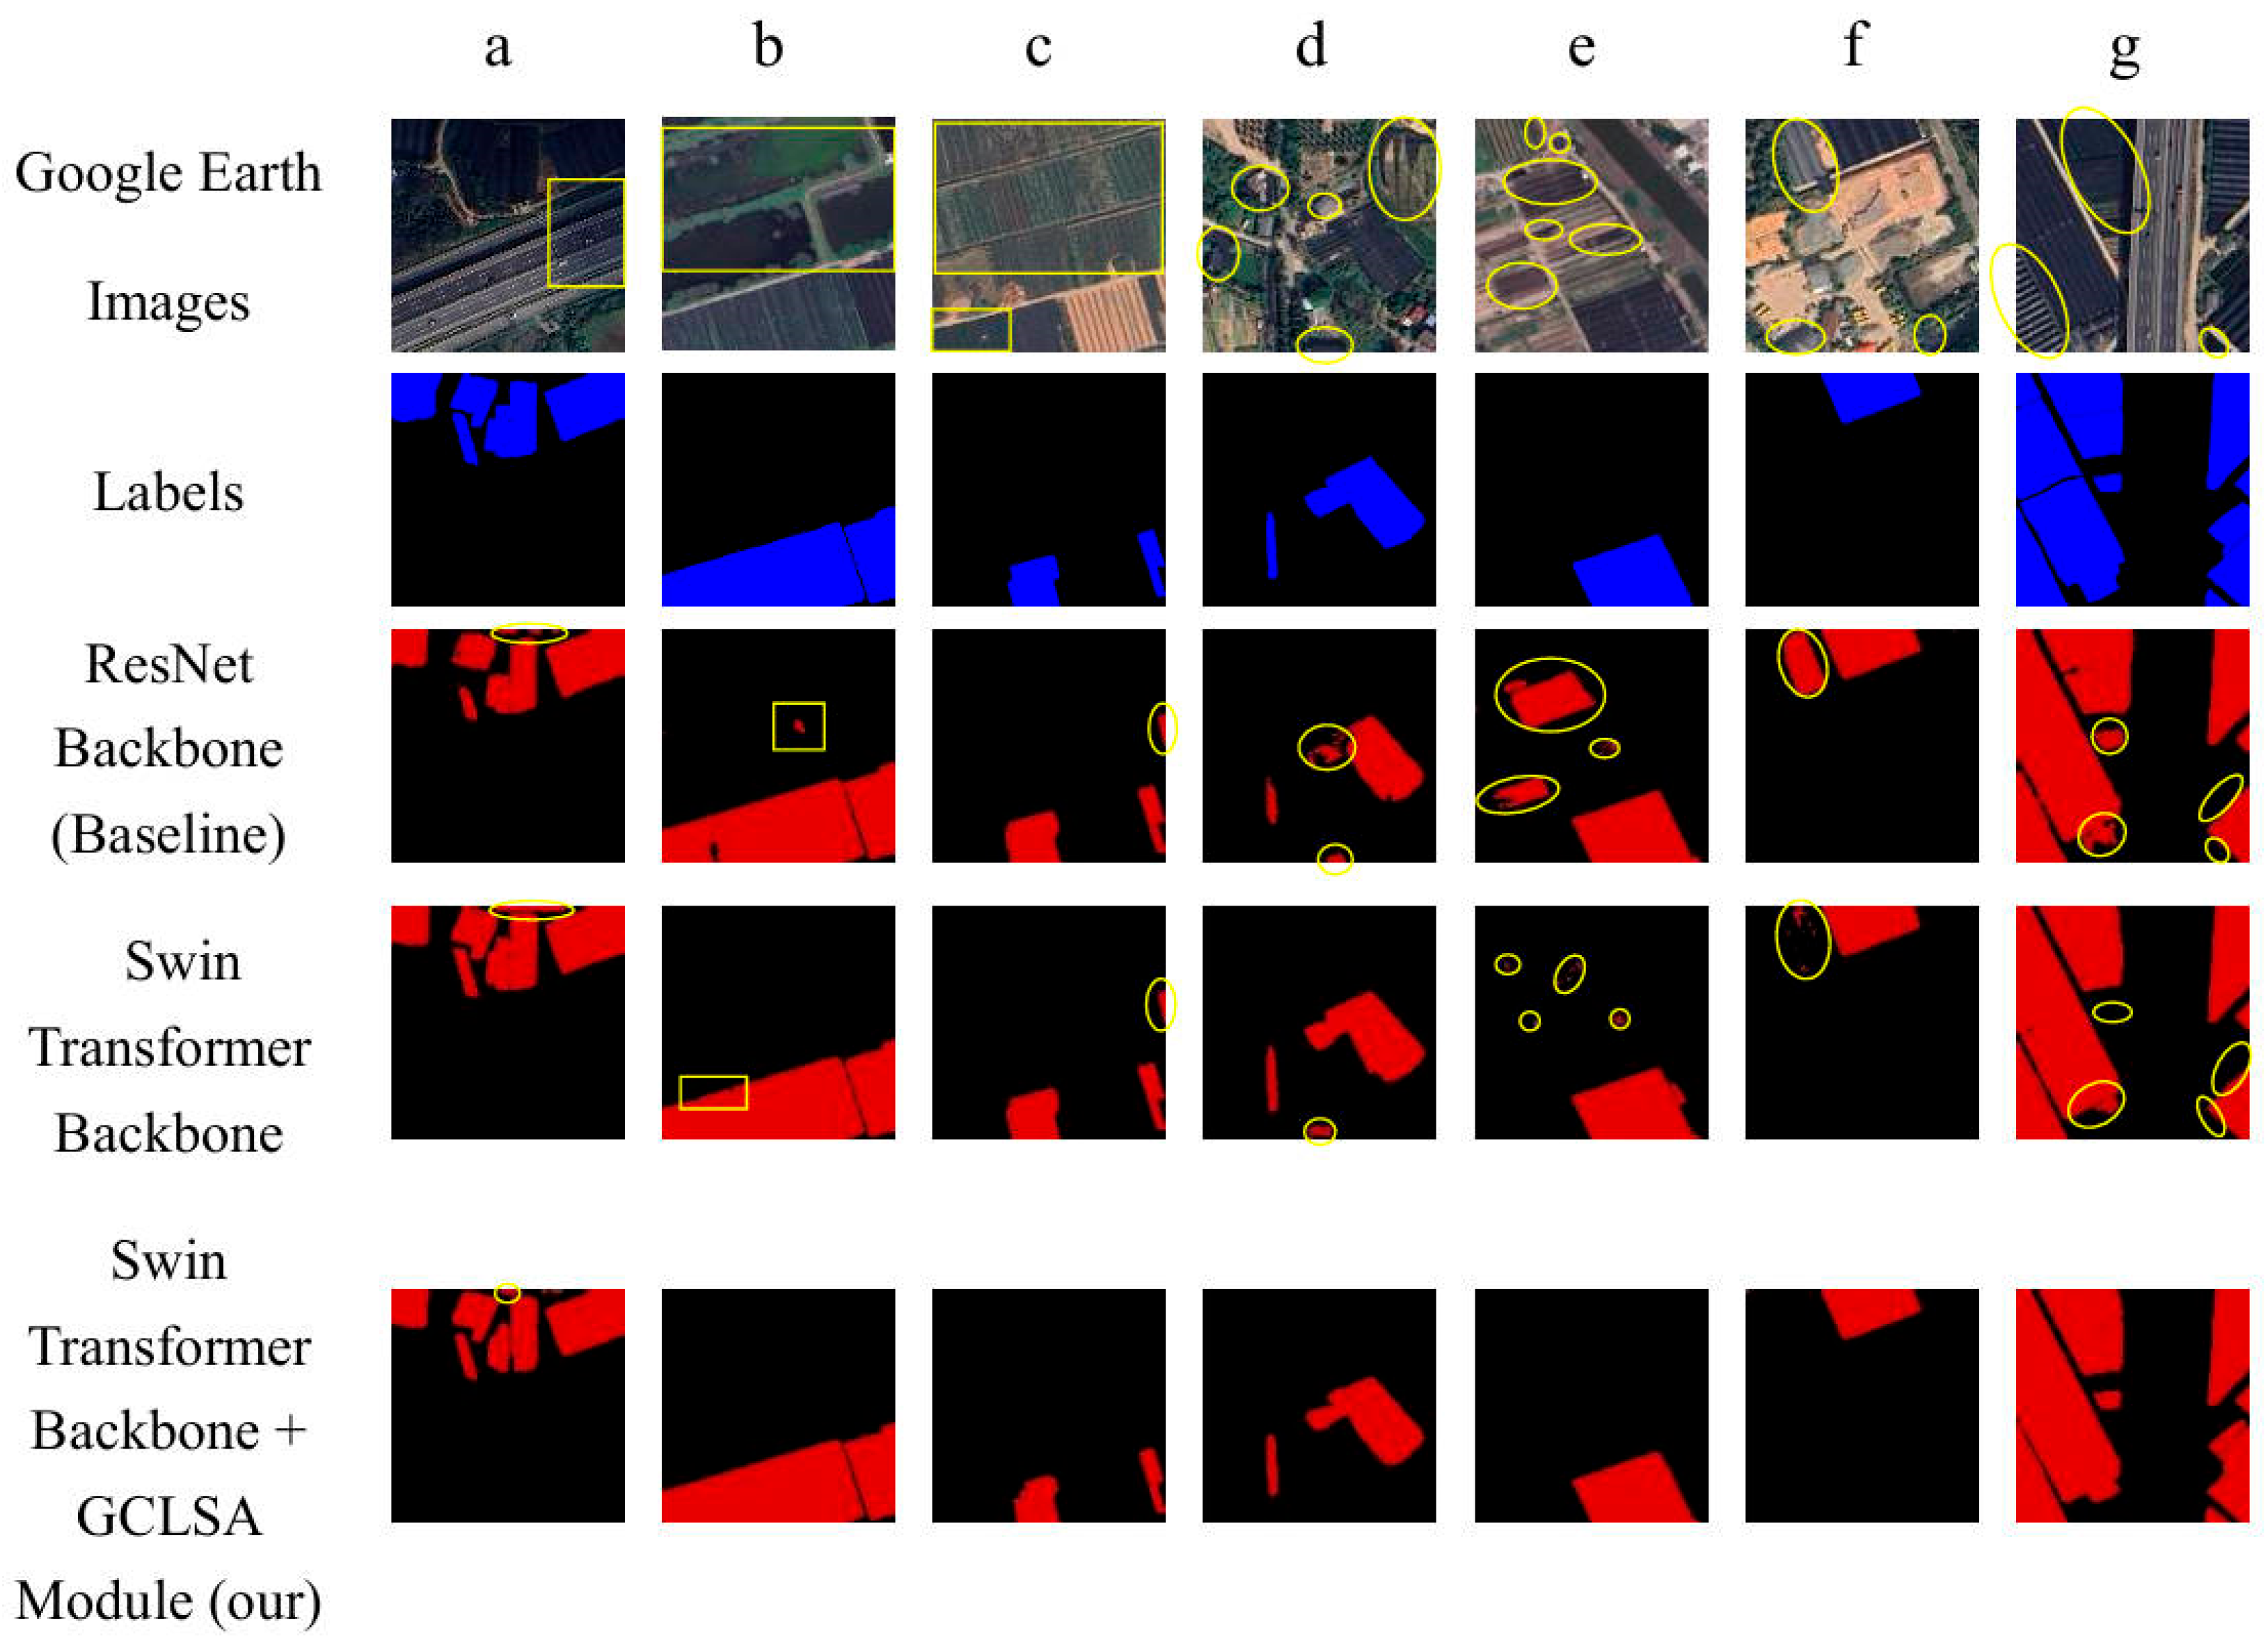
  • The ablation experiment of the backbone network. The Mask2Former model [18] with ResNet [40] as the backbone is selected as the baseline model. This choice is justified by the following two points: (1) ResNet [40], as a classic convolutional neural network architecture, has been extensively studied and validated in the semantic segmentation field, especially in combination with Transformer decoders. It is widely used in benchmark solutions such as CMNeXt [42] and Mask-RCNN [43]; (2) by keeping the decoder structure unchanged and only replacing the backbone network, the impact of the Swin Transformer’s [17] unique hierarchical attention mechanism and long-range dependency modeling capabilities on segmentation performance can be effectively isolated.
  • The validation experiment of the GCLSA Module. The GCLSA module is introduced in the improved model based on the Swin Transformer to quantitatively analyze its contribution to enhancing the model’s ability to learn contextual information. The experiment employs a controlled variable approach, keeping other hyperparameters consistent and comparing performance by activating and deactivating the GCLSA module.
In the ablation experiment section, we used the mIoU introduced in Section 4.2 as the accuracy evaluation metric. This study verified the effectiveness of each component through a hierarchical experimental design. The accuracy results are shown in Table 2, where “ResNet Backbone” refers to the Mask2Former model with ResNet as the backbone network, “Swin Transformer Backbone” refers to the Mask2Former model with Swin Transformer as the backbone network, and “Swin Transformer Backbone + GCLSA Module” refers to the ShadeNet model proposed in this study. Based on these results, we can draw the following conclusions:
  • The baseline model with ResNet as the backbone achieves an mIoU of 89.21%, which is consistent with the benchmark performance of similar studies under the Mask2Former framework [18], thereby validating the reliability of the experimental setup.
  • After adopting the Swin Transformer backbone, the model’s mIoU improves to 90.05%, indicating that the self-attention mechanism architecture, which incorporates a sliding window attention, significantly enhances the feature representation capability compared to traditional convolutional structures.
  • After introducing the GCLSA module, the model’s performance significantly improves to 92.42%, which validates that the GCLSA module, by reinforcing the attention to interrelations, effectively enhances the model’s ability to capture global contextual information.
Table 2. The mIoU results of the ablation experiment.
ModelmIOU (%)
ResNet Backbone (Baseline)89.21
Swin Transformer Backbone90.05
Swin Transformer Backbone + GCLSA Module(our)92.42
To provide a more intuitive comparison of the performance of each model, we present the visualization results of the models in Figure 11. In the following analysis, for convenience, we refer to the Mask2Former model with ResNet as the backbone as Mask2Former(ResNet), the Mask2Former model with Swin Transformer as the backbone as Mask2Former (Swin Transformer), and the Swin Transformer Backbone + GCLSA Module as the ShadeNet model proposed in this study.
As shown in Figure 11, ShadeNet demonstrates outstanding segmentation performance in complex scenarios, particularly in handling roads, dark-colored water bodies, deep-colored vegetation, black roofs, shadowed regions, and other similar objects, with its accuracy significantly surpassing that of the other models involved in the ablation experiments.
In the road and shade house scenes presented in Figure 11a, Mask2Former (ResNet), Mask2Former (Swin Transformer), and ShadeNet exhibit clear performance differences. In complex backgrounds, ShadeNet performs exceptionally well, effectively distinguishing between shade houses and roads, thereby avoiding misclassification and feature confusion, and significantly outperforming the traditional Mask2Former (ResNet). Due to its relatively simple structure, Mask2Former (ResNet) tends to confuse shade houses with the background in complex scenes, leading to a decrease in segmentation accuracy. Although Mask2Former (Swin Transformer) leverages the self-attention mechanism to capture global information and shows certain advantages in handling complex scenarios, it still encounters some misclassification issues in processing finer details and boundaries.
In the scene with dark-colored water bodies (Figure 11b), ShadeNet demonstrates strong discriminative ability, effectively distinguishing between shade houses and dark-colored water regions, significantly reducing misclassification. In contrast, the Mask2Former (ResNet) tends to confuse shade houses with dark-colored water bodies in this scenario, leading to a decrease in segmentation accuracy. Although the Mask2Former (Swin Transformer) shows improvements over the baseline model, it still exhibits some deficiencies in segmentation accuracy at the boundaries of the shade houses.
In the scene with shade houses and dark-colored vegetation (Figure 11c), ShadeNet is able to accurately distinguish between shade houses and dark-colored vegetation, significantly reducing misclassification in high-similarity target areas compared to other models. In contrast, both Mask2Former (ResNet) and Mask2Former (SwinTransformer) mistakenly classify a small portion of dark-colored vegetation at the image’s edge as a shade house. Despite the dark vegetation only representing a small part of its overall structure, ShadeNet is still able to accurately differentiate between the shade house and vegetation in this case, demonstrating its exceptional capability in fine-grained feature extraction.
In the scene with similar objects, such as the black roofs and shade houses shown in Figure 11d, ShadeNet, with its enhanced spatial and channel features, significantly improves the model’s ability to perceive both local features and global relationships in complex backgrounds, ensuring the accuracy of shade house region segmentation and the integrity of boundaries. In contrast, while Mask2Former (SwinTransformer) shows improvements in capturing global features, it still lags behind ShadeNet in terms of detail handling and boundary integrity, resulting in poor performance of complex object segmentation. Mask2Former (ResNet), on the other hand, exhibits significant misclassification over a larger area.
In the scene with shade houses and dark land or black plastic films (Figure 11e), ShadeNet effectively distinguishes between shade houses and dark land or plastic films, particularly excelling in cases where the ground and shade house boundaries are ambiguous. In contrast, Mask2Former (ResNet) exhibits a higher number of misclassifications in this scenario, especially in areas where the ground color closely matches black, making it difficult to accurately differentiate between the shade house and the background. Although Mask2Former (SwinTransformer) reduces the misclassification range, it still encounters errors in some complex ground areas.
In the high-density distribution scene of shade houses and warehouses (Figure 11f), where shade houses and similar objects such as warehouses are closely distributed, other models tend to confuse the background and target areas. In contrast, ShadeNet’s self-attention mechanism and spatial-channel attention mechanism are better at balancing the target’s detailed features with contextual information, significantly reducing the misclassification rate.
Finally, in the handling of shade houses and complex shadow scenes (Figure 11g), ShadeNet demonstrates strong robustness in dealing with shadow variations, accurately distinguishing between shade houses and the background, and reducing the impact of shadow regions on the segmentation results. Mask2Former (ResNet) is more susceptible to shadow interference, leading to misclassifications. Mask2Former (Swin Transformer) shows improvements in handling shadows, but still experiences misclassifications in regions with strong shadows.
In summary, ShadeNet demonstrates strong robustness and accuracy in multiple complex scenarios, particularly in scenes with shade houses and complex backgrounds, similar objects, and shadow variations, significantly improving segmentation accuracy. In contrast, traditional Mask2Former (ResNet) and Mask2Former (Swin Transformer) exhibit certain limitations in handling some complex backgrounds and finer details.

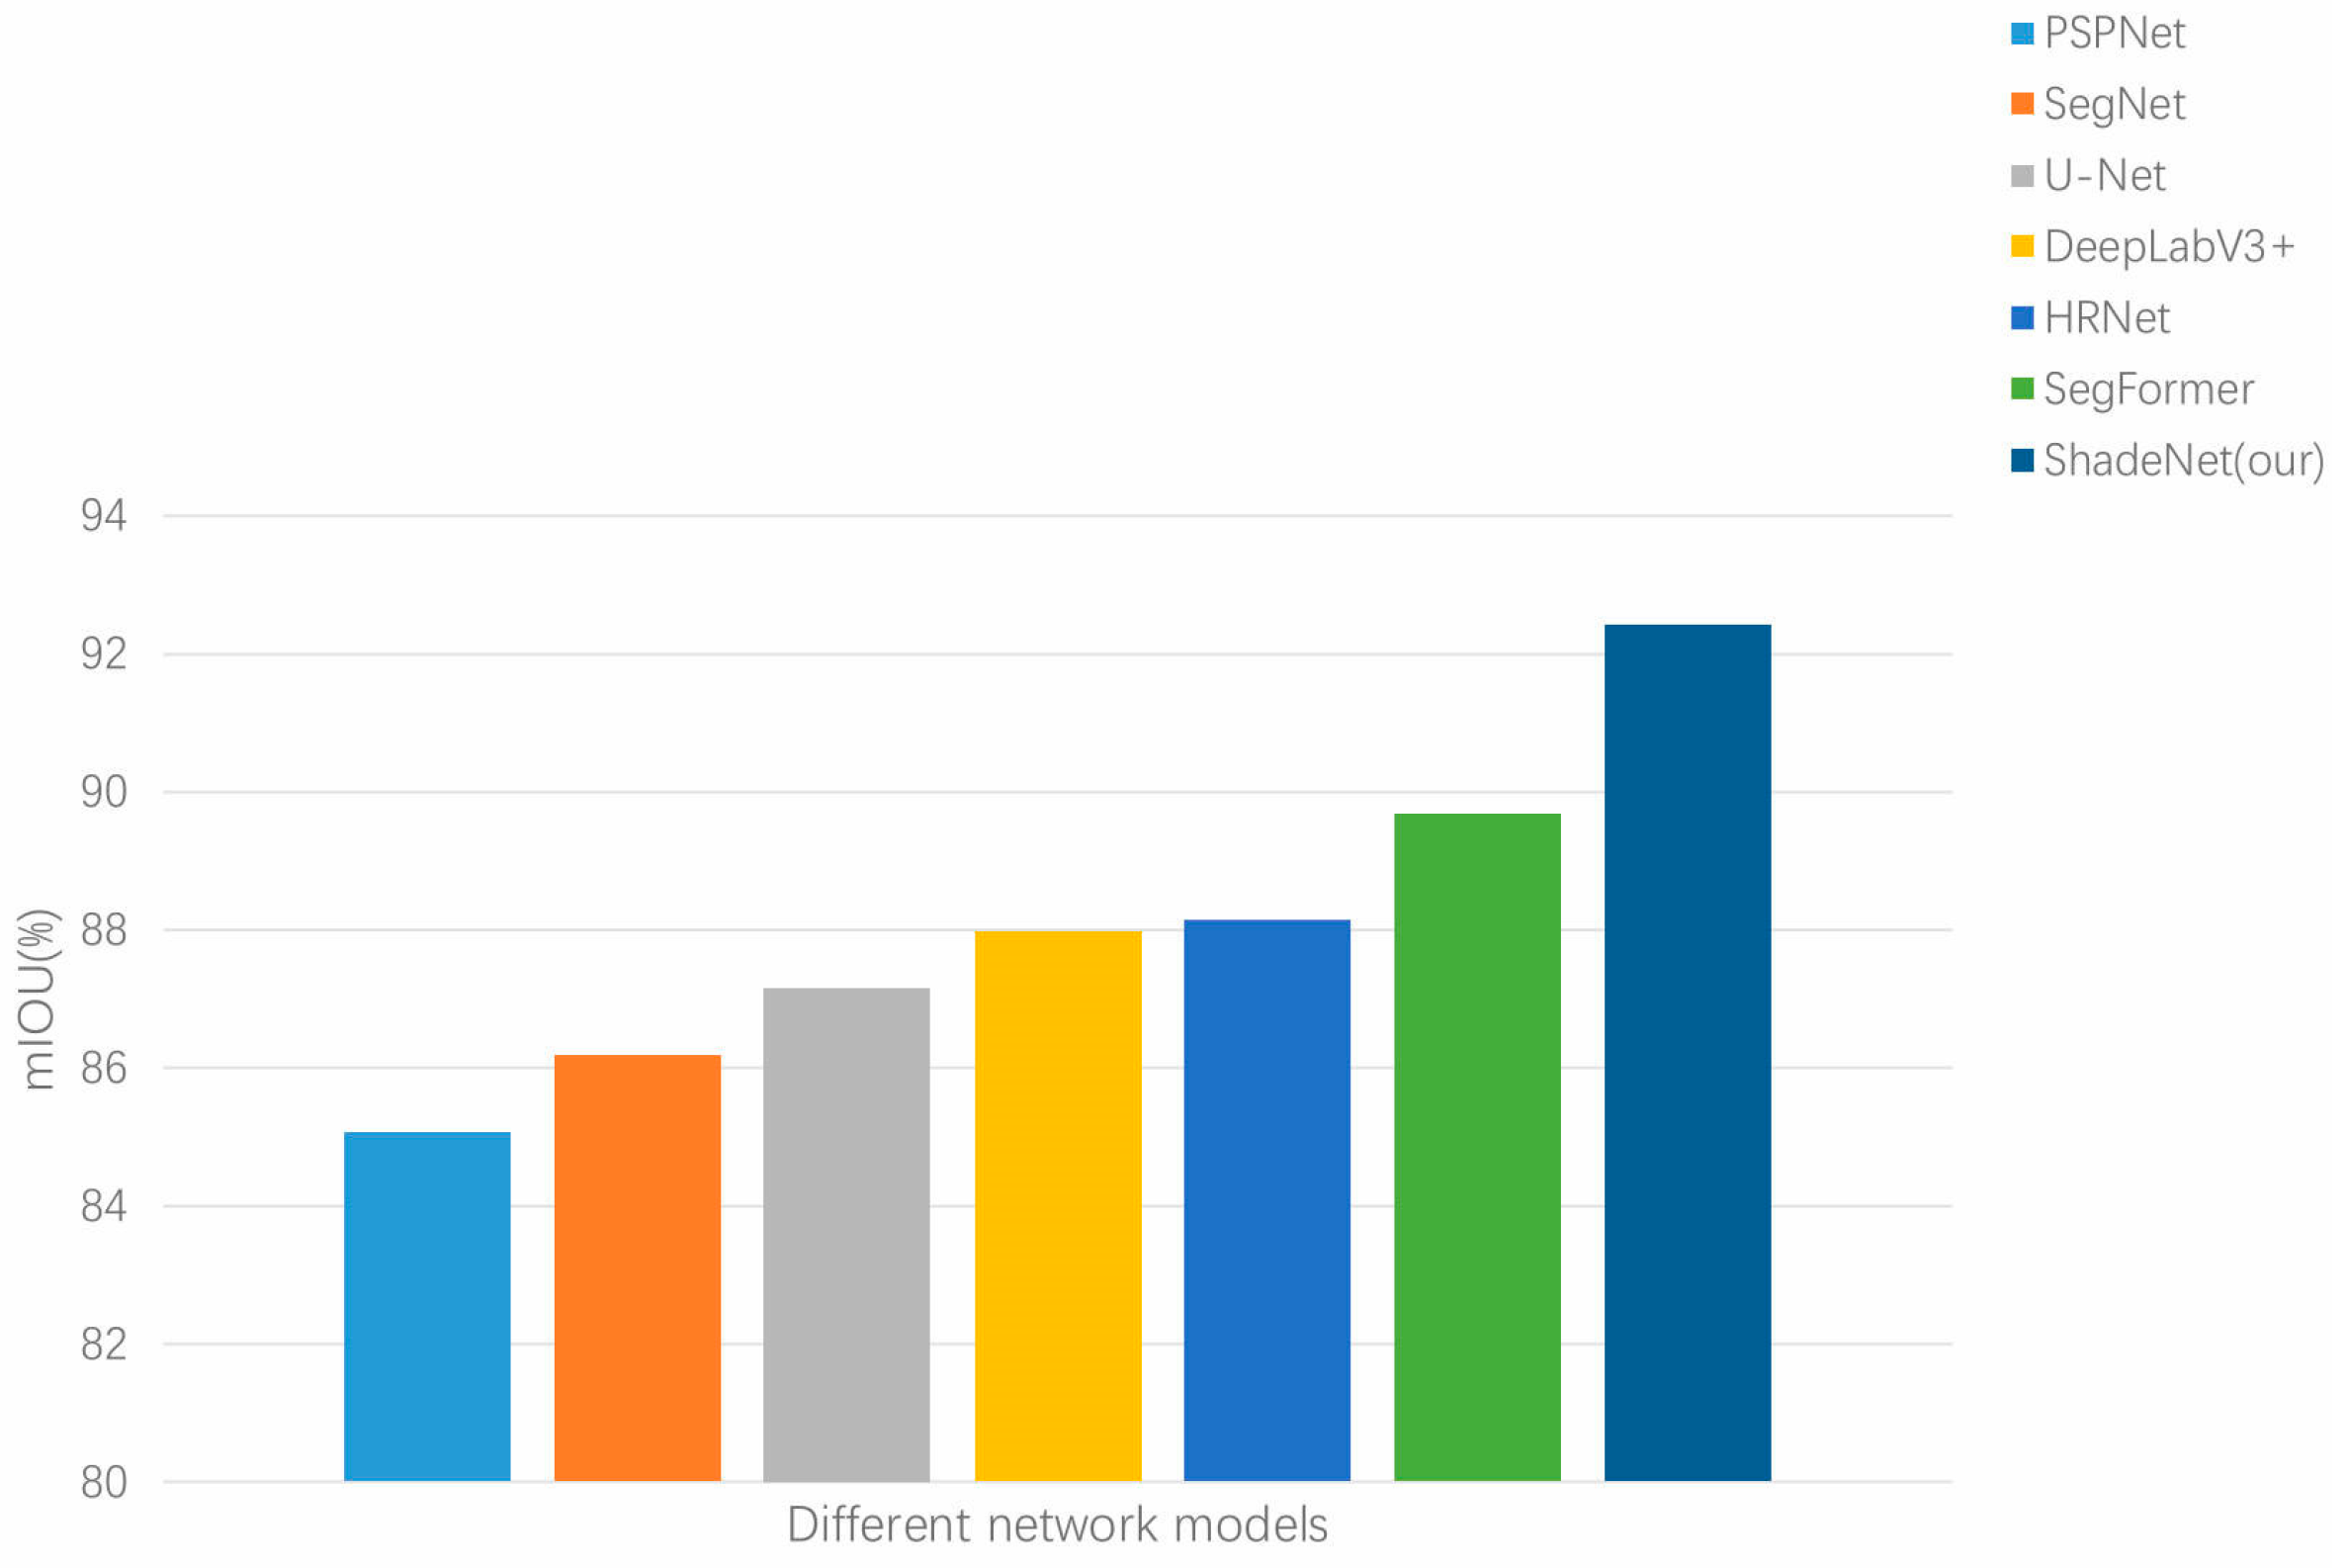
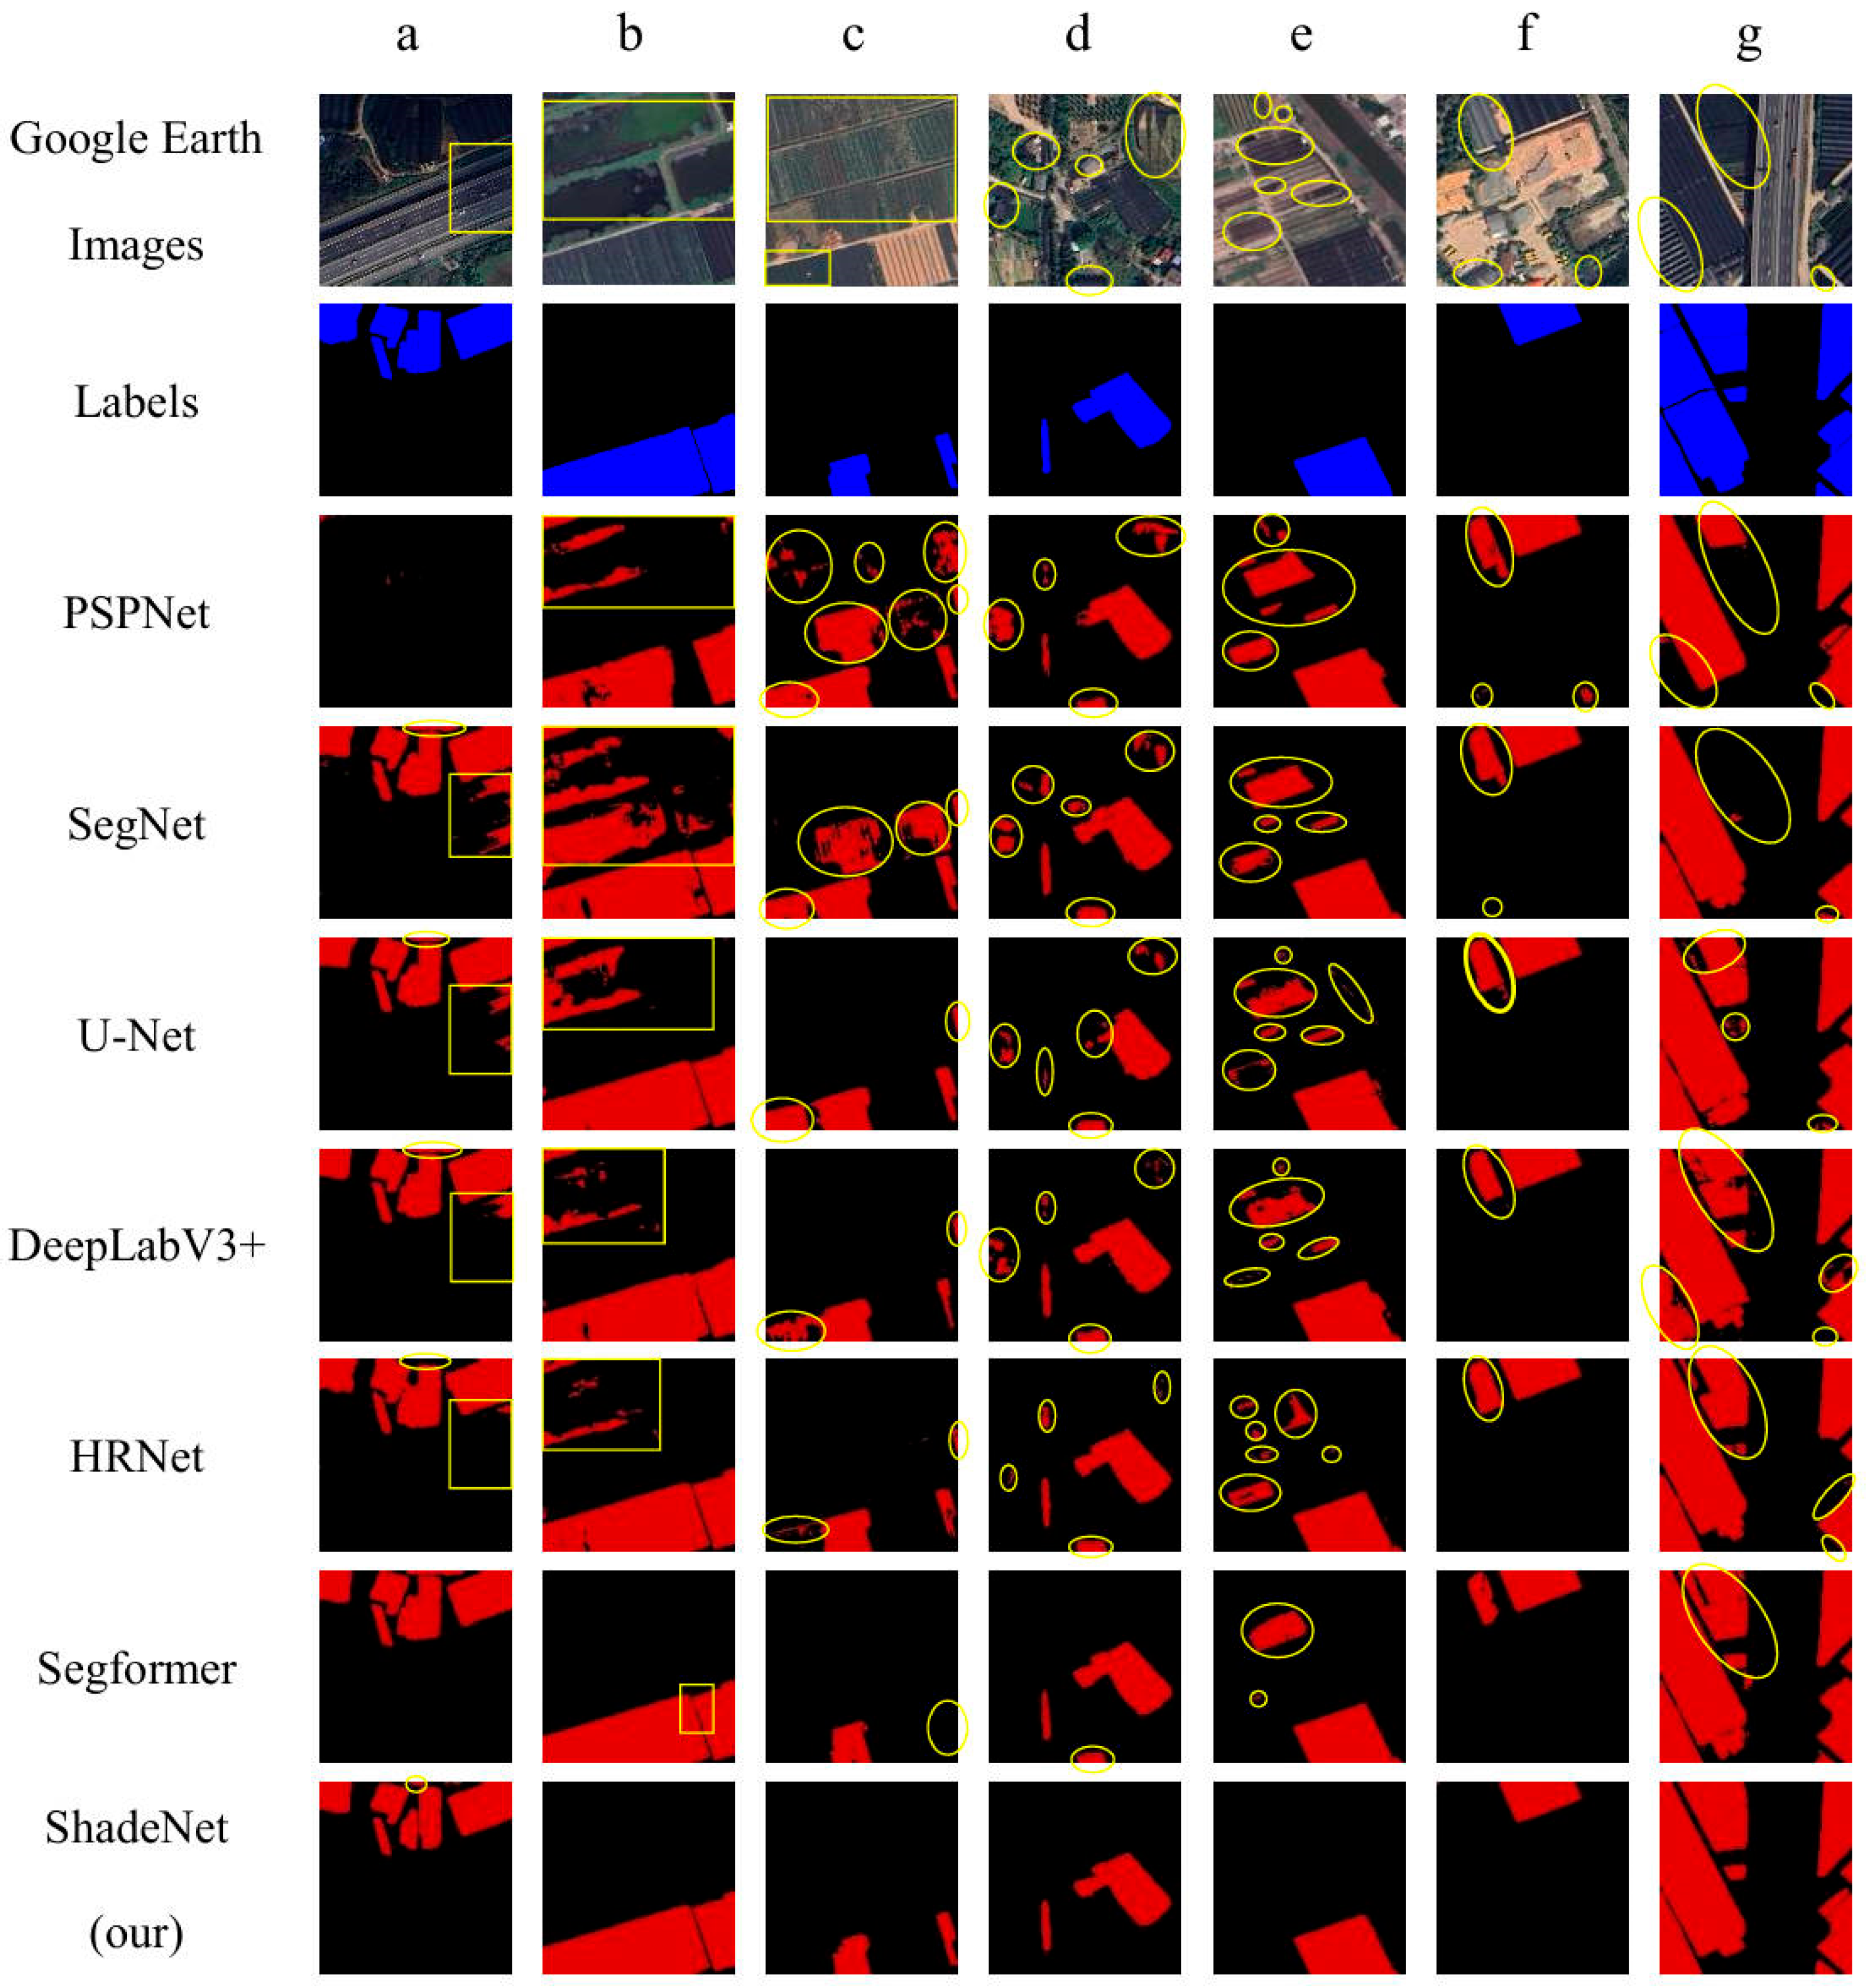
4.5. Comparative Experiment and Results

This study selected six typical and widely used networks (U-Net [27], HRNet [28], DeeplabV3+ [44], SegNet [45], SegFormer [46], PSPNet [47]) as the control group for comparison with the ShadeNet proposed in this study. The histograms of mIOU results for each model are shown in Figure 12.
As shown in Table 3, Figure 12 and Figure 13, the ShadeNet demonstrates exceptional segmentation performance in complex scenarios. Particularly when handling roads, dark-colored water bodies, dark-colored vegetation, black roofs, shadow areas, and other objects similar to shade houses, its accuracy significantly outperforms the other models in the comparison.
Specifically, in the scenario shown in Figure 13a, the ShadeNet, along with Segformer [46], demonstrates outstanding performance in distinguishing roads and shade houses, significantly outperforming traditional CNNs such as U-Net [27] and HRNet [28]. U-Net [27], due to its symmetric encoder–decoder structure, performs well in simple scenes but struggles with feature confusion in complex backgrounds, leading to a decline in segmentation accuracy. On the other hand, HRNet [28] maintains high-resolution feature maps, effectively capturing multi-scale information. While this improves segmentation performance to some extent, its ability to extract local features is still insufficient when dealing with highly similar objects. After introducing Swin Transformer [17] as the backbone network, ShadeNet significantly improves the capture of global features through the self-attention mechanism, enabling better handling of long-range dependencies and complex backgrounds. Building on this, ShadeNet further integrates a -channel attention mechanism, which dynamically adjusts the spatial and channel weights of the feature maps, enhancing the focus on key regions and detailed information. This allows ShadeNet to more accurately capture subtle feature differences between black plastic greenhouses and similar objects in complex scenes, such as road edges, effectively avoiding misclassifications.
In the dark-colored water body scenario shown in Figure 13b, ShadeNet’s GCLSA module, through multi-scale feature extraction, precisely captures the subtle feature differences between the water bodies and shade houses at the boundary, significantly improving segmentation accuracy. While Segformer [46] excels at capturing global features, its performance in detail handling is still inferior to ShadeNet’s channel-spatial attention mechanism, resulting in reduced segmentation accuracy at boundaries.
In the dark-colored vegetation scenario shown in Figure 13c, ShadeNet, by enhancing the selectivity of feature signals, more effectively distinguishes between shade houses and dark-colored vegetation, significantly reducing the misclassification of other models in high-similarity target regions. U-Net [27] and HRNet [28] exhibit a higher misclassification rate in such regions due to their feature fusion strategies failing to adequately differentiate subtle differences. Although Segformer [46] show improvement in global feature capture, they still fall short of ShadeNet’s dual attention mechanism in terms of detail differentiation.
In the scenario shown in Figure 13d with similar objects such as black roofs and shade nets, ShadeNet, through dynamically weighted channel and spatial features, significantly improves its ability to perceive local features and global relationships in complex backgrounds, ensuring the accuracy of shade houses region segmentation and the integrity of boundaries. While Segformer [46], based on the self-attention mechanism, shows a significant improvement in accuracy compared to traditional CNN networks, it still encounters issues such as misclassifying black roofs as shade houses.
In the scenario shown in Figure 13e, ShadeNet effectively distinguishes shade houses from dark lands and black plastic films, significantly reducing misclassification and improving the segmentation quality of target boundaries, thanks to its outstanding global perception and local feature capture abilities. While Segformer [46] performs well in capturing global information in similar scenarios, it still faces issues with blurring and misjudgment in detail areas, failing to completely avoid misclassification.
In the scenario shown in Figure 13f, where shade houses and warehouses are densely distributed, other models often confuse background and target regions, while ShadeNet’s self-attention mechanism and spatial-channel attention mechanism balance the target’s detailed features and contextual information, significantly reducing the misclassification rate. U-Net [27] and HRNet [28] perform especially poorly in such high-density similar object distribution scenarios, with a higher misclassification rate and an inability to effectively distinguish tightly distributed similar objects.
Finally, in the complex shadowed scene shown in Figure 13g, ShadeNet’s channel-spatial attention mechanism demonstrates excellent semantic extraction ability, accurately identifying the obscured shade houses regions and ensuring the completeness and accuracy of the segmentation results. In contrast, Segformer [46] perform poorly in the shadow-covered area, often missing the occluded targets, resulting in incomplete segmentation outcomes.
In summary, the ShadeNet significantly enhances its ability to discriminate complex backgrounds and similar objects by integrating self-attention and GCLSA mechanisms. The self-attention mechanism empowers the model with strong global perceptive capabilities, enabling it to effectively capture long-range dependencies and extract global features. On the other hand, the GCLSA mechanism strengthens the model’s focus on key regions and detailed information by dynamically adjusting the channel and spatial weights of the feature maps. The synergistic effect of these dual attention mechanisms allows ShadeNet to strike a better balance between multi-level feature fusion, detail processing, and global understanding, thereby maintaining high performance across various complex and dynamic remote sensing image segmentation tasks.
The experimental results demonstrate that ShadeNet exhibits remarkable robustness and reliability in both complex scenes with significant visual similarities (e.g., dark land and black PMFs) and in scenes with occlusions and background interference (e.g., PCGs under shadow coverage). Its semantic segmentation performance significantly outperforms other mainstream models. This provides a highly efficient and reliable solution for shade houses extraction tasks, with broad application potential.

5. Discussion

5.1. Advantages

To fill the current research gap in the field of shade houses extraction, this paper proposes a high-precision shade houses extraction method and verifies its feasibility. The accuracy of deep learning largely depends on the quality of the dataset, and there is currently no specific dataset targeting shade houses. Therefore, this study efficiently creates a high-quality, high-resolution shade house dataset by leveraging the advantages of Segment Anything.
The proposed ShadeNet is an innovative method for shade house extraction based on self-attention mechanisms and enhanced feature learning, featuring an advanced attention mechanism architecture. As a deep learning-based approach, ShadeNet offers superior portability and feature extraction capabilities compared to traditional remote sensing methods. For instance, spectral index methods are often plagued by poor portability and require solid expertise. While spectral index extraction can achieve good results in small-scale shade houses extraction, it may not be suitable for large-scale extractions, especially with seasonal variations and differences in shade houses covering materials across different regions. Object-based classification methods, due to their high computational cost and limited capability to extract only shallow features, are not ideal for large-scale applications, requiring considerable processing time. In contrast, deep learning methods can explore deeper, more complex features and benefit from efficient parallel computation on GPU devices. Compared to traditional or state-of-the-art network models, ShadeNet’s novel architecture design enables it to learn semantic features of various scales and granularities more effectively, thus achieving higher segmentation accuracy when handling complex scenarios.
Specifically, Transformer-based structures have been tried in the remote sensing image processing field for extracting complex features, especially for large-scale images, where Transformer’s self-attention mechanism is effective in capturing long-range dependencies. However, research specifically addressing shade houses extraction remains in the exploratory phase. For example, Swin Transformer [17] has demonstrated strong capabilities in feature extraction at the image level, especially in capturing image details and global context. Nevertheless, it faces challenges in further improving extraction precision. To address this, we propose an improvement combining the Global-Channel and Local-Spatial Attention (GCLSA) module. This enhancement effectively strengthens the model’s learning of contextual information and reduces misclassification rates. Considering that Swin Transformer’s local window attention mechanism can process high-resolution images, but may have limitations in multi-scale feature fusion and fine-grained information processing, the GCLSA module provides an effective means of enhancement. Through the GCLSA module, the network can dynamically adjust the attention weights of different spatial locations and channels, thus improving the precise extraction of shade house regions. Specifically, the spatial attention mechanism helps the model focus on critical locations in the target area, while the channel attention further strengthens the selective focus on different feature channels, ensuring multi-level information fusion from local to global. This multidimensional attention mechanism enables ShadeNet to better recognize subtle differences between shade houses and their surrounding environment, improving extraction accuracy by capturing both global appearance features and learning deeper contextual information.

5.2. Limitations and Future Perspectives

As shown in the red boxes in Figure 14a,b, due to the inherently dark tone of the shade house and the potential formation of shadows at its edges when exposed to sunlight under certain situations, the shade house and its shadows often overlap when viewed from a top–down remote sensing perspective. This results in a blurred distinction between the boundary of the shade house and the surrounding soil. In manually annotated datasets, the reliance on visual interpretation inherently introduces some level of error, which may accumulate as network training progresses, thus impacting the final semantic segmentation accuracy. This is particularly evident in the blurring of boundary regions, leading to insufficient precision in the extraction results. Therefore, future research should focus on incorporating boundary extraction methods to refine the delineation of shade houses’ boundaries, which will further improve extraction accuracy and minimize the impact of boundary errors on both model training and final outcomes.

6. Conclusions

Shade houses are an essential component of modern facility agriculture, and accurately acquiring their distribution and area information is of great significance for environmental protection and sustainable development. As a key type of APCs, the extraction of shade houses remains an area with limited research. To address this gap, this paper proposes a precise extraction method for shade houses based on high-resolution remote sensing imagery and semantic segmentation technology.
The ShadeNet designed in this study integrates the GCLSA module into the Swin Transformer-based Mask2Former framework. Through a hierarchical structure and sliding window attention, the model effectively captures both local and global features of the image. Meanwhile, by combining multilayer perceptrons and convolutional layers, the model strengthens its understanding of inter-channel and spatial relationships, significantly enhancing its ability to capture global features and interpret contextual information, thereby improving segmentation accuracy.
The proposed ShadeNet was tested on a self-labeled shade house dataset. The results show that the ShadeNet network outperforms PSPNet [47], SegNet [45], U-Net [27], DeepLabV3+ [44], HRNet [28] and SegFormer [46] by 7.37%, 6.25%, 5.26%, 4.45%, 4.28%, 2.75%, and in terms of the mIOU metric. Moreover, it significantly reduces misjudgments and misclassifications of shade houses. This method enables accurate extraction of shade houses, providing reliable technical support for obtaining information such as their distribution and total coverage area.
The contributions of this study are manifold. First, the combination of Swin Transformer [17] and Mask2Former [18] significantly enhances the model’s ability to capture both global and local features, effectively addressing the limited receptive field problem of traditional CNNs. Second, the innovative development of the GCLSA module strengthens the model’s understanding of inter-channel relationships and spatial dependencies, improving its ability to extract global features and analyze contextual information. Finally, the proposed ShadeNet provides an effective solution for the accurate detection of shade houses, filling a gap in existing literature and offering valuable technical support for agricultural monitoring and environmental management.
In summary, the proposed ShadeNet method provides a significant advancement in the field of shade houses extraction from high-resolution remote sensing images. The integration of advanced attention mechanisms and feature learning techniques enables the model to achieve high accuracy and robustness in various complex scenarios. Future work will focus on addressing the current limitations and exploring new directions to further enhance the performance and applicability of the model. Specifically, future research will focus on incorporating boundary extraction methods to optimize the delineation of shade house boundaries, thereby improving extraction accuracy and minimizing the impact of boundary errors on both model training and final outcomes.

Author Contributions

Conceptualization, Y.L. and Q.Z.; methodology, Y.L.; validation, Y.L., M.X. and W.D.; formal analysis, Q.Z.; investigation, Y.L.; writing—original draft preparation, Y.L., M.X. and Q.Z.; writing—review and editing, Y.L., M.X., W.D. and Q.Z.; project administration, Q.Z. All authors have read and agreed to the published version of the manuscript.

Funding

This research was funded by the National Key R&D Program of China, grant number 2022YFE0209300. The funder is the corresponding author, Qingling Zhang. The funding period for this project is from 1 November 2022, to 31 October 2025.

Institutional Review Board Statement

Not applicable.

Informed Consent Statement

Not applicable.

Data Availability Statement

The self-annotated canopy dataset mentioned in this paper has been made available on the Figshare platform and can be accessed via the following link: https://doi.org/10.6084/m9.figshare.28388252.v1.

Acknowledgments

This work was supported by the OpenMMLab’s MMSegmentation toolkit, which provided a robust and flexible framework for semantic segmentation tasks. We appreciate the efforts of the OpenMMLab community in maintaining and continuously improving this valuable resource. The toolkit is available at https://github.com/open-mmlab/mmsegmentation (accessed on 22 March 2024).

Conflicts of Interest

The authors declare no conflicts of interest.

References

  1. Veettil, B.K.; Van, D.D.; Quang, N.X.; Hoai, P.N. Remote Sensing of Plastic-Covered Greenhouses and Plastic-Mulched Farmlands: Current Trends and Future Perspectives. Land. Degrad. Dev. 2023, 34, 591–609. [Google Scholar] [CrossRef]
  2. Jiménez-Lao, R.; Aguilar, F.J.; Nemmaoui, A.; Aguilar, M.A. Remote Sensing of Agricultural Greenhouses and Plastic-Mulched Farmland: An Analysis of Worldwide Research. Remote Sens. 2020, 12, 2649. [Google Scholar] [CrossRef]
  3. AGROVOC: Shade Houses. Available online: https://agrovoc.fao.org/browse/agrovoc/en/page/c_91cf9ea0 (accessed on 15 January 2025).
  4. Mohawesh, O.; Albalasmeh, A.; Deb, S.; Singh, S.; Simpson, C.; AlKafaween, N.; Mahadeen, A. Effect of Colored Shading Nets on the Growth and Water Use Efficiency of Sweet Pepper Grown under Semi-Arid Conditions. HortTechnology 2021, 32, 21–27. [Google Scholar] [CrossRef]
  5. Food and Agriculture Organization of the United Nations. Available online: https://www.fao.org/americas/news/news-detail/FAO-and-IICA-Partnering-to-Build-Climate-Resilience-During-the-Pandemic/en (accessed on 15 January 2025).
  6. Wu, C.F.; Deng, J.S.; Wang, K.; Ma, L.G.; Tahmassebi, A.R.S. Object-Based Classification Approach for Greenhouse Mapping Using Landsat-8 Imagery. Int. J. Agric. Biol. Eng. 2016, 9, 79–88. [Google Scholar]
  7. Zhang, X. Research on Algorithms for Agricultural Greenhouses Extraction from High-Resolution Remote Sensing Imagery Based on Deep Learning. Master’s Thesis, University of Chinese Academy of Sciences, Beijing, China, 2022. [Google Scholar]
  8. Feng, Q.; Niu, B.; Chen, B.; Ren, Y.; Zhu, D.; Yang, J.; Liu, J.; Ou, C.; Li, B. Mapping of Plastic Greenhouses and Mulching Films from Very High Resolution Remote Sensing Imagery Based on a Dilated and Non-Local Convolutional Neural Network. Int. J. Appl. Earth Obs. Geoinf. 2021, 102, 102441. [Google Scholar] [CrossRef]
  9. Picuno, P.; Tortora, A.; Capobianco, R.L. Analysis of Plasticulture Landscapes in Southern Italy through Remote Sensing and Solid Modelling Techniques. Landsc. Urban Plan. 2011, 100, 45–56. [Google Scholar] [CrossRef]
  10. Feng, S.; Lu, H.; Liu, Y. The Occurrence of Microplastics in Farmland and Grassland Soils in the Qinghai-Tibet Plateau: Different Land Use and Mulching Time in Facility Agriculture. Environ. Pollut. 2021, 279, 116939. [Google Scholar] [CrossRef]
  11. Niu, B.; Feng, Q.; Su, S.; Yang, Z.; Zhang, S.; Liu, S.; Wang, J.; Yang, J.; Gong, J. Semantic Segmentation for Plastic-Covered Greenhouses and Plastic-Mulched Farmlands from VHR Imagery. Int. J. Digit. Earth 2023, 16, 4553–4572. [Google Scholar] [CrossRef]
  12. Huang, D. Extraction and Accuracy Analysis of “Greenhouse Houses” Based on POI Data and Satellite Remote Sensing Images. In Proceedings of the 2024 5th International Conference on Geology, Mapping and Remote Sensing (ICGMRS), Wuhan, China, 12–14 April 2024; pp. 178–181. [Google Scholar]
  13. Guo, J. Research on Remote Sensing Extraction Method of Agricultural Plastic Greenhouse in Large-scale Complex Environments. Master’s Thesis, Yunnan Normal University, Kunming, China, 2024. [Google Scholar]
  14. Nemmaoui, A.; Aguilar, M.A.; Aguilar, F.J.; Novelli, A.; García Lorca, A. Greenhouse Crop Identification from Multi-Temporal Multi-Sensor Satellite Imagery Using Object-Based Approach: A Case Study from Almería (Spain). Remote Sens. 2018, 10, 1751. [Google Scholar] [CrossRef]
  15. Wang, Y.; Peng, L.; Chen, D.; Li, W. Remote Sensing Extraction Method of Agricultural Greenhouse Based on an Improved U-Net Model. J. Univ. Chin. Acad. Sci. 2024, 41, 375–386. [Google Scholar]
  16. Xu, X.; Feng, Z.; Cao, C.; Li, M.; Wu, J.; Wu, Z.; Shang, Y.; Ye, S. An Improved Swin Transformer-Based Model for Remote Sensing Object Detection and Instance Segmentation. Remote Sens. 2021, 13, 4779. [Google Scholar] [CrossRef]
  17. Liu, Z.; Lin, Y.; Cao, Y.; Hu, H.; Wei, Y.; Zhang, Z.; Lin, S.; Guo, B. Swin Transformer: Hierarchical Vision Transformer Using Shifted Windows. In Proceedings of the 2021 IEEE/CVF International Conference on Computer Vision (ICCV 2021), Virtual, 11–17 October 2021; pp. 9992–10002. [Google Scholar]
  18. Cheng, B.; Misra, I.; Schwing, A.G.; Kirillov, A.; Girdhar, R. Masked-Attention Mask Transformer for Universal Image Segmentation. In Proceedings of the 2022 IEEE/CVF Conference on Computer Vision and Pattern Recognition (CVPR), New Orleans, LA, USA, 21–24 June 2022; pp. 1280–1289. [Google Scholar]
  19. Aggarwal, A. A Geospatial Approach to Monitoring Land Use and Land Cover Dynamics: A Review. In Proceedings of the International Conference on Materials for Energy Storage and Conservation, Singapore, 23–24 August 2022; pp. 63–71. [Google Scholar]
  20. Zhang, X.; Cheng, B.; Liang, C.; Wang, G. Edge-Guided Dual-Stream Network for Plastic Greenhouse Extraction From Remote Sensing Image. IEEE Trans. Geosci. Remote Sens. 2024, 62, 1–21. [Google Scholar] [CrossRef]
  21. Ji, L.; Zhang, L.; Shen, Y.; Li, X.; Liu, W.; Chai, Q.; Zhang, R.; Chen, D. Object-Based Mapping of Plastic Greenhouses with Scattered Distribution in Complex Land Cover Using Landsat 8 OLI Images: A Case Study in Xuzhou, China. J. Indian Soc. Remote Sens. 2020, 48, 287–303. [Google Scholar] [CrossRef]
  22. Balcik, F.B.; Senel, G.; Goksel, C. Greenhouse Mapping Using Object Based Classification and Sentinel-2 Satellite Imagery. In Proceedings of the 2019 8th International Conference on Agro-Geoinformatics (Agro-Geoinformatics), Istanbul, Turkey, 16–19 July 2019; pp. 1–5. [Google Scholar]
  23. Wang, Z.; Zhang, Q.; Qian, J.; Xiao, X. Greenhouse Extraction Based on the Enhanced Water Index–A Case Study in Jiangmen of Guangdong. J. Integr. Technol. 2017, 6, 11–21. [Google Scholar]
  24. Yang, D.; Chen, J.; Zhou, Y.; Chen, X.; Chen, X.; Cao, X. Mapping Plastic Greenhouse with Medium Spatial Resolution Satellite Data: Development of a New Spectral Index. ISPRS J. Photogramm. Remote Sens. 2017, 128, 47–60. [Google Scholar] [CrossRef]
  25. Zhang, P.; Du, P.; Guo, S.; Zhang, W.; Tang, P.; Chen, J.; Zheng, H. A Novel Index for Robust and Large-Scale Mapping of Plastic Greenhouse from Sentinel-2 Images. Remote Sens. Environ. 2022, 276, 113042. [Google Scholar] [CrossRef]
  26. LeCun, Y.; Bengio, Y.; Hinton, G. Deep Learning. Nature 2015, 521, 436–444. [Google Scholar] [CrossRef]
  27. Ronneberger, O.; Fischer, P.; Brox, T. U-Net: Convolutional Networks for Biomedical Image Segmentation. In Proceedings of the Medical Image Computing and Computer-Assisted Intervention – MICCAI 2015, Munich, Germany, 5–9 October 2015; pp. 234–241. [Google Scholar]
  28. Sun, K.; Xiao, B.; Liu, D.; Wang, J. Deep High-Resolution Representation Learning for Human Pose Estimation. In Proceedings of the 2019 IEEE/CVF Conference on Computer Vision and Pattern Recognition (CVPR), Long Beach, CA, USA, 15–20 June 2019; pp. 5686–5696. [Google Scholar]
  29. Tan, M.; Le, Q.V. EfficientNet: Rethinking Model Scaling for Convolutional Neural Networks. In Proceedings of the 36th International Conference on Machine Learning (ICML), Long Beach, CA, USA, 9–15 June 2019; pp. 6105–6114. [Google Scholar]
  30. Redmon, J.; Farhadi, A. YOLOv3: An Incremental Improvement. arXiv 2018, arXiv:1804.02767. [Google Scholar]
  31. Li, M.; Zhang, Z.; Lei, L.; Wang, X.; Guo, X. Agricultural Greenhouses Detection in High-Resolution Satellite Images Based on Convolutional Neural Networks: Comparison of Faster R-CNN, YOLO v3 and SSD. Sensors 2020, 20, 4938. [Google Scholar] [CrossRef]
  32. Baghirli, O.; Ibrahimli, I.; Mammadzada, T. Greenhouse Segmentation on High-Resolution Optical Satellite Imagery Using. Deep Learning Techniques. arXiv 2020, arXiv:2007.11222. [Google Scholar]
  33. Ma, A.; Chen, D.; Zhong, Y.; Zheng, Z.; Zhang, L. National-Scale Greenhouse Mapping for High Spatial Resolution Remote Sensing Imagery Using a Dense Object Dual-Task Deep Learning Framework: A Case Study of China. ISPRS J. Photogramm. Remote Sens. 2021, 181, 279–294. [Google Scholar] [CrossRef]
  34. Aleissaee, A.A.; Kumar, A.; Anwer, R.M.; Khan, S.; Cholakkal, H.; Xia, G.-S.; Khan, F.S. Transformers in Remote Sensing: A Survey. Remote Sens. 2023, 15, 1860. [Google Scholar] [CrossRef]
  35. Vaswani, A.; Shazeer, N.; Parmar, N.; Uszkoreit, J.; Jones, L.; Gomez, A.N.; Kaiser, L.; Polosukhin, I. Attention Is All You Need. In Proceedings of the Advances in Neural Information Processing Systems 30 (NIPS 2017), Long Beach, CA, USA, 4–9 December 2017; pp. 5998–6008. [Google Scholar]
  36. Baidu Baike. Huilong Town (A Town in Panyu District, Guangzhou City, Guangdong Province). Available online: https://baike.baidu.com/item/%E5%8C%96%E9%BE%99%E9%95%87/15977 (accessed on 6 December 2024).
  37. Guangzhou Panyu District People’s Government Portal Website. Available online: http://www.panyu.gov.cn/jgzy/zzfjdbsc/fzqhlzrmzf/zjgk/ (accessed on 6 December 2024).
  38. Li, Y.; Zhang, J.; Zhang, P.; Xue, Y.; Li, Y.; Chen, C. Estimation of the Planting Area of Panax Notoginseng in Wenshan, Yunnan Based on Sentinel-2 Satellite Remote Sensing Images. J. Yunnan Univ. (Nat. Sci. Ed.) 2022, 44, 89–97. [Google Scholar]
  39. Shelhamer, E.; Long, J.; Darrell, T. Fully Convolutional Networks for Semantic Segmentation. IEEE Trans. Pattern Anal. Mach. Intell. 2017, 39, 640–651. [Google Scholar] [CrossRef]
  40. He, K.; Zhang, X.; Ren, S.; Sun, J. Deep Residual Learning for Image Recognition. In Proceedings of the 2016 IEEE Conference on Computer Vision and Pattern Recognition (CVPR), Las Vegas, NV, USA, 27–30 June 2016; pp. 770–778. [Google Scholar]
  41. Dosovitskiy, A.; Beyer, L.; Kolesnikov, A.; Weissenborn, D.; Zhai, X.; Unterthiner, T.; Dehghani, M.; Minderer, M.; Heigold, G.; Gelly, S.; et al. An Image is Worth 16x16 Words: Transformers for Image Recognition at Scale. In Proceedings of the 9th International Conference on Learning Representations (ICLR 2021), Virtual, 3–7 May 2021. [Google Scholar]
  42. Zhang, J.; Liu, R.; Shi, H.; Yang, K.; Reiß, S.; Peng, K.; Fu, H.; Wang, K.; Stiefelhagen, R. Delivering Arbitrary-Modal Semantic Segmentation. In Proceedings of the IEEE/CVF Conference on Computer Vision and Pattern Recognition (CVPR), Vancouver, BC, Canada, 18–22 June 2023; pp. 1136–1145. [Google Scholar]
  43. He, K.; Gkioxari, G.; Dollár, P.; Girshick, R. Mask R-CNN. In Proceedings of the 2017 IEEE International Conference on Computer Vision (ICCV), Venice, Italy, 22–29 October 2017; pp. 2980–2988. [Google Scholar]
  44. Chen, L.-C.; Zhu, Y.; Papandreou, G.; Schroff, F.; Adam, H. Encoder-Decoder with Atrous Separable Convolution for Semantic Image Segmentation. In Proceedings of the 2018 European Conference on Computer Vision (ECCV), Munich, Germany, September 8–14, 2018; Ferrari, V., Hebert, M., Sminchisescu, C., Weiss, Y., Eds.; Springer International Publishing: Cham, Switzerland, 2018; pp. 833–851. [Google Scholar]
  45. Badrinarayanan, V.; Kendall, A.; Cipolla, R. SegNet: A Deep Convolutional Encoder-Decoder Architecture for Image Segmentation. IEEE Trans. Pattern Anal. Mach. Intell. 2017, 39, 2481–2495. [Google Scholar] [CrossRef]
  46. Xie, E.; Wang, W.; Yu, Z.; Anandkumar, A.; Álvarez, J.; Luo, P. SegFormer: Simple and Efficient Design for Semantic Segmentation with Transformers. In Proceedings of the 2021 IEEE/CVF Conference on Computer Vision and Pattern Recognition (CVPR), Nashville, TN, USA, 19–25 June 2021; pp. 5688–5697. [Google Scholar]
  47. Zhao, H.; Shi, J.; Qi, X.; Wang, X.; Jia, J. Pyramid Scene Parsing Network. In Proceedings of the 2017 IEEE Conference on Computer Vision and Pattern Recognition (CVPR), Honolulu, HI, USA, 21–26 July 2017; pp. 6230–6239. [Google Scholar]
Figure 1. Geographical location of the Hualong Town and its high-resolution remote sensing image. The top–left corner shows the geographical location of Guangzhou within Guangdong Province, while the bottom–left corner indicates the location of Hualong Town within Guangzhou. The image on the right depicts a high-resolution remote sensing image of Hualong Town.
Applsci 15 03735 g001
Figure 3. Images of objects similar to shade houses. (1) Objects resembling shade houses in everyday scenes; (2) objects resembling shade houses from a remote sensing perspective.
Applsci 15 03735 g003
Figure 4. Sample images from the dataset. (a) Field photographs of shade houses; (b) remote sensing images of shade houses; (c) corresponding label masks of the remote sensing images in (b).
Applsci 15 03735 g004
Figure 5. The construction process of the shade house semantic segmentation dataset. In detail, the first step is to collect remote sensing images and then crop them into image patches. The third step involves visual interpretation and labeling using SAM-Tool. Finally, the labeled results are saved in both JSON and mask formats.
Applsci 15 03735 g005
Figure 6. Overall network architecture. (a) Overall network framework; (b) structure of the Transformer Decoder; (c) structure of the GCLSA-Swin Transformer.
Applsci 15 03735 g006
Figure 7. The structure of the Swin Transformer. The H, W, and C represent the height, width, and number of channels of the feature map at each stage, respectively. In Stage 1, H/4 × W/4 × 48 indicates that the input image is divided into 4×4 patches, with each patch containing 48 features. As the network progresses, H and W decrease with Patch Merging, while C increases to capture more complex features. Stage 1 represents the first feature extraction stage, with Stage 2, Stage 3, and Stage 4 following a similar pattern, representing different levels of feature extraction. ×2 and ×18 denote the number of Swin Transformer blocks in each stage, with x2 indicating two blocks in Stage 1 and ×18 indicating 18 blocks in Stage 3, following a similar pattern for the other stages. In Stage 2, the feature map size is H/8 × W/8 × 2C, in Stage 3 H/16 × W/16 × 4C, and in Stage 4 H/32 × W/32 × 8C.
Applsci 15 03735 g007
Figure 8. Two successive Swin Transformer blocks. MLP represents multilayer perceptron. LN represents layer normalization. W-MSA represents window multi-head self-attention. SW-MSA represents shifted window multi-head self-attention. A Swin Transformer block consists of either a W-MSA module or a SW-MSA module, followed by a two-layer MLP with GELU nonlinearity in between. A LayerNorm (LN) layer is applied before each MSA module and each MLP, and a residual connection is applied after each module.
Applsci 15 03735 g008
Figure 9. The structure of the GCLSA module.
Applsci 15 03735 g009
Figure 11. Visualization of results for the ablation experiment. Each column (ag) represents a different scene, and each row represents a different model: (a) roads and shade houses in complex backgrounds; (b) shade houses and dark-colored water bodies; (c) shade houses and dark-colored vegetation; (d) shade houses and similar objects (e.g., black roofs and shade nets); (e) shade houses and dark lands, black plastic films; (f) high-density distribution of shade houses and warehouses; (g) shade houses in complex shadowed scenes.
Applsci 15 03735 g011
Figure 12. Precision comparison of various network models. The horizontal axis represents different network models, and the vertical axis represents the mean Intersection over Union (mIoU) values in percentage.
Applsci 15 03735 g012
Figure 13. Visualization of results from different models. Each column (ag) represents a different scene, and each row represents a different model: (a) roads and shade houses in complex backgrounds; (b) shade houses and dark-colored water bodies; (c) shade houses and dark-colored vegetation; (d) shade houses and similar objects (e.g., black roofs and shade nets); (e) shade houses and dark lands, black plastic films; (f) high-density distribution of shade houses and warehouses; (g) shade houses in complex shadowed scenes.
Applsci 15 03735 g013
Figure 14. Exemplary diagrams of shade house boundary and self-shadow confusion zones (cases (a,b)).
Applsci 15 03735 g014
Table 1. Binary confusion matrix.
Confusion MatrixPredict
TrueFalse
RealTrueTP (True position)FN (False negative)
FalseFP (False positive)TN (True negative)
Table 3. The mIoU results of various models.
ModelmIOU (%)
PSPNet85.05
SegNet86.17
U-Net87.16
DeepLabV3+87.97
HRNet88.14
SegFormer89.67
ShadeNet (our)92.42
Disclaimer/Publisher’s Note: The statements, opinions and data contained in all publications are solely those of the individual author(s) and contributor(s) and not of MDPI and/or the editor(s). MDPI and/or the editor(s) disclaim responsibility for any injury to people or property resulting from any ideas, methods, instructions or products referred to in the content.

