Article

A Study into the Effects of Chosen Lactic Acid Bacteria Cultures on the Quality Characteristics of Fermented Dairy, Dairy–Oat, and Oat Beverages

1
Department of Food Technology and Assessment, Institute of Food Science, Warsaw University of Life Sciences—SGGW (WULS–SGGW), Nowoursynowska 159c St., 02-776 Warsaw, Poland
2
Professor E. Pijanowski Catering School Complex in Warsaw, 04-110 Warsaw, Poland
*
Author to whom correspondence should be addressed.
Appl. Sci. 2025, 15(7), 3714; https://doi.org/10.3390/app15073714
Submission received: 25 February 2025 / Revised: 18 March 2025 / Accepted: 25 March 2025 / Published: 28 March 2025

Abstract

:
The growing demand for plant-based and hybrid dairy–plant beverages has driven interest in optimizing their fermentation processes. This study investigates the effects of selected lactic acid bacteria (LAB) cultures on the quality characteristics of fermented dairy, dairy–oat, and oat beverages. The term ‘dairy-oat beverage’ refers to a hybrid product composed of cow’s milk and an oat-based drink in a 1:1 ratio. Cow’s milk, an oat beverage, and a 1:1 mixture of both were inoculated with traditional yogurt cultures (Streptococcus thermophilus and Lactobacillus delbrueckii subsp. bulgaricus) and/or probiotic strains (Lactiplantibacillus plantarum 299v and Lactobacillus acidophilus La-5). Fermentation was conducted for 6 h at 37 °C, followed by 28 days of cold storage. pH, texture (hardness and adhesiveness), syneresis, carbohydrate content, and bacterial viability were assessed. The selection of lactic acid bacteria cultures had a significant impact on the quality attributes of the beverages. Both the bacterial culture type and the base material played a crucial role in determining the beverages’ texture, stability, and overall quality. Mixed bacterial cultures exhibited higher hardness, while milk and dairy–oat samples fermented with the yogurt culture demonstrated better structural stability. Fermentation influenced sugar levels, and bacterial viability depended on the beverage type and storage conditions. The selection of lactic acid bacteria cultures significantly impacts the quality of fermented beverages. Further optimization of bacterial culture combinations could improve these products’ stability and sensory properties.

1. Introduction

Contemporary society is experiencing dynamic shifts in dietary preferences and lifestyles, leading to a growing interest in alternative forms of nutrition [1,2]. One significant trend gaining popularity is the plant-based diet, characterized by exclusive or predominantly plant-based consumption. One of the primary drivers of this increased popularity is the response to society’s diverse dietary needs and preferences. Many individuals grapple with lactose intolerance or milk protein allergies, while others increasingly adopt plant-based diets for ethical and environmental considerations. In addressing the growing interest in plant-based diets and consumer expectations, the food industry offers an expanding array of plant-based beverages, such as yogurts [3]. By utilizing diverse raw materials, manufacturers can produce products with appealing flavors and textures, as well as beneficial health properties [4]. Although fermented dairy and plant-based beverages have been extensively studied, previous research has primarily focused on their basic production and probiotic potential. However, limited studies have systematically compared the effects of different lactic acid bacteria cultures on both dairy and plant-based matrices, particularly in terms of texture, syneresis, and bacterial viability during storage. Additionally, the long-term stability and structural properties of mixed dairy–plant beverages remain underexplored. In this context, the fermentation of plant-based beverages is emerging as a fascinating area of research, bridging tradition with modern technologies [5,6].
In the food industry, fermented beverages constitute a significant product category, as they are valued for their sensory attributes and potential health benefits [7,8]. Traditionally, lactic acid fermentation is widely employed in the production of dairy beverages, such as yogurts and kefirs, where lactic acid bacteria (LAB) play a pivotal role in converting lactose to lactic acid, thereby influencing the product’s texture, flavor, and shelf life. Despite the growing popularity of fermented plant-based beverages, significant challenges remain regarding their fermentation efficiency and stability. Unlike dairy matrices, plant-based substrates often lack essential nutrients that support bacterial growth and fermentation, leading to variations in texture, acidity, and probiotic viability. The effect of specific lactic acid bacteria strains on these properties, particularly in mixed dairy–plant beverages, has not been thoroughly investigated. Both the growing interest in plant-based diets and the search for alternatives to dairy products have contributed to the development of plant-based fermented beverages, including oat-based beverages. The fermentation of plant-based beverages, such as those made from nuts, cereal seeds, or legumes, offers an alternative for individuals seeking flavor diversity and the health and functional benefits associated with this process [5,9].
Plant-based beverages with probiotic properties represent an interesting alternative to dairy products; however, their refinement requires further research. Blending raw materials allows for the creation of products with interesting flavors and textures. Meanwhile, oat-based products are particularly recommended for individuals suffering from diabetes and hypertension [10]. Oats are fiber-rich, positively affecting digestive health and lowering cholesterol levels. They are also a source of beta-glucans, which have immunomodulatory effects. Combining milk and oats can increase the nutritional value of the beverage, namely combining the protein and calcium from milk with the fiber and other nutrients from oats [11]. Studies indicate the possibility of enriching milk–oat beverages with cultures of potentially probiotic lactic acid bacteria strains [12,13]. Using probiotics for fermentation can improve the digestibility of beverages by breaking down complex carbohydrates and proteins into simpler compounds. Furthermore, fermentation imparts a characteristic flavor and aroma, which can increase the product’s attractiveness to consumers.
Unlike previous studies that primarily focused on traditional dairy fermentation, this study explores the application of lactic acid bacteria cultures not only in dairy but also in dairy–oat and oat-based matrices. In this study, we use the term ‘dairy-oat beverage’ to describe a hybrid beverage composed of cow’s milk and an oat-based drink in equal proportions. This terminology was chosen to avoid confusion with ‘oat milk’, which refers exclusively to plant-based beverages. To the best of our knowledge, no widely available commercial product combines dairy and oat bases in a single beverage. However, interest in such hybrid products is growing, particularly in the dairy industry, where they are being explored as potential fermented dessert-like beverages. By evaluating key quality parameters such as pH, texture, syneresis, sugar metabolism, and bacterial viability over storage time, this research provides novel insights into the role of specific bacterial strains in optimizing the stability and sensory properties of fermented beverages. This approach contributes to a better understanding of how different bacterial cultures interact with diverse substrates, paving the way for improved formulations of plant-based and hybrid dairy–plant beverages. The research hypothesis posited that the selection of specific lactic acid bacteria cultures would influence multiple quality parameters of fermented dairy, dairy–oat, and oat beverages, including pH, texture, syneresis, and bacterial viability.

2. Materials and Methods

2.1. Materials

For the experiment, “Łaciate” 2% fat milk (Mlekpol Dairy Cooperative, Grajewo, Poland) and the organic oat beverage “Bio Avoine” (Auchan Polska Sp. z o.o., Warsaw, Poland) were used as raw materials (Table 1). These were mixed in a 1:1 ratio to create the dairy–oat beverage, a novel hybrid product combining dairy and plant-based components. The starter culture for the yogurt, YC-X16 (Chr. Hansen, Hoersholm, Denmark), containing Streptococcus thermophilus and Lactobacillus delbrueckii subsp. bulgaricus, was used for this study. The experiment used two monocultures of probiotic lactic acid bacteria: Lactiplantibacillus plantarum 299v (DSM 9843) and Lactobacillus acidophilus La-5 (Chr. Hansen, Hoersholm, Denmark). L. plantarum is a well-studied and well-documented reservoir of probiotic strains, as evidenced by over 200 scientific publications. The strain Lactiplantibacillus plantarum 299v has been selected and studied for its beneficial health effects [14]. Lactobacillus acidophilus LA-5 is a thermophilic strain capable of converting lactose into DL-lactic acid. The strain has been used in food production (especially in the dairy industry) and dietary supplements since 1979. It exhibits numerous probiotic properties. The manufacturer states that the strain can be used alone or in combination with other cultures to obtain various products [15].

2.2. Preparation of Fermented Dairy, Dairy–Oat, and Oat Beverages

The preparation of fermented beverages commenced by precisely measuring cow’s milk, a dairy–oat beverage (cow’s milk: oat beverage in a 1:1 ratio), and an oat beverage into clean and sterilized glass jars. The final volume of the liquid in each jar was 120 mL. Subsequently, the samples were inoculated, and the prepared samples were subjected to fermentation. A suspension of a starter culture and/or a pure culture of lactic acid bacteria was inoculated into beverage samples at 0.05 mL per 120 mL of the specific beverage. The proportions for variants B and E (Table 1) were 1:1. The fermentation process lasted 6 h at 37 °C. After fermentation, the samples were transferred to a refrigerator and stored for 28 days under refrigerated conditions (6 °C ± 0.5). The entire experiment was repeated twice on independent batches of raw materials.

2.3. pH Measurement

The initial pH measurements were conducted during the fermentation process. A fermentation curve was established based on the results obtained at two-hour intervals. Subsequent pH determinations were performed immediately after fermentation and on days 7, 14, 21, and 28 of cold storage of the samples. A CPO-505 pH meter manufactured by Elmetron (Elmetron, Zabrze, Poland) was used for the measurements. Measurements were performed in two independent replicates. The results are presented with an accuracy of two decimal places.

2.4. Texture Analysis: Hardness and Adhesiveness

The hardness and adhesiveness of fermented beverages were evaluated after 0, 7, 14, 21, and 28 days of refrigerated storage. This analysis involved immersing a probe of specific dimensions into the fermented beverage. A Brookfield CT3 10K texture analyzer (AMETEK Brookfield, Middleboro, MA, USA) equipped with a TA4/1000 cylindrical probe (diameter: 38.1 mm; height: 20 mm) was employed for the rheological property assessment. The applied compressive and tensile forces induced a displacement of the sample volume, disrupting its structure, which allowed for the determination of hardness. Hardness is defined as the force required to deform the sample. Adhesiveness, on the other hand, refers to the force necessary to separate the probe from the analyzed sample. Samples were removed from refrigeration conditions (6 °C) and subjected to the probe’s compressive force. The force applied during the tests was 0.04 N. The probe moved towards the sample at a speed of 2 mm/s and in the opposite direction at 4.5 mm/s. Ten measurements were taken per second. The probe penetrated 25 mm into the sample at a speed of 1 mm/s from the beginning of the measurement. For each type of fermented beverage, a single measurement cycle was performed. The results were graphically processed using the TexturePro CT V1.4 Build 17 software (AMETEK Brookfield) included in the measurement system. Measurements were conducted twice, and the results were recorded to two decimal places.

2.5. Syneresis Testing

Syneresis is a process involving the contraction of a clot, resulting in the release of fluid or whey. This phenomenon is perceived negatively by consumers, which is why producers add stabilizers to prevent it. Syneresis measurements were taken after 0, 7, 14, 21, and 28 days of refrigerated storage of the samples. Sample preparation involved weighing 40 g of fermented beverages into falcon tubes for centrifugation. The laboratory centrifuge MPRW MPW-350R (MPW Med. Instruments Spółdzielnia Pracy, Warsaw, Poland) was set to a speed of 12,300× g, a temperature of 4 °C, and a running time of 20 min. After centrifugation, the resulting supernatant was decanted from the sediment and weighed. The measurement result was calculated as the ratio of the supernatant mass to the total mass of the sample before centrifugation, according to Formula (1):
s y n e r e s i s   [ % ] = s u p e r n a t a n t   m a s s   [ g ] m a s s   o f   t h e   s a m p l e   b e f o r e   c e n t r i f u g a t i o n   [ g ] ,
Measurements were performed in two independent replicates. The results are presented with an accuracy of one decimal place.

2.6. Determination of Selected Carbohydrate Content

The quantity of selected carbohydrates was analyzed after 0, 7, 14, 21, and 28 days of storage of samples under refrigerated conditions. For this purpose, the high-performance liquid chromatography (HPLC) method coupled with a refractive index (RI) detector was used. The preparation for the determination consisted of extraction, HPLC analysis, and data integration.
Firstly, falcon tubes were filled with 32 g of the fermented beverages being analyzed; then, 16 g of methanol was added. After capping and thorough mixing, the tubes were placed in an ultrasonic water bath (previously set to 30 °C) for 30 min. After completion, the tubes were transferred to a laboratory centrifuge (MPRW MPW-350R) set to 4 °C and 12,000× g. Subsequently, the obtained supernatant, a clear liquid above the sediment, was filtered using a syringe filter (Merck, Darmstadt, Germany; pore size 0.4 µm) into glass chromatographic vials. The vials were stored in a freezer (−24 °C) until chromatographic analysis.
HPLC analysis was performed using a system consisting of the following: the DeltaChromTM Pump (Sykam, Eresing, Germany); S 6020 Needle Injection Valve; DeltaChromTM Temperature Control Unit (Sykam); S3580 RI Detector (Sykam); 05394-81 Cosmosil Guard Column Sugar-D 4, 6 IDx10 mm pre-column; and 05397-51 Cosmosill Sugar-D 4,6 IDx250 mm chromatographic column (Nacalai USA, Inc., San Diego, CA, USA). The HPLC analysis parameters were as follows: flow rate: 1 cm3/min; column temperature: 30 °C; RI detector settings: range 10,000 mV; and sample rate: 2 Hz. The mobile phase for the HPLC analysis was a mixture of acetonitrile (HPLC grade) and deionized water in a weight ratio of 80:20. The sample solution was taken using a microsyringe from the chromatographic vial and manually introduced into the injector feed (with a 20 µL loop) of the HPLC system. The analysis duration of the samples was 30 min. After performing the analysis, the obtained peaks were identified by comparing the retention times with the retention times of standards of selected carbohydrates (1% aqueous solutions, e.g., fructose, glucose, galactose, lactose, sucrose, raffinose, stachyose, and verbascose) analyzed in the same way as the actual samples. The proportion of selected carbohydrates in the beverage samples was calculated based on the peak area of the analyzed sugar, considering the initial sample’s dilution factor. The final result regarding the content of selected carbohydrates in the beverage samples is given as a percentage with an accuracy of two decimal places. Measurements were conducted twice, and the results were recorded to one decimal place.

2.7. Enumeration of Starter Culture Populations

The enumeration of starter culture populations was carried out at days 0, 7, 14, 21, and 28 of refrigerated storage. Plate counts were performed on the following media: M17 agar (BioMaxima, Lublin, Poland) for the enumeration of streptococci, MRS agar (Merck, Darmstadt, Germany) for the enumeration of lactobacilli, and MRS CC agar (prepared according to Süle et al., [16]) for the enumeration of L. acidophilus La-5 in milk and dairy products. All three media were prepared according to the manufacturer’s instructions. Prepared media were sterilized in an autoclave at 121 °C for 15 min. Before performing microbiological inoculations, ten-fold dilutions of the tested fermented beverage samples were prepared in sterile Ringer’s solution (Merck, Darmstadt, Germany). Petri dishes with MRS agar for the total number of lactobacilli and MRS CC agar for the number of L. acidophilus La-5 cells were placed in an Anaerojar (Merck, Darmstadt, Germany), where appropriate anaerobic conditions were provided by Anaerocult sachets (Merck, Darmstadt, Germany). All Petri dishes were incubated at 37 °C for 7 days. After this time, the number of colonies grown was counted. Then, the decimal algorithm was used to calculate the number of colony-forming units per gram of the original fermented beverage sample (CFU/g). The final result, obtained from the average of two replicates, was recorded to one decimal place.

2.8. Statistical Analysis

Statistical analysis of the obtained research results was conducted using the Statistica 13.3 (StatSoft, Kraków, Poland) software with a significance level of α = 0.05. A two-way analysis of variance was employed to assess the influence of fermentation time and sample variant on the examined qualitative characteristics. Tukey’s HSD test was used to compare the mean values obtained in individual measurements.

3. Results

3.1. Fermentation Curve

In the case of fermented samples with the yogurt culture, a monoculture of L. plantarum 299v, and their mixture (Figure 1a), all samples had an initial pH of 6.5–7.0. Within the first 2 h, there was a rapid decrease in pH, suggesting intensive lactic acid production by the bacteria. After 4 h of fermentation, most samples’ pH stabilized at 4.0–4.5. It is worth noting that the milk and dairy–oat samples showed a more remarkable ability to lower pH than oat samples, suggesting milk’s beneficial properties for fermentation. The lowest pH values were observed in samples supplemented with L. plantarum 299v, indicating the strong fermentative activity of these bacteria in milk. The research hypothesis was confirmed, as the choice of lactic acid bacteria cultures significantly influenced various quality characteristics of the beverages, including pH reduction, textural properties, and bacterial viability, depending on the base material and storage conditions. Nevertheless, L. plantarum 299v exhibited strong fermentative activity, which may positively impact the quality of fermented beverages.
In the case of samples fermented with the yogurt culture, a monoculture of L. acidophilus La-5, and their mixture (Figure 1b), at the beginning of fermentation, all samples also had a pH within the range of 6.5–7.0. After 4 h, the pH value in most samples stabilizes at a level of 4.0–4.5, suggesting the end of the main fermentation phase, especially in samples containing milk. The lowest pH values were achieved in samples where L. acidophilus La-5 was present, suggesting its high acidifying ability. These results also confirmed the research hypothesis; that is, the use of L. acidophilus La-5 significantly impacted the pH of fermented beverages, which is crucial for their quality and shelf life. In this case, the milk and dairy–oat beverages showed more intense fermentation than the oat beverage, suggesting that milk favors the activity of lactic acid bacteria. L. acidophilus La-5 demonstrated high fermentative activity, suggesting that it could be an effective starter culture to improve the quality of fermented beverages.

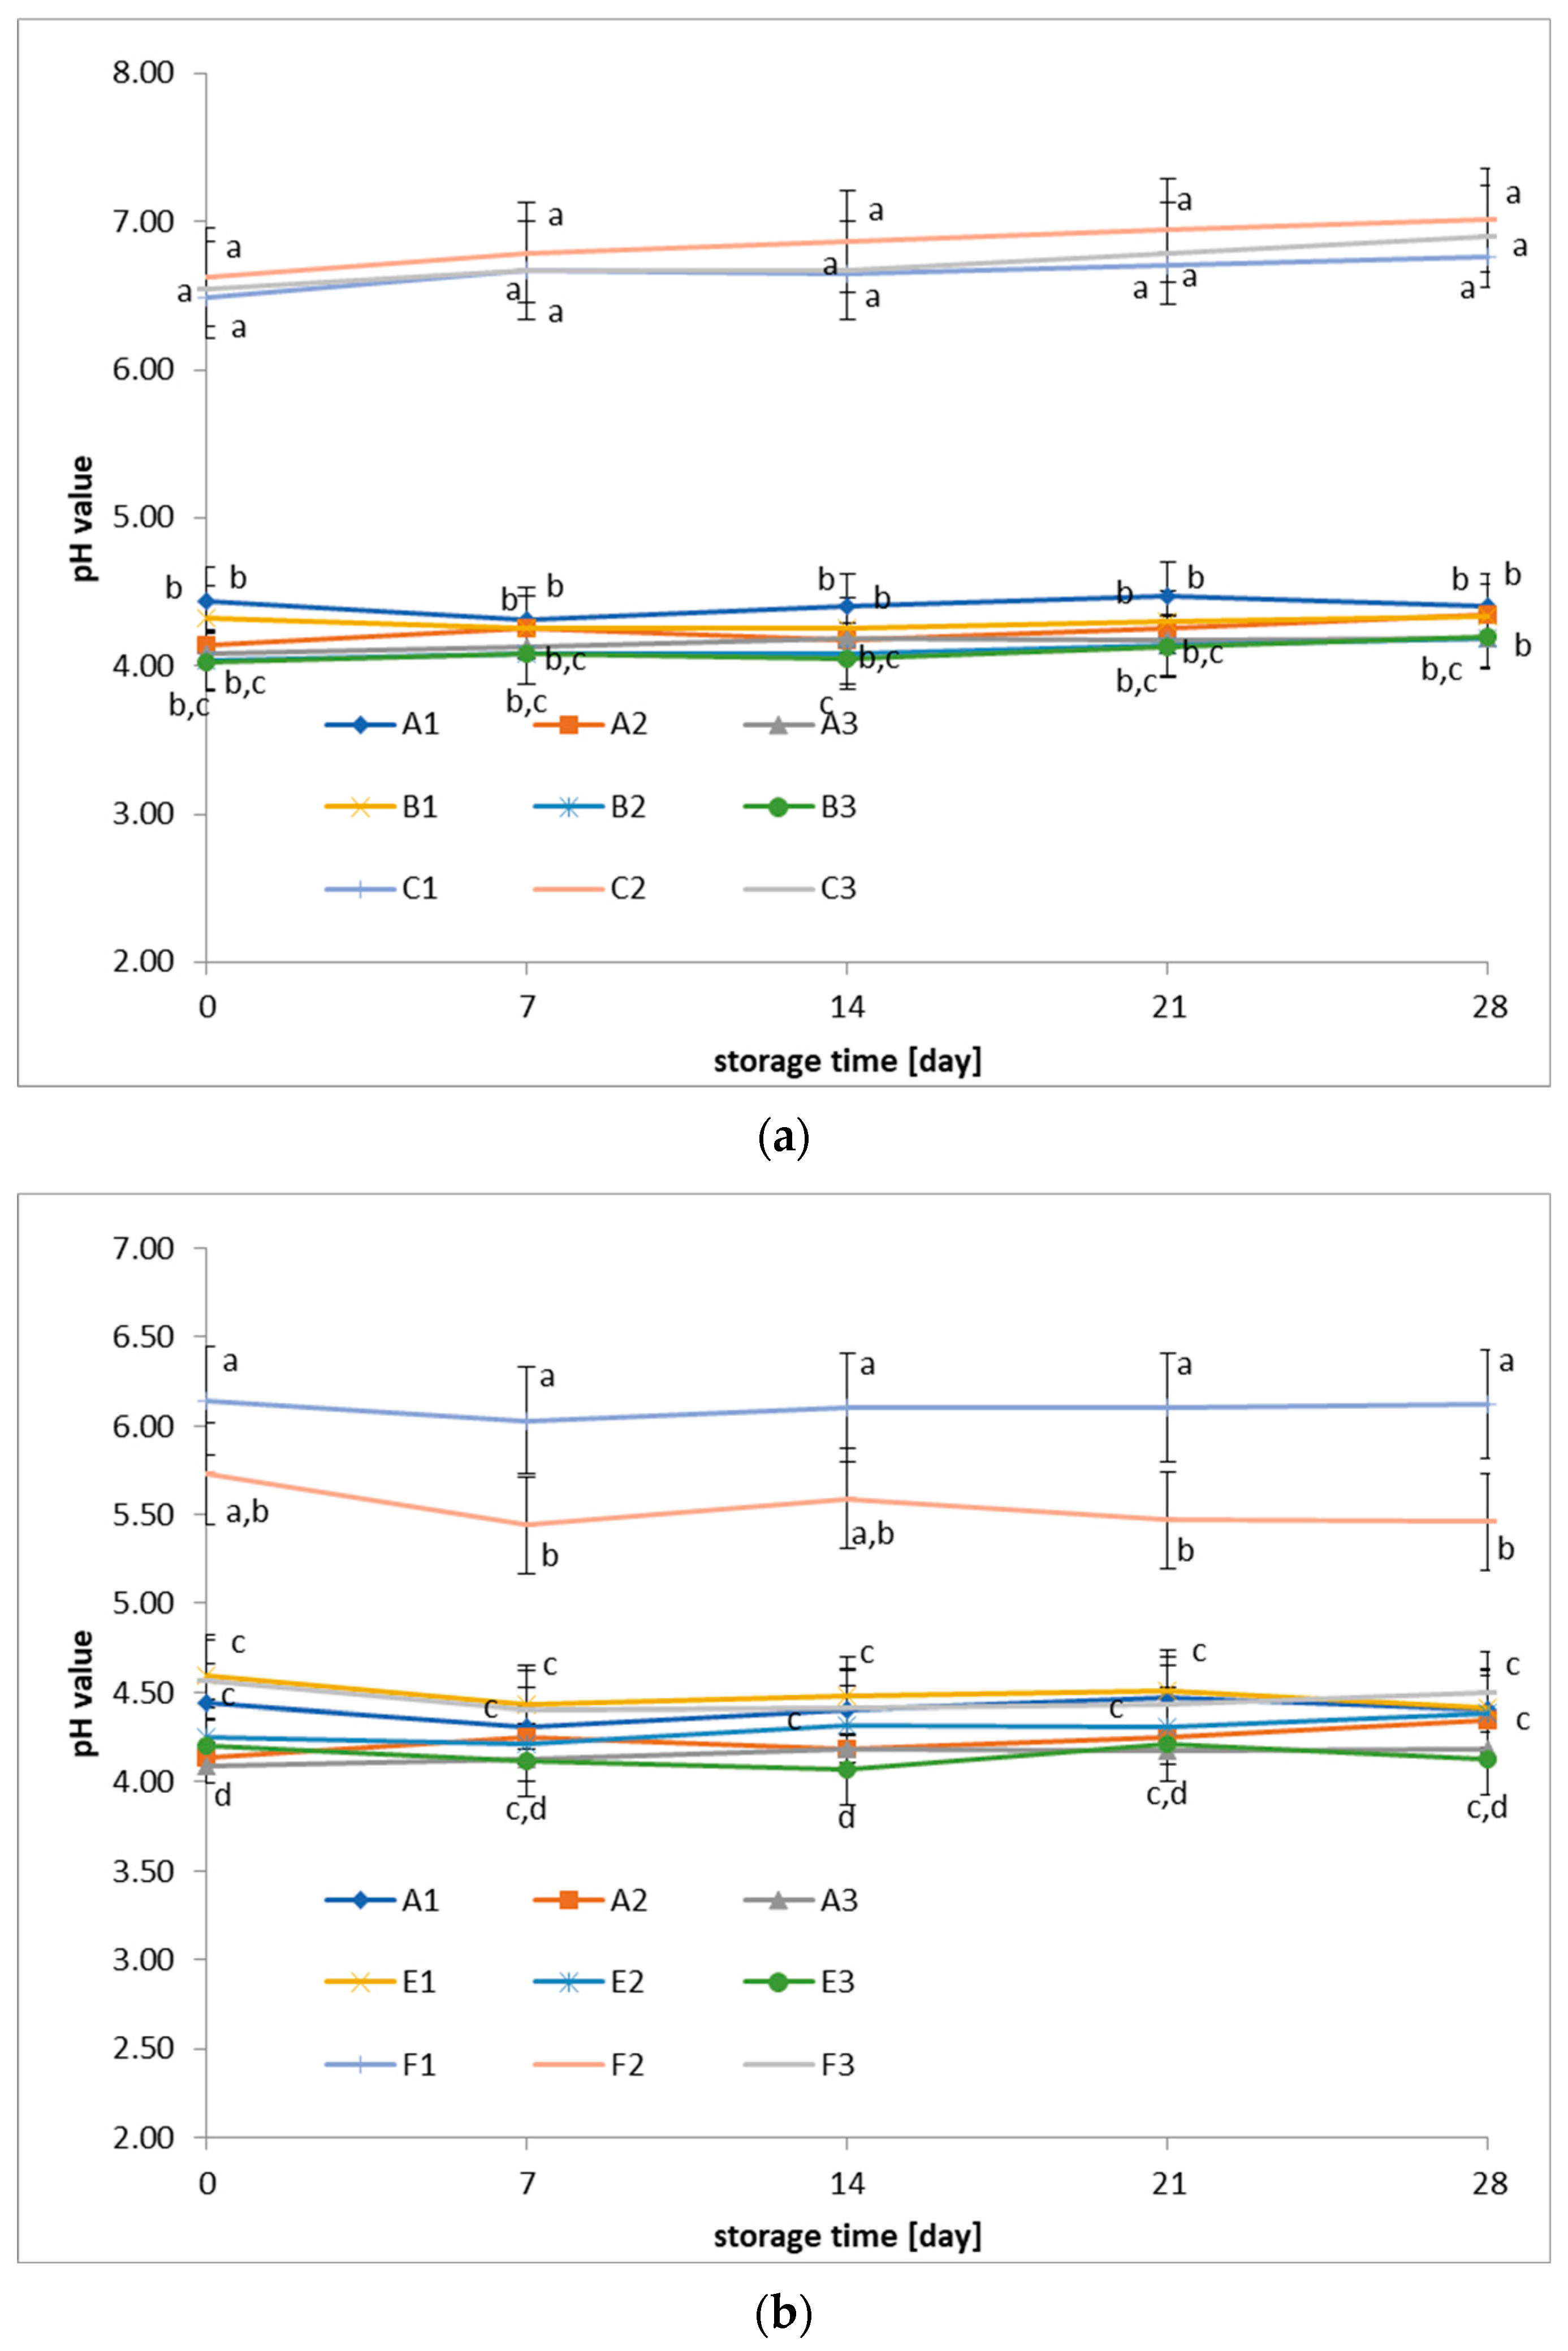
3.2. Changes in pH of Fermented Beverages During Cold Storage

The pH values of samples fermented with L. plantarum 299v remained relatively stable over the 28-day cold storage period (Figure 2a). This pH stability indicates that L. plantarum 299v effectively maintained the acidification of the beverages for 28 days, suggesting good stability of the fermented products. The dairy and dairy–oat beverages (Groups A and B) exhibited more stable pH values, suggesting that fermentation was more effective in these matrices than the oat beverage (Group C). The results confirm the research hypothesis that appropriately selected lactic acid bacteria cultures positively impact the shelf life and quality of fermented beverages.
The pH values of the fermented beverages containing L. acidophilus La-5 remained relatively stable over a 28-day cold storage period. The other groups (A and E) exhibited lower pH values (~4.0–4.5), indicating effective lactic acid bacteria activity and proper fermentation. Group F (oat-based beverages) displayed higher pH values and a smaller decrease in acidity, suggesting less efficient fermentation. This could be attributed to a lack of nutrients supporting the growth of lactic acid bacteria or their limited ability to acidify the oat-based environment. The pH stability in dairy and dairy–oat products indicates their shelf-life and potentially better sensory properties during storage. Dairy and dairy–oat products demonstrated superior fermentation properties compared to oat beverages, confirming the research hypothesis regarding the positive impact of lactic acid bacteria cultures on the quality of fermented beverages. The high pH values in Group F may suggest the need to modify the fermentation process or add supplementary ingredients to support the growth of lactic acid bacteria in plant-based products.

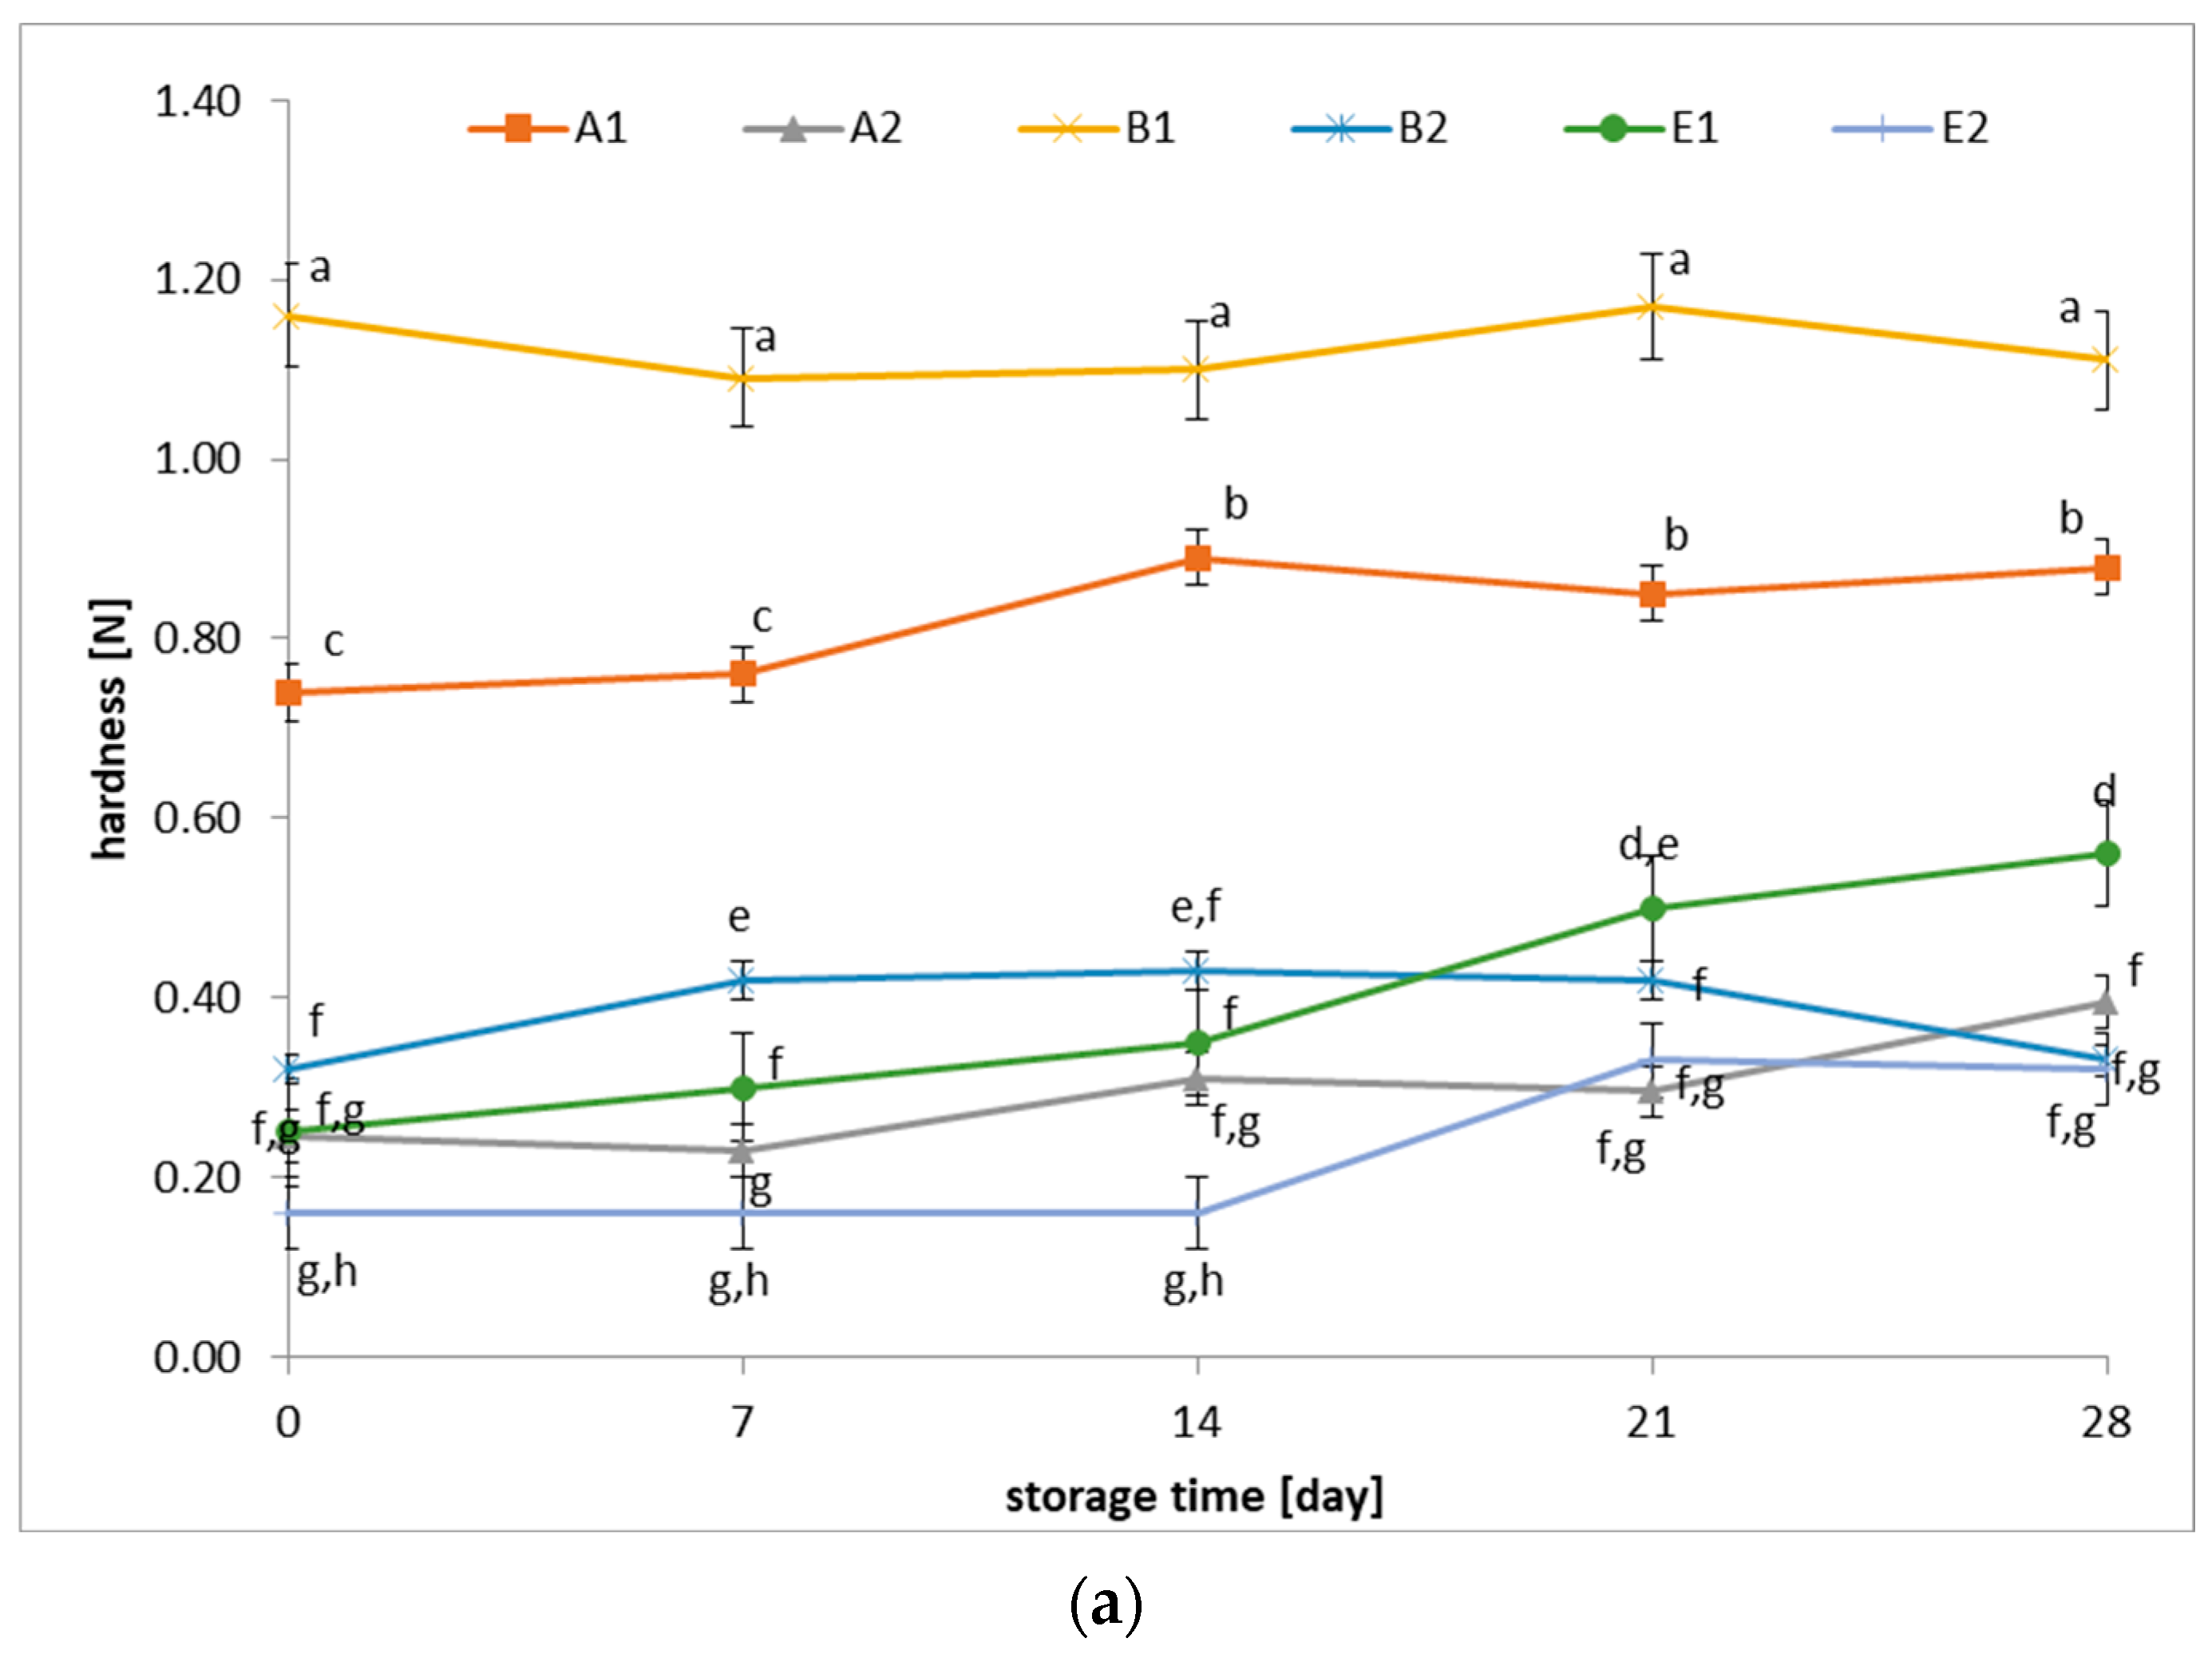
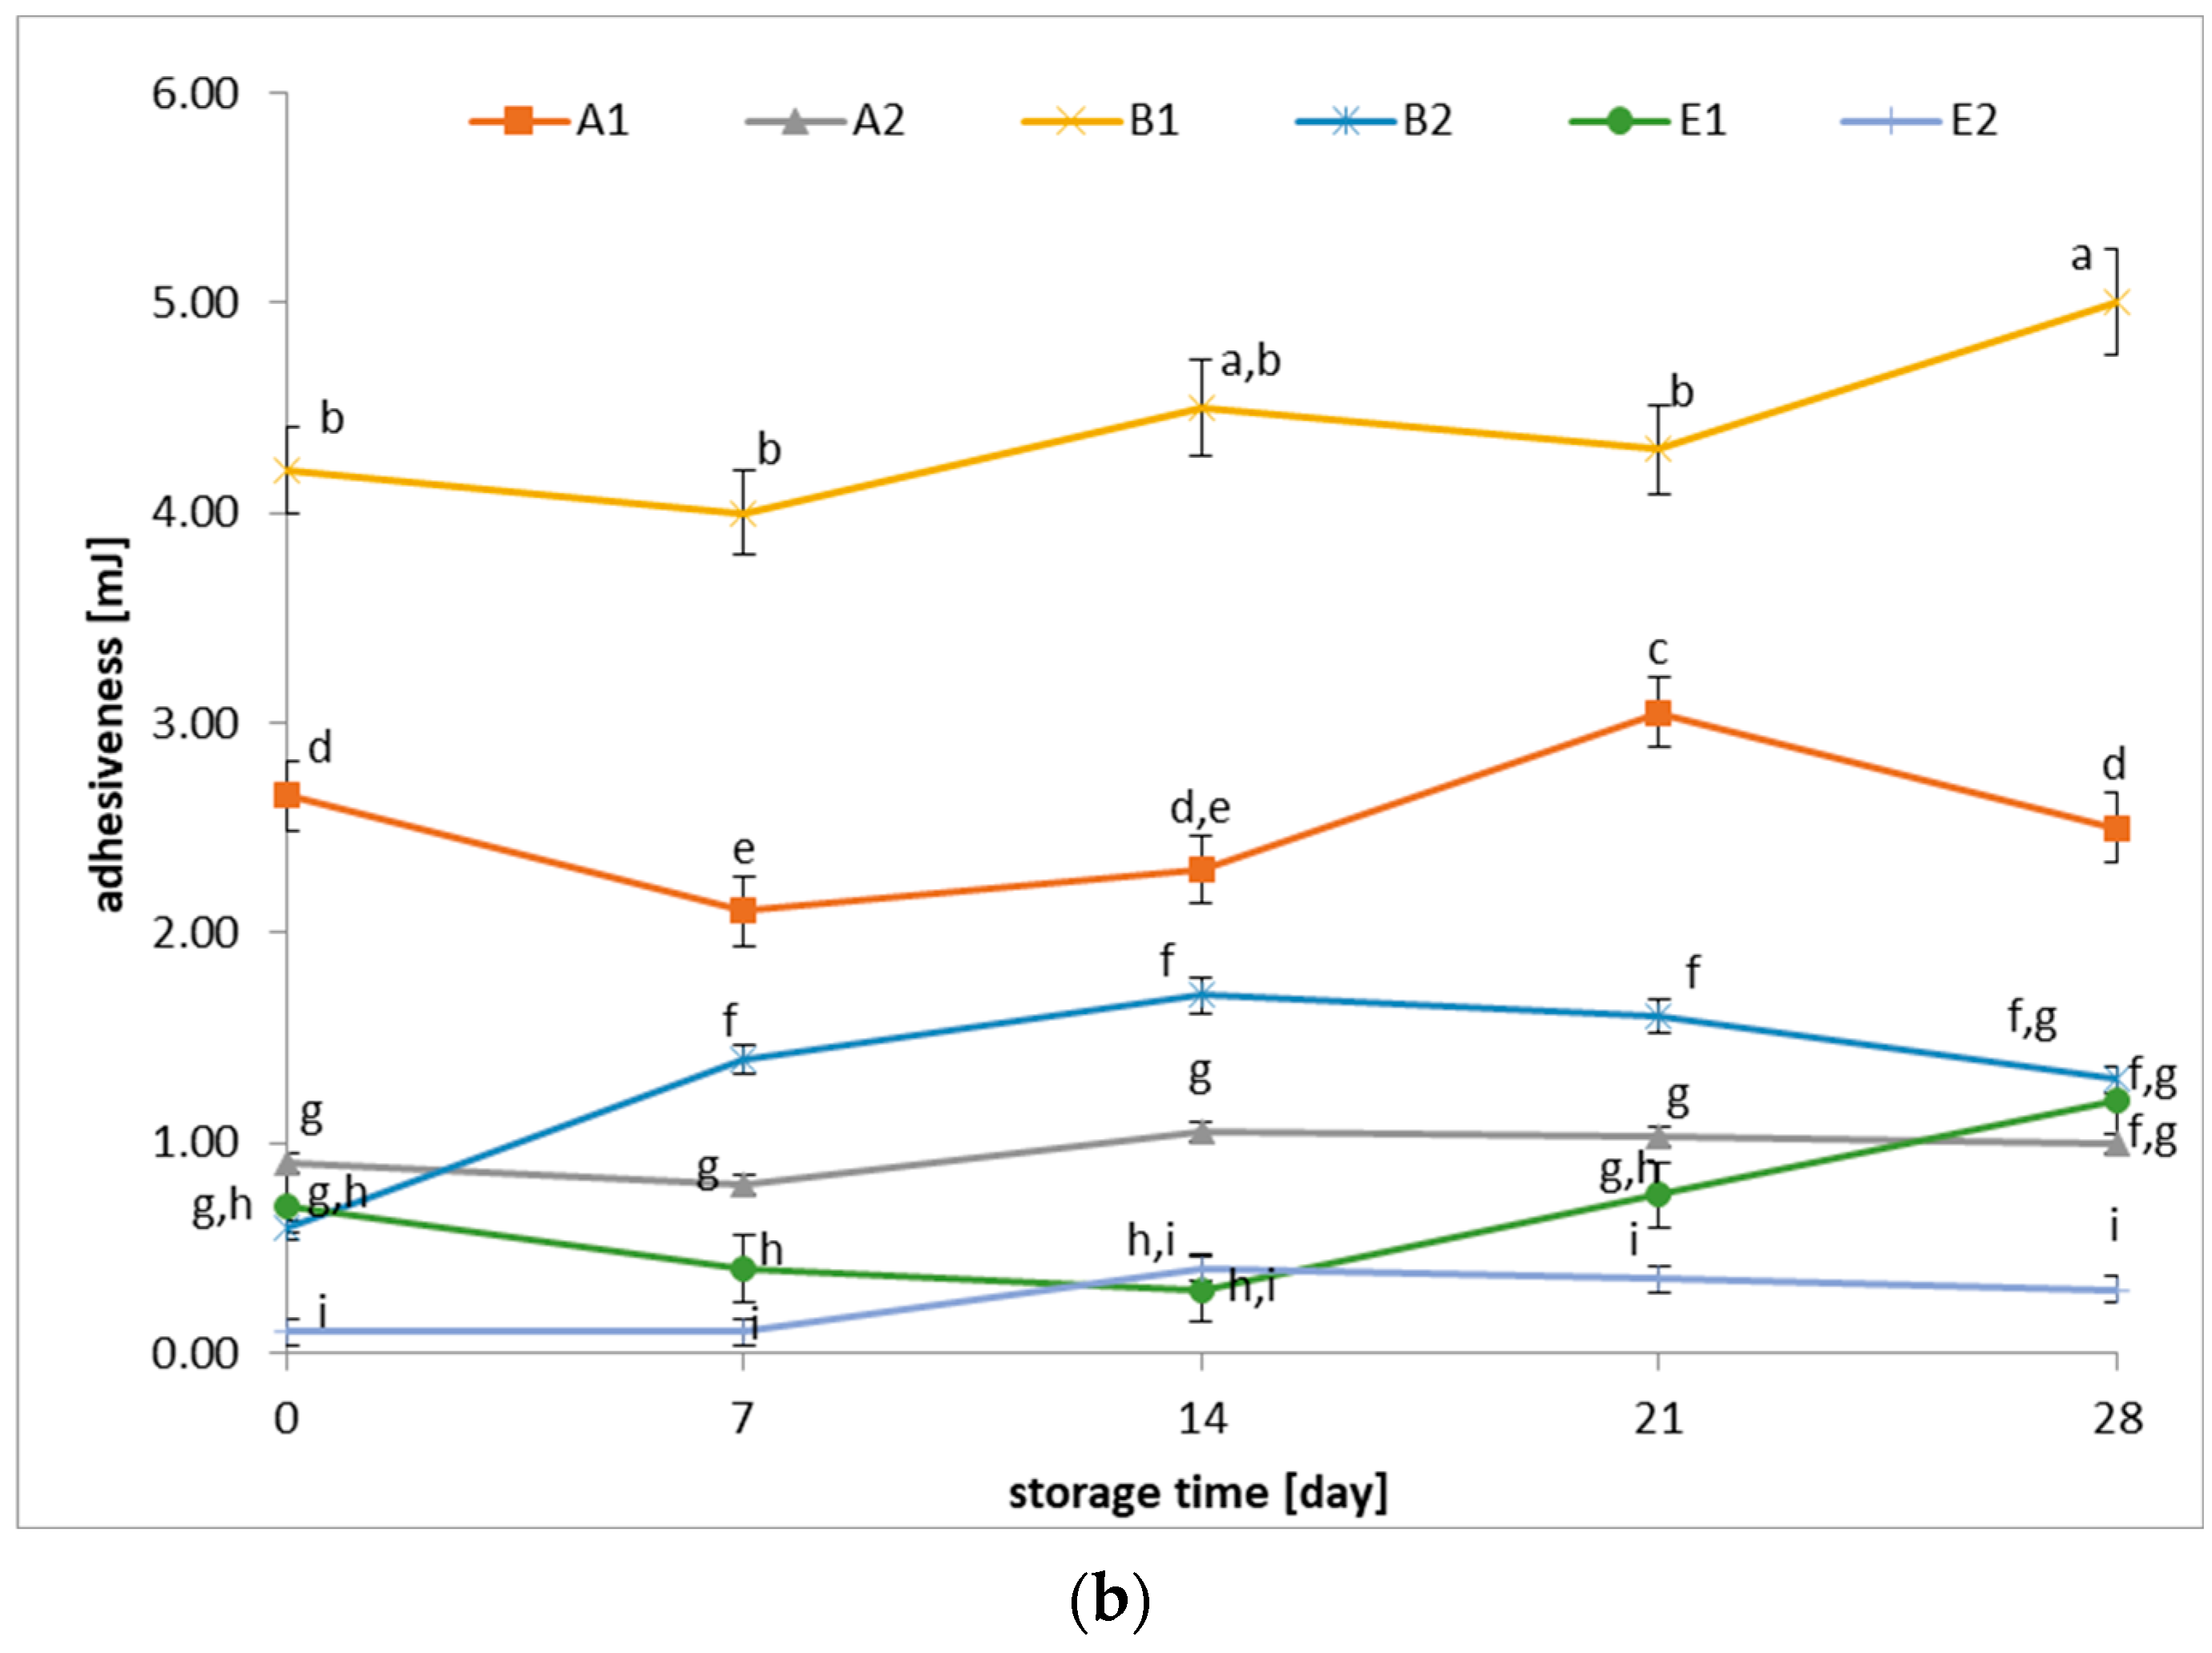
3.3. Changes in Hardness and Adhesiveness of Fermented Beverages

The hardness of fermented beverages varies depending on the type of lactic acid bacteria culture used and the base raw material (dairy, dairy–oat, and oat). Dairy and dairy–oat products exhibit better stability and higher hardness than oat beverages, confirming the research hypothesis of a positive impact of lactic acid bacteria cultures on the quality of fermented beverages. Groups A1 and B1 have the highest hardness values (~1.0–1.2 N) and do not show significant changes during storage (Figure 3a). It is suggested that the bacteria in these samples stabilize the beverage structure and ensure its durability. Group E1 shows a marked increase in hardness over time, reaching ~0.6 N at the end of storage, suggesting a gradual improvement in consistency. Beverages containing mixed cultures (probiotic monocultures and yogurt bacteria) are characterized by higher hardness, suggesting a beneficial effect on consistency. Samples E2, B2, and A2 initially exhibit the lowest hardness values (~0.1–0.3 N), but they gradually increase in the case of E2 and B2. It may indicate that fermentation in these groups was less effective at the beginning, but the structure gradually stabilized during storage.
The adhesiveness of fermented beverages showed significant differences between samples depending on the type of lactic acid bacteria culture used and the raw material (Figure 3b). The most significant viscous changes occurred in the first days of storage, which may indicate dynamic processes of beverage structure maturation. The viscosity values do not show a uniform trend; that is, in some samples, they decrease in the first days of storage and then increase, which may result from the rearrangement processes of the gel structure. Samples B1 and A1 exhibited the highest viscosity throughout the storage period, suggesting these beverages’ more sticky, dense structure. Sample B1 reached the highest viscosity values (~5.0 mJ), suggesting a significant impact of the bacteria used on the beverage’s texture. These values are significantly higher than the remaining samples, which may result from the type of bacteria used or interactions between milk components and fermentation cultures. Sample A1 exhibits stable viscosity values (~2.0–3.0 mJ) during storage, indicating the maintenance of the fermented beverage structure. The increase in viscosity on day 21 suggests additional stabilization processes in the protein gel structure. Samples E2 and A2 exhibit the lowest viscosity values (~0.0–0.5 mJ), suggesting a more fluid consistency and a lack of a distinct gel structure. It may result from a low protein content (oat beverage in ample E2) or weak interactions of bacteria with the substrate. (Milk in sample A2 was poorly fermented by the monoculture and yogurt bacteria.) Samples containing milk and dairy–oat mixtures (especially B1 and A1) exhibit higher viscosity, which means better texture and product stability. Fermentation with selected strains of lactic acid bacteria has a significant impact on texture, which confirms the research hypothesis.

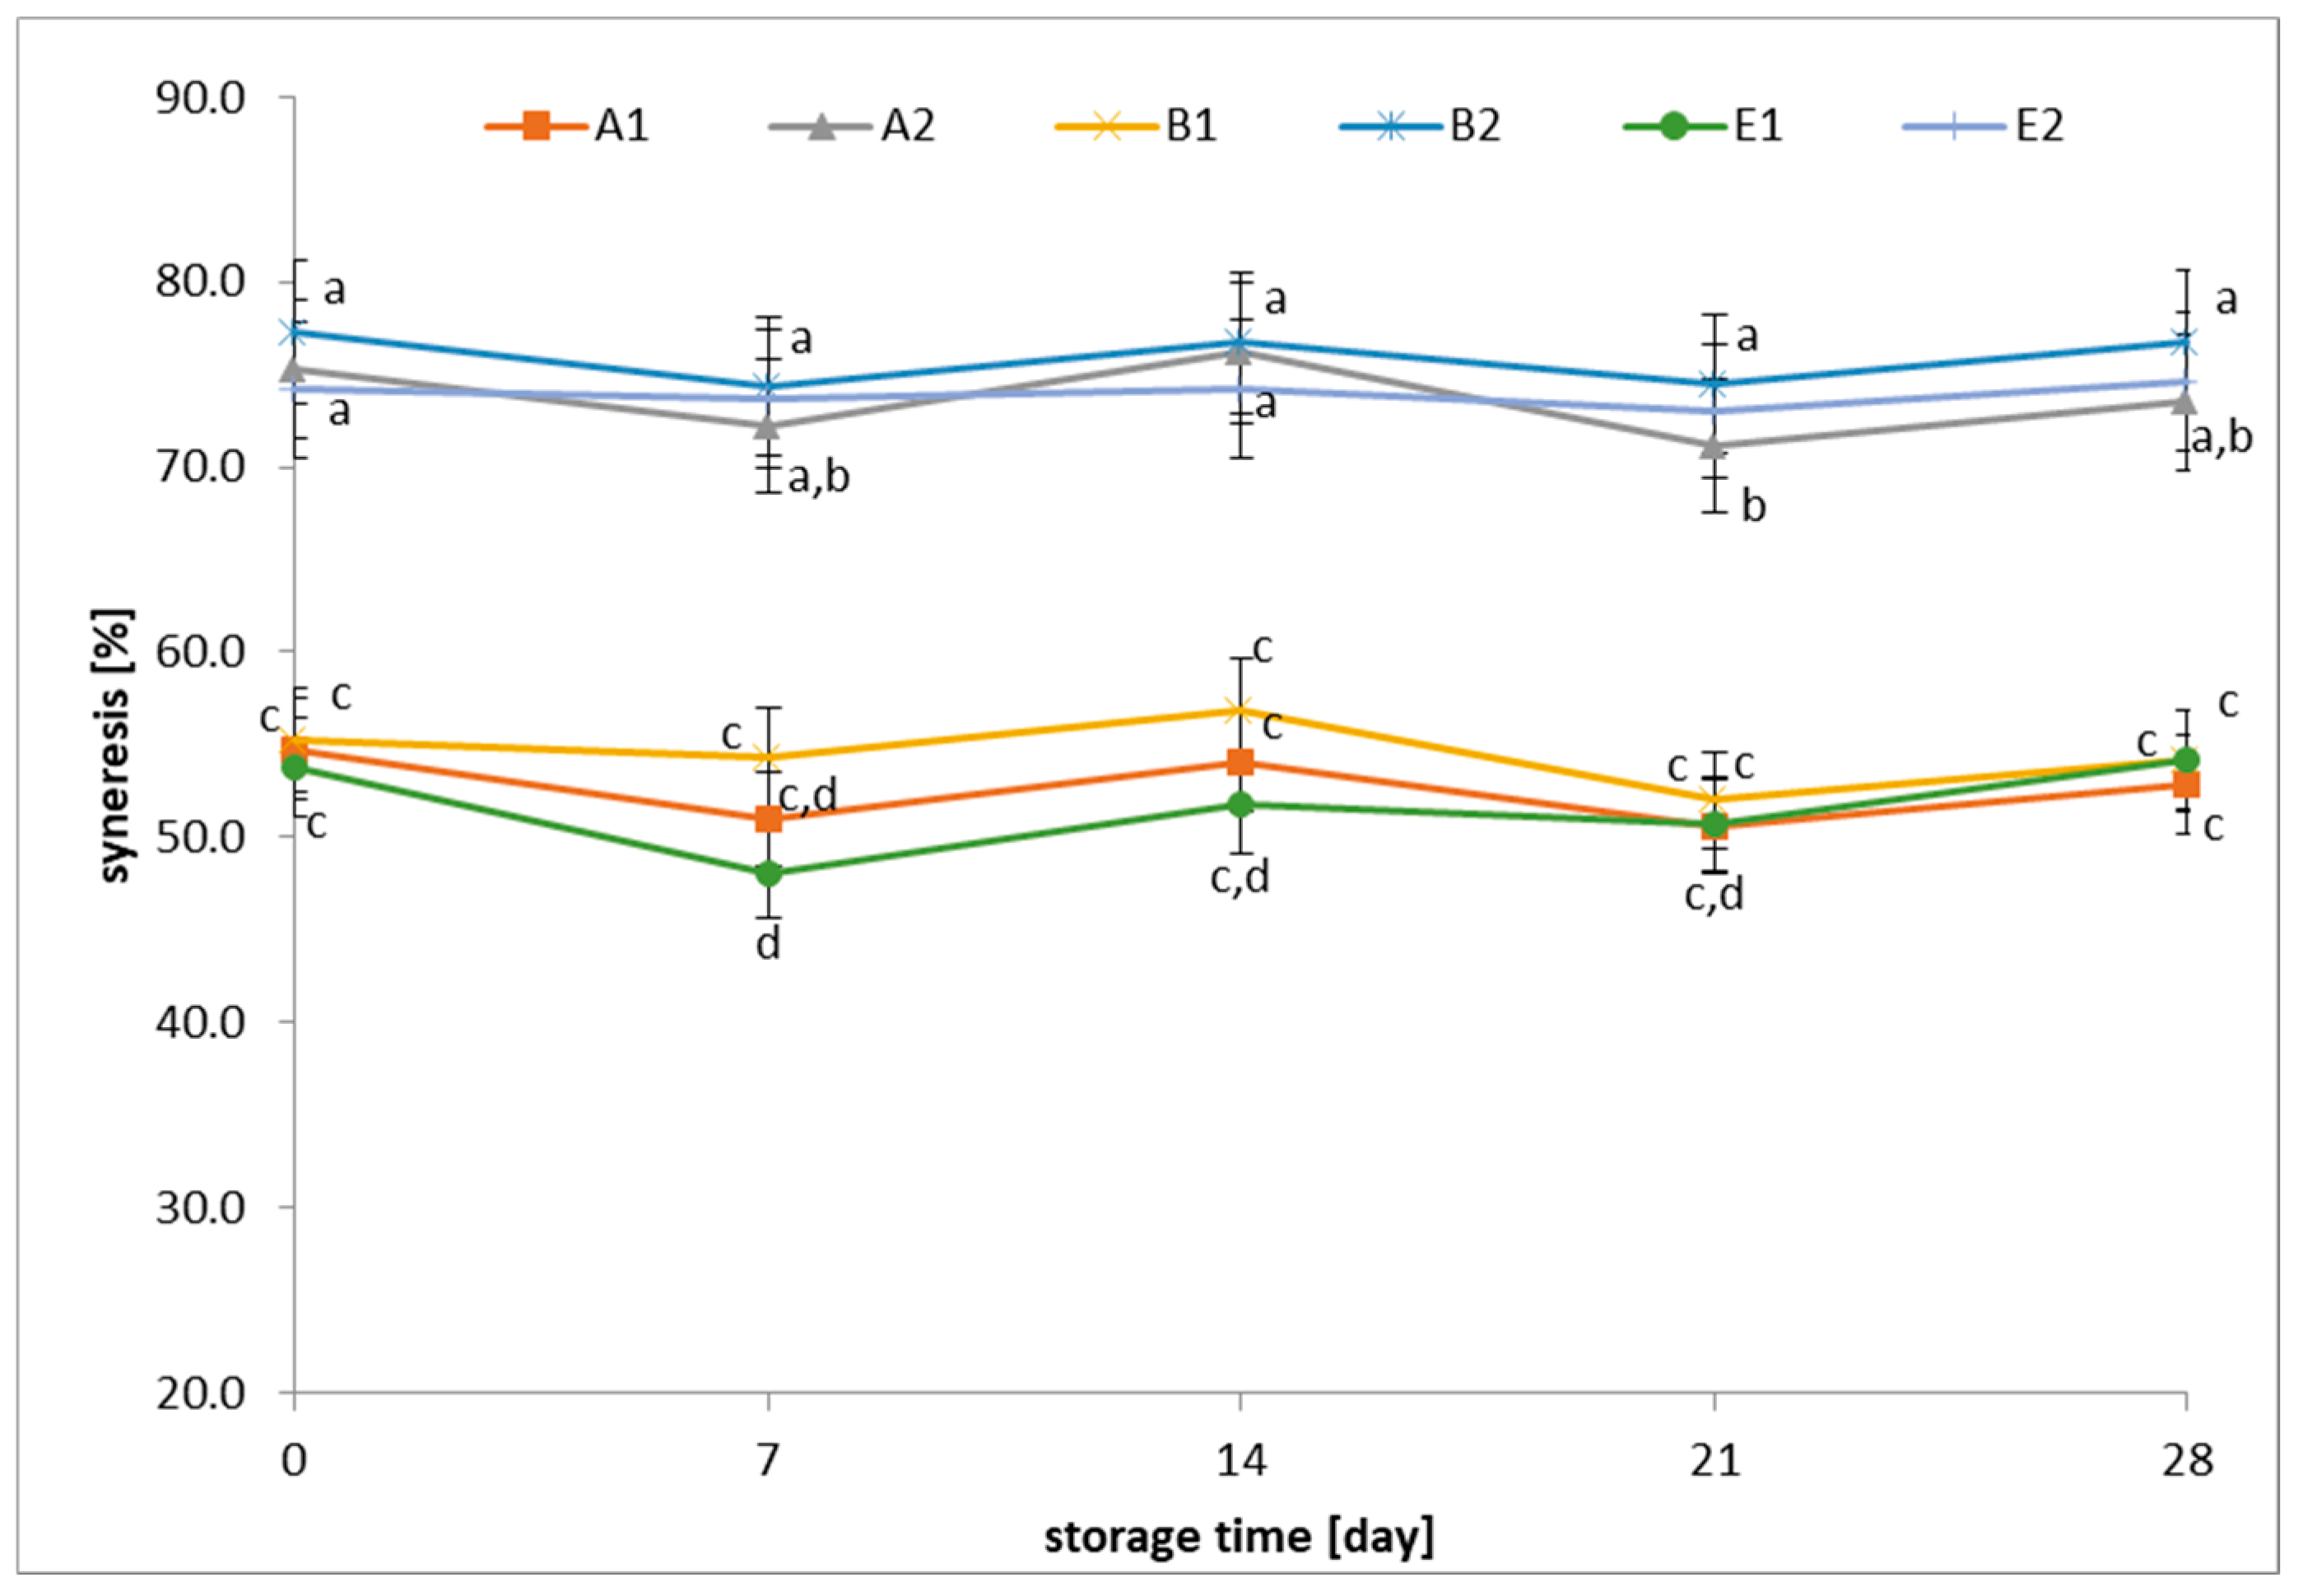
3.4. Changes in Syneresis of Fermented Beverages

Samples A1, A2, and B1 exhibited a lower level of syneresis (~45–60%), indicating better structural stability of the beverage (Figure 4). These samples showed slight fluctuations during storage but generally maintained more favorable textural properties. Samples B2, E1, and E2 exhibited the highest level of syneresis (~75–80%), indicating the best whey separation. The values remained stable during storage, suggesting that their structure does not improve over time. It may be due to a lower content of gel-stabilizing proteins or a weaker structural network formed by the fermenting bacteria. The research hypothesis was partially confirmed in this respect; that is, the choice of bacterial cultures influences the quality of fermented beverages, but not all strains improve their textural properties. Optimizing the selection of fermenting bacterial strains may improve the stability and texture of fermented beverages.

3.5. Changes in the Content of Selected Carbohydrates in Fermented Beverages

Lactose, as the primary fermentation substrate, undergoes gradual degradation during storage. A significant decrease in lactose was observed in all samples, indicating continued bacterial metabolism throughout storage (Table 2). The most substantial decrease in lactose was noted in samples D1 (from 2.57 g/100 g to 1.46 g/100 g) and B1 (from 2.40 to 1.66 g/100 g), suggesting intense activity of lactose-degrading bacteria. Glucose remained at very low levels (0.01–0.02 g/100 g) in all samples throughout the storage period. No significant changes in glucose content were observed in any sample, suggesting that the fermentative bacteria consumed most of the glucose in the early stages of fermentation. In most samples, galactose content did not exhibit significant statistical changes, except in samples C1 and A1, where a gradual decrease was observed. Therefore, it can be concluded that different bacterial cultures influence the rate of fermentation and sugar metabolism, resulting in variations in lactose and galactose content during storage.
The fermentation process significantly influences the content of certain sugars, especially galactose, sucrose, and lactose. It aligns with the study’s hypothesis regarding the positive impact of lactic acid bacteria on the quality of fermented dairy–oat beverages (Table 3). Lactose exhibits significant variability depending on the beverage variant: in A2, levels remain relatively stable, while in C2 and D2, substantial fluctuations are observed, which may be attributed to the different abilities of fermentative bacteria to metabolize it. Galactose demonstrates a decreasing trend in some beverage variants, particularly in A2, C2, and D2, suggesting its metabolism by fermentative bacteria. Fructose, glucose, and maltose exhibit stability during storage, with their levels remaining virtually unchanged regardless of the beverage type. Sucrose generally decreases, especially in A2, B2, C2, D2, and E2, suggesting its breakdown during fermentation. Raffinose and stachyose remain relatively stable, with minor fluctuations during storage. Some beverage variants (e.g., D2) exhibit more excellent dynamics in sugar content changes, which may indicate stronger fermentative activity of the applied bacterial cultures. The results confirm that the selection of bacterial cultures can be crucial for specific fermented dairy–oat beverages.
The fructose and glucose content remained relatively stable in all analyzed samples during storage (Table 4). Slight fluctuations in glucose content were observed in samples D3 and C3, where values increased on the 14th day and then decreased on the 28th day. Fructose in most samples remained at a constant level of 0.01 g/100 g, suggesting a lack of intensive fermentation of this sugar by the present bacteria. A gradual decrease in sucrose content was observed in all samples during storage. The most pronounced decrease was observed in samples A3, C3, and D3; on the 28th day, its amount decreased by about 30–40% compared to the initial value. This may indicate the enzymatic activity of lactic acid bacteria, which contributes to the hydrolysis of sucrose. The raffinose content remained relatively stable without significant changes throughout the storage period. Maltose was not present in the tested beverages to a significant extent, and its content was close to the method’s detection limit in all samples and at all storage stages. These results confirm the hypothesis that adding lactic acid bacteria cultures affects the quality parameters of fermented oat beverages, especially by modifying the sugar composition during storage.

3.6. Viability of Streptococcus thermophilus in Fermented Beverages

Most samples exhibited an initial S. thermophilus population within the 7.8–8.9 log CFU/g range, an indication of successful fermentation (Table 5). Notably, sample A3 and the samples belonging to Group B (B1 and B2) displayed the highest initial population, reaching 8.9 log CFU/g. Throughout the 14-day storage period, the S. thermophilus population in most samples remained relatively constant. However, a decline in bacterial count was evident in most samples post-14 days, a phenomenon commonly attributed to nutrient depletion and the environmental conditions of storage. The most pronounced reduction in bacterial count was observed in samples B1, E1, and E3, where a decrease of approximately 1.5 log CFU/g was recorded by the 28th day. In contrast, samples A3 and B2 demonstrated the exceptional stability of the S. thermophilus population, maintaining a count exceeding 8.0 log CFU/g even after 28 days of storage. These findings underscore the bacterial culture type’s significant influence on fermented beverages’ microbiological stability.

3.7. Viability of Lactobacillus delbrueckii subsp. bulgaricus in Fermented Beverages

Samples from Group E (E1, E2, and E3) generally exhibited higher initial Lactobacillus delbrueckii subsp. bulgaricus counts compared to Groups A and B, which could be attributed to differences in raw material composition or starter cultures employed (Table 5). The highest initial values were recorded in samples E1 (8.9 log CFU/g) and E2 (8.6 log CFU/g), while the lowest initial count was observed in sample B1 (7.0 log CFU/g). Most samples demonstrated a relatively stable level of starter bacteria during storage, although a decrease in counts was observed in some cases. In most instances, a slight decrease in Lactobacillus delbrueckii subsp. bulgaricus counts was noted with increasing storage duration, consistent with the natural trend in fermented dairy and plant-based products. In Groups A and B, the decreases in counts were more pronounced, suggesting a higher susceptibility of these samples to storage conditions. The results corroborate the hypothesis that lactic acid bacteria cultures significantly influence fermented beverages’ quality and microbiological stability.

3.8. Viability of L. plantarum 299v in Fermented Beverages

All samples had a similar initial population level of L. plantarum 299v (6.2–6.7 log CFU/g), indicating successful fermentation (Table 5). In most samples, a gradual decrease in L. plantarum 299v counts was observed over time, a natural phenomenon resulting from the limitation of available nutrients and the influence of refrigeration conditions. After 14 days, bacterial counts were decreased in all samples, particularly in B3 (5.5 log CFU/g) and B2 (5.5 log CFU/g). The most significant decrease was observed in sample C2, where the count decreased to 5.0 log CFU/g after 28 days. Samples B1 and C3 showed excellent stability, with bacterial populations remaining above 5.7 log CFU/g throughout the storage period. The results confirm that the type of bacterial culture used and the matrix of the fermented beverage can influence the stability of L. plantarum 299v during storage, which may be important for maintaining the quality and probiotic properties of the product.

3.9. Viability of Lactobacillus acidophilus La-5 in Fermented Beverages

The initial L. acidophilus La-5 population was relatively high in all samples, ranging from 7.8 to 8.8 log CFU/g (Table 5). The L. acidophilus La-5 population in the tested samples exhibited relatively high stability throughout the storage period, suggesting good adaptation of the strains to refrigerated conditions. Samples from Group F (F1, F2, and F3) showed the highest microbiological stability, suggesting that this fermented beverage variant better supported bacterial viability. Samples from Group E (E1, E2, and E3) exhibited more significant decreases in cell counts, especially in the case of E1, which may indicate differences in the matrix composition of the fermented beverage that affected bacterial survival. In sample E1, the most significant decrease in bacterial counts was observed (from 7.8 to 6.0 log CFU/g), suggesting that storage conditions may have been less favorable for L. acidophilus La-5’s stability in this variant. The results indicate that the choice of bacterial culture and the type of fermented substrate can significantly affect the stability of L. acidophilus La-5 in beverages stored under refrigerated conditions.

4. Discussion

This study aimed to determine the influence of typical lactic acid bacteria cultures in the dairy industry on the quality of fermented dairy, dairy–oat, and oat beverages. The dairy–oat beverage investigated in this study represents a novel approach to hybrid beverage formulation, combining the nutritional benefits of both dairy and plant-based ingredients. While similar products are not widely available on the market, industry interest in such formulations is increasing, particularly in the context of fermented beverages that could serve as functional dairy alternatives with enhanced sensory properties. The research hypothesis postulated that the addition of selected bacterial cultures would have a significant positive impact on the quality parameters of fermented beverages.
The observed changes in pH during fermentation indicate that yogurt cultures, both alone and in combination with L. plantarum 299 or L. acidophilus La-5, significantly affected the acidity of the beverages. Dairy and dairy–oat samples exhibited similar pH values (4.1–4.5). In contrast, adding L. plantarum 299 did not cause significant pH changes, suggesting the weak fermentative ability of this culture under the applied conditions. The designated fermentation period was too short, as other researchers have successfully fermented plant-based substrates with this bacterial strain [17,18]. The lowest pH values were observed in samples fermented with L. plantarum 299 and L. acidophilus La-5, indicating their high fermentative activity. The current results correlate with the literature data [19]. According to Šertović et al. [19], the fermentation of cow and soy milk mixtures with L. acidophilus La-5 achieved a pH of 4.6, demonstrating effective acidification. Dairy and dairy–oat beverages demonstrated greater pH stability than oat-based samples, which is crucial for product quality and sensory characteristics. This corresponds with previous studies showing that dairy beverages maintain a lower pH due to lactic acid bacteria efficiently fermenting lactose into lactic acid [20,21]. In contrast, Lactococcus lactis-fermented oat beverages showed a significant pH drop to 4.25 but with lower stability [13]. While acidity is critical for fermentation, excessive acidification may negatively impact consumer acceptance, highlighting the need for balanced acidification in plant-based alternatives.
Texture analysis showed that fermentation influenced beverage consistency, with samples containing mixed bacterial cultures (probiotic and yogurt) exhibiting higher hardness. This effect likely results from interactions between bacterial cultures and the beverage matrix. The highest hardness values were observed in samples fermented with the yogurt culture and L. plantarum 299v, suggesting a stabilizing effect of these bacteria. In contrast, samples fermented solely with L. plantarum 299v or L. acidophilus La-5 did not form a gel, preventing hardness and adhesiveness measurements. Previous studies confirm that specific bacterial blends enhance gel hardness and improve texture through acidification and fermentation processes [22,23]. L. acidophilus La-5 has been shown to contribute to firmer acid gels when added to traditional yogurt cultures [24,25]. Adhesiveness varied depending on the fermentation conditions. The highest adhesiveness values were recorded for cow’s milk fermented with the yogurt culture, while dairy–oat beverages fermented with the yogurt culture and L. acidophilus La-5 showed the lowest adhesiveness, suggesting a more fluid consistency and weaker gel structure. L. plantarum can enhance yogurt’s rheological properties by increasing viscosity and cohesiveness [26]. Additionally, LAB strains, including L. plantarum, exhibit superior adhesion properties, which may influence the texture of fermented products [27,28]. Syneresis analysis revealed that dairy and dairy–oat samples fermented with the yogurt culture had the lowest syneresis (~45–60%), indicating better structural stability. The addition of L. plantarum 299v slightly reduced syneresis in dairy beverages, likely due to its interaction with the dairy matrix [28,29,30]. However, the highest syneresis levels were observed in dairy–oat samples fermented with the yogurt culture and L. plantarum 299v, possibly due to a weaker structural network or lower content of gel-stabilizing proteins. These results suggest that while L. plantarum 299v may reduce syneresis in dairy products, its effect depends on formulation-specific factors, highlighting the complex interactions within fermented beverages [30].
The fermentation process influenced the level of sugars, especially galactose, sucrose, and lactose, confirming the activity of lactic acid bacteria [31,32]. These bacteria, including lactobacilli and streptococci, efficiently ferment lactose and sucrose, producing lactic acid and other metabolites [33,34]. Our study showed that glucose levels remained stable, suggesting rapid consumption at the beginning of fermentation, which aligns with its role as a primary energy source for lactic acid bacteria [35,36]. However, excessive glucose depletion can lead to metabolic shifts, potentially affecting fermentation efficiency. The most pronounced changes in galactose levels were observed in cow’s milk fermented with the yogurt culture and L. plantarum 299v, confirming that specific bacterial strains influence carbohydrate metabolism. The variability in galactose content may result from differences in bacterial metabolic pathways, such as the Leloir and Tagatose-6P pathways, which regulate lactose and galactose metabolism [37,38]. L. plantarum has been shown to alter the milk metabolite profile, improving fermentation stability [39]. Sucrose hydrolysis in dairy–oat beverages further confirmed the enzymatic activity of lactic acid bacteria, which plays a role in flavor development and nutritional enhancement [21]. Conversely, the minimal changes in raffinose and stachyose levels suggest a limited ability of the tested bacterial cultures to metabolize these oligosaccharides. This is consistent with previous findings that lactic acid bacteria lack the α-galactosidase enzyme required for the efficient degradation of raffinose and stachyose [18,21,40,41,42,43].
In our study, the initial count of S. thermophilus was 7.8–8.9 log CFU/g, and it remained stable after 14 days in fermented beverages. After 28 days, a decrease was observed in milk beverages fermented with the yogurt culture and L. acidophilus La-5, as well as oat beverages fermented with the same combination. The stability of S. thermophilus is crucial for probiotic benefits and sensory quality [44]. While this species typically maintains viability during storage, factors such as temperature, pH fluctuations, and microbial interactions can contribute to its decline [45,46]. The presence of L. acidophilus can also influence fermentation and bacterial survival [47]. The highest initial lactobacilli count was recorded in samples fermented with the yogurt culture and L. acidophilus La-5, suggesting a synergistic interaction that enhanced bacterial stability [48]. This positive effect is likely due to complementary metabolic activities that support fermentation and improve probiotic viability, as well as the sensory and textural properties of the product [25,48,49,50]. L. plantarum 299v showed better survival in cow’s milk and oat beverages, whereas, in dairy–oat mixtures, the count of this bacterium decreased to 5.0 log CFU/g after 28 days. This highlights the importance of selecting appropriate food matrices to maintain probiotic viability. While cow’s milk provides a nutrient-rich environment, oat beverages have also been shown to support L. plantarum survival, making them a suitable non-dairy alternative [51,52]. However, dairy–oat combinations may introduce inhibitory factors such as pH shifts, nutrient competition, and the accumulation of metabolic by-products, reducing bacterial viability [12,52,53]. These findings emphasize the need for careful formulation and potential protective strategies, such as microencapsulation, to enhance probiotic stability in mixed substrates.
In summary, the research confirmed that the selection of bacterial cultures and the base raw material plays a key role in shaping fermented beverages’ quality, texture, and stability. Further optimization of the selection of bacterial strains may contribute to improving the stability and sensory properties of these products.

5. Conclusions

This study showed that the selection of lactic acid bacteria cultures significantly affected the quality of fermented dairy, dairy–oat, and oat beverages, with effects depending on the base material. Yogurt cultures (Streptococcus thermophilus and Lactobacillus delbrueckii subsp. bulgaricus) improved structural stability and reduced syneresis, especially in dairy and dairy–oat beverages. Adding Lactiplantibacillus plantarum 299v increased gel hardness compared to using only the yogurt culture. The lowest pH values occurred in samples with Lactobacillus acidophilus La-5, indicating strong acidification. Oat-based beverages maintained more stable pH during storage than dairy-based ones, showing resistance to further fermentation. Lactose breakdown and galactose changes were greater in samples with L. acidophilus La-5 and L. plantarum 299v, confirming active carbohydrate metabolism. Sucrose content in dairy–oat beverages decreased over time, suggesting enzymatic hydrolysis. S. thermophilus remained viable (>7 log CFU/g) in most samples, while the viability of L. acidophilus La-5 declined more in oat-based beverages. In conclusion, the bacterial culture and base material both shaped beverage quality. Dairy and dairy–oat drinks with yogurt cultures had better stability, while L. plantarum 299v and L. acidophilus La-5 enhanced acidification and sugar metabolism. These results suggest that bacterial culture combinations can be optimized to improve fermented beverage stability, texture, and taste.
A limitation of the study was the assessment of only selected quality parameters, excluding factors like flavor and aroma. The fermentation period may have been too short to fully evaluate the fermentative capacity of L. plantarum. Future research should include more lactic acid bacteria strains and their combinations to identify optimal cultures for various beverages. It is also important to conduct studies under industrial-like conditions to better understand how processing affects beverage quality and stability and to analyze the impact of fermentation on sensory attributes (taste, aroma, and texture) and consumer preferences. Optimizing bacterial culture combinations could enhance product stability and sensory qualities, offering valuable insights for developing high-quality fermented beverages.

Author Contributions

Conceptualization, M.Z. and D.Z.; methodology, M.Z., E.K. and T.F.; validation, M.Z. and D.Z.; formal analysis, M.Z., E.K. and T.F.; investigation, M.Z., E.K. and T.F.; resources, M.Z. and D.Z.; data curation, M.Z. and D.Z.; writing—original draft preparation, M.Z., D.Z., E.K. and T.F.; writing—review and editing, M.Z., D.Z., E.K. and T.F.; visualization, M.Z. and D.Z.; supervision, M.Z.; project administration, M.Z.; funding acquisition, M.Z. All authors have read and agreed to the published version of the manuscript.

Funding

This research received no external funding.

Institutional Review Board Statement

Not applicable.

Informed Consent Statement

Not applicable.

Data Availability Statement

The original contributions presented in this study are included in the article. Further inquiries can be directed to the corresponding author.

Acknowledgments

The authors gratefully acknowledge the Institute of Food Sciences of Warsaw University of Life Sciences WULS–SGGW for supporting and providing necessary infrastructure and research materials.

Conflicts of Interest

The authors declare no conflicts of interest.

References

  1. Tilman, D.; Clark, M. Global Diets Link Environmental Sustainability and Human Health. Nature 2014, 515, 518–522. [Google Scholar] [CrossRef]
  2. Karmaus, A.L.; Jones, W. Future Foods Symposium on Alternative Proteins: Workshop Proceedings. Trends Food Sci. Technol. 2021, 107, 124–129. [Google Scholar] [CrossRef]
  3. Damayanti, A.; Bahlawan, Z.A.S.; Fibriana, F.; Kayati, F.N. Review: Production Mechanism of Yogurt with Additional Plant-Based High Protein for Vegetarian Consumers. E3S Web Conf. 2024, 576, 04010. [Google Scholar] [CrossRef]
  4. D’Andrea, A.E.; Kinchla, A.J.; Nolden, A.A. A Comparison of the Nutritional Profile and Nutrient Density of Commercially Available Plant-Based and Dairy Yogurts in the United States. Front. Nutr. 2023, 10, 1195045. [Google Scholar] [CrossRef]
  5. Hidalgo-Fuentes, B.; de Jesús-José, E.; Cabrera-Hidalgo, A.d.J.; Sandoval-Castilla, O.; Espinosa-Solares, T.; González-Reza, R.M.; Zambrano-Zaragoza, M.L.; Liceaga, A.M.; Aguilar-Toalá, J.E. Plant-Based Fermented Beverages: Nutritional Composition, Sensory Properties, and Health Benefits. Foods 2024, 13, 844. [Google Scholar] [CrossRef] [PubMed]
  6. Erem, E.; Kilic-Akyilmaz, M. The Role of Fermentation with Lactic Acid Bacteria in Quality and Health Effects of Plant-Based Dairy Analogues. Compr. Rev. Food Sci. Food Saf. 2024, 23, e13402. [Google Scholar] [CrossRef]
  7. Hu, Y.; Badar, I.H.; Zhang, L.; Yang, L.; Xu, B. Odor and Taste Characteristics, Transduction Mechanism, and Perceptual Interaction in Fermented Foods: A Review. Crit. Rev. Food Sci. Nutr. 2024, 1–19. [Google Scholar] [CrossRef]
  8. Saleem, G.N.; Gu, R.; Qu, H.; Bahar Khaskheli, G.; Rashid Rajput, I.; Qasim, M.; Chen, X. Therapeutic Potential of Popular Fermented Dairy Products and Its Benefits on Human Health. Front. Nutr. 2024, 11, 1328620. [Google Scholar] [CrossRef]
  9. Raungrusmee, S.; Kumar, S.R.; Anal, A.K. Probiotic Cereal-Based Food and Beverages, Their Production and Health Benefits. In Probiotics, Prebiotics and Synbiotics; John Wiley & Sons, Ltd.: Hoboken, NJ, USA, 2022; pp. 186–212. ISBN 978-1-119-70216-0. [Google Scholar]
  10. Angelov, A.; Yaneva-Marinova, T.; Gotcheva, V. Oats as a Matrix of Choice for Developing Fermented Functional Beverages. J. Food Sci. Technol. 2018, 55, 2351–2360. [Google Scholar] [CrossRef]
  11. Kumar, A.; Kaur, A.; Tomer, V.; Rasane, P.; Gupta, K. Development of Nutricereals and Milk-Based Beverage: Process Optimization and Validation of Improved Nutritional Properties. J. Food Process Eng. 2020, 43, e13025. [Google Scholar] [CrossRef]
  12. Popova, N.V.; Kalinina, I.V.; Vasiliev, A.K.; Kameneva, K.S. Evaluation of effectiveness and optimisation of the process of fermentation of oat drink with lactic acid microorganisms. Agrar. Sci. 2024, 2, 127–132. [Google Scholar] [CrossRef]
  13. Yu, Q.; Xia, X.; Qian, J.; Xu, Q.; Yu, H.; Guo, Y.; Xie, Y.; Yao, W.; Qian, H.; Cheng, Y. A Study on Physicochemical Properties and Flavor Profile of Oat Beverage Fermented by Lactococcus lactis. SSRN 2023. [Google Scholar] [CrossRef]
  14. Nordström, E.A.; Teixeira, C.; Montelius, C.; Jeppsson, B.; Larsson, N. Lactiplantibacillus plantarum 299v (LP299V®): Three Decades of Research. Benef. Microbes 2021, 12, 441–465. [Google Scholar] [CrossRef]
  15. Lactobacillus Acidophilus, LA-5®—A Well-Documented Probiotic Strain. The Probiotics Institute by Chr. Hansen A/S. Available online: https://global.theprobioticsinstitute.com/en/chr-hansen-probiotics/la-5 (accessed on 15 February 2025).
  16. Süle, J.; Kõrösi, T.; Hucker, A.; Varga, L. Evaluation of Culture Media for Selective Enumeration of Bifidobacteria and Lactic Acid Bacteria. Braz. J. Microbiol. 2014, 45, 1023–1030. [Google Scholar] [CrossRef]
  17. Fang, X.; Ye, H.; Chen, M.; Chen, X.; Chen, M.; Chen, J.; Kong, W.; Wang, Q.; Zhang, Z. Effects of Co-Fermentation of Lactobacillus Plantarum and Inulin on Beany Flavor and Physicochemical Quality of Soy Yogurt in a Multiple Lactic Acid Bacteria Fermentation System. Cereal Chem. 2024, 101, 248–262. [Google Scholar] [CrossRef]
  18. Küçükgöz, K.; Franczak, A.; Borysewicz, W.; Kamińska, K.; Salman, M.; Mosiej, W.; Kruk, M.; Kołożyn-Krajewska, D.; Trząskowska, M. Impact of Lactic Acid Fermentation on the Organic Acids and Sugars of Developed Oat and Buckwheat Beverages. Fermentation 2024, 10, 373. [Google Scholar] [CrossRef]
  19. Šertović, E.; Sarić, Z.; Božanić, R.; Barać, M.; Barukčić, I.; Kostić, A. Fermentation of Cow’s Milk and Soy Milk Mixture with L. Acidophilus Probiotic Bacteria with Yoghurt Culture. In Proceedings of the 30th Scientific-Experts Conference of Agriculture and Food Industry, Sarajevo, Bosnia and Herzegovina, 26–27 September 2019; Brka, M., Omanović-Mikličanin, E., Karić, L., Falan, V., Toroman, A., Eds.; Springer International Publishing: Cham, Switzerland, 2020; pp. 251–259. [Google Scholar]
  20. Raj, S.K.; Ligimol, J.; Beena, A.K.; Rejeesh, R.; Aysha, C.H.; Divya, M.P. Assessment of pH Variations During Extended Period of Fermentation of Cow Milk with Different Lactic Acid Bacterial Cultures. In Prospective Research and Technological Advancements in Food and Health Sciences; Skyfox Publishing Group: Thanjavur, Indian, 2023. [Google Scholar]
  21. Khrundin, D.V.; Nikitina, E.V. Chemical, Textural and Antioxidant Properties of Oat-Fermented Beverages with Different Starter Lactic Acid Bacteria and Pectin. BioTech 2024, 13, 38. [Google Scholar] [CrossRef]
  22. Masiá, C.; Fernández-Varela, R.; Jensen, P.E.; Rahimi Yazdi, S. The Impact of Different Bacterial Blends on Texture and Flavour Development in Plant-Based Cheese. Future Foods 2023, 8, 100250. [Google Scholar] [CrossRef]
  23. Komalasari, H.; Karni, I.; Heldiyanti, R.; Arianto, A.R.; Rahayu, E.S. Effect of Inoculation Time for Indigenous Probiotic Bacteria Lactobacillus Plantarum DAD-13 on the Physiochemical and Organoleptic Properties of Yoghurt Drink: Pengaruh Waktu Inokulasi Bakteri Probiotik Indigenous Lactobacillus Plantarum DAD-13 Terhadap Sifat Fisikokimia Dan Organoleptik Yoghurt Drink. JITIPARI J. Ilm. Teknol. Dan Ind. Pangan UNISRI 2024, 9, 67–78. [Google Scholar] [CrossRef]
  24. Domínguez-Murillo, A.C.; Urías-Silvas, J.E. Fermented Coconut Jelly as a Probiotic Vehicle, Physicochemical and Microbiology Characterisation during an in Vitro Digestion. Int. J. Food Sci. Technol. 2023, 58, 45–52. [Google Scholar] [CrossRef]
  25. Gustaw, W.; Kozioł, J.; Radzki, W.; Skrzypczak, K.; Michalak-Majewska, M.; Sołowiej, B.; Sławińska, A.; Jabłońska-Ryś, E. The Effect of Addition of Selected Milk Protein Preparations on the Growth of Lactobacillus Acidophilus and Physicochemical Properties of Fermented Milk. Acta Sci. Pol. Technol. Aliment. 2016, 15, 29–36. [Google Scholar] [CrossRef] [PubMed]
  26. Lin, X.; Cao, Z.; Zhang, J.; Mu, G.; Jiang, S. Characteristics of the Mixed Yogurt Fermented from Cow–Soy Milk in the Presence of Transglutaminase. Foods 2024, 13, 2120. [Google Scholar] [CrossRef] [PubMed]
  27. Sim, E.A.; Kim, S.-Y.; Kim, S.; Mun, E.-G. Probiotic Potential and Enhanced Adhesion of Fermented Foods-Isolated Lactic Acid Bacteria to Intestinal Epithelial Caco-2 and HT-29 Cells. Microorganisms 2025, 13, 32. [Google Scholar] [CrossRef] [PubMed]
  28. Horáčková, Š.; Vrchotová, B.; Koval, D.; Omarova, A.; Sluková, M.; Štětina, J. Use of Lactiplantibacillus Plantarum for Dairy and Non-Dairy Fermented Products. Czech J. Food Sci. 2022, 40, 392–399. [Google Scholar] [CrossRef]
  29. El Bouchikhi, S.; Pagès, P.; El Alaoui, Y.; Ibrahimi, A.; Bensouda, Y. Syneresis Investigations of Lacto-Fermented Sodium Caseinate in a Mixed Model System. BMC Biotechnol. 2019, 19, 57. [Google Scholar] [CrossRef]
  30. Gedik, O.; Karahan, A.G. Physicochemical Properties and Survival Assessment of Potential Probiotics in a Novel Dairy Drink during Storage. Food Sci. Nutr. 2023, 11, 7803–7815. [Google Scholar] [CrossRef]
  31. Martins, A.R.; Monteiro, R.L.; Burkert, J.F.d.M.; Burkert, C.A.V. Simultaneous Enzymatic Hydrolysis and Lactic Fermentation to Obtain a Yogurt with Low Lactose Content. Ciênc. Agrotecnol. 2012, 36, 551–559. [Google Scholar] [CrossRef]
  32. Tadesse, B.T.; Zhao, G.; Kempen, P.; Solem, C. Consolidated Bioprocessing in a Dairy Setting─Concurrent Yoghurt Fermentation and Lactose Hydrolysis without Using Lactase Enzymes. J. Agric. Food Chem. 2022, 70, 11623–11630. [Google Scholar] [CrossRef]
  33. Schwab, C.; Gänzle, M. Lactic Acid Bacteria Fermentation of Human Milk Oligosaccharide Components, Human Milk Oligosaccharides and Galactooligosaccharides. FEMS Microbiol. Lett. 2011, 315, 141–148. [Google Scholar] [CrossRef]
  34. Gunkova, P.I.; Buchilina, A.S.; Maksimiuk, N.N.; Bazarnova, Y.G.; Girel, K.S. Carbohydrate Fermentation Test of Lactic Acid Starter Cultures. IOP Conf. Ser. Earth Environ. Sci. 2021, 852, 012035. [Google Scholar] [CrossRef]
  35. Andreevskaya, M.; Johansson, P.; Jääskeläinen, E.; Rämö, T.; Ritari, J.; Paulin, L.; Björkroth, J.; Auvinen, P. Lactobacillus Oligofermentans Glucose, Ribose and Xylose Transcriptomes Show Higher Similarity between Glucose and Xylose Catabolism-Induced Responses in the Early Exponential Growth Phase. BMC Genom. 2016, 17, 539. [Google Scholar] [CrossRef]
  36. Ebrahimi, P.; Larsen, F.H.; Jensen, H.M.; Vogensen, F.K.; Engelsen, S.B. Real-Time Metabolomic Analysis of Lactic Acid Bacteria as Monitored by in Vitro NMR and Chemometrics. Metabolomics 2016, 12, 77. [Google Scholar] [CrossRef]
  37. Hettinga, K. Study Used Wrong Assumption about Galactose Content of Fermented Dairy Products. BMJ 2014, 349, g7000. [Google Scholar] [CrossRef]
  38. Wu, Q.; Cheung, C.K.W.; Shah, N.P. Towards Galactose Accumulation in Dairy Foods Fermented by Conventional Starter Cultures: Challenges and Strategies. Trends Food Sci. Technol. 2015, 41, 24–36. [Google Scholar] [CrossRef]
  39. Zha, M.; Li, K.; Zhang, W.; Sun, Z.; Kwok, L.-Y.; Menghe, B.; Chen, Y. Untargeted Mass Spectrometry-Based Metabolomics Approach Unveils Molecular Changes in Milk Fermented by Lactobacillus Plantarum P9. LWT 2021, 140, 110759. [Google Scholar] [CrossRef]
  40. Sumarna. Changes of Raffinose and Stachyose in Soy Milk Fermentation by Lactic Acid Bacteria from Local Fermented Foods of Indonesian. Malays. J. Microbiol. 2008, 4, 26–34. [Google Scholar] [CrossRef]
  41. He, Z.; Zhang, H.; Wang, T.; Wang, R.; Luo, X. Effects of Five Different Lactic Acid Bacteria on Bioactive Components and Volatile Compounds of Oat. Foods 2022, 11, 3230. [Google Scholar] [CrossRef]
  42. Klajn, V.M.; Ames, C.W.; da Cunha, K.F.; Lorini, A.; Hackbart, H.C.d.S.; Filho, P.J.S.; Cruxen, C.E.d.S.; Fiorentini, Â.M. Probiotic Fermented Oat Dairy Beverage: Viability of Lactobacillus Casei, Fatty Acid Profile, Phenolic Compound Content and Acceptability. J. Food Sci. Technol. 2021, 58, 3444–3452. [Google Scholar] [CrossRef]
  43. Chen, L.; Wu, D.; Schlundt, J.; Conway, P.L. Development of a Dairy-Free Fermented Oat-Based Beverage With Enhanced Probiotic and Bioactive Properties. Front. Microbiol. 2020, 11, 609734. [Google Scholar] [CrossRef]
  44. Zacarchenco, P.B.; Massaguer-Roig, S. Avaliação sensorial, microbiológica e de pós-acidificação durante a vida-de-prateleira de leites fermentados contendo Streptococcus thermophilus, Bifidobacterium longum e Lactobacillus acidophilus. Food Sci. Technol. 2004, 24, 674–679. [Google Scholar] [CrossRef]
  45. Gueimonde, M.; Reyes-Gavilán, C.G. Reduction of Incubation Time in Carbonated Streptococcus Thermophilus/Lactobacillus Acidophilus Fermented Milks as Affected by the Growth and Acidification Capacity of the Starter Strains. Milchwiss.-Milk Sci. Int. 2004, 59, 280–283. [Google Scholar]
  46. Huang, Y.-Y.; Lu, Y.-H.; Liu, X.-T.; Wu, W.-T.; Li, W.-Q.; Lai, S.-Q.; Aadil, R.M.; Rajoka, M.S.R.; Wang, L.-H.; Zeng, X.-A. Metabolic Properties, Functional Characteristics, and Practical Application of Streptococcus thermophilus. Food Rev. Int. 2024, 40, 792–813. [Google Scholar] [CrossRef]
  47. Souza, C.H.B.; Saad, S.M.I. Viability of Lactobacillus Acidophilus La-5 Added Solely or in Co-Culture with a Yoghurt Starter Culture and Implications on Physico-Chemical and Related Properties of Minas Fresh Cheese during Storage. LWT Food Sci. Technol. 2009, 42, 633–640. [Google Scholar] [CrossRef]
  48. Sarvari, F.; Mortazavian, A.M.; Fazei, M.R. Biochemical Characteristics and Viability of Probiotic and Yogurt Bacteria in Yogurt during the Fermentation and Refrigerated Storage. Appl. Food Biotechnol. 2014, 1, 55–61. [Google Scholar] [CrossRef]
  49. Canon, F.; Nidelet, T.; Guédon, E.; Thierry, A.; Gagnaire, V. Understanding the Mechanisms of Positive Microbial Interactions That Benefit Lactic Acid Bacteria Co-Cultures. Front. Microbiol. 2020, 11, 2088. [Google Scholar] [CrossRef]
  50. Xavier-Santos, D.; Bedani, R.; Perego, P.; Converti, A.; Saad, S.M.I. L. Acidophilus La-5, Fructo-Oligosaccharides and Inulin May Improve Sensory Acceptance and Texture Profile of a Synbiotic Diet Mousse. LWT 2019, 105, 329–335. [Google Scholar] [CrossRef]
  51. Gullo, M.; Zotta, T. Chapter 18—Probiotics in Dairy Products: Microencapsulation and Delivery. In Advances in Dairy Microbial Products; Singh, J., Vyas, A., Eds.; Woodhead Publishing: Cambridge, UK, 2022; pp. 271–285. ISBN 978-0-323-85793-2. [Google Scholar]
  52. Russo, P.; de Chiara, M.L.V.; Capozzi, V.; Arena, M.P.; Amodio, M.L.; Rascón, A.; Dueñas, M.T.; López, P.; Spano, G. Lactobacillus Plantarum Strains for Multifunctional Oat-Based Foods. LWT Food Sci. Technol. 2016, 68, 288–294. [Google Scholar] [CrossRef]
  53. Salmerón, I.; Thomas, K.; Pandiella, S.S. Effect of Substrate Composition and Inoculum on the Fermentation Kinetics and Flavour Compound Profiles of Potentially Non-Dairy Probiotic Formulations. LWT Food Sci. Technol. 2014, 55, 240–247. [Google Scholar] [CrossRef]
Figure 1. Changes in the pH of beverages inoculated with a yogurt culture, a monoculture of lactobacilli, and their mixture at 37 °C: (a) L. plantarum 299v; (b) L. acidophilus La-5. Different superscripts show a significant difference at α < 0.05.
Applsci 15 03714 g001
Figure 2. Changes in the pH of beverages inoculated with the yogurt culture, a monoculture of lactobacilli, and their mixture during cold storage: (a) L. plantarum 299v; (b) L. acidophilus La-5. Different superscripts show a significant difference at α < 0.05.
Applsci 15 03714 g002
Figure 3. Changes in the hardness and adhesiveness of fermented beverages inoculated with the yogurt culture and their mixture with lactobacilli monocultures during cold storage: (a) hardness; (b) adhesiveness. Different superscripts show a significant difference at α < 0.05.
Applsci 15 03714 g003aApplsci 15 03714 g003b
Figure 4. Changes in the syneresis of fermented beverages inoculated with the yogurt culture and their mixture with lactobacilli monocultures during cold storage. Different superscripts show a significant difference at α < 0.05.
Applsci 15 03714 g004
Table 1. Variations in prepared fermented beverages.
SampleCow’s MilkDairy-Oat BeverageOat Beverage
A: Inoculated with the yogurt cultureA1A2 A3
B: Inoculated with the yogurt culture and L. plantarum 299vB1B2 B3
C: Inoculated with the L. plantarum 299v cultureC1C2 C3
E: Inoculated with the yogurt culture and L. acidophilus La-5E1E2 E3
F: Inoculated with the acidophilus La-5 cultureF1F2 F3
Table 2. Sugar content [g/100 g] of fermented milk beverage samples during cold storage.
Storage Time [Day]0 7 14 21 28
A1
glucose0.02 a ± 0.000.03 a ± 0.000.02 a ± 0.010.02 a ± 0.010.02 a ± 0.01
galactose0.80 a ± 0.040.85 a ± 0.050.82 a ± 0.050.67 b ± 0.030.59 b ± 0.04
lactose *2.52 a ± 0.132.46 a,b ± 0.152.44 a,b ± 0.142.35 b ± 0.121.89 c ± 0.19
B1
glucose0.02 a ± 0.000.02 a ± 0.010.02 a ± 0.010.02 a ± 0.000.02 a ± 0.00
galactose0.65 a ± 0.030.61 a ± 0.040.61 a ± 0.050.58 a ± 0.030.61 a ± 0.03
lactose2.40 a ± 0.122.33 b ± 0.142.02 c ± 0.152.01 c ± 0.101.66 d ± 0.08
C1
glucose0.02 a ± 0.010.02 a ± 0.010.02 a ± 0.000.02 a ± 0.010.02 a ± 0.00
galactose0.60 a ± 0.040.52 a ± 0.050.44 b ± 0.020.40 b ± 0.030.38 b ± 0.02
lactose2.45 a ± 0.122.37 a ± 0.132.21 b ± 0.112.00 c ± 0.111.93 c ± 0.10
D1
glucose0.02 a ± 0.010.02 a ± 0.000.02 a ± 0.010.02 a ± 0.000.02 a ± 0.01
galactose0.64 a ± 0.050.74 a ± 0.040.72 a ± 0.050.70 a ± 0.040.63 a ± 0.06
lactose2.57 a ± 0.142.41 a ± 0.121.80 c ± 0.101.70 c ± 0.091.46 d ± 0.07
E1
glucose0.02 a ± 0.010.02 a ± 0.010.00 a ± 0.000.01 a ± 0.010.01 a ± 0.01
galactose0.92 a ± 0.050.92 a ± 0.060.93 a ± 0.050.88 a ± 0.040.89 a ± 0.05
lactose2.55 a ± 0.132.40 a ± 0.152.22 a ± 0.112.11 a ± 0.111.67 b ± 0.09
F1
glucose0.01 a ± 0.010.01 a ± 0.010.01 a ± 0.000.01 a ± 0.010.01 a ± 0.01
galactose0.83 a ± 0.040.90 a ± 0.050.80 a ± 0.060.76 a ± 0.040.78 a ± 0.06
lactose2.52 a ± 0.132.56 a ± 0.172.47 a ± 0.162.33 a ± 0.071.43 b ± 0.13
* Legend: a,b,c,d—The average values in rows labeled with the same letter are not significantly different at α < 0.05.
Table 3. Sugar content [g/100 g] of fermented dairy–oat beverage samples during cold storage.
Storage Time [Day]0 7 14 21 28
A2
fructose0.01 a ± 0.010.01 a ± 0.000.01 a ± 0.010.01 a ± 0.000.01 a ± 0.00
glucose0.04 a ± 0.020.04 a ± 0.010.04 a ± 0.000.04 a ± 0.000.04 a ± 0.01
galactose0.47 a ± 0.030.50 a ± 0.020.48 a ± 0.030.40 a,b ± 0.050.35 b ± 0.03
maltose0.00 a ± 0.000.00 a ± 0.000.00 a ± 0.000.00 a ± 0.000.00 a ± 0.00
sucrose0.36 a ± 0.020.31 a,b ± 0.010.27 b ± 0.010.26 b ± 0.030.26 b ± 0.02
lactose1.22 a ± 0.061.17 a ± 0.060.94 a ± 0.051.24 a ± 0.061.18 a ± 0.06
raffinose0.49 a ± 0.000.49 a ± 0.010.44 a ± 0.010.42 a ± 0.010.40 a ± 0.01
stachyose0.03 a ± 0.000.03 a ± 0.000.04 a ± 0.000.03 a ± 0.000.03 a ± 0.00
B2
fructose0.01 a ± 0.000.01 a ± 0.010.01 a ± 0.000.01 a ± 0.010.01 a ± 0.00
glucose0.04 a ± 0.000.04 a ± 0.020.04 a ± 0.000.04 a ± 0.010.03 a ± 0.01
galactose0.38 a ± 0.020.36 a,b ± 0.020.36 a,b ± 0.020.34 b ± 0.020.36 a,b ± 03
maltose0.00 a ± 0.000.00 a ± 0.000.00 a ± 0.000.00 a ± 0.000.00 a ± 0.00
sucrose0.31 a ± 0.030.31 a ± 0.020.30 a,b ± 0.020.28 b ± 0.010.28 b ± 0.02
lactose0.00 a ± 0.010.73 a ± 0.040.92 a ± 0.050.62 a ± 0.030.63 a ± 0.04
raffinose0.32 a ± 0.020.35 a ± 0.020.34 a ± 0.020.34 a ± 0.030.31 a ± 0.02
stachyose0.03 a ± 0.010.03 a ± 0.010.03 a ± 0.010.02 b ± 0.010.02 b ± 0.00
C2
fructose0.01 a ± 0.000.01 a ± 0.000.01 a ± 0.000.01 a ± 0.000.01 a ± 0.00
glucose0.04 a ± 0.010.04 a ± 0.020.04 a ± 0.000.04 a ± 0.020.04 a ± 0.00
galactose0.35 a ± 0.030.31 a ± 0.030.26 a,b ± 0.010.23 a,b ± 0.030.22 b ± 0.01
maltose0.00 a ± 0.000.00 a ± 0.000.00 a ± 0.000.00 a ± 0.000.00 a ± 0.00
sucrose0.35 a ± 0.020.34 a ± 0.030.33 a,b ± 0.030.32 a,b ± 0.020.28 b ± 0.02
lactose2.54 a ± 0.131.93 a ± 0.112.23 a ± 0.121.56 a ± 0.091.73 a ± 0.10
raffinose0.35 a ± 0.020.34 a ± 0.030.34 a ± 0.030.33 a ± 0.020.34 a ± 0.05
stachyose0.04 a ± 0.010.05 a ± 0.010.05 a ± 0.000.05 a ± 0.010.04 a ± 0.01
D2
fructose0.01 a ± 0.000.01 a ± 0.000.01 a ± 0.000.01 a ± 0.000.01 a ± 0.01
glucose0.05 a ± 0.010.06 a ± 0.010.05 a ± 0.020.04 a ± 0.000.04 a ± 0.01
galactose0.38 a ± 0.030.43 b ± 0.030.43 b ± 0.020.41 a,b ± 0.020.37 a ± 0.03
maltose0.00 a ± 0.000.00 a ± 0.000.00 a ± 0.000.00 a ± 0.000.00 a ± 0.00
sucrose0.28 a ± 0.020.29 a ± 0.020.27 a,b ± 0.020.25 a,b ± 0.020.22 b ± 0.02
lactose1.20 a ± 0.071.65 a ± 0.081.74 a ± 0.101.30 a ± 0.080.90 a ± 0.06
raffinose0.31 a ± 0.020.32 a ± 0.030.33 a ± 0.030.33 a ± 0.030.32 a ± 0.04
stachyose0.03 a ± 0.010.03 a ± 0.010.03 a ± 0.010.03 a ± 0.010.03 a ± 0.00
E2
fructose0.01 a ± 0.000.01 a ± 0.000.01 a ± 0.000.01 a ± 0.000.01 a ± 0.01
glucose0.05 a ± 0.010.04 a ± 0.010.05 a ± 0.010.04 a ± 0.010.05 a ± 0.02
galactose0.54 a ± 0.040.54 a ± 0.040.55 a ± 0.050.52 a ± 0.000.52 a ± 0.01
maltose0.00 a ± 0.000.00 a ± 0.000.00 a ± 0.000.00 a ± 0.000.00 a ± 0.00
sucrose0.22 a,b ± 0.020.25 a ± 0.020.23 a,b ± 0.020.22 a,b ± 0.010.20 b ± 0.03
lactose1.04 a ± 0.060.84 a ± 0.050.87 a ± 0.051.40 a ± 0.080.89 a ± 0.02
raffinose0.28 a ± 0.010.28 a ± 0.020.26 a ± 0.030.28 a ± 0.030.26 a ± 0.01
stachyose0.03 a ± 0.010.04 a ± 0.010.04 a ± 0.000.03 a ± 0.010.03 a ± 0.00
F2
fructose0.01 a ± 0.000.01 a ± 0.000.01 a ± 0.010.01 a ± 0.000.01 a ± 0.00
glucose0.04 a ± 0.010.05 a ± 0.020.05 a ± 0.010.04 a ± 0.010.04 a ± 0.01
galactose0.49 a ± 0.040.53 a ± 0.050.47 a,b ± 0.050.45 b ± 0.050.46 a,b ± 0.03
maltose0.00 a ± 0.000.00 a ± 0.000.00 a ± 0.000.00 a ± 0.000.00 a ± 0.00
sucrose0.28 a ± 0.020.28 a ± 0.030.26 a,b ± 0.010.26 a,b ± 0.020.23 b ± 0.02
lactose1.83 a ± 0.100.56 a ± 0.041.37 a ± 0.080.81 a ± 0.061.06 a ± 0.06
raffinose0.45 a ± 0.020.43 a ± 0.020.41 a ± 0.020.44 a ± 0.020.46 a ± 0.02
stachyose0.02 a ± 0.000.02 a ± 0.000.02 a ± 0.010.02 a ± 0.000.03 a ± 0.01
Legend: a,b—The average values in rows labeled with the same letter are not significantly different at α < 0.05.
Table 4. Sugar content [g/100 g] of fermented oat beverage samples during cold storage.
Storage Time [Day]0 7 14 21 28
A3
fructose0.01 a ± 0.000.01 a ± 0.000.01 a ± 0.000.01 a ± 000.01 a ± 0.00
glucose0.02 a ± 0.000.03 a ± 0.000.02 a ± 0.000.02 a ± 0.010.02 a ± 0.01
maltose0.00 a ± 0.000.00 a ± 0.000.00 a ± 0.000.00 a ± 0.000.00 a ± 0.00
sucrose0.54 a ± 0.040.47 a ± 0.020.41 b ± 0.030.39 b ± 0.030.35 c ± 0.03
raffinose0.81 a ± 0.030.81 a ± 0.060.58 a ± 0.050.55 a ± 0.040.60 a ± 0.05
stachyose0.06 a,b ± 0.010.06 a,b ± 0.010.07 a ± 0.010.05 c ± 0.010.06 a,b ± 0.01
B3
fructose0.01 a ± 0.000.01 a ± 0.000.01 a ± 0.000.01 a ± 0.000.02 a ± 0.01
glucose0.02 a ± 0.010.03 a ± 0.000.02 a ± 0.010.02 a ± 0.020.02 a ± 0.01
maltose0.00 a ± 0.000.00 a ± 0.000.00 a ± 0.000.00 a ± 0.000.00 a ± 0.00
sucrose0.46 a ± 0.020.46 a ± 0.030.46 a ± 0.030.40 b ± 0.030.39 b ± 0.03
raffinose0.48 a ± 0.020.52 a ± 0.040.52 a ± 0.030.51 a ± 0.050.47 a ± 0.03
stachyose0.06 a ± 0.010.06 a ± 0.000.06 a ± 0.010.03 b ± 0.010.04 b ± 0.00
C3
fructose0.01 a ± 0.000.01 a ± 0.000.01 a ± 0.000.01 a ± 0.000.01 a ± 0.00
glucose0.03 a ± 0.000.04 a ± 0.010.04 a ± 0.010.03 a ± 0.010.02 b ± 0.01
maltose0.00 a ± 0.000.00 a ± 0.000.00 a ± 0.000.00 a ± 0.000.00 a ± 0.00
sucrose0.55 a ± 0.040.51 a ± 0.040.50 a ± 0.050.45 b ± 0.050.35 c ± 0.06
raffinose0.52 a ± 0.040.51 a ± 0.040.51 a ± 0.040.50 a ± 0.030.51 a ± 0.02
stachyose0.08 a,b ± 0.010.09 a,b ± 0.010.10 a ± 0.010.09 a,b ± 0.010.07 b ± 0.02
D3
fructose0.02 a ± 0.000.01 a ± 0.010.02 a ± 0.010.02 a ± 0.010.01 a ± 0.00
glucose0.03 a ± 0.010.04 a ± 0.010.05 b ± 0.020.04 a ± 0.010.04 a ± 0.01
maltose0.00 a ± 0.000.00 a ± 0.000.00 a ± 0.000.00 a ± 0.000.00 a ± 0.00
sucrose0.51 a ± 0.040.43 a ± 0.030.41 b ± 0.030.38 b ± 0.050.27 c ± 0.03
raffinose0.47 a ± 0.040.48 a ± 0.040.50 a ± 0.030.50 a ± 0.040.48 a ± 0.02
stachyose0.06 a ± 0.010.06 a ± 0.020.06 a ± 0.010.06 a ± 0.020.07 b ± 0.01
E3
fructose0.01 a ± 0.000.01 a ± 0.000.01 a ± 0.000.01 a ± 0.000.01 a ± 0.00
glucose0.05 a ± 0.020.05 a ± 0.020.05 a ± 0.010.04 b ± 0.010.04 b ± 0.01
maltose0.00 a ± 0.000.00 a ± 0.000.00 a ± 0.000.00 a ± 0.000.00 a ± 0.00
sucrose0.33 a ± 0.020.31 a,b ± 0.040.28 b ± 0.010.27 a,b ± 0.010.25 b ± 0.02
raffinose0.34 a ± 0.030.35 a ± 0.030.32 a ± 0.020.34 a ± 0.030.31 a ± 0.03
stachyose0.07 a,b ± 0.010.07 a,b ± 0.010.08 a ± 0.010.06 b ± 0.000.06 b ± 0.01
F3
fructose0.01 a ± 0.000.01 a ± 0.000.01 a ± 0.000.02 a ± 0.010.01 a ± 0.01
glucose0.03 a ± 0.000.04 a ± 0.010.04 a ± 0.010.03 a ± 0.010.03 a ± 0.01
maltose0.00 a ± 0.000.00 a ± 0.000.00 a ± 0.000.00 a ± 0.000.00 a ± 0.00
sucrose0.48 a ± 0.020.48 a ± 0.020.42 a,b ± 0.030.42 a,b ± 0.040.38 b ± 0.03
raffinose0.68 a ± 0.030.40 a ± 0.020.23 a ± 0.040.43 a ± 0.040.30 a ± 0.04
stachyose0.05 a ± 0.020.03 b ± 0.010.05 a ± 0.010.04 a,b ± 0.010.05 a ± 0.01
Legend: a,b,c—The average values in rows labeled with the same letter are not significantly different at α < 0.05.
Table 5. Starter culture populations [log CFU/g] in fermented beverage samples during cold storage.
Storage Time [Day]0 7 14 21 28
Sample L. delbrueckii subsp. bulgaricus
A17.7 a ± 0.18.1 a ± 0.17.5 a ± 0.27.4 a ± 0.27.4 a ± 0.2
A28.0 a ± 0.27.6 a,b ± 0.27.2 b,c ± 0.26.9 c ± 0.16.9 c ± 0.1
A37.7 a ± 0.27.2 a ± 0.27.2 a ± 0.17.2 a ± 0.17.0 a ± 0.2
B17.0 a ± 0.17.1 a ± 0.17.5 a ± 0.17.0 a ± 0.26.8 a ± 0.1
B27.4 a ± 0.17.7 a ± 0.17.0 a ± 0.17.2 a ± 0.17.3 a ± 0.2
B37.9 a ± 0.27.6 a ± 0.27.4 a ± 0.27.6 a ± 0.17.3 a ± 0.2
E18.9 a ± 0.28.1 a ± 0.18.0 a,b ± 0.28.4 a ± 0.27.6 b ± 0.1
E28.6 a ± 0.17.9 b ± 0.28.0 a,b ± 0.18.5 a ± 0.28.0 a,b ± 0.2
E37.9 a ± 0.28.8 a ± 0.18.3 a ± 0.18.1 a ± 0.28.0 a ± 0.2
S. thermophilus
A17.9 a ± 0.17.9 a ± 0.18.1 a ± 0.27.9 a ± 0.27.6 a ± 0.2
A28.0 a ± 0.27.9 a ± 0.18.4 a ± 0.27.7 a ± 0.17.6 a ± 0.1
A38.9 a ± 0.29.1 a ± 0.28.9 a ± 0.28.7 a ± 0.28.2 a ± 0.2
B18.9 a ± 0.28.8 a ± 0.27.9 a,b ± 0.27.6 b ± 0.27.3 b ± 0.1
B28.9 a ± 0.28.8 a ± 0.28.9 a ± 0.28.6 a ± 0.28.5 a ± 0.2
B38.0 a ± 0.28.2 a ± 0.17.8 a ± 0.17.8 a ± 0.27.8 a ± 0.2
E17.8 a ± 0.27.6 a ± 0.17.6 a ± 0.27.1 a,b ± 0.16.9 b ± 0.2
E27.9 a ± 0.27.7 a ± 0.27.2 a ± 0.16.9 a ± 0.17.5 a ± 0.1
E38.1 a ± 0.27.7 a ± 0.27.4 a,b ± 0.16.9 b ± 0.17.0 a,b ± 0.2
L. plantarum 299v
B16.7 a ± 0.26.3 a ± 0.15.9 a,b ± 0.25.5 b ± 0.26.2 a ± 0.1
B26.2 a ± 0.16.3 a ± 0.15.5 a ± 0.25.6 a ± 0.25.8 a ± 0.2
B36.7 a ± 0.16.7 a ± 0.25.5 b ± 0.25.2 b ± 0.15.6 a,b ± 0.1
C16.2 a ± 0.16.9 a ± 0.25.8 a,b ± 0.25.7 b ± 0.15.7 b ± 0.2
C26.7 a ± 0.26.0 a,b ± 0.15.8 b ± 0.25.7 b ± 0.15.0 c ± 0.1
C36.7 a ± 0.26.3 a ± 0.26.0 a ± 0.15.7 b ± 0.25.9 a,b ± 0.2
L. acidophilus La-5
E17.8 a ± 0.26.9 b ± 0.27.0 a ± 0.26.9 b ± 0.16.0 b ± 0.1
E28.7 a ± 0.27.8 a,b ± 0.27.9 a ± 0.27.4 b ± 0.26.9 b ± 0.1
E38.1 a ± 0.18.5 a ± 0.28.0 a,b ± 0.27.5 b ± 0.26.7 c ± 0.2
F18.8 a ± 0.18.7 a ± 0.18.8 a ± 0.18.2 a,b ± 0.27.4 b ± 0.2
F28.4 a ± 0.27.9 a ± 0.28.1 a ± 0.28.1 a ± 0.17.8 a ± 0.1
F38.4 a ± 0.28.6 a ± 0.18.3 a,b ± 0.28.2 a,b ± 0.27.4 b ± 0.2
Legend: a,b,c—The average values in rows labeled with the same letter are not significantly different at α < 0.05.
Disclaimer/Publisher’s Note: The statements, opinions and data contained in all publications are solely those of the individual author(s) and contributor(s) and not of MDPI and/or the editor(s). MDPI and/or the editor(s) disclaim responsibility for any injury to people or property resulting from any ideas, methods, instructions or products referred to in the content.

