1. Introduction
Many studies have relied on the Magnetotelluric (MT) method to obtain subsurface information. Due to its broad frequency range, MT is capable of imaging both shallow and deep subsurfaces. While MT is widely recognized in geothermal exploration [
1,
2], it has also been applied in other fields such as mining [
3], hydrocarbon exploration [
4], crustal studies [
5,
6], and hydrogeological structures [
7,
8]. In Taiwan, only a limited number of MT studies have been conducted to investigate the deep subsurface structure, and most of them are of regional scale [
9,
10,
11]. Consequently, this study performs an MT survey concentrating on the northern Pingtung Plain, to resolve the deeper subsurface features of the Plain with higher resolution, thereby enhancing the overall characterization of its subsurface structure.
The Pingtung Plain is an alluvial area and a significant source of groundwater in Taiwan. Located at the active tectonic margin of the collision zone between the Luzon Arc and a sub-plate of the Eurasian plate, southwestern Taiwan experienced collision, uplifting in the mountain region, and subsidence in the Pingtung Plain [
12,
13,
14]. The Plain is primarily filled with Quaternary deposits, consisting of marine and alluvial materials from the late Pleistocene and Holocene epochs. These alluvial sediments are largely derived from the major rivers in the Plain (
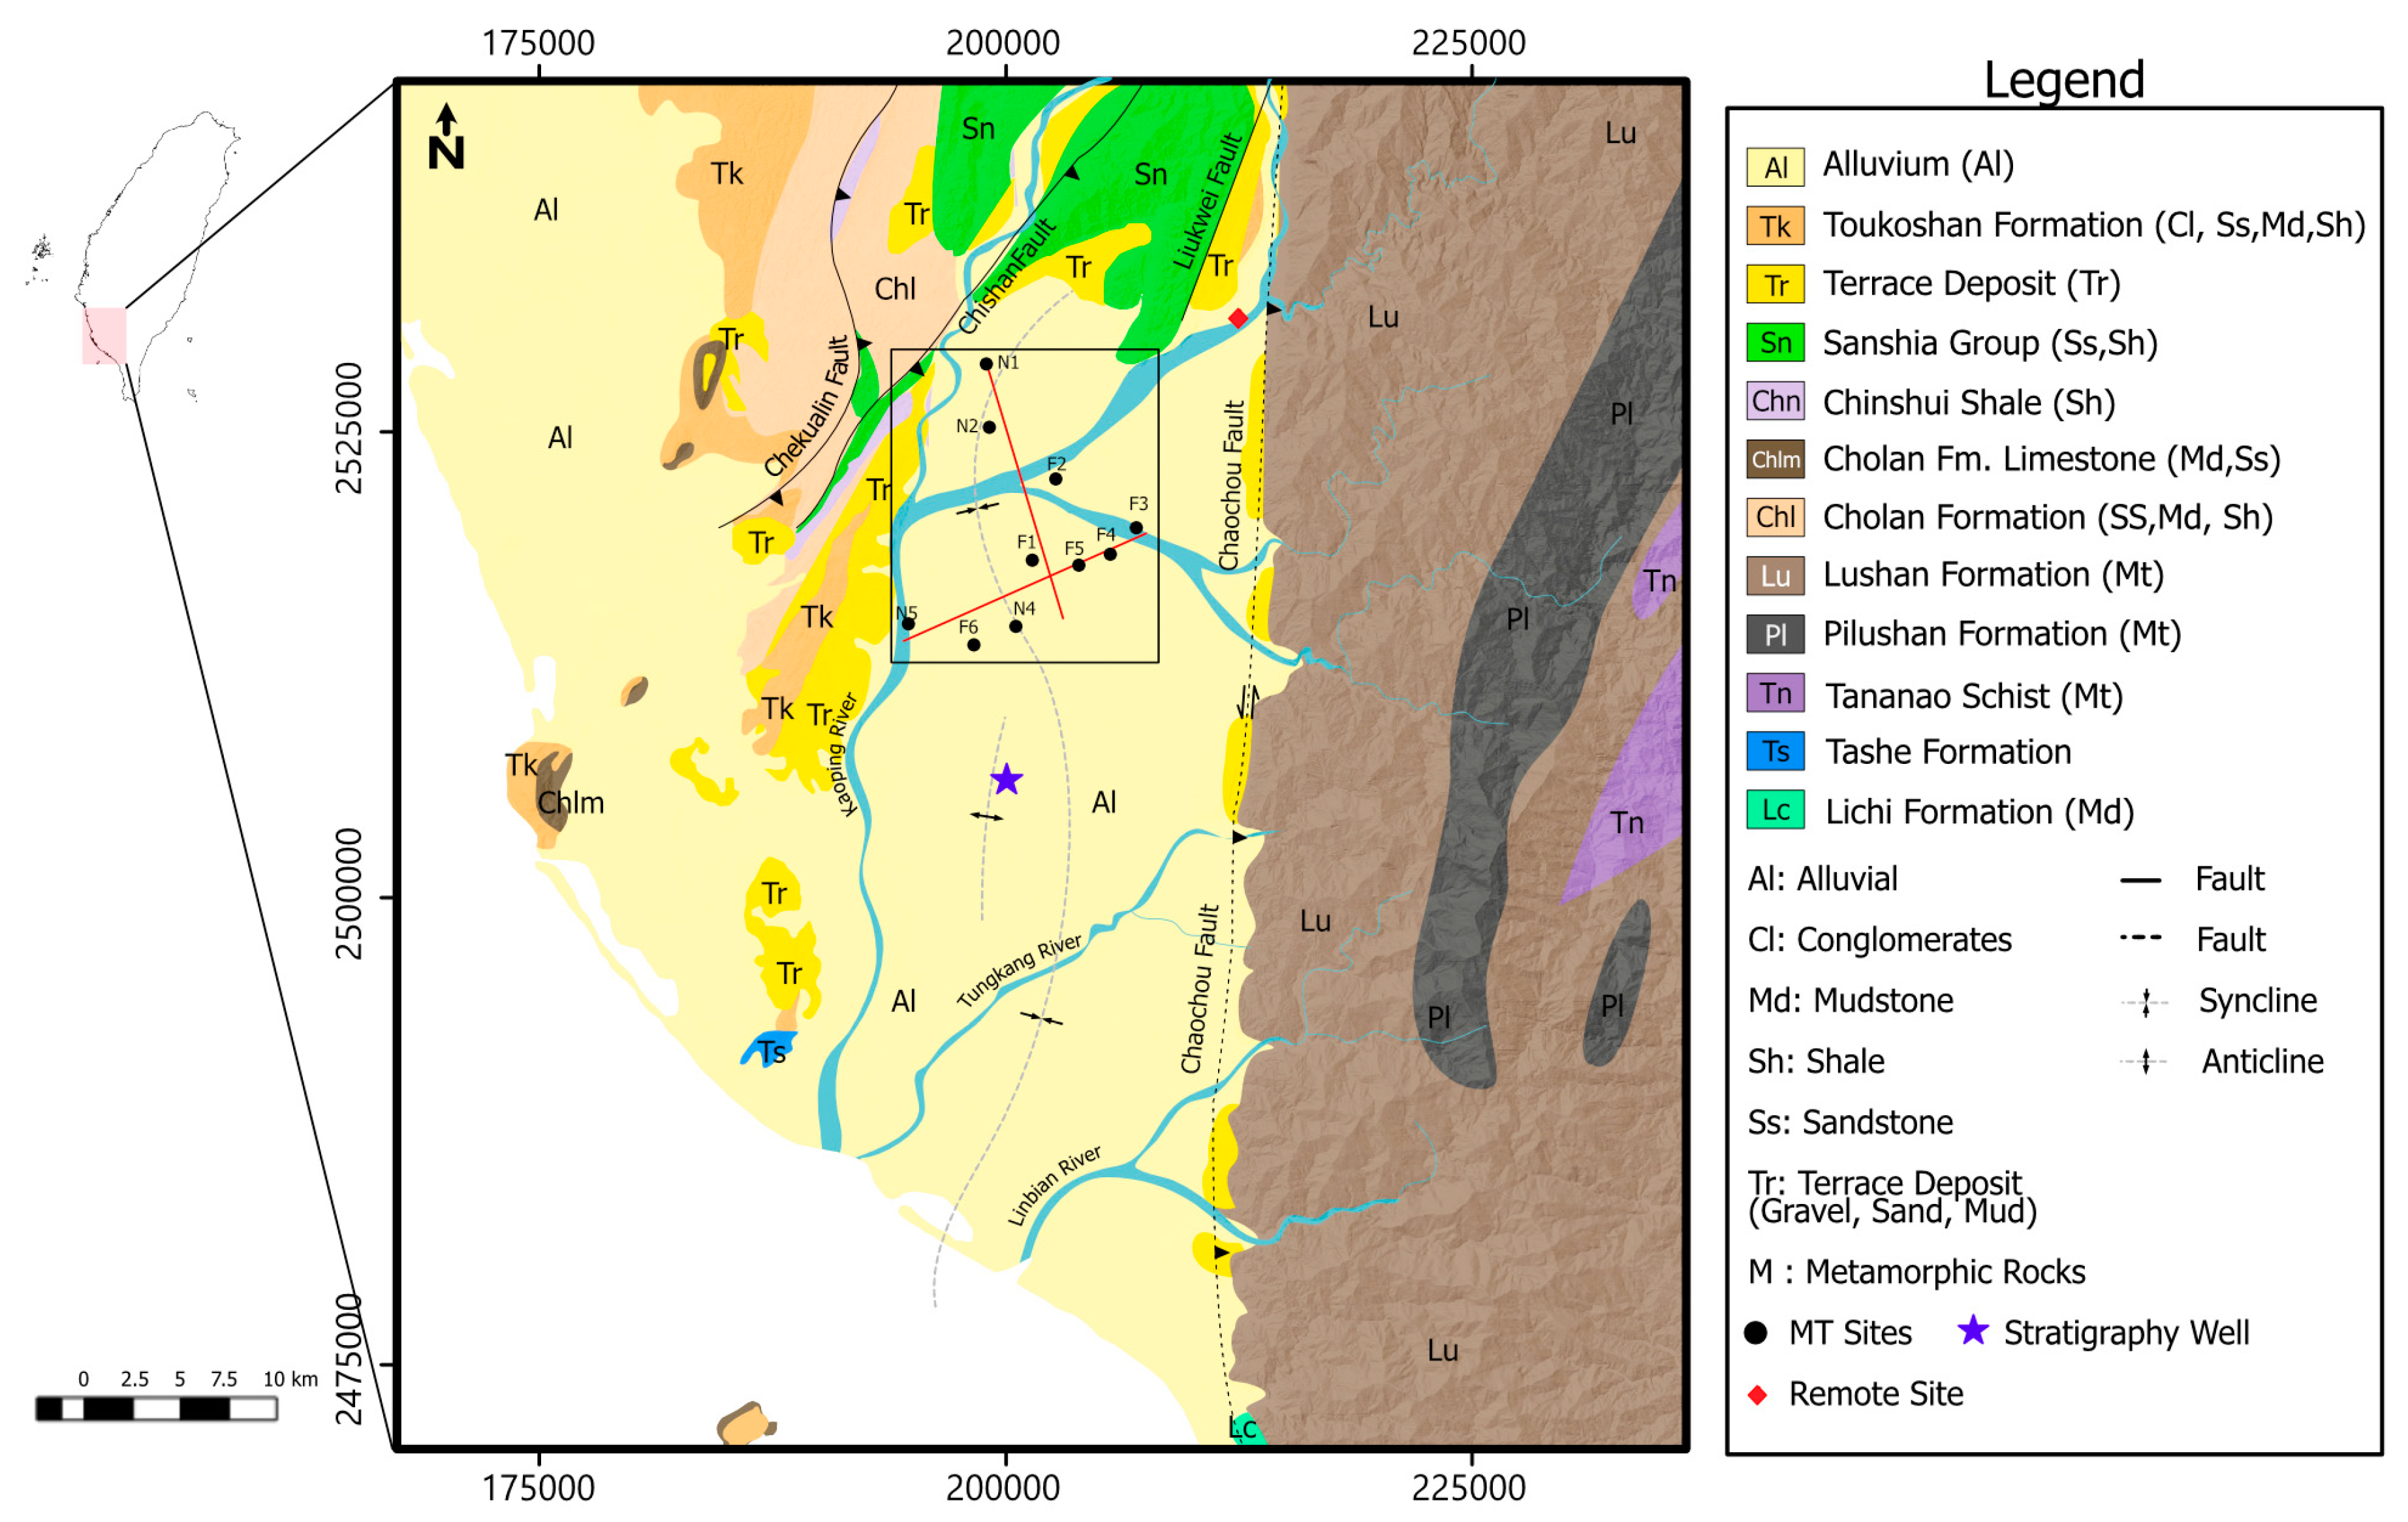
Figure 1), while the older, deeper sediments are likely from shallow marine environments that existed during the subduction of the oceanic plate.
GPS measurements indicate that the Pingtung Plain is rapidly subsiding, with the southern portion experiencing the greatest rates of subsidence. The subsidence is attributed to both tectonic extrusion and groundwater extraction [
15,
16,
17]. Gravity and magnetic studies reveal that the Plain is characterized by low gravity and magnetic anomalies, suggesting the presence of sediment-filled basins [
12,
18,
19,
20]. Seismic analyses further indicate that the Pingtung Plain is a low-velocity zone relative to its surrounding regions, reinforcing the idea of sediment accumulation [
21,
22,
23,
24]. Numerous boreholes have been drilled in the northern portion of the Plain, with depths ranging from 100 to 250 m. However, only a few studies have addressed the deeper subsurface structure. Consequently, there is a significant gap in data regarding the deeper extent of these subsurface formations.
The MT method has been used since the 1950s to image the Earth’s subsurface electrical structure by recording naturally occurring electromagnetic (EM) waves. The EM waves span a broad frequency range of 10
−4 to 10
4 Hz [
25]. This wide frequency band allows MT to achieve subsurface penetration of tens to hundreds of kilometers. The method assumes that the Earth only absorbs or dissipates the EM field, and it measures the time-varying electric field (
E) and magnetic field (
H) generated in the atmosphere and magnetosphere [
26]. Low-frequency signals (<1 Hz) are generated by magnetic storms resulting from the interaction of solar wind with the Earth’s
H in the magnetosphere. In contrast, higher-frequency signals (>1 Hz) originate from a small fraction of the energy produced by worldwide lightning activity.
The transfer function in MT data is represented by the impedance (
Z), which reflects the Earth’s response to EM induction and carries information about subsurface resistivity. The impedance (
Z) is linearly related to the orthogonal horizontal
E and
H, as expressed in the following equation:
Each tensor element can be presented as:
where
i and
j are the field components
x and
y, respectively. In the 2D Earth model,
x is assumed to be parallel to the strike and
y is perpendicular to the strike. This gives rise to two polarization modes of MT: Transverse Electric (TE) and Transverse Magnetic (TM). TE is the polarization where
E is parallel to the strike, while TM is where
H is parallel to the strike. In TM mode, the measured
E is perpendicular to the strike. The current is flowing across the boundary between the different media. The heterogeneity of the medium will cause the electric charge to gather on the interface, thus causing
E discontinuity in the lateral direction. Therefore, the TM mode normally provides a better resolution for interfaces between different resistivity zones. In contrast, TE mode is measured where the current flows along the strike and may omit the interface; thus, it will carry less information about lateral inhomogeneity. TE mode can provide a better image laterally compared to TM mode because the current flows continuously along the strike. Electric current interacts more strongly with conductive material than resistive material; thus, the response of the TE mode will be more affected if any conductive layer is present. Prior to any knowledge of strike,
x is usually associated with north–south, while
y is associated with east–west of geographical coordinates during the MT field survey.
The impedance
Z is a complex number, where one can derive two values: (1) apparent resistivity (
) and (2) phase (
φ). The resistivity information can be derived from
Z in the form of:
where
ω is the angular frequency and
is the magnetic permeability of free space (4π × 10
−7 H/m). The
E and
H components will have a phase difference
φ of:
In the assumed homogeneous Earth, the apparent resistivity reflects the true resistivity, and the phase value is 45°. An increase in resistivity corresponds to a phase decrease below 45°. Meanwhile, a decrease in resistivity will have a larger phase over 45°. EM waves that penetrate the Earth experience an amplitude attenuation as the depth increases, and used to estimate the skin depth (
δ), also known as penetration depth. This parameter represent the distance that the signals diffuse as a function of period
T:
that can be simplified into:
2. Noise in Magnetotelluric Survey
Aside from its many advantages, one of the crucial drawbacks of MT method is how it is prone to electromagnetic interference (EMI) or noise. The natural EM field recorded in the MT survey is quite weak and easily affected by noise. Many sources can contribute to noise perceived in the MT survey, but cultural or man-made noises are what cause severe distortion in the transfer function estimation. Cultural noise sources such as power lines, automobiles, transmission networks, mobile devices, and many other EM devices can severely affect the signal quality, thus affecting the MT impedance tensor estimation and potentially leading to unreliable results. Noise issues have been a long-standing concern of the MT community and have been extensively studied in previous research [
27,
28], yet they continue to present challenges.
Many MT surveys suffer from the presence of such EMI, and finding ideal MT sites in the environment where rapid urban development occurs is challenging. For example, the MT survey carried out in Pohang suffered near-field noise effects at their MT stations [
29]. They set up far-remote reference stations, located 60–500 km from their observation sites to reduce the noise effect in their estimation. Another survey faced the same issue and explored various processing approaches to determine the parameters that are best suited for data processing. They also combined several other methods to denoise the data, including Remote Reference [
30].
To deal with the noise in our data, we also use the Remote Reference (RR) Method [
31]. RR has been around for decades and remains the most widely used method in the industry as a way of minimizing the noise impact on MT data. Since its development, this method has been used by many researchers to support MT studies to this day [
29,
30,
32]. The idea is to set up a station at a distance from the target station where the noise is assumed to be uncorrelated. The recording requires a synchronous recording of the remote site and the target site. The
H of the remote reference station is then retrieved and used during the impedance tensor calculation as follows:
where
D is:
This will result in an unbiased impedance tensor as long as the noise between the local and remote sites is uncorrelated.
H*xr and
H*yr are the complex conjugates of the remote site
H. In this study, remote reference processing is carried out using Bounded Influence Remote Reference Processing (BIRRP) through the open-source MT python toolbox MTPy [
33,
34].
3. Geological Setting
The geological setting of the study area is presented in
Figure 1. The Pingtung Plain extends over 1000 km southward toward the Taiwan Strait, bordered by two major faults. The Chishan Fault, a northeast–southwest trending thrust fault, forms the western boundary. Meanwhile, the Chaochou Fault, a high-angle fault trending north to south, marks the eastern boundary, separating the Plain from the Central Mountain Range. The Chaochou Fault continues southward, extending beyond the land into the offshore area. The uplift along the Chaochou Fault is considered a key factor in the sediment transport from the eroded Central Mountain Range into the Pingtung Plain.
Sediment types in the Pingtung Plain range from fluvial deposits to marine sediments, spanning the Holocene to Miocene epochs. The surface is predominantly covered by Holocene alluvium, which overlies Pleistocene sediments. These Quaternary sediments form the water-bearing aquifers and aquitards of the Plain. Hydrogeological studies indicate that the aquifer system is notably thick, with aquifers primarily composed of gravel and sand from the continental sequence. In contrast, the aquitard, primarily made of silt and clay from the marine sequence, is mostly found in the distal fan region [
35,
36].
Stratigraphical records, as presented in
Table 1 [
13,
37,
38,
39,
40], show that the Holocene alluvium is relatively thin. It overlies the Pleistocene conglomerates consisting of loose sediments, predominantly pebbles and cobbles. Below these are Neogene sediments, including the early-to-late Pliocene Nanshilun Sandstone, which consists of medium-to-coarse-grained sandstone with slate fragments. The Nanshilun Sandstone formation overlies the Kaitzuliao Shale, a deep marine mudstone interbedded with sandstone. The Pliocene rocks are considered the bedrock of the Plain, deepening from north to south [
41,
42,
43]. The Wushan Formation, which consists of Miocene very fine-grained sandstone and mudstone interbedded with shale from shallow marine environments, is present below this layer.
4. Data Acquisition and Analysis
A total of 11 MT stations were obtained during the survey, including 10 observation stations in the northern Pingtung Plain, divided into two profiles trending NW-SE and NE-SW, and one remote reference station located in Meinong Hills, approximately 15–20 km away from the local stations. Survey locations are depicted in
Figure 1. The data were collected using Earth Data EDR-210 Multichannel data logger, manufactured by Earth Data Division of Kenda Electronic Systems from Southampton, UK, which offers a wide sampling rate from 1 to 3000 Hz. Our data were sampled at 500 Hz. The
H was measured using Bartington Mag-03MSESL 100 and Mag639 fluxgate magnetometer (Bartington, Witney, UK), a low-noise level magnetometer that can be operated to measure the
H in the range of ±100 µT. We used a Lead-Lead-Chloride (Pb-PbCl2) non-polarized electrode to measure the potential difference. The electric field and the potential difference are related through the following equation:
where
E is the electric field,
U is the potential difference, and
d is the dipole length. Dipole length is the separation of each coupled porous pot sensor. Most of the stations are recorded using the cross-configuration with a 50 m dipole length, where a pair of electrodes are aligned north–south (
x) and another pair aligned east–west (
y). In the condition where space is limited, the configuration is adjusted into L configuration.
4.1. Time Series Analysis
We recorded data for approximately 17 to 24 h at each station. However, not all of the measured data could be used due to persistent noise, particularly during the daytime when urban activities are at their peak. After reviewing the time series segment, we chose to focus only on the data collected at midnight, as these segments have comparatively lower levels of noise.
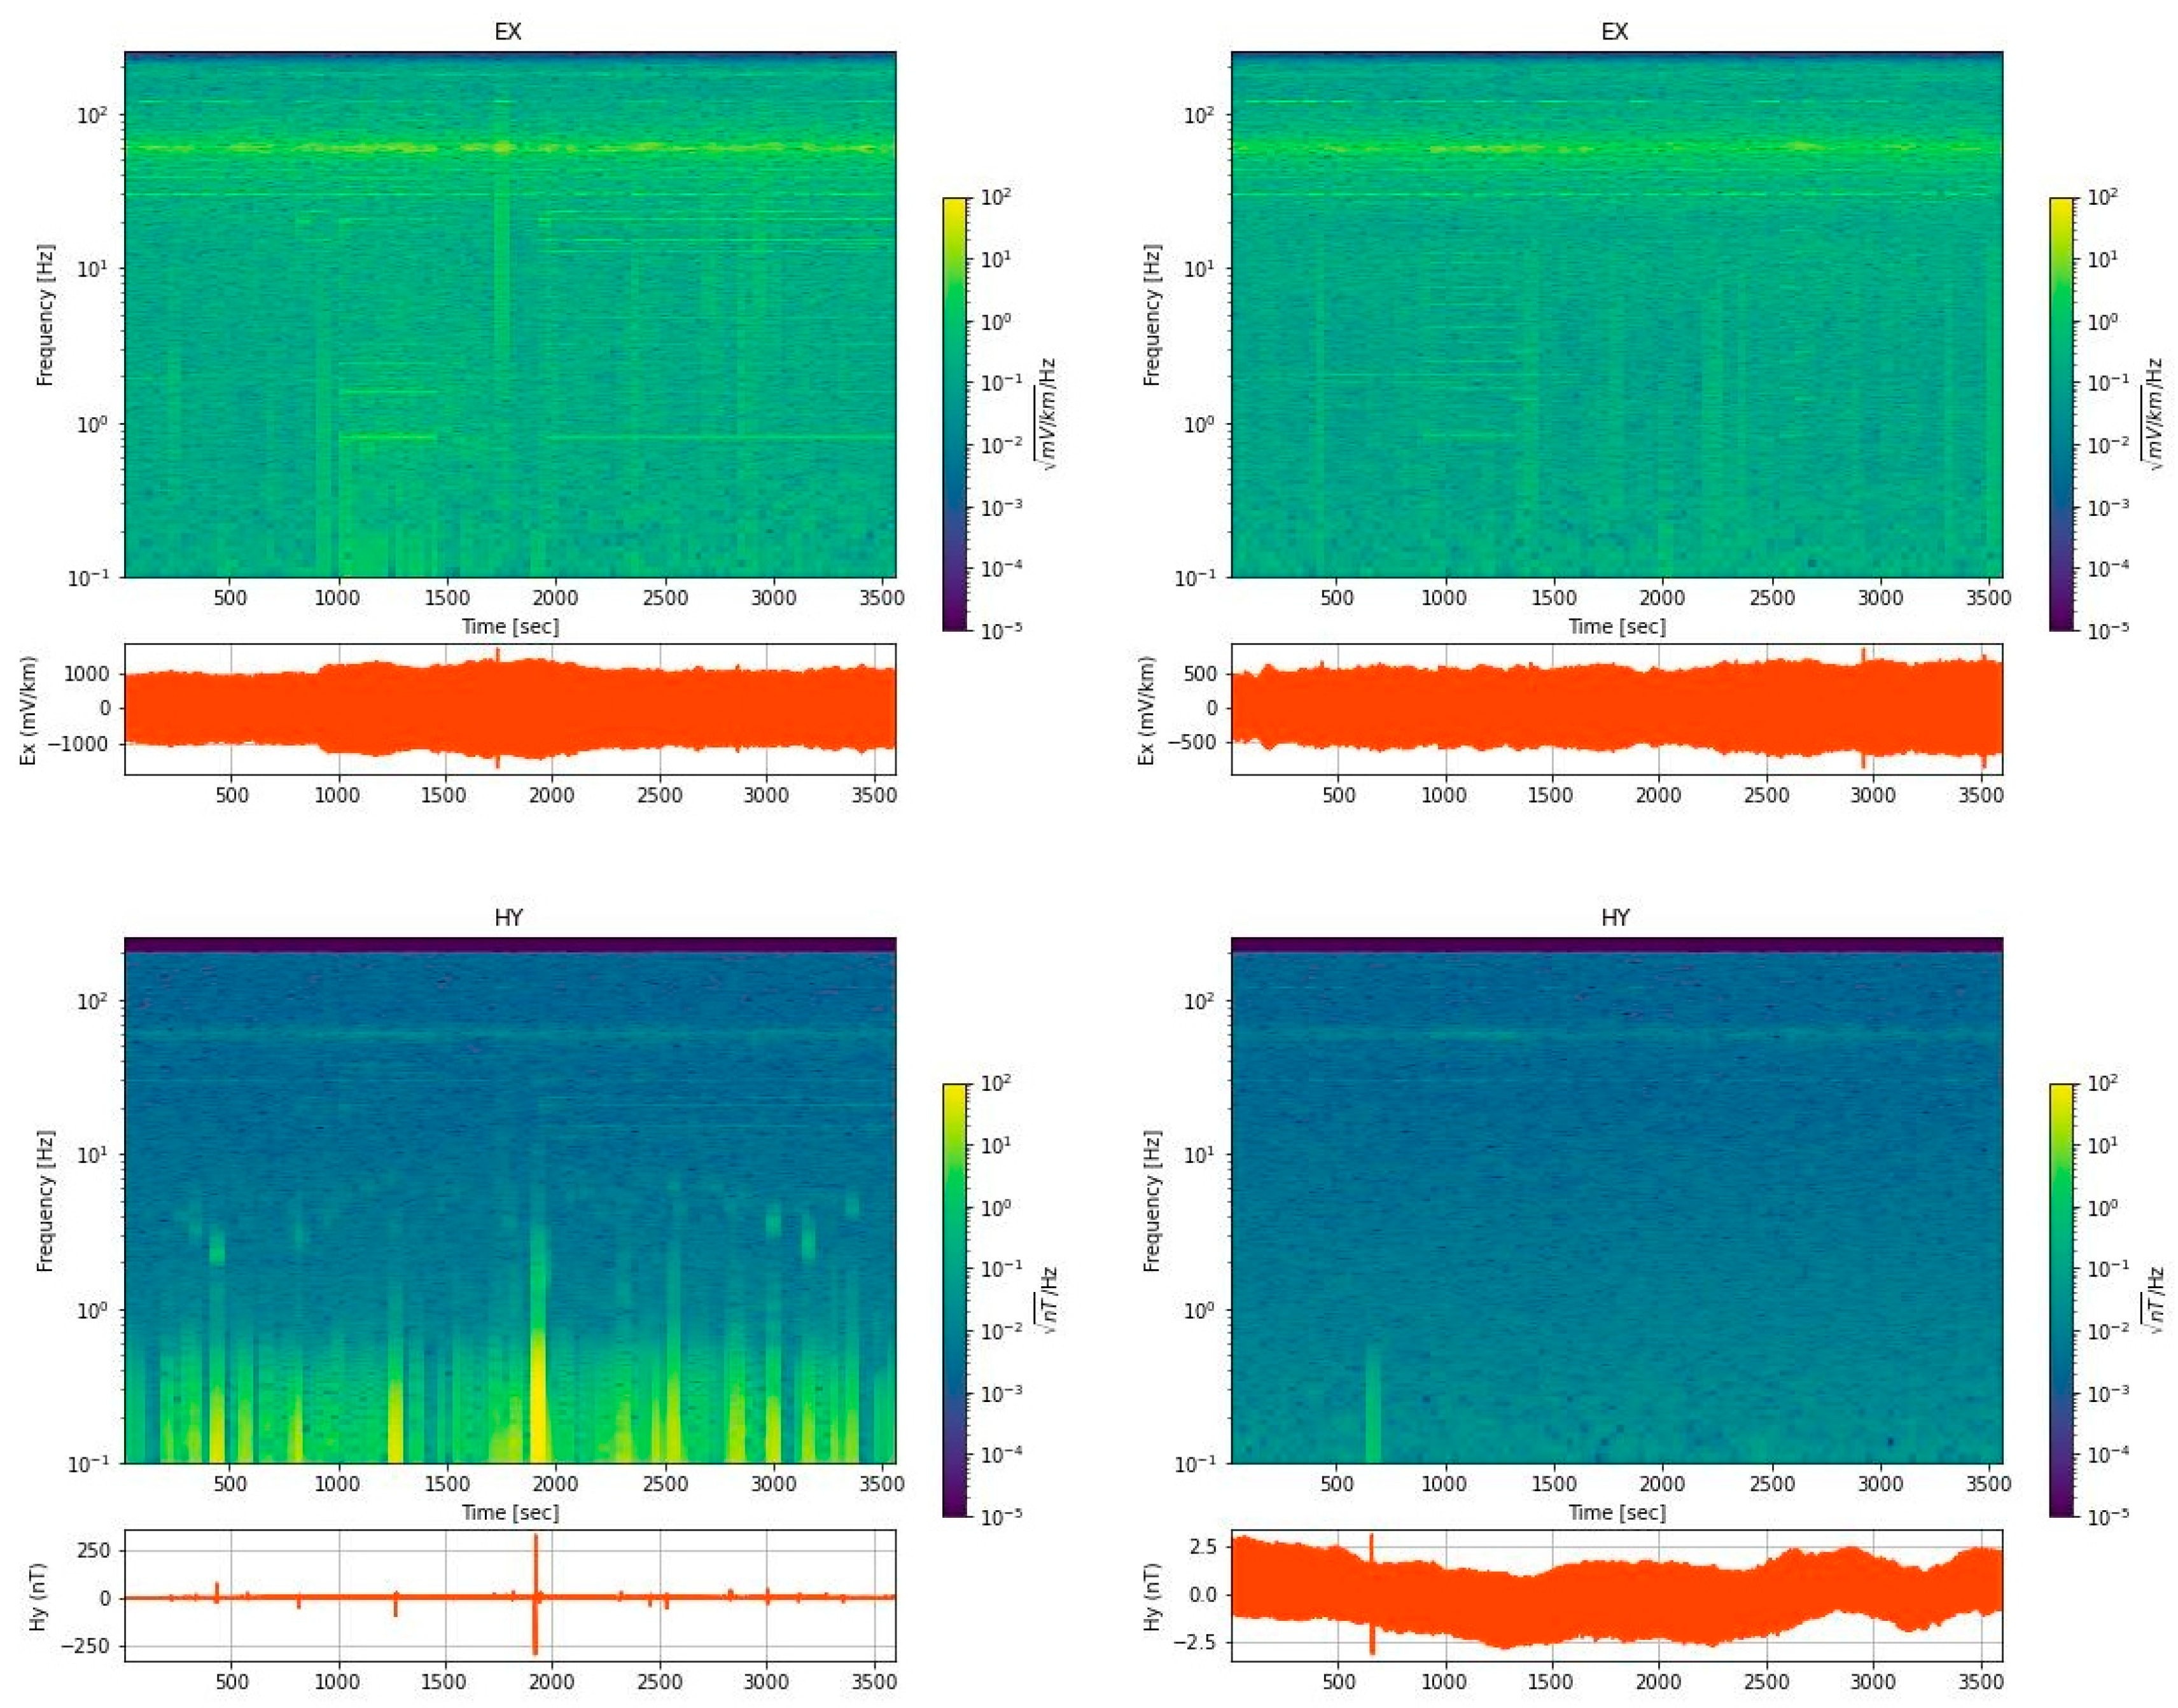
Figure 2 compares the orthogonal EM fields recorded during daytime (07:00–07:59) and nighttime (02:00–02:59). The north–south
E component (
Ex) measured during the daytime fluctuated around ±1000 mV/km, whereas at night, the magnitude was reduced by approximately half, to ±500 mV/km. In the
Hy component, the
H perpendicular to
Ex, showed similar values, typically around ±2.5 nT. However, we observed significant disturbances in the daytime data, particularly spikes in the time series, along with strong power extending across a broad frequency range in the spectrogram. These are commonly attributed to moving vehicles [
44], with the magnitude and frequency range of the disturbance varying depending on factors such as vehicle size and speed. In contrast, such disturbances were minimal during the night, except for one brief anomaly at 660 s. The 60 Hz powerline signal was observable in both daytime and nighttime data, which can be removed using a notch filter. To reduce the impact of the random noise, we applied remote reference processing, incorporating data from a synchronized remote station located away from the noise source.
4.2. The Transfer Function
As mentioned in
Section 2, a remote reference station was implemented to mitigate noise effects in our data. Based on the transfer curves (
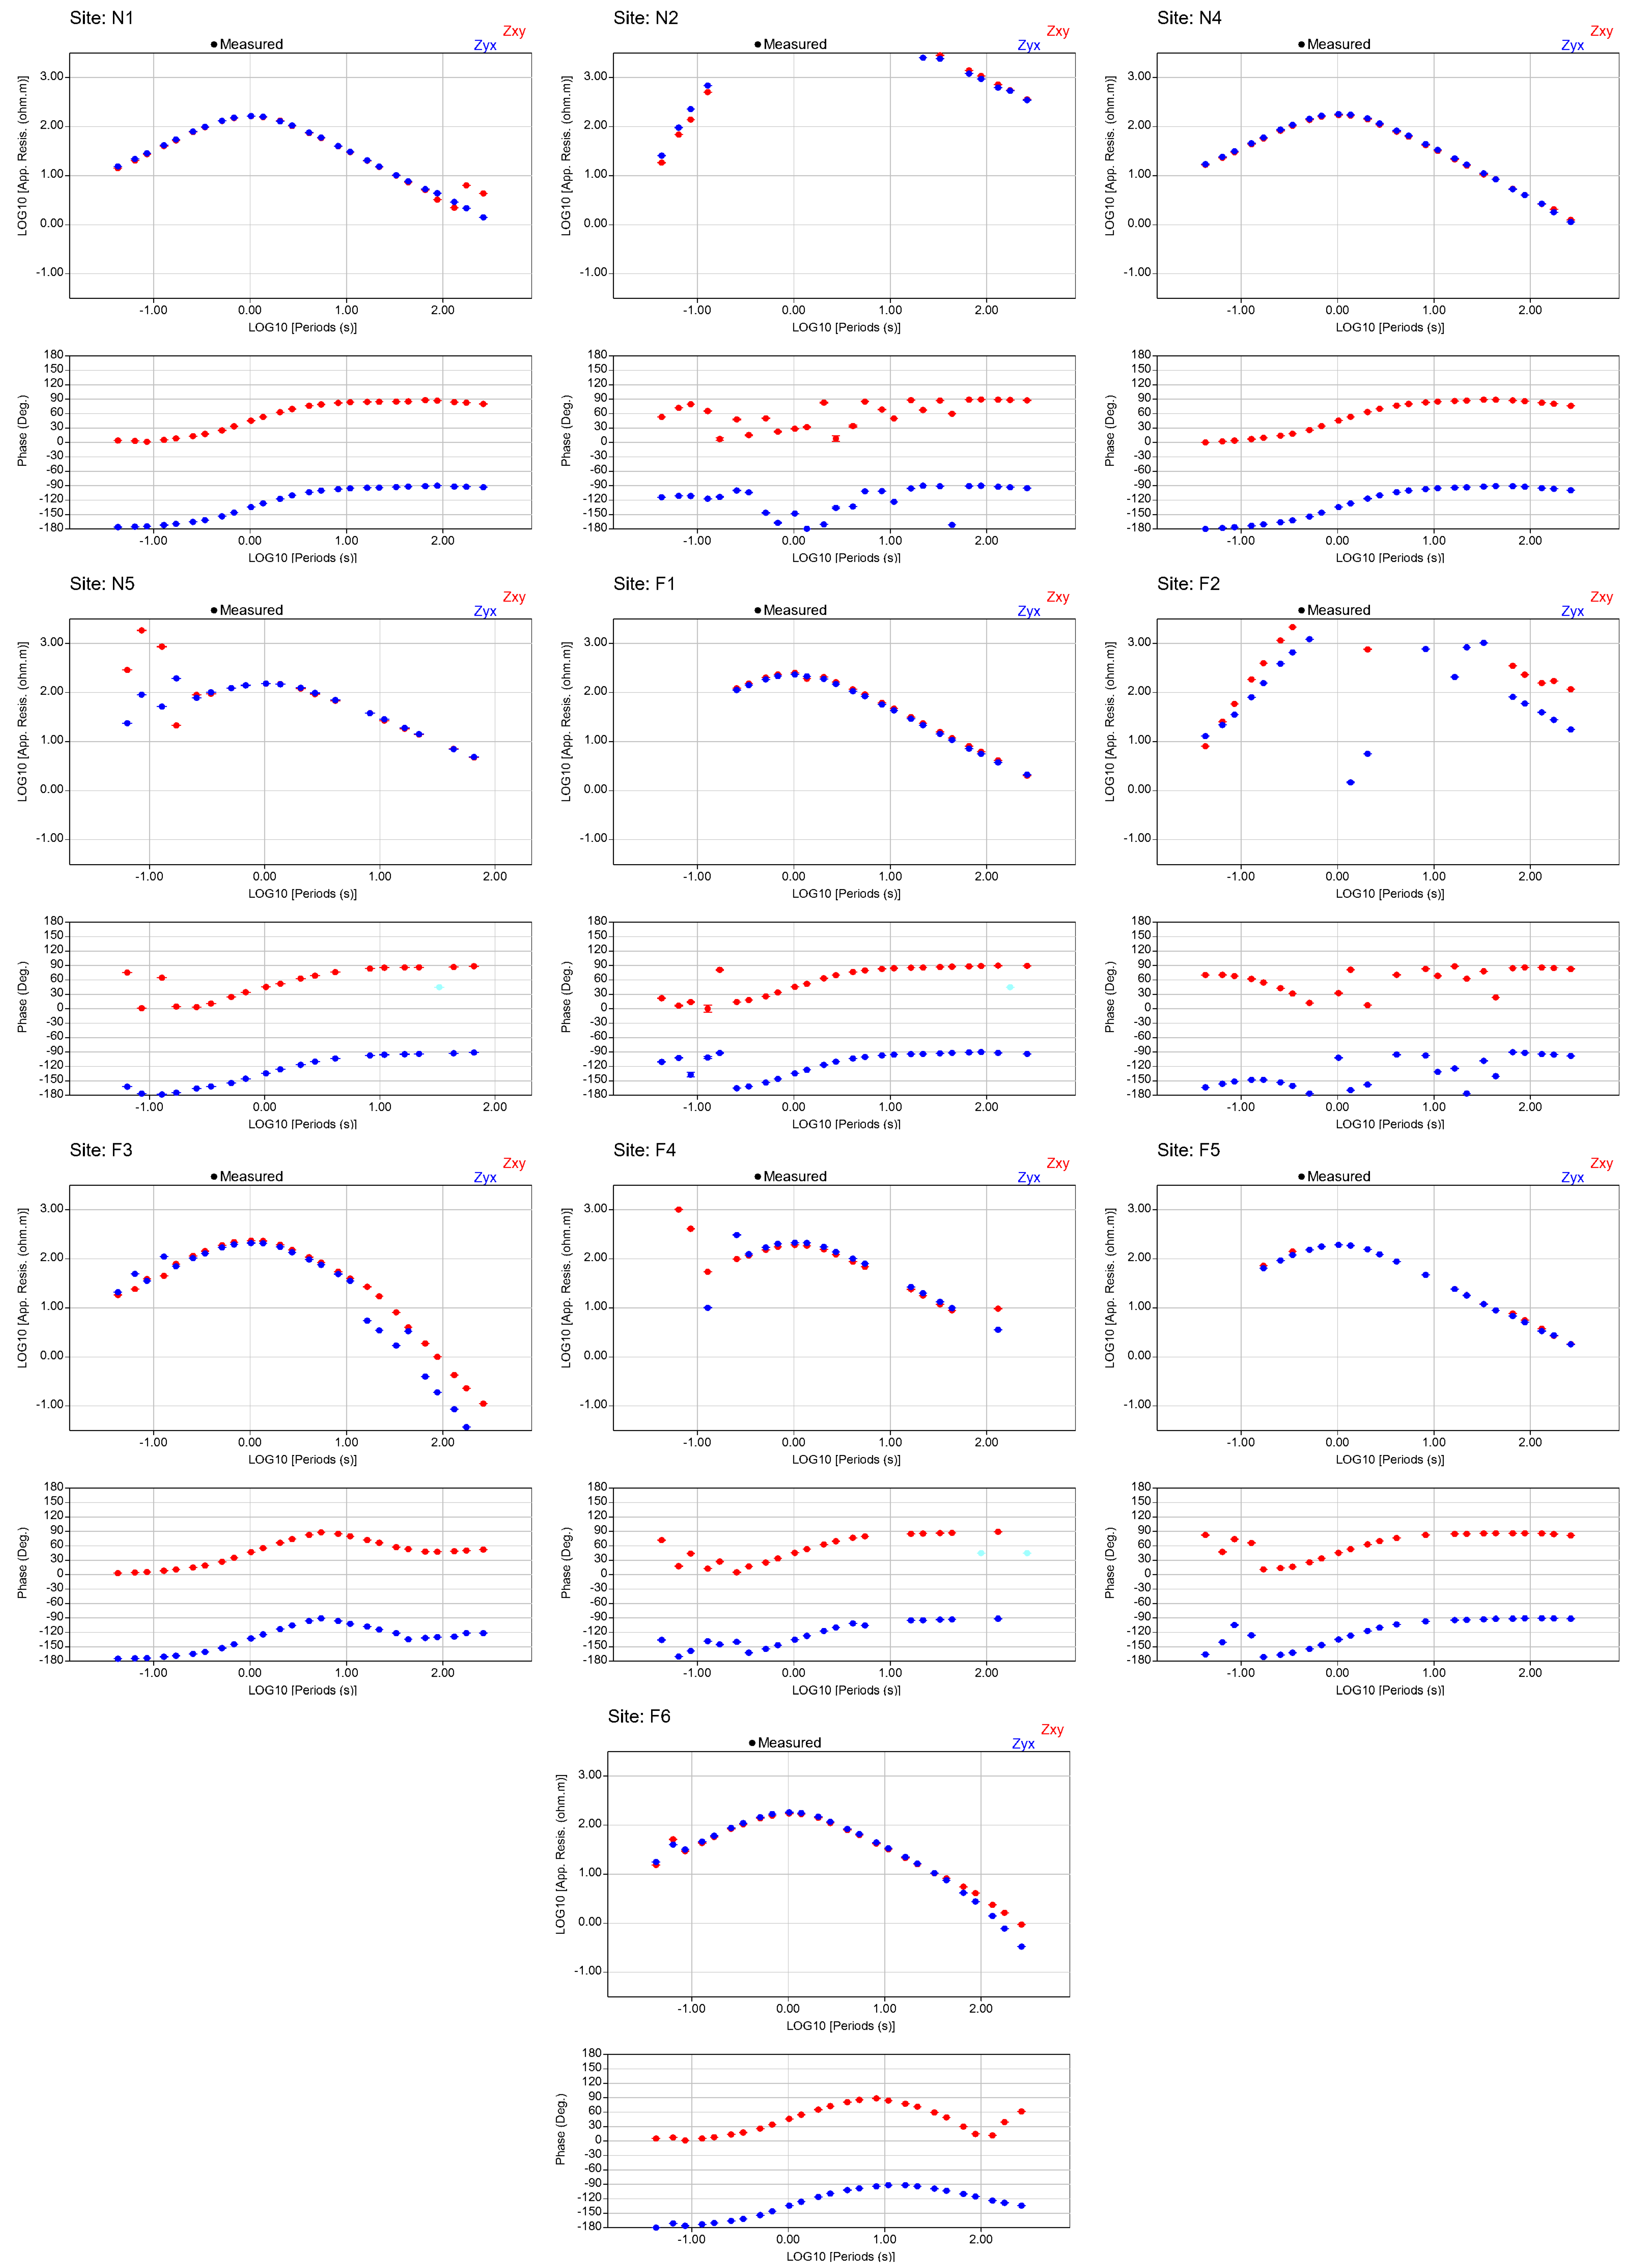
Figure 3), most observation stations exhibit similar characteristics. At short periods, the apparent resistivity is around tens of Ohm-m, increasing to approximately 200 Ohm-m at a period of about 1 s. At longer periods, the apparent resistivity decreases to below 10 Ohm-m. This decrease is accompanied by an increase in phase values, suggesting the presence of a low-resistivity layer at greater depths. The transfer function results indicate that the subsurface below the study area consists of a low-resistivity near-surface layer, which overlies a higher-resistivity layer, followed by another low-resistivity layer at greater depth. However, high-frequency (short-period) data appear to be affected by scattering due to noise. For example, stations F1 and F5 show values that are out of range. Additionally, stations N2 and F2 exhibit significant scattering in the dead-band frequency range, from approximately 1 s to around 10 s.
4.3. Dimensionality and Strike Analysis
Dimensionality analysis provides valuable insights into the dimensionality and strike direction of the underlying subsurface structure. Understanding whether the subsurface is 1D, 2D, or 3D is crucial for selecting the appropriate modeling approach. Dimensionality analysis can be performed in several ways, one of which involves using the phase tensor (PT), which is less sensitive to galvanic distortion [
45].
The phase tensor can be represented graphically by PT ellipses, which contain three key pieces of information: the minimum phase (ϕ
min), the maximum phase (ϕ
max), and the skew angle (β). The values of ϕ
min and ϕ
max define the shape of the ellipses, indicating the likely direction of the geoelectrical strike. The shape of the PT ellipses also provides insights into the dimensionality of the structure: they are perfectly circular for 1D structures and elongated for 2D or 3D structures. The PT skew angle (β) is another measure of dimensionality, quantifying the asymmetry of the phase tensor. A perfectly 1D condition typically has a β value of zero, while larger β values indicate higher-dimensional structures. For 2D conditions, β = 0 is necessary, but not sufficient. The commonly suggested threshold for a 2D condition is β ±3, though β ±5 is often used due to field conditions [
46,
47,
48]. For our analysis, we set the maximum threshold for β at ±5 to define a 2D condition.
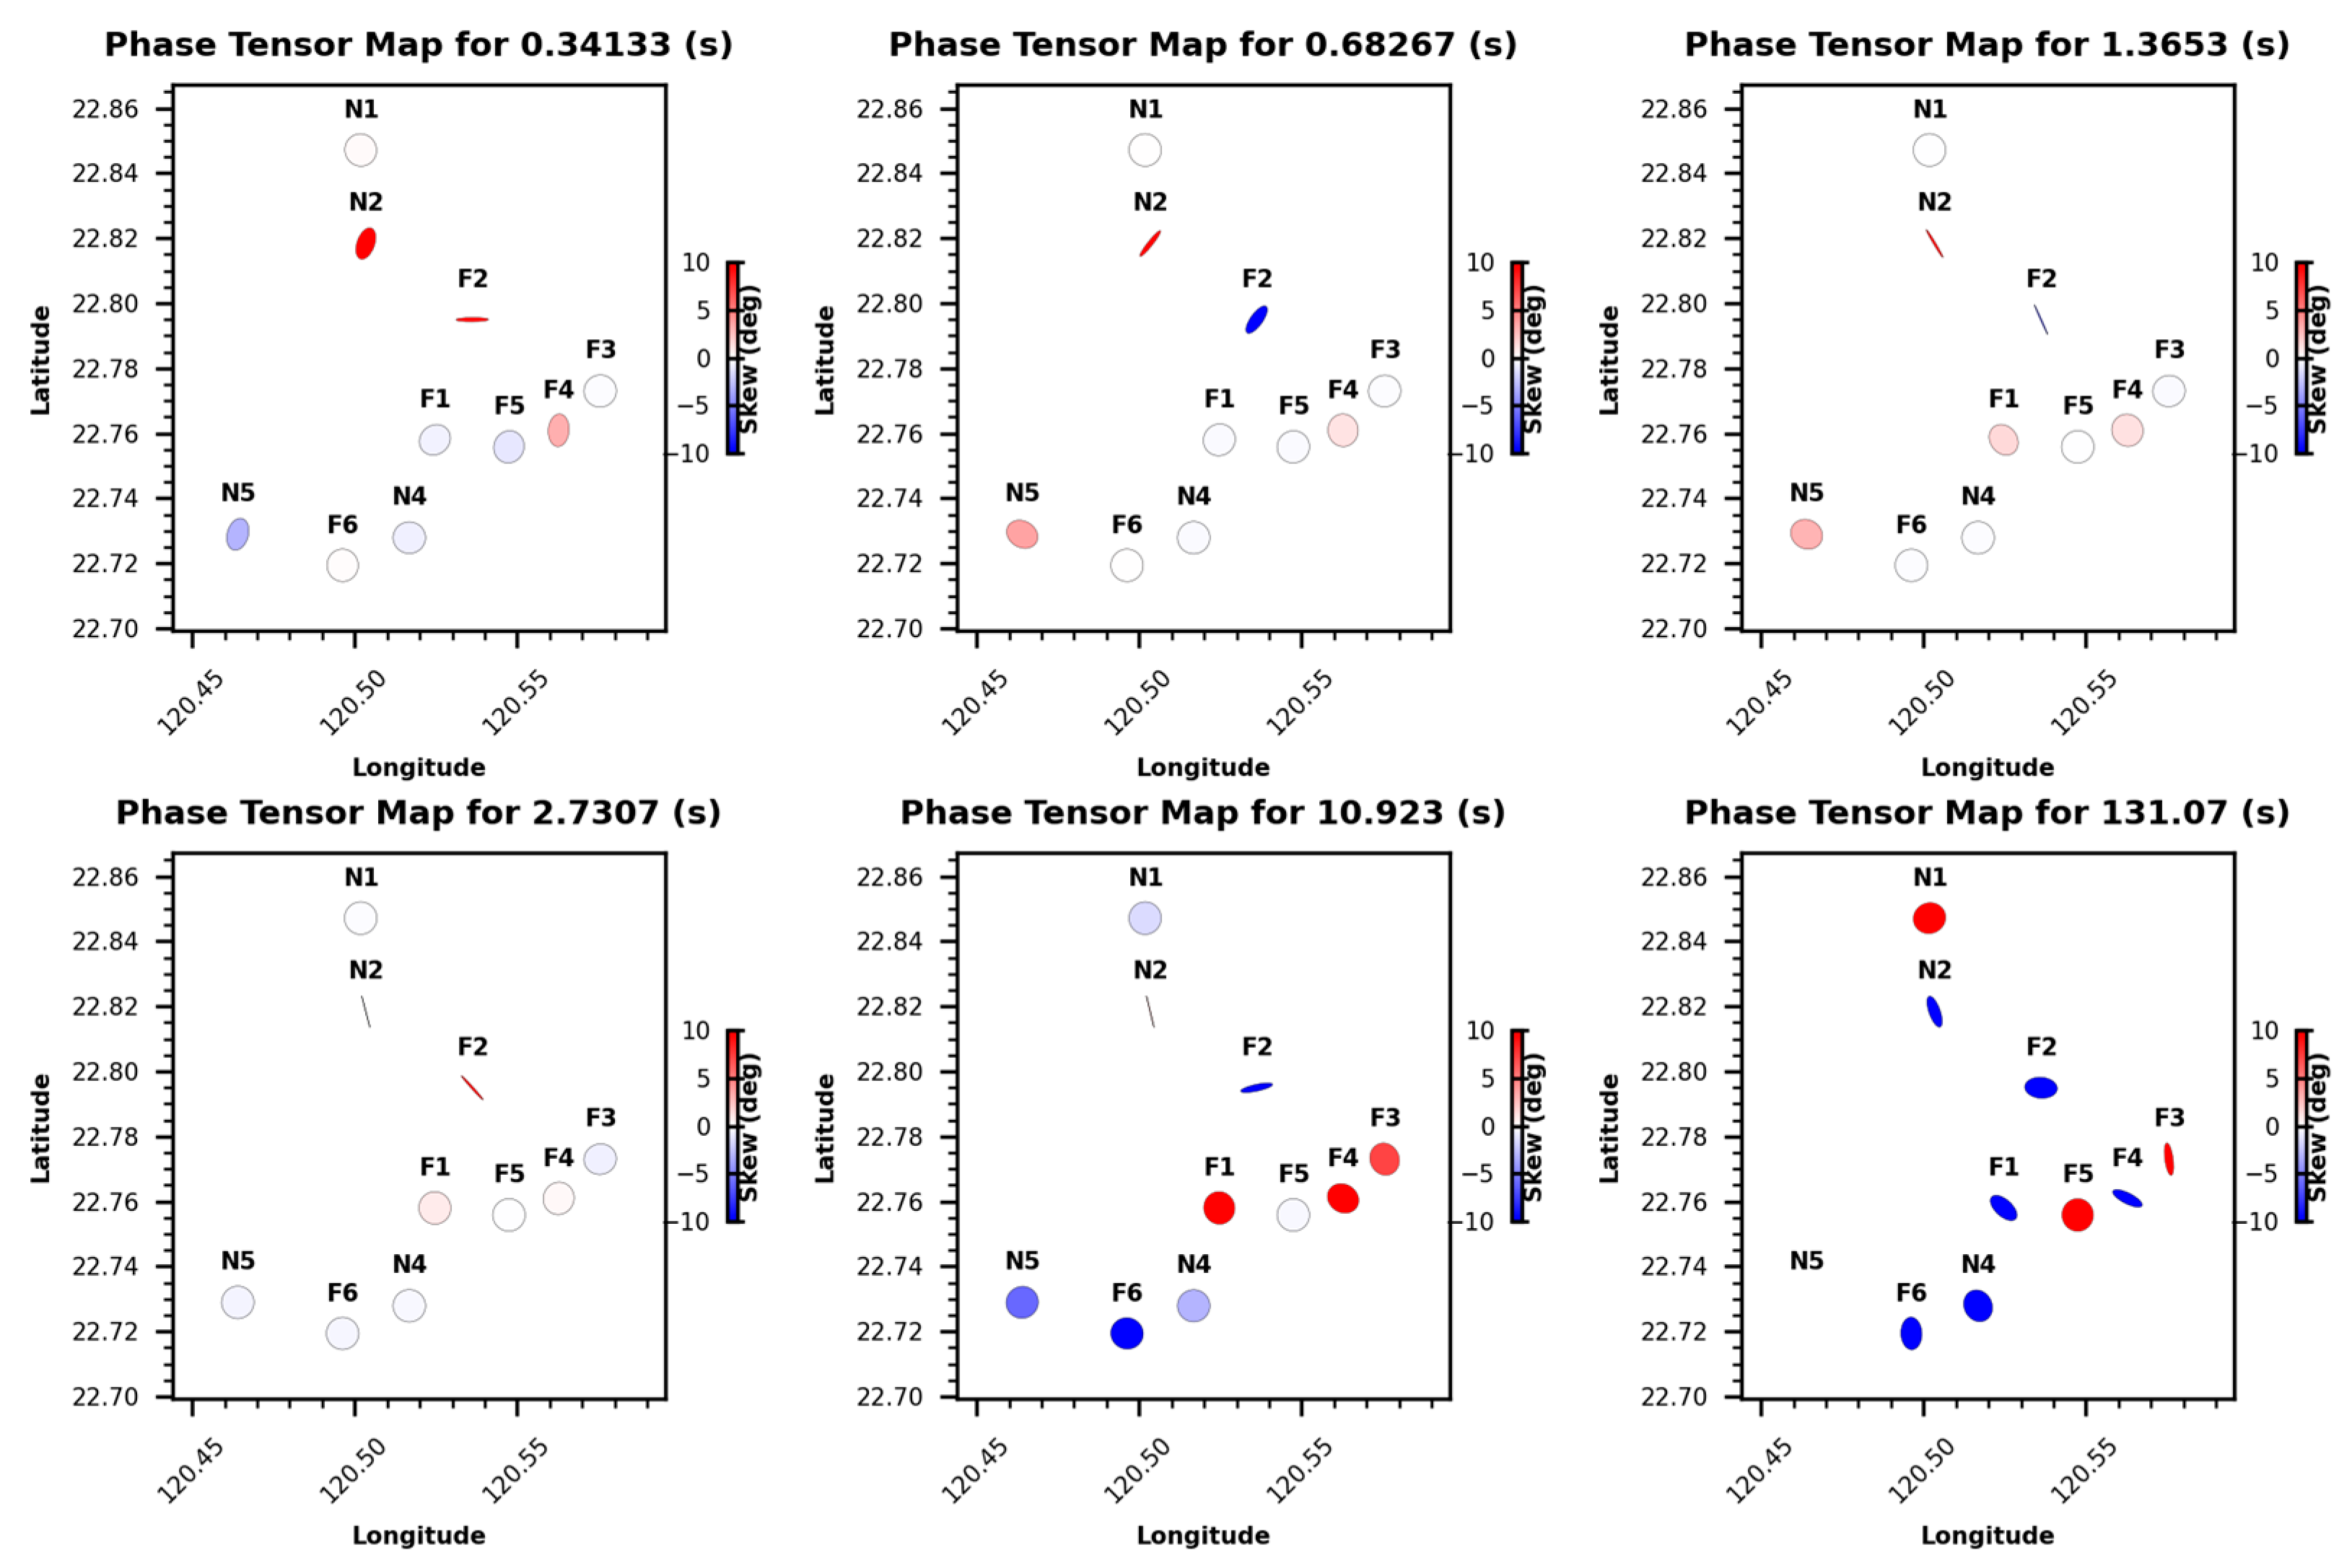
Figure 4 displays the PT ellipses for several periods across the study area, with the color bar representing β values. The computed PT values suggest a 1D/2D response at short periods, transitioning to 3D at longer periods. Stations F2 and N2 exhibit consistent 3D features across all periods, which may be attributed to noise effects shown in
Figure 3. This suggests that the shallow subsurface below the study area is predominantly 1D, becoming more complex at greater depths. Therefore, in addition to 1D inversion, it is advisable to perform 2D and 3D modeling. For the strike analysis, we excluded the noisy data, as such data can cause unstable estimations [
27].
Figure 5 presents a rose diagram illustrating the geoelectrical strike orientation derived from both the impedance invariant and the phase tensor across all MT sites. The plots are divided into several period ranges, showing how the strike estimation is distributed locally. Both the
Z-strike and PT rose plots reveal that the strike estimation is primarily oriented between N-S and NNE-SSW, with a noticeable shift to a nearly W-E orientation at the intermediate period range of 1–10 s. This shift is likely due to local effects within that period. Overall, the dominant strike direction from both the
Z-strike and PT-derived strike is N10°E.
Figure 3.
Apparent resistivity and phase curves of all 10 observation stations in this study. Red and blue circle represents the xy and yx component respectively.
Figure 3.
Apparent resistivity and phase curves of all 10 observation stations in this study. Red and blue circle represents the xy and yx component respectively.
Figure 4.
Phase tensor ellipse distribution along the survey lines, mapped at six different periods, shows characteristics change from 1D/2D nature to 3D. Short periods represent shallow depth while longer periods show characteristics at greater depth.
Figure 4.
Phase tensor ellipse distribution along the survey lines, mapped at six different periods, shows characteristics change from 1D/2D nature to 3D. Short periods represent shallow depth while longer periods show characteristics at greater depth.
Figure 5.
The rose diagram plot for strike direction derived from impedance invariants and phase tensor at all frequencies (a,c) and at decades frequency segments (b,d).
Figure 5.
The rose diagram plot for strike direction derived from impedance invariants and phase tensor at all frequencies (a,c) and at decades frequency segments (b,d).
Since both strike estimations have a ±90° ambiguity [
45,
49], further verification is needed to confirm the precise orientation. Commonly, tipper data, the transfer function of the vertical
H, is used to resolve this ambiguity. However, since no tipper data were available in our observations, we relied on existing geological records. Most geological features in the Pingtung Plain are oriented between N-S and NNE-SSW, as depicted in
Figure 1. Therefore, our estimated strike direction aligns closely with the geological data, and we determined that the strike derived from our survey is N10°E. This direction was used to rotate the data, aligning them parallel to the strike (TE) and orthogonal to the strike (TM) prior to the inversion.
The 1D inversion was performed using IPI2WIN_MT, which is designed for automatic MT-sounding interpretation of a single profile using data amplitude and/or phase curves. The 2D inversion was carried out using the open-source Occam2D code. Occam2D is an extension of the Occam 1D inversion scheme, aiming to generate a smooth model from EM data while maintaining a specified misfit tolerance [
50,
51]. Considering the amount of our data, all data were included for the inversion, but any noisy data were smoothed to reduce the noise effect.
4.4. One-Dimension Inversion Results
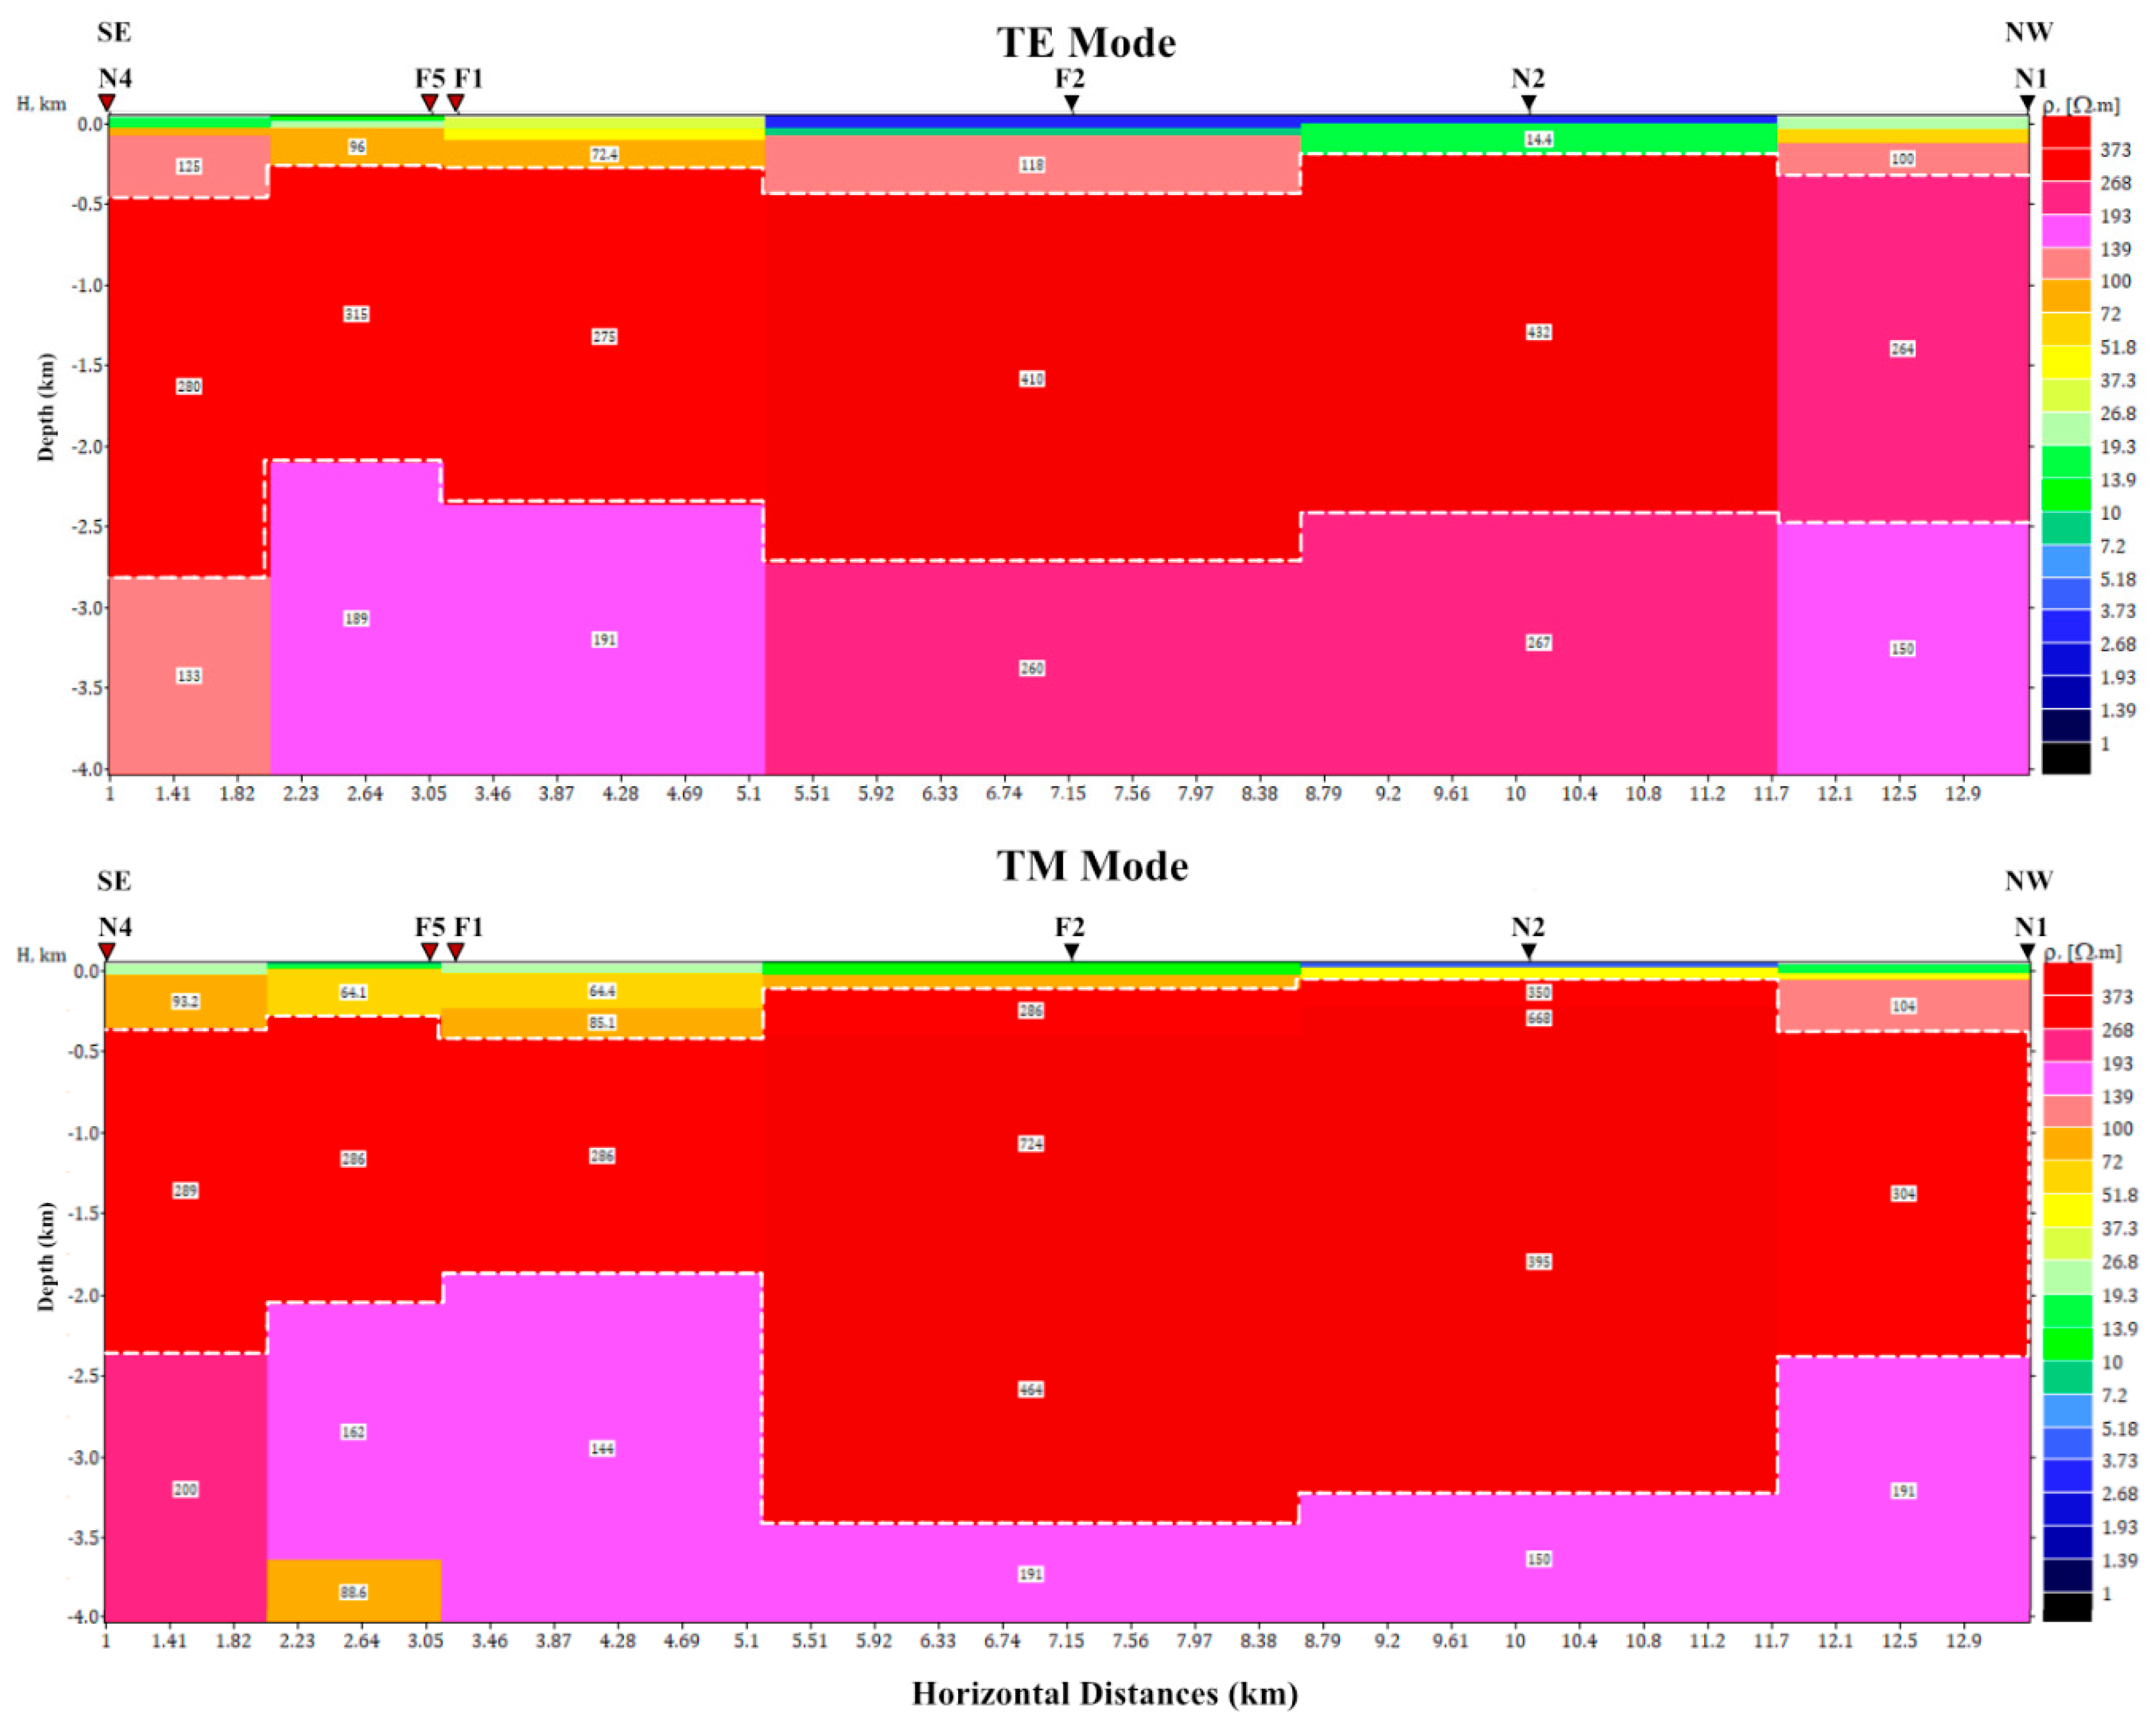
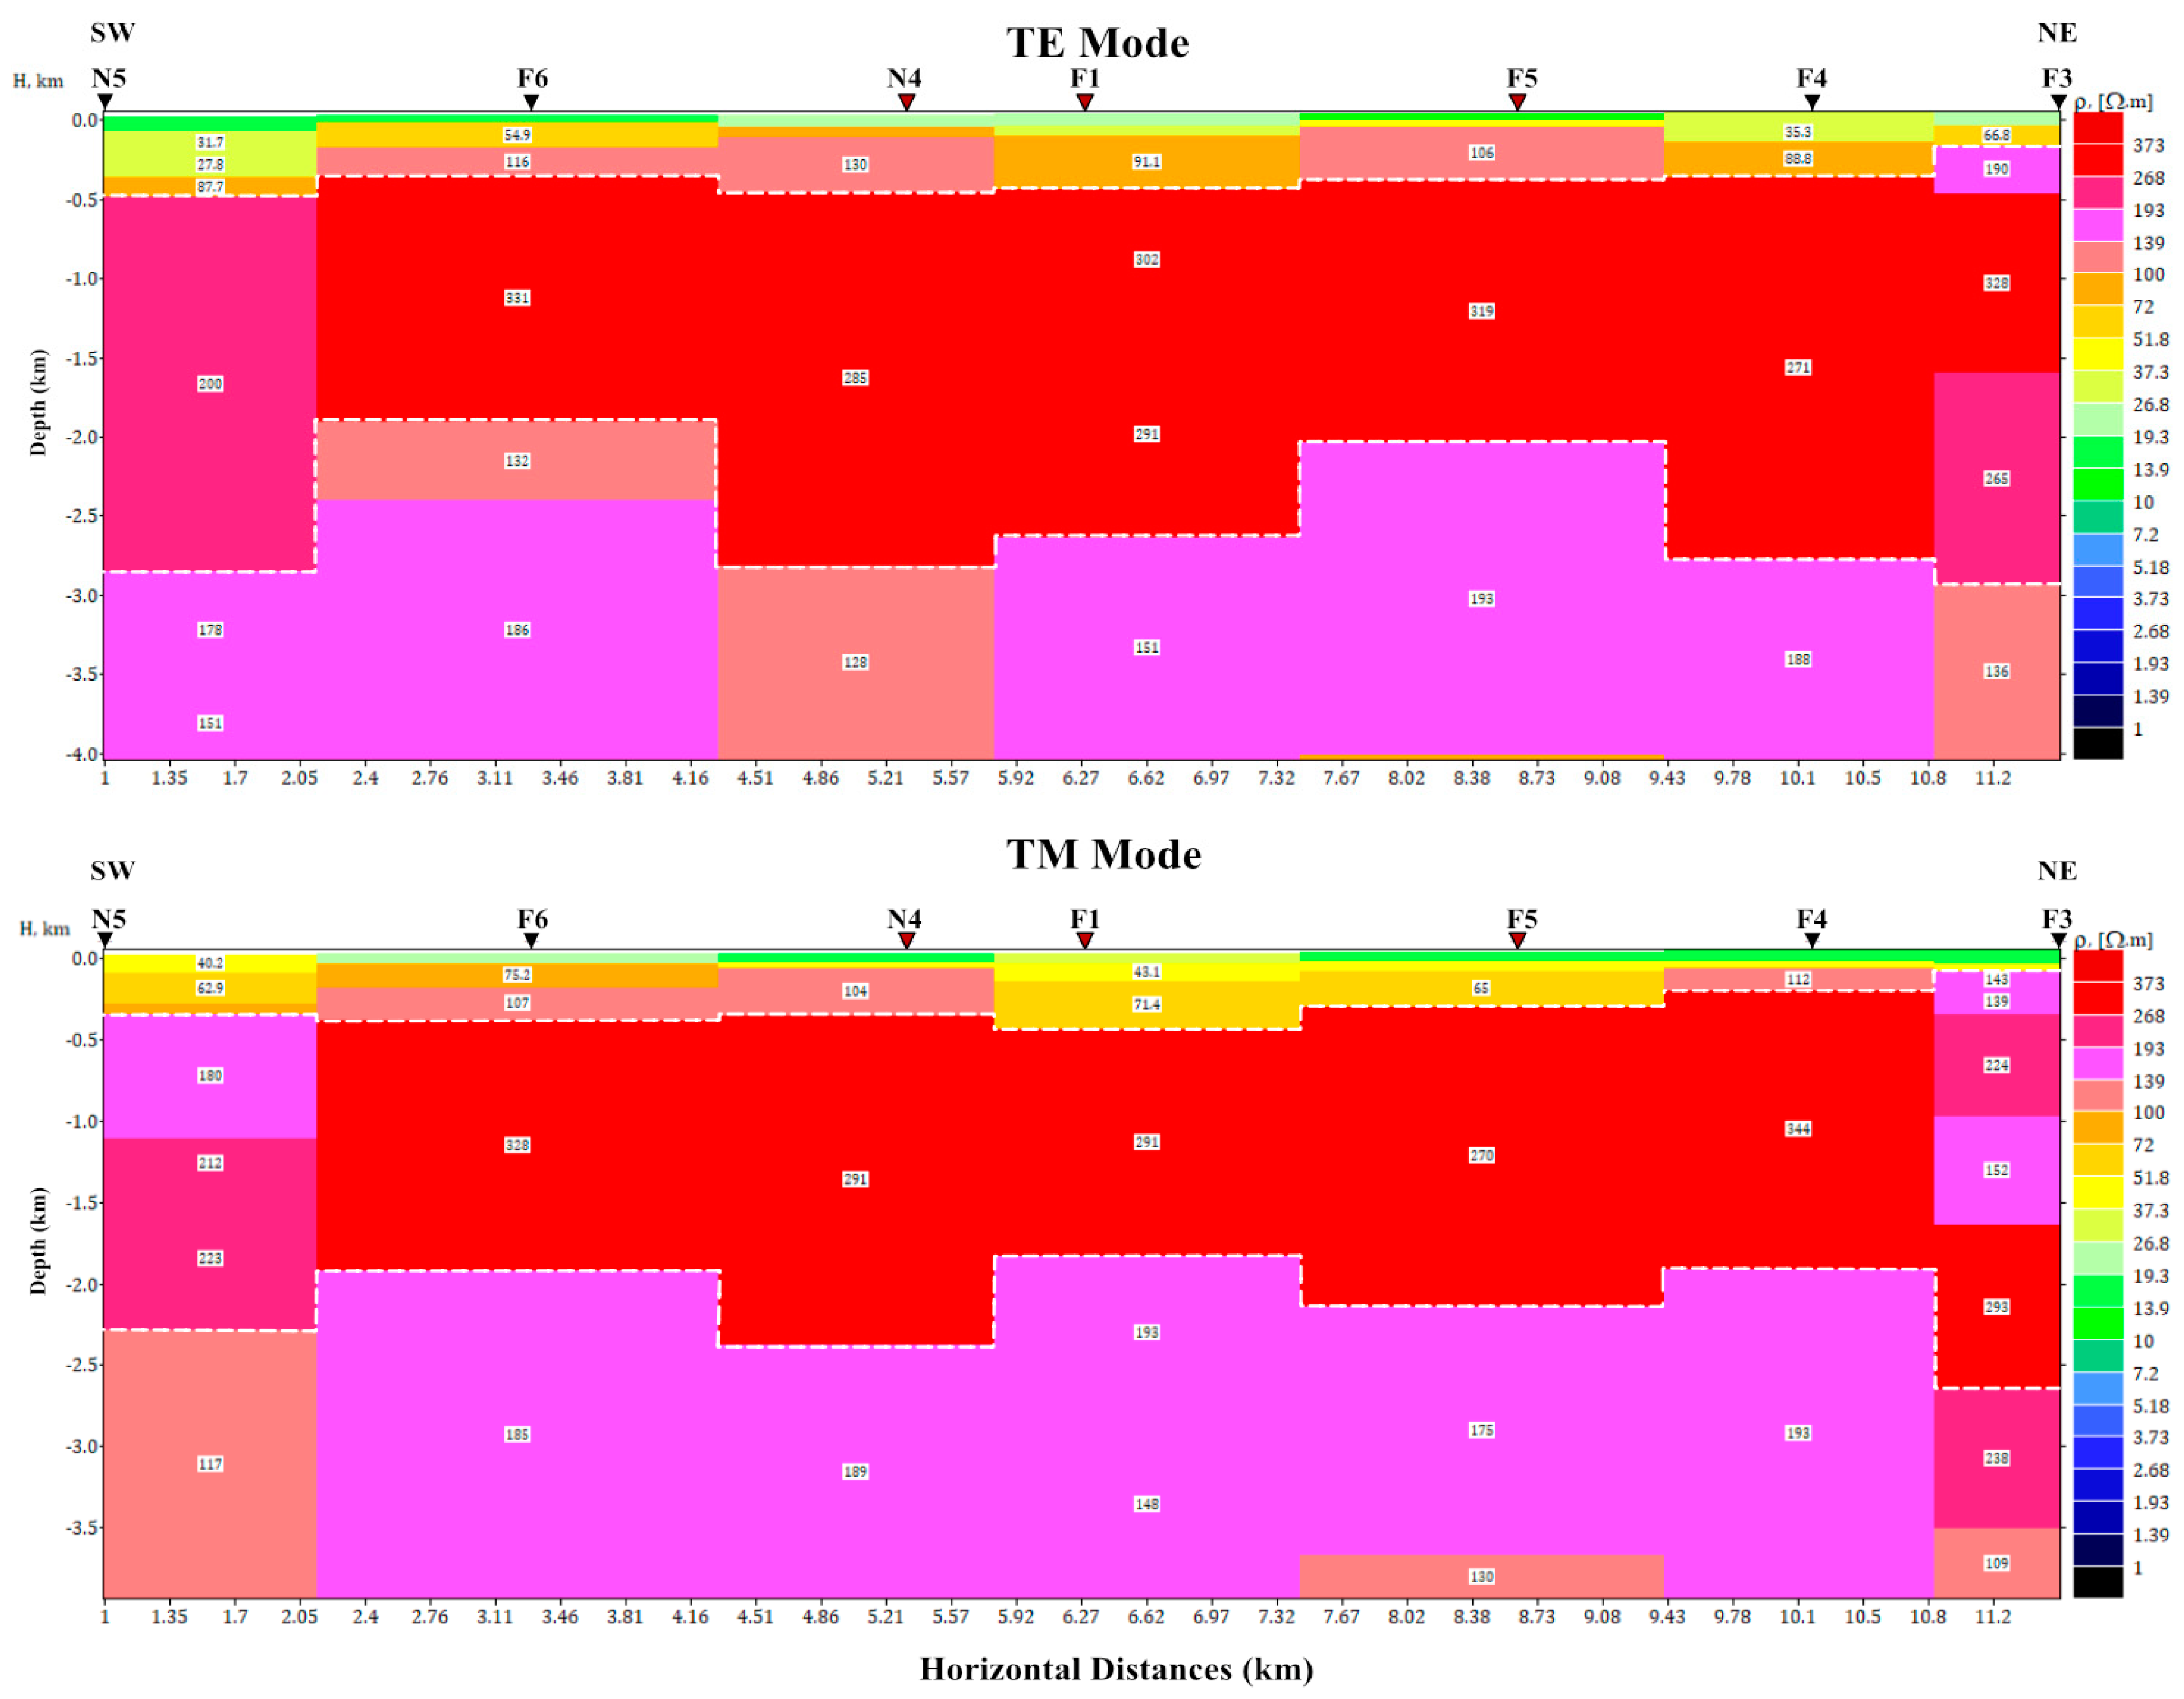
The 1D inversion results are presented as stitched geoelectrical sections in
Figure 6 and
Figure 7, corresponding to the NW-SE and NE-SW lines, respectively. Both figures reveal a noticeable resistivity contrast that reflects the sedimentary structure beneath the observation stations. Along the NW-SE line, both the TE and TM modes show low-to-medium-resistivity layers, typically around 10 Ωm to less than 150 Ωm, extending from the surface to depths of less than 500 m. Beneath this low-resistivity layer, a high-resistivity zone of less than 500 Ωm, with variable thicknesses between approximately 2 and 3 km, is observed. The northeastern side is more resistive compared to the southern side, where the high-resistivity layer at stations F2 and N2 appears to extend to the greatest depth. Below this high-resistivity zone exists a moderate-resistivity layer, generally below 200 Ωm.
A similar pattern is observed along the NE-SW line (
Figure 7), where the near surface is marked by the low–medium-resistivity layer of approximately 10–130 Ωm. The underlying high-resistivity layer is relatively uniform compared to the NW-SE profile, with a depth ranging from approximately 2 to 2.5 km. The top low-resistivity layer is likely associated with Quaternary sediments deposited in the Plain, while the higher-resistivity layer may correspond to older sediments from the late Neogene. This interpretation is consistent with the sedimentary bedrock described in
Section 3.
4.5. 2D Inversion Results
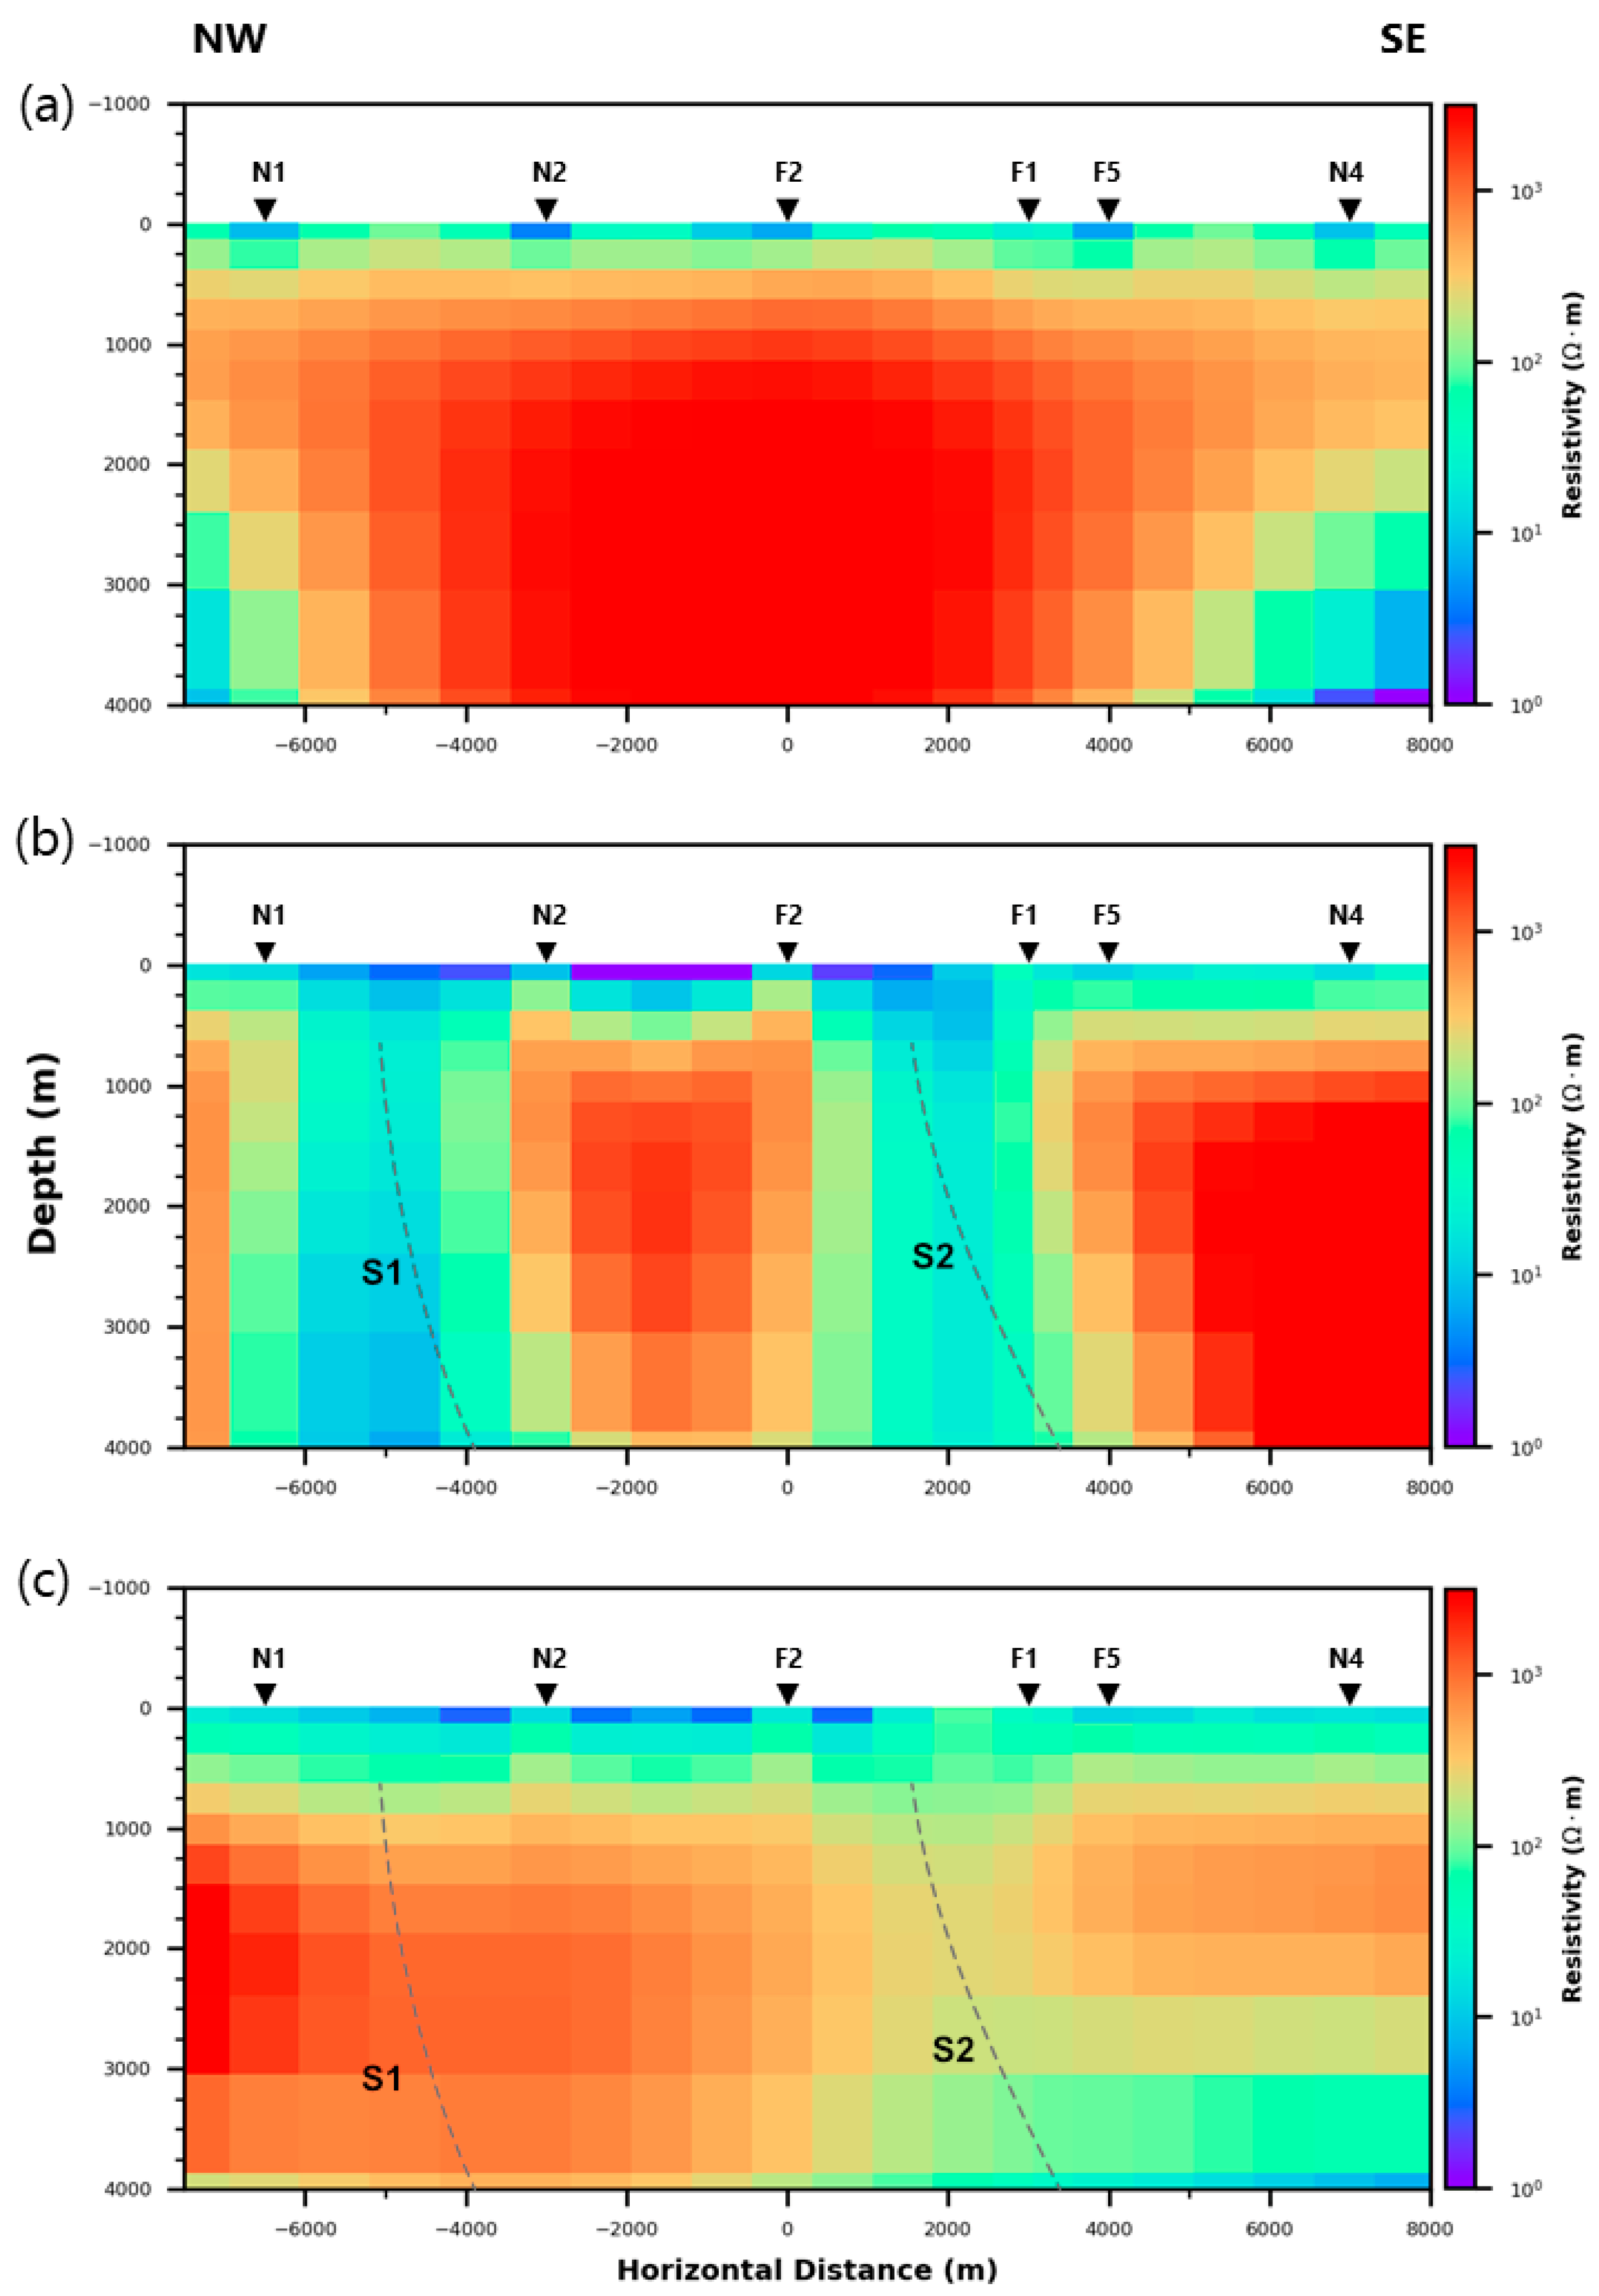
For the NW-SE profile, the TE mode inversion (
Figure 8a) reveals a thin low-resistivity layer (<100 Ωm) near the surface, with a thickness of less than 250–300 m. This layer overlies a high-resistivity layer of more than 1000 Ωm, which extends beyond the depth limits of the study. At the lower edges of the profile, both the NW and SE portions hinted at the existence of lower-resistivity features at around 2.5 km deep. The TM mode inversion (
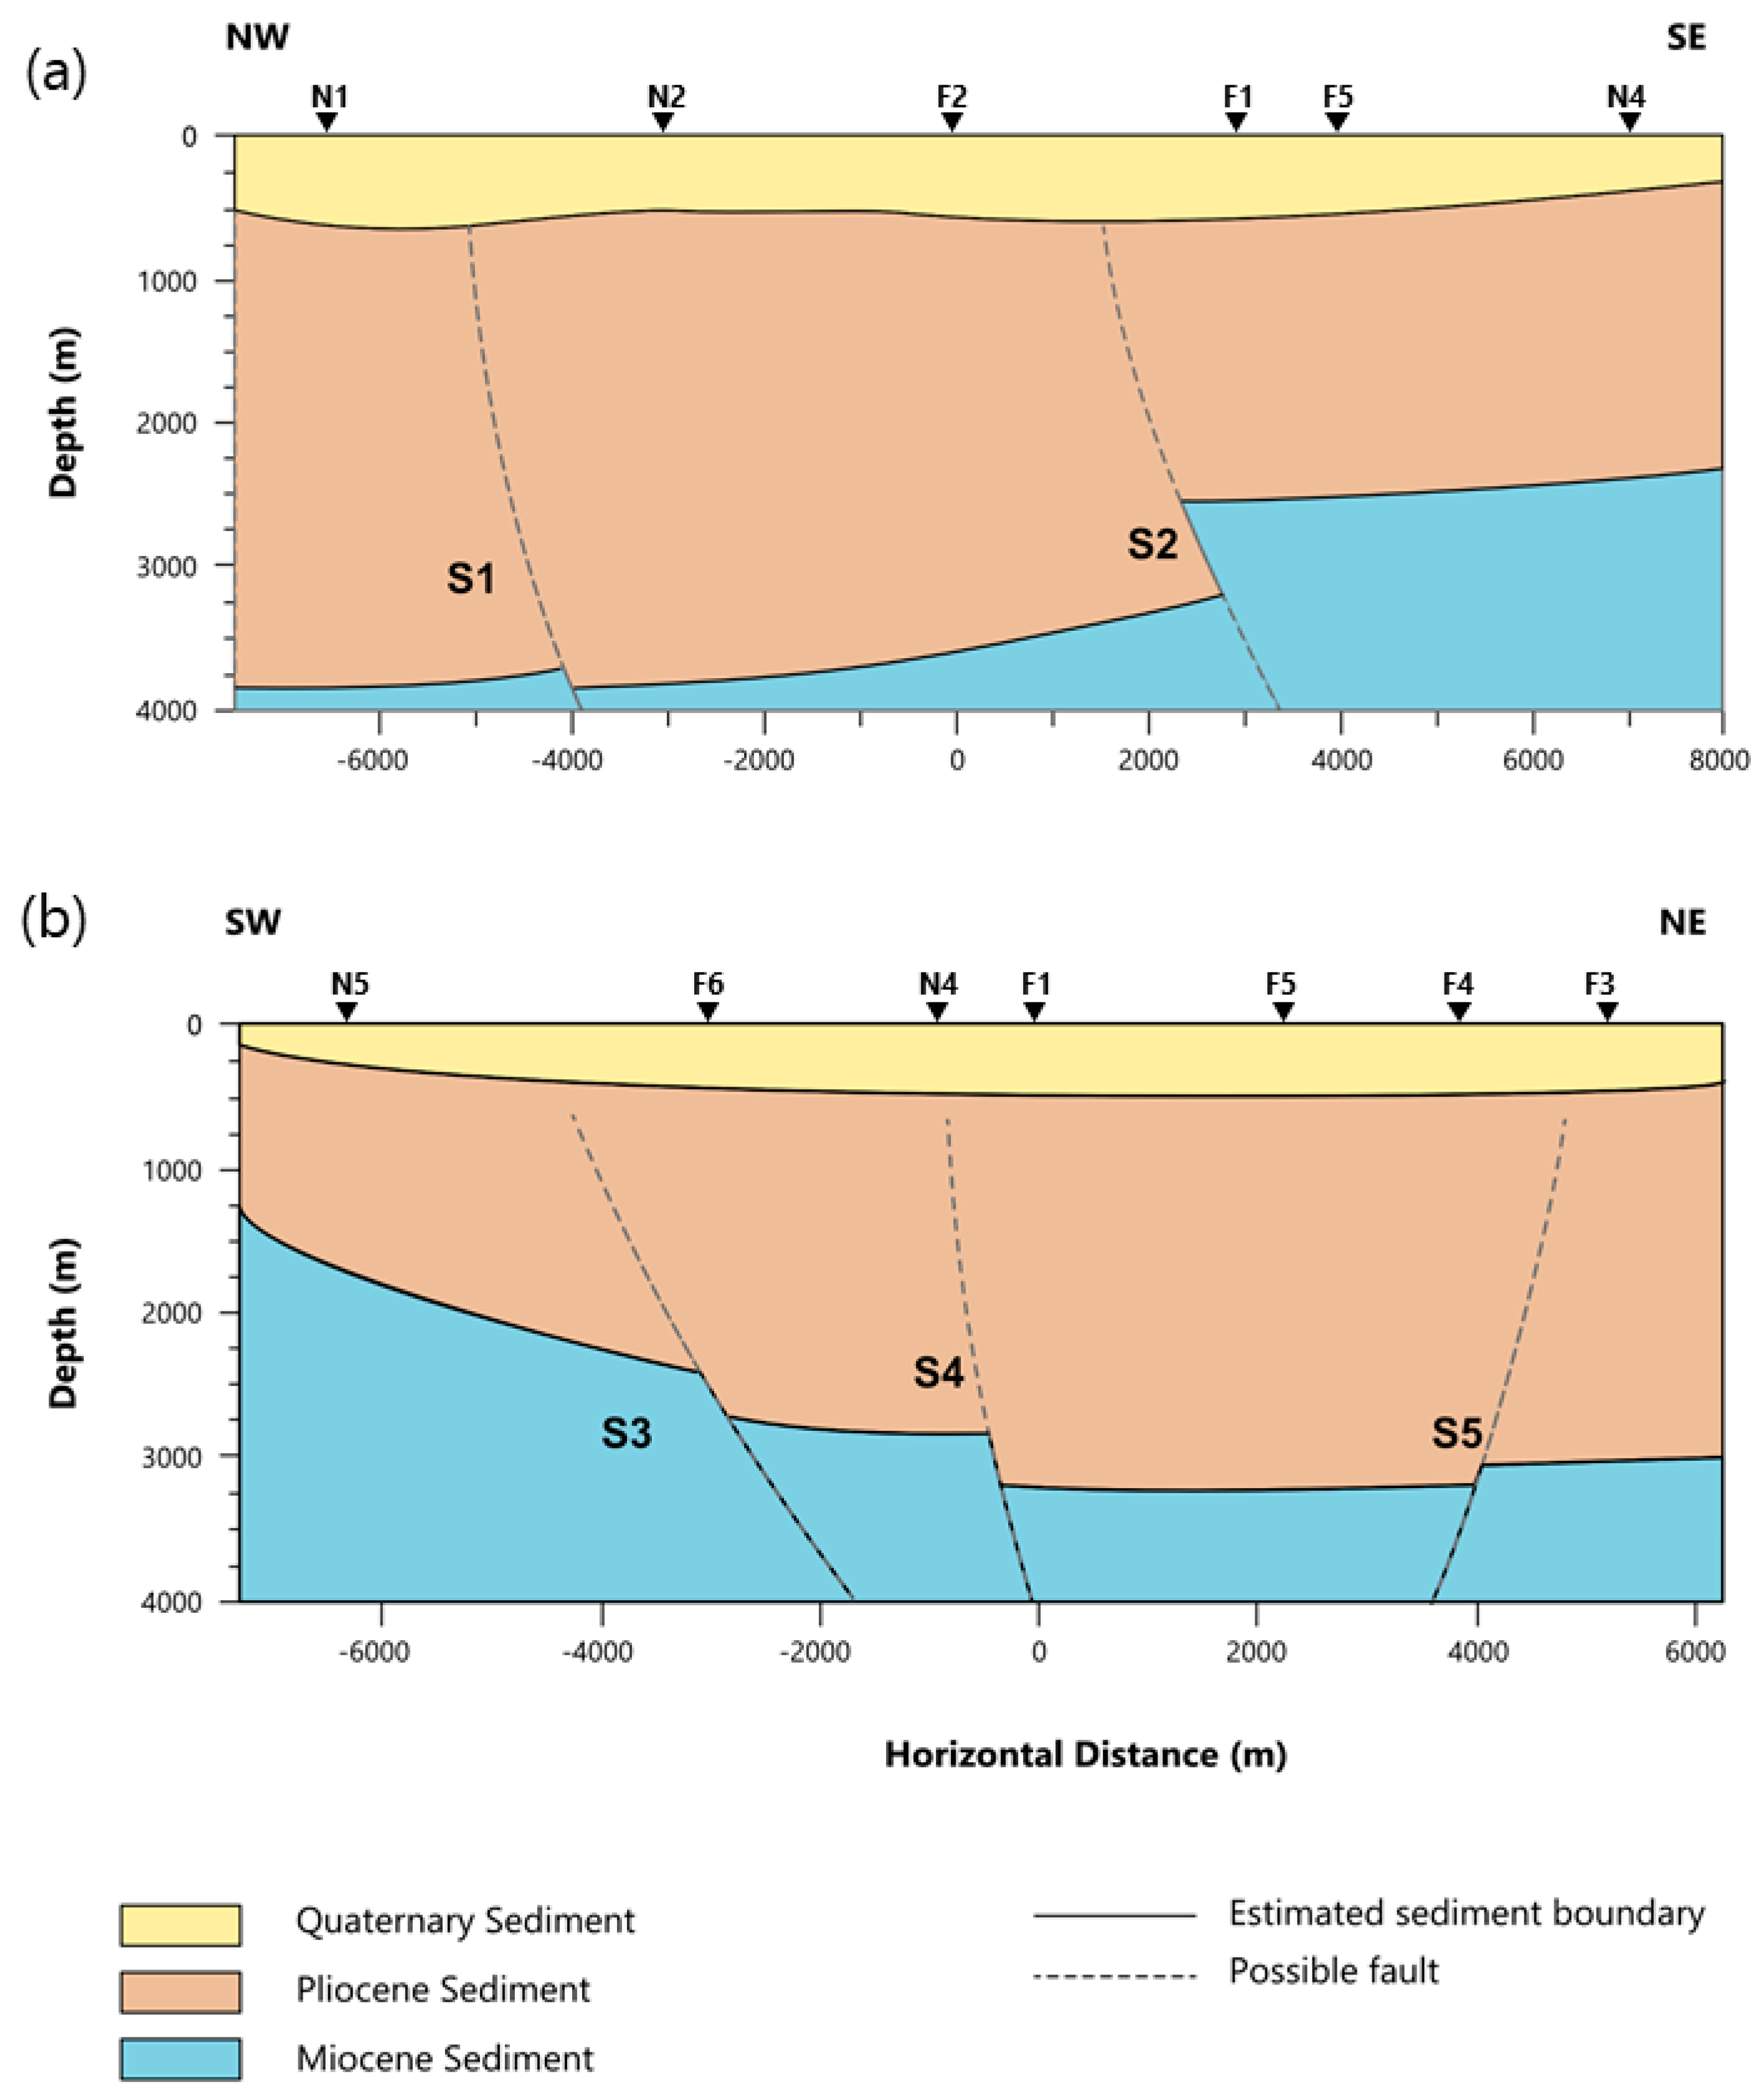
Figure 8b) reveals nearly vertical conductive features between N1-N2 (marked as S1) and F2-F1 (marked as S2), dipping southward and extending to the bottom of the profile. Similar to the other two modes, the joint-mode inversion (
Figure 8c) portrays the thin conductive layer at depths of nearly 500 m from the surface, followed by a high-resistivity layer of more than 1000 Ωm. A low-resistivity layer below 100 Ωm is observed at approximately below 3 km. The nearly vertical structure S1 is less distinguishable in the joint mode, but S2 remains visible.
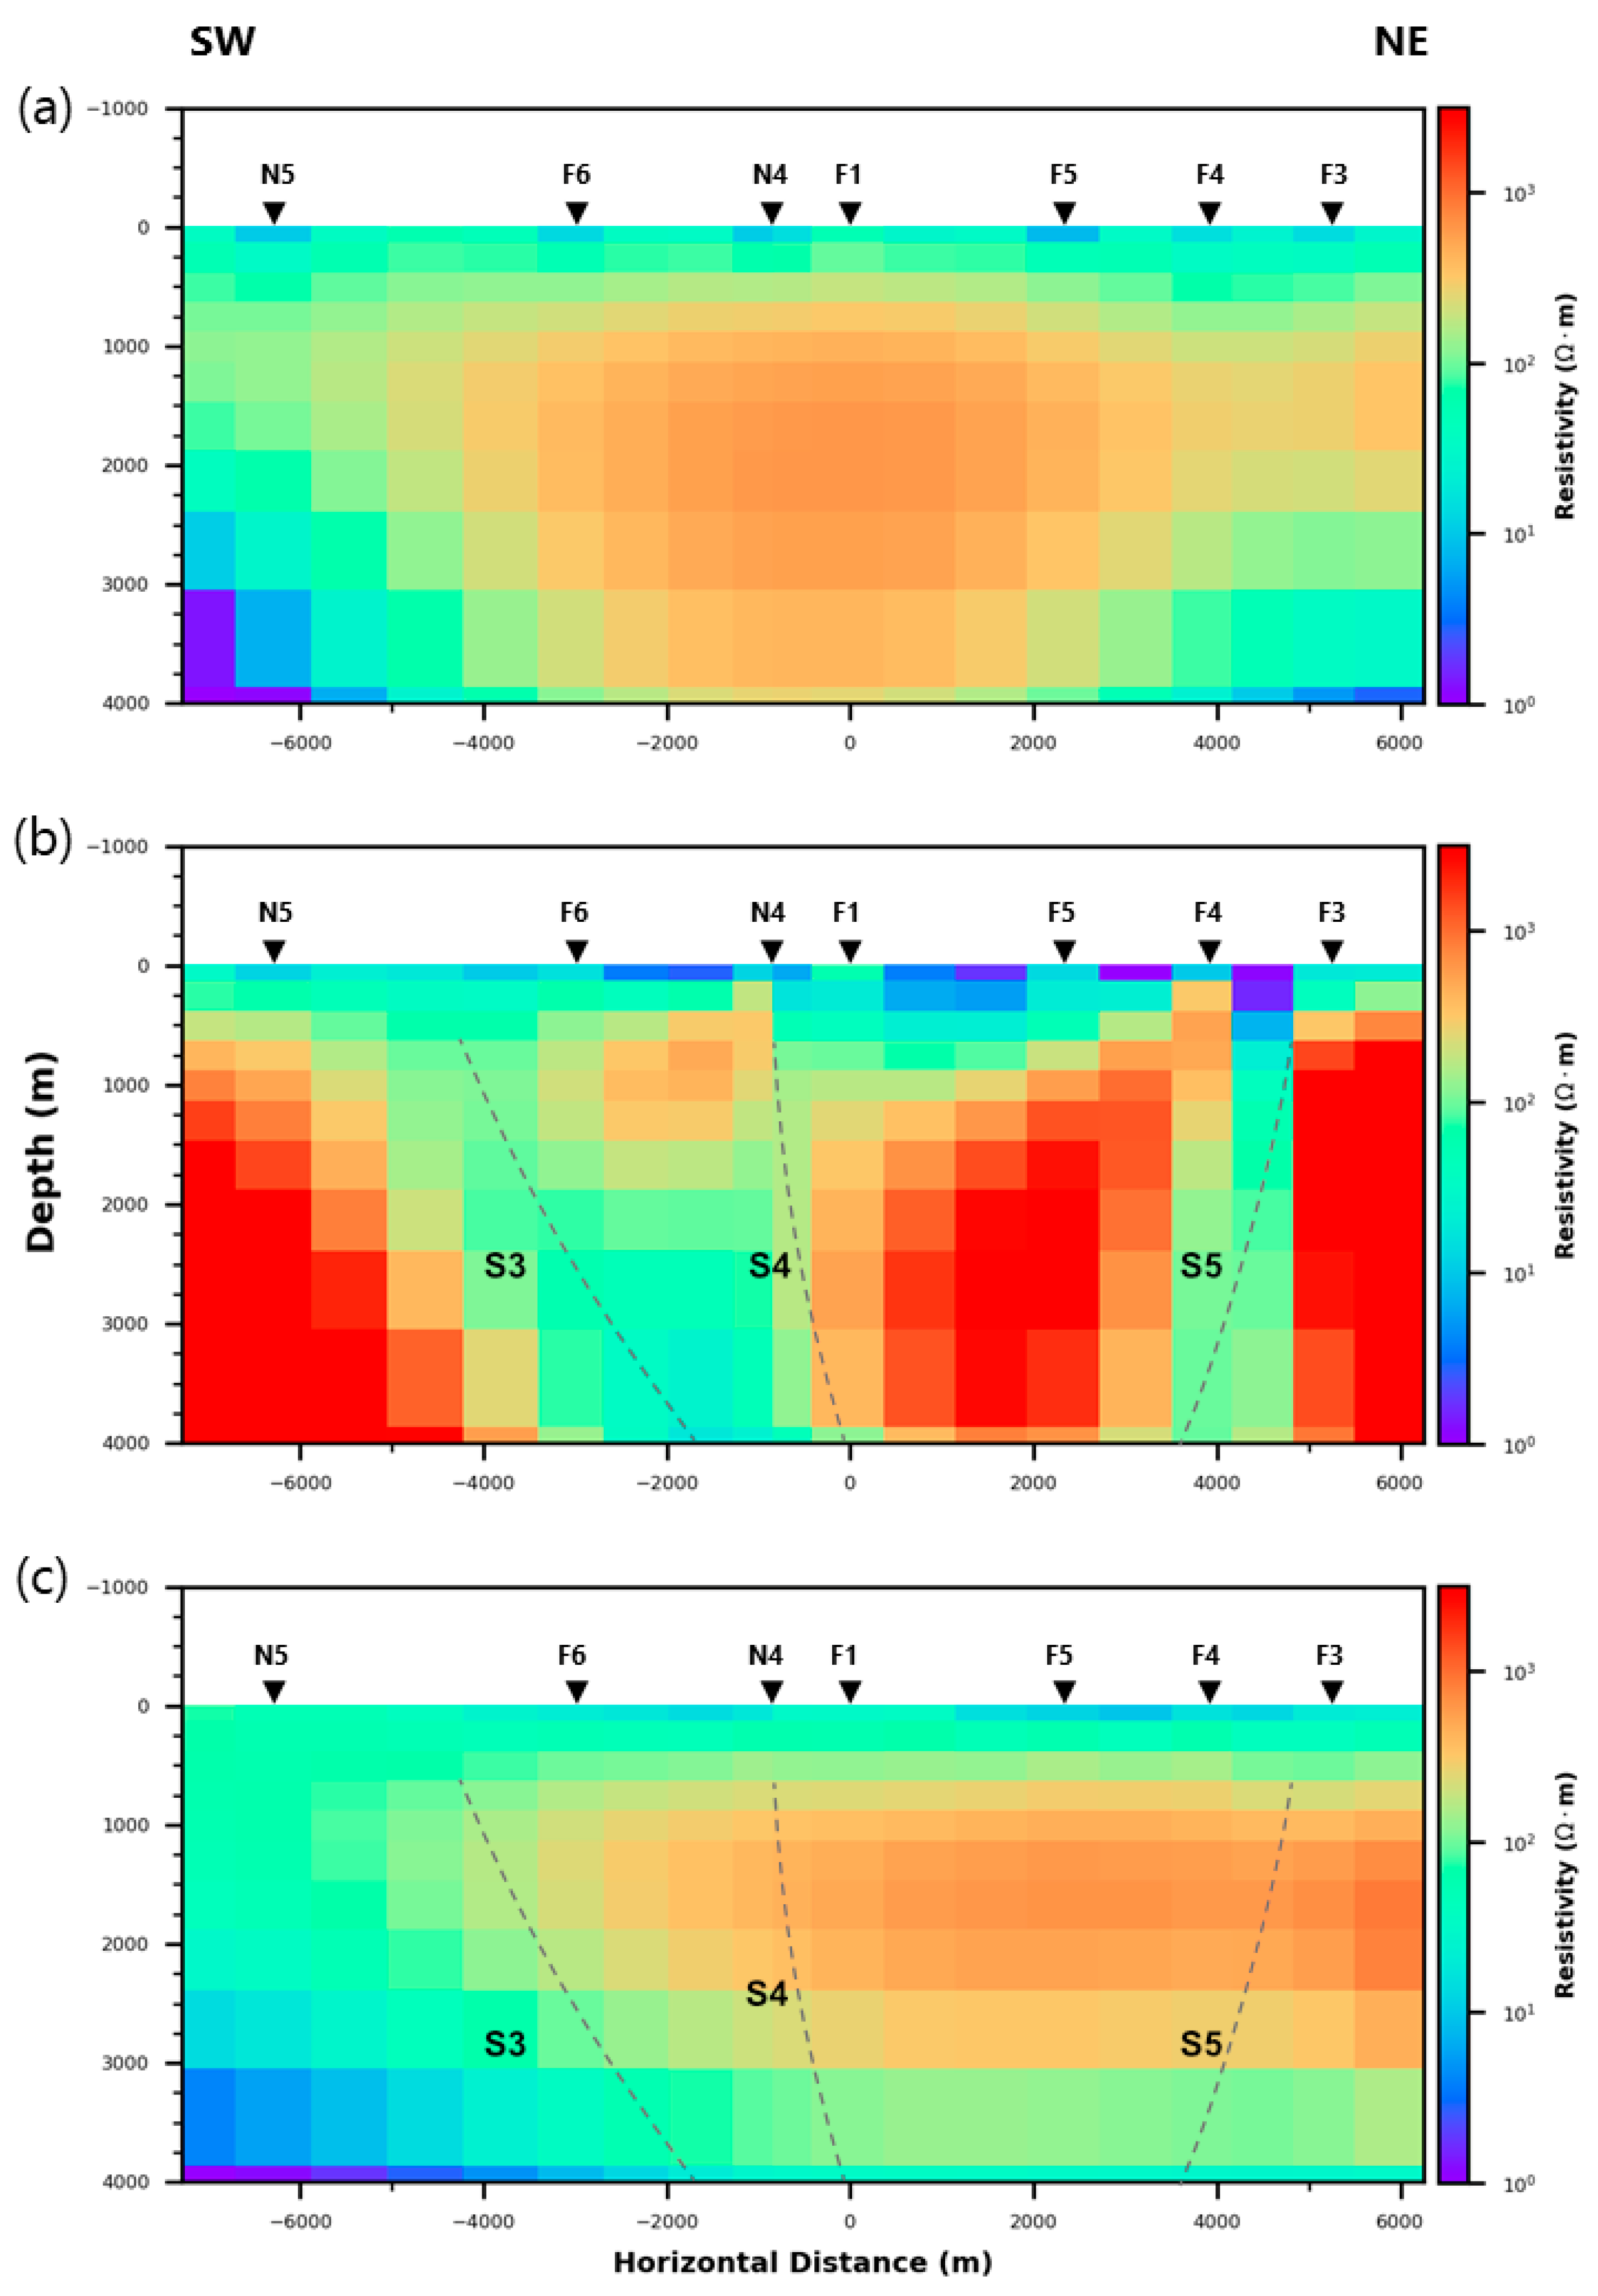
For the NE-SW profile (
Figure 9), the inversion results from the TE mode show similar characteristics to the NW-SE profile, where the shallow layer is of low resistivity of less than 100 Ωm up to 500 m deep. The underlying high-resistivity layer of approximately 1000 Ωm, extends to the bottom of the profile. Low-resistivity-layer features of less than 100 Ωm can be observed at nearly 2 km. The TM mode inversion shows a series of conductive vertical discontinuity marked as S3–S5. In the joint-mode inversion, the shallow conductive layer extends to approximately 500 m while the underlying resistive layer thinned out to the southwest end of the profile. Low-resistivity features below this layer are also observed at approximately 3 km deep.
The general consistency between the 1D and 2D inversion results suggests that the subsurface beneath the study area, down to a depth of 4 km, can be characterized by three main layers: a low-resistivity shallow layer, a high-resistivity middle layer, and a low-resistivity bottom layer. The top low-resistivity layer, extending to a variable depth of less than 500 m, represents the Quaternary sediments, which include recent alluvium and the Linkou Conglomerate, overlying marine sediment formations. The low resistivity may be due to the presence of the groundwater system beneath the Plain. The presence of fluid within the highly porous layer can decrease resistivity, resulting in lower measurements. The high-resistivity middle layer up to 2.5–3 km may represent the Pliocene bedrock made up of sandstone and shale, which has undergone compaction that causes it to have lower porosity as the sediments expel more fluid and become more tightly packed. The low-resistivity layer at the bottom may imply the Miocene muddy sandstone and sandy mudstone of the Wushan formation, which may extend deeper to more than 4 km.
5. Discussion
Conducting MT surveys in areas with significant noise sources presents a considerable challenge and requires meticulous data selection and processing. To begin with, it is important to evaluate the raw data and identify time segments with the least noise. This is where spectral analysis becomes crucial, as it provides insights into the noise characteristics present in the data, as presented in
Section 4.1. Through time series and spectral analysis, the nighttime data were selected, as they were observed to have comparatively lower noise levels than daytime data. However, despite this, it is not possible to entirely eliminate noise, even during the night. In addition, if the correlated noise is present, using the remote reference method only would not suffice as it works to minimize noises on the basis that the noise in the observed sites and the local sites is uncorrelated. Consequently, the use of the remote reference method may still yield scatter shown in the transfer function curves, as shown in
Figure 3. Thus, in highly populated areas where man-made noise is abundant, the conventional remote reference method might not suffice and calls for a better processing technique suited for such conditions. Despite this, we still managed to obtain adequate results from our survey.
While the 1D inversion yields similar results between the TE and TM modes, this is not the case for the 2D inversion. This discrepancy is expected, as real field subsurface conditions are inherently heterogeneous. The 1D inversion cannot resolve 2D or 3D structures as effectively as higher-dimensional inversion methods. Nevertheless, the 1D inversion provides a clear view of the estimated boundaries, making it easier to identify these features. Even in conditions where a multidimensional inversion is applied, 1D inversion can still be valuable as a preliminary tool, offering a quick overview of the subsurface structure.
The 2D inversion results demonstrate the sensitivity differences between both MT decomposition modes, as discussed in
Section 1. The TE mode inversion effectively identifies the conductive bottom structure, suggesting deeper conductive features in the subsurface. On the other hand, the TM mode points to a possible vertical structure, which does not appear in the TE mode. However, it is crucial to note that the TM mode results may be influenced by certain artifacts. Specifically, noise from nearby infrastructure, such as the railway south of the study area, and roads and highways running parallel to the east–west
E (
Ey), may affect the inversion. A study by in Ilan, northeastern Taiwan demonstrates how electric trains have a stronger impact on the
E in the direction parallel to the railway and on the
H perpendicular to it [
44]. Additionally, the absence of observation sites in areas where vertical structures are observed may result in inversion artifacts, potentially distorting the true subsurface structure. Given the possibility of external noise and inversion artifacts affecting the inversion results, interpretation should be made with caution when an MT survey is carried out in regions with significant noise interference. Noting the noise source location and orientation might be helpful in evaluating the noise-affected mode, which can minimize the possibility of misinterpretation. If one mode (either TE or TM) exhibits significantly lower data quality due to noise or 3D effects, including it in a joint inversion can degrade the overall result. In such cases, using only single-mode inversion may lead to a more reliable subsurface model [
10,
52,
53]. Therefore, one should evaluate each inversion model before relying solely on the bimodal inversion as it may not always be the optimal approach. Comparing our results to the available geology and geophysical study results, we infer that our inversion results are still reasonable in representing the subsurface features below the study area.
Both the 1D and 2D inversion results generally suggest a shallower depth compared to the stratigraphic well data, indicating that the sediments may thin out and become shallower toward the northeastern part of the Pingtung Plain. A distinct synclinal shape is apparent in the inversion sections, indicative of the Pingtung Syncline, which results from the thrusting of the Chaochou Fault to the east of the study area, implying that the sediment may thin out to the southwest of the Plain. This hypothesis aligns with previous tectonic and geological studies conducted in the Pingtung Plain [
37,
42,
43,
54]. The nearly vertical features observed below both profiles suggest the possibility of step-fault existence buried beneath the Quaternary sediments, disrupting the lateral continuity of the Neogene bedrock. These structures may have been formed due to the upthrusting associated with the Chaochou Fault, as suggested by previous study [
40]. Given that few studies have addressed the deep structure of this area, and considering the reasons mentioned earlier, the existence of these structures remains speculative. As such, the results offer a preliminary insight, providing a foundation for further investigation in the northern Pingtung Plain to further validate the findings presented in this study. A proposed preliminary conceptual model is presented in
Figure 10.
6. Conclusions
To investigate the subsurface structure of the northern Pingtung Plain, an MT survey was conducted with ten local observation stations and one remote reference station. Given the substantial presence of noise, careful data selection and processing were essential. Spectral analysis was employed to identify time segments with minimal noise, and in this study, the nighttime data were chosen for analysis due to their lower noise content. Static noise, such as the 60 Hz powerline signal, was mitigated using a notch filter to reduce its effect on the corresponding frequencies, while random noise was minimized by employing a remote reference station located away from major noise sources. Despite this, the obtained data, supported by existing datasets, allowed for the adequate imaging of the subsurface structure through both 1D and 2D inversions, to depths of up to 4 km. The resistivity profile beneath the study area generally displays a conductive shallow layer overlying a resistive layer. From the inversion results, we identified the boundary between the Quaternary sediment and the underlying bedrock, which possibly dates from the Pliocene to Miocene periods. This boundary was located at various depths of up to 500 m. Our results suggest that the sediments thin out toward the northeast and southwest directions. A series of step-fault structures assumed to be caused by the thrusting of the Chaochou fault are observed. However, due to the lack of available supporting data, its true existence remains speculative at the moment. Thus, it can serve as preliminary insight into the deep subsurface information in the area. To further validate these findings, we recommend increasing the density of MT soundings, especially in areas where these structures are observed. Additionally, the use of complementary geophysical methods would provide more detailed subsurface information and help confirm the deep structural characteristics of the northern Pingtung Plain.
