Abstract
Embracing a greener future requires understanding our carbon footprint. This study analyses the greenhouse gas emissions of the Technical University of Cluj-Napoca (TUCN) across all three emission scopes (1, 2, and 3) over a two-year period (2022–2023), employing the GHG Protocol methodology and One Click LCA software. In 2022, TUCN reported total greenhouse gas emissions of 7445.1 tonnes of CO2 equivalent (tCO2e), with a significant emphasis on Scope 3 emissions (28.3% of the total). This figure decreased slightly to 7229.1 tCO2e in 2023. On a per-person basis, emissions decreased from 0.378 tCO2e per person in 2022 to 0.362 tCO2e per person in 2023. The emissions per square meter also decreased from 31.2 kgCO2e/m2 in 2022 to 30.3 kgCO2e/m2 in 2023. Stationary fuel use (primarily natural gas) remained the largest contributor to emissions, accounting for approximately 62.7% and 66.9% in 2022 and 2023, respectively. TUCN aims for an 80% emissions reduction by 2030, fostering positive environmental impacts through education, energy efficiency, community engagement, and partnerships. This study provides a foundation for achieving carbon neutrality, benchmarking Romanian institutions, and contributing to national climate mitigation. The research’s findings are valuable for those seeking to integrate sustainable practices within higher education and broader urban contexts.
1. Introduction
1.1. General Background
With the advent of climate change, there is a growing movement for action and positive changes to the environment. Through collaborative efforts on a global scale, humanity possesses the power to adapt to and mitigate its most severe consequences. The transition requires a collective commitment to building a future where environmental responsibility is paramount. In 2015, all members of the United Nations (UN) joined forces to establish a roadmap for a better future. This ambitious plan, called the 2030 Agenda for Sustainable Development, established 17 Sustainable Development Goals (SDGs) aiming to address critical issues like poverty, inequality, and climate change by 2030 [1]. These goals extend beyond the pursuit of human prosperity, encompassing the imperative of securing a healthy planet for future generations. To effectively fight climate change, significantly more ambitious goals from individuals, businesses, and governments are necessary [2]. After the Paris agreement (2015), now a clear reference worldwide, in 2019 the European Union (EU) Commission launched a far-reaching plan to transition to a greener economy called the European Green Deal. This roadmap lays out 50 specific actions to fight climate change and transition Europe into a climate-neutral continent by 2050 [3]. It is a significant undertaking that touches many aspects of European life, updated with the Fit for 55 and RePower EU, the latter being added after the start of the war in Ukraine [4,5].
The EU’s plan to achieve climate neutrality by 2050 hinges on transforming urban centres. That is where the EU Mission: Climate-Neutral and Smart Cities comes in [6]. European cities are at the forefront of what the EU Commission calls an urgent battle against climate change, actively managing the adoption of robust resilience strategies. While they occupy a small portion of the EU’s land (around 4%), they house three-fourths of its citizens. This concentration makes them significant contributors to the EU’s Green Deal goal of achieving climate neutrality by 2050. Cities are also major energy consumers, using more than two-thirds of the world’s energy and generating more than 70% of global carbon dioxide (CO2) emissions [7]. Therefore, accelerating their transition to sustainable practices is crucial. By supporting their green and digital advancements, significant progress towards the EU Green Deal’s target of a 55% emissions reduction by 2030 can be made. This initiative would not only improve the environment but also enhance the quality of life for European residents.
As a member state of the European Union, Romania has actively incorporated the UN’s 17 SDGs and the European Green Deal roadmap into its national policy framework, as well at the local level. This comprehensive approach is embodied in the National Strategy for Sustainable Development of Romania (NSSDR) 2030 [8]. Romania is also involved in the EU’s ambitious goal of achieving climate neutrality in several major cities. Three Romanian cities—Cluj-Napoca, Suceava, and Bucharest’s District 2—are at the forefront of sustainability efforts, having already signed climate neutrality contracts with EU Mission 100 [9]. This initiative empowers these cities with the resources and tools they need to implement innovative green solutions and accelerate their transition towards a more sustainable future. The 2030 NSSDR recognizes that achieving a sustainable future requires the collective effort of the whole ecosystem. While individual environmental responsibility at the local level is crucial, the strategy extends beyond traditional government sectors to employ a multifaceted approach. Furthermore, the 2030 NSSDR emphasizes the importance of individual action.
By understanding their Carbon Footprint (CF), organizations can identify areas where they can reduce their greenhouse gas (GHG) emissions and contribute meaningfully to achieving these ambitious climate goals. This collaborative effort, with individuals working with national and local government initiatives, is key to securing a sustainable future for Romania. CF calculation involves a few different methods, with the GHG Protocol [10] and the ISO 14064 standard [11] being two of the most popular for businesses and organizations. The GHG Protocol offers a user-friendly framework, ideal for organizations seeking to establish a baseline CF, identifying major emission sources (Scopes 1, 2, and 3), and implementing initial reduction strategies. It is particularly useful for internal reporting and tracking progress over time. The ISO 14064 standard, on the other hand, provides a more rigorous and detailed approach, emphasizing data accuracy and verification. This is especially valuable for organizations pursuing external validation of their CF, aiming for formal carbon neutrality certifications. The best choice between the GHG Protocol and ISO 14064 depends on the specific needs and objectives of an organization. For example, organizations like universities prioritizing ease of implementation and internal monitoring might opt for the GHG Protocol, while those requiring robust verification and external credibility would benefit from ISO 14064. In many cases, a phased approach may be adopted, starting with the GHG Protocol for initial assessments and transitioning to ISO 14064 for more advanced reporting and verification.
Romanian higher education institutions (HEIs) serve as crucial contributors to the 2030 NSSDR, bringing academic expertise to the table and ensuring that public policy is informed by the latest research as part of their mission of evidence-based knowledge dissemination. By rigorously measuring and managing their emissions through frameworks like the GHG Protocol or ISO 14064 standard, HEIs can showcase their dedication to sustainability and establish themselves as frontrunners in the shift towards a carbon-neutral future. As innovation powerhouses, university incubators play a vital role in developing and scaling pilot projects for a sustainable future. These hubs of cutting-edge research and technology are driving the development of zero-emissions buildings, positive energy campuses, and zero-carbon cities and communities through innovative demo-site pilots and test beds. From advanced renewable energy systems to sustainable building practices, universities are constantly pushing the boundaries of what is possible [12,13,14,15]. The sustainability endeavours of HEIs are further recognized through their inclusion in international rankings. An example is the Times Higher Education (THE) Impact Ranking [16], which is a global platform that assesses universities’ contributions to the UN Sustainable Development Goals (SDGs), notably SDG 13: Climate Action. While the THE Impact Ranking does not directly calculate a CF, a university’s strong performance across its four key areas (Research, Education, Outreach, and Stewardship), particularly in categories related to environmental sustainability, strongly suggests a commitment to practices that would likely reduce its CF. High rankings in areas like “Affordable and clean energy” and “Sustainable cities and communities” indicate actions being taken to reduce emissions, improve energy efficiency, and promote sustainable practices [17]. Many HEIs worldwide are thus actively calculating their CF as a crucial step towards achieving their sustainability goals. However, a major obstacle hinders their progress: the lack of a universally accepted method for measuring, reporting, and verifying how institutions offset their GHG emissions. This inconsistency leads to a significant issue: research on CFs produces widely varying results, making comparisons between institutions very difficult [18,19].
HEIs typically encompass a variety of buildings like classrooms, labs, libraries, gyms, offices, restaurants, cafeterias, dorms, swimming pools, etc. The size and complexity of these campuses can vary greatly, with some boasting of their own power plants, transportation networks, water systems, or even healthcare facilities. All these activities contribute to the institution’s CF through various emission sources. The specific sources and their corresponding emissions will depend on the unique characteristics of each HEI.
1.2. Literature Review
Extensive research has explored CF assessments in various sectors, including HEIs. Studies have examined the carbon emissions associated with campus operations, student and staff commuting, and embodied emissions in construction and procurement [15,20,21,22]. However, there remains a need for more comprehensive and standardized methodologies for assessing CF in HEIs, particularly concerning the inclusion of indirect emissions and the development of effective mitigation strategies. Universities often struggle to accurately report their GHG emissions, particularly the emissions categorized as Scope 3. While most institutions report direct emissions from owned or controlled sources (Scope 1) and indirect emissions from purchased energy (Scope 2), the complex and often much larger Scope 3 indirect emissions, which occur across the entire value chain, are frequently incomplete or missing. This is largely due to challenges in data accessibility and availability [15,22]. Although some Scope 3 categories, like waste, business travel, and commuting, are commonly included in university GHG inventories, others, such as procurement-related emissions, are often overlooked [22,23]. The sheer number of Scope 3 categories (fifteen in total) and the variability in data collection methodologies contribute to inconsistencies and underreporting, making it difficult to compare emissions across institutions. Several studies illustrate the variability in Scope 3 emissions reporting. Clabeaux et al. [24] included business travels, commuting, wastewater, waste, paper, and fertilizer, while Varón-Hoyos et al. [25] accounted for water, wastewater, paper, business travels, commuting, waste, construction, and transportation and distribution losses from purchased electricity. Yañez et al. [21] considered business travels, commuting, paper, and waste, while Kiehle et al. [26] included a broader range: business travel, property maintenance, general procurements, IT equipment, paper, waste management, restaurant services, and commuting. This lack of standardization and data accessibility hinders the accurate assessment of true environmental impacts and impedes the development of effective emissions reduction strategies. The discrepancy in reported Scope 3 emissions is substantial: some studies suggest they represent up to 90% of a university’s carbon footprint [27,28,29], while others estimate a much lower contribution of around 18% [30]. This wide range highlights the urgent need for improved methodologies and data collection to accurately capture the full extent of university emissions. This inconsistency has raised concerns among environmental professionals regarding potential biases in the representation of institutions due to varying accounting methods for indirect emissions [31,32].
To accelerate carbon neutrality, universities must meticulously track both on-campus carbon emissions and sequestration potential while minimizing waste, maximizing energy efficiency, and exploring innovative carbon offset strategies like implementing nature-based solutions, technology-driven innovations, circular economy practices, and community engagement [21,22,26]. By effectively implementing these strategies and sharing their experiences through case studies, universities can not only achieve carbon neutrality but also serve as inspiring models for sustainable development, paving the way for a future where cities and communities coexist harmoniously with the environment. This collective knowledge, gained from diverse case studies, can further refine existing methodologies, enhance the transparency of carbon assessments, and empower other institutions, especially local authorities, to embark on their own sustainability journeys [24,32].
1.3. Research Gap, Novelty, and Paper Structure
The CF profiles of HEIs exhibit significant variability based on factors like size, location, and operational practices. Notably, the specific CF profiles of different HEI types, particularly within Eastern Europe, remain under-documented. This lack of comprehensive data hinders the development of effective sustainability strategies and benchmarking across the region. This is especially pertinent within the context of climate-neutral initiatives, such as Mission 100, which aim to drive systemic change towards decarbonization. Although research on carbon footprints is widespread, the presence of inconsistent methodologies and reporting practices complicates the accurate comparison of results across different institutions. Furthermore, tracking the progress of an institution’s CF over time is essential in evaluating the effectiveness of sustainability initiatives, enhancing transparency and accountability, and fostering stakeholder trust, while also facilitating the establishment of measurable carbon reduction targets that ensure compliance with regulations and alignment with global climate objectives. Enhancing the availability and quality of CF data for Eastern European HEIs is crucial for the advancement of climate action and supporting the successful implementation of climate-neutral initiatives like Mission 100. This data gap highlights the importance of standardized methodologies and increased research efforts in this area.
Addressing this research gap in the literature is crucial for guiding effective climate action strategies within the higher education sector. Our research aimed to quantify the carbon footprint of a selected Eastern European university, located within a Mission 100 city, and to analyse how its operational activities and strategic initiatives align with, or could be optimized to support, the city’s climate neutrality objectives. To address these questions, we performed a detailed carbon footprint assessment of the Technical University of Cluj-Napoca (TUCN) from Romania to quantify its emissions and evaluate its potential contribution to the city’s climate neutrality goal.
This study’s aim is to offer the first comprehensive CF analysis for a Romanian HEI, focusing on TUCN. The study employs the GHG Protocol methodology and One Click LCA software (https://oneclicklca.com/), encompassing all three emission scopes (1, 2, and 3) across a two-year baseline period (2022–2023), to identify trends and impacts within TUCN’s footprint. This examination provides a robust framework for Romanian and international HEIs to develop effective, data-driven strategies to achieving carbon neutrality and sustainable urban environments. This study contributes significantly to Romania’s national climate action goals by providing a benchmark for the reduction of emissions and highlighting the importance of a holistic approach to CF management, including often-overlooked indirect emissions. Ultimately, this research expands the collective knowledge base on CF assessment in HEIs, informing effective decision-making processes for emission reduction initiatives and strengthening the commitment of universities to environmentally sustainable practices.
This paper is structured to provide a clear and logical progression of the analysis. The Introduction Section 1 establishes the context and significance of the study. The Materials and Methods Section 2 details the employed methodology, including the selection of One Click LCA software. The Case-study Section 3 provides specific information about the university as the subject of the analysis. The Results Section 4 presents the quantified carbon footprint, covering Scope 1, 2, and 3 emissions for multiple years. The Discussion Section 5 delves into the interpretation of these results, analysing trends, addressing limitations, and comparing findings with existing literature. The Conclusions Section 6 highlights key insights and recommendations for future sustainability efforts at the university.
2. Materials and Methods
A literature review conducted by the authors on CF methodologies revealed that the GHG Protocol guidelines were widely adopted [15,22,33]. Consequently, to facilitate comparison with other HEIs, the present research methodology for assessing TUCN’s carbon footprint is grounded in the principles of the GHG Protocol. Moreover, commercial software platforms like SimaPro and OpenLCA are frequently cited in the literature as tools used by HEIs for carbon footprint and life cycle assessment (LCA) studies [24,25,34,35,36,37]. Clabeaux et al. [24] utilized the Open LCA program to quantify a university’s carbon footprint, encompassing Scope 1, 2, and 3 emissions. Similarly, Silva et al. [35] leveraged Open LCA to conduct an LCA comparing in-person and virtual university courses during the COVID-19 pandemic. In contrast, Varón-Hoyos et al. [25] employed SimaPro software to determine that Scope 3 emissions, primarily from commuting and infrastructure construction, constituted a substantial 97% of the university’s total emissions.
CF and LCA methodologies diverge primarily in scope. A CF assessment focuses exclusively on quantifying GHG emissions, typically expressed in carbon dioxide equivalents (CO2e). A LCA, conversely, takes a broader perspective, encompassing a range of environmental impact categories that extend beyond GHGs. Consequently, CF assessments can be considered a specialized form of LCA, specifically addressing GHG emissions.
This study introduces a novel approach to assessing the CF of TUCN using One Click LCA software. One Click LCA is a powerful software tool designed to streamline and enhance the process of organizational carbon footprint assessment, particularly within the built environment and broader Scope 3 analyses. By meticulously applying the GHG Protocol, the software accurately quantifies GHG emissions across all three Scopes, providing a holistic view of the university’s environmental impact.
One Click LCA leverages the extensive Ecoinvent database—the source of the emission factors used in this carbon footprint assessment—to provide detailed reporting and visualization tools for effectively communicating CF data to diverse stakeholders. Its extensive dataset empowers organizations to identify environmental hotspots, inform data-driven decisions, set sustainability targets, and track progress towards environmental compliance and performance goals. While tools like SimaPro and OpenLCA offer broad LCA functionalities, One Click LCA’s specialized focus, user-friendliness, and robust Scope 3 capabilities, along with its integration and reporting features, give it a distinct advantage for organizational CF assessments, especially within the built environment. Its ability to integrate with industry-standard databases and provide clear reporting further enhances its value. For HEIs with large building infrastructures, One Click LCA is a very strong option.
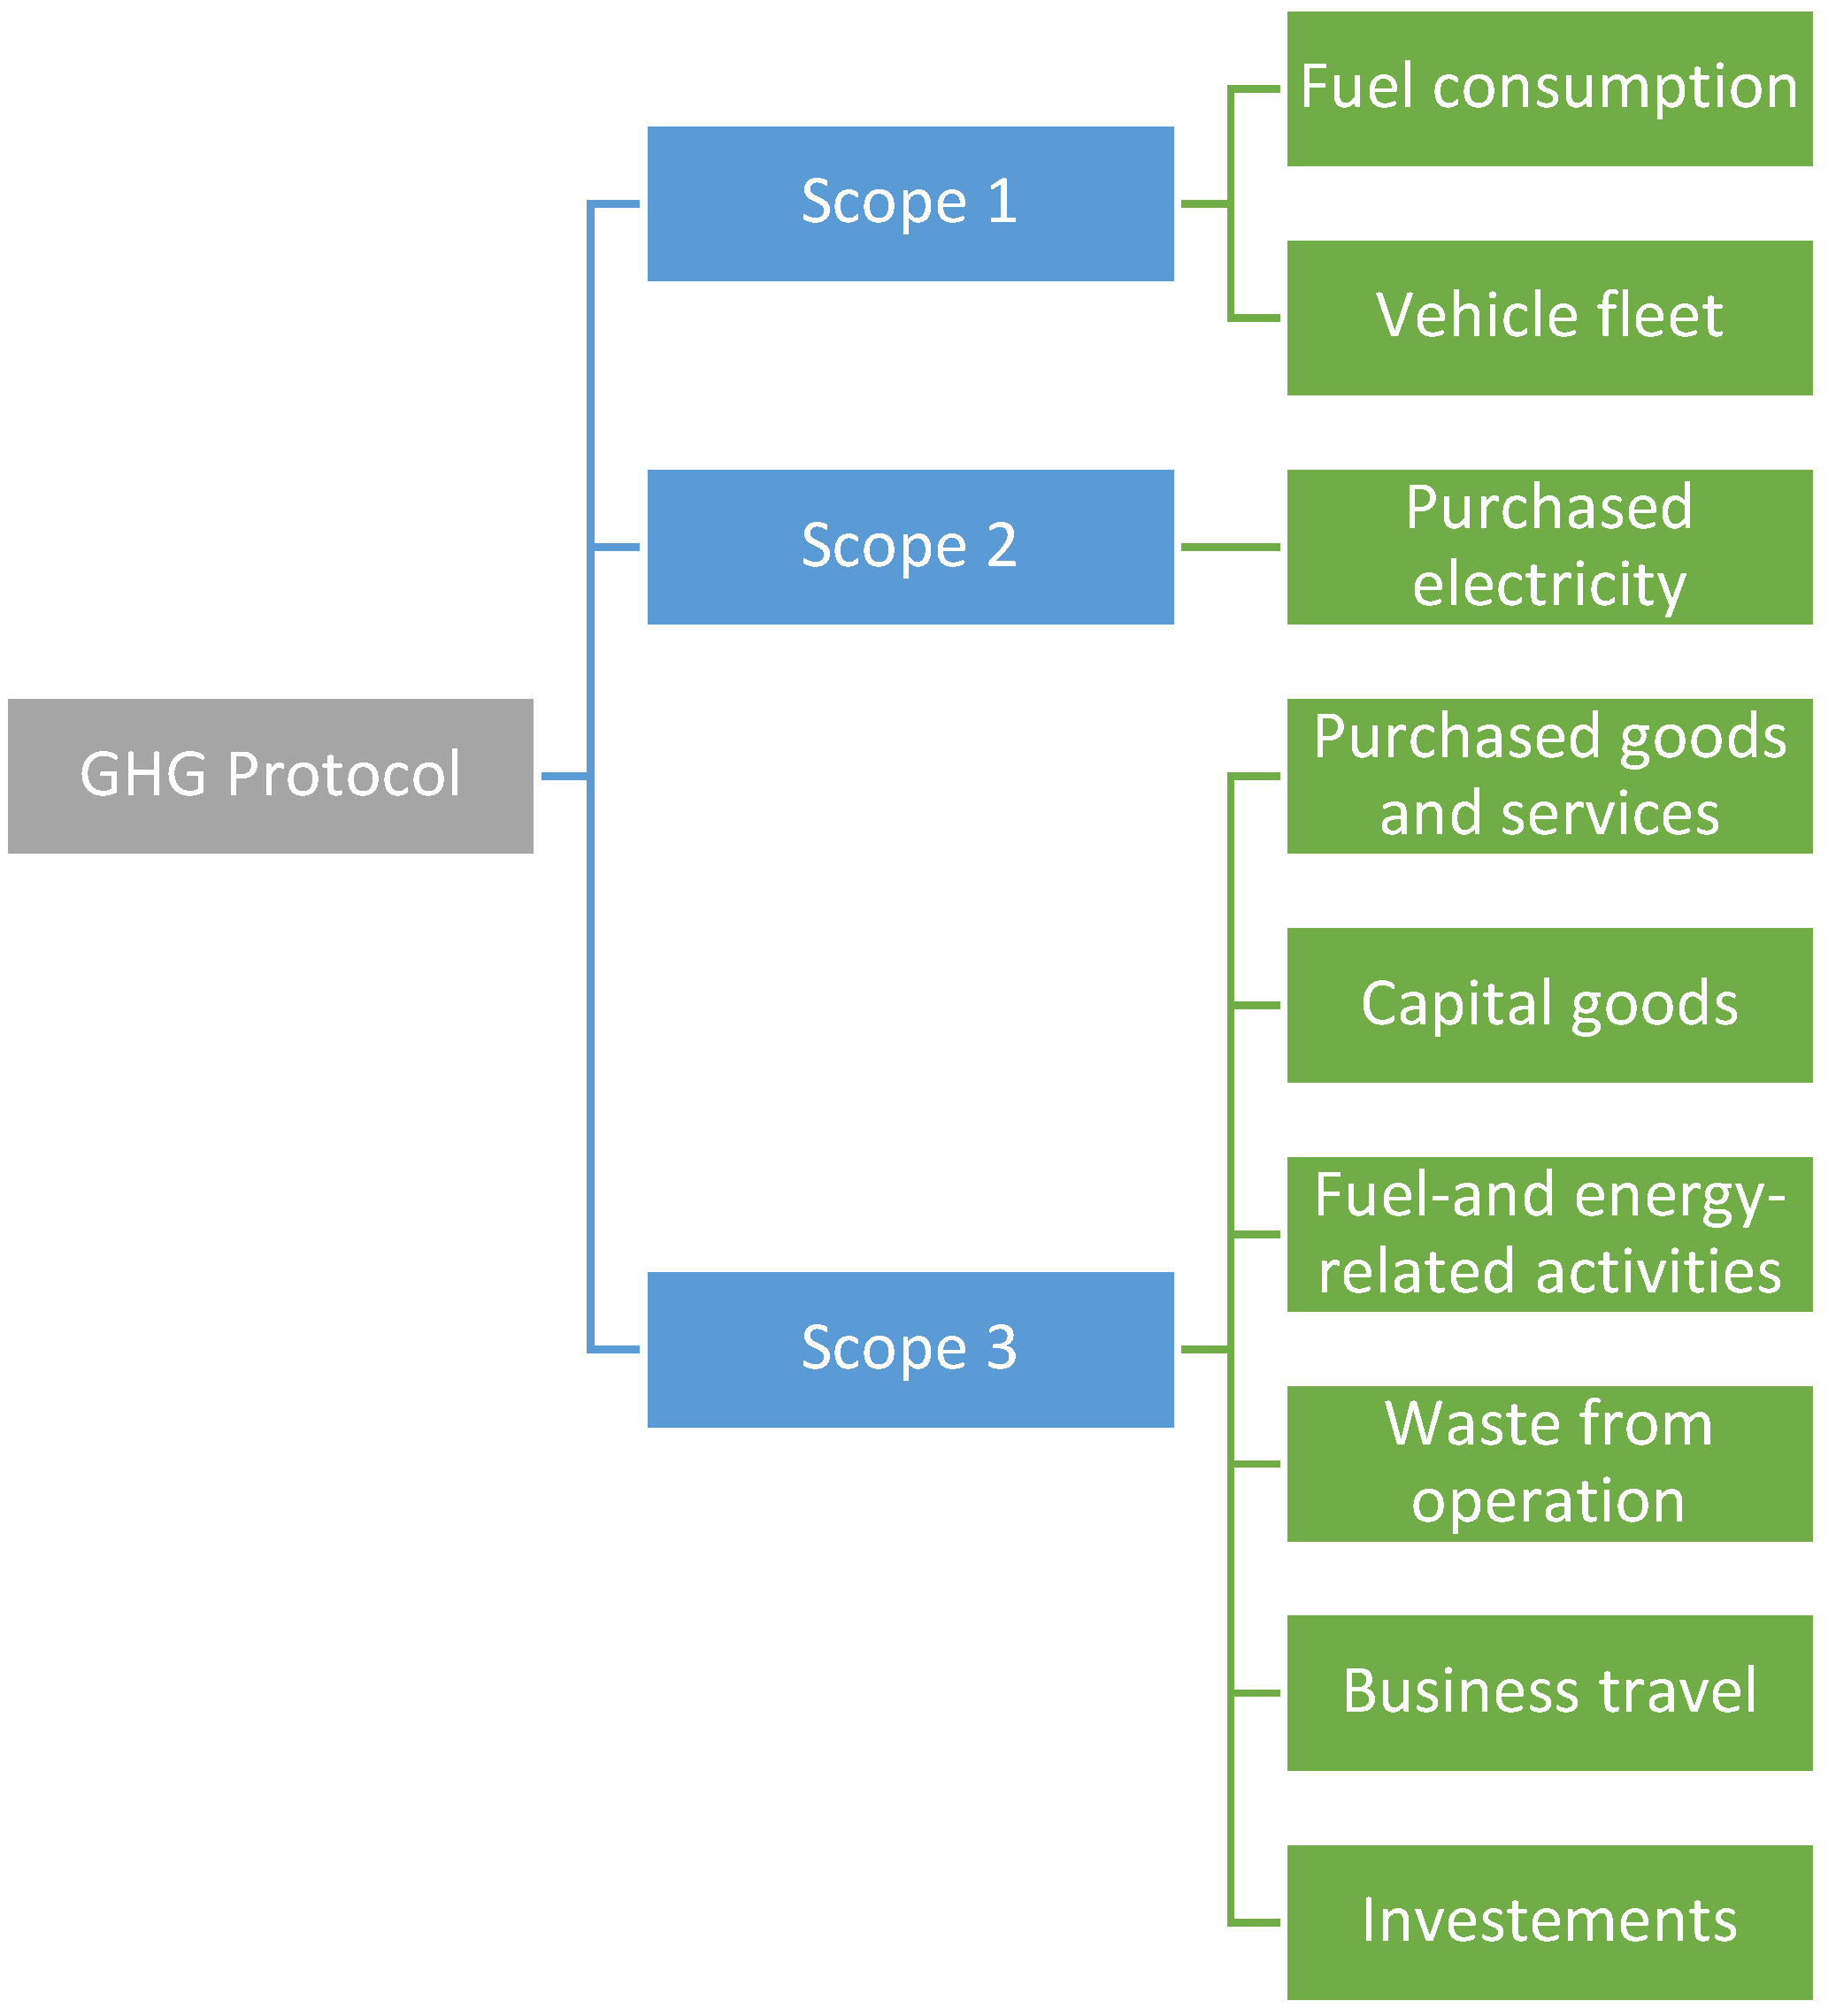
The main goal of this study is to transparently report the contribution of each Scope, according to GHG Protocol methodology, to assess the overall emissions level associated with operations of TUCN. This assessment will thus provide a clear picture of the university’s environmental impact and serve as a foundation for implementing effective emission reduction strategies. To provide a comprehensive understanding of the GHG Protocol methodology, a detailed flowchart has been developed and is presented in Figure 1.
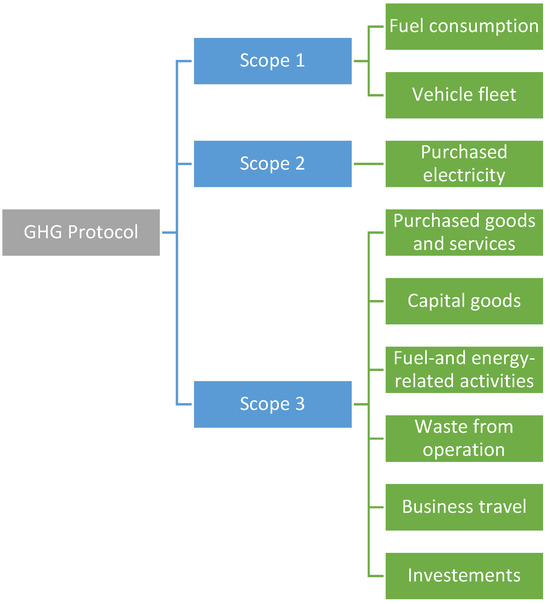
Figure 1.
Flowchart of GHG Protocol methodology.
2.1. Scope 1
Direct GHG emissions from an institution’s owned or controlled sources are classified as Scope 1 emissions. This category includes emissions released from the combustion of fuels in boilers and vehicles that the company owns or operates.
The university’s on-site thermal power generation facilities produce direct GHG emissions. These facilities combust natural gas, and the associated emissions were quantified by multiplying the annual fuel consumption (expressed in MWh) by the emission factor (0.21 kgCO2e/kWh). The university’s vehicle fleet consists of diesel-powered transporter vans, deployed for various university events, excluding employee commuting. The methodology employed for calculating fleet emissions involved multiplying the annual distance traveled (km) by each vehicle by its associated emission factor (0.0659 kgCO2e/km). For the purposes of this CF analysis, the university’s technical–administrative department provided the requisite data.
2.2. Scope 2
Indirect GHG emissions resulting from an institution’s consumption of purchased electricity, heat, or steam are classified as Scope 2 emissions. These emissions are generated at the energy provider’s facilities, not the company’s own, and are therefore outside of the company’s direct control.
The GHG Protocol requires reporting Scope 2 emissions using two separate methods: location-based and market-based. The first one uses national average emission factors for the effective electricity use from the contracted retailers, while the latter uses residual mix data, typically reported by national energy authorities in the EU. Given the university’s initial focus on understanding its emissions and potential resource constraints, the GHG Protocol offered a cost-effective and efficient approach. While ISO 14064, with its rigorous verification, is valuable for certifications or external assurance, the GHG Protocol’s ease of use and wide adoption made it the optimal choice for the university’s current needs, allowing for effective tracking and comparison with other institutions. The environmental impact associated with Scope 2 emissions was determined by multiplying the annual volume of purchased electricity (MWh) by the corresponding location-based (0.44 kgCO2e/kWh) and market-based (0.33 kgCO2e/kWh) emission factors. Data on purchased electricity consumption for the specified reporting period were obtained from utility bills provided by the university’s technical–administrative department.
2.3. Scope 3
Scope 3 emissions, representing indirect GHG emissions from sources not owned or controlled by a company, are categorized as upstream and downstream [10]. Upstream emissions include purchased goods and services, capital goods, fuel- and energy-related activities (outside Scope 1 and 2), transportation and distribution, waste from operations, business travel, employee commuting, and leased assets. Downstream emissions encompass the transportation and distribution of sold products, processing and use of sold products, end-of-life treatment of sold products, downstream leased assets, franchises, and investments. Analysing these emissions provides a holistic view of a company’s value chain emissions.
The academic context within which HEIs operate shapes their environmental impact profile. While commercial organizations often have complex product life cycles and extensive distribution networks, universities’ activities are centred mainly on teaching and research. As a result, several Scope 3 categories, specifically fuel and energy activities (beyond Scopes 1 and 2), upstream distribution and transportation, downstream distribution and transportation, processing, use, and end-of-life treatment of sold products, and franchises, are less pertinent to the HEI setting. Universities, for instance, rarely have “sold products” in the traditional commercial sense, making the associated downstream emissions less applicable.
The quantification of Scope 3 emissions presents a greater degree of complexity compared to Scope 1 and 2, primarily due to the inherent variability and complexity of the requisite data. Specifically, the assessment of indirect, non-energy-related emissions within Scope 3 necessitated the utilization of financial data for the estimation of certain categories, owing to the limitations of available quantitative metrics.
2.3.1. Purchased Goods and Services
This category includes a wide variety of purchased goods, ranging from common office supplies, such as paper and pens, to specialized materials essential for the university’s diverse operations. These include cleaning supplies, educational and laboratory materials, and items required for building maintenance and repairs. Moreover, the services for property maintenance and landscape were included in this category. Given the variety of these purchased goods and services, and the size of TUCN, a detailed inventory of individual items was impractical. Therefore, the environmental impact was calculated based on aggregated procurement costs provided by TUCN’s accounting department. This approach allows for a reasonable estimation of the overall impact of purchased goods within this category.
2.3.2. Capital Goods
This category encompasses emissions associated with the acquisition, transport, and utilization of durable assets employed in operational activities but not intended for resale. These assets, characterized by their longevity, include items such as buildings, machinery, equipment, and vehicles. A distinction is drawn between capital goods and purchased goods and services, with the latter typically consumed or utilized within a shorter time frame. Within the TUCN context, capital goods include laboratory equipment, building renovations, research vessels, and IT equipment. The environmental impact of these assets was calculated by multiplying the procurement expenditures, as documented in the rector’s annual report, by an emission factor of 0.54 kgCO2e/euro.
2.3.3. Fuel- and Energy-Related Activities
In this category, water and wastewater were considered. Water usage itself is not directly categorized under any of the GHG Protocol scopes (Scope 1, Scope 2, or Scope 3) because it does not directly result in GHG emissions. However, the energy used to treat, transport, or heat water can result in GHG emissions, which can be categorized under different scopes, depending on the source of the energy. While TUCN does not directly manage water and wastewater treatment and transport, the university is indirectly responsible for the associated emissions. To assess the environmental impact, TUCN’s water and wastewater consumption in cubic meters (m3), as provided by the technical–administrative department, was multiplied by the emission factors of 0.0003 kgCO2e/m3 for water and 0.39 kgCO2e/m3 for wastewater, respectively.
2.3.4. Waste from Operations
This category includes GHG emissions from the handling, treatment, and disposal of waste generated by university operations. Various waste streams are considered, such as paper, plastic, mixed waste, metal, concrete, and electronic waste. The emissions accounted for here are those occurring after the university’s control, encompassing waste transportation, landfill methane, incineration emissions, and avoided emissions from recycling. The collection of granular waste data across a geographically dispersed university campus presents inherent challenges. However, TUCN’s environmental protection department maintains a comprehensive database of waste generation, measured in kilograms (kg), for all institutional locations. This data repository provided the basis for the calculation of waste-related greenhouse gas emissions, utilizing the following emission factors, differentiated by waste stream: paper (0.0078 kgCO2e/kg), plastic (2.38 kgCO2e/kg), mixed waste (0.37 kgCO2e/kg), metal (0.0078 kgCO2e/kg), concrete (0.0111 kgCO2e/kg), and electronic waste (0.0616 kgCO2e/kg).
2.3.5. Business Travel
Business travel emissions encompass GHG emissions associated with travel undertaken by university staff for official university purposes. These emissions can be a significant contributor to a university’s carbon footprint, as they include a variety of travel modes and distances. At TUCN, gathering precise individual travel data is challenging due to the decentralized nature of the institution. Therefore, travel expenses provided by the accounting department were used as a basis for estimating the environmental impact of business travel. The emission factor associated with business travel is 0.25 kgCO2e/euro. This methodology provides a reasonable estimate of the overall impact.
2.3.6. Investments
This Scope 3 category pertains to the quantification of indirect GHG emissions attributable to an institution’s financial investment portfolio. The “Investments” category is generally defined to encompass emissions arising from external financial instruments, including, but not limited to, equity holdings, debt instruments, and real estate investments. TUCN’s rector’s annual report identifies investments in real estate, which are thus included within this category for the purposes of this carbon footprint assessment.
3. Case Study: Technical University of Cluj-Napoca
Situated in the heart of Transylvania, Romania, the Technical University of Cluj-Napoca serves as a pivotal centre for higher education and research. The university offers an extensive array of academic programs spanning disciplines such as engineering, architecture, physical sciences, and social sciences. Students can commence their academic pursuits by enrolling in one of the 88 bachelor’s programs, further their expertise through 91 master’s degree programs, and engage in doctoral studies across 16 distinct fields.
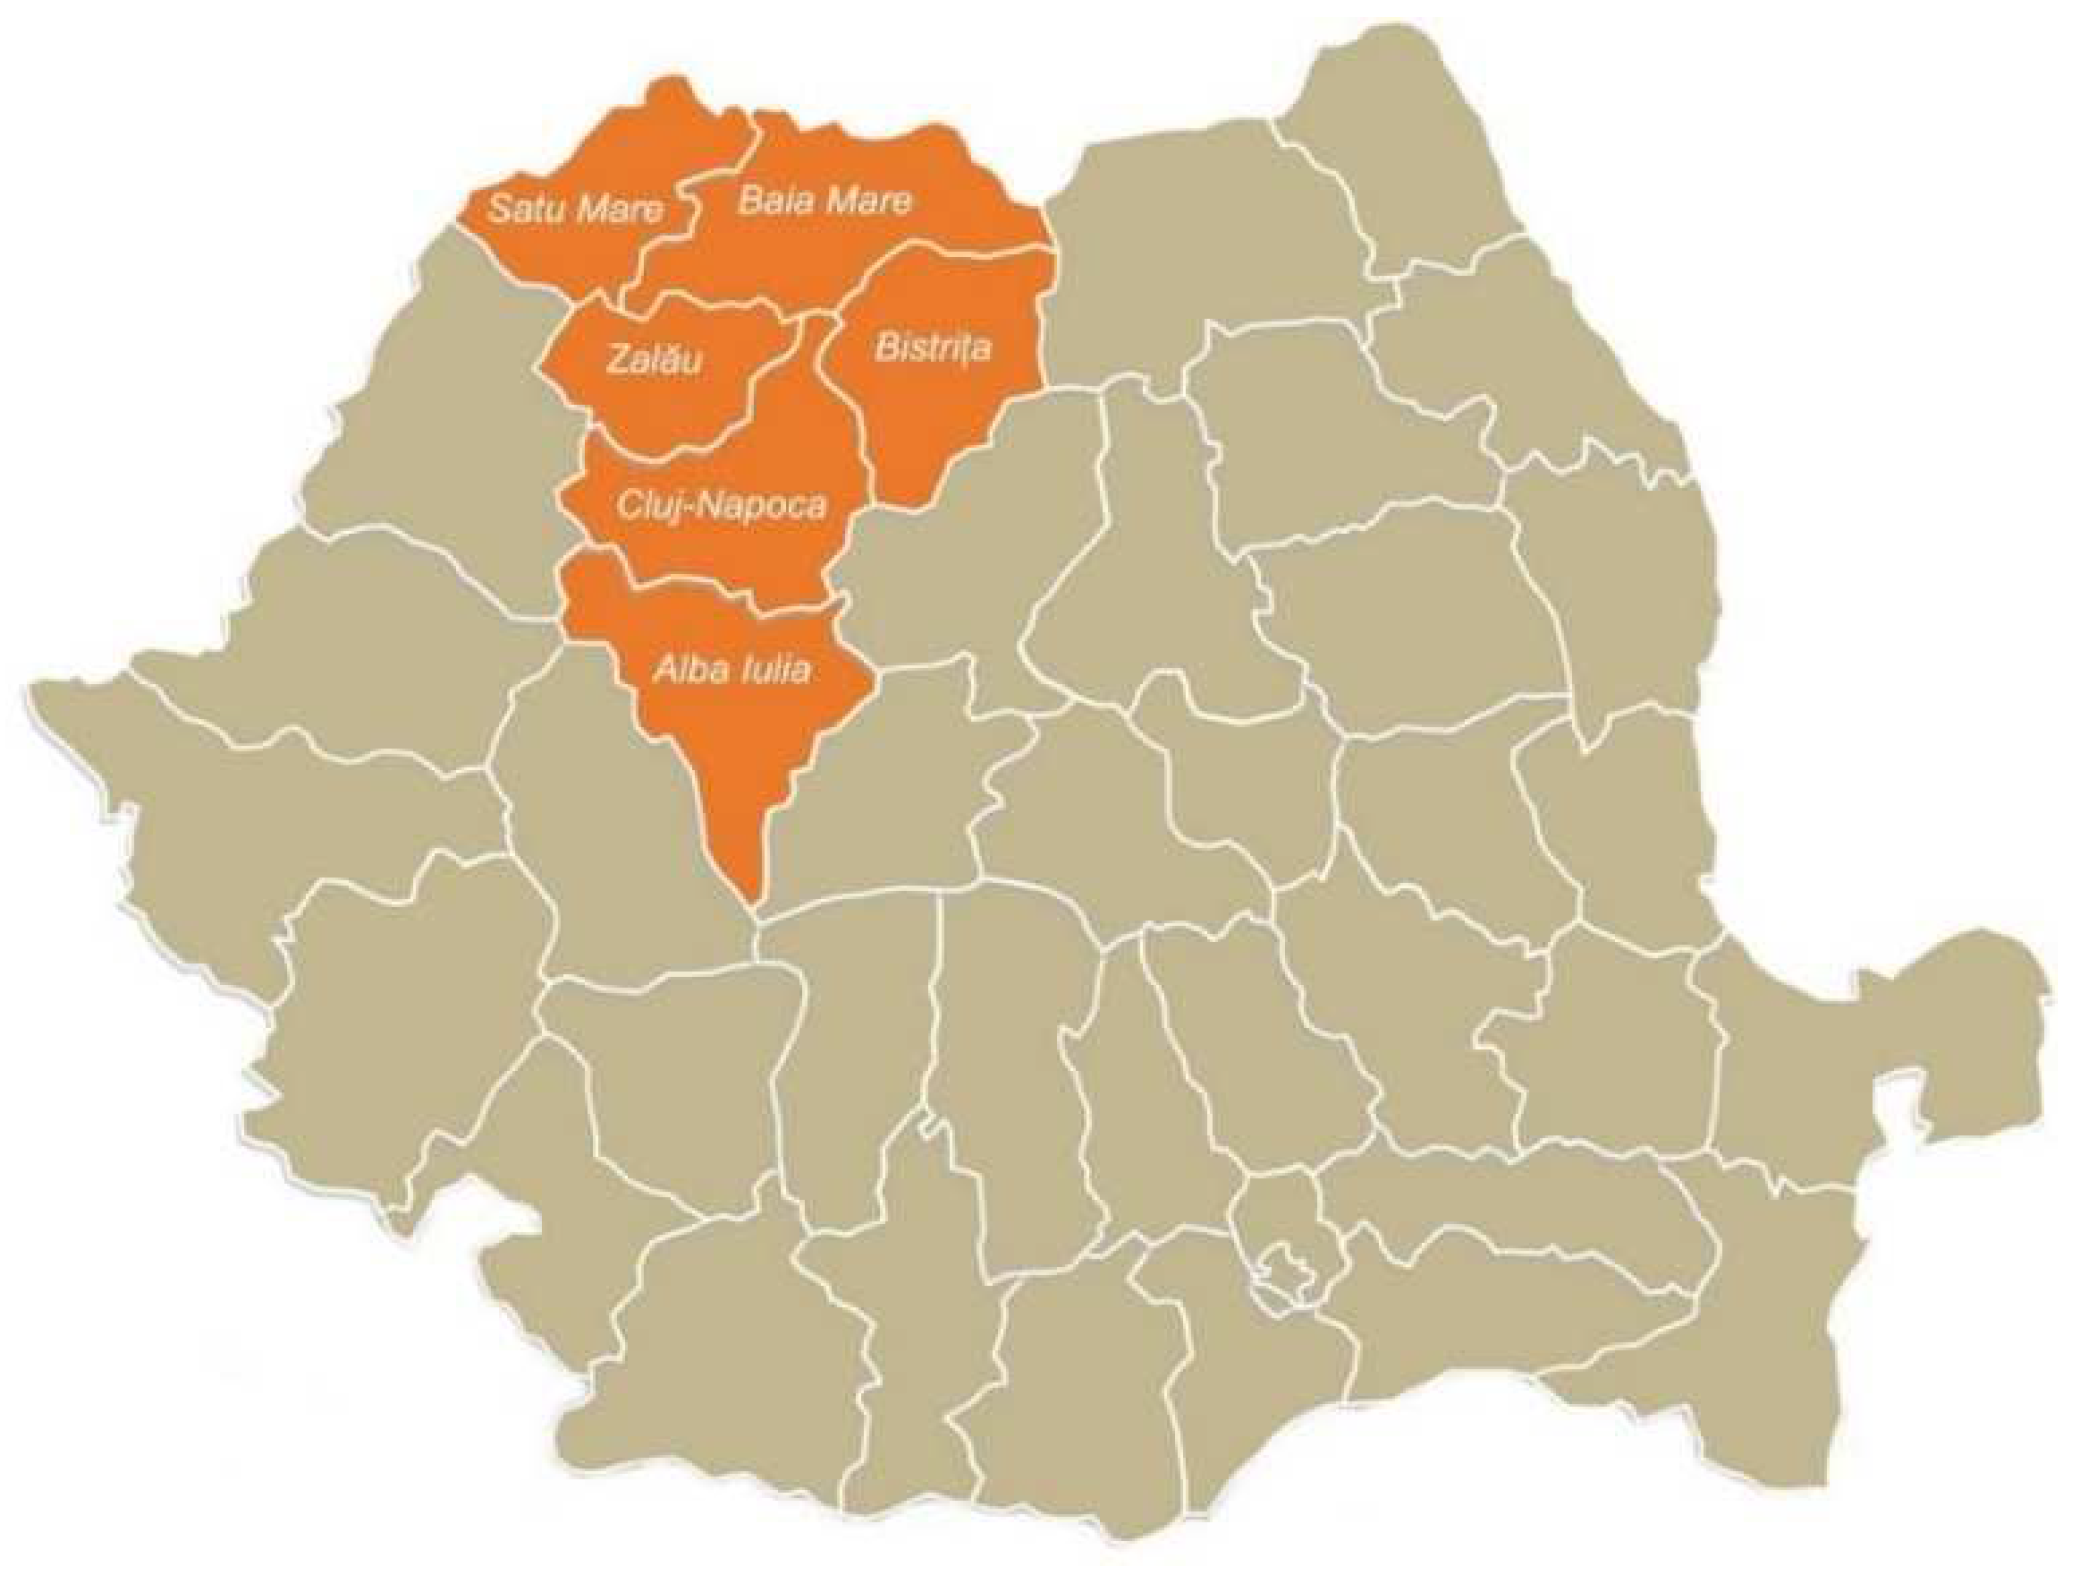
TUCN encompasses 12 (twelve) faculties distributed across two main university centres: Cluj-Napoca, one of the selected cities in the climate-neutral and smart cities Mission, and Baia Mare, a city known for its rich mining history and local heritage preservation from across Maramures county. TUCN’s commitment to education extends beyond these core locations. The HEI has established four extensions in Alba Iulia, Zalau, Bistrița, and Satu Mare (as depicted in Figure 2). This network ensures that quality education is readily accessible to a wider community, fostering a diverse and geographically inclusive student body.
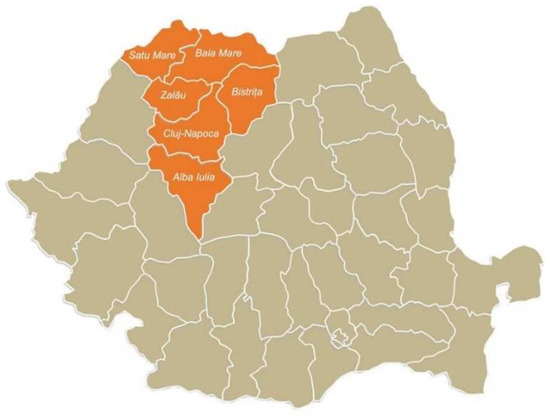
Figure 2.
Map of TUCN’s locations in Romania.
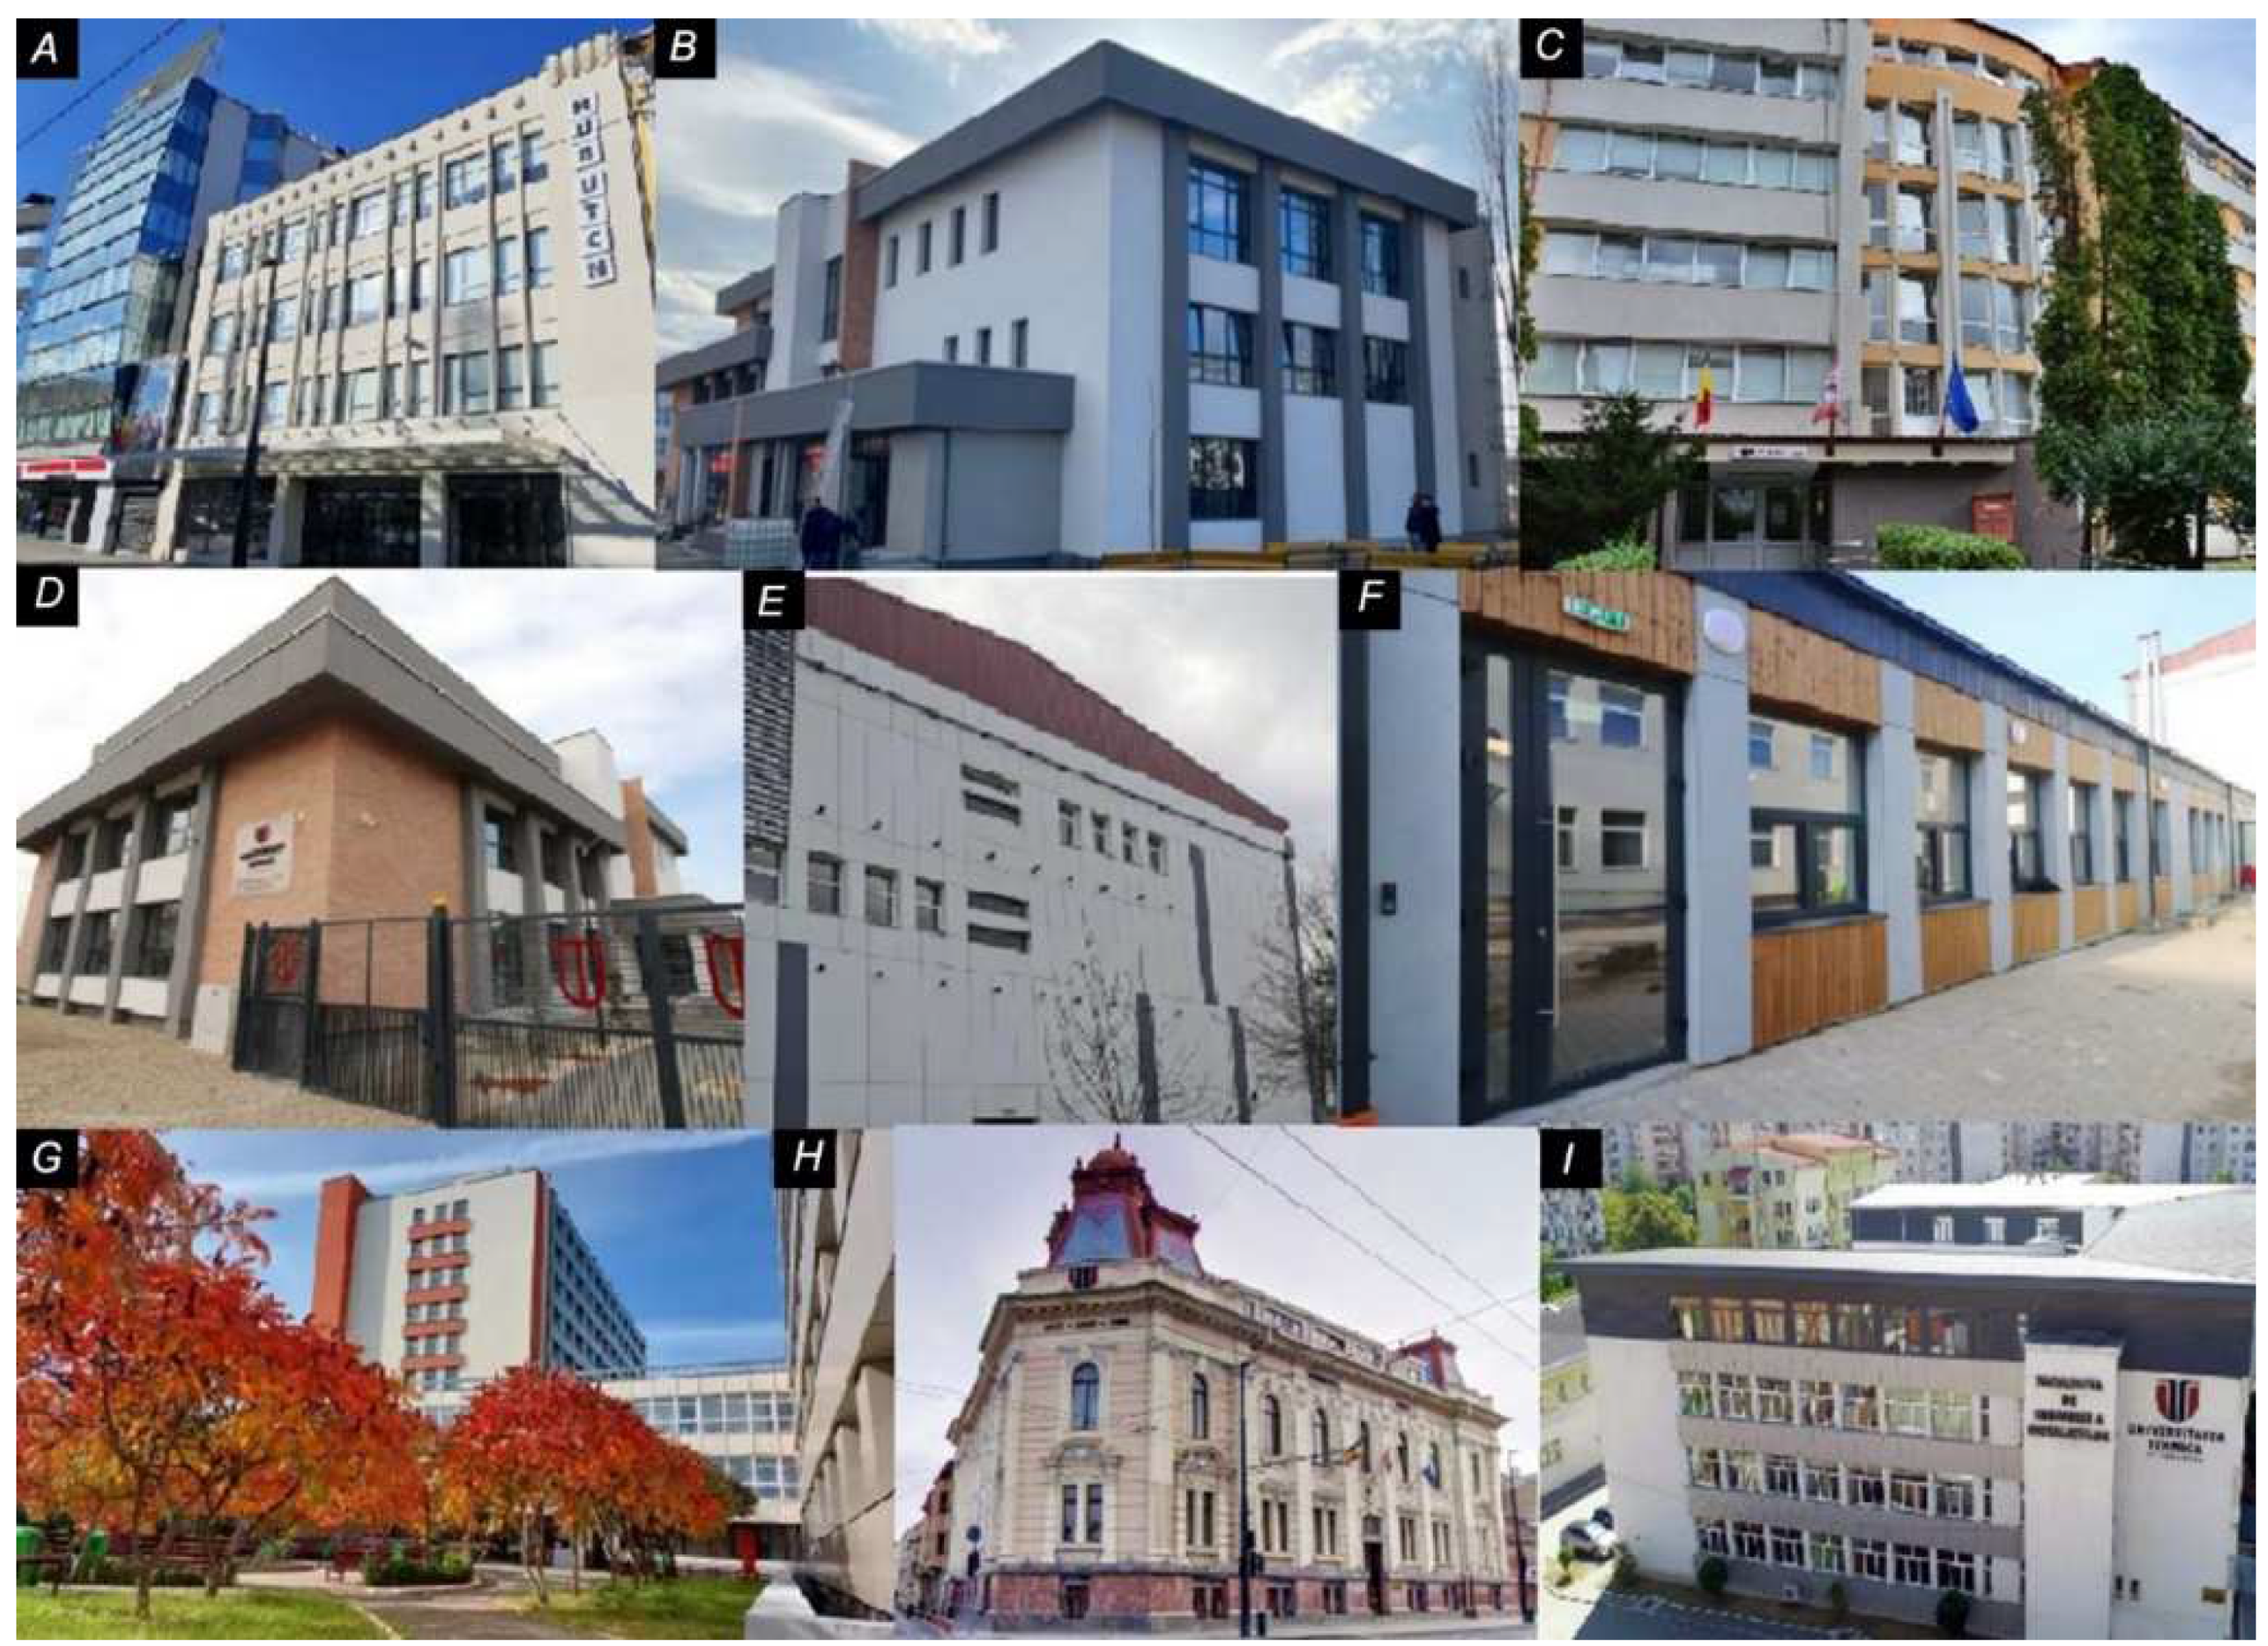
TUCN boasts a physical footprint encompassing 78 buildings across 238,678 square meters (m2) of useful indoor area. Some of the HEI’s assets can be observed in Figure 3.
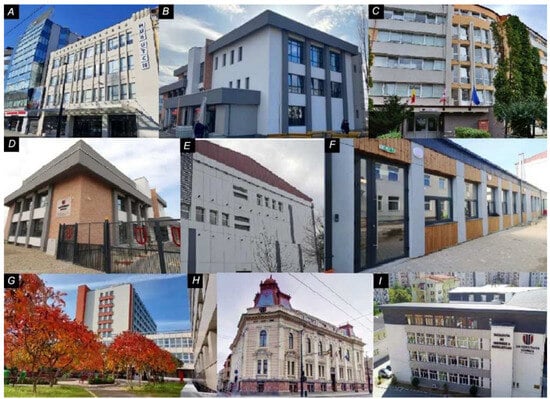
Figure 3.
Assets of the Technical University of Cluj-Napoca: HUB building (A); Alba-Iulia buildings (B,D); Cluj-Napoca students’ dormitories (C,G); Cluj-Napoca faculties buildings (E,F,I); Cluj-Napoca Rectorate building (H).
Thriving with a dynamic academic community of over 18,000 students each year, TUCN offers the guidance and support of a team exceeding 1700 academic and administrative staff. Committed to providing a modern and well-equipped learning environment, the university continuously invests in renovations, refurbishments, and upgrades to its extensive facilities, but at this moment without a clear roadmap to reaching carbon neutrality.
University management plays a vital role in shaping a sustainable future by integrating SDGs into its core mission, at this moment at the level of just reporting the annual state. This strategic commitment fosters collaboration between higher education, the business community, and international partners. Such collaborative efforts are recognized by the THE Impact Ranking, which highlights TUCN’s achievements in integrating sustainability into its programs and research. This is evidenced by TUCN’s placement among the top 100 universities globally in the categories of “Affordable and clean energy” and “Quality education”. Further solidifying its commitment, TUCN ranks between 301–400 in the “Sustainable cities and communities” category [38]. These recognitions underscore TUCN’s ongoing dedication to embedding these crucial SDGs into its educational and research endeavours.
Encompassing all TUCN’s facilities, this study proposes a two-year approach (2022–2023) as a baseline to calculate the CF and analyse data to identify trends and impacts within the university. It further compares these findings with data from other HEIs to provide a broader context.
4. Results
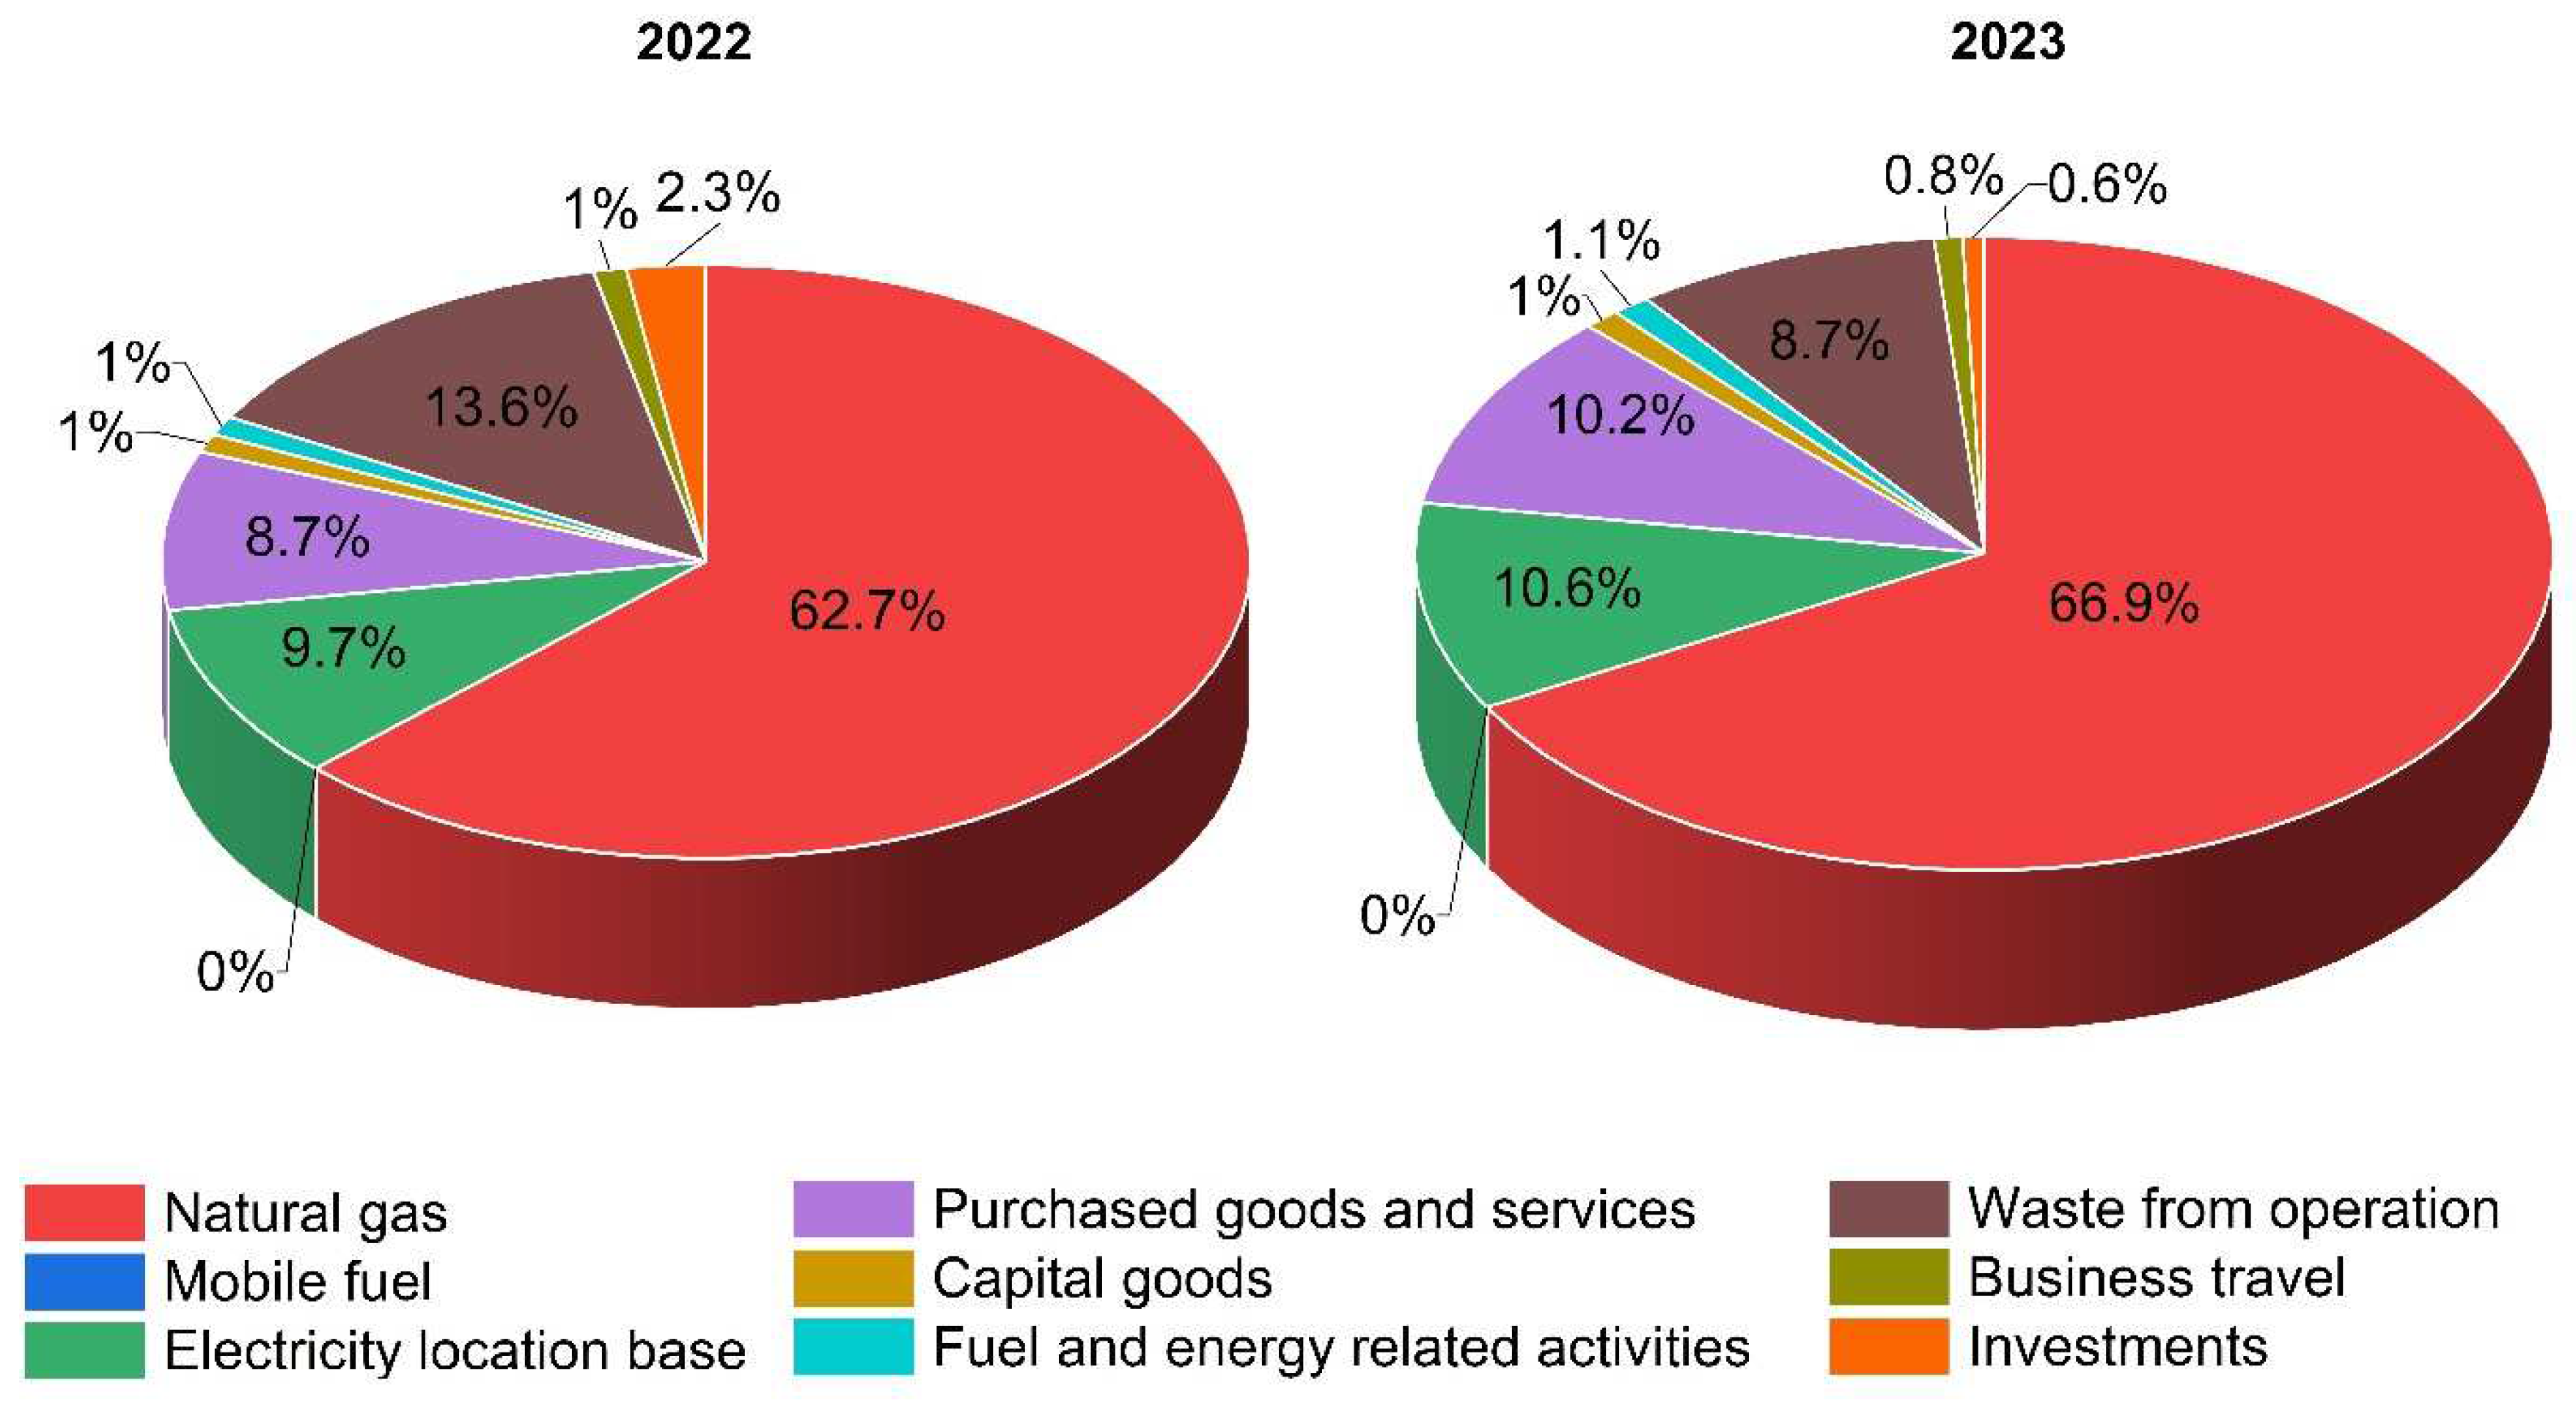
TUCN’s carbon footprint, encompassing all three Scopes, amounted to 7445.1 tCO2e/year in 2022. This figure exhibited a slight decrease to 7229.1 tCO2e/year in 2023. For an easier comparison with other HEIs, the CF was calculated on a per-person basis. In 2022, emissions were 0.378 tCO2e/person, and in 2023, they decreased to 0.362 tCO2e/person. These calculations were based on a total of 19,722 and 19,985 individuals (students, academia, and staff) in the university community, respectively. Additionally, a footprint of 31.2 kgCO2e per square meter (kgCO2e/m2) was calculated in 2022, which decreased to 30.3 kgCO2e/m2 in 2023. These figures were determined using the university’s occupied indoor area of 238,678 m2. Next, a detailed CF breakdown by category is visualized in Figure 4, with corresponding numerical data provided in Table 1.
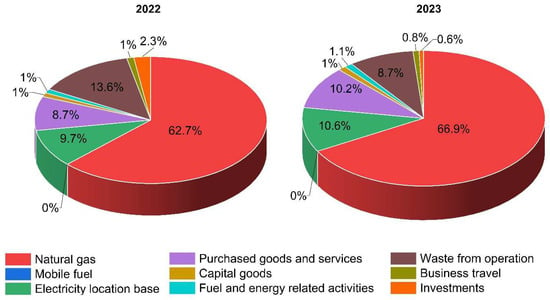
Figure 4.
TUCN’s carbon footprint by category in % for the year 2022 (left) and 2023 (right).

Table 1.
Carbon footprint of the HEI in 2022 and 2023.
Stationary fuel use, primarily natural gas, represented the most significant contributor to TUCN’s CF in both 2022 and 2023, accounting for approximately 62.7% and 66.9%, respectively. This substantial reliance on fossil fuels for heating and domestic hot water generation is largely attributable to TUCN’s location in a region classified as a humid continental climate (Dfb) according to the Köppen climate classification system [39]. This climate type experiences cold winters and warm summers, requiring significant energy for heating during the 6–8 coldest months. The observed increase in Scope 1 GHG emissions by 3.6% from 2022 to 2023 is directly linked to the completion and subsequent use of two university facilities that had previously undergone refurbishment. These newly operational buildings contributed in 2023 to increased direct emissions. Concurrently, the decrease in waste from operations observed between 2022 and 2023 is a consequence of the reduced construction and demolition waste associated with the completion of the renovation project.
Table 1 presents Scope 2 GHG emissions in accordance with the GHG Protocol’s dual reporting requirements, utilizing both location-based and market-based methodologies. However, the total emissions presented in the table are derived exclusively from location-based emissions data due to higher values and do not incorporate the market-based emissions. The observed increase of electricity GHG emissions by 7.1% from 2022 to 2023 can be attributed to a combination of factors, primarily driven by the university’s evolving operational activities. Notably, the completion and subsequent use of the refurbished facilities played a significant role. These facilities, now fully operational, naturally increased the university’s overall energy demand, leading to higher electricity consumption. However, when isolating the natural gas consumption of facilities operational in both 2022 and 2023, a more modest 1.5% increase in Scope 1 emissions is observed. This suggests that the increase in natural gas usage in existing facilities may be influenced by external factors, such as variations in outdoor temperatures between the two years, which would affect heating demands.
Going further with Scope 2, the negative value of −2.39 tCO2e reported in Table 1 for self-generated renewable energy represents a net emission reduction resulting from TUCN’s 2023 installation of a photovoltaic (PV) system. This value is an accounting adjustment reflecting the offset of emissions attributable to the renewable energy generated.
Scope 3 emissions represent a significant portion of TUCN’s overall CF, accounting for approximately 28.3% and 23.1% of total emissions in 2022 and 2023, respectively. In 2022, the “Waste from Operations” category constituted the largest source of Scope 3 GHG emissions, representing 13.6% of the total emissions profile, followed by “Purchased Goods and Services” with a share of 8.7%, as depicted in Figure 3. In 2023, the category “Purchased Goods and Services” increased to 10.2% of total emissions, becoming the most significant contributor, while “Waste from Operations” experienced a substantial decrease of 60.8% (see Table 1), representing 8.7% of total emissions. This major decrease in “Waste from Operations” emissions from 2022 to 2023 is attributed to the completion of major building renovations in 2023 which significantly altered the university’s waste stream. In 2022, during the construction phase, a considerable amount of construction and demolition waste was generated, contributing substantially to the “Waste from Operations” category. With the completion of these projects, this source of waste was significantly reduced in 2023.
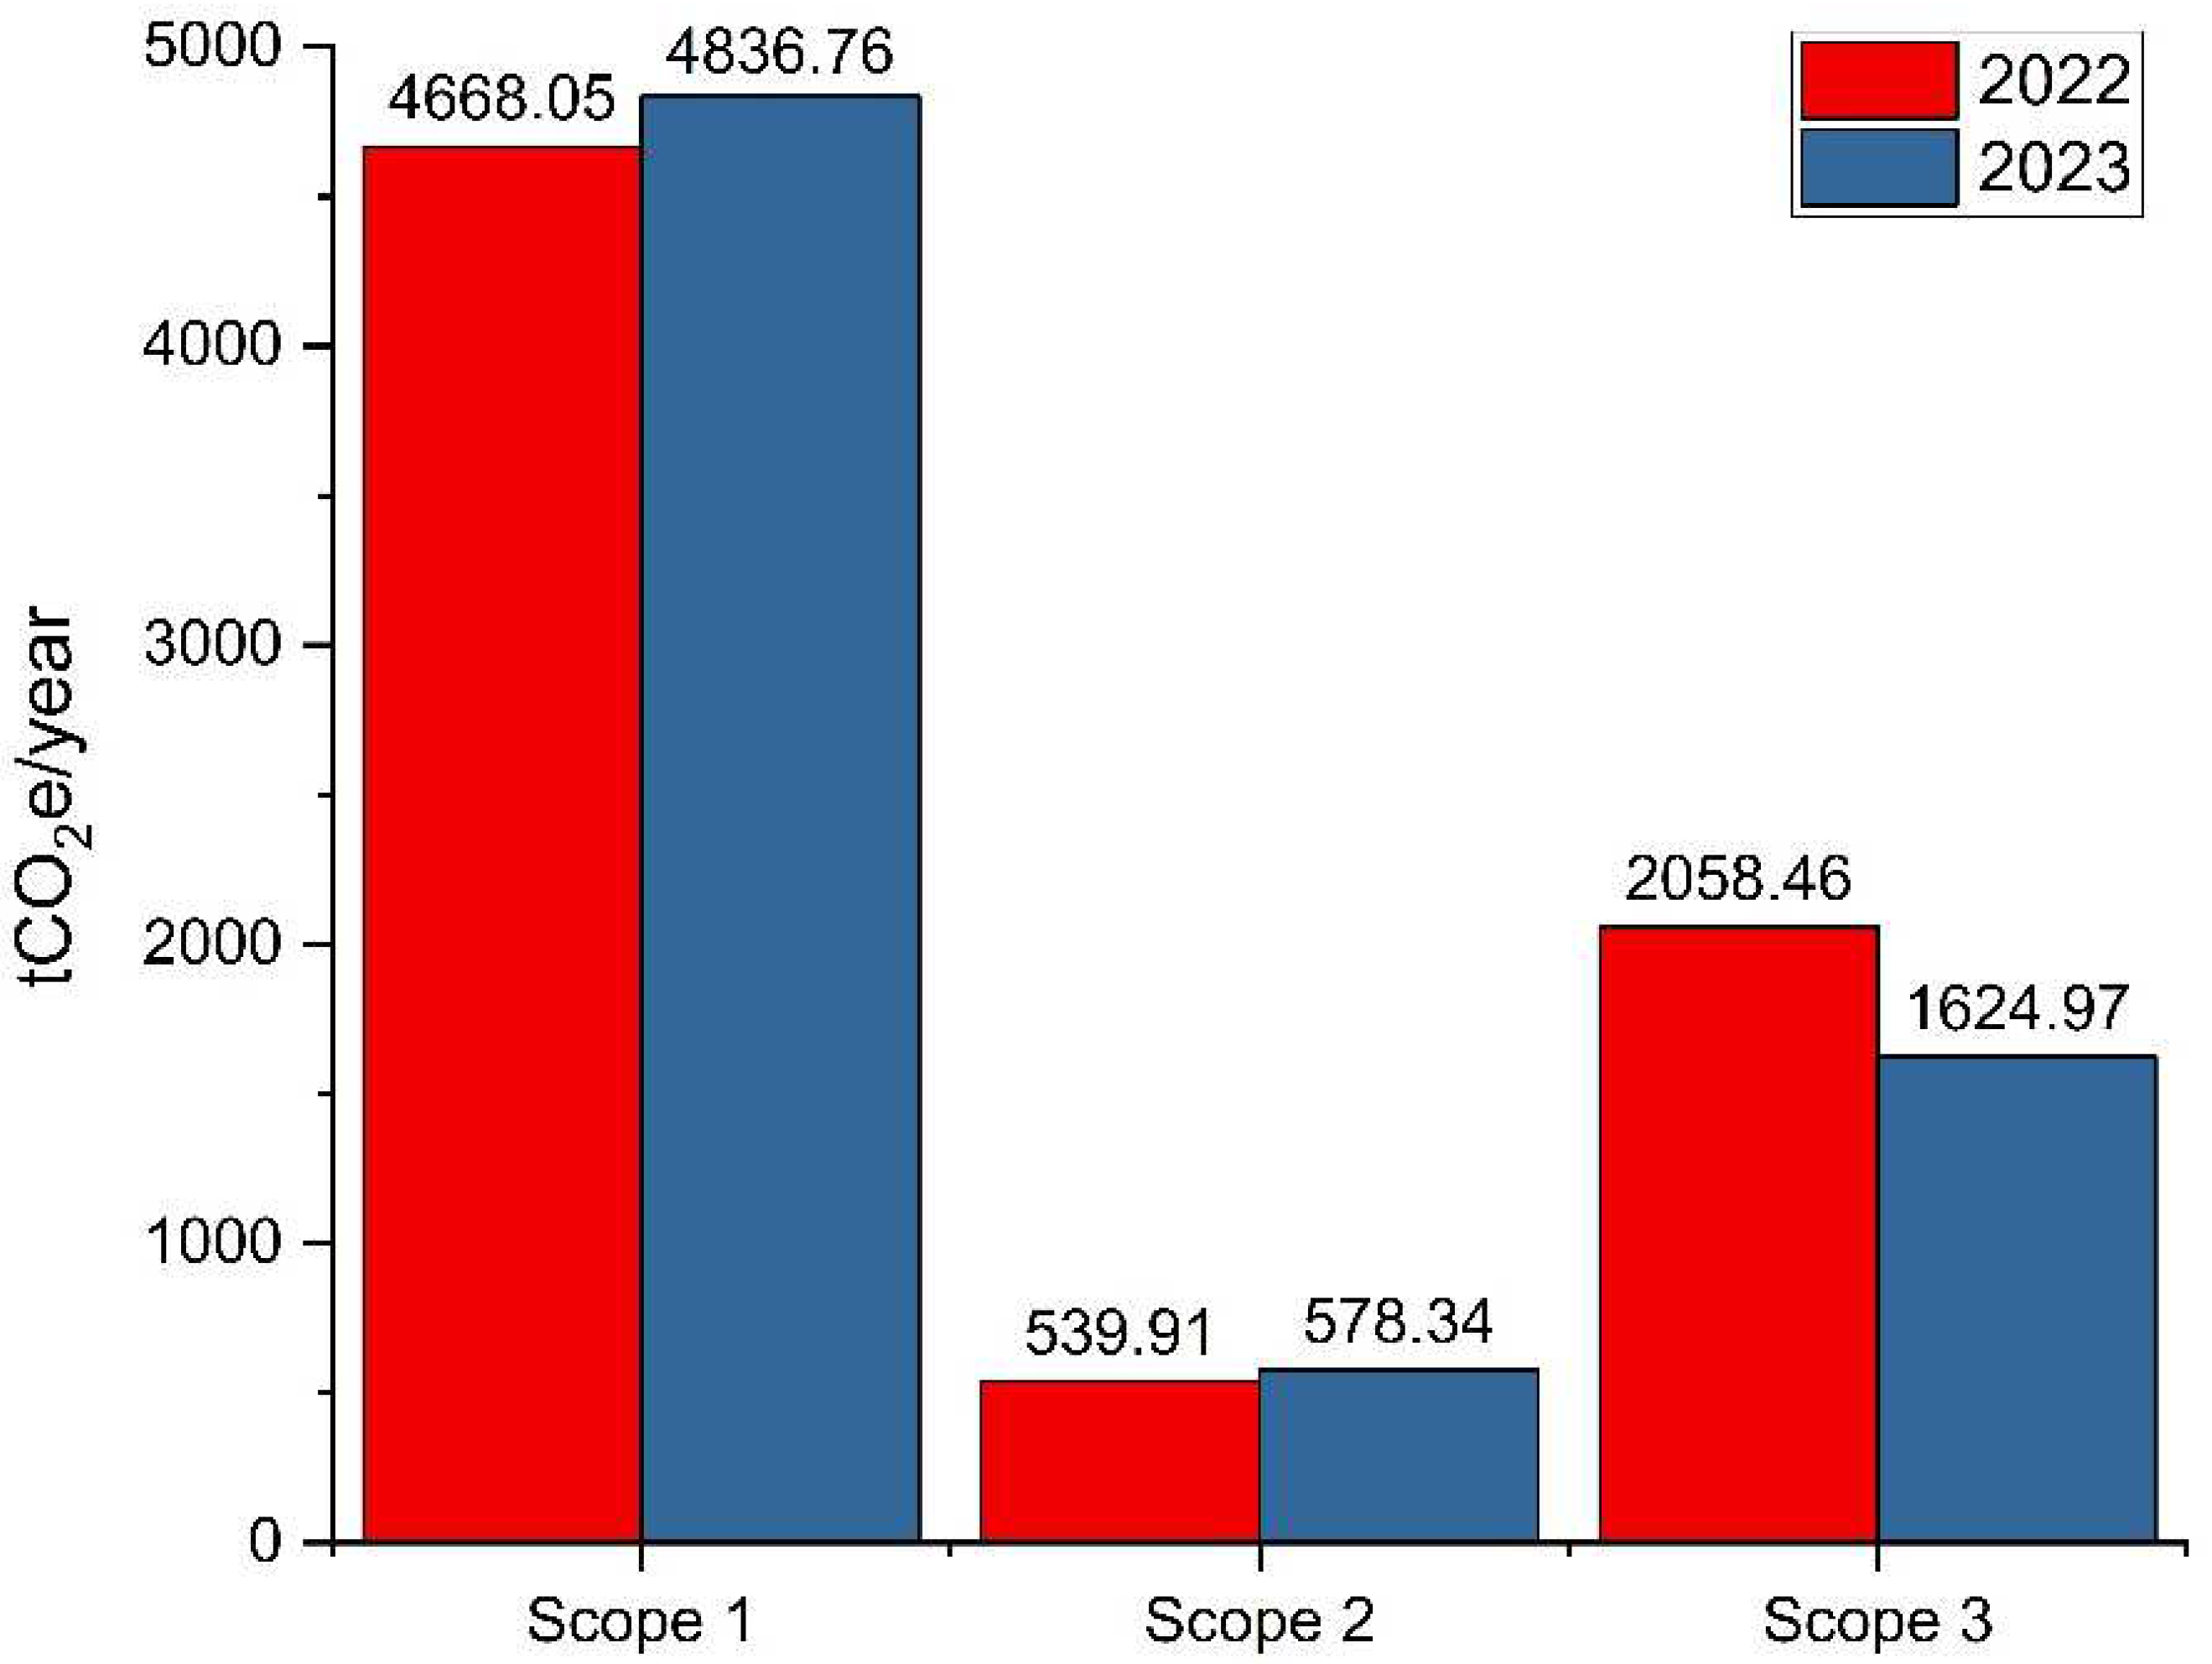
To gain a deeper understanding of the environmental impacts associated with each Scope, Figure 5 provides a detailed breakdown of the emissions for 2022 and 2023.
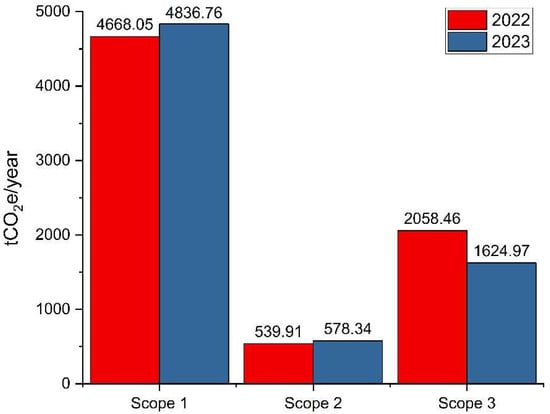
Figure 5.
TUCN’s carbon footprint by Scope in tCO2e/year.
Driven by its sustainability goals and the need to modernize its infrastructure, TUCN launched a major, multi-phased building renovation project in 2020. This initiative encompasses numerous facilities across campus and focuses on improvements in energy efficiency and environmental impact reduction. Given the ongoing building renovations during the reported period of this study, the environmental impacts of these initiatives are primarily reflected in Scope 3 emissions, which include purchased goods and services and waste from operations, activities associated with the renovation process. This significant proportion underscores the crucial role of Scope 3 emissions in the overall CF assessment. The renovation process temporarily increased Scope 3 emissions in 2022, with a subsequent reduction in 2023. However, these are expected to be offset by significant energy savings and waste reduction once the projects are completed. The renovated buildings are expected to achieve a nearly-Zero Energy Building (nZEB) standard [40], significantly reducing the primary energy consumption by an estimated 25–45%. Additionally, waste production after the renovation process has been projected to decrease by 40%. These advancements are key steps in TUCN’s progress towards a NetZero and climate-neutral campus, and they effectively reduce the university’s overall carbon footprint.
Despite a rise in Scope 1 and Scope 2 GHG emissions from 2022 to 2023, a substantial decrease in Scope 3 emissions led to a 2.98% reduction in the university’s overall carbon footprint. This demonstrates the critical role of Scope 3 emissions in a comprehensive organizational carbon footprint analysis.
5. Discussion
A key advantage of calculating a comprehensive carbon footprint lies in its ability to elaborate and materialize more detailed university carbon management strategies. By pinpointing significant carbon emission sources, universities can target specific areas for reduction. This involves benchmarking emission activities, assessing organizational strengths and weaknesses, and identifying optimal practices to enhance sustainability.
5.1. TUCN’s Carbon Footprint Analysis
As the previous results demonstrate, a comprehensive carbon footprint assessment for HEI necessitates analysis extending across multiple years. The inherent operational variability within HEIs, including activities such as building renovations and waste generation, can exert a significant influence on single-year assessments, as illustrated by the data presented in Table 1. While the initial carbon emissions associated with infrastructure improvements may appear substantial, these investments frequently result in significant long-term reductions in energy consumption and waste generation.
The university’s 2022 carbon footprint included 4668.05 tCO2e/year from Scope 1 and 718.6 tCO2e/year from Scope 2. By 2023, these had risen to 4836.76 tCO2e/year (Scope 1) and to 769.7 tCO2e/year (Scope 2). These increases are relatively modest; however, they underscore the necessity of intensified efforts to achieve significant and sustained reductions in the university’s environmental impact. Despite TUCN’s demonstrable commitment to sustainability, as evidenced by the significant building renovation projects initiated in 2020 and beyond, the persistent preponderance of Scope 1 emissions necessitates that further measures are taken. This involves a detailed evaluation of individual building energy performance, including assessments of necessary renovations (e.g., insulation upgrades and HVAC system replacements) and an analysis of the efficacy of implemented energy-saving policies and technologies (e.g., LED lighting and building management systems). Such evaluations can identify opportunities for further improvements, leading to both reduced emissions and lower operating costs.
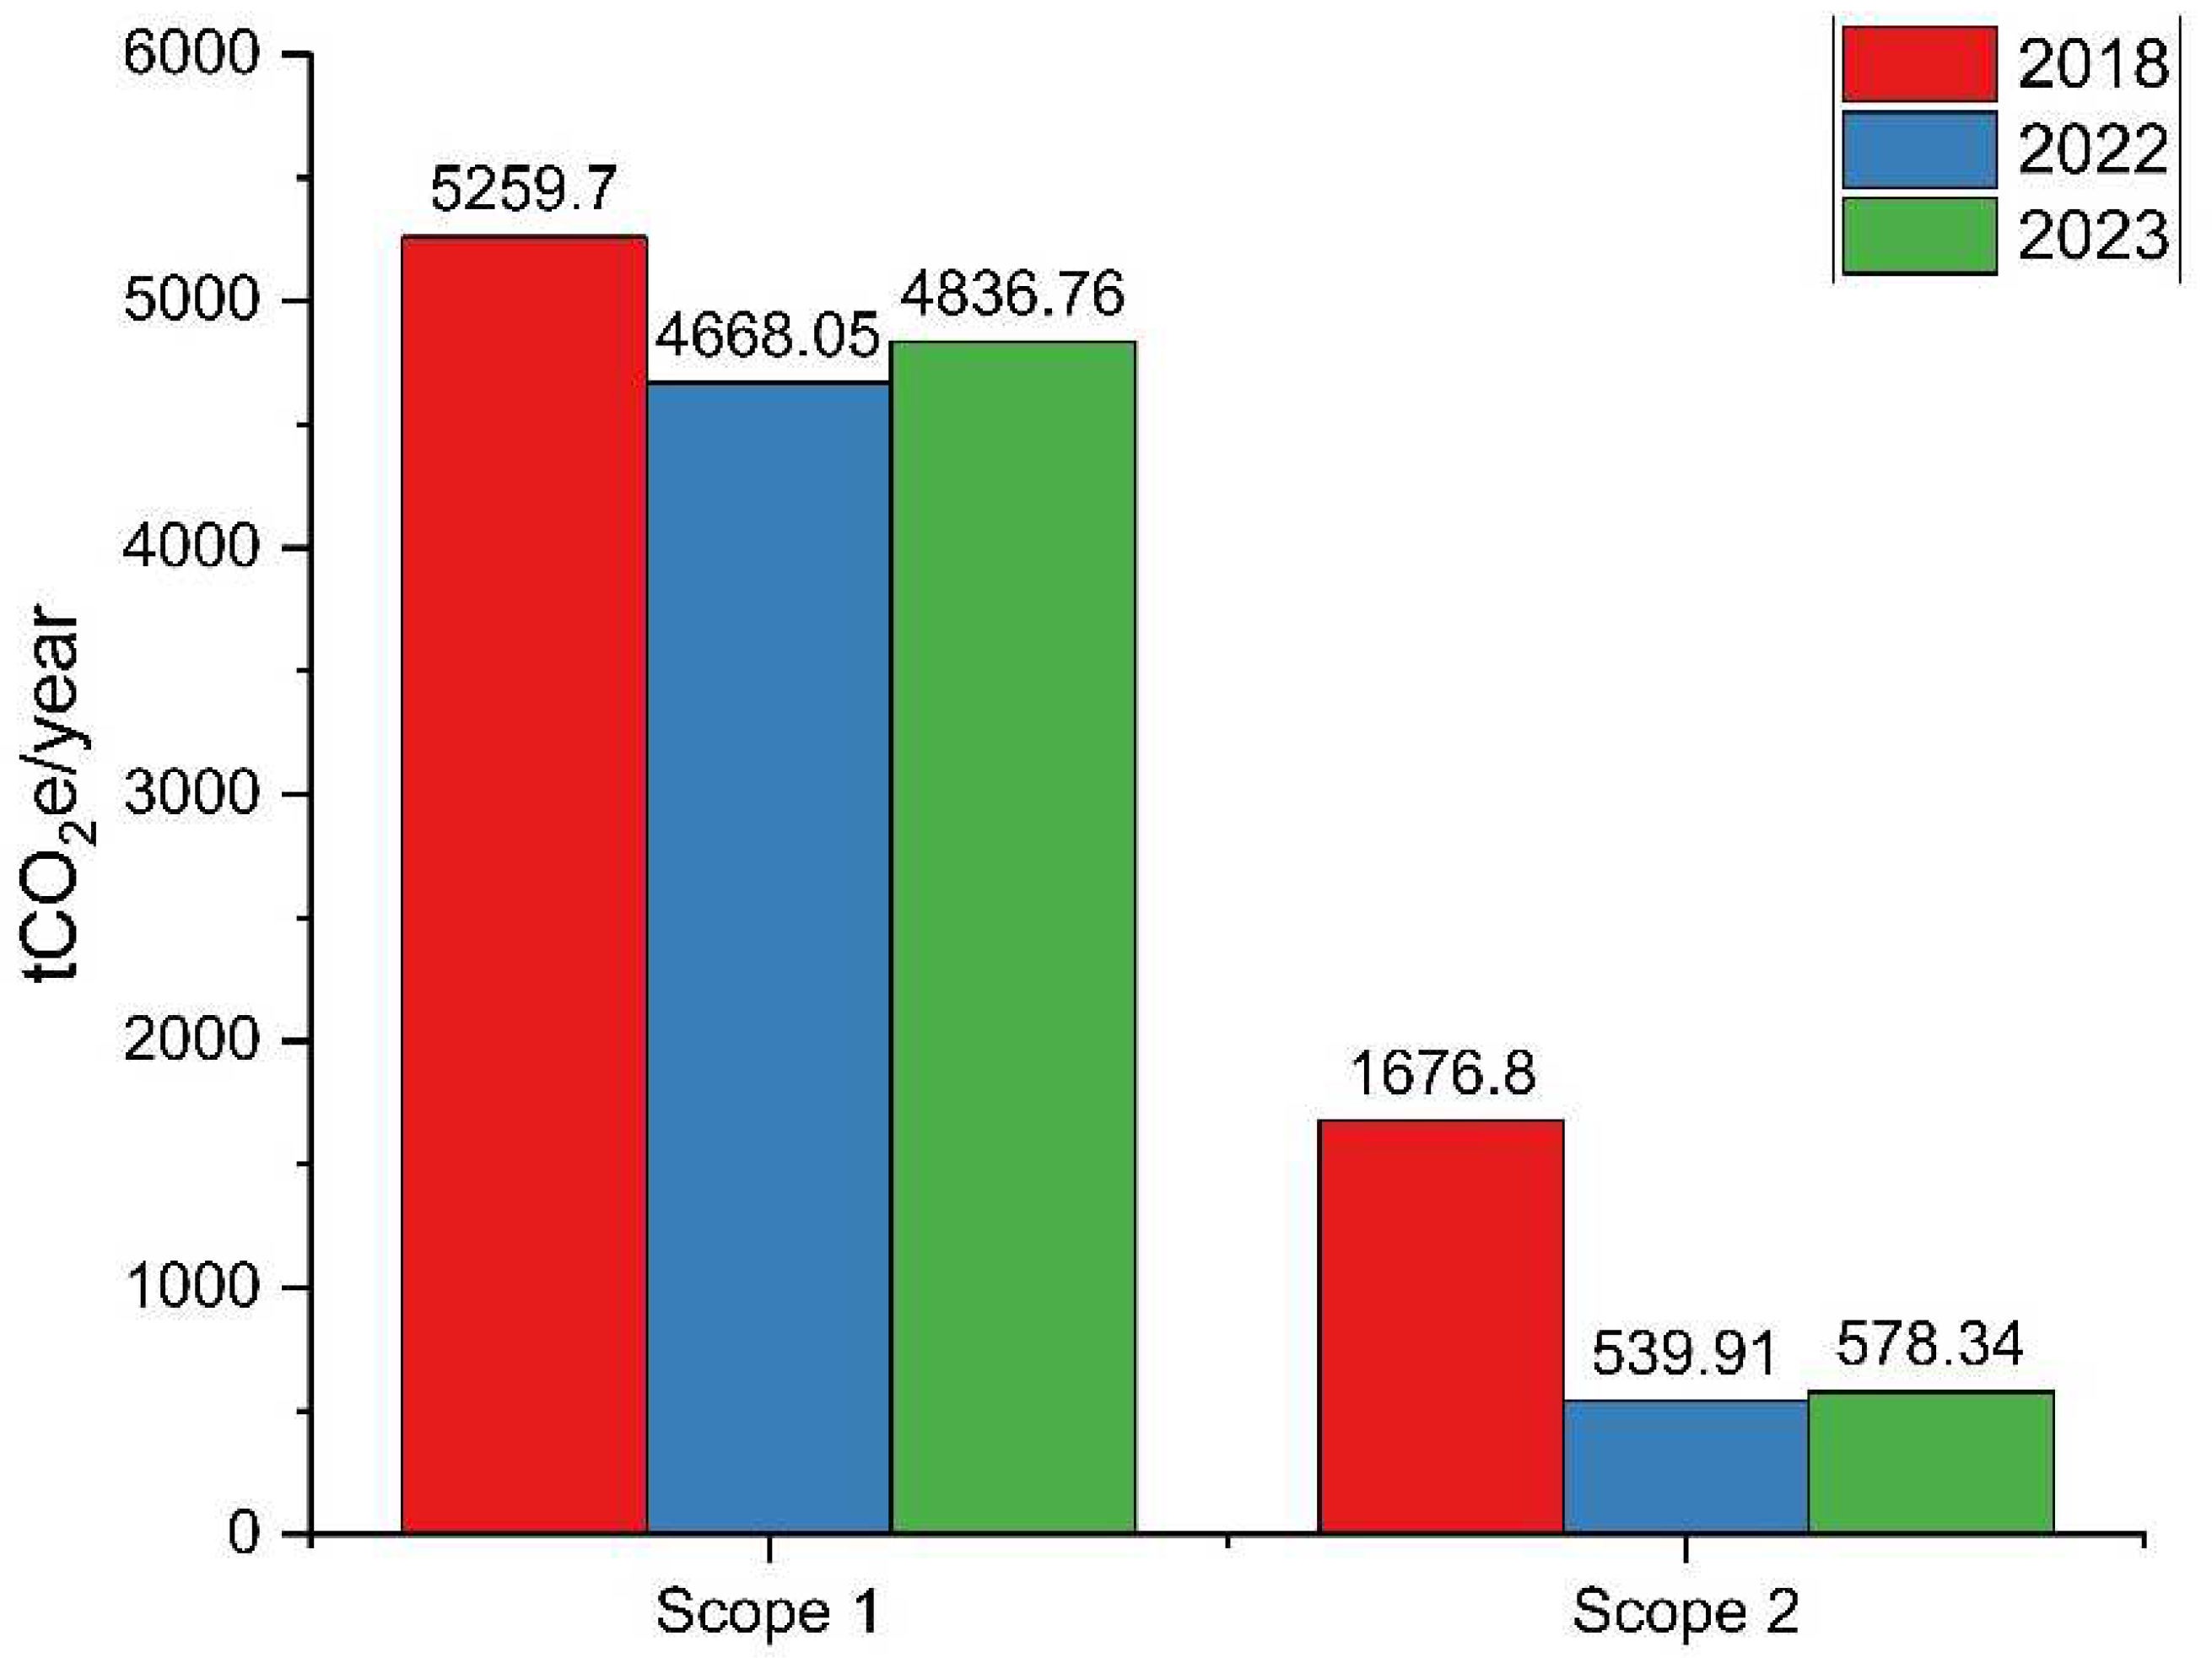
While this study was unable to include the baseline year of 2018 due to insufficient Scope 3 data, this would have provided a crucial benchmark for measuring progress towards the university’s ambitious goal of achieving a climate-neutral campus. Figure 6 offers a comparative analysis of Scope 1 and 2 emissions for the years 2018, 2022, and 2023.
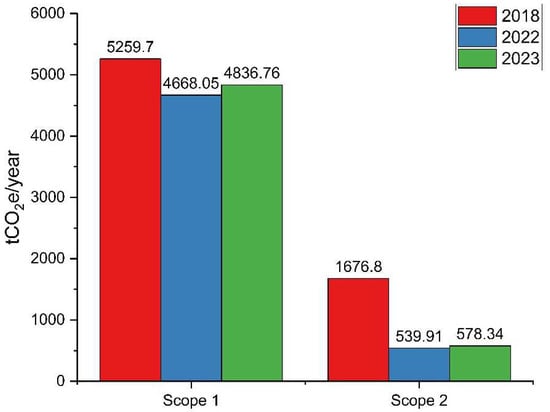
Figure 6.
Benchmarking of TUCN’s emissions by Scope 1 and 2 in tCO2e.
As illustrated in Figure 6, Scope 1 emissions experienced a notable 12.67% decline from 2018 to 2022, corresponding to a decrease from 22 kgCO2e/m2 to 19.5 kgCO2e/m2, representing a significant improvement in the university’s direct emissions profile. This decline suggests the successful implementation of energy-efficient measures like building insulation, window replacements, and more efficient heating systems. However, a slight increase of 3.6% was observed from 2022 to 2023. This small increase can be attributed to the recent completion and commissioning of several building renovations. This suggests that the increased energy consumption associated with these newly renovated spaces, with full HVAC technical systems inexistent before, is the primary factor driving the rise in emissions.
Scope 2 emissions experienced a substantial decline from 7 kgCO2e/m2 in 2018 to 2.2 kgCO2e/m2 in 2022, representing a remarkable 67.8% reduction. The significant decrease can be primarily attributed to Romania’s substantial investments in the energy sector. The share of renewables in the country’s energy mix has increased, resulting in lower electricity emission factors. In addition to the broader national trends, TUCN’s proactive implementation of energy-saving measures, including LED lamps and Building Energy Management Systems (BEMSs), has played a pivotal role in reducing its Scope 2 emissions.
5.2. Benchmarking TUCN’s Emissions with Other Universities
To facilitate the accurate benchmarking of institutional CFs, it is imperative that HEIs employ transparent methodologies for estimating their GHG emissions [12,17]. This approach not only reveals institutional strategies but also enables more precise comparisons, fostering a deeper understanding of the similarities and differences in primary GHG emissions.
Examining the CF assessment at TUCN, the results indicate total emissions of 7445.1 tCO2e/year in 2022. This breakdown further reveals that the emissions per occupied area amounted to 0.031 tCO2e/m2, while per-person emissions reached 0.378 tCO2e/person. Notably, in 2023, total emissions decreased by 2.98% to 7229.1 tCO2e/year, accompanied by a reduction in emissions per area to 0.030 tCO2e/m2 and to 0.36 tCO2e/person. These figures highlight a positive trend towards reduced carbon emissions at TUCN.
To ensure a more equitable comparison, we selected a pool of European universities that evaluated all three Scopes in their CF assessment and whose results are reported in terms of functional units per-person and per square meter. For our initial comparative analysis, we selected the University of Oulu from Finland [26] and Umwelt-Campus Birkenfeld (UCB) in Germany, a unique case study with a 100% renewable energy supply [29]. We also compared our results to the Spanish University of the Basque Country (UPV/EHU), which employed the same Ecoinvent database in their reported emissions [34], and De Montfort University (DMU) in Leicester, United Kingdom [27]. Table 2 provides the data for the comparison.

Table 2.
Benchmarking of HEIs.
Overall, TUCN compares favourably to the other universities in terms of emissions per square meter and emissions per person. The differences might be attributed to a combination of factors like energy-efficient buildings, emission factors, commuting patterns, waste management or specific activities conducted within the institutions. In addition, the data provided are from different years for each university, which makes direct comparisons difficult. Further, the climate zone in which each university is located can affect their emissions. Universities in colder climates may have higher emissions due to increased heating needs.
TUCN’s Scope 3 emissions are notably lower than those of other universities, constituting only 28.3% of its total emissions. For instance, UCB, despite its 100% renewable energy supply, faces a significant Scope 3 burden, accounting for 90% of its total emissions. Without considering Scope 3 emissions, UCB’s emissions per square meter and per person would be substantially lower, at 0.012 tCO2e/m2 and 0.113 tCO2e/person, respectively. UCB’s commitment to renewable energy demonstrates the potential of sustainable energy sources in mitigating direct emissions. However, the dominance of Scope 3 emissions highlights the need for a comprehensive approach to carbon reduction, encompassing both direct and indirect emissions.
Regarding the other HEIs considered in the benchmark, the exclusion of Scope 3 emissions from their CF assessment would have resulted in significantly lower emissions per square meter and per person. This underscores the substantial impact of indirect emissions on the overall environmental performance of these institutions. By neglecting Scope 3 emissions, HEIs can create a misleading impression of their CF, potentially hindering their ability to effectively reduce their environmental impact. Therefore, it is imperative for HEIs to adopt a comprehensive approach to CF assessment.
As we move forward, understanding CFs becomes increasingly crucial in supporting the EU’s ambitious goal of achieving 100 climate-neutral cities. This next subchapter will delve deeper into the role of the CF as a powerful tool in achieving this sustainable urban future.
5.3. The Carbon Footprint as a Tool for EU’s 100 Climate-Neutral Cities Mission
As part of the ambitious European Union’s 100 Climate-Neutral Cities Mission, cities across Europe are striving to achieve net-zero GHG emissions by 2030. This ambitious goal necessitates a comprehensive reduction of their CF to zero. To contribute to this vital initiative, it is imperative for public institutions, and indeed all organizations and individuals, to conduct thorough assessments of their CFs and establish ambitious targets for emissions reduction for several reasons:
- Baseline Assessment: A comprehensive CF assessment offers a snapshot of a city’s current emissions, revealing the primary sources that contribute most significantly to its environmental impact.
- Prioritization of Actions: Armed with a detailed CF analysis, policymakers can strategically prioritize interventions that will deliver the most substantial reductions in emissions, ensuring that efforts are focused on areas with the greatest potential for positive change.
- Monitoring Progress: Regular CF assessments serve as invaluable tools for monitoring progress toward climate neutrality. Tracking changes in emissions over time, cities can identify areas where efforts are bearing fruit and where additional action is required to stay on course.
- Public Engagement: A transparent and accessible CF can be a powerful tool for fostering public engagement in climate action. Understanding their individual and collective carbon footprints, citizens can become more invested in sustainability efforts and actively participate in creating a more environmentally responsible future.
- Policy Development: A robust CF analysis provides policymakers with the data-driven insights necessary to develop effective climate policies and regulations. Identifying the key drivers of emissions, policymakers can design targeted interventions that address the root causes of the problem, ensuring that climate action is both efficient and effective.
Carbon footprint analysis is a valuable tool for the EU’s 100 Climate-Neutral Cities Mission. By providing a quantitative assessment of emissions, it enables cities to set targeted goals, prioritize actions, monitor progress, engage the public, and develop effective policies. As cities strive to achieve climate neutrality, carbon footprint analysis will be essential for guiding their efforts and ensuring a sustainable future.
5.4. Strategies to Reduce TUCN’s Carbon Footprint
TUCN initiated a significant, multi-phase building renovation project in 2020, driven by its commitment to sustainability and the necessity to upgrade its facilities. The project targets a wide range of improvements across multiple campus buildings, including increased energy efficiency through insulation improvements, triple-glazed windows, HVAC system upgrades, heat pump and LED lighting installation, and a reduction in the university’s overall environmental footprint. Moreover, TUCN installed a 50 kWp photovoltaic (PV) system on one of its buildings in 2023 and has plans to expand this capacity in the future, with an undertaken feasibility study and EU grant request for an upgrade of 1048 kWp [41,42]. This renewable energy initiative aligns with the university’s Sustainable Energy and Climate Action Plan (SECAP) and demonstrates its commitment to energy efficiency and environmental stewardship. By transitioning from a passive consumer of energy to an active prosumer [43], TUCN is taking a proactive approach to reducing its reliance on fossil fuels and mitigating climate change. The combined impact of these building renovations and the PV system significantly advances the campus toward a climate-neutral future.
TUCN’s commitment to sustainable development, as outlined in its SECAP, includes a bold target of an 80% carbon footprint reduction by 2030, using 2018 as the baseline year. To achieve this goal, the SECAP focuses on four key areas of action: education and research, energy, campus and community, and governance and partnerships [44].
TUCN aims to cultivate a green mindset within its community by integrating environmental awareness into its educational programs and stimulating multidisciplinary research that addresses various climate-related challenges. Ongoing educational projects, such as “Empowering Energy Efficiency Awareness through a Holistic Educational Approach–ENERGEIA” [45], and Erasmus+ KA220, like “Support of higher education system in a context of climate change mitigation through regional-level of carbon footprint caused by a product, building and organization–Hi-Edu Carbon” and “An Innovative Circular Economy Training based on BIM and LCA technologies applied to the Construction Industry–BIM-LCA” [46,47], are focused on strengthening higher education’s capacity to address climate change. To complement existing sustainability curricula, these initiatives focus on enriching educational experiences by including topics such as carbon footprint reduction, energy efficiency, the circular economy, and LCAs.
Several research projects, like “Renewable Energy-based Positive Homes–RENplusHOMES”, “Positive Energy Districts Driven by Citizens–PERSIST”, and “Educational Campuses as Drivers for Positive Energy District–EDUPED” [48,49,50], extend beyond traditional research boundaries, with practical implementation in these case studies in terms of energy efficiency, campus development, and community engagement, offering valuable insights and solutions to act against climate change.
Complementarily, the university is committed to fostering a supportive environment for the entire community by aligning its services with sustainable development principles and empowering community engagement. By collaborating on initiatives and projects such as “NetZeroCities–National Competence Center and Solutions for the Development of Climate-Neutral Smart Cities” or “Blueprint for Net-Zero Apartment-block Neighborhood” [51,52] the institution can strengthen partnerships and accelerate the transition to climate-neutral cities.
As this study reveals, the most significant contributor to GHG emissions is Scope 1 emissions. Recognizing this, the SECAP has strategically prioritized investments in building stock to mitigate these emissions. However, implementing energy efficient projects requires substantial financial resources. To secure the necessary funding, TUCN has leveraged a diverse range of sources, including the National Recovery and Resilience Plan, the National Investment Fund for Energy Efficiency and Climate Change, the Romanian Fund for Energy Efficiency, etc. With funding secured from these agencies, TUCN has operated a comprehensive modernization program since 2020.
Overall, TUCN’s efforts to promote environmental responsibility through education, research, infrastructure improvements, and community engagement position it as a leader in the field of sustainable higher education. By continuing to prioritize climate action and actively implementing these initiatives, TUCN can significantly reduce its carbon footprint and contribute to a more sustainable and resilient future.
5.5. Identified Problems and Solutions for CF Reduction for HEIs
HEIs face a complex challenge in balancing their diverse building portfolios with the urgent need to reduce carbon emissions. While some historic structures may pose limitations for achieving near-zero energy standards, newer facilities often exhibit varying levels of energy efficiency. As HEIs continue to invest in new buildings, prioritizing upgrades to existing structures based on their potential to reduce carbon footprints become crucial. This strategic approach will not only contribute to environmental sustainability but also optimize resource allocation and long-term cost savings. All new construction projects should incorporate LCAs to identify the most sustainable solutions beyond initial investment costs. Careful material selection and the adoption of innovative options, such as low-carbon concrete or bio-based insulation, are essential for minimizing environmental impacts.
The growing emphasis on sustainability presents both opportunities and challenges for investment departments within HEIs. While transitioning to climate-neutral campuses may require significant investments, it also opens the door to innovative solutions and long-term cost savings. Effective building management is a cornerstone of this transformation, necessitating meticulous energy monitoring and optimization. Moreover, extending the lifespan of existing assets through furniture and IT equipment repair contributes significantly to reducing the institution’s overall carbon footprint.
Addressing Scope 3 emissions presents unique challenges for HEIs. While participation in European and international projects often necessitates extensive travel, HEIs are also striving to reduce their carbon footprints. To reconcile these competing demands, HEIs should prioritize low-carbon travel options, such as electric vehicles and alternative modes of transportation for commuting purposes like bicycles.
By prioritizing energy efficiency, material sustainability, and sustainable travel practices, HEIs can take a proactive approach to achieving their carbon reduction goals, creating more environmentally friendly and resilient campuses, and mitigating the environmental impact of their international engagements.
5.6. Limitations of This Study
The availability of complete data was a constraint in this study. Due to insufficient data on individual travel patterns, the GHG emissions associated with commuting were not included in the analysis. This omission may have resulted in an underestimation of Scope 3. To address this data limitation, the university can conduct travel surveys, employ travel demand modelling, or collaborate with external partners for data and expertise.
Another limitation is the discrepancy between the national emission factors [53] and those found in the Ecoinvent database for natural gas and electricity. The national emission factor for natural gas in 2023 was reported as 0.205 kgCO2/kWh, while the Ecoinvent database listed a value of 0.21 kgCO2/kWh. Similarly, for market-based consumed electricity, the national emission factor was 0.265 kgCO2/kWh, compared to 0.33 kgCO2/kWh in the Ecoinvent database.
The slight difference in the emission factor for natural gas (2.4% as related to 2022) has a relatively minor impact on the TUCN’s overall carbon footprint calculation. However, the more significant difference in the emission factor for electricity (19.7%) can have a more substantial effect on the accuracy of CF assessments. To address this limitation, the Ecoinvent database should be updated more frequently, leading to differences in values due to the inclusion of more recent data, in order to foster collaboration among researchers, policymakers, and industry stakeholders to ensure the development and use of standardized methodologies.
6. Conclusions
The increasing momentum towards climate-neutral and smart cities is driving a surge towards more sustainable and environmentally responsible university campuses. HEIs are under increasing pressure to play a more active role in promoting education, equality, and innovation while also minimizing their environmental footprint and maximizing the economic, social, and public health benefits they provide to society.
This study represents a pioneering effort to comprehensively assess the carbon footprint of a Romanian HEI, the Technical University of Cluj-Napoca. By examining all three Scopes of emissions over a two-year baseline period, this research has provided a detailed understanding of TUCN’s environmental impact.
Utilizing One Click LCA software and the Ecoinvent database, this analysis revealed a total carbon footprint of 7445.1 tCO2e/year in 2022, which registered a 2.98% decrease to 7229.1 tCO2e/year in 2023.
While stationary fuel use (primarily natural gas) remained the largest contributor to emissions (approximately 63% each year), significant contributions also stemmed from Scope 3 emissions (28.3% in 2022 and 23.1% in 2023), highlighting the importance of taking into consideration the entire value chain. A per-person analysis showed a decrease in emissions from 0.378 tCO2e/person in 2022 to 0.362 tCO2e/person in 2023. The decrease in Scope 3 emissions in 2023 is largely attributed to the completion of building renovations, which temporarily increased emissions in previous years. The significant contribution of Scope 3 underscores the critical necessity of including its emissions in any thorough evaluation of an organization’s carbon footprint.
This study’s findings offer a valuable benchmark for Romanian higher education institutions and contribute to the national efforts to mitigate climate change. This research demonstrates the significance of implementing holistic strategies for carbon footprint reduction, encompassing both direct and indirect emissions. Future research should focus on continued monitoring, refining methodologies for accurate Scope 3 assessment, and exploring innovative solutions for reducing emissions across all scopes. The university’s ambitious goal of an 80% emissions reduction by 2030, coupled with ongoing initiatives like building renovations and the implementation of renewable energy systems, provides a strong foundation for achieving significant progress towards climate neutrality.
The TUCN’s strategies to promote sustainability through education, research, infrastructure improvements, and community engagement have positioned it as a pioneer in the field of sustainable higher education. By maintaining its focus on environmental responsibility and actively implementing these initiatives, TUCN plays a pivotal role in mitigating its carbon footprint and creating a more sustainable and resilient future.
Author Contributions
Conceptualization: T.R., R.-P.M. and M.P.; methodology: T.R. and R.-P.M.; software: T.R. and R.-P.M.; validation: D.B. and A.C.; formal analysis: T.R. and R.-P.M.; data curation: T.R. and M.P.; writing—original draft preparation: T.R. and M.P.; writing—review and editing: R.-P.M., D.B., M.P. and A.C.; visualization: D.B. and A.C.; supervision: D.B. and A.C. All authors have read and agreed to the published version of the manuscript.
Funding
This research was funded by the Romanian program GNaC ARUT 2023, project name “Clădiri pOzitiv eNergetic în EduCaTie–CONECT” [Grant number 22/01.07.2024].
Institutional Review Board Statement
Not applicable.
Informed Consent Statement
Not applicable.
Data Availability Statement
The original contributions presented in this study are included in the article. Further inquiries can be directed to the corresponding author.
Acknowledgments
The authors are grateful to the technical–administrative and accounting departments’ staff of the Technical University of Cluj-Napoca for their assistance during the data collection process.
Conflicts of Interest
The authors declare no conflicts of interest. The funders had no role in the design of the study; in the collection, analyses, or interpretation of data; in the writing of the manuscript; or in the decision to publish the results.
Abbreviations
The following abbreviations are used in this manuscript:
| UN | United Nations |
| SDGs | Sustainable Development Goals |
| EU | European Union |
| NSSDR | National Strategy for Sustainable Development of Romania |
| CF | carbon footprint |
| GHG | greenhouse gas |
| HEIs | higher education institutions |
| LCA | life cycle assessment |
| MWh | megawatt-hour |
| kgCO2e | kilograms of carbon dioxide equivalents |
| tCO2e | tons of carbon dioxide equivalents |
| TUCN | Technical University of Cluj-Napoca |
| SECAP | Sustainable Energy and Climate Action Plan |
References
- United Nations. The 2030 Agenda for Sustainable Development; United Nations: New York, NY, USA, 2015. [Google Scholar]
- Vulevic, A.; Castanho, R.A.; Gómez, J.M.N.; Lausada, S.; Loures, L.; Cabezas, J.; Fernández-Pozo, L. Cross-Border Cooperation and Adaptation to Climate Change in Western Balkans Danube Area. In Advances in Spatial Science; Springer: Cham, Switzerland, 2021; pp. 289–308. [Google Scholar] [CrossRef]
- COM 640 The European Green Deal. Communication from the Commission to the European Parliament, the European Council, the Council, the European Economic and Social Committee and the Committee of the Regions. 2019. Available online: https://www.eea.europa.eu/policy-documents/com-2019-640-final (accessed on 22 April 2024).
- Fit for 55. Available online: https://ec.europa.eu/commission/presscorner/detail/en/IP_23_4754 (accessed on 22 April 2024).
- REPowerEU. Available online: https://ec.europa.eu/commission/presscorner/detail/en/IP_22_3131 (accessed on 22 April 2024).
- European Commission. Climate-Neutral and Smart Cities. Available online: https://research-and-innovation.ec.europa.eu/funding/funding-opportunities/funding-programmes-and-open-calls/horizon-europe/eu-missions-horizon-europe/climate-neutral-and-smart-cities_en (accessed on 26 June 2024).
- IEA. CO2 Emissions in 2022—Analysis. Available online: https://www.iea.org/reports/co2-emissions-in-2022 (accessed on 12 March 2025).
- Guvernul Romaniei. Planul Național de Acțiune Pentru Implementarea SNDDR 2030 (National Action Plan for the Implementation of the SNDDR 2030); Guvernul Romaniei: Bucharest, Romania, 2022. [Google Scholar]
- European Commission. EU Missions: 100 Climate-Neutral and Smart Cities; European Commission: Brussels, Belgium; Luxembourg, 2024. [Google Scholar]
- GHG Protocol. Available online: https://ghgprotocol.org/ (accessed on 22 April 2024).
- ISO 14064; Greenhouse Gases—Part 1: Specification with Guidance at the Organization Level for Quantification and Reporting of Greenhouse Gas Emissions and Removal. International Organization for Standardization: Geneva, Switzerland, 2018.
- Li, Z.; Chen, Z.; Yang, N.; Wei, K.; Ling, Z.; Liu, Q.; Chen, G.; Ye, B.H. Trends in Research on the Carbon Footprint of Higher Education: A Bibliometric Analysis (2010–2019). J. Clean. Prod. 2021, 289, 125642. [Google Scholar] [CrossRef]
- Horan, W. The Role of Irish Higher Education Institutions in National Decarbonisation Transitions. Ph.D. Thesis, University of Limerick, Limerick, Ireland, 2019. [Google Scholar] [CrossRef]
- Biancardi, A.; Colasante, A.; D’Adamo, I.; Daraio, C.; Gastaldi, M.; Uricchio, A.F. Strategies for Developing Sustainable Communities in Higher Education Institutions. Sci. Rep. 2023, 13, 20596. [Google Scholar] [CrossRef] [PubMed]
- Helmers, E.; Chang, C.C.; Dauwels, J. Carbon Footprinting of Universities Worldwide: Part I—Objective Comparison by Standardized Metrics. Environ. Sci. Eur. 2021, 33, 30. [Google Scholar] [CrossRef]
- Top Universities Pursuing Sustainable Development Goals in 2024 | Times Higher Education (THE). Available online: https://www.timeshighereducation.com/impactrankings (accessed on 26 June 2024).
- Deda, D.; Gervásio, H.; Quina, M.J. Bibliometric Analysis and Benchmarking of Life Cycle Assessment of Higher Education Institutions. Sustainability 2023, 15, 4319. [Google Scholar] [CrossRef]
- Idundun, E.; Hursthouse, A.S.; McLellan, I. Carbon Management in UK Higher Education Institutions: An Overview. Sustainability 2021, 13, 10896. [Google Scholar] [CrossRef]
- Wang, L.; Yan, X.; Fang, M.; Song, H.; Hu, J. A Systematic Design Framework for Zero Carbon Campuses: Investigating the Shanghai Jiao Tong University Fahua Campus Case. Sustainability 2023, 15, 7975. [Google Scholar] [CrossRef]
- Ma, B.; Bashir, M.F.; Peng, X.; Strielkowski, W.; Kirikkaleli, D. Analyzing Research Trends of Universities’ Carbon Footprint: An Integrated Review. Gondwana Res. 2023, 121, 259–275. [Google Scholar] [CrossRef]
- Yañez, P.; Sinha, A.; Vásquez, M. Carbon Footprint Estimation in a University Campus: Evaluation and Insights. Sustainability 2020, 12, 181. [Google Scholar] [CrossRef]
- Valls-Val, K.; Bovea, M.D. Carbon Footprint in Higher Education Institutions: A Literature Review and Prospects for Future Research. Clean. Technol. Environ. Policy 2021, 23, 2523–2542. [Google Scholar] [CrossRef]
- Valls-Val, K.; Bovea, M.D. Carbon Footprint Assessment Tool for Universities: CO2UNV. Sustain. Prod. Consum. 2022, 29, 791–804. [Google Scholar] [CrossRef]
- Clabeaux, R.; Carbajales-Dale, M.; Ladner, D.; Walker, T. Assessing the Carbon Footprint of a University Campus Using a Life Cycle Assessment Approach. J. Clean. Prod. 2020, 273, 122600. [Google Scholar] [CrossRef]
- Varón-Hoyos, M.; Osorio-Tejada, J.; Morales-Pinzón, T. Carbon Footprint of a University Campus from Colombia. Carbon. Manag. 2021, 12, 93–107. [Google Scholar] [CrossRef]
- Kiehle, J.; Kopsakangas-Savolainen, M.; Hilli, M.; Pongrácz, E. Carbon Footprint at Institutions of Higher Education: The Case of the University of Oulu. J. Environ. Manage 2023, 329, 117056. [Google Scholar] [CrossRef] [PubMed]
- Ozawa-Meida, L.; Brockway, P.; Letten, K.; Davies, J.; Fleming, P. Measuring Carbon Performance in a UK University through a Consumption-Based Carbon Footprint: De Montfort University Case Study. J. Clean. Prod. 2013, 56, 185–198. [Google Scholar] [CrossRef]
- Gómez, N.; Cadarso, M.Á.; Monsalve, F. Carbon Footprint of a University in a Multiregional Model: The Case of the University of Castilla-La Mancha. J. Clean. Prod. 2016, 138, 119–130. [Google Scholar] [CrossRef]
- Helmers, E.; Chang, C.C.; Dauwels, J. Carbon Footprinting of Universities Worldwide Part II: First Quantification of Complete Embodied Impacts of Two Campuses in Germany and Singapore. Sustainability 2022, 14, 3865. [Google Scholar] [CrossRef]
- Klein-Banai, C.; Theis, T.L.; Brecheisen, T.A.; Banai, A. Greenhouse Gas Inventory as a Measure of Sustainability. Environ. Pract. 2010, 12, 35–47. [Google Scholar]
- Robinson, O.J.; Tewkesbury, A.; Kemp, S.; Williams, I.D. Towards a Universal Carbon Footprint Standard: A Case Study of Carbon Management at Universities. J. Clean. Prod. 2018, 172, 4435–4455. [Google Scholar] [CrossRef]
- Bailey, G.; LaPoint, T. Comparing Greenhouse Gas Emissions across Texas Universities. Sustainability 2016, 8, 80. [Google Scholar] [CrossRef]
- da Silva, L.A.; de Aguiar Dutra, A.R.; de Andrade Guerra, J.B.S.O. Decarbonization in Higher Education Institutions as a Way to Achieve a Green Campus: A Literature Review. Sustainability 2023, 15, 4043. [Google Scholar] [CrossRef]
- Bueno, G.; de Blas, M.; Pérez-Iribarren, E.; Zuazo, I.; Torre-Pascual, E.; Erauskin, A.; Etxano, I.; Tamayo, U.; García, M.; Akizu-Gardoki, O.; et al. The Environmental and Social Footprint of the University of the Basque Country UPV/EHU. J. Clean. Prod. 2021, 315, 128019. [Google Scholar] [CrossRef]
- Silva, D.A.L.; Giusti, G.; Rampasso, I.S.; Junior, A.C.F.; Marins, M.A.S.; Anholon, R. The Environmental Impacts of Face-to-Face and Remote University Classes during the COVID-19 Pandemic. Sustain. Prod. Consum. 2021, 27, 1975–1988. [Google Scholar] [CrossRef] [PubMed]
- Ullah, I.; Islam-Ud-Din; Habiba, U.; Noreen, U.; Hussain, M. Carbon Footprint as an Environmental Sustainability Indicator for a Higher Education Institution. Int. J. Glob. Warm. 2020, 20, 277–298. [Google Scholar] [CrossRef]
- Wang, C.; Parvez, A.M.; Mou, J.; Quan, C.; Wang, J.; Zheng, Y.; Luo, X.; Wu, T. The Status and Improvement Opportunities towards Carbon Neutrality of a University Campus in China: A Case Study on Energy Transition and Innovation Perspectives. J. Clean. Prod. 2023, 414, 137521. [Google Scholar] [CrossRef]
- Technical University of Cluj-Napoca | World University Rankings | THE. Available online: https://www.timeshighereducation.com/world-university-rankings/technical-university-cluj-napoca (accessed on 17 July 2024).
- Köppen Climate Classification System. Available online: https://www.britannica.com/science/humid-continental-climate (accessed on 22 August 2024).
- Order of the Ministry of Development, Public Works, and Administration. nr.16/05.01.2023; Metodologie de Calcul al Performanței Energetice a Clădirilor, Indicativ Mc 001-2022 (Methodology for Calculating the Energy Performance of Buildings, Indicative Mc 001-2022); Order of the Ministry of Development, Public Works, and Administration: Bucharest, Romania, 2023. [Google Scholar]
- Cristea, C.; Cristea, M.; Micu, D.D.; Ceclan, A.; Tîrnovan, R.A.; Șerban, F.M. Tridimensional Sustainability and Feasibility Assessment of Grid-Connected Solar Photovoltaic Systems Applied for the Technical University of Cluj-Napoca. Sustainability 2022, 14, 10892. [Google Scholar] [CrossRef]
- Rus, T.; Moldovan, R.P.; Pardo Picazo, M.Á. LCA Analysis of a Roof Mounted PV System: A Romanian Case Study. Front. Environ. Sci. 2024, 12, 1413629. [Google Scholar] [CrossRef]
- Scripcariu, M.; Gheorghiu, C.; Bitir-Istrate, I.S.; Bonea, M.M. Transforming Romanian School Buildings in Prosumers. An Opportunity for Increasing the Energy Efficiency in Electrical Networks and Reducing the Environmental Impact of the Power Distribution Sector. In E3S Web of Conferences; EDP Sciences: Les Ulis, France, 2020; Volume 180. [Google Scholar]
- Sustainability Strategy: Technical University of Cluj-Napoca—2030; Technical University of Cluj-Napoca: Cluj-Napoca, Romania, 2022.
- ENERGEIA. Available online: https://entrec.utcluj.ro/energeia/ (accessed on 10 September 2024).
- Hi-Edu Carbon. Available online: https://hieducarbon.tuke.sk (accessed on 10 September 2024).
- BIM-LCA. Available online: https://bimlca.eu/ro/acasa/ (accessed on 10 September 2024).
- Ren + Homes. Available online: https://renplushomes.eu/ (accessed on 10 September 2024).
- PERSIST. Available online: https://entrec.utcluj.ro/positive-energy-districts-driven-by-citizens/ (accessed on 10 September 2024).
- EDUPED. Available online: https://dutpartnership.eu/funding-opportunities/dut_call_2023/projects-suggested-for-funding/positive-energy-districts-projects/ (accessed on 10 September 2024).
- Net Zero Cities. Available online: https://netzerocities.upb.ro/ (accessed on 10 September 2024).
- Net Zero Cities. Blueprint for Net-Zero Apartment-Block Neighbourhoods. Available online: https://netzerocities.eu/cluj-napoca-pilot-city-activity-blueprint-for-net-zero-apartment-block-neighbourhoods/ (accessed on 10 September 2024).
- Conversion Factors (CO2 Equivalent). Available online: https://lege5.ro/Gratuit/ha4demjwgu3q/factorii-de-conversie-in-emisii-de-gaze-cu-efect-de-sera-co-2-echivalent-ghid-anexa-nr-4-la-ghid-factori-de-conversie?dp=gqytcnztga3dimi (accessed on 22 August 2024).
Disclaimer/Publisher’s Note: The statements, opinions and data contained in all publications are solely those of the individual author(s) and contributor(s) and not of MDPI and/or the editor(s). MDPI and/or the editor(s) disclaim responsibility for any injury to people or property resulting from any ideas, methods, instructions or products referred to in the content. |
© 2025 by the authors. Licensee MDPI, Basel, Switzerland. This article is an open access article distributed under the terms and conditions of the Creative Commons Attribution (CC BY) license (https://creativecommons.org/licenses/by/4.0/).

