Abstract
With the increasing depth of mining operations and the emergence of complex geological conditions, pneumatic down-the-hole (DTH) hammers have become an efficient drilling technology. This method utilizes high-pressure air to drive hammering actions for rock fragmentation. However, the layout and durability of tungsten carbide buttons significantly affect the rate of penetration (ROP). This study focuses on optimizing the button arrangement for large-diameter reverse circulation pneumatic DTH hammers to improve drilling efficiency. A numerical model incorporating zero-thickness cohesive elements was developed to simulate rock fracturing. A comparative analysis of 16 mm and 22 mm buttons under varying drilling pressures (1–1.8 kN) and impact energies (20–40 J) was conducted. Key metrics, including penetration depth, fragmentation range, stress-affected zone, and specific energy consumption, were analyzed. The results indicate that 22 mm buttons under 35 J impact energy and 1.4 kN drilling pressure exhibit superior performance, with optimal circumferential (47.2 mm) and radial (51.2 mm) spacing determined through stress superposition analysis. This configuration enhances the weakened rock strength zone, providing critical guidance for DTH hammer design.
1. Introduction
With the increasing depth of mining operations and the emergence of complex geological conditions, the reverse circulation pneumatic DTH hammer has become a widely used drilling technology. It employs high-pressure air to drive the impact bit for rock and soil fragmentation. Due to its unique advantages of efficient rock breaking and fast debris removal, the reverse circulation pneumatic DTH hammer demonstrates excellent potential for rapid borehole formation in complex geological environments [1,2]. This technology has shown significant application prospects in fields such as rapid mineral exploration, sampling, and mine disaster rescue [3].
The rescue expansion drill is a specialized tool designed for rapid rescue operations in mining accidents. In the actual rescue process, the first step is to drill a pilot hole. This ensures the accuracy and stability of the subsequent rescue hole. Once the pilot hole is completed, the expansion drill can be used to begin drilling the rescue hole. During the drilling process, the expansion drill gradually increases the diameter of the hole to provide sufficient space and passage for trapped personnel. The button layout design of the DTH hammer drill bit is a critical factor in improving rock-breaking efficiency and extending the service life of the drill bit [4]. Therefore, research on the rock-breaking mechanism of tungsten carbide buttons, the optimization of drilling parameters, and the rational design of button distribution play a vital role in enhancing drilling efficiency.
Numerous studies have explored the rock-breaking mechanism of tungsten carbide buttons via experimental and numerical approaches. Previous studies on rock-breaking mechanisms primarily focused on single-button performance. For instance, Souissi et al. [5] analyzed the effects of loading and indenter spacing on rock damage using numerical simulations and experiments. They compared two measurement methods and concluded that rock indentation damage is primarily caused by the development of tensile strain. Weddfelt et al. [6] confirmed that the compaction zone under the indenter is limited. Rock failure only occurs when the circumferential stress exceeds the tensile strength of the rock. Zhang et al. [7] studied the compression failure mechanism of sandstone by recording force-displacement curves during the indentation process. They employed digital image correlation (DIC), a non-destructive optical technique, to measure the full-field displacements on the sandstone surface. Zhou et al. [8] explored the impact fracture mechanism of rocks under low-energy conditions through single-head impact experiments. Using 3D scanning technology, they obtained precise parameters of the impact craters. Ajibose et al. [9] conducted quasi-static indentation and dynamic impact tests using conical and spherical drill bits on sandstone, granite, and basalt. They examined the relationship between contact force and displacement. Wang et al. [10] demonstrated through numerical methods that dynamic loading and indenter spacing play a critical role in the rock-breaking process with dual indenters, providing a basis for optimizing rock-breaking efficiency. Zhu et al. [11] proposed the plastic energy consumption ratio as an indicator to evaluate the efficiency of indenters breaking hard rocks. Their results showed that the lower the plastic energy consumption ratio, the higher the efficiency of rock indentation failure. Chen [12] employed non-destructive techniques such as acoustic emission and electronic speckle interferometry to study the indentation process of rocks using wedge-shaped tools. They found that the geometric characteristics of the wedge-shaped tools and the mechanical properties of the rock significantly affect the indentation pressure and damage zone size. Additionally, under certain lateral confinement conditions, the rock failure mode transitions from brittle to plastic behavior.
A wealth of research has focused on the energy transfer efficiency and rock-breaking mechanisms of impact drilling. Wu et al. [13] developed a mathematical model for pneumatic rotary drilling and analyzed the impact energy transfer in pneumatic top-hammer rock drilling. Lundberg et al. [14,15] investigated the effect of waveforms on the energy transfer efficiency of impact drilling in both integrated drill rods and detachable drill bits using a one-dimensional stress wave propagation model. Song et al. [16] established a three-dimensional impact system model, considering the strong nonlinearity during the impact process, to study the energy transfer efficiency of impact drills. In further studies, Song et al. [17,18] explored the energy transfer efficiency and rock damage caused by multi-button drill bits in axial-torsional coupled impact drilling. They constructed a mechanical impact-thermal coupling physical model to examine the effects of this coupling on impact stress wave propagation, energy transfer efficiency, and rock damage. Li et al. [19] conducted impact drilling experiments to investigate the influence of impact parameters on rock-breaking efficiency. Using an orthogonal experimental method and regression analysis, they studied the effects of operational parameters on rock drilling efficiency. Their results showed that impact power has the greatest influence on drilling efficiency. The optimal parameter combination was determined to be an impact power of 6.4 kW, a rotational speed of 240 r/min, a thrust force of 3800 N, and a 7-button drill bit. Additionally, Song et al. [20], Lundberg et al. [14], and Yang et al. [21] revealed the significant role of waveform characteristics in the energy transfer efficiency of impact drilling. Their findings provide critical insights into the optimization of impact drilling systems for enhanced performance.
In addition to focusing on rock-breaking efficiency and methods, the propagation and extension of internal cracks during rock impact remain a key area of research for scholars. Liu et al. [22] and Saksala [23] used numerical methods to study the effect of confining pressure on rock-breaking behavior. Their findings revealed that confining pressure reduces rock penetration rates and suppresses crack propagation. Liu et al. [24,25] further investigated the mechanisms of lateral crack development during rock compression through numerical simulations. They discovered that the lateral cracks within the crushed zone are caused by a combination of tensile and shear failure, while those outside the crushed zone primarily result from tensile failure. In addition, they designed bi-axial indentation experiments to study rock-breaking behavior under different stress conditions, highlighting the decisive role of surface and internal cracks in the rock-breaking process. Saadati et al. [26] explored the influence of pre-existing or structural cracks on rock-breaking efficiency. Their results demonstrated that such cracks facilitate the rock-breaking process by providing pathways for stress concentration and crack propagation. Meanwhile, Cook et al. [27] studied the fracture patterns of rocks under dynamic indentation loading. Their research uncovered the key mechanisms of internal crack propagation under dynamic impact, providing valuable insights for improving rock-breaking techniques. To analyze the physical characteristics and microstructures of rocks during indentation experiments, Salma et al. [28] conducted double-indentation tests on granite, limestone, and sandstone. They determined the optimal spacing between indentations to achieve overlapping crack regions, thereby enhancing rock fragmentation efficiency. These studies offer important theoretical and practical guidance for the design and optimization of impact drilling and rock-breaking technologies.
While previous studies, including our own work [29], focused on optimizing single-diameter button arrangements under static or quasi-static conditions, the current research advances the field through three key innovations. First, we expand the parameter scope by systematically comparing 16 mm and 22 mm button diameters under varied impact energies (20–40 J) and drilling pressures (1–1.8 kN), addressing a critical gap in understanding diameter-dependent performance trade-offs. Second, we propose a novel stress overlap analysis framework to optimize circumferential and radial button spacing, which maximizes stress superposition effects while minimizing button count. These methodological and analytical advancements bridge the gap between single-button experiments and practical multi-button drill bit design, offering actionable insights for enhancing ROP and tool longevity in complex granite formations.
Currently, research on the rock-breaking mechanism of button bits primarily concentrates on the rock fragmentation aspect, with insufficient attention paid to the distribution of the buttons. Additionally, the impact of commonly used hard alloy balls of different diameters bits on rock has not been considered. This paper verifies the applicability of the zero-thickness viscoelastic element through mathematical modeling. By simulating different impact energies, the study investigates their effects on penetration depth, fragmentation area, and the region of stress influence. The aim of this research is to understand the rock-breaking mode to optimize drilling parameters and the arrangement of ball bits on the drill head, thereby reducing the number of bits while ensuring efficient rock fragmentation and minimizing costs.
2. Model and Methodology
2.1. Spherical Tooth Impact Model
Contact stress and contact area are fundamental parameters used to describe the impact fragmentation process. The geometric description of contact is shown in Figure 1. Another important parameter during the impact process is the average contact stress , which is related to the contact stress and the contact radius . Here, the contact radius refers to the distance from the particle’s center axis to the edge of the actual contact area between the particle and the rock. The relationship is expressed as follows:
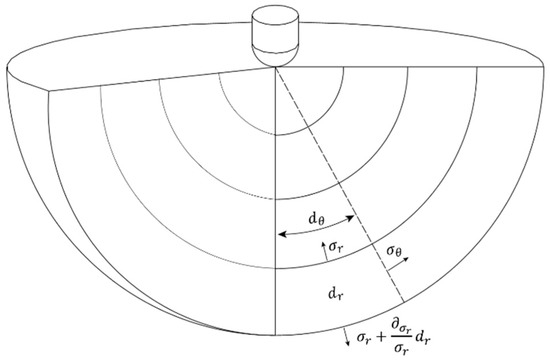
Figure 1.
Diagram of spherical coordinates of stress waves.
Based on elastic-plastic indentation analysis and Newton’s law, the differential relationship between force and displacement is obtained:
where is the quality of the spherical tooth (apportion the quality of the bit); is the impact velocity of the spherical tooth; represents the depth of the impact crater.
Based on the Brinell hardness experiments conducted by Hill et al. [30], a nonlinear elastoplastic impact analysis model was developed. The model provides a detailed description of the contact stress and derives its corresponding expression:
where represents Meyer hardnes; represents contact stress; is the Meyer law constant; is the strain hardening exponent of the material; is the radius of the spherical tooth.
Under the impact of the spherical tooth, the stress and strain generated inside the rock propagate in the form of a stress wave spherical wave. As shown in Figure 1, the spherical tooth impacts the rock at interface point , causing the stress wave to propagate from the surface of the spherical tooth into the rock. Due to the symmetry of the spherical wave, in the spherical coordinate system (), the wave is independent of and , so , the longitudinal displacement and the lateral displacement are both zero, , and the radial displacement is not zero.
According to the spherical coordinates, the stress–strain relationship is:
where , are the radial and circumferential strain of the rock in a spherical coordinate system:
According to the generalized Hooke’s law, assuming that the rock is an elastic body before being damaged, the mathematical expressions of the radial and circumferential stresses of the stress wave are obtained:
where is the Young’s modulus of the rock; is the Poisson’s ratio of the rock.
The calculation of the rock stress field can be regarded as the solution to the motion equation of spherical cavity compression. Because the stress wave is spherically symmetric, the wave field variables are only wave radius r and time t, and the only variable is along the radial direction, which is set as . The boundary conditions and initial conditions are:
The negative sign represents the pressure and the conservation of the momentum of the spherical coordinate infinitesimal . The equation of motion of the spherical wave expressed by displacement is obtained:
The propagation velocity of an elastic longitudinal wave in the rock:
The governing equation of stress wave is obtained:
2.2. Simulation Settings
2.2.1. Simulation Model
Recently, the FDEM (Finite-Discrete Element Method) model has been widely used for simulating material fractures. This method combines the advantages of continuum and discontinuum approaches. It employs zero-thickness cohesive elements to simulate the rock fracture process. The constitutive response of the zero-thickness cohesive elements can be directly defined using a traction–separation law to evaluate fracture behavior. In the model, a bilinear traction–separation law is adopted to describe the response of the zero-thickness cohesive elements [25].
Before damage initiation, the normal traction increases with the increase in normal displacement . When the normal traction reaches its peak value , a linear damage evolution law is adopted to describe the degradation of the normal stiffness of the cohesive elements until the element fails, as expressed below [31]:
Similarly, there is a linear relationship between the tangential traction force and the relative shear displacement . After reaching the tangential peak , the linear damage evolution law is activated to describe the degradation of the tangential stiffness , which is expressed as follows [32]:
where is the relative shear displacement at the beginning of the damage and is the damage variable.
The damage initiation is relative to a maximum nominal stress criterion. The damage is assumed to initiate if the maximum nominal stress ratio is to a value of one:
where ⟨⟩ is the Macaulay bracket, which is adapted to distinguish whether the cohesive element is under compression or tension:
The damage is described by a scalar damage variable , which represents the unrecoverable overall damage of the cohesive element from 0 to 1. In this model, the damage variable adopts a linear softening law in independent mode [31], which can be expressed as:
where and are the maxima of the relative displacements obtained in the loading history of the normal and shear direction, respectively. and are corresponding to the damage variables in the normal and shear direction. and respectively denote the critical fracture energy in the normal and shear direction.
Based on the damage of the cohesive element in the normal and shear direction, an overall damage variable U that synthetically reflects the damage in all directions is used to estimate whether the integration points of the cohesive element are fully damaged or not:
If the overall damage variable U reaches 1 at all of its integration points, the cohesive element is treated as completely failed and will be deleted from the model.
2.2.2. Grid and Independence Verification
The numerical simulation investigates the rock fragmentation mechanism of large-diameter pneumatic down-the-hole hammers using two tungsten carbide button configurations with diameters of 16 mm and 22 mm. A three-dimensional finite element model was developed with particular attention to dimensional accuracy. The rock specimen dimensions were systematically determined based on button diameter scaling principles: length and width dimensions were set at 16 times the button diameter, while height was maintained at seven times. This scaling yielded a representative volume element measuring 300 mm (length) × 300 mm (width) × 130 mm (height), as illustrated in Figure 2.
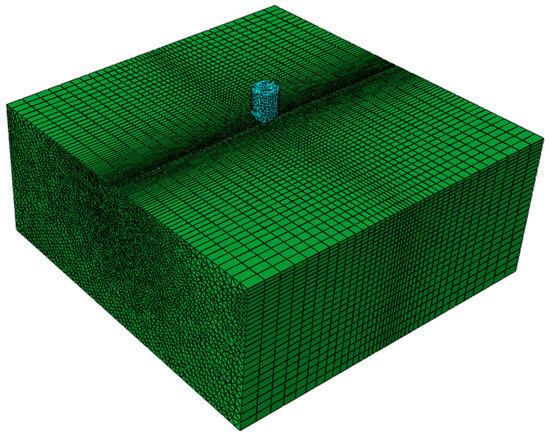
Figure 2.
Spherical tooth impact model and meshing.
To realistically simulate fracture propagation dynamics, a cohesive zone modeling approach was implemented through zero-thickness cohesive elements inserted within the rock matrix meshing. This methodology enables spontaneous crack initiation and propagation under impact loading, demonstrating good congruence with experimental observations. Contact algorithms were carefully configured using a universal contact formulation to precisely characterize both button–rock interface interactions and inter-element rock contact behaviors. Furthermore, a dual-attribute constitutive model was established to simultaneously account for damage evolution at contact interfaces and viscous dissipation effects during dynamic fracturing processes.
Mesh independence verification was conducted, as depicted in the figure, using rock models with five different mesh quantities. As shown in Figure 3, as the number of meshes increases, both the fragmentation range and the stress distribution become stable. When the mesh quantity reaches around 200,000, the curves begin to stabilize, and the difference between 220,000 and 200,000 meshes is less than 5%. Therefore, to ensure computational accuracy, a mesh quantity of 220,000 is selected.
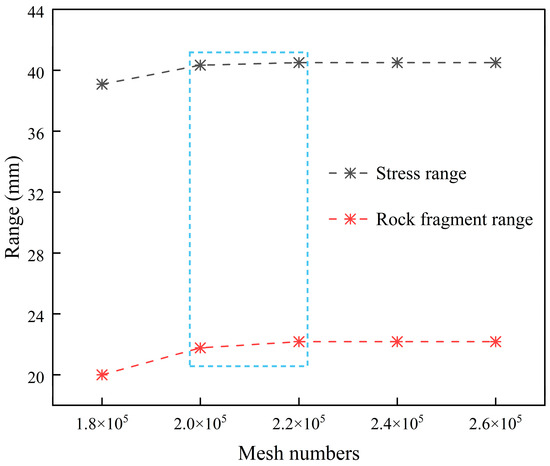
Figure 3.
Grid independence verification.
To enhance the efficiency of the simulation analysis, an uneven meshing method is adopted. Since the rock model used is a hexahedron, the area impacted by the button is at the center of the rock’s surface, while boundary conditions are applied around the rock to fix it as in experimental conditions. Thus, local mesh refinement is applied at the center where the button contacts the rock, while fewer meshes are used around the edges. According to the mesh independence verification requirements mentioned above, the granite model is divided into a total of 222,240 meshes. The meshing for the single-button impact model is shown in Figure 2.
2.2.3. Simulation Parameter Setting
In this simulation study, the simulation model primarily consists of specific physical parameters of rock, cohesive elements, and tungsten carbide buttons [33], including density (), Young’s modulus (), Poisson’s ratio (), damage displacement (), nominal stress under normal mode (), nominal stress under the first tangential mode (), and nominal stress under the second tangential mode (). The specific parameter values are shown in Table 1.

Table 1.
Simulation parameter setting table.
3. Results and Discussion
3.1. Simulation Correctness Verification
The simulation takes the average stress curve at several points on a hemispherical surface located 36 mm from the impact source and compares it with the results of the tungsten carbide button impact model simulation. As shown in Figure 4, the trends of the two curves are the same. However, when the stress stabilizes, the simulated stress curve is lower and dynamically stable. This phenomenon is attributed to the simulation model considering the effect of stress waves on rock fragmentation, which weakens the energy of the stress waves. Additionally, since the rock does not have infinite boundaries, stress waves reflect upon reaching the boundaries. Nevertheless, the rock model is designed to be sufficiently large, making the impact of this reflection minimal.
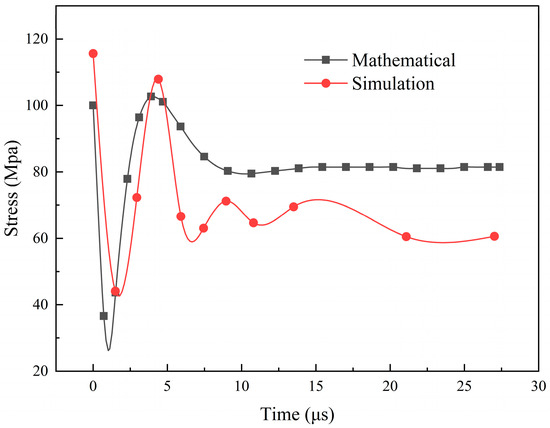
Figure 4.
The comparison diagram of mathematical model and simulation stress curve.
3.2. Study on the Influencing Factors of Single-Tooth Broken Rock
For the simulation analysis of rock fragmentation by single tungsten carbide buttons with diameters of 16 mm and 22 mm, the study first conducts an overall analysis of the specific energy of fragmentation to understand the rock-breaking efficiency under different drilling pressures and impact energies. Subsequently, an in-depth investigation is carried out on the vertical failure to explore the rock cracking behavior and fragmentation effects under various working conditions. Based on the analysis of vertical failure, further study is conducted on circumferential fragmentation to comprehensively understand the fragmentation characteristics of the single tungsten carbide button in different directions.
3.2.1. Spherical Tooth into Rock Displacement
As shown in Figure 5 and Figure 6, the 16 mm and 22 mm tungsten carbide buttons impact the rock and penetrate into its interior under the application of impact energy. At approximately 0.0005 s, the buttons reach their maximum penetration displacement. For a 16 mm button diameter, the maximum single penetration displacement ranges from 0.66 mm to 0.79 mm, while for a 22 mm button diameter, it ranges from 0.59 mm to 0.72 mm. The reason is that with a smaller button diameter, the localized pressure between the button and the rock surface increases during impact, resulting in greater penetration depth. As the impact energy increases, the maximum penetration depth also increases. After penetrating the rock, the reaction force exerted by the rock on the button exceeds the drilling pressure, causing the button to rebound and move upward. Around 0.006 s to 0.007 s, the button reaches its maximum upward displacement, which is approximately 1.05 mm to 1.6 mm. Subsequently, as the drilling pressure fully counteracts the reaction force from the rock, the button begins to move downward again. Finally, the button reaches a state of dynamic equilibrium as the drilling pressure is balanced by the reaction force from the fractured pit and the button itself.
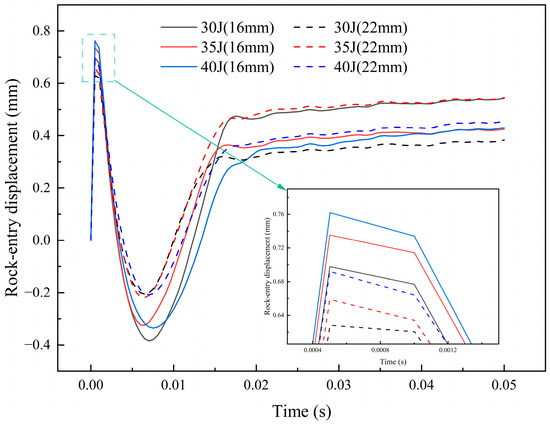
Figure 5.
The displacement curve of the spherical tooth under 1.4 kN drilling pressure.
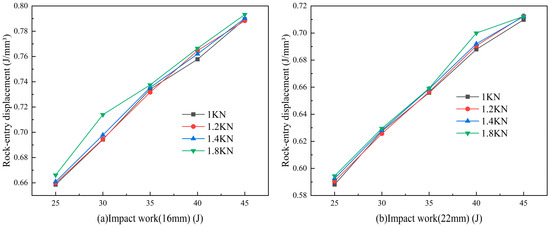
Figure 6.
The maximum rock-entry displacement of 16 mm and 22 mm spherical teeth under different bit weights and impact energy.
Figure 6 illustrates a positive correlation between drilling pressure and penetration displacement. For 16 mm buttons, displacement increased from 0.66 mm (1 kN) to 0.79 mm (1.8 kN), while 22 mm buttons showed a rise from 0.59 mm to 0.72 mm. This trend is attributed to enhanced contact force under higher pressures, enabling deeper rock penetration. This is because an increase in drilling pressure strengthens the contact force between the drill bit and the rock. Consequently, the contact force between the tungsten carbide button and the rock surface also increases, enhancing the energy generated by each impact. This results in a stronger impact and cutting force from the button on the rock, effectively penetrating the rock.
3.2.2. Rock Fragmentation Range
After the tungsten carbide button fractures the rock, the main regions of the rock, based on the influence of stress from the center outward, can be divided into three zones: the rock fragmentation zone, the stress-affected zone, and the stress dissipation zone. The Rock Fragmentation Zone is the area closest to the button, which is directly subjected to impact and fragmentation; The stress-affected zone is outside the rock fracture-affected zone, this area experiences relatively light stress influence, which may result in a certain degree of deformation and cracking. The stress Dissipation Zone is the outermost area where the stress gradually dissipates, and the rock is only minimally affected by the impact. As shown in Figure 7, in the area around the spherical teeth where the grid undergoes significant displacement, it can be observed that rock debris separates from the rock, resulting in significant displacement of the debris—this area is identified as the rock fragmentation zone, where notable rock breakage occurs. The lower region corresponds to the crack propagation area, where the element displacement shown in the red circle is caused by fracturing, which can be regarded as the rock fragmentation range resulting from the button’s impact. To determine the rock fragmentation range, the horizontal X-coordinate values of the two points corresponding to the start and end of the area with significant displacement are subtracted. The resulting value represents the range of the rock debris formation, which is used as the rock fragmentation influence range under the current drilling parameters.
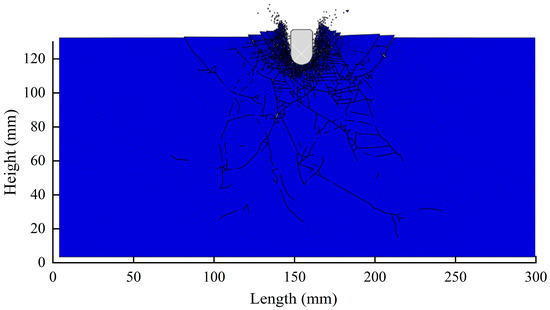
Figure 7.
Rock failure diagram.
For the simulation of rock fragmentation under the impact of 16 mm and 22 mm tungsten carbide buttons, the rock fragmentation range curves are shown in Figure 8. At a drilling pressure of 1 kN, the fragmentation ranges of the two buttons are similar. However, when the drilling pressure increases to 1.2 kN and 1.4 kN, the fragmentation range produced by the 22 mm button is significantly larger. At a drilling pressure of 1.8 kN, the fragmentation ranges of the two buttons become similar again. This is due to the different mechanisms of rock fragmentation for buttons of varying sizes. At lower drilling pressures, the fragmentation capabilities of the two buttons are comparable because the applied drilling pressure is insufficient to fully utilize the advantages of size. However, as the drilling pressure increases to 1.2 kN and 1.4 kN, the larger 22 mm button, with its greater contact area, can more effectively transfer pressure, resulting in a larger fragmentation range. As the drilling pressure continues to increase, the rock fragmentation mode may change.
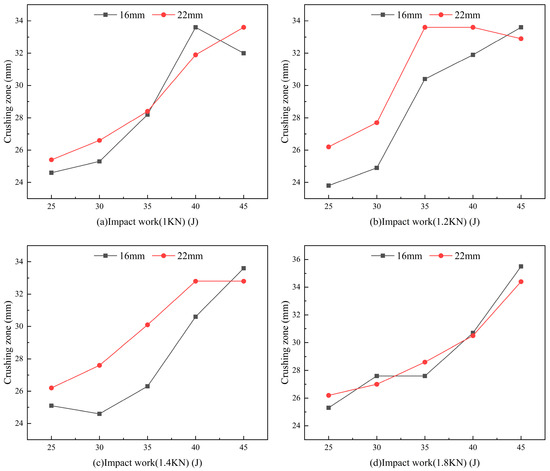
Figure 8.
The comparison of the stress influence range of 16 mm and 22 mm spherical teeth under different impact energy.
When the drilling pressure reaches 1.8 kN, the stress in the rock approaches its limit, and the energy transmitted to the rock by the two buttons becomes relatively similar, leading to convergence in the fragmentation ranges. From the analysis of drilling pressures at 1.2 kN and 1.4 kN, it can be observed that as the impact energy increases, the fragmentation range initially increases and then tends to level off. This phenomenon may be due to the fact that as impact energy increases, part of the energy received by the rock is used for fragmentation, while another portion may be lost to internal friction, heat generation, and other forms of energy dissipation. As the impact energy further increases, the proportion of dissipated energy may rise, reducing the effective energy available for fragmentation. Therefore, based on the analysis of the rock fragmentation range, when the drilling pressure is between 1.2 kN and 1.4 kN, the 22 mm button achieves a larger fragmentation range and better fragmentation performance when the impact energy is between 35 J and 40 J.
3.2.3. Influence Range of Rock Stress
When a spherical tooth impacts rock, the kinetic energy of the tooth is instantly transformed into other forms of energy. The impact stress wave is a primary pathway for this energy release. It not only fractures the rock directly beneath the tooth but also shears the surrounding rock to break it apart. As the distance from the tooth increases, the stress wave within the rock gradually diminishes and eventually dissipates. Therefore, considering the early stage of impact, where the stress wave has not yet dissipated, we can more accurately determine the boundary of the stress-affected area.
During the impact process, the stress value in the rock changes with the stress wave. When the rock’s stress value reaches its compressive strength, the rock fails. Even if the stress does not reach the compressive strength, the rock can still be affected by the stress wave, leading to a decrease in strength. In this paper, the compressive strength of granite is 120 MPa as the benchmark, and 0.8 times the compressive strength of rock is taken as the stress limit as the standard [29].
As shown in Figure 9, the curve demonstrates an overall trend of initial increase followed by a gradual plateau. This further confirms that in the drilling process of spherical teeth, higher drilling pressure and impact energy do not necessarily result in better performance. This phenomenon occurs because, beyond a certain impact energy threshold, most energy is not utilized for shear failure but is instead consumed by compressive failure beneath the tooth. Therefore, when determining the optimal drilling parameters, drilling pressure and impact energy must be considered comprehensively, rather than being blindly increased.
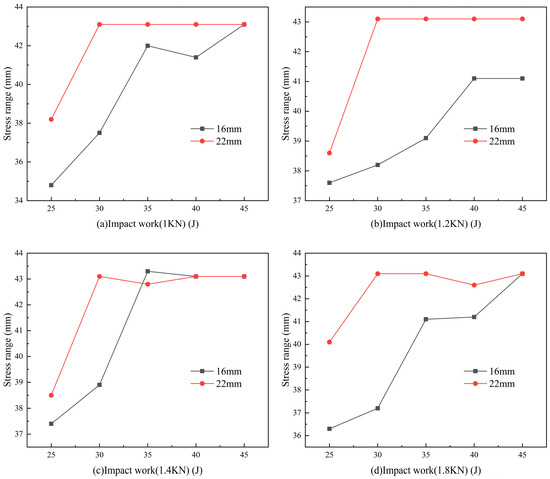
Figure 9.
Comparison of stress influence range of 16 mm and 22 mm spherical teeth under different impact energy.
The stress-affected range comparison for 16 mm and 22 mm spherical teeth under impact shows a similar trend: an initial rise followed by a plateau. When the impact energy exceeds a certain threshold, most of the energy is not used for the shear failure induced by stress waves on both sides of the spherical tooth but instead for the compressive failure beneath the tooth. The stress-affected range of the 22 mm spherical tooth is generally larger than that of the 16 mm tooth. For the 22 mm spherical tooth, the curve’s inflection point occurs consistently at an impact energy of 30 J, where the stress-affected range reaches its maximum. Therefore, for the 22 mm spherical tooth, the optimal drilling parameters are a drilling pressure of 1.2 kN and an impact energy of 30 J, resulting in a stress-affected range of 43.2 mm.
3.2.4. Single Spherical Tooth Crushing Specific Work
As shown in Figure 10, the specific energy of rock breaking can be regarded as the slope of the rock volume fracturing curve, which reflects the efficiency of utilizing impact energy. When the drilling pressure is less than 1.4 kN, the specific energy increases with the rise in impact energy. At a drilling pressure of 1 kN, the specific energy of the 16 mm spherical tooth is significantly higher than that of the 22 mm spherical tooth. However, when the drilling pressure exceeds 1 kN, the values for both sizes become similar. When the drilling pressure surpasses 1.4 kN, the specific energy of the 22 mm spherical tooth exceeds that of the 16 mm spherical tooth. At a drilling pressure of 1.4 kN, the 22 mm spherical tooth reaches a peak at an impact energy of 35 J. When the drilling pressure is 1.8 kN, the 22 mm spherical tooth demonstrates consistently higher specific energy than the 16 mm counterpart.
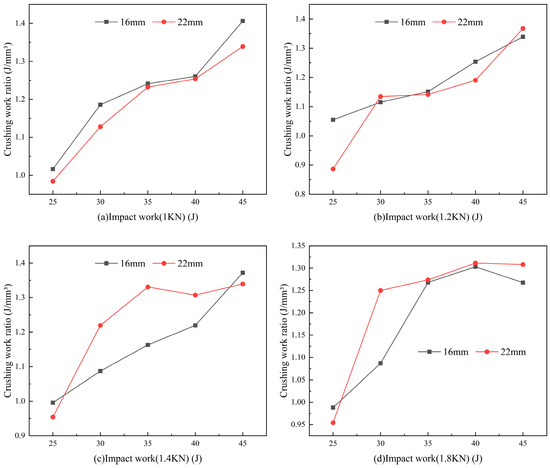
Figure 10.
The comparison diagram of crushing specific work of 16 mm and 22 mm spherical teeth under different impact energy.
This indicates that when the drilling pressure is below 1.2 kN, the 16 mm spherical tooth has a higher impact energy utilization rate. However, when the drilling pressure exceeds 1.2 kN, the 22 mm spherical tooth exhibits a more efficient utilization of impact energy. Additionally, in the high drilling pressure range, the specific energy tends to stabilize. As a result, at higher drilling pressures, a smaller impact energy is sufficient to achieve greater specific energy for rock breaking.
3.3. Layout Optimization Research
It is important to calculate the minimum number of ball teeth on a down-the-hole hammer head with a diameter of within the range of fracture stress to reduce economic costs. The following formula calculates the maximum number of ball teeth. It is worth mentioning that due to the presence of flow channels on the hammer head, the actual distribution of ball teeth is smaller.
where is the pitch between two spherical tooth; is the spacing between two spherical tooth; k represents the maximum number of rings.
Analysis of Rock Fragmentation Performance Under Multi-Button Scenarios Based on Single-Button Studies. According to the analysis of single-button rock fragmentation, the 22 mm button bit demonstrates superior rock-breaking performance under the conditions of an impact energy of 35 J and a drilling pressure of 1.4 kN. Based on these findings, this study further analyzes the rock-breaking effect in multi-button scenarios. The analysis primarily considers two different motion patterns of the button bits on the drill bit: circular spacing (radial distance) and pitch spacing (circumferential displacement). The drilling parameters used are derived from the single-button simulation. The optimal stress influence range for a single button bit, which is 43.2 mm, is taken as the starting distance, with increments of 4 mm. Considering that button bits are positioned on different radial circles, their rotational speeds vary accordingly. For this study, a commonly observed rotational speed of 8 r/min is used. Since the duration of a single impact is extremely short, the arc displacement of the button bit during this period can be approximated as a linear displacement. Therefore, a linear velocity is applied to simulate the cutting motion of the button bits. For the outermost button bit, which is located at a radial distance of 300 mm from the central axis, a linear velocity of 0.25 m/s is applied. For the button bits on the inner radial circle, located 256.7 mm from the central axis, a linear velocity of 0.22 m/s is applied.
3.3.1. Optimization of Pitch of 22 mm Spherical Tooth Ring
Based on the principle that rock strength decreases under stress, an analysis was conducted using a stress threshold of 98 MPa obtained from single button bit impact tests [29]. As shown in Figure 11, the stress distribution of the rock under the impact of two button bits exhibits a wave-like pattern. Stress reaches its peak directly beneath the two button bits and diminishes progressively on both sides of the bits. As the spacing between the button bits increases, the peak stress values at the bits decrease. When the spacing is 43.2 mm, the stress values in the rock between the two bits are entirely above the stress threshold, indicating a significant reduction in rock strength throughout the region. At a spacing of 47.2 mm, most of the stress values in the intermediate region remain above the stress threshold, suggesting a moderate reduction in rock strength over a smaller area. However, when the spacing exceeds 51.2 mm, some portions of the intermediate region fall below the stress threshold, implying minimal stress impact and a less effective reduction in rock strength.
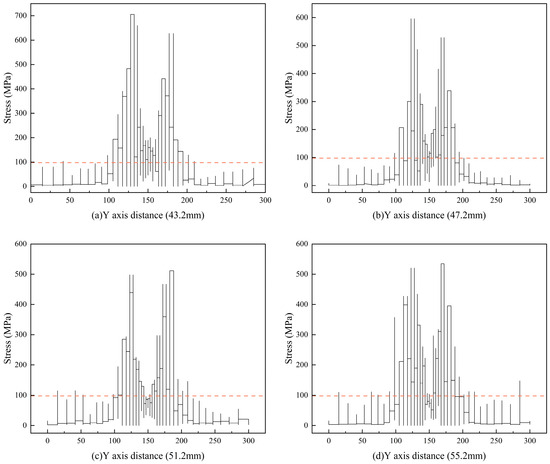
Figure 11.
The influence range of stress under different ring spacing.
From the above analysis, it can be concluded that a spacing of approximately 47.2 mm strikes an optimal balance between cost and efficiency. At this spacing, most of the intermediate rock stress values exceed the stress threshold, enabling significant strength reduction over a large portion of the rock. This spacing minimizes button bit costs while effectively facilitating rock fragmentation.
3.3.2. Spacing Optimization of 22 mm Spherical Teeth
As shown in Figure 12, when the spacing is less than 51.2 mm, the stress values in the intermediate rock mostly exceed the stress limit, indicating significant strength reduction in the rock. When the spacing exceeds 55.2 mm, a considerable portion of the intermediate rock remains below the stress limit, suggesting that the stress influence is weaker, resulting in a less effective reduction in rock strength. Therefore, considering the balance between reducing cutter spacing costs and achieving effective rock strength reduction, a spacing of approximately 51.2 mm is recommended. At this spacing, most of the intermediate stress values exceed the stress limit, enabling a significant reduction in rock strength, which facilitates rock breakage.
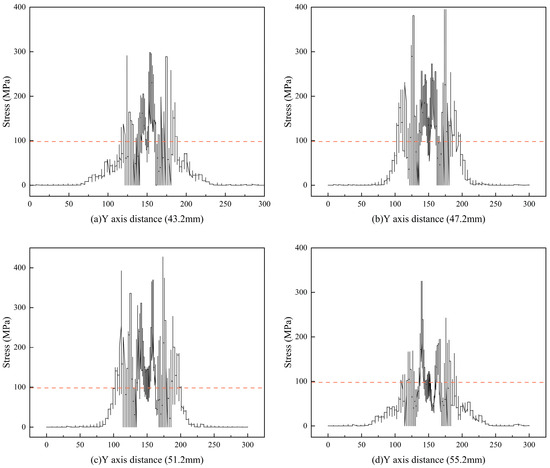
Figure 12.
The influence range of stress under different spacing.
Under the drilling parameters of a 22 mm double-spherical tooth with an impact energy of 35 J and a drilling pressure of 1.4 kN, the optimal cutter spacing and row spacing are determined based on the fracture range and stress influence area. When aiming to achieve a significant fracture range in the intermediate rock, the row spacing is set to 47.2 mm, and the cutter spacing is chosen as 51.2 mm. This configuration effectively reduces the strength of the intermediate rock, thereby enhancing the rock-breaking efficiency.
4. Conclusions
The zero-thickness bonding element method is an effective tool for simulating the fracture behavior of rocks under the impact of spherical cutters. Using this simulation approach, we conducted a comprehensive comparative analysis of the penetration displacements, fracture zones, stress influence areas, and specific energy consumption of 16 mm and 22 mm spherical cutters under different drilling pressures and impact energy conditions. The results indicate that, at an impact energy of 35 Joules and a drilling pressure of 1.4 kN, the performance of the 22 mm spherical cutter significantly surpasses that of the 16 mm cutter, achieving a stress influence area of 43.2 mm and improving energy efficiency. By analyzing the stress superposition effects between adjacent spherical cutters, we identified the optimal arrangement for the cutters. Under the same impact energy and drilling pressure, the optimal spacing and arrangement for the 22 mm cutters were determined to be 47.2 mm and 51.2 mm, respectively, placing the stress influence area above the stress threshold. This arrangement optimizes drilling parameters and the configuration of the cutters, reducing their number while maintaining rock fragmentation efficiency and lowering costs. In summary, the proposed layout achieves a good balance between fragmentation efficiency and operational costs, providing valuable insights for the rational arrangement of different diameter spherical cutters in large-diameter pneumatic down-the-hole hammers used in granite formations.
Author Contributions
Methodology, J.Z., K.L. and B.X.; Software, J.Z.; Validation, H.W.; Data curation, J.Z. and K.L.; Writing—review & editing, J.Z. and K.L.; Funding acquisition, H.W. and Y.D. All authors have read and agreed to the published version of the manuscript.
Funding
This research was funded by Research on efficient pneumatic drilling tools and rapid hole forming technology and equipment for life rescue holes in mine disaster accidents grant number [Qiankehe support [2023] general 422] And The APC was funded by Research on efficient pneumatic drilling tools and rapid hole forming technology and equipment for life rescue holes in mine disaster accidents.
Data Availability Statement
The data presented in this study are available on request from the corresponding author (Kunkun Li).
Acknowledgments
We extend our sincere thanks to the China University of Geosciences (Beijing) for providing essential facilities and resources. This work was financially supported by research on efficient pneumatic drilling tools and rapid hole forming technology and equipment for life rescue holes in mine disaster accidents. In addition, we would like to thank previous researchers for their excellent work, which has greatly helped academic research.
Conflicts of Interest
The authors declare that they have no known competing financial interests or personal relationships that could have appeared to influence the work reported in this paper.
References
- Bo, K.; Ji, F.; Zhao, Z.; Fan, L.; Wang, M. Optimum Design of Large-Diameter Reverse Circulation Drill Bit for Drilling Rescue Wells Using Orthogonal Experimental Method and CFD Simulation. Energies 2023, 16, 3913. [Google Scholar] [CrossRef]
- He, J.; Zhao, Z.; Yin, Q.; Luo, Y.; Gan, X. Design and Optimisation on Rapid Rescue Well-Drilling Technology with Large-Diameter Pneumatic Hammers. Int. J. Min. Reclam. Environ. 2020, 34, 19–33. [Google Scholar] [CrossRef]
- Zhao, J.; Hao, S. Application of pneumatic DTH hammer in drilling rescue of mine accidents. Coal Geol. Explor. 2022, 50, 24–34. [Google Scholar]
- Kivade, S.B. Experimental Investigations on Penetration Rate of Percussive Drill. Procedia Earth Planet. Sci. 2015, 11, 89–99. [Google Scholar] [CrossRef]
- Souissi, S.; Miled, K.; Hamdi, E.; Sellami, H. Numerical Modeling of Rock Damage during Indentation Process with Reference to Hard Rock Drilling. Int. J. Geomech. 2017, 17, 04017002. [Google Scholar] [CrossRef]
- Weddfelt, K.; Saadati, M.; Larsson, P.-L. On the Load Capacity and Fracture Mechanism of Hard Rocks at Indentation Loading. Int. J. Rock Mech. Min. Sci. 2017, 100, 170–176. [Google Scholar] [CrossRef]
- Zhang, H.; Huang, G.; Song, H.; Kang, Y. Experimental Investigation of Deformation and Failure Mechanisms in Rock under Indentation by Digital Image Correlation. Eng. Fract. Mech. 2012, 96, 667–675. [Google Scholar] [CrossRef]
- Qin, Z.; Baolin, L.; Mingtao, J.; Tong, L.; Guoxin, W.; Jun, Z. Experiment Research on Impact Fragmentation Mechanism of Single-Indenter under Low Power Condition. Procedia Eng. 2014, 73, 186–193. [Google Scholar] [CrossRef][Green Version]
- Ajibose, O.K.; Wiercigroch, M.; Akisanya, A.R. Experimental Studies of the Resultant Contact Forces in Drillbit–Rock Interaction. Int. J. Mech. Sci. 2015, 91, 3–11. [Google Scholar] [CrossRef]
- Wang, S.Y.; Sloan, S.W.; Liu, H.Y.; Tang, C.A. Numerical Simulation of the Rock Fragmentation Process Induced by Two Drill Bits Subjected to Static and Dynamic (Impact) Loading. Rock Mech. Rock Eng. 2011, 44, 317–332. [Google Scholar] [CrossRef]
- Zhu, X.; Yue, Y.; Wong, P.; Zhang, Y.; Tan, J. Optimum Water Quality Monitoring Network Design for Bidirectional River Systems. Int. J. Environ. Res. Public Health 2018, 15, 195. [Google Scholar] [CrossRef]
- Chen, L.H.; Labuz, J.F. Indentation of Rock by Wedge-Shaped Tools. Int. J. Rock Mech. Min. Sci. 2006, 43, 1023–1033. [Google Scholar] [CrossRef]
- Wu, C.M.L. Nopainear Thermal and Mechanical Analysis of Step-Tapered Laminated Plate under Uniform in-Plane Load. Compos. Struct. 1992, 22, 33–45. [Google Scholar]
- Lundberg, B.; Collet, P. Optimal Wave Shape with Respect to Efficiency in Percussive Drilling with Detachable Drill Bit. Int. J. Impact Eng. 2015, 86, 179–187. [Google Scholar] [CrossRef]
- Lundberg, B.; Collet, P. Optimal Wave with Respect to Efficiency in Percussive Drilling with Integral Drill Steel. Int. J. Impact Eng. 2010, 37, 901–906. [Google Scholar] [CrossRef]
- Song, H.; Wu, Z.; Wang, A.; Sun, W.; Liu, H.; Lou, Y.; Zuo, Y. Study on the Microscale Tensile Properties of Lower Cambrian Niutitang Formation Shale Based on Digital Images. Geofluids 2020, 2020, 8828965. [Google Scholar] [CrossRef]
- Song, H.; Shi, H.; Chen, Z.; Li, G.; Ji, R.; Chen, H. Numerical Study on Impact Energy Transfer and Rock Damage Mechanism in Percussive Drilling Based on High Temperature Hard Rocks. Geothermics 2021, 96, 102215. [Google Scholar] [CrossRef]
- Song, H.; Shi, H.; Li, G.; Chen, Z.; Li, X. Numerical Simulation of the Energy Transfer Efficiency and Rock Damage in Axial-Torsional Coupled Percussive Drilling. J. Pet. Sci. Eng. 2021, 196, 107675. [Google Scholar] [CrossRef]
- Li, H.; Liu, S.; Chang, H. Experimental Research on the Influence of Working Parameters on the Drilling Efficiency. Tunn. Undergr. Space Technol. 2020, 95, 103174. [Google Scholar] [CrossRef]
- Song, H.; Shi, H.; Ji, Z.; Wu, X.; Li, G.; Zhao, H.; Wang, G.; Liu, Y.; Hou, X. The Percussive Process and Energy Transfer Efficiency of Percussive Drilling with Consideration of Rock Damage. Int. J. Rock Mech. Min. Sci. 2019, 119, 1–12. [Google Scholar] [CrossRef]
- Yang, Y.; Chen, C.; Wen, L.; Chen, X.; Liang, H.; Liu, R.; Guan, X.; Luo, B.; Xie, C. Characteristics of Buried Structures in Northern Longmenshan Mountains and Its Significance to Oil and Gas Exploration in the Sichuan Basin. Nat. Gas Ind. B 2019, 6, 175–182. [Google Scholar] [CrossRef]
- Liu, H.Y.; Kou, S.Q.; Lindqvist, P.-A.; Tang, C.A. Numerical Simulation of the Rock Fragmentation Process Induced by Indenters. Int. J. Rock Mech. Min. Sci. 2002, 39, 491–505. [Google Scholar] [CrossRef]
- Saksala, T. Numerical Study of the Influence of Hydrostatic and Confining Pressure on Percussive Drilling of Hard Rock. Comput. Geotech. 2016, 76, 120–128. [Google Scholar]
- Li, D.; Cheng, J.; Leung, V.C.M. Adaptive Spectrum Sharing for Half-Duplex and Full-Duplex Cognitive Radios: From the Energy Efficiency Perspective. IEEE Trans. Commun. 2018, 66, 5067–5080. [Google Scholar] [CrossRef]
- Jiang, H.; Cai, Z.; Zhao, H. Numerical Study of Hard Rock Breakage under Indenter Impact by the Hybrid FDEM. Eng. Fract. Mech. 2020, 233, 107068. [Google Scholar] [CrossRef]
- Saadati, M.; Forquin, P.; Weddfelt, K.; Larsson, P.; Hild, F. A Numerical Study of the Influence from Pre-existing Cracks on Granite Rock Fragmentation at Percussive Drilling. Num. Anal. Meth. Geomech. 2015, 39, 558–570. [Google Scholar] [CrossRef]
- Cook, W.; Hood, M.; Tsai, F. Observations of Crack Growth in Hard Rock Loaded by an Indenter. Int. J. Rock Mech. Min. Sci. Geomech. Abstr. 1984, 21, 97–107. [Google Scholar]
- Souissi, S.; Hamdi, E.; Sellami, H. Microstructure Effect on Hard Rock Damage and Fracture During Indentation Process. Geotech. Geol. Eng. 2015, 33, 1539–1550. [Google Scholar] [CrossRef]
- Yang, Q.; Zhou, J. Pneumatic DTH Hammer Tooth Crushing and Optimization of Teeth Arrangement Based on ABAQUS. Drill. Eng. 2024, 51, 40–50. [Google Scholar] [CrossRef]
- Hill, R.; Storåkers, B.; Zdunek, A.B. A Theoretical Study of the Brinell Hardness Test. Proc. R. Soc. Lond. A 1989, 423, 301–330. [Google Scholar] [CrossRef]
- Jiang, H.; Meng, D. 3D Numerical Modelling of Rock Fracture with a Hybrid Finite and Cohesive Element Method. Eng. Fract. Mech. 2018, 199, 280–293. [Google Scholar] [CrossRef]
- Wu, Z.; Ma, L.; Fan, L. Investigation of the Characteristics of Rock Fracture Process Zone Using Coupled FEM/DEM Method. Eng. Fract. Mech. 2018, 200, 355–374. [Google Scholar] [CrossRef]
- Li, S.; Chen, Z.; Li, W.; Yan, T.; Bi, F.; Tong, Y. An FE Simulation of the Fracture Characteristics of Blunt Rock Indenter Under Static and Harmonic Dynamic Loadings Using Cohesive Elements. Rock Mech. Rock Eng. 2023, 56, 2935–2947. [Google Scholar] [CrossRef]
Disclaimer/Publisher’s Note: The statements, opinions and data contained in all publications are solely those of the individual author(s) and contributor(s) and not of MDPI and/or the editor(s). MDPI and/or the editor(s) disclaim responsibility for any injury to people or property resulting from any ideas, methods, instructions or products referred to in the content. |
© 2025 by the authors. Licensee MDPI, Basel, Switzerland. This article is an open access article distributed under the terms and conditions of the Creative Commons Attribution (CC BY) license (https://creativecommons.org/licenses/by/4.0/).