Abstract
Intraluminal photoacoustic (PA) imaging has the potential for providing physiological and functional information in wide-ranging clinical applications. Along with endoluminal ultrasound transducers, these applications require compact light delivery devices which can deliver high-energy ns-pulsed laser to the target region. In this work, we describe the design, method of fabrication and characterization of a new compact, side-fire optical fiber that can deliver high-energy laser pulses for PA imaging. Side-fire illuminators were fabricated using UV laser ablation to create windows on the side of a 1.5 mm diameter single core, multi-mode optical fiber with a reflective silver coating and a beveled end. Devices with 10 mm, 20 mm, and 30 mm window lengths were fabricated and their beam profiles characterized. Elongated side-fire fibers with −6 dB beam size up to 30.79 mm × 5.5 mm were developed. A side-fire to total output ratio of up to 0.69 and a side fire efficiency of up to 40%, relative to a standard front-fire fiber, were achieved. We evaluated the effects of high-energy ns-pulsed light propagation on the fiber by coupling the fiber to 18 mJ or 100 MW/cm2 (at 750 nm) beam from a Q-switched laser. The PA imaging with the fiber was demonstrated by detecting India ink targets embedded in chicken breast tissue over the full length of a 20 mm illumination window and over a 100° angle and by visualizing in vivo the rat ear vasculature.
1. Introduction
Photoacoustic (PA) imaging combines optical contrast from pulsed laser illumination of tissue with the imaging field of view of ultrasound. The PA signal arises from wavelength-specific absorption of typically near-infrared wavelength, nanosecond (ns) laser pulses by chromophores in the tissue, including hemoglobin, lipids, melanin, and exogenous contrast agents. With multi-wavelength illumination, PA imaging is capable of differentiating chromophores with distinct absorption spectra, so it can provide functional information such as total hemoglobin concentration, oxygen saturation [1,2,3], and molecular imaging [4,5,6,7], mapped to the anatomical structure shown by conventional B-mode ultrasound. The pressure generated by the absorption of light is given by
where the Grüneisen parameter () relates to the efficiency of converting absorbed optical energy into pressure, is the optical absorption coefficient of the chromophore, and is the local fluence (energy per unit area). As the light travels through the tissue, it is scattered and absorbed, resulting in a gradual reduction in the fluence with distance from the light source; hence, the PA signal is limited by the fluence reaching it. This can degrade the PA imaging performance when large-volume imaging is required or if the imaging target is situated deep in the anatomy [8,9,10].
PA imaging systems for non-invasive imaging often use optical fiber bundles flanking the ultrasound transducer to illuminate tissue over the ultrasound imaging plane with high peak power laser pulses, typically in MWs. However, the fiber bundle adds to the bulk of the ultrasound probe [1,11]. The PA field of view can match the ultrasound imaging field if the fiber bundles deliver sufficient fluence at depth while being distributed along the length of the US probe. However, for applications that have limited access, such as image-guided intervention, intraluminal, or endovascular imaging, both the ultrasound probe and the light delivery device must be compact. Single optical fibers, with forward illumination from the end or side-fire with a prism, mirror, or bevel at the tip have been developed to investigate these applications [9,12,13,14,15,16,17,18,19,20,21,22,23,24,25,26,27]. Small-diameter fibers (e.g., <5 mm) can also enable through-transmission illumination aligned with the ultrasound image plane, for example, intraluminal light delivery separated from the US probe [28,29,30].
While compact side fire devices have yielded good PA imaging depth [28,29,31], the imaging field of view is restricted by the small spot size and weakly diverging beam, requiring the optical fiber to be mechanically swept to illuminate the full region of interest. This may significantly increase the imaging time and make it difficult to use in a clinical setting. Further, the laser pulse energy may have to be restricted so that the fluence at the small aperture is below safety limits to avoid localized tissue heating or damage. Therefore, a compact light delivery device with an extended illumination aperture is needed.
Radial fiber diffusers deliver light circumferentially along a section of the fiber [17,27,32]. Such designs can have an extended aperture and provide large illumination volumes. However, the cylindrical beam is not an efficient use of the laser energy for PA imaging using a finite ultrasound imaging plane. Furthermore, diffusers based on light scattering centers in the fiber core, such as those used for photodynamic therapy applications [32,33] are not able to withstand high peak powers. Therefore, we propose a compact side-fire fiber with an elongated illumination aperture that can carry high peak power (MW) ns pulses. Elongated side-fire illuminators have been developed by creating multiple notches along the fiber to reflect the light [34], by depositing materials with different refractive indices on the core [35], by laser-ablating micro-holes the generate multiple side-fire beams [36,37], or by adding a conical mirror to a cylindrical diffuser [38]. However, high power laser pulse transmission has not been demonstrated with the first three, while the diameter of the latter [38] is 8 mm. The challenge of generating uniform side-fire illumination from a compact (e.g., <3 mm diameter) device capable of carrying high pulse power remains.
In this paper, we present an elongated side-fire fiber comprising rectangular apertures, which were laser micromachined on one side of an optical fiber. By ablating into the core, light from the low order propagation modes can be redirected out of the machined window. UV laser ablation was used to create a roughened window on the side of a 1.5 mm diameter optical fibers. The fibers were coated with silver to redirect light out of the ablated region. Fibers with windows up to 30 mm long were developed and characterized. We measured the beam profile and the side-firing efficiency using a low-power CW laser (660 nm). The fabricated fibers were coupled to a 100 MW/cm2 beam from a Q-switched PA imaging laser (680–970 nm), and the effect of repeated transmission of the laser pulses on the emission characteristics of the window was evaluated. PA imaging with a fabricated fiber was demonstrated with ink tubes in a tissue phantom and then by scanning a rat ear in vivo.
2. Materials and Methods
2.1. Side-Fire Fiber Design
The forward light propagation in multi-mode optical fibers can be altered by modifying the refractive index or the physical structure of the fiber core or its surface through methods such as chemical etching, mechanical abrasion, UV laser ablation, and femtosecond laser writing [17,32,39,40]. These modifications cause scattering of optical energy and redirection of some light propagation modes, allowing photons to escape the core and be emitted from the fiber’s side, such as in circumferential diffusers. In our work, we used UV laser ablation to create corrugated windows along the side of single core 1.5 mm diameter multi-mode optical fibers (FT1500UMT, Thorlabs, Inc., Newton, NJ, USA), which have a damage threshold of 1 GW cm−2. We made side-emitting fibers with 10 mm (n = 2), 20 mm (n = 2), and 30 mm (n = 2) long windows. Three successive ablations were performed to enhance the side emission by creating deeper structures in the fiber, enabling more transmission modes to interact with the window. The ablated window was positioned 5 mm from the fiber’s distal end, leaving an intact segment for quantifying emission properties, including the side-to-front fire ratio, as described below. The goal of these modifications is to disrupt the total internal reflection at the modified core surface, causing a constant redistribution of the modes traveling in the core.
Reflective silver coatings were used to further redirect modes that do not satisfy the optical fibers’ NA and would not be emitted at the machined window. Silver films are highly reflective across the visible and infrared spectrum down to 400 nm and minimally absorbed in the visible range [41]. While optical properties depend on film thickness, stability in transmittance and reflectance is achieved once a minimum thickness of 12–18 nm is reached [42].
2.2. Side-Fire Fiber Fabrication
The optical fiber’s buffer coating was stripped using a fiber stripping tool, keeping the cladding intact, and the fiber was secured on a glass slide. To address the challenge of focusing the ablation laser on the fiber’s curved surface, one side was flattened using a dicing saw (DAD3240, DISCO Corporation, Tokyo, Japan). A 200 µm thick, 500-grit diamond blade was used to make 150-µm-deep cuts perpendicular to the fiber axis, spaced 100 µm apart, creating overlapping passes that flattened the surface by removing the cladding and exposing the core (Figure 1a,b). Additionally, a 45° bevel was made at the distal end with the same blade to reflect light back into the fiber core and to reduce forward emissions.
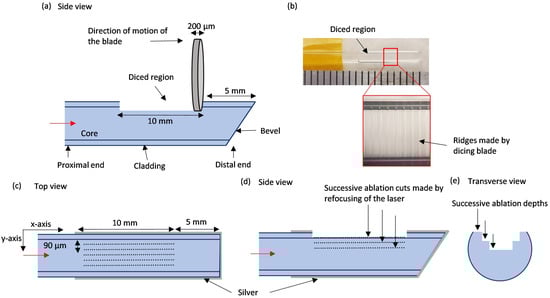
Figure 1.
The micromachined side-fire optical fiber. (a) Side-view sketch showing the flattened region and beveled tip machined with a dicing saw. (b) A fiber before silver coating showing the surface ridges made by the dicing blade. (c) The top view sketch illustrates the laser ablation pattern along the length of the fiber (dotted lines). (d) A side view sketch illustrates the refocusing of the micromachining laser focus on ablating successive layers deeper into the fiber. (e) Transverse view sketch illustrating the successive ablations.
The fiber was then secured on a glass slide and mounted on a four-axis servomotors-operated stage. The diced surface was patterned using an ArF excimer laser (wavelength = 193 nm; IX-255, IPG Photonics, Oxford, MA, USA), emitting 10 ns pulses at a 100 Hz repetition rate. We focused a 90 µm square laser beam spot onto the fiber, setting the ablation energy at 6.42 J/cm². The laser focus was set to the mean depth of the ablated surface, which was found by adjusting the focus of the inspection camera of the laser micromachining system at three positions along the window. As the four-axis stage moved the fiber along the x-axis in 3 µm steps, each pulse overlapping the previous one, continuous ablation lines were created along the fiber’s length. We patterned seven parallel lines across the fiber’s width (y-axis) to achieve a 0.8 mm window width (Figure 1c). This process was repeated twice to ablate deeper into the fiber (Figure 1d). For each successive ablation, the width of the cut (along the y-axis) was reduced by 180 µm, giving the ablated region a u-shape as shown in Figure 1e.
After laser ablation, we cleaned the fibers with isopropyl alcohol, masked the window area with masking tape, and wrapped the proximal end of the fiber in aluminum foil, leaving only the distal end exposed for silver coating. A 3000 Å thick layer of silver was deposited using a magnetron sputtering system (Orion3, AJA International, Scituate, MA, USA). Fibers, between 12 cm and 19 cm long to fit within the sputtering system, were placed horizontally on the carrier plate, and sputtering was performed twice to coat the entire fiber circumference. After sputtering, the tape covering the window was removed, and the distal end of the fiber, including the ablated window, was encapsulated in a clear fused quartz tubing (Technical Glass Products Inc., Painesville, OH, USA) with 2.2 mm (inner diameter) × 3 mm (outer diameter) dimensions. The final outer diameter of the enclosed fiber was 3 mm.
2.3. Fiber Emission Characterization
Fiber characterization involved measuring the beam profile in the longitudinal and azimuth directions. Additionally, the percentage of light emitted from the side of the fiber was measured relative to the total light output from the fiber to estimate the proportion diverted through the side-fire window. The percentage of side-emitted light was also compared to that of a naïve optical fiber of the same model to estimate the combined light lost in back-reflections and front leakage.
To measure the longitudinal profile, we scanned an isotropic detection fiber (IP85, Medlight, Ecublens, Switzerland, tip diameter 850 µm) over a 30 mm × 30 mm area in the x-longitudinal and y-transverse directions with a step size of 500 µm in both directions, recording the relative irradiance emitted by the area side-fire fiber regardless of the emission angle. The detection fiber, which was positioned at a distance of 5 mm from the side-fire fiber, was connected to a photodiode (DET10, Thorlabs, Newton, NJ, USA) to record the output voltage with an oscilloscope and was positioned at a distance of 5 mm from the side-fire fiber. The side-fire fiber was connected to a 660 nm laser source (S1FC660, Thorlabs, Newton, NJ, USA) via a coupling assembly consisting of a collimator (F810SMA-780, Thorlabs, Newton, NJ, USA) and a focusing lens (LA1560-B, Thorlabs, Newton, NJ, USA). This laser wavelength is close to the Q-switched PA imaging laser wavelengths, and the wavelength difference does not significantly change the refractive index, hence the scattering at the window can be expected to be similar for all the PA wavelengths. The Numerical Aperture (NA) of the coupling assembly was 0.10 and the fiber was spatially overfilled by placing it behind the lens focus. The coupling assembly was mounted on a computer-controlled 2D motor stage for automated data collection by synchronizing the oscilloscope output with a 2D motor stage. The “front” beam profile corresponds to measurements taken with the light-emitting window facing the isotropic detection fiber, while the “back” profile corresponds to measurements when the detection fiber faces the silver-coated region. Figure 2a illustrates this setup.
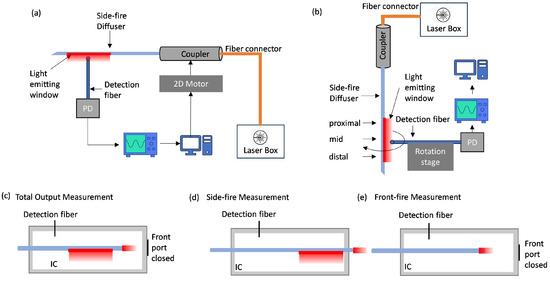
Figure 2.
Experiment setup for fiber characterization. (a) Two-dimensional beam profile measurement is shown here for the “front” profile. (b) Azimuthal profile measurement. Schematic diagram of the experiment setup showing the position of the optical fiber inside an integrating sphere for measuring: (c) Total output It (d) Side fire Is. (e) Front fire If from a non-modified front firing optical fiber.
For azimuthal profile measurements, the side-fire fiber was fixed vertically on a mount, while the detection fiber was mounted on a rotation stage. The middle of the machined window was visually aligned to face towards the detection fiber. The distance between the two fibers was set at 1 mm, and data points were acquired at 5° intervals while manually rotating the detection fiber around the stationary side-fire fiber. Azimuth measurements were taken at the proximal, mid, and distal regions of the side-fire window, as shown in Figure 2b. The beam spread in the azimuth direction was calculated by the difference between the maximum and minimum angle at 50% of the peak intensity.
The side-fire ratio is the ratio of the light emitted from the side of the fiber, Is, relative to the total light exiting fiber It, and it evaluates the proportion of the total emitted light that is coming from the machined window. This is critical to assess how much light is lost in forward propagation. The side-fire efficiency is the side fire emission Is relative to the light emitted from a multi-mode straight-cut front-firing fiber of the same model (If). This measurement evaluates the proportion of light diverted to the side-fire window compared to the total light in the fiber. This is useful for assessing the amount of light lost in forward propagation and back reflections from the bevel. These measurements were performed using an integrating cylinder (IC) manufactured from ultra-high-density polyurethane (Gigahertz-Optik, Munich, Germany). A fraction of the light inside the IC was recorded via a detector fiber (FT600UMT, Thorlabs, Newton, NJ, USA) inserted via a small port hole. The measurement configurations for It, Is, If are illustrated in Figure 2c–e. For side-fire measurement, the fiber extends through the IC such that its distal end passes through the front hole, otherwise the front hole is sealed with reflective tape. An average of 10 readings was acquired for each prototype characterized and each measurement configuration.
2.4. Coupling PA Laser into Fiber
A Q-switched Nd:YAG OPO tunable laser (LAZR, FUJIFILM VisualSonics, Inc., Toronto, ON, Canada) was used as the PA laser source. The laser system produces 40 mJ pulses with a duration of 5–10 ns in the near-infrared range (680–970 nm) at 20 Hz repetition rate. For multispectral photoacoustic (PA) imaging using the Vevo 3100 system (FUJIFILM VisualSonics, Inc., Toronto, ON, Canada), up to 550 frames can be collected during one acquisition, with 4 pulses required for each frame. Thus, a total of 2200 pulses can be fired during one PA acquisition. To demonstrate the fiber’s mechanical resilience, it was tested by coupling more pulses than needed for one PA acquisition; thus, a total of 6000 shots at 18 mJ pulse energy ( = 750 nm) were transmitted into the fiber. A custom coupling assembly was developed as described in our previous studies [28] and had an NA of 0.10, as used in the characterization setup. The light from the coupling assembly was directed into a 1-meter-long patch cable of the same specification as the fabricated side-fire fibers. The fabricated fibers were then butt coupled to this long fiber connected to the PA laser with an index matching gel (G608N3, Thorlabs, Inc., Newton, NJ, USA); we measured an energy loss of 10–16% due to the butt connection. The patch fiber was spatially overfilled by placing the coupling end slightly beyond the focal point of the focusing lens. The per-pulse energy emitted from the window region was measured using a power/energy meter (Maestro; Gentec, OR, USA; 5 cm diameter) before and after PA laser pulse transmission as part of standard measurement prior to imaging.
2.5. Phantom and In Vivo PA Imaging Using the Side-Fire Fiber
PA imaging of a phantom using the side-fire fiber was demonstrated by imaging absorbing targets embedded in chicken breast tissue. The targets were polyurethane tubes (0.015″ ID and 0.033″ OD) filled with India ink (DeSerres, Vancouver, BC, Canada). The fiber with the 20 mm long window was coupled to the tunable laser (LAZR, FUJIFILM VisualSonics, Inc., Toronto, ON, Canada). The energy output at the 750 nm wavelength used for imaging was 3–5 mJ, as measured from the window region. B-mode and PA-mode images were acquired with a Vevo 3100 ultrasound imaging system (FUJIFILM VisualSonics, Inc., Toronto, ON, Canada) and a 20 MHz linear array (MX250; max. image width 23 mm) positioned to image the tube cross-sections. To evaluate the illumination along its length, the optical fiber was positioned parallel to the image plane, i.e., perpendicular to the tubes. The fiber was then aligned perpendicular to the image plane (i.e., parallel to the target tubes) and positioned centrally approximately 10 mm from the tubes to evaluate the tissue illumination by the fiber in the azimuth direction. A motor stage was used to translate the transducer along its elevation direction with a step size of 150 µm and acquire a volumetric image of the tube targets.
For in vivo PA imaging, a rat ear was placed on an anechoic and optically transparent support that held the optical fiber such that the ear was within the large illumination area of a 20 mm window side-fire fiber. Anesthesia of the animal was initiated by 5% isoflurane in oxygen and maintained at 2% throughout the imaging. B-mode and PA-mode imaging was performed with the same laser and ultrasound acquisition setup as for the phantoms described above. The optical fiber was inserted into a channel 5 mm below the top surface of a block of plastisol (50 × 50 × 50 mm3) [28,43] to separate visually the strongly reflecting fiber from the thin ear in the images. The transducer was held by a motor stage above the ear, with ultrasound gel coupling between the ear and the plastisol block, and up to 8 mm thick above the ear. A 3D scan of the ear was set up to acquire an image volume of 25 mm (image width) × 16 mm (image depth) × 10 mm (scan length) with a step size of 150 µm. Animal experiments were performed under the approved animal use protocol of Sunnybrook Research Institute. Image reconstruction and analysis for both phantom and in vivo imaging were performed using the Vevo LAB software (v5.6.1, FUJIFILM VisualSonics, Inc., Toronto, ON, Canada).
3. Results
3.1. Side-Fire Fiber Fabrication
Three variations of the side-fire fibers were fabricated, sporting 10 mm, 20 mm, and 30 mm long windows on the fiber’s side. Figure 3a–c shows microscope images of the laser machined region on a fiber. The ablated surface of the fiber is visibly roughened, and a pit was observed along the central axis of the fiber (Figure 3b). Figure 3c shows the cross-sectional view of the fiber showing a u-shaped valley created as a result of three successive ablations. Figure 3d,e shows the side and top view of a 20 mm long window fiber after coating it with silver, encasing in a 3 mm (OD) glass tube. A red laser was coupled manually to the fiber, and the light exiting over the full length of the window was observed. As shown in Figure 3d, some light can be seen exiting from the silver coated bevel and sideways from the window region. More light was observed visually towards the proximal end of the window compared to the distal end (Figure 3e). The maximum ablation depth into the fiber, estimated with the laser machining system inspection camera, is reported in Table 1.
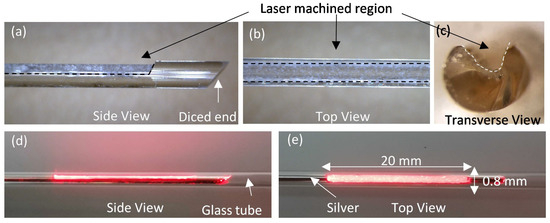
Figure 3.
Laser machined side-fire fiber: (a) side view showing the machined window demarcated by black dashed lines in the 1.5 mm OD fiber and the 45° diced end, (b) top view showing the width of the cut indicated by black dashed lines, and (c) transverse view of the window cut along the width showing a valley created by the laser machining. (d) Side and (e) top view images of the fiber with silver coating, except in the ablated window, placed in a glass tube and with a red laser pointer coupled to it to show the light emitting from the machined window.

Table 1.
Summary of beam characteristics for fabricated prototypes.
3.2. Side-Fire Fiber Characterization
The beam profiles of fibers with window lengths of 10 mm, 20 mm, and 30 mm are shown in Figure 4, and their characteristics are summarized in Table 1. The distal and proximal ends of the windows, relative to the light travel direction in the core, are indicated by yellow arrows; intensities are normalized to the peak in each dataset. Figure 4b,e, and k show the plots of the normalized intensity along the longitudinal and transverse directions relative to the fiber axis, indicated by the black dotted lines in the 2D beam plots. The maximum intensity in the beam profile was observed near the center of the ablated aperture for the 10 mm window prototypes. The maximum intensity was about 5 mm from the proximal window end for the 20-mm window prototypes, with the signal intensity tapering slowly to about 4 mm from the distal end then dropping quickly (Figure 4e). The beam profile for the 30 mm prototype has peaks within 4 mm of each end of the window and a 30% intensity drop in the middle; the highest intensity was measured near the distal edge. The pair of 10 mm window prototypes had substantially similar beam profiles, as did the 30 mm window pair. The pair of 20 mm window prototypes had differing slopes in the plateau over the machined window, with the beam profile of the second prototype.dropping to 70% of the peak before the steep drop at the distal edge of the window.
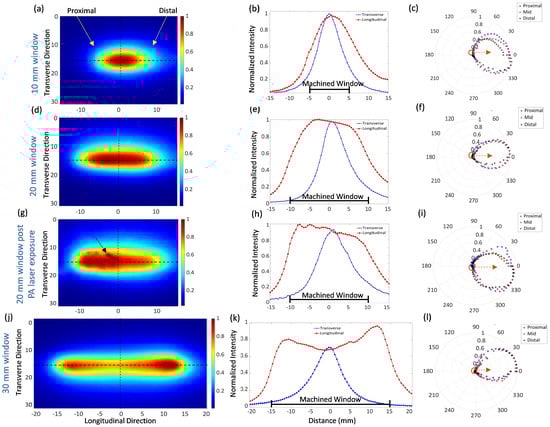
Figure 4.
Normalized measured beam profiles for side-fire fibers: (left) two-dimensional beam profile, (mid) longitudinal and transverse intensity plots along black dotted lines in beam profile, and (right) azimuthal beam profile at proximal, central, and distal positions within the ablated aperture of fibers with (a–c) a 10 mm window, (d–f) a 20 mm window, (g–i) a 20 mm window fiber after receiving 6000 PA laser pulses, and (j–l) a 30 mm window.
The azimuth beam profile at the distal, middle, and proximal window positions for the three window lengths are shown in Figure 4c,f,l. The intensity values are normalized to the maxima at each longitudinal position. The average azimuth angle span was 108°, 109°, and 82° for the 10 mm, 20 mm, and 30 mm window prototypes, respectively. The prototypes achieved a side fire ratio ranging from 38% for a 30 mm window and up to 69% for a 20 mm window. The side-fire efficiency, compared to a naïve fiber with emission only at the flat distal end, was a maximum of 40% for one of the 20 mm prototypes and as low as 18% for a 10 mm window.
3.3. Beam Profile Before and After PA Laser Transmission
Figure 4g shows the 2D beam profile of the 20 mm long window prototype fiber after launching 6000, 18 mJ ( = 750 nm) pulses into the fiber. A clear difference was observed in the 2D beam profiles pre- and post-PA laser coupling, as seen in Figure 4d,e and Figure 4g,h, respectively. The beam width (FWHM) after the PA laser coupling fiber expanded by 2.8 mm in the longitudinal direction and 1.63 mm in the transverse direction. After PA laser exposure, the location of the maximum intensity shifted proximally, as can be seen from the 2D beam plot graphs in Figure 4e,h. A small diagonal crack, indicated by an arrow in Figure 4i, appeared on the window after PA laser transmission and was also observed with the naked eye as a bright spot when the 660 nm test laser was coupled to the fiber. The azimuth plots indicated an expansion of the beam divergence by 10° at the proximal position. The per-pulse energy from the window region, as measured by the energy meter, decreased from 8 mJ at the beginning of the session to 5 mJ after transmitting the 6000 pulses.
3.4. Phantom and In Vivo PA Imaging Using the Side-Fire Fiber
Figure 5 shows B-mode and PA-mode images of the tissue phantom with embedded tubes filled with India ink. The tubes are imaged in cross-section and visible in the B-mode as bright features; as expected, both the top and bottom walls of the tube are visible as two echoes for each tube. When the optical fiber is perpendicular to the tubes and parallel to the transducer (Figure 5a), it is faintly visible in B-mode because it is slightly out of plane (Figure 5b). In the corresponding PA-mode image (Figure 5c), all targets above the optical fiber are detected, including the tubes furthest (9 mm) from the fiber. When the optical fiber is aligned parallel to the ink-filled tubes, nd perpendicular to the image plane (Figure 5d), it is visible as a bright feature in the B-mode image (Figure 5e). Tubes spanning 102° are visible in the PA-mode (Figure 5f), which matches the 109° azimuthal beam profile of the fiber (Figure 4f). The PA signals from the tube delineating the top and bottom of the ink can be seen in the inset in Figure 5f; this is expected when imaging contrast-filled tubes due to the N-shaped PA waveform [44]. Since the light source is below the tubes, the bottom surface of the ink yields a stronger signal. The volumetric scan has the fiber aligned approximately parallel to the tubes (Figure 5g), and demonstrates PA signals are detected from these tubes along the 10 mm scan (Figure 5h). The top and bottom of the ink-filled tubes is also detected, appearing as a doublet for tubes that received sufficient energy to generate a strong PA signal at the top surface.
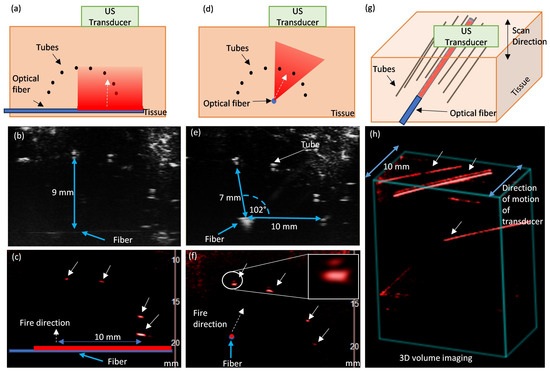
Figure 5.
PA imaging of polyurethane tubes filled with India ink embedded in chicken breast tissue. (a) Schematic diagram, (b) B-mode US image and (c) PA-mode image of the tube cross-sections with optical fiber perpendicular to the tubes (parallel to image plane), demonstrating the longitudinal illumination field, and (d) Schematic diagram, (e) B-mode US image, and (f) PA-mode image with the optical fiber parallel to the tubes (perpendicular to the plane) showing the angular illumination field; inset in (f) is zoomed-in view of PA signal from top and bottom surfaces of ink in the tube. Multi-plane imaging with 10 mm scan (g) schematic and (h) volume rendered PA-mode image showing both angular and longitudinal illumination field. Solid white arrows indicate tubes visible in PA-mode images; dotted white arrows indicate approximate orientation of the machined window and direction of the emitted laser beam.
The PA-mode image of the rat ear overlaid on the B-mode image is shown in Figure 6. The PA image is acquired with laser per pulse energy of 3 mJ measured at 750 nm. The optical fiber is visualized in the B-mode as a strong reflector at the bottom of the image; it is tilted due to the deformation of the plastisol block in which the fiber is inserted. The shape of the ear is visible in the B-mode, with anechoic gel and plastisol above and below the ear, respectively. No signal was observed from plastisol as it was devoid of any optical or acoustic scatterers. Due to hemoglobin absorption, blood vessels appear as bright regions in the PA-mode, which are, as expected, confined within the ear. PA signals from the blood vessels were observed over 19 mm apart in the central cross-section of the ear, matching the site of the machined window.
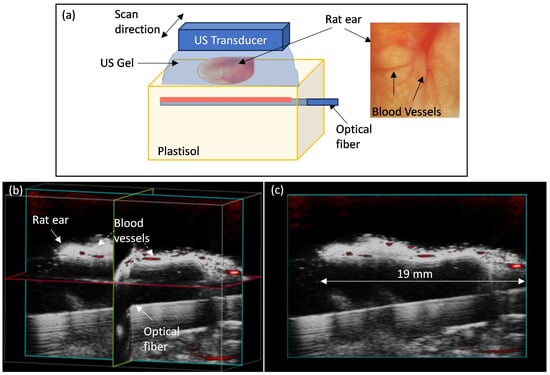
Figure 6.
(a) Setup for imaging rat ear in vivo, with optical fiber placed 5 mm below the surface of a plastisol block supporting the ear. Ultrasound gel couplant surrounds the ear. (b) Volume rendering of 3D B-mode and PA-mode scan of a rat ear. Pseudo-color PA-mode image (red) is overlaid on the grayscale B-mode image, and three perpendicular cross-sections are shown, intersecting near the middle of the ear. (c) The transverse view shows the same imaging plane as in (b). The image dimensions are 23 mm (lateral) × 16 mm (depth), and the length of the imaged ear is 19 mm.
4. Discussion and Conclusions
Intraluminal or interstitial photoacoustic imaging of tissues and organs requires the delivery of high peak power (MW) over the field of view of the ultrasound probe while minimizing the cross-sectional dimensions of the light delivery device for ease of access. As PA imaging requires the delivery of a large number of sub-micro-second pulses, the light delivery system must be resilient to high transient optical power densities. At the same time, the local fluence near the illumination device must be kept below safety limits. Since off-the-shelf cylindrical diffusers are not suitable due to their low power damage threshold, an elongated illuminator that can carry high peak power and scatter optical energy from the core is needed. Furthermore, the light emission should be directional and confined within the US imaging plane. In order to obtain light out from the side of the fiber, the modes in the core need to be disturbed. While structures or modifications on the fiber surface can redistribute energy from higher modes, alteration of the material close to the fiber center is required to redistribute the energy from lower modes and redirect the majority of the energy out of the fiber.
4.1. Observations and Insights
In this work, single-core, multimode fused silica fibers with high damage threshold (1 GW cm−2) were utilized to develop side-fire elongated illuminator using ArF excimer laser machining. The developed device was compact with a 1.5 mm OD or a 3 mm OD with a glass tube housing, had extended side-fire illumination demonstrated up to 30 mm in length, and was capable of carrying 18 mJ per-pulse energy or 100 MW cm−2 power density. As shown in Figure 4, for all the prototypes, the −6 dB beam size in the longitudinal direction matched the machined window length. The fibers with 10 mm long windows showed a central peak in intensity, whereas the longer windows had steep rises in intensity within 5 mm of the window ends and tilted plateaus or dips (>10% drop within 10 mm) over the middle of the window. The peaks are likely due to scattering of the higher modes on interaction with the machined material, whether at the proximal end of the window or at the distal window end after reflection of forward propagating modes at the bevel. The decreasing intensity with distance from the peaks is likely due to the reducing energy in the higher order modes after interaction with the machined surface and therefore decreasing scattering and escaping light as a function of position. As expected, the silver deposition led to negligible light intensity detected opposite the window. The lateral window dimension was the same for all prototypes, corresponding with reasonably consistent transverse beam spread (80–110°), though the effect of widow width was not investigated here. It should be noted that the optical coupling used in the current setup has an NA of 0.10 which is less than the NA of the fiber of 0.39, which leads to mode under-filling. While mode filling was not investigated here, if we overfill the modes, we can expect more light interacting with the machined window region. This may result in more light escaping out from the side and less light propagating unperturbed and improved side-fire efficiency.
The ablation depth in the fiber core is a crucial factor in the beam profile and side-fire efficiency, with deeper ablation corresponding with higher side-fire efficiency irrespective of window length (Table 1). For example, the 30 mm window was expected to allow more light to exit the fiber but had lower efficiency than the 20 mm fibers, corresponding with shallower ablation depths. Hence, greater ablation depths and the consequent disruption closer to the center of the core is a larger determinant of side-fire efficiency than the window size. The u-shaped ablation trench, created by three successive machining layers, was selected to retain as much of the fiber material for structural integrity while ablating into the core in order to scatter the lower modes. The cross-sectional geometry, such as the opening angle of the fabricated prototypes, is expected to affect the emitted azimuthal beam profile but was not investigated in this study. All fibers were structurally intact after machining but were fragile and could easily break during testing. In some early prototypes, the trench was encapsulated in an optically transparent epoxy to strengthen the fiber, but charring was observed after coupling to the PA imaging laser, caused by air bubbles not fully removed during the epoxy casting process. However, once they are encased in a glass tube, they maintain mechanical integrity through all the characterization and imaging experiments.
Compared to our earlier prototype [45], this new design includes a bevel at the distal end of the fiber. This bevel, which redirects the reflected light into the fiber, allowing for further interaction with the machined region, resulted in a 30% increase in the side-fire ratio compared to the 10 mm window prototype with a flat-cut end. When the device has both a beveled tip and a conformal silver coating to reflect light from the fiber surface, up to 40% of the light emitted from a flat ended fiber is redirected outside of the machined fiber. Some of the light is lost in back reflections from the beveled tip that also does not interact with the machined window, such that the side-fire efficiency, relative to a flat-cut fiber, is lower than the ratio of side-to-total light emitted from the tip.
We also observed some light transmission at the bevel end, which increased after 6000 PA laser pulses were transmitted into the fiber. Upon visual inspection, the silver covering the beveled tip was completely eroded after a set of PA laser transmits was used in the test and imaging demonstration of the fibers. This emission from the bevel results in a decrease in the side-fire efficiency of the device. This could be remedied by replacing the silver coating by a 45° rod reflector at the terminating end of the fiber [29].
The optical fiber developed in this study is designed for Acoustic Resolution–Photoacoustic Imaging (AR-PAI) applications, where image resolution is determined by the ultrasound transducer and system and not the light beam dimension [28,46].While light intensity drops by up to 30% along the window (for the 30 mm windows), tissue scattering is expected to significantly homogenize the beam, reducing the effect of beam intensity variation on PA signal uniformity. As with any light source, fluence is highest near the emitting surface and decreases as light travels through tissue due to absorption and scattering, leading to stronger PA signals near the firing window, as observed in Figure 5c. However, apart from this expected PA signal intensity decrease with distance, no significant effect on the spatial registration of PA signal due to window size is anticipated.
4.2. Challenges and Limitations
We used an excimer laser to fabricate the side-fire fiber prototypes because it is a versatile and programmable micromachining tool available in our lab [47]. This allowed us to investigate the side-fire fiber concept. This laser was able to ablate the core materials and generate a roughened surface. However, the cylindrical shape of the optical fiber makes it challenging to focus the machining laser at the surface and causes insufficient and non-uniform ablation at the sides of the fiber. This challenge was overcome by dicing the optical fiber surface prior to laser machining. The dicing saw creates a planar surface with ridges, as shown in Figure 1b, so that the ArF radiation could be focused on the intended region of the fiber.
The focus of the excimer laser to remove the successive layers of glass was set using the inspection camera. This has limited accuracy because of the roughened surface of the ablated window, so the six characterized fibers have variable ablation depths with a mean and standard deviation of 645 ± 95 μm, consistent with an imprecise laser focal position relative to the surface height and the effect of it is reflected in a variation in the fiber side-fire efficiency (Table 1).
The nanosecond PA imaging laser pulses have the potential to effectively continue altering the fiber structurally. The long-duration ns pulse allows for the heat to diffuse in the fiber material, which may result in melting and fracturing [48] in the fibers. As an example, a diagonal crack (black arrow, Figure 4g) near the center of the window was observed following the 6000 pluses of the PA imaging laser. This may have been a result of the elongation of an existing crack or the formation of a new crack as the ns laser pulses interact with the modified fiber structure. The beam profile was also altered, increasing by 12% and 18% in the longitudinal and transverse directions, respectively, and the peak intensity shifted proximally (Figure 4g–i). This can be expected as the proximal region of the window interacts with the highest power density, redirecting a portion of the energy out of the fiber, while more distal regions experience lower power densities. The azimuth emission profile was also affected most at the proximal window position (Figure 4i), increasing the beam spread by 10°. Overall, the light emitted from the window side decreased by 37% following the initial sequence of imaging laser pulses, and a drop in the energy was observed after each phantom and in vivo imaging session. Repeated use of the fibers may change the beam characteristics and reduce side-fire efficiency significantly, which may limit their use to single use only.
4.3. Optimization and Future Directions
While it is possible to fabricate the elongated side-fire fibers with an excimer machining laser, and process optimization can improve some of the limitations discussed above, the method leads to fragile fibers that degrade when transmitting ns PA imaging laser pulses. Micromachining processes like femto-second (fs) laser would be better suited for altering the optical fiber core because of the short pulse duration and their ability to perform subsurface ablations without affecting the fiber surface [49,50]. The pulse duration of fs lasers is shorter than the thermalization time scale, resulting in smaller temperature diffusion length and a more precise ablation [51]. This is expected to reduce fractures in the fiber and improve strength and robustness post fabrication. Another advantage of using fs laser ablation is that patterns of ablated points can be created across the full diameter of the fiber so that light in all the modes in the fiber can be redistributed. This has the potential to significantly improve the side-fire efficiency of the fibers if an appropriate pattern and density of ablated spots can be created.
We demonstrated PA imaging of India ink-filled tubes embedded in chicken breast tissue and vasculature in a rat ear in vivo using the side-fire fiber prototypes. Targets were visible in the PA-mode over an angle of 102° and for the full width of the US transducer field of view. The initial device design considered optical fibers positioned within and parallel to the ultrasound probe imaging plane so as to benefit from the illumination from the full longitudinal length of the side-fire window. Yet, the 3D imaging of the tissue and ink phantom (Figure 5f) demonstrates the feasibility of PA imaging of a volume using these extended illumination side-fire optical fibers aligned perpendicular to the image plane. In this setup, the optical fiber can be stationary, illuminating a constant segment of tissue, and the ultrasound probe is translated to cover its entire length. In the end, PA imaging of the phantom with India ink tubes and rat ear in vivo was performed at 5 mJ and 3 mJ, respectively, which is quite low when compared to the 35 mJ delivered by the commercial PA system used in our lab. Yet, we were able to visualize tubes in the chicken at 10 mm depth and blood vessels in the rat ear, demonstrating a potential for deeper PA imaging with this elongated side-fire fiber design.
4.4. Conclusions
In this work, we introduced a compact (OD = 1.5 mm without casing, 3 mm with casing) side-fire fiber capable of carrying 100 MW/cm2 peak power density for at least 6000 pulses. Fibers of different illumination lengths were fabricated and characterized. We showed the improvement in side-fire coupling of the light in fibers for an increased illumination window size. The fiber was coupled to the PA imaging laser, and variations in beam profile due to high-energy PA laser pulse transmission were evaluated. The fibers were shown to be structurally stable over multiple imaging sessions. We demonstrated the PA imaging capability of the fiber by imaging India ink targets embedded in chicken breast and the vasculature in a rat ear. The compact device developed here has the potential to be used for intraluminal optical illumination for PA imaging in applications in the brain, prostate, esophagus, colon, and blood vessels or for minimally invasive PA imaging.
Author Contributions
Conceptualization, N.S., C.-F.R., L.L. and C.E.M.D.; funding acquisition, C.E.M.D.; methodology, N.S., C.-F.R., E.C. and L.L.; writing—original draft, N.S.; writing—review and editing, N.S., C.-F.R., E.C., L.L. and C.E.M.D.; supervision, C.E.M.D.; project administration, C.E.M.D. All authors have read and agreed to the published version of the manuscript.
Funding
This work was supported by the Terry Fox Research Institute New Frontiers Program Project Grant-1075 and Natural Sciences and Engineering Research Council of Canada (NSERC) through the Discover Grant RGPIN-2017-06834.
Institutional Review Board Statement
The animal study protocol was approved by the Institutional Review Board of Sunnybrook Research Institute (protocol code 21739, approved November 2023, renewed November 2024).
Informed Consent Statement
Not applicable.
Data Availability Statement
The original contributions presented in this study are included in the article. Further inquiries can be directed to the corresponding author.
Acknowledgments
The authors acknowledge Aaron Boyes for helping with the fiber fabrication, Yohannes Soenjaya for helping with animal handling for rat imaging, and Robin Marjoribanks and his team for discussions on light–matter interaction and laser ablation physics.
Conflicts of Interest
The authors declare no conflicts of interest. The funders had no role in the design of the study; in the collection, analyses, or interpretation of data; in the writing of the manuscript; or in the decision to publish the results.
References
- Needles, A.; Heinmiller, A.; Sun, J.; Theodoropoulos, C.; Bates, D.; Hirson, D.; Yin, M.; Foster, F. Development and initial application of a fully integrated photoacoustic micro-ultrasound system. IEEE Trans. Ultrason. Ferroelectr. Freq. Control 2013, 60, 888–897. [Google Scholar] [CrossRef] [PubMed]
- Liu, C.; Liang, Y.; Wang, L. Single-shot photoacoustic microscopy of hemoglobin concentration, oxygen saturation, and blood flow in sub-microseconds. Photoacoustics 2020, 17, 100156. [Google Scholar] [CrossRef] [PubMed]
- Lin, X.; Yang, C.; Lv, Y.; Zhang, B.; Kan, J.; Li, H.; Tao, J.; Yang, C.; Li, X.; Liu, Y. Preclinical multi-physiologic monitoring of immediate-early responses to diverse treatment strategies in breast cancer by optoacoustic imaging. J. Biophotonics 2024, 17, e202300457. [Google Scholar] [CrossRef]
- Emelianov, S.Y.; Li, P.C.; O’Donnell, M. Photoacoustics for molecular imaging and therapy. Phys. Today 2009, 62, 34–39. [Google Scholar]
- Mallidi, S.; Luke, G.P.; Emelianov, S. Photoacoustic imaging in cancer detection, diagnosis, and treatment guidance. Trends Biotechnol. 2011, 29, 213–221. [Google Scholar] [CrossRef]
- Luke, G.P.; Yeager, D.; Emelianov, S.Y. Biomedical Applications of Photoacoustic Imaging with Exogenous Contrast Agents. Ann. Biomed. Eng. 2012, 40, 422–437. [Google Scholar] [CrossRef]
- Weber, J.; Beard, P.C.; Bohndiek, S.E. Contrast agents for molecular photoacoustic imaging. Nat. Methods 2016, 13, 639–650. [Google Scholar] [CrossRef]
- Singh, M.K.A.; Parameshwarappa, V.; Hendriksen, E.; Steenbergen, W.; Manohar, S. Photoacoustic-guided focused ultrasound for accurate visualization of brachytherapy seeds with the photoacoustic needle. J. Biomed. Opt. 2016, 21, 120501. [Google Scholar] [CrossRef]
- Xia, W.; Nikitichev, D.I.; Mari, J.M.; West, S.J.; Pratt, R.; David, A.L.; Ourselin, S.; Beard, P.C.; Desjardins, A.E. Performance characteristics of an interventional multispectral photoacoustic imaging system for guiding minimally invasive procedures. J. Biomed. Opt. 2015, 20, 86005. [Google Scholar] [CrossRef]
- Benavides-Lara, J.; Manwar, R.; McGuire, L.S.; Islam, M.T.; Shoo, A.; Charbel, F.T.; Menchaca, M.G.; Siegel, A.P.; Pillers, D.A.M.; Gelovani, J.G.; et al. Transfontanelle photoacoustic imaging of intraventricular brain hemorrhages in live sheep. Photoacoustics 2023, 33, 100549. [Google Scholar] [CrossRef]
- Daoudi, K.; van den Berg, P.J.; Rabot, O.; Kohl, A.; Tisserand, S.; Brands, P.; Steenbergen, W. Handheld probe for portable high frame photoacoustic/ultrasound imaging system. In Proceedings of the Photons Plus Ultrasound: Imaging and Sensing, San Francisco, CA, USA, 3–5 February 2013; Oraevsky, A.A., Wang, L.V., Eds.; International Society for Optics and Photonics (SPIE): Bellingham, WA, USA, 2013; Volume 8581, p. 85812I. [Google Scholar] [CrossRef]
- Jansen, K.; Wu, M.; van der Steen, A.F.; van Soest, G. Photoacoustic imaging of human coronary atherosclerosis in two spectral bands. Photoacoustics 2013, 2, 12–20. [Google Scholar] [CrossRef] [PubMed]
- Wu, M.; FW van der Steen, A.; Regar, E.; van Soest, G. Emerging Technology Update Intravascular Photoacoustic Imaging of Vulnerable Atherosclerotic Plaque. Interv. Cardiol. 2016, 11, 120–123. [Google Scholar] [CrossRef] [PubMed]
- Schneider, M.K.; Wang, J.; Kare, A.; Adkar, S.S.; Salmi, D.; Bell, C.F.; Alsaigh, T.; Wagh, D.; Coller, J.; Mayer, A.; et al. Combined near infrared photoacoustic imaging and ultrasound detects vulnerable atherosclerotic plaque. Biomaterials 2023, 302, 122314. [Google Scholar] [CrossRef]
- He, H.; Englert, L.; Ntziachristos, V. Optoacoustic Endoscopy of the Gastrointestinal Tract. ACS Photonics 2023, 10, 559–570. [Google Scholar] [CrossRef]
- Zhang, K.; Qiu, J.; Yang, F.; Wang, J.; Zhao, X.; Wei, Z.; Ge, N.; Chen, Y.; Sun, S. Photoacoustic endoscopy and EUS: Shaking the future of multimodal endoscopy. Endosc. Ultrasound 2022, 11, 1–3. [Google Scholar] [CrossRef]
- Bungart, B.; Cao, Y.; Yang-Tran, T.; Gorsky, S.; Lan, L.U.; Roblyer, D.; Koch, M.O.; Cheng, L.; Masterson, T.; Cheng, J.X. Cylindrical illumination with angular coupling for whole-prostate photoacoustic tomography. Biomed. Opt. Express 2019, 10, 1405–1419. [Google Scholar] [CrossRef]
- Lin, L.; Xia, J.; Wong, T.T.W.; Li, L.; Wang, L.V. In vivo deep brain imaging of rats using oral-cavity illuminated photoacoustic computed tomography. J. Biomed. Opt. 2015, 20, 016019. [Google Scholar] [CrossRef]
- Lediju Bell, M.A.; Ostrowski, A.K.; Li, K.; Kazanzides, P.; Boctor, E.M. Localization of Transcranial Targets for Photoacoustic-Guided Endonasal Surgeries. Photoacoustics 2015, 3, 78–87. [Google Scholar] [CrossRef]
- Zhang, P.; Li, L.; Lin, L.; Hu, P.; Shi, J.; He, Y.; Zhu, L.; Zhou, Y.; Wang, L.V. High-resolution deep functional imaging of the whole mouse brain by photoacoustic computed tomography in vivo. J. Biophotonics 2018, 11, e201700024. [Google Scholar] [CrossRef]
- Graham, M.T.; Sharma, A.; Padovano, W.M.; Suresh, V.; Chiu, A.; Thon, S.M.; Tuffaha, S.; Bell, M.A.L. Optical absorption spectra and corresponding in vivo photoacoustic visualization of exposed peripheral nerves. J. Biomed. Opt. 2023, 28, 097001. [Google Scholar] [CrossRef]
- Xia, W.; West, S.J.; Nikitichev, D.I.; Ourselin, S.; Beard, P.C.; Desjardins, A.E. Interventional multispectral photoacoustic imaging with a clinical linear array ultrasound probe for guiding nerve blocks. In Proceedings of the Photons Plus Ultrasound: Imaging and Sensing 2016, San Francisco, CA, USA, 14–17 February 2016; p. 97080C. [Google Scholar] [CrossRef]
- Mari, J.M.; Xia, W.; West, S.J.; Desjardins, A.E. Interventional multispectral photoacoustic imaging with a clinical ultrasound probe for discriminating nerves and tendons: An ex vivo pilot study. JBO 2015, 20, 110503. [Google Scholar] [CrossRef] [PubMed]
- Maneas, E.; Xia, W.; Singh, M.K.A.; Sato, N.; Agano, T.; Ourselin, S.; West, S.J.; David, A.L.; Vercauteren, T.; Desjardins, A.E. Human placental vasculature imaging using an LED-based photoacoustic/ultrasound imaging system. In Proceedings of the Photons Plus Ultrasound: Imaging and Sensing, San Francisco, CA, USA, 28 January–1 February 2018; SPIE: Bellingham, WA, USA, 2018; Volume 10494, pp. 69–73. [Google Scholar] [CrossRef]
- Shubert, J.; Bell, M.A.L. Photoacoustic imaging of a human vertebra: Implications for guiding spinal fusion surgeries. Phys. Med. Biol. 2018, 63, 144001. [Google Scholar] [CrossRef] [PubMed]
- Wiacek, A.; Wang, K.C.; Wu, H.; Bell, M.A.L. Dual-wavelength photoacoustic imaging for guidance of hysterectomy procedures. In Proceedings of the Advanced Biomedical and Clinical Diagnostic and Surgical Guidance Systems XVIII, San Francisco, CA, USA, 2–4 February 2020; Volume 11229, pp. 73–79. [Google Scholar] [CrossRef]
- Li, M.; Lan, B.; Liu, W.; Xia, J.; Yao, J. Internal-illumination photoacoustic computed tomography. J. Biomed. Opt. 2018, 23, 030506. [Google Scholar] [CrossRef] [PubMed]
- Singh, N.; Chérin, E.; Roa, C.F.; Soenjaya, Y.; Wodlinger, B.; Zheng, G.; Wilson, B.C.; Foster, F.S.; Demore, C.E. Adaptation of a Clinical High-Frequency Transrectal Ultrasound System for Prostate Photoacoustic Imaging: Implementation and Pre-clinical Demonstration. Ultrasound Med. Biol. 2024, 50, 457–466. [Google Scholar] [CrossRef]
- Lediju Bell, M.A.; Guo, X.; Song, D.Y.; Boctor, E.M. Transurethral light delivery for prostate photoacoustic imaging. J. Biomed. Opt. 2015, 20, 36002. [Google Scholar] [CrossRef]
- Lediju Bell, M.A.; Kuo, N.P.; Song, D.Y.; Kang, J.U.; Boctor, E.M. In vivo visualization of prostate brachytherapy seeds with photoacoustic imaging. J. Biomed. Opt. 2014, 19, 126011. [Google Scholar] [CrossRef]
- Ai, M.; Youn, J.i.; Salcudean, S.; Rohling, R.; Abolmaesumi, P.; Tang, S. Photoacoustic tomography for imaging the prostate: A transurethral illumination probe design and application. Biomed. Opt. Express 2019, 10, 2589. [Google Scholar] [CrossRef]
- Vesselov, L.; Whittington, W.; Lilge, L. Design and performance of thin cylindrical diffusers created in Ge-doped multimode optical fibers. Appl. Opt. 2005, 44, 2754–2758. [Google Scholar] [CrossRef]
- Kostanski, L.; Pope, M.; Hrymak, A.; Gallant, M.; Whittington, W.; Vesselov, L. Development of Novel Tunable Light Scattering Coating Materials for Fiber Optic Diffusers in Photodynamic Cancer Therapy. J. Appl. Polym. Sci. 2009, 112, 1516–1523. [Google Scholar] [CrossRef]
- Appeldorn, R.H.; Hulme-Lowe, A.G.; Lea, M.C. Illumination Devices and Optical Fibres for Use Therein. US Patent US5432876A, 11 July 1995. [Google Scholar]
- Mori, K. Apparatus for Uniform Illumination Employing Light Diffuser. US Patent US4460940A, 17 July 1984. [Google Scholar]
- Nguyen, H.; Parvez Arnob, M.M.; Becker, A.T.; Wolfe, J.C.; Hogan, M.K.; Horner, P.J.; Shih, W.C. Fabrication of multipoint side-firing optical fiber by laser micro-ablation. Opt. Lett. 2017, 42, 1808. [Google Scholar] [CrossRef]
- Volkov, V.V.; Loshchenov, V.B.; Konov, V.I.; Kononenko, V.V. Fibreoptic diffuse-light irradiators of biological tissues. Quantum Electron. 2010, 40, 746–750. [Google Scholar] [CrossRef]
- Ai, M.; Tang, S.; Salcudean, T.; Rohling, R.; Abolmaesumi, P. Transurethral illumination probe design for deep photoacoustic imaging of prostate. In Proceedings of the Photons Plus Ultrasound: Imaging and Sensing, San Francisco, CA, USA, 28 January–1 February 2018; p. 11. [Google Scholar] [CrossRef]
- Kosoglu, M.A.; Hood, R.L.; Rossmeisl, J.H.; Grant, D.C.; Xu, Y.; Robertson, J.L.; Rylander, M.N.; Rylander, C.G. Fiberoptic microneedles: Novel optical diffusers for interstitial delivery of therapeutic light. Lasers Surg. Med. 2011, 43, 914–920. [Google Scholar] [CrossRef] [PubMed]
- Ströbl, S.; Wäger, F.; Domke, M.; Rühm, A.; Sroka, R. Homogeneously Emitting, Mechanically Stable, and Efficient fs-Laser-Machined Fiber Diffusers for Medical Applications. Lasers Surg. Med. 2022, 54, 588–599. [Google Scholar] [CrossRef] [PubMed]
- Sun, X.; Hong, R.; Hou, H.; Fan, Z.; Shao, J. Optical properties and structures of silver thin films deposited by magnetron sputtering with different thicknesses. Chin. Opt. Lett. 2006, 4, 366–369. [Google Scholar]
- Liu, P.; Shi, Z.; Teng, D.; Liu, F.; Cao, Y.; Lin, Y.; Yang, Z.; Yang, A.; Zheng, Y.; Chen, L. Optical Characteristics of Silver Thin Films from Island to Percolation in the Ultra-Wide Infrared Spectral Range. Coatings 2023, 13, 1910. [Google Scholar] [CrossRef]
- Spirou, G.M.; Oraevsky, A.A.; Vitkin, I.A.; Whelan, W.M. Optical and acoustic properties at 1064 nm of polyvinyl chloride-plastisol for use as a tissue phantom in biomedical optoacoustics. Phys. Med. Biol. 2005, 50, N141–N153. [Google Scholar] [CrossRef]
- Karpiouk, A.; Aglyamov, S.; Mallidi, S.; Scott, W.; Rubin, J.; Emelianov, S. Combined ultrasonic and photoacoustic imaging to age deep vein thrombosis: Preliminary studies. In Proceedings of the IEEE Ultrasonics Symposium, Rotterdam, The Netherlands, 18–21 September 2005; Volume 1, pp. 399–402. [Google Scholar] [CrossRef]
- Singh, N.; Roa, C.F.; Lilge, L.; Demore, C.E. Development of a Side-Fire Optical Fiber Diffuser for High-Energy Light Transport for Intraluminal Photoacoustic Imaging. In Proceedings of the 2024 Photonics North (PN), Vancouver, BC, Canada, 28–30 May 2024; pp. 1–2. [Google Scholar] [CrossRef]
- Yao, J.; Wang, L.V. Photoacoustic tomography: Fundamentals, advances and prospects. Contrast Media Mol. Imaging 2011, 6, 332–345. [Google Scholar] [CrossRef]
- Roa, C.F.; Chérin, E.; Singh, N.; Yin, J.; Boyes, A.; Foster, F.S.; Demore, C.E.M. Development of a Small-Footprint 50 MHz Linear Array: Fabrication and Micro-Ultrasound Imaging Demonstration. Sensors 2024, 24, 1847. [Google Scholar] [CrossRef]
- Haglund, R.F. 2. Mechanisms of Laser-Induced Desorption and Ablation. In Experimental Methods in the Physical Sciences; Miller, J.C., Haglund, R.F., Eds.; Laser Ablation and Desorption; Academic Press: Cambridge, MA, USA, 1997; Volume 30, pp. 15–138. [Google Scholar] [CrossRef]
- Marjoribanks, R.S.; Tang, J.; Dzelzainis, T.; Prickaerts, M.; Lilge, L.; Akens, M.; Veevers, C.; Gharabaghi, N.; King, A.; Hitzler, A.; et al. Plasma persistence, accumulated absorption, and scattering: What physics lets us control the heat left behind in ultrafast-pulse burst-mode laser surgery. In Proceedings of the Frontiers in Ultrafast Optics: Biomedical, Scientific, and Industrial Applications XXIV, San Francisco, CA, USA, 28–30 January 2024; Herman, P.R., Osellame, R., Ben-Yakar, A., Eds.; International Society for Optics and Photonics (SPIE): Bellingham, WA, USA, 2024; Volume 12875, p. 1287504. [Google Scholar] [CrossRef]
- Marjoribanks, R.S.; Dille, C.; Schoenly, J.E.; McKinney, L.; Mordovanakis, A.; Kaifosh, P.; Forrester, P.; Qian, Z.; Covarrubias, A.; Feng, Y.; et al. Ablation and thermal effects in treatment of hard and soft materials and biotissues using ultrafast-laser pulse-train bursts. Photonics Lasers Med. 2012, 1, 155–169. [Google Scholar] [CrossRef]
- Rethfeld, B.; Sokolowski-Tinten, K.; von der Linde, D.; Anisimov, S. Timescales in the response of materials to femtosecond laser excitation. Appl. Phys. A 2004, 79, 767–769. [Google Scholar] [CrossRef]
Disclaimer/Publisher’s Note: The statements, opinions and data contained in all publications are solely those of the individual author(s) and contributor(s) and not of MDPI and/or the editor(s). MDPI and/or the editor(s) disclaim responsibility for any injury to people or property resulting from any ideas, methods, instructions or products referred to in the content. |
© 2025 by the authors. Licensee MDPI, Basel, Switzerland. This article is an open access article distributed under the terms and conditions of the Creative Commons Attribution (CC BY) license (https://creativecommons.org/licenses/by/4.0/).