Article

Determination of the Fracture Locus of a Cor-Ten Steel at Low and High Triaxiality Ranges

Faculty of Engineering, Free University of Bolzano, 39100 Bolzano, Italy
*
Author to whom correspondence should be addressed.
Appl. Sci. 2025, 15(7), 3569; https://doi.org/10.3390/app15073569
Submission received: 10 February 2025 / Revised: 14 March 2025 / Accepted: 20 March 2025 / Published: 25 March 2025

Abstract

:
Cor-Ten steels, also known as weathering steels, are construction materials of growing importance in the field of architecture and crash barriers, not only due to their good mechanical and corrosion resistance properties but also for the appealing color of their oxides. However, a complete description of the fracture locus of Cor-Ten steels in both low and high triaxiality ranges is still lacking. The present study aims at integrating and extending the data available in the literature for this peculiar material by evaluating four different planar specimens with a mixed numerical–experimental methodology. A non-notched specimen was tested in terms of tension to calibrate the true stress–strain curve of the material after necking by means of an iterative process involving the FEM. Once the model had been calibrated, a tensile test of each specimen was simulated, and the corresponding results were validated using the experimental test data. From the FEM results, the quantities of interests, namely, the stress triaxiality, the equivalent plastic strain, and the normalized Lode angle, were extrapolated. Subsequently, the fracture locus of the Cor-Ten steel was determined through the interpolation of the experimental data collected in the present study as well as data available in the literature for low triaxiality ranges. The results confirmed the parabolic trend characterizing the fracture locus at low triaxiality suggested in the literature, and an exponential decreasing trend was found at higher triaxiality values after reaching a local maximum. The results thus confirm that the fracture locus of Cor-Ten steels, as generally found for metallic materials, cannot be completely described by a monotonic function. Moreover, it was found that the highly ductile behavior of the material induces a significant topology change in the specimens before failure, thus making it more complex to forecast the location of crack nucleation and, as a consequence, the stress state.

1. Introduction

The failure criteria for materials play a very important role in the application of solid mechanics. Commonly, the failure of a metallic component is considered the onset of yielding [1]; thus, modelling its failure does not require particularly complex methodologies beyond performing a tensile test on the material. However, for applications in which plastic deformation may be tolerated or even desired (as is the case for manufacturing technologies involving cold-working or energy absorption applications), a more complex failure criterion must be devised to take into account the non-linear behavior of the material. This is the case for Cor-Ten steels, also called weathering steels, a class of steels whose application is growing, particularly in the fields of architecture and crash barriers. These steels are known mainly for their good mechanical and corrosion resistance properties but also for the appealing color of their oxide, which makes them suitable for architectural purposes. It has been extensively shown in the literature that crack formation in the plastic field is governed by at least two quantities, namely, the equivalent plastic strain ε p s , e q and the stress triaxiality η [2]; more complex models also involve the Lode parameter to fully characterize the stress state in the material [3]. Stress triaxiality (see Equation (1)) is defined as the ratio between the hydrostatic stress, namely, the average value of the principal stresses ( σ 1 ,   σ 2   and   σ 3 ), and von Mises equivalent stress, σ V M :
η = 1 3 σ 1 + σ 2 + σ 3 σ V M .
Regarding the Lode parameter, there is a little bit of confusion in the literature since three quantities are used interchangeably: the normalized Lode angle θ ¯ , the Lode angle parameter ξ , and the Lode parameter L [4]. These quantities are all related to one to another, as shown in Equations (2)–(4):
L = 2 σ 2 σ 1 σ 3 σ 1 σ 3 ,
ξ = L ( L + 3 ) ( L 3 ) L 2 + 3 3 / 2 ,
θ ¯ = 1 2 π arccos ξ .
In the present study, the normalized Lode angle θ ¯ was chosen since it is the most common in the literature and thus easier to compare.
In order to successfully model the failure and damage of materials subjected to plastic deformation, it is necessary to determine the combination of the aforementioned parameters that leads to crack formation [3,5]. This combination or, better still, relation is called the fracture locus. The determination of the fracture locus is not trivial because one needs to induce different values of stress triaxiality and Lode angle parameters in the tested specimens to cover the whole range of values that could be of interest regarding the material during its application. Moreover, these quantities can be found only by means of numerical methods, which must be suitably supported by experimental testing.
Bao and Wierzbicki were pioneers in suggesting a more complex trend for the fracture locus of metallic materials based on their work on an aluminum alloy, thus tackling the common assumption that the fracture locus can be completely described by a monotonic decreasing function [2]. During the extrapolation of the fracture locus, these researchers found three distinct trends:
  • In the range of negative triaxiality (from −1/3 to 0), the fracture locus can be expressed by an exponential decreasing function.
  • In the range of low stress triaxiality (from 0 to 0.4), the fracture locus is best fit by a parabolic function and reaches a local maximum.
  • In the range of high stress triaxiality (from 0.4 to 0.95), the fracture locus starts to decrease again according to an exponential function.
  • Even if the shape of the fracture locus is specific for each material, as recognized by Bao and Wierzbicki in their study, the general trends of the curve are similar for other metallic materials.
  • On the basis of these observations, Maccioni and Concli [6] investigated the fracture locus of a Cor-Ten steel, focusing on the parabolic range. The present study aims to integrate the work carried out by previous authors on this material with the determination of the fracture locus in both the parabolic and exponential ranges, i.e., the low and high triaxiality ranges.

2. Materials and Methods

2.1. Specimens and Tensile Test Machine

In order to induce different values of stress triaxiality in the material, four different specimen geometries (see Figure 1) were produced using a 4 mm Cor-Ten steel sheet (S355J0WP) by means of LASER cutting. For each geometry, three different samples were tested to evaluate the variability in the results, which was expected to be present due to possible microstructural imperfections—such as inclusions—that can influence the ductility of the material.
The specimens were tested in terms of tension by means of an MTS Criterion 100 universal testing machine (MTS Systems, Eden Prairie, MN, USA) equipped with a 100 kN load cell available at the Materials Characterization Lab of the Free University of Bolzano (see Figure 2). For each tensile test, the applied force and the crosshead displacement were acquired. The deformation rate was set to 1 mm/min in order to achieve quasi-static conditions at room temperature.
The main mechanical properties of the Cor-Ten steel were ascertained by means of a tensile test and summarized in Table 1.

2.2. True Stress–Strain Curve Correction

The non-notched specimen, namely, SPECT, was used to characterize the material’s behavior by means of a tensile test. However, since the determination of the fracture locus requires knowledge of the material’s behavior up to the point of crack nucleation, it is necessary to correct the true stress–strain curve, σ ε , after the onset of necking. In fact, the classical formulas for the determination of the true stress–strain curve, namely,
σ = F A ε = l 0 l d l l = ln l l 0 ,
are valid only in the case of uniaxial tension, but the onset of necking induces a local topology change that results in a multiaxial stress field. In the present study, the true stress-curve of the material was obtained from the engineering stress–strain curve σ e ε e (see Equation (6)) and corrected by means of an iterative process.
σ = σ e ( 1 + ε e ) ε = l n ( 1 + ε e )
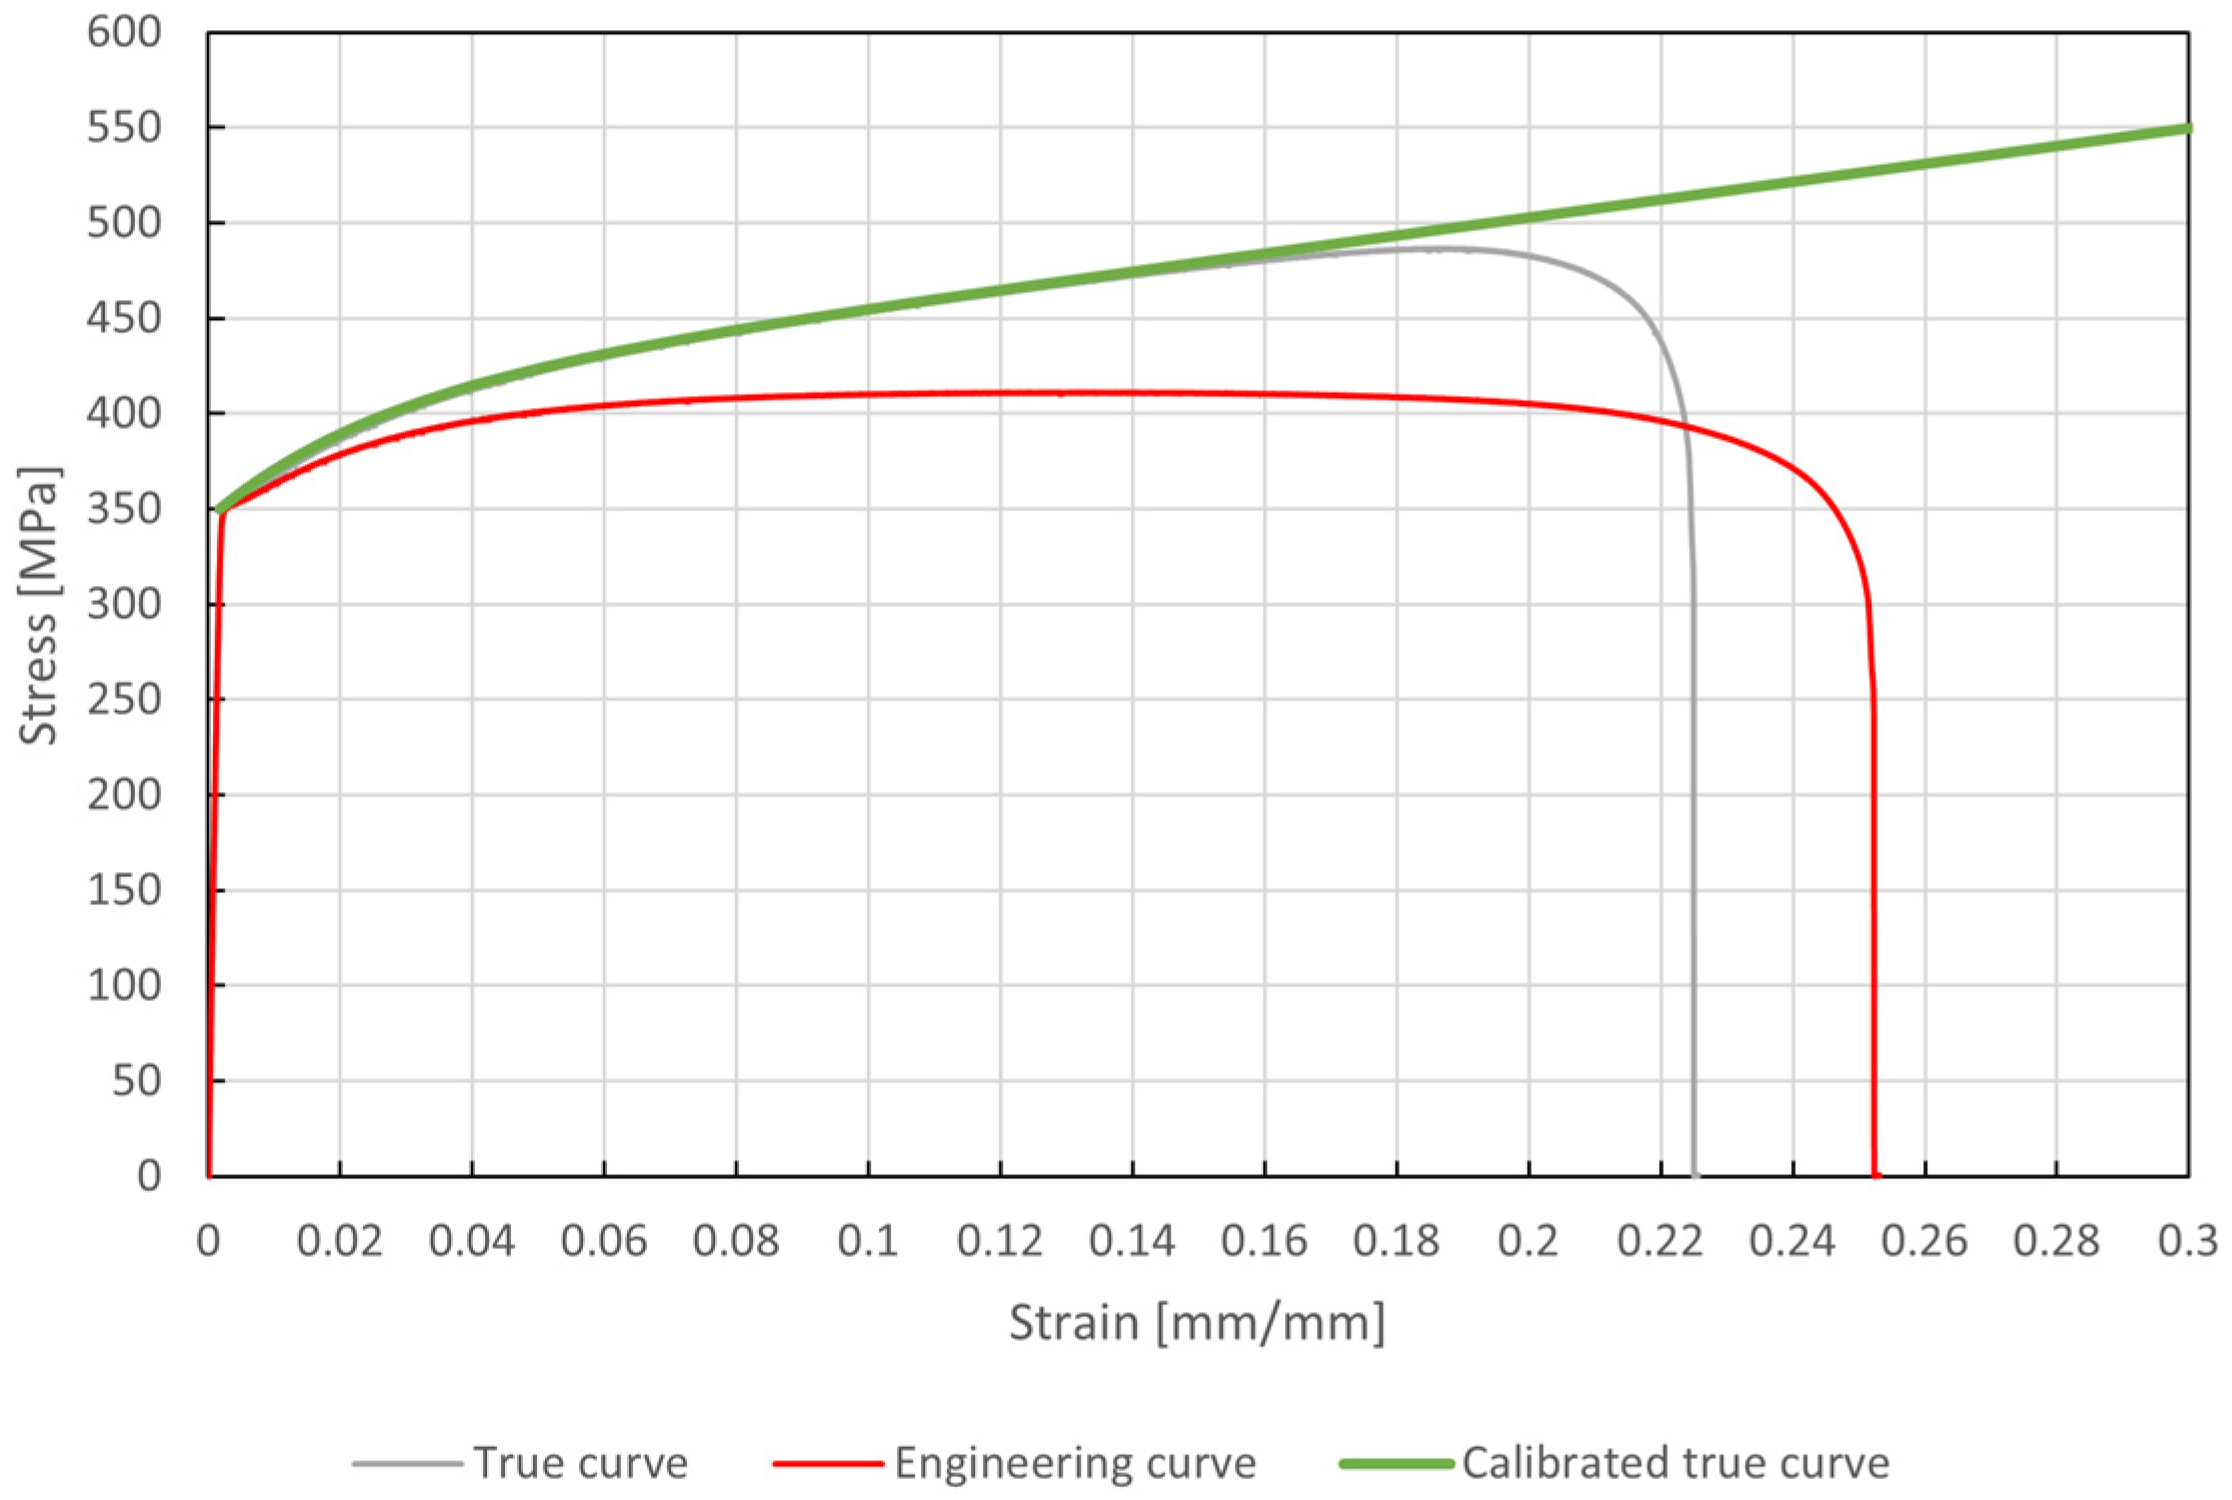
The true stress–strain curve correction (see Figure 3) was based on the following three-step process:
  • Fit the plastic portion of the true stress–strain curve by means of the Voce equation (see Equation (7)), which relates the true stress σ to the plastic strain ε p s through four constants, i.e., C 1 ,   C 2 ,   C 3   and   C 4 .
  • Simulate the tensile test by means of a non-linear FEM (Finite Element Method) model taking the Voce equation as an input.
  • Compare the force–displacement curve given as an output in the FEM model with the experimental one.
The previous steps were repeated, slightly changing the coefficients in the Voce equation at each iteration up to the matching of the force–displacement curves.
σ = C 1 + C 2 1 e C 3 ε p s + C 4 ε p s

2.3. FEM Validation

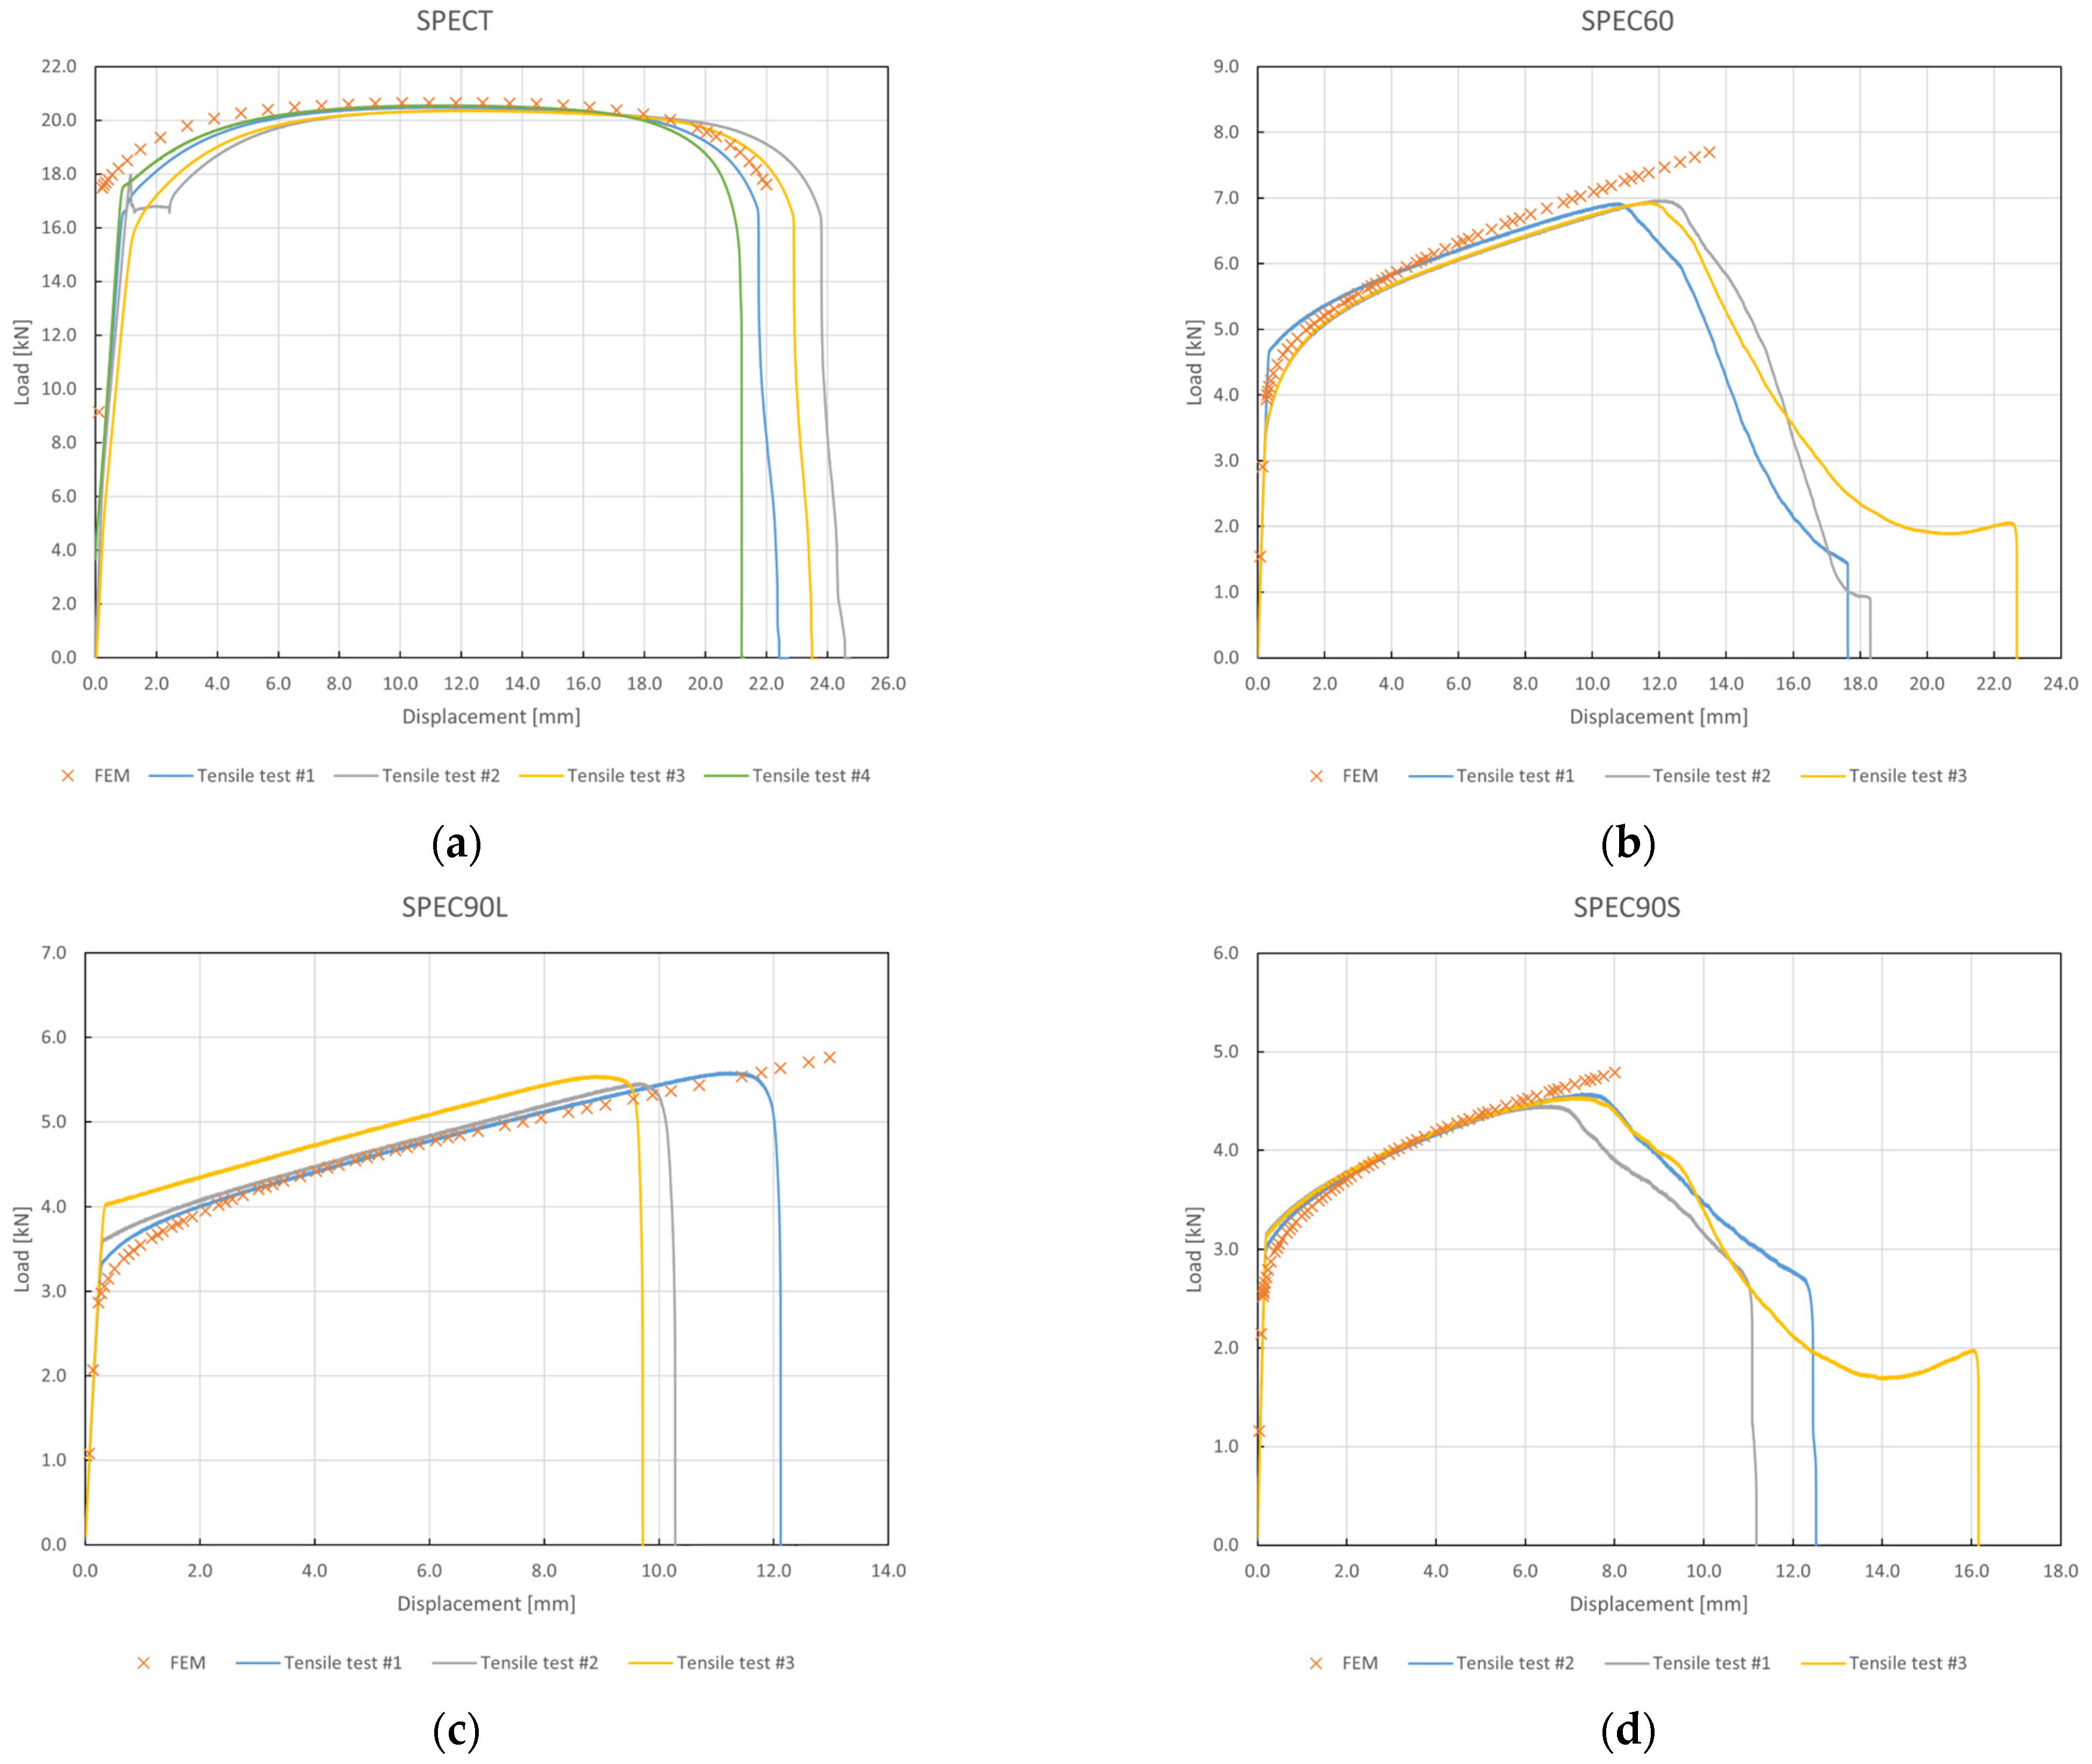
Based on the calibrated true stress–strain curve for the Cor-Ten steel, non-linear FEM simulations for each specimen were conducted in order to extrapolate the values of stress triaxiality, equivalent plastic strain, and the normalized Lode angle at the onset of crack nucleation. To check the reliability of the simulations, the force–displacement points obtained from the FEM were compared with the experimental curves obtained during the tensile tests of the specimens. The numerical simulations were performed in the Ansys Mechanical environment. The non-linear behavior of the material was included in the simulations by means of a multilinear isotropic hardening function. In order to reduce computational effort, only one quarter of SPECT and half of SPEC60, SPEC90L, and SPEC90S were modeled via proper exploitation of symmetries. Hexahedral linear elements were employed to generate structured meshes, which were refined in correspondence with the notches to capture local gradients and large topology changes during plastic deformation. Mesh convergence showed that an element length of 100 μm was sufficient to provide stable results in proximity of the notch. As can be seen in Figure 4, the results of the FEM model correlate well with the experimental data.

3. Results

3.1. Comparison Between FEM and Experimental Results

Once the FEM model was calibrated and validated, the quantities of interest were extrapolated from the numerical solutions, as reported in Table 2.
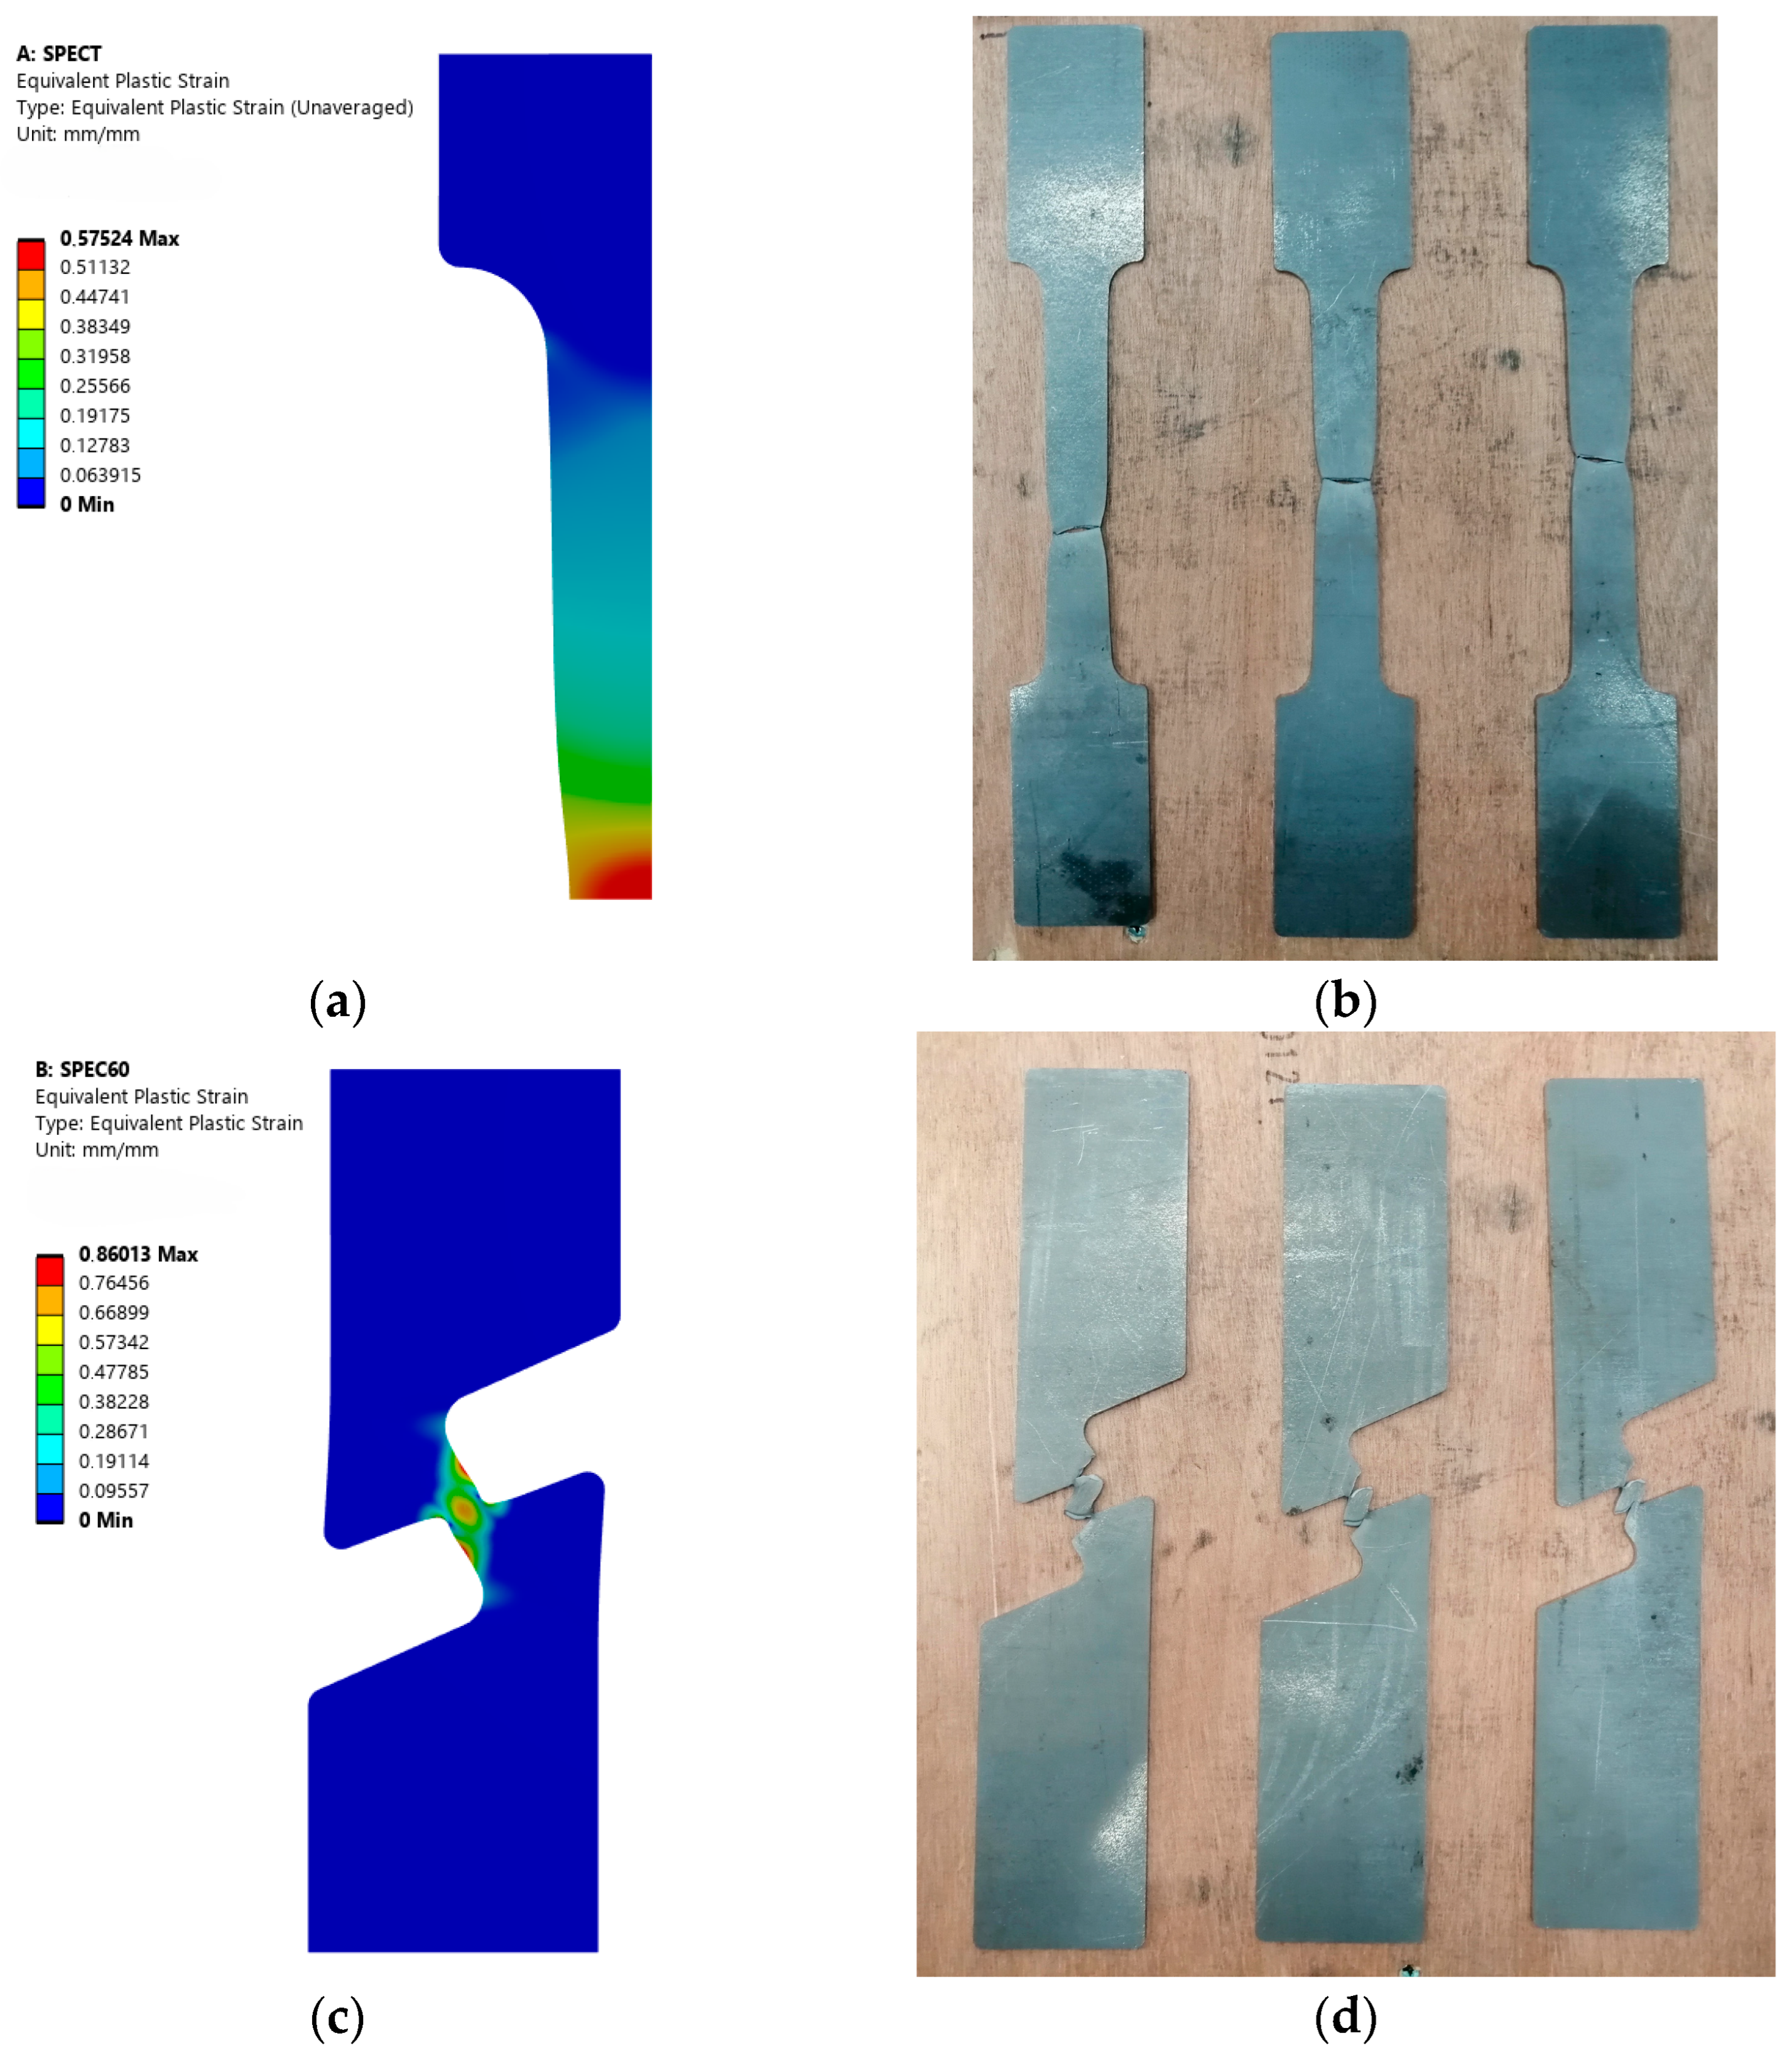
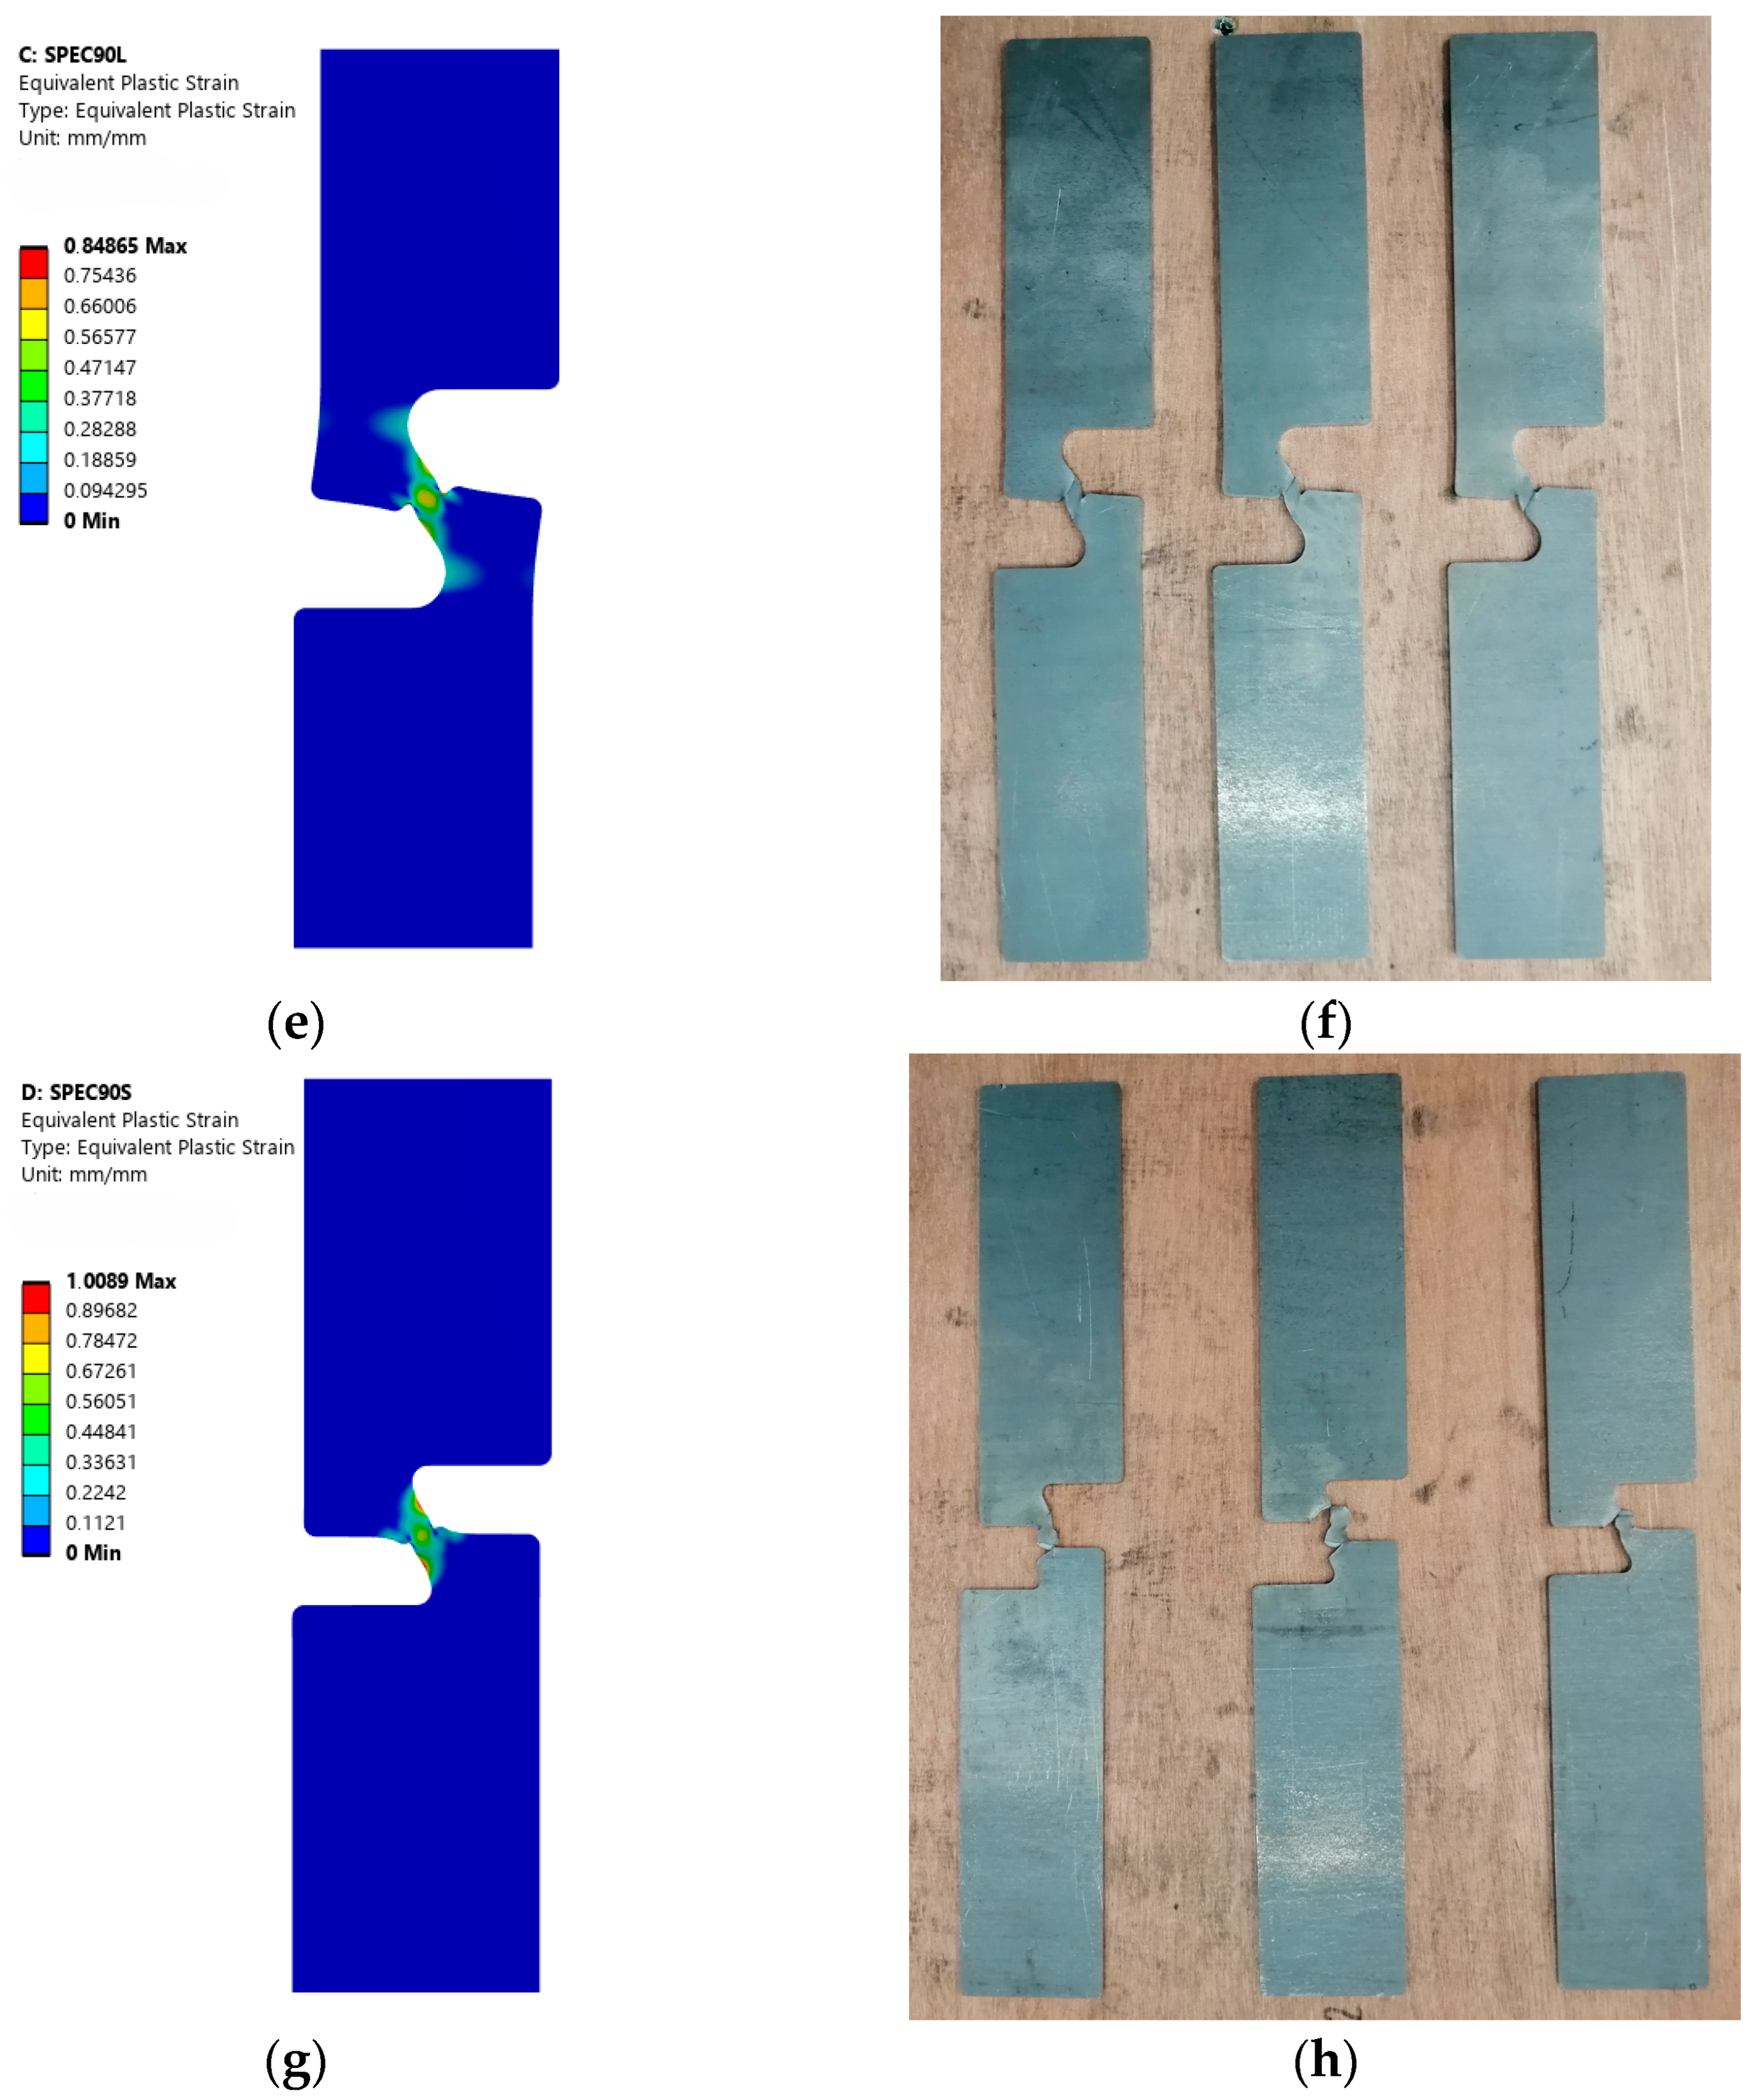
As can be seen in Figure 5, the deformed shapes of the specimens match well with the shape predicted by the FEM simulation.
Notice that the cracks in the notched specimens nucleated in the proximity of the notch but not exactly in the middle as could be expected because the highly ductile behavior of the material allowed for a significant change in the topology of the specimens before failure, thus favoring a different position for crack nucleation.

3.2. Determination of the Fracture Locus

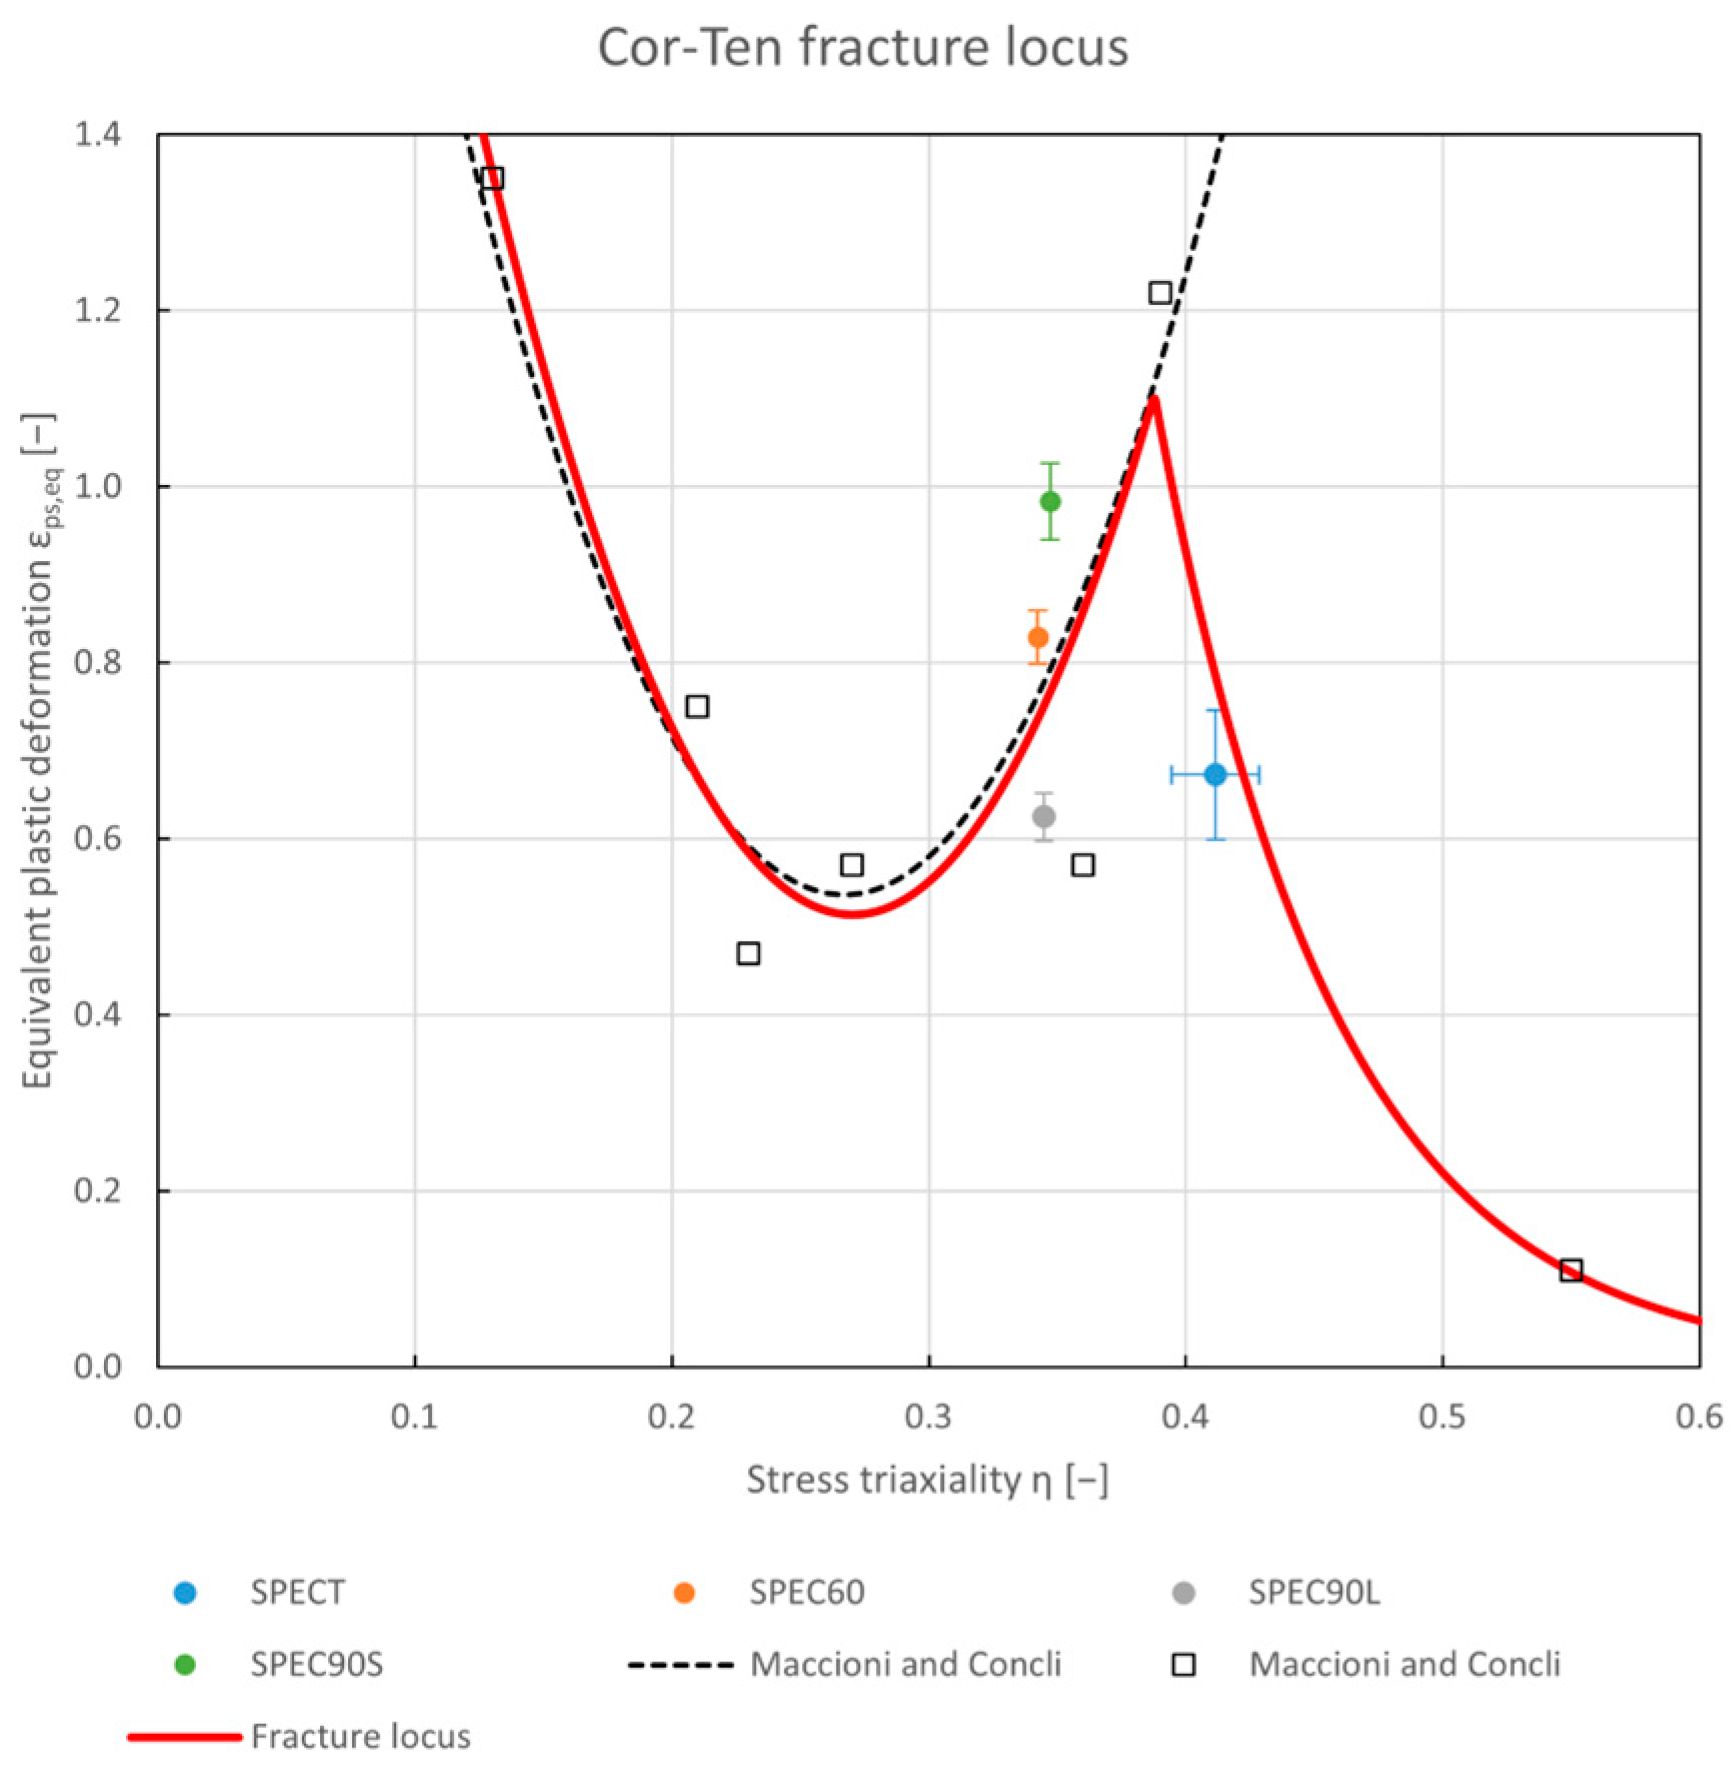
The experimental points obtained from the tensile testing of the four specimens were integrated with the data obtained by Maccioni and Concli for Cor-Ten steel [6]. As shown in Figure 6, the experimental points obtained in the present study correlate well with the parabolic trend proposed by Maccioni and Concli. Particularly, the experimental points belonging to the fracture onsets for SPEC60, SPEC90L, and SPEC90S suggest a strong gradient of the fracture locus approaching the 0.4 value of triaxiality, where the transition between fracture mechanisms [5] would be expected, and thus the fracture locus shows a local maximum. By including the point related to the SPECT specimen, the fracture locus can be determined in the high stress triaxiality range by means of an exponentially decreasing function [2,7,8].
The fracture locus of the Cor-Ten steel can be expressed mathematically after proper interpolation of the experimental points according to Equation (8):
ε p s , e q η = 42.871 η 2 23.181 η + 3.648           i f   0.33 η 0.39 286.737 e 14.339 η           i f     η > 0.39
The curve obtained by interpolation is in good agreement with the literature concerning the fracture loci of metals, in which a local maximum is expected in the range of η = 0.3 0.5 [9,10,11] near the conditions under which a uniaxial stress state is generated.

3.3. Stress State Locus

A complete analysis of the stress state upon fracturing must also consider the normalized Lode angle θ ¯ , as shown in Figure 7.
The stress state analysis showed that all four specimens fractured under plane stress conditions [12]. However, while SPEC60, SPEC90L, and SPEC90S failed under axisymmetric tension, the stress state for the SPECT specimen shifted slightly towards plane strain conditions because of the significant localized necking that developed before fracturing. Notice that SPEC60, SPEC90L, and SPEC90S were expected to break at a lower stress triaxiality range, dominated by shear stress, but the high degree of ductility of the material allowed a significant change in the topology of the notch before crack nucleation, which, as a consequence, induced a propensity for crack nucleation in regions predominantly under axisymmetric tension conditions. The ductility of the material can be observed qualitatively in Figure 4d and Figure 5b, where, after the first force drop (crack nucleation), crack propagation absorbed a significant amount of energy before the complete failure of the specimens. Another measure of the ductility of Cor-Ten steel can be obtained by integrating its engineering stress–strain curve, which provides the toughness of the material: 99.4 MJ/m3. For comparison, materials that are considered highly ductile, such as S235JR and AISI 304, show toughness values of around 90 and 200 MJ/m3, respectively [13,14].

4. Discussion

The experimental data obtained in the present study match well with the parabolic trend of the fracture locus for Cor-Ten steel proposed by Maccioni and Concli [6]. Particularly, the experimental data captured the rather strong gradient of the fracture locus in proximity to the local maximum expected around the onset of uniaxial tension. In this regard, it should be noted that for very similar triaxialities and normalized lode angle values, the equivalent plastic strain upon fracturing can vary considerably around the local maximum; this can be reasonably attributed to the inhomogeneities of the material at the microscopic scale—such as non-metallic inclusions or anisotropic grain structures—that can influence its behavior during plastic deformation. Moreover, although this mixed numerical–experimental methodology is widely employed in the literature, it must be said that finding the exact onset of crack nucleation, as well as localizing it precisely in the FEM model, are rather complex tasks that can easily introduce errors in the fracture locus. This also explains why it is common to find fracture loci with significantly scattered data points for small variations in triaxiality values. Therefore, when determining the fracture locus of a material, it is important to also evaluate the statistical reliability of correlations and deviations from the average values. Regarding the non-notched specimen, SPECT, it is worth pointing out that, in the literature, it is commonly assumed that non-notched planar specimens will fail at η = 0.33 , i.e., under uniaxial tension conditions, and as such they are often passed over. However, as shown by Cho et al. [15] and confirmed by the present study, particularly ductile materials showing localized necking with significant topology changes before failure can develop higher triaxiality values than expected.

5. Conclusions

In this study, the fracture locus of a Cor-Ten steel was determined at both low and high triaxiality ranges by integrating and extending the partial data present in the literature. Three samples of each of the four different specimens’ geometries were tested in terms of tension. After calibrating the non-linear FEM model via an iterative process, the quantities of interest that were needed to determine the fracture locus were extracted from the simulations. On the basis of the experimental data produced, as well as data present in the literature, the fracture locus of the material was fitted. In the low-triaxiality range, the parabolic trend proposed in the literature was confirmed, with a local maximum around a triaxiality value of 0.4. In the high-triaxiality range, an exponential correlation was found. A significant topology change before the failure of the specimen was observed during the tensile tests, and, as a consequence, the site of crack nucleation, as well as the induced stress state, was found to be difficult to forecast. In agreement with studies involving the determination of the fracture locus of particularly ductile materials, the stress triaxiality upon damage initiation of the non-notched specimen was found to be greater than the widely assumed value of 0.33 pertaining to the uniaxial tension condition.

Author Contributions

Conceptualization, F.C.; methodology, A.B. and N.M.; software, A.B.; formal analysis, A.B.; investigation, A.B. and N.M.; resources, F.C.; writing—original draft preparation, A.B.; writing—review and editing, F.C. All authors have read and agreed to the published version of the manuscript.

Funding

This research received no external funding.

Institutional Review Board Statement

Not applicable.

Informed Consent Statement

Not applicable.

Data Availability Statement

The original contributions presented in this study are included in the article. Further inquiries can be directed to the corresponding author.

Conflicts of Interest

The authors declare no conflicts of interest.

References

  1. Budinas, R.G.; Nisbett, J.K. Failure Theories. In Shigley’s Mechanical Engineering Design; McGraw-Hill: New York, NY, USA, 2011; pp. 219–225. [Google Scholar]
  2. Bao, Y.; Wierzbicki, T. On fracture locus in the equivalent strain and stress triaxiality space. Int. J. Mech. Sci. 2004, 46, 81–98. [Google Scholar] [CrossRef]
  3. Barsoum, I.; Faleskog, J. Micromechanical analysis on the influence of the Lode parameter on void growth and coalescence. Int. J. Solids Struct. 2011, 48, 925–938. [Google Scholar] [CrossRef]
  4. Liu, X.; Yan, S.; Rasmussen, K.J.R.; Deierlein, G.G. Experimental investigation of the effect of Lode angle on fracture initiation of steels. Eng. Fract. Mech. 2022, 271, 108637. [Google Scholar] [CrossRef]
  5. Barsoum, I.; Faleskog, J. Rupture mechanisms in combined tension and shear—Micromechanics. Int. J. Solids Struct. 2007, 44, 5481–5498. [Google Scholar] [CrossRef]
  6. Maccioni, L.; Concli, F. Fracture locus of a CORTEN steel: Finite Element calibration based on experimental results. Procedia Struct. Integr. 2019, 24, 738–745. [Google Scholar] [CrossRef]
  7. Murugesan, M.; Jung, D.W. Johnson Cook Material and Failure Model Parameters Estimation of AISI-1045 Medium Carbon Steel for Metal Forming Applications. Materials 2019, 12, 609. [Google Scholar] [CrossRef]
  8. Suárez, F.; Gálvez, J.C.; Cendón, D.A.; Atienza, J.M. Distinct Fracture Patterns in Construction Steels for Reinforced Concrete under Quasistatic Loading—A Review. Metals 2018, 8, 171. [Google Scholar] [CrossRef]
  9. Park, N.; Huh, H.; Lim, S.J.; Lou, Y.; Kang, Y.S.; Seo, M.H. Fracture-based forming limit criteria for anisotropic materials in sheet metal forming. Int. J. Plast. 2017, 96, 1–35. [Google Scholar] [CrossRef]
  10. Liu, Y.; Ikeda, S.; Liu, Y.; Ge, H. Ductile Fracture Investigation of High-Strength Steel SM570 under Low Stress Triaxiality. Metals 2022, 12, 1394. [Google Scholar] [CrossRef]
  11. Giglio, M.; Manes, A.; Mapelli, C.; Mombelli, D. Relation between Ductile Fracture Locus and Deformation of Phases in Ti–6Al–4V Alloy. ISIJ Int. 2013, 53, 2250–2258. [Google Scholar] [CrossRef]
  12. Peng, J.; Zhou, P.; Wang, Y.; Dai, Q.; Knowles, D.; Mostafavi, M. Stress Triaxiality and Lode Angle Parameter Characterization of Flat Metal Specimen with Inclined Notch. Metals 2021, 11, 1627. [Google Scholar] [CrossRef]
  13. Annealed 304 Stainless Steel. Available online: https://www.makeitfrom.com/material-properties/Annealed-304-Stainless-Steel (accessed on 2 February 2025).
  14. EN 1.0038 (S235JR) Non-Alloy Steel. Available online: https://www.makeitfrom.com/material-properties/EN-1.0038-S235JR-Non-Alloy-Steel (accessed on 2 February 2025).
  15. Cho, Y.; Lee, C.; Yee, J.-J.; Kim, D.-K. Modeling of Ductile Fracture for SS275 Structural Steel Sheets. Appl. Sci. 2021, 11, 5392. [Google Scholar] [CrossRef]
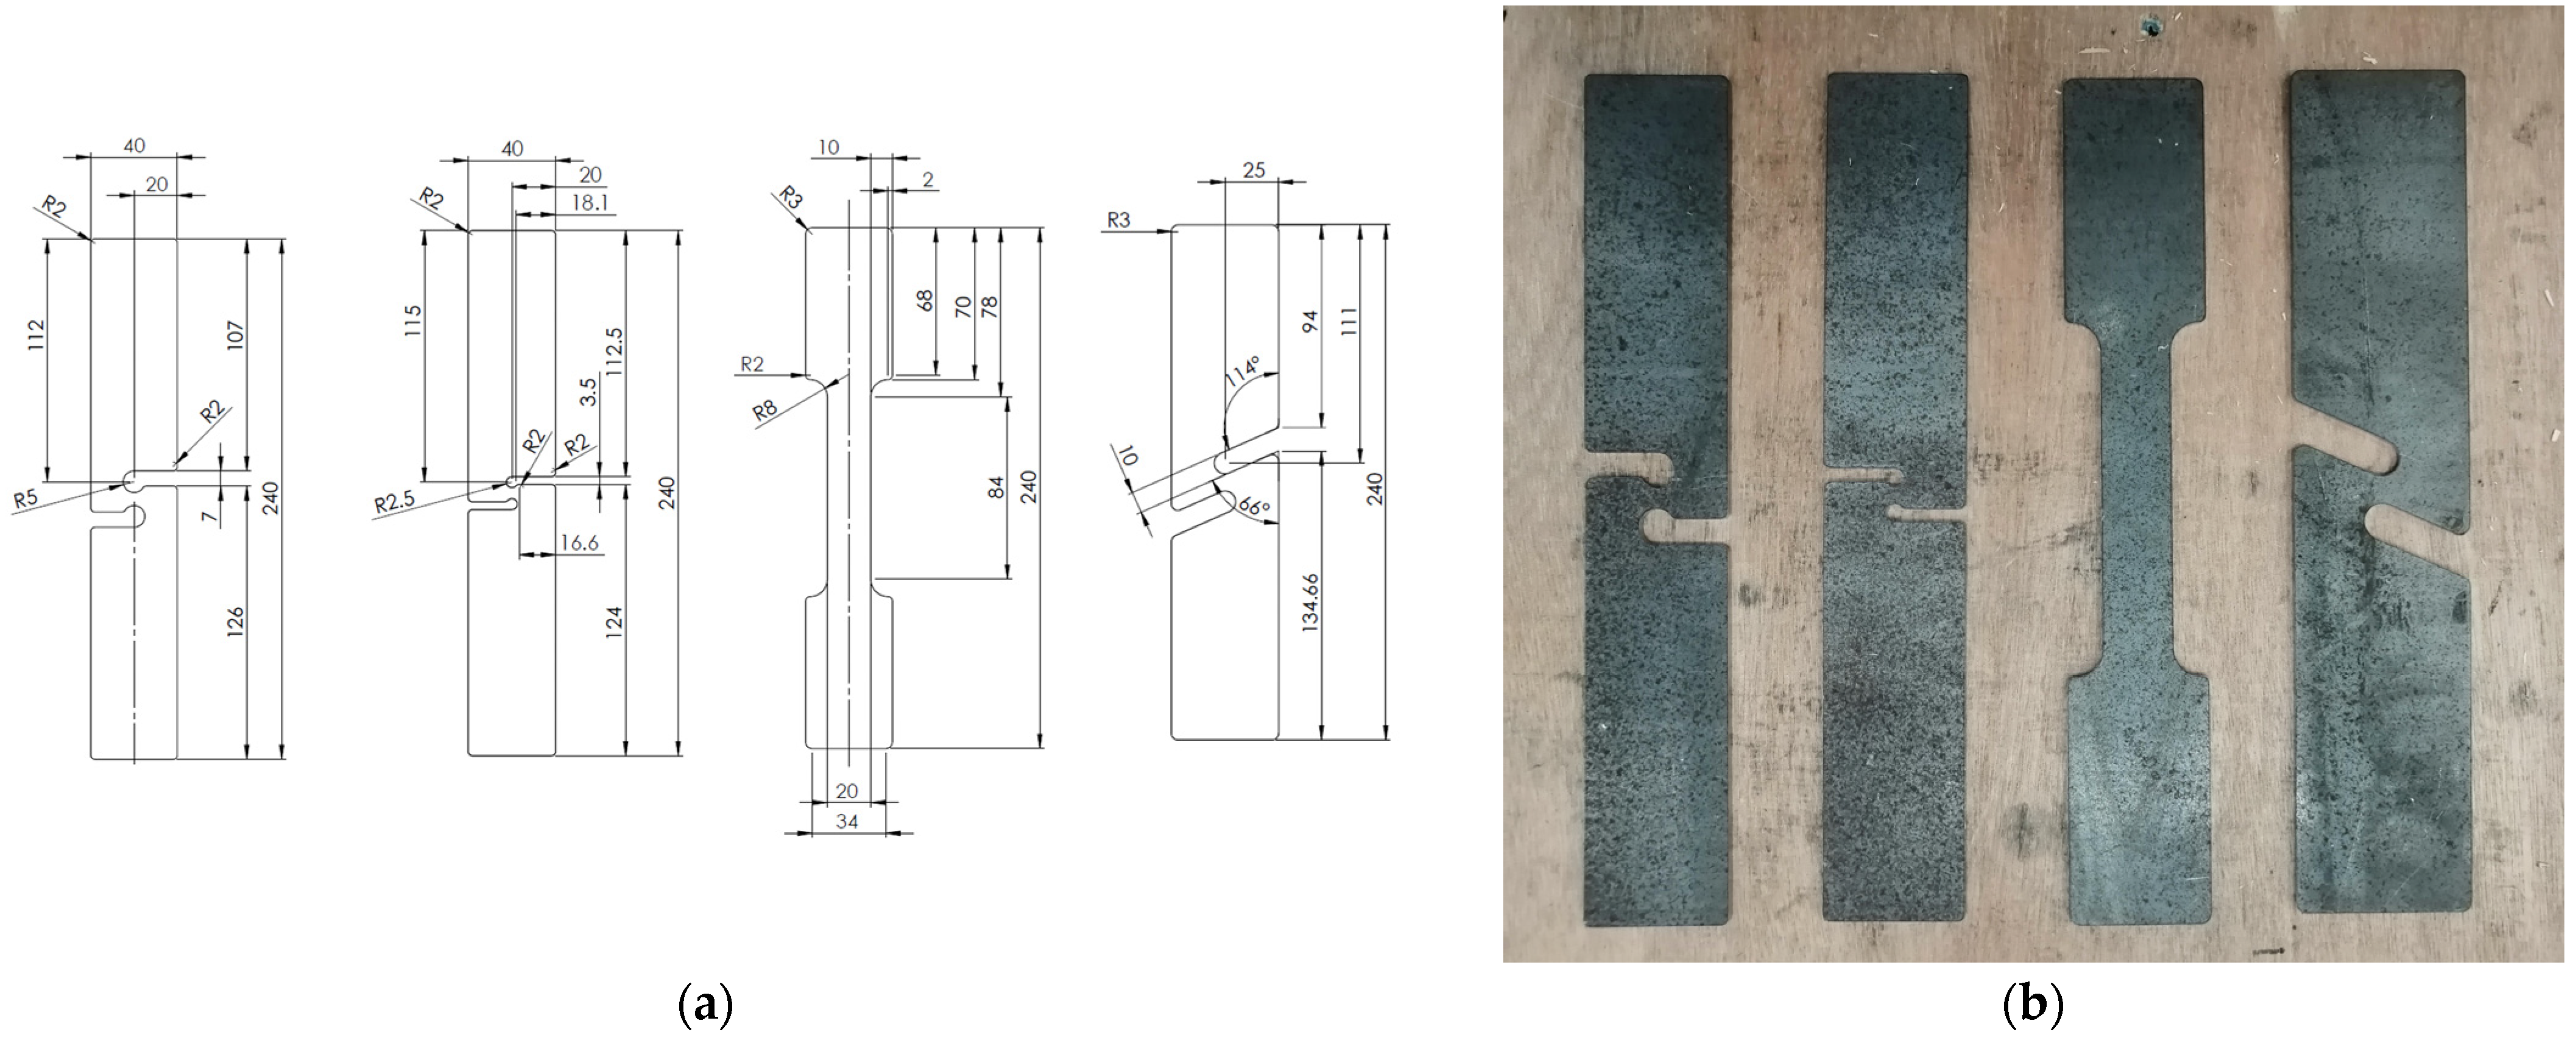
Figure 1. (a) Drawings of the four geometries and (b) the four resulting specimens made from a 2.5 mm thickness Cor-Ten sheet. From left to right: SPEC90L, SPEC90S, SPECT, and SPEC60.
Applsci 15 03569 g001
Figure 2. The MTS Criterion 100 universal testing machine at the Materials Characterization Lab of the Free University of Bolzano.
Applsci 15 03569 g002
Figure 3. True and engineering stress–strain curves from the tensile test of SPECT along with the FEM-calibrated true curve.
Applsci 15 03569 g003
Figure 4. Comparison between force–displacement points obtained through FEM analysis and tensile tests of specimens: (a) SPECT (tensile test #2 was discontinued due to slipping of the specimen during testing), (b) SPEC60, (c) SPEC90L, and (d) SPEC90S.
Applsci 15 03569 g004
Figure 5. Comparison between the specimens’ deformed shapes as predicted by the FEM model and the experimental results obtained through tensile testing: (a) equivalent plastic strain for SPECT and (b) broken SPECT specimens, (c) equivalent plastic strain for SPEC60 and (d) broken SPEC60 specimens, (e) equivalent plastic strain for SPEC90L and (f) broken SPEC90L specimens, and (g) equivalent plastic strain for SPEC90S and (h) broken SPEC90S specimens.
Applsci 15 03569 g005aApplsci 15 03569 g005b
Figure 6. Fracture locus of Cor-Ten steel obtained by integrating the experimental results of the present study with the work of Maccioni and Concli [6]. The coefficient of determination is R 2 = 0.76 for the parabolic fit and R 2 = 0.95 for the exponential one.
Applsci 15 03569 g006
Figure 7. Stress states upon fracturing for the four specimens represented in the triaxiality-normalized lode angle plane η - θ ¯ .
Applsci 15 03569 g007
Table 1. Mechanical properties of the Cor-Ten steel measured during tensile test.
Elastic Modulus
[GPa]
Yield Strength [MPa]Ultimate Tensile Strength
[MPa]
Deformation
at Fracture
[mm/mm]
Toughness
[MJ/m3]
2063504110.2599.4
Table 2. Stress triaxiality, equivalent plastic strain, and normalized Lode angle θ ¯ [ 1,1 ] upon fracturing for each of the four specimens. The average value of each quantity is accompanied by its standard deviation.
Specimen η [-] ε p s , e q [mm/mm] θ ¯ [-]
SPECT0.412 ± 0.0170.673 ± 0.0740.75 ± 0.064
SPEC600.342 ± 0.0010.829 ± 0.0300.97 ± 0.003
SPEC90L0.345 ± 0.0000.625 ± 0.0270.96 ± 0.001
SPEC90S0.347 ± 0.0000.983 ± 0.0440.96 ± 0.000
Disclaimer/Publisher’s Note: The statements, opinions and data contained in all publications are solely those of the individual author(s) and contributor(s) and not of MDPI and/or the editor(s). MDPI and/or the editor(s) disclaim responsibility for any injury to people or property resulting from any ideas, methods, instructions or products referred to in the content.